Embed Size (px)
Citation preview
Guidance on Brake Testing forRubber-tyred Vehicles
Operating in Quarries, Open Cast Coal Sites and Mines
PERCOff-highway Plant and Equipment
Research Centre
EPIC Training and Consulting Services Ltd in conjunction with the Off-highway Plant and Equipment Research Centre (OPERC)
With the exception of research, private study or review, the contents of this document cannot bereproduced, stored or transmitted, in any form or by any means without the written permission of thecopyright owner. All copyright requests should be made in writing to either: Mr Clive Webb, EPICTraining & Consulting Services Limited, Alban Row, 27-31 Verulam Road, St. Albans, Herts., AL3 4DGand/or Dr David J. Edwards at OPERC, PO Box 5039, Dudley, West Midlands DY1 9FQ.
The material contained within this document constitutes general guidelines only and is not, at thetime of publication, mandatory. The guidance provided does not replace any legal obligations uponemployers (or employees), for example, to comply with any statutory duties under relevant legislation.
The guidance is given in good faith but the reader must accept that because (inter-alia) of theindefinable particular and specific risks relating to any given item of plant in any given workingenvironment, it cannot, and therefore does not, purport to be optimal guidance for all possiblecircumstances. Because of this, readers are strongly encouraged to consult as appropriate specificgovernment agencies such as the Health and Safety Executive (within the UK) or specialistmanufacturers etc., before acting upon any recommendations contained within this text.
EPIC and OPERC do not endorse or specifically recommend any of the products or services referred toin this Guide. Any reference to a commercial organisation, product or service is for information oreducational purposes only.
Whilst written principally in a UK context, for the most part, the principles and concepts discussedwithin this publication hold equal international relevance.
Jointly published by:EPIC Training & Consulting Services LimitedAlban Row, 27-31 Verulam Road, St. Albans, Herts., AL3 4DGTel: 01727 869008 Fax: 01727 843318 Email: [email protected]
The Off-highway Plant and Equipment Research Centre (OPERC)PO Box 5039, Dudley, West Midlands DY1 9FQ.Email: [email protected] Web: www.operc.com
Distributed by:IRAS Group, PO Box 3258, Wolverhampton, West Midlands, WV3 7YT, UKTel/Fax: +44(0) 1384 356202 Email: [email protected] Web: www.irasgroup.net
Edited by:Dr David J Edwards, Dr Gary D Holt and Miss Philippa G Spittle.
ISBN: 978 0 947974 62 6
SummaryIn the past, brake testing of rubber-tyred vehicles operating in quarries, opencast coal sites, minesand similar environments, comprised ‘simple’ stopping distance tests, typically carried out at daily orweekly intervals. More recently, many operators of such plant have progressed to using a braketesting method that employs electronic instrumentation, as a means of determining the ‘brake ratio’of a vehicle. This is because instrumented testing gives more accurate results. Accordingly, the timebetween performing these instrumented tests has increased to monthly, or even 3-monthly intervals.
For both ‘simple’ and ‘instrumented’ test methods, international standard ISO 3450 is often (wrongly)used as the guide to acceptable brake performance testing regimes. The ISO standard containsformulae that enable either a stopping distance or a brake ratio (depending on which test method isused) to be calculated. However, these calculated values are minimum levels of braking ability,necessary for a vehicle to be placed on the market. That is, the ISO standard is a minimum standardfor manufacture, not a maintenance standard. To put this into context, it is likely that any ‘modern’vehicle will have levels of braking performance approaching twice these minimum ISO values.
In using these ISO values as routine test pass or fail criteria, organisations may be indirectlyaccepting that brakes on modern vehicles can deteriorate by up to 50 per cent before their operatorsbecome concerned with braking ability. In addition, test conditions on site (particularly speed andgradient) may be much less onerous than those used in ISO 3450, which produces low test results.The overall outcome of which may be a 'poor' brake test result, but one that exceeds a low level passcriterion and is not, therefore, seen as a test failure.
Another common problem with some brake testing regimes is that they do not readily correlate tosite operating conditions; in particular to gradients, but also to vehicle speed and load. The lawrequires organisations to ‘ensure’ that work equipment is suitable (safe) for the conditions of use itwill encounter. This means being able to demonstrate that vehicle braking capabilities are adequatefor actual site operating gradients, speeds and loads. Naturally therefore, any testing regime shouldaccurately take account of the site conditions which the vehicle will be exposed to.
In order to address these shortcomings regarding brake testing of rubber-tyred vehicles, this guideexplains the brake ratio method of brake testing. A step-by-step guide on how to correlate brakingperformance with actual site conditions and how to design and put in place a suitable brake testregime is preceded by several discussion chapters. (Hence, if you already have an understanding ofthis method of brake performance testing, then skip straight to the Step-by-step Guide).
The following convention is used to highlight significant information:
• Text in bold is used to highlight a point of principle;
• Text in a box highlights a cautionary note; and
• Footnotes provide added information.
The guidance was prepared by a working group of the Quarries National Joint Advisory Committee(Appendix A). The written report was compiled in collaboration with EPIC Training and ConsultingServices Ltd and the Off-highway Plant and Equipment Research Centre (OPERC).
Preface
Mr Barry Robinson MBE, OPERC Chief Examiner.
Each year within Great Britain, approximately 50 people are killed as a result of accidents that in some way involve workplace transport. In striving to improve upon this unfortunate statistic,workplace transport safety should encourage safe sites, safe drivers and safe vehicles. This guidancedocument is concerned with the latter and focuses upon vehicular braking systems in particular.
The need for safe braking systems on any type of vehicle is all too obvious, but this need assumeseven greater importance for those vehicles operating in the quarrying and mining sectors, where large plant items, heavy loads and steep haul road gradients might be experienced.
Advancements in vehicular brake testing technologies mean that less robust methods, such asstopping distance tests, can no longer be relied upon to accurately (or adequately) assess theefficacy of braking systems. Additionally, the criteria by which brake test results are evaluated must also be appropriate, if reliable test decisions (e.g. pass/fail) are to be arrived at.
This guidance document describes how electronic brake testing equipment may be used to establish‘brake ratio’, as a means of reliably assessing the efficacy of braking systems of rubber-tyred vehiclesoperating in quarrying and mining environments. The guidance presented is not mandatory, but itdoes represent best practice and in doing so, sets about encouraging ‘safe vehicles’ and therebysafer use of workplace transport generally.
OPERC Executive, March 2007.
Contents
Introduction 1
What is this Booklet About? 1
Who Should Read this Booklet? 1
Relevant Legal Requirements 2
What is Brake Testing? 3
Braking Systems 3
Brake Testing 3
The Problem with Simple Stopping Distance Tests 4
Instrumented Testing 4
Some Simple Dynamics 5
What is Brake Ratio? 5
Instrumented Brake Testing 5
The Effects of Speed, Load and Gradient 6The Effect of Speed on Stopping Distance 6The Effect of Load on Stopping Distance 6The Effect of Gradient on Stopping Distance 7
How Much Brake Ratio is Required for Stopping? 8
Using Peaks and Plateau Levels 9
A Typical Brake Test Instrument 11
How Does it Work? 11
Brake Delay Time 12
Some Sources of Error 12
Practical Considerations 14
The Test Site 14
Frequency of Testing 14
Repeatability of Results 15
Pass and Fail Criteria 15
Other Tests and Checks 16
Vehicle Damage Caused by Heavy Braking 16
Step-by-step Guide 17
Step 1: Establish Maximum Brake Ratio 17
Step 2: Determine Conditions of Use 17
Step 3: Determine Pass/Fail Criteria 18
Step 4: Identify Deteriorating Trends 18
Step 5: Check Delay Time 18To Summarise (for this example) 19
Recording Test Results 19
Further Information 22
List of Tables, Figures and AppendicesTable 1. Tabular comparison of braking distances at different vehicle speeds 8
Figure 1. Graphical comparison of braking distances at different vehicle speeds 9
Figure 2. Brake ratio versus braking time showing peaks and ‘plateau’ 10
Figure 3. Example of brake test instrument print-out 12
Figure 4. Specimen brake test assessment record form 20
Appendix A. The Quarries National Joint Advisory Committee (Working Groupattendees and visitors) 24
1Introduction What is this Booklet About?This booklet contains guidance for brake testing self-propelled, rubber-tyred vehicles such as thoseused in quarries, at opencast coal sites, on mine surfaces or underground in mines. The guidance mayalso be useful in other industries where similar vehicles are used, such as mineral processing andconstruction.
The guidance uses ‘brake ratio’ as the measure of brake performance (in contrast to other measuresof brake performance, such as stopping distance). Following the guidance in this booklet is notcompulsory, but it is recommended that any other chosen method of testing brake performance,should be equally as effective as the measures described here.
The types of vehicle covered by this guidance include:
� dumpers, wheeled loaders, tractors, graders and similar earth moving vehicles;
� service vehicles that operate on work sites, such as rough terrain type lift trucks; and
� passenger vehicles that operate on work sites, such as 4x4’s.
The guidance is not appropriate to slow moving vehicles that stop almost instantly (i.e. before brakeratio can be measured), such as a coal mine free steered vehicles. For these latter types of vehicle,other kinds of brake test(s) may be more suitable.
Who Should Read this Booklet?The intended readership of this guidance is:
� site operators who are responsible for providing vehicles;
� site managers who are responsible for vehicle operation and maintenance; and
� those who carry out vehicle brake testing.
Site operators and managers may require the assistance of competent persons with relevantacademic knowledge, to supervise and / or undertake the technical activities covered in thisguidance.
The guidance may also be useful for:
� safety representatives;
� employee representatives; and
� those who are involved with driver training and assessment.
2 Relevant Legal RequirementsThe following is an indication of some relevant legislation. For complete bibliographic listings ofthese, see Further Information at the end of this guide.
Section 2 of the Health and Safety at Work etc. Act 1974, places a general duty on employers totake reasonable action to ensure the safety of people at work. Such duty extends to the provision and maintenance of plant, which for the purposes of that Act, must also be considered as safe.
Regulation 4 of the Provision and Use of Work Equipment Regulations 1998 and the Approved Code of Practice and Guidance, require plant and equipment to be suitable for the purposes for which it isprovided.
Regulation 5 of the Provision and Use of Work Equipment Regulations 1998 and the Approved Code of Practice and Guidance, require that equipment is appropriately maintained such that itsperformance does not deteriorate to the extent that it puts people at risk.
Regulation 9 of the Quarries Regulations 1999 and Approved Codes of Practice, require that personscarrying out brake testing are competent by virtue of training, experience and knowledge, to do thatwork.
Regulation 12 of the Quarries Regulations 1999 and Approved Codes of Practice (ACoP), require the operator to prepare and keep up to date, a suitable written scheme for systematic inspection,maintenance and testing. ACoP 95 highlights that it is particularly important that the scheme covers vehicles.
Regulation 14 of the Quarries Regulations 1999 and Approved Codes of Practice and Guidance,require the operator to make vehicle rules, that include cross-references to the scheme for inspectionand maintenance of plant. The Guidance, Appendix 4, paragraph 14, requires that a suitableinspection scheme be in place to ensure vehicle brakes are kept in good condition at all times.
3What is Brake Testing? Braking SystemsVehicles may be provided with any combination of the following braking systems:
� a service brake – used for stopping and holding;
� a secondary or emergency brake – used for stopping if the service brake fails;
� a parking brake – used to hold a vehicle stationary; and
� retarders – an energy absorbing brake normally used to control speed.
It will generally be necessary to test the performance of all braking systems provided on a vehicle, toensure that safety is maintained.
Cautionary Note 1
There is controversy surrounding the dynamic testing of secondary (emergency) brakes. Some argue that this brake should not be tested dynamically, because to do so risks causing damage to the vehicle. But, from a safety point of view, it is difficult to justify that a brake that would berelied on in an emergency should never be tested. A secondary brake must be capable of safelystopping a vehicle under the most onerous conditions of use, and information will be required to verify this. Where there is justifiable reason not to carry out dynamic testing of secondary brakes,then manufacturers should be asked to provide a suitable, alternative test procedure that is capableof demonstrating that secondary braking is compatible with site operating conditions and can besafely maintained. Less frequent test intervals might be justified on a little used braking system.
Brake TestingThe designer of a vehicle determines the level of performance of its braking system(s). The user(employer) has a duty to ensure that the vehicle selected is suitable for the conditions of its intendeduse. For example, the brakes must safely stop and hold the vehicle in the most onerous workingconditions that might be expected of it – such as when it is carrying its maximum load down itsmaximum operating gradient.
Brake testing is a procedure for periodically checking that a vehicle’s brakes are maintained(working) at a level of performance that does not put people at risk. Usually, this means:
� ideally, that their level of performance has not significantly reduced below the design levelperformance; or
� at the very least, that their level of performance exceeds that required for safe working under the most onerous site conditions of speed, load and gradient.
Examples of brake performance tests include:
� instrumented brake testing – where an instrument is used to measure brake performance when stopping, usually in terms of a brake ratio;
� simple stopping distance tests – where the distance to stop a vehicle from a pre-determined speed is measured;
� a hold test – where the vehicle is parked on a pre-determined slope and the brakes are applied to see if they hold;
� a stall test – where the engine attempts to drive through the brakes; and
� a pull test – where a hydraulic ram, or similar, attempts to pull a vehicle through its brakes.
4Service and emergency brakes are designed to stop a vehicle that is moving and a park brake isdesigned to hold it stationary. Stopping distance tests and instrumented tests are carried outdynamically and are therefore appropriate to service and emergency brakes (refer to Cautionary Note 1 earlier). A hold test is a static test and is therefore appropriate to parking brakes.
Simple stopping distance tests and stall tests are a quick and easy check of any brake, but are oftenimprecise and cannot easily be related to actual operating conditions, in order to give a clearindication of adequate brake performance. Pull tests are a useful alternative where dynamic testing isimpractical. Using a pull test, brake force can be measured by a dynamometer.
Brake performance achieved during testing has to be compared to some pre-determined acceptablebrake performance values. That is, results must be evaluated against pass/fail criteria. The bestcomparator is the design specification, i.e. the performance defined by the manufacturer when thebrakes are in good condition.
The Problem with Simple Stopping Distance TestsFor a simple stopping distance test, a series of marker posts are arranged in a line with 1m spacingbetween them. The driver of the vehicle being tested accelerates to the test speed and maintains thisspeed until the first marker post is reached; at which point the brakes are applied in an attempt tobring the vehicle to a stop as quickly as possible. The stopping distance is the distance travelledbeyond the first marker post.
The stopping distance is made up of the braking distance plus the distance travelled by the vehicleduring the short ‘delay time’ it takes the brakes to achieve full effort after the pedal has beenapplied. It also includes the distance travelled during the driver’s reaction time; this being any slightdelay in applying the brakes after passing the first marker post.
The main problem with simple stopping distance tests is that they are not very precise. For example,the theoretical braking distance for a vehicle travelling at 15mph (24kph) on level ground is about7.5m. If there is a 20 per cent error in the speed and the actual test speed is only 12mph (19kph),then the stopping distance will be reduced to about 5m. If there is a 10 per cent downward slopeinstead of a level test road, then a 15mph vehicle will stop after about 11.5m. Also, the driver’sreactions are important. If there is a 0.5 second delay in applying the brakes as the driver passes thefirst marker post, then at 15mph this will increase the stopping distance by a further 3.5m.
Consequently, in such a series of tests all intended to be under the same test conditions for a vehicletravelling at 15mph, it is possible to achieve a stopping distance of 7.5m in the first test; whilesubsequent tests could result in a stopping distance anywhere between 5m (i.e. 20 per cent speederror) and 15m (i.e. a downward slope plus driver reaction time).
Instrumented TestingWhen properly carried out, instrumented testing is much more accurate than the simple stoppingdistance method and hence, more likely to show up brake deficiencies.
Instrumented testing can also be used as part of a site risk assessment to demonstrate that vehiclebraking capabilities are adequate, when compared to the site gradients, speeds and loads that theyare to encounter.
The brake ratio method of testing is ideal for both of these uses.
5Some Simple Dynamics
What is Brake Ratio? An appreciation of the term brake ratio is essential to understanding instrumented brake testing usingthe brake ratio method.
In simple stopping distance tests it is the stopping distance that is measured and compared withsome standard value as a means of considering brake performance. In contrast, when electronicinstruments are used to measure brake performance, they usually measure brake ratio. By definition:
brake ratio = brake force exerted by the wheels
vehicle weight
The brake force exerted by the wheels results in a linear (in line of travel) retardation of the vehicle.This force is generated by the wheel brakes exerting a braking torque (measured in Newton-metres,Nm), which will be applied to the outside of the wheel and tyre at a rolling radius depending on thewheel size (measured in metres, m). The vehicle design will set these values.
For example, assume that a dump truck has a laden mass of 67,230 kg (multiply by 9.81 to convertto weight). The total braking torque for its 6 wheels is 224,971Nm, acting at a tyre rolling radius of0.887m.
Therefore, the brake ratio = 224,971/0.887 N = 253,631 = 0.384
67,230 x 9.81 N 659,526
The brake ratio is usually expressed as a percentage, i.e. 38.4 per cent1.
Instrumented Brake TestingFrom simple dynamics, brake force F = vehicle mass M x retardation f. Also, vehicle weight W (due togravity) = vehicle mass M x g (acceleration due to gravity). By ‘juggling’ these two equations slightly,we see that F/W = f/g. That is, the ratio of force/weight is the same as the ratio of retardation/gand is known as the brake ratio. Hence:
brake ratio = brake force and it is also = retardation
vehicle weight g
An electronic brake test instrument usually contains a single axial transducer that measuresretardation. And if the instrument expresses this measured retardation as a fraction of g, we havemeasured the brake ratio.
So, if manufacturers tell us what the designed braking force is for a particular machine we can easilycalculate the design brake ratio for that machine. A brake test instrument can then be used tomeasure the actual operating brake ratio, in order to compare this with the design brake ratio toassess brake performance.
In practice, the operating brake ratio is likely to be less than the design brake ratio for a brand newvehicle, because the brakes will have deteriorated slightly with use. A practical margin would be say10 per cent of the design brake ratio. So, in the example above, we should expect instrumentedbrake testing results for that vehicle of at least (38.4 minus 10 per cent) 34.5 per cent.
There are several kinds of test instrument available, which are either mechanically or electronicallyoperated.
1 Brake ratio is often referred to as brake efficiency when expressed as a percentage, but in this guidance document,the term brake ratio is consistently used so as to avoid confusion.
6The mechanical instruments, sometimes called inertia meters, are reasonably accurate if tests areconducted on smooth level roads. However, if the roadway surface is uneven, then ‘bumps’ can affectthe readings on the inertia meter. Under such test conditions, they may tend to give higher thanactual readings.
Cautionary Note 2
The test procedures referred to in this guidance are aimed at electronic instruments specificallydesigned to test the brakes on heavy off-road vehicles and to automatically compensate for anyvariation in gradient when doing so. The use of other instruments, such as those designed to test on good level surfaces only (i.e. instruments that cannot automatically compensate for variations in gradient or tolerate rutting in the travel surface etc.), if used under such off-road circumstances could lead to potentially dangerous errors in measurement.
The Effects of Speed, Load and GradientA vehicle will stop differently under different conditions of speed, load or gradient. It is important tounderstand why and how these conditions affect stopping ability, because when brake testing wehave to compare like with like.
The Effect of Speed on Stopping DistanceThe faster a vehicle is travelling the longer it will take to stop. In fact, twice the speed results inapproximately four times the required braking distance.
For example, take a dump truck that has a brake ratio of 30 per cent. In this case, the retardationalong level ground will be 2.94m/s/s (i.e. 30 per cent of g). If it is travelling at 12.5kph (3.47m/s)when the brakes are applied, then the braking distance will be (using the dynamics formula of v2 = u2 + 2fs, where the final speed is zero):
v2 = 3.47 x 3.47 = 2.05m
2f 2 x 2.94
For the same dump truck, with the same brake ratio, this time travelling at 25kph (6.94m/s), i.e.twice the speed, when the brakes are applied the braking distance will be:
6.94 x 6.94 = 8.18m. That is, 4 times longer.
2 x 2.94
Consequently, in stopping distance testing, it is critical to ensure that the same speed is maintainedin all tests otherwise results will vary widely.
The Effect of Load on Stopping DistanceA laden vehicle will take longer to stop than an unladen vehicle. This is because the rate ofretardation that the brakes can achieve will be less for a laden vehicle than for an unladen vehicle.For example, if a dump truck has a brake ratio of 30 per cent, this means that it is capable ofdeveloping a brake force in the direction of travel equal to 30 per cent of the vehicle weight. But isthis 30 per cent of the laden weight or 30 per cent of the unladen weight?
If the design brake ratio is given as a percentage of the laden weight and we test unladen, then thebrake ratio we measure will not be the same. We will not be comparing like with like; so the overallassessment of brake performance will be flawed. Fortunately, it is easy to convert from a laden brakeratio to an unladen one. From basic dynamics:
Force = Mass x Retardation.
7The maximum braking force a vehicle is capable of developing can be assumed to be constant for anycondition of load, provided it is caused to be developed. Therefore:
Mass Laden x Retardation Laden = Mass Unladen x Retardation Unladen.
The laden and unladen masses are standard information. So, if we measure either the retardationladen or the retardation unladen, we can calculate the other. As mentioned previously, we see thatbrake ratio and retardation as a percentage of g are interchangeable. So, for example, if the ladenmass is 67,230kg and the unladen mass is 30,730kg, then for a laden brake ratio of 30 per cent theequivalent brake ratio for an unladen vehicle is:
Unladen brake ratio = 67,230 x 0.3 = 65 per cent.
30,730
For the same vehicle, the retardation laden is 30 per cent of g, and unladen 65 per cent of g, i.e.2.94 m/s/s and 6.38 m/s/s. The unladen vehicle, which is approximately half the weight, will stoptwice as quickly.
Testing unladen is likely to induce skidding, as the higher brake ratio approaches the coefficient offriction between the wheels and the road surface.
The Effect of Gradient on Stopping DistanceA vehicle travelling down a gradient will take longer to stop than a vehicle travelling at the samespeed on level ground. This is because on a gradient, gravity will try to accelerate the vehicle downthe slope and this effect has to be overcome, before the brakes can begin to stop the vehicle.
The best way to consider the effect of gradients is to think in terms of percentage slopes. That is, a1 in 10 gradient is a 10 per cent slope, and 1 in 12 is 8.3 per cent. In this way, the fraction of avehicle’s weight acting down the gradient is equal to the percentage slope of the gradient.
A vehicle with a 30 per cent brake ratio can apply all that effort into stopping on level ground, butwhen travelling down a gradient it must overcome the weight acting down the gradient first. So, on a1 in 10 gradient (10 per cent slope) this leaves only 20 per cent for stopping. On a 1 in 12 gradient(8.3 per cent slope) it leaves 21.7 per cent for stopping.
So, to ensure that a vehicle can travel safely down a gradient, the total brake ratio must be equal to,or greater than, the gradient expressed as a percentage plus an amount of brake ratio necessary tostop the vehicle.
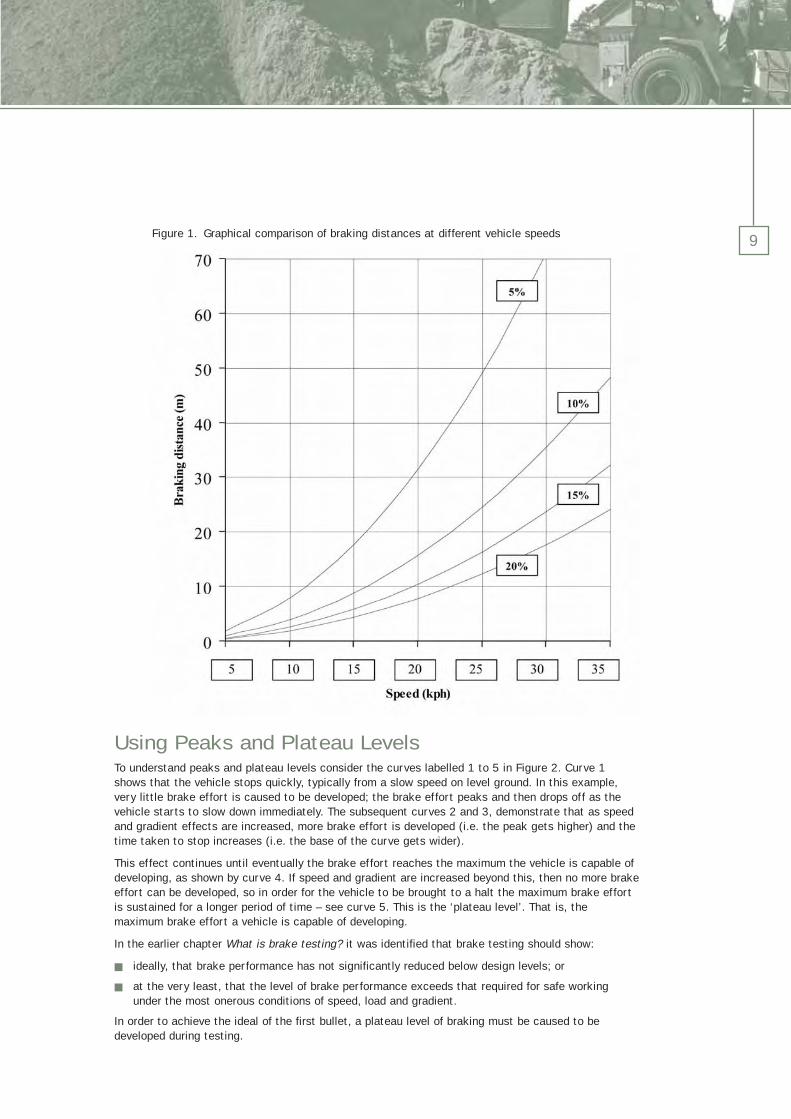
8 How Much Brake Ratio is Required for Stopping?There is no prescribed amount of brake ratio that is required to stop a vehicle. Rather, it is a matter forthe risk assessment to decide. However, 10 per cent is a good rule-of-thumb absolute minimum. If thebrake ratio on a vehicle is less than 10 per cent, its driver may not feel they are slowing down quicklyenough when in a braking situation.
Taking this rule-of-thumb into account would mean, for example, that for a 1 in 10 down-gradient, i.e. 10per cent slope, the vehicle brake ratio should be no less than 20 per cent. That is, 10 per cent for thegradient and 10 per cent for stopping. Note however, that braking distance increases at approximatelydouble the increase in speed. So, to ensure safe stopping distances at higher speeds, the amount ofbrake ratio necessary just for slowing down may be 15 per cent, 20 per cent, or even more.
Table 1 compares braking distances for speeds of 5 to 35 kph at 5kph increments and given brakeratios of 5 to 20 per cent inclusive. So for example, row six of the data in the Table confirms that at30kph, if a vehicle only had 10 per cent brake ratio left for slowing down then the braking distancewould be about 35m; but if it had 20 per cent then the braking distance would drop to about 18m.Figure 1 meanwhile represents this data graphically. The resulting shorter braking distances as a resultof increasing brake ratio are clearly visible from the lines on the graph in this Figure.
Cautionary Note 3
When considering the data in Table 1 and Figure 1, it should be noted that the given braking distances havenot included allowance for a driver’s reaction time, or for the slight delay from first applying the brake toachieving full brake effort, both of which will add to the overall stopping distances shown. For example,from velocity = distance/time, a 0.5 second delay when travelling at 25kph would result in a distancetravelled of about 3.5m before braking becomes effective.
Cautionary Note 4
The 5 per cent data given in Table 1 and Figure 1 are included because some emergency brake systems are50 per cent of the service brake. So, if the service brake ratio for slowing down is 10 per cent, then in suchcases the emergency brake would only be 5 per cent and the examples shown demonstrate the very longbraking distances that would result.
Table 1. Tabular comparison of braking distances at different vehicle speeds
Braking distance for various brake ratios(m)
Speed (kph) 5% 10% 15% 20%
5 1.96 0.98 0.66 0.49
10 7.89 3.94 2.63 1.97
15 17.74 8.87 5.91 4.44
20 31.54 15.77 10.51 7.88
25 49.28 24.64 16.43 12.32
30 70.98 35.49 23.66 17.74
35 96.60 48.30 32.20 24.15
Note. Doubling the brake ratio halves the braking distance; doubling the speed increases the brakingdistance by approximately four times.
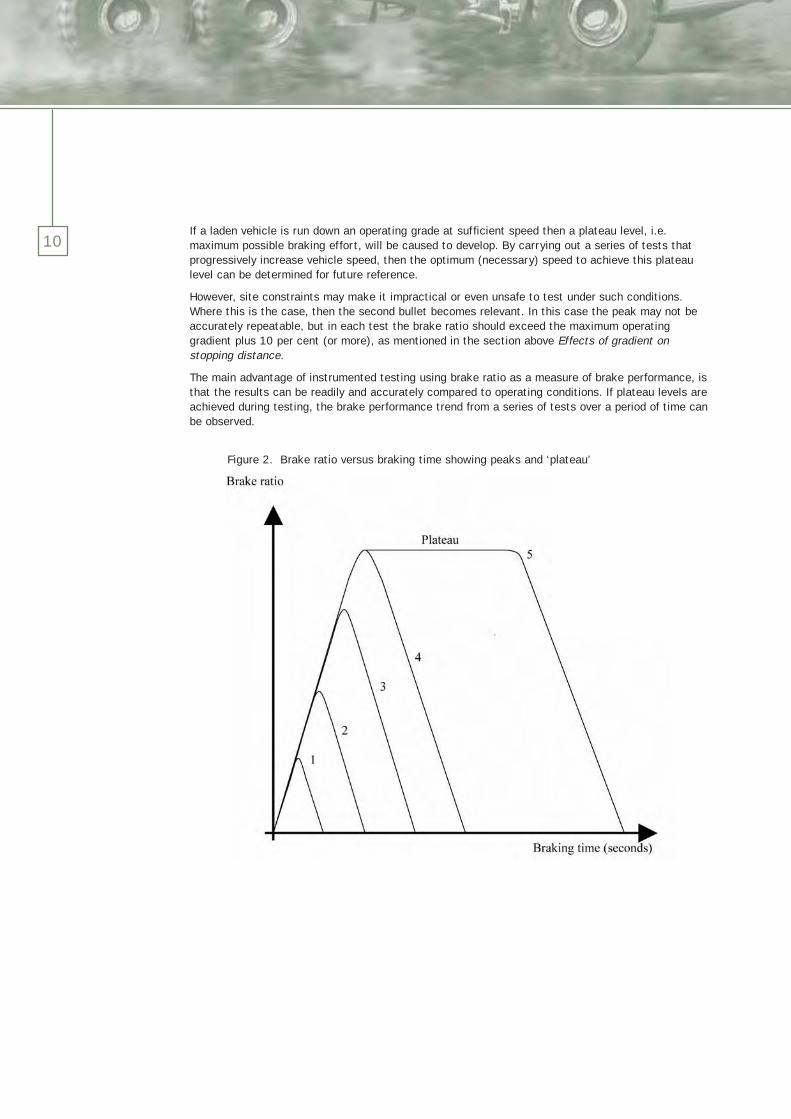
9Figure 1. Graphical comparison of braking distances at different vehicle speeds
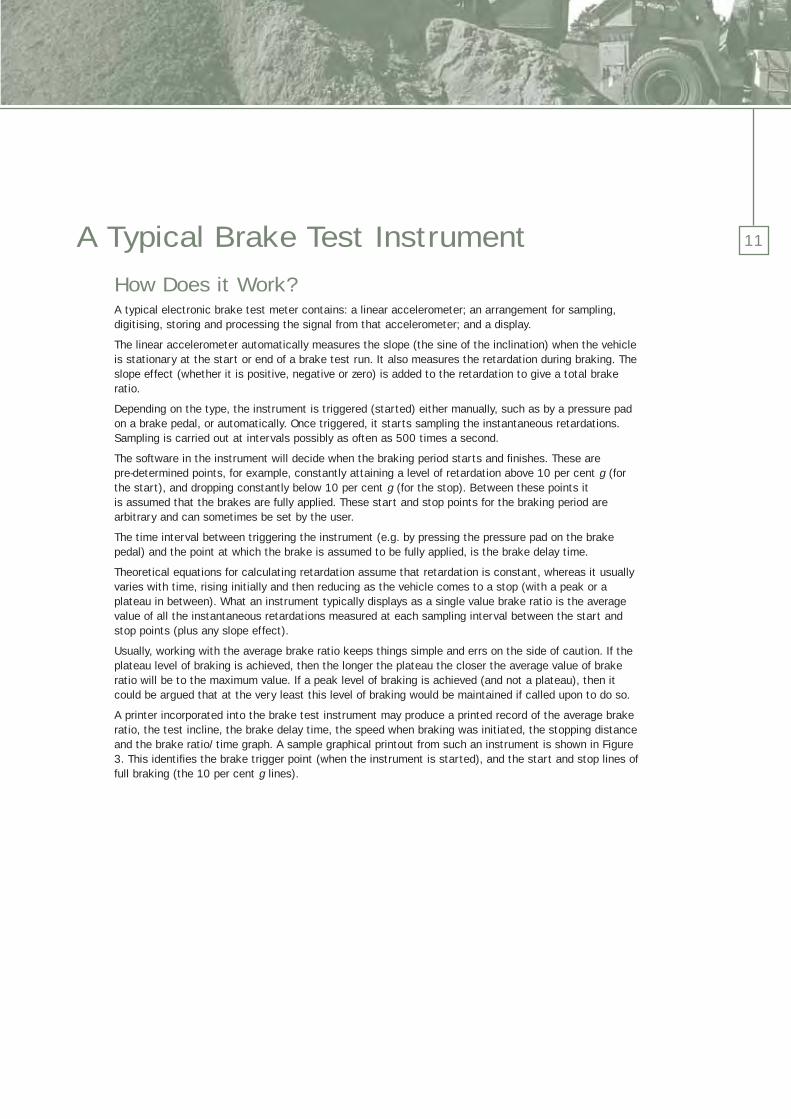
Using Peaks and Plateau LevelsTo understand peaks and plateau levels consider the curves labelled 1 to 5 in Figure 2. Curve 1shows that the vehicle stops quickly, typically from a slow speed on level ground. In this example,very little brake effort is caused to be developed; the brake effort peaks and then drops off as thevehicle starts to slow down immediately. The subsequent curves 2 and 3, demonstrate that as speedand gradient effects are increased, more brake effort is developed (i.e. the peak gets higher) and thetime taken to stop increases (i.e. the base of the curve gets wider).
This effect continues until eventually the brake effort reaches the maximum the vehicle is capable ofdeveloping, as shown by curve 4. If speed and gradient are increased beyond this, then no more brakeeffort can be developed, so in order for the vehicle to be brought to a halt the maximum brake effortis sustained for a longer period of time – see curve 5. This is the ‘plateau level’. That is, themaximum brake effort a vehicle is capable of developing.
In the earlier chapter What is brake testing? it was identified that brake testing should show:
� ideally, that brake performance has not significantly reduced below design levels; or
� at the very least, that the level of brake performance exceeds that required for safe working under the most onerous conditions of speed, load and gradient.
In order to achieve the ideal of the first bullet, a plateau level of braking must be caused to bedeveloped during testing.
10
Figure 2. Brake ratio versus braking time showing peaks and ‘plateau’
If a laden vehicle is run down an operating grade at sufficient speed then a plateau level, i.e.maximum possible braking effort, will be caused to develop. By carrying out a series of tests thatprogressively increase vehicle speed, then the optimum (necessary) speed to achieve this plateaulevel can be determined for future reference.
However, site constraints may make it impractical or even unsafe to test under such conditions.Where this is the case, then the second bullet becomes relevant. In this case the peak may not beaccurately repeatable, but in each test the brake ratio should exceed the maximum operatinggradient plus 10 per cent (or more), as mentioned in the section above Effects of gradient onstopping distance.
The main advantage of instrumented testing using brake ratio as a measure of brake performance, isthat the results can be readily and accurately compared to operating conditions. If plateau levels areachieved during testing, the brake performance trend from a series of tests over a period of time canbe observed.
11A Typical Brake Test Instrument
How Does it Work?A typical electronic brake test meter contains: a linear accelerometer; an arrangement for sampling,digitising, storing and processing the signal from that accelerometer; and a display.
The linear accelerometer automatically measures the slope (the sine of the inclination) when the vehicleis stationary at the start or end of a brake test run. It also measures the retardation during braking. Theslope effect (whether it is positive, negative or zero) is added to the retardation to give a total brakeratio.
Depending on the type, the instrument is triggered (started) either manually, such as by a pressure padon a brake pedal, or automatically. Once triggered, it starts sampling the instantaneous retardations.Sampling is carried out at intervals possibly as often as 500 times a second.
The software in the instrument will decide when the braking period starts and finishes. These are pre-determined points, for example, constantly attaining a level of retardation above 10 per cent g (forthe start), and dropping constantly below 10 per cent g (for the stop). Between these points it is assumed that the brakes are fully applied. These start and stop points for the braking period arearbitrary and can sometimes be set by the user.
The time interval between triggering the instrument (e.g. by pressing the pressure pad on the brakepedal) and the point at which the brake is assumed to be fully applied, is the brake delay time.
Theoretical equations for calculating retardation assume that retardation is constant, whereas it usuallyvaries with time, rising initially and then reducing as the vehicle comes to a stop (with a peak or aplateau in between). What an instrument typically displays as a single value brake ratio is the averagevalue of all the instantaneous retardations measured at each sampling interval between the start andstop points (plus any slope effect).
Usually, working with the average brake ratio keeps things simple and errs on the side of caution. If theplateau level of braking is achieved, then the longer the plateau the closer the average value of brakeratio will be to the maximum value. If a peak level of braking is achieved (and not a plateau), then itcould be argued that at the very least this level of braking would be maintained if called upon to do so.
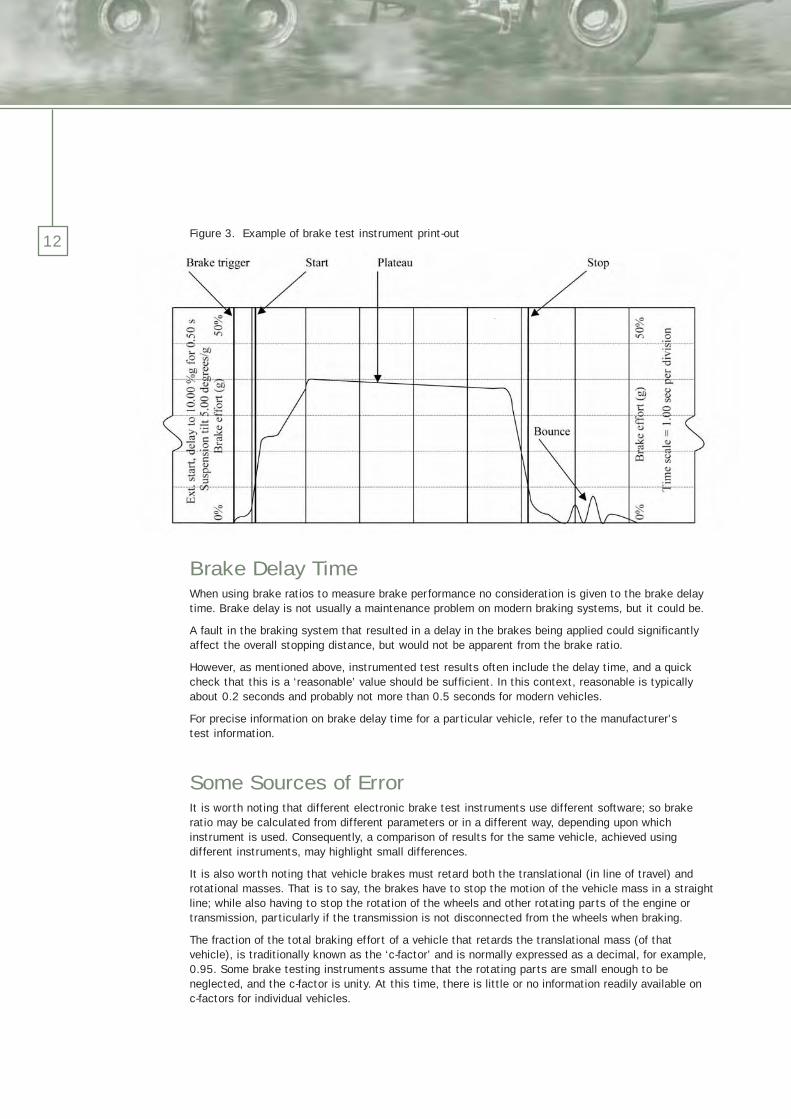
A printer incorporated into the brake test instrument may produce a printed record of the average brakeratio, the test incline, the brake delay time, the speed when braking was initiated, the stopping distanceand the brake ratio/time graph. A sample graphical printout from such an instrument is shown in Figure3. This identifies the brake trigger point (when the instrument is started), and the start and stop lines offull braking (the 10 per cent g lines).
12
Brake Delay TimeWhen using brake ratios to measure brake performance no consideration is given to the brake delaytime. Brake delay is not usually a maintenance problem on modern braking systems, but it could be.
A fault in the braking system that resulted in a delay in the brakes being applied could significantlyaffect the overall stopping distance, but would not be apparent from the brake ratio.
However, as mentioned above, instrumented test results often include the delay time, and a quickcheck that this is a ‘reasonable’ value should be sufficient. In this context, reasonable is typicallyabout 0.2 seconds and probably not more than 0.5 seconds for modern vehicles.
For precise information on brake delay time for a particular vehicle, refer to the manufacturer’s test information.
Some Sources of ErrorIt is worth noting that different electronic brake test instruments use different software; so brakeratio may be calculated from different parameters or in a different way, depending upon whichinstrument is used. Consequently, a comparison of results for the same vehicle, achieved usingdifferent instruments, may highlight small differences.
It is also worth noting that vehicle brakes must retard both the translational (in line of travel) androtational masses. That is to say, the brakes have to stop the motion of the vehicle mass in a straightline; while also having to stop the rotation of the wheels and other rotating parts of the engine ortransmission, particularly if the transmission is not disconnected from the wheels when braking.
The fraction of the total braking effort of a vehicle that retards the translational mass (of thatvehicle), is traditionally known as the ‘c-factor’ and is normally expressed as a decimal, for example,0.95. Some brake testing instruments assume that the rotating parts are small enough to beneglected, and the c-factor is unity. At this time, there is little or no information readily available on c-factors for individual vehicles.
Figure 3. Example of brake test instrument print-out
13Electronic brake test instruments measure retardation in the line of travel. In order to get an accuratemeasurement, the axis of the instrument should be parallel to the ground. The easiest way to achievethis is to set the vehicle on level ground and then set the test instrument level on the vehicle. If thevehicle is on a slope, then the slope must be measured and the instrument set to the same slope onthe vehicle. If the axis of the instrument is not parallel to the ground then a slight error in readingswill result.
During braking, weight transfer from one axle to another can cause the body of the vehicle to tipforward on the suspension, and mean that the instrument is no longer parallel to the road surface,which gives rise to small errors in retardation readings. However, if the instrument manufacturer’soperating instructions are followed (e.g. for correct set up and use) then under ‘normal’ testconditions these small errors will not impact test results. Some instruments may make an allowancefor vehicles tipping forward by a few degrees.
14 Practical Considerations
The Test SiteFor dynamic testing, the test site must be safe. In practice this normally means:
� there must be no risk of the test vehicle colliding with other vehicles operating on site;
� there should be ample distance ahead of the brake test site for the test vehicle to stop moreslowly (i.e. overrun) if brakes are defective; and
� allowance should be made for a vehicle pulling or veering to one side during the test.
Skidding will increase the stopping distance and make the brakes appear less effective, so is not atrue measure of braking performance. If skidding occurs, then the test may be invalidated. Wetconditions are the most likely cause of skidding. However, if testing is carried out with unladenvehicles then skidding may occur even on dry roads. For this reason, brake testing is best carried out with a laden vehicle.
Ideally, the test site should have a dry, smooth, hard surface and be either level or have a constantdownward slope.
Frequency of TestingThe frequency of periodic instrumented testing should be based on the risk assessment. For example,to ensure performance is maintained, older vehicles (that therefore, typically will have less efficientbraking systems) may require more frequent testing than will more modern vehicles. More frequenttesting may also be appropriate where steep gradients feature on the site at which a vehicle normallyoperates. Because of their specific characteristics, different vehicles working on the same site mayhave different test frequencies. Similarly, due to differing environmental conditions, the same type ofvehicles that are working on different sites may also require different test frequencies.
More frequent, simple driver stopping tests should be used to ‘back up’ formal periodic instrumentedtesting. Having determined by instrumented testing that the brakes are in good condition, asubsequent simple stopping test may be marked out by two posts (representing start and acceptablestop positions), on a regularly used section of haul road. This would permit drivers to test periodically,such as at the start of a shift or daily during routine vehicle use. Ideally, testing should be down-slopeand with load. Equally, referring to the aspects of a safe site mentioned above, the test area shouldbe selected with consideration given to safe stopping.
A stall test is another method of frequent, simple testing to back up periodic instrumented testing.There are also available built-in versions of some electronic brake test instruments that arepermanently fitted into a vehicle. Such an instrument allows drivers to perform simple instrumentedtests on a daily basis, and is much better than a simple stopping distance test.
In practice, a typical service brake test regime would consist of:
� a simple, driver stopping/instrumented test, or stall test, carried out either per shift or daily; and
� an instrumented test at an interval of between 1 and 3 months (depending on the vehicle/ environmental circumstances as indicated earlier) carried out by a competent person.
15Repeatability of ResultsRepeatability means that when testing the same vehicle(s) with the same effective brakes under thesame conditions of load, gradient and speed then the same results should be obtained. As alreadymentioned, repeatability with stopping distance tests is very difficult. Repeatability of instrumentedbrake testing results can be achieved with a proper understanding of what is being measured.
Test instruments usually produce graphical results (retardation versus time) of the braking cycle, fromthe driver hitting the brake pedal, to the vehicle coming to a stop. The initial slope of the brake testgraph (refer Figure 3) carries on rising as the brake force continues to develop. After a short whilethe brake force will have developed to its maximum value. If there is sufficient momentum, thismaximum value will be sustained for a short while and as mentioned earlier, this is called the plateaulevel, because the slope of the graph levels out. After the plateau, the graph slopes downwards as thevehicle comes to a stop.
If the momentum of a vehicle is such that the brakes can stop it before the maximum brake force iscaused to be developed (for example, if the vehicle is moving slowly), it will stop quickly with littlebrake effort and a plateau level will not be achieved. Under such circumstances the brake test resultgraph will simply reach a peak and then fall off to zero as the vehicle stops.
If a plateau level is reached, results are repeatable. If a plateau level is not reached then differentpeaks will be reached on each test and results will not be accurately repeatable.
Plateau levels are sometimes difficult to determine from graphs. This is because the horizontal timescale may be extended such that an interval of 1 second appears to be stretched out (and under suchcircumstances this is probably just an extended peak). A proper plateau level is therefore one that issustained for at least 2 or 3 seconds.
Pass and Fail CriteriaBS EN ISO 3450 : (1996)2 requires a minimum brake performance equivalent to 17 per cent brakeratio for a category of dumper having an unladen weight of under 32t when tested with full payload;and 19 per cent for dumpers over 32t. However, some modern dumpers will readily achieve twice thislevel of braking.
Actual braking performance should always be compared with the design level; if performance iscompared with the minimum standard then a very significant deterioration may occur and result in anunsafe vehicle being operated.
Hence, the minimum level of braking required in the standard should not be used as an automaticpass/fail level during routine periodic testing. Instead, users should obtain information from thevehicle manufacturer that enables them to determine the design brake ratio.
2 BS EN ISO 3450:1996. Safety of earth-moving machinery. Specification for braking systems and performancerequirements and test procedures for rubber-tyred machines. British Standards Institution. ISBN: 0-580-26308-8.
16 Other Tests and ChecksTesting is not just a procedure for establishing the performance of a braking system. It should alsoinclude other tests and checks that verify the ongoing reliability of the braking system. For example,daily checks should be carried out by drivers to ascertain that fluid levels and operating pressures arecorrect, warning devices are working and that simple stopping and holding tests appear normal.
Other periodic tests and checks by technicians might include3:
� checking the pressure in stored energy devices (also known as accumulators4);
� testing warning devices on stored energy systems (these devices are typically activated beforethe pressure drops below the specified level necessary to maintain secondary brake performancerequirements);
� testing interlocks (such as devices that prevent start-up unless the park brake is applied);
� leakage checks, e.g. for brake fluid loss or air leakages;
� wear checks on friction discs;
� general checks of the condition of brake system pipes; and
� draining water from compressed air tanks.
Vehicle Damage Caused by Heavy BrakingVehicles continue to get larger and braking systems more efficient; the end result is that somesuspension and chassis components are heavily stressed during heavy braking. However, it isreasonable to expect service and emergency brakes to be tested dynamically, but testing should be no more frequent than is necessary to demonstrate ongoing satisfactory brake performance, and (testing) should be designed such that it is in line with any operating restrictions imposed by the manufacturer (see also Cautionary Note 1 earlier).
Park brakes are designed purely for the purpose of holding a vehicle stationary and so there is nosimilar justification for testing these dynamically. Damage may be caused if park brakes are testeddynamically.
3 See manufacturers’ maintenance manuals for full details of other periodic checks and tests required.4 An accumulator is a small vessel used to store energy and may be used in vehicle steering and braking circuits. Thestored energy is provided to operate these critical functions and allow a vehicle to be stopped safely if, for example, theengine cuts out unexpectedly. Typically, accumulators are pre-charged with an inert gas, which the operating air/fluid(compressed air or hydraulic fluid) compresses. When the engine (compressor or pump) stops, the gas in the accumulatorexpands and delivers sufficient air/fluid at sufficient pressure to operate the critical systems for a short time. If this pre-charge of gas is slowly lost over a period of time, then the stored energy will be reduced, possibly to zero.
17Step-by-step GuideThis final chapter of the booklet presents a step-by-step guide to determining initial required brakingcapability for a vehicle along with a pass level for subsequent testing.
Step 1: Establish Maximum Brake RatioThe first step is to establish the maximum, or design, brake ratio of the vehicle. If it is a new vehiclethen the manufacturer must provide adequate information to the user. This may be in the form of astated brake ratio or it may be information on braking torque exerted at the wheels (refer to What isbrake ratio? earlier if necessary).
If it is not a new vehicle and there is little or no available information on braking capability, then atest instrument can be used to determine the maximum achievable brake ratio. This is achieved in aseries of tests (ideally following a thorough overhaul of the braking systems), by progressively testinga fully laden vehicle and increasing the speed at each test, until no increase in brake ratio isrecorded. This is then the maximum brake ratio for the vehicle, i.e. the plateau level (refer toRepeatability of Results).
If several vehicles of the same type are tested, then all should achieve similar results. If they do not,then an ‘outstanding’ result may indicate a fault. The more vehicles that are tested, the more reliableis the derived maximum brake ratio for that particular vehicle type.
Let us assume that the brake ratio of a fully laden new vehicle is 38.4 per cent, (convenientlyrounded down to 38 per cent).
Step 2: Determine Conditions of UseHaving established the braking capabilities of a particular vehicle, the next step is to determine itsconditions of use. That is, the gradient, the speed limit, and any other factors that might increaserisk. For example, a bend at the bottom of a gradient where overrunning might result in a collisionwith vehicles travelling in the opposite direction.
Let us assume (in this worked example) that the gradient is 1 in 12 (i.e. 8.3 per cent). The gradientis quite long and the road is good, so the manager’s preferred permissible operating speed limit forthe gradient is 25kph. But there is a bend at the bottom of the gradient, and the ability to stop in areasonably short distance, say 15 to 20m, would reduce the risk of overrunning and collision.
After deducting 4m from this stopping distance for distance travelled during the driver’s reaction time(refer to Cautionary Note 3), then the amount of brake ratio needed just for slowing down andstopping at 25kph (refer to Table 1 and Figure 1 detailing braking distances at different speeds forvarying brake ratios) would be 20 per cent, (i.e. 12.32m being closest fit for 15 to 20m less 4m).
The minimum brake ratio considered necessary for safe travel of a fully laden vehicle down thegradient is therefore (20 + 8.3 =) 28.3 per cent which is conveniently rounded up to 29 per cent.
Cautionary Note 5
Skidding negates this analysis, because the stopping distance would be so much longer. Similarly,overloading needs to be controlled, otherwise the retardation will be reduced and once again thestopping distance would be so much longer.
18 Step 3: Determine Pass/Fail CriteriaA pass/fail criterion exactly equal to the total brake ratio just determined in Step 2 makes noallowance for acceptable brake deterioration between tests, for example, as a result of permittedlining wear. Consequently, the brake ratio just determined in Step 2 should be increased by say 10per cent of its value, so in the example, the required operating brake ratio becomes 32 per cent. Thisis the value that testers should regard as the minimum pass figure for this vehicle under theconditions of use described.
Usually, a series of three brake tests is carried out and in each case the result should exceed thisminimum pass figure. The results may differ for reasons described in the section ‘Repeatability ofResults’.
Step 4: Identify Deteriorating TrendsThe value determined in Step 3 is a peak value (32 per cent). It is less than the design brake ratiodetermined in Step 1 (38 per cent), which is a plateau level (see Using Peaks and Plateau Levels). Ifa plateau level is reached, results are repeatable. A comparison of plateau level results from one testto another will allow a deteriorating trend in brake performance to be monitored.
In addition, if brake test conditions allow plateau levels to be developed, a more accurate and hencemore reliable pass/fail criterion than the minimum can be determined. By applying the same practicaltolerance as in Step 3, then we may assume that the design brake ratio (which is the plateau level)determined in Step 1 (38 per cent), may fall off by up to say 10 per cent5 of its value, i.e. to 34 percent, before concern is raised.
This (34 per cent value) exceeds the minimum pass figure of 32 per cent determined in Step 2 and soit may not be immediately unsafe to operate the vehicle, but, here we are saying that neverthelessthe vehicle should be taken out of service for investigation if brake ratio does fall below 34 per cent,because the deterioration of the brakes is the concerning factor.
Cautionary Note 6
If the minimum pass/fail criterion in Step 3 is very low compared to the design brake ratio in Step 1,for example 15 per cent compared to 40 per cent, then a large fall-off in brake performance couldresult before concern was raised. In this case, testing in line with Step 4 is more reliable.
Step 5: Check Delay TimeFinally, the brake delay time, i.e. the time taken from ‘hitting the pedal’ to the start of braking,should be checked. This is often printed out numerically by the brake test instrument in the list ofresults. It is important to remember that the brake ratio is measured after the start of braking andany delay in brake application would not be recognised. However, any delay in brake application couldsignificantly increase the stopping distance, even though the brake ratio shows the brakes areperforming effectively.
5 The 10 per cent margin described in Steps 3 and 4 is arbitrary, and should be determined by a competent person.
19To Summarise (for this example)1. Design brake ratio = 38 per cent;
2. Maximum gradient 1 in 12, so brake ratio for slope = 8.3 per cent; permitted speed of 25kph, so brake ratio for stopping in 15 to 20m (with driver delay allowance of 4m) = 20 per cent; rounding up, total brake ratio required = 29 per cent;
3. Allowing for some deterioration (add 10 per cent to last), minimum test brake ratio for safe operation = 32 per cent;
4. The best pass/fail criterion is determined from plateau level testing and comparing this with the design value, i.e. plateau value results should be between 34 and 38 per cent (i.e. design value less a practical tolerance); if it drops below 34 per cent it fails; and
5. Check the brake delay time.
Repeat steps 1 to 5 for any other brake, e.g. secondary (or emergency) brake, that is to be testeddynamically.
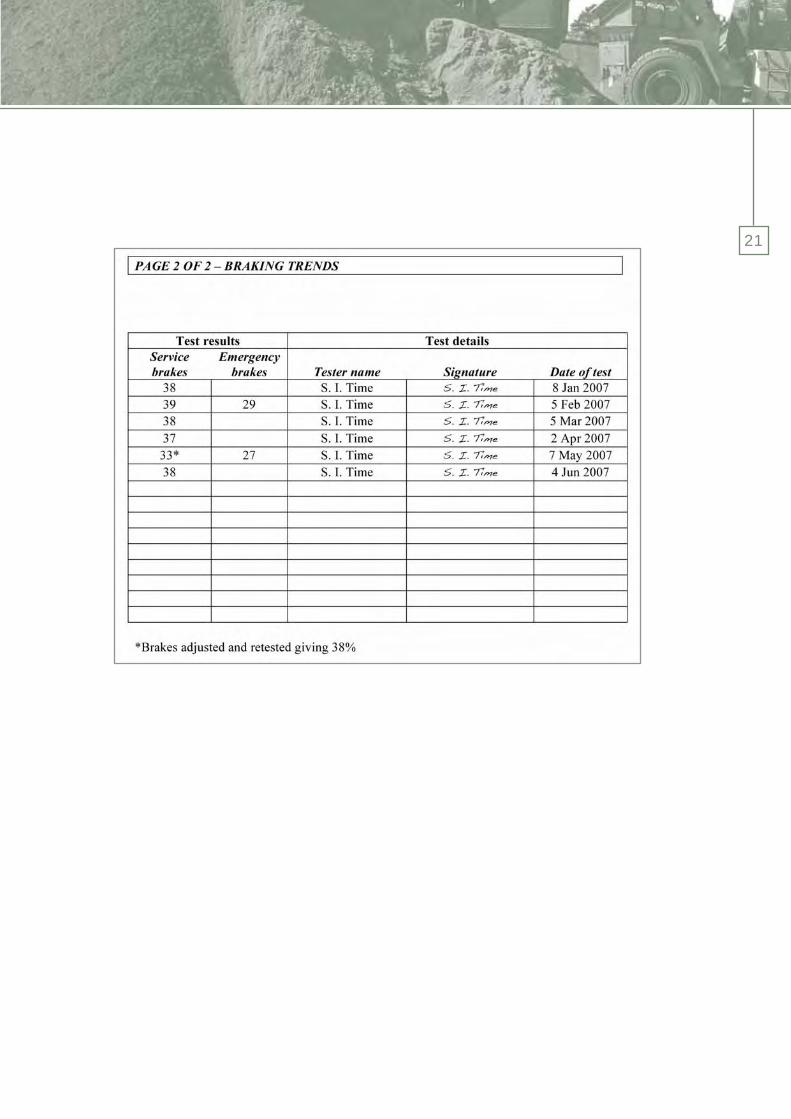
Recording Test ResultsFigure 4 shows an example of a brake assessment form, recording commissioning information againstwhich future test results will be compared. The results of all periodic brake tests must be recordedand the report trail should be auditable. It will also be useful to record the trends, e.g. a comparisonof results over a period of time. Software is available to record test information and trends forindividual vehicles using PCs.
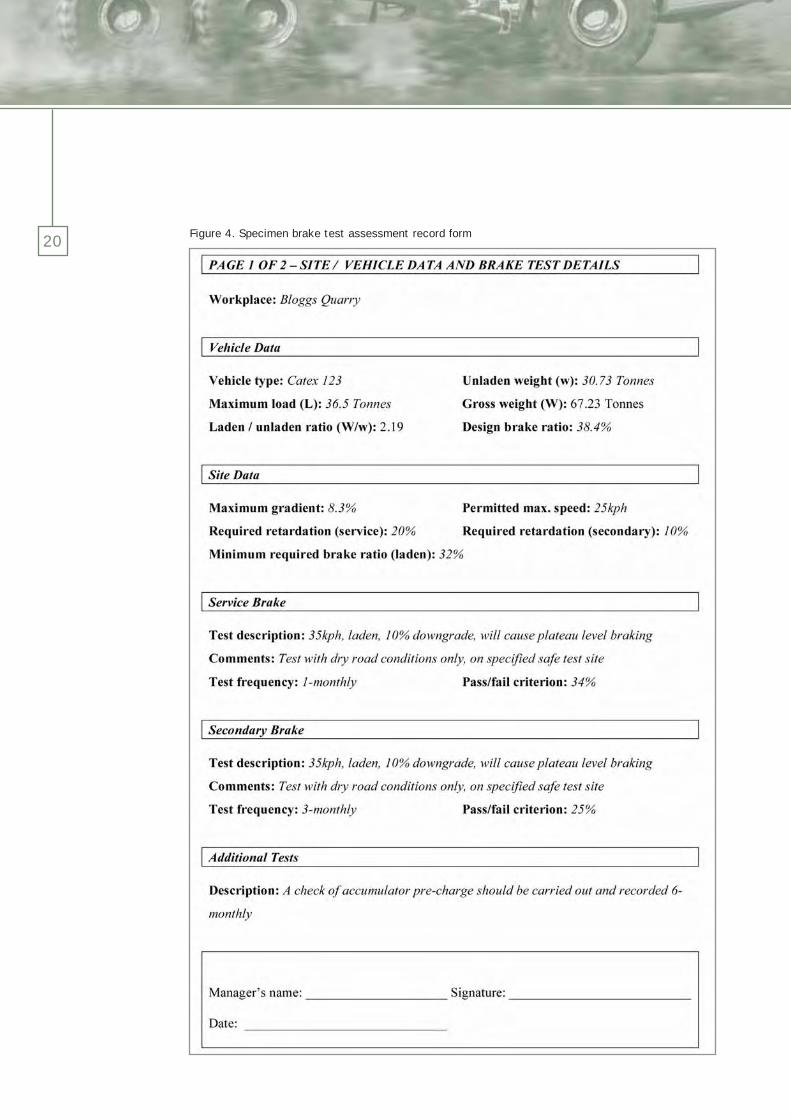
20Figure 4. Specimen brake test assessment record form
21
22 Further InformationHealth and Safety at Quarries. Quarries Regulations 1999. Approved Code of Practice.London: HSE Books. ISBN: 0-7176-2458-7.
Simple Guide to The Provision and Use of Work Equipment Regulations 1998.The Health and Safety Executive, document ref: INDG 291. ISBN: 0-7176-2429-3.
The Health and Safety at Work Etc. Act (1974).London: HMSO. ISBN 0-1054-3774-3.
The Provision and Use of Work Equipment Regulations (1998). Statutory Instrument No. 2306.Accessible on the Office of Public Sector Information website at: www.opsi.gov.uk/ (viewed February 2007).
The Quarries Regulations (1999). Statutory Instrument 1999 No. 2024.Accessible on the Office of Public Sector Information website at: www.opsi.gov.uk/(viewed February 2007).
Various other information on the safe operation of plant and equipment is available on the website ofthe Off-highway Plant and Equipment Research Centre (OPERC). See: www.operc.com.
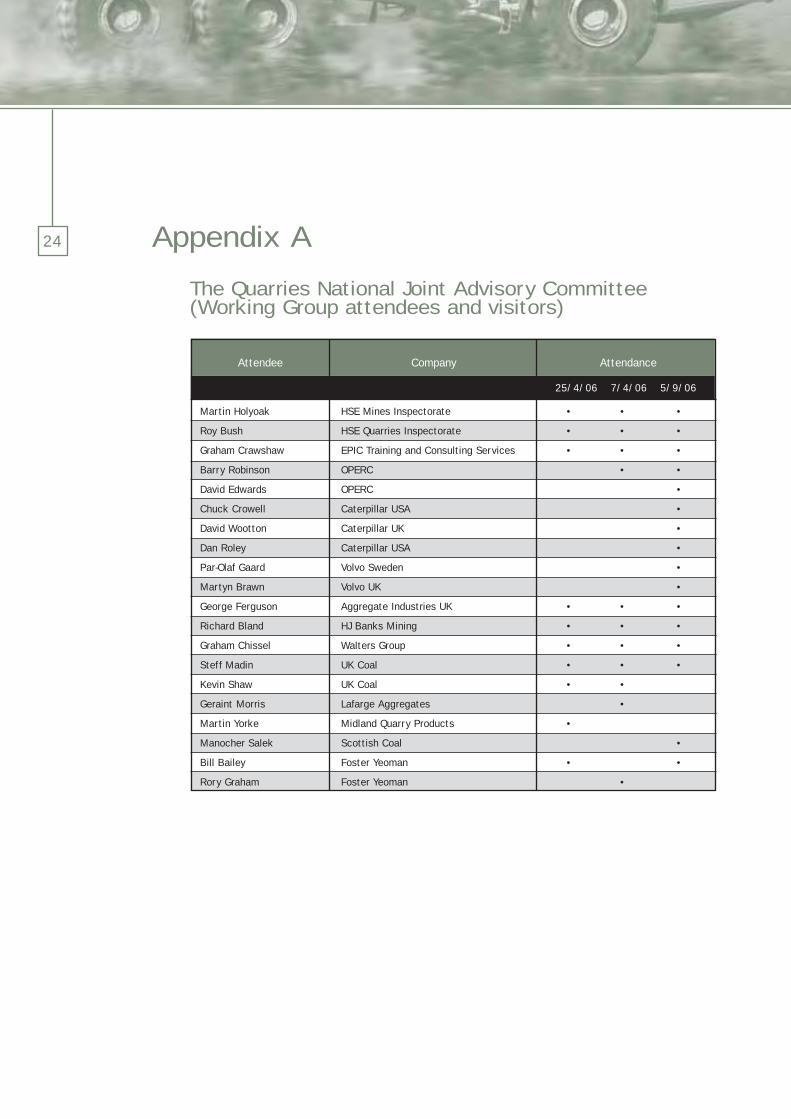
24 Appendix A
The Quarries National Joint Advisory Committee(Working Group attendees and visitors)
Martin Holyoak
Roy Bush
Graham Crawshaw
Barry Robinson
David Edwards
Chuck Crowell
David Wootton
Dan Roley
Par-Olaf Gaard
Martyn Brawn
George Ferguson
Richard Bland
Graham Chissel
Steff Madin
Kevin Shaw
Geraint Morris
Martin Yorke
Manocher Salek
Bill Bailey
Rory Graham
HSE Mines Inspectorate
HSE Quarries Inspectorate
EPIC Training and Consulting Services
OPERC
OPERC
Caterpillar USA
Caterpillar UK
Caterpillar USA
Volvo Sweden
Volvo UK
Aggregate Industries UK
HJ Banks Mining
Walters Group
UK Coal
UK Coal
Lafarge Aggregates
Midland Quarry Products
Scottish Coal
Foster Yeoman
Foster Yeoman
• • •
• • •
• • •
• •
•
•
•
•
•
•
• • •
• • •
• • •
• • •
• •
•
•
•
• •
•
Attendee Company Attendance
25/4/06 7/4/06 5/9/06

Distributor: IRAS GroupEmail: [email protected]

OPERC, PO Box 5039, Dudley, West Midlands DY1 9FQ Tel/Fax: +44 (0)1384 356202