Embed Size (px)
Citation preview
U.S. Fire Department Profile – 2015
April 2017 Hylton J.G. Haynes Gary P. Stein
© April 2017 National Fire Protection Association
Abstract NFPA estimates there were approximately 1,160,450 firefighters in the U.S. in 2015. An estimated 345,600 (30%) of these were career firefighters and 814,850 (70%) were volunteer firefighters. Most of the career firefighters (71%) worked in communities that protected 25,000 or more people. Most of the volunteer firefighters (95%) were in departments that protected fewer than 25,000 people. There are an estimated 29,727 fire departments in the U.S. Of these, 2,651 departments were staffed by all career firefighters, 1,893 were mostly career, 5,421 were mostly volunteer and 19,762 were all volunteer. In the U.S., 13,500 (45.4%) of departments provided EMS service, 4,617 departments (15.5%) provided EMS service and advanced life support, and 11,610 (39.1%) of departments provided no EMS support.
Keywords: fire departments, firefighters, career, volunteer, EMS, fire stations, pumpers, aerial apparatus.
Acknowledgments
The authors would like to thank the fire departments who participated in this annual NFPA Fire Experience Survey, and/or the NFPA Fire Service Survey.
The authors would also like to thank the members of the NFPA staff who worked on the 2015 U.S. Fire Experience Survey, Frank Deely, Justin Cronin, and Jay Petrillo for editing the survey form and making follow-up calls to fire departments, and Blair Prince for processing this report.
For more information about the National Fire Protection Association, visit www.nfpa.org or call 617-770-3000. To learn more about Research go to www.nfpa.org/research or call 617-984-7451.
Copies of this analysis are available from:
National Fire Protection Association NFPA Research, Data and Analytics Division 1 Batterymarch Park Quincy, MA 02169-7471 www.nfpa.org E-mail: [email protected]: 617-984-7451
NFPA No. USS07-REVCopyright© 2017, National Fire Protection Association, Quincy, MA
U.S. Fire Department Profile- 2015, 4/17 i NFPA Research, Quincy, MA
Table of Contents
List of Tables and Figures ii
Overview iv
Fact Sheet v
Infographic vi
Background and Objectives 1
Methods 2
Results- 3
Firefighters 3
Numbers and Rates of Firefighters 7
Fire Departments 22
Emergency Medical Services 33
U.S. Expenditures on Local Fire Protection 33
Appendix 1: Number of U.S. Fire Departments 37
Appendix 2: Number of Fire Stations 38
Appendix 3: Firefighters by Gender, Race and Hispanic or Latino Ethnicity 39
U.S. Fire Department Profile- 2015, 4/17 ii NFPA Research, Quincy, MA
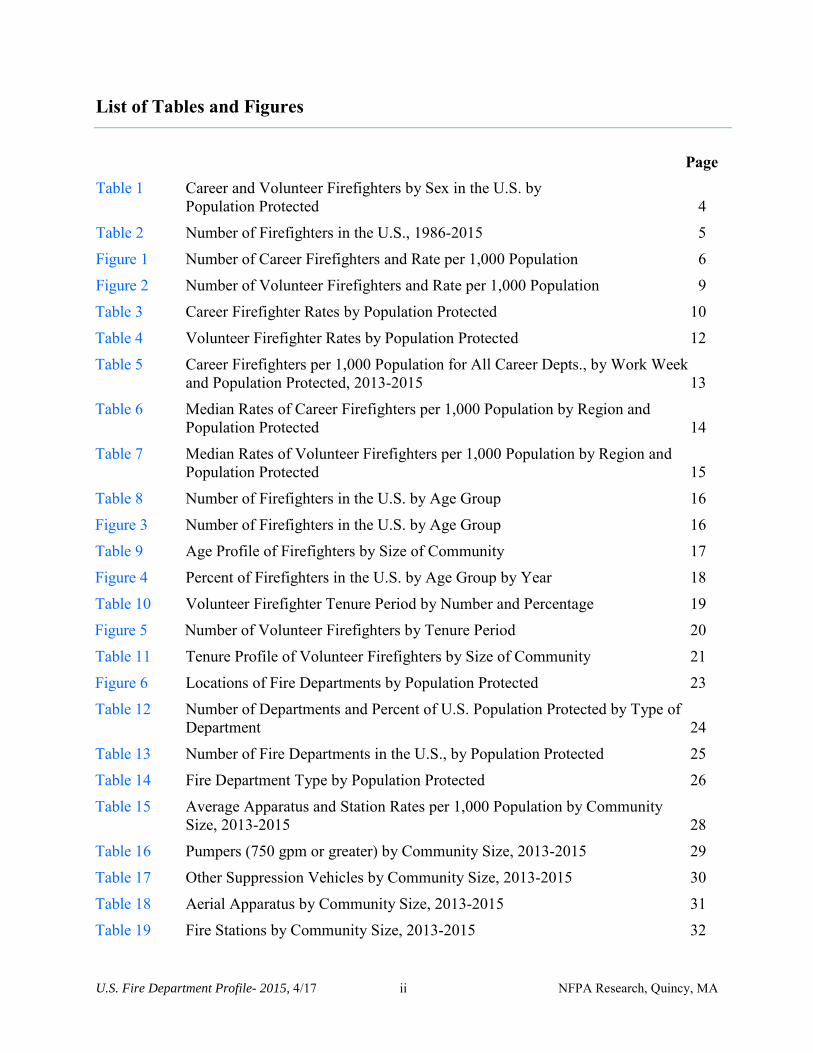
List of Tables and Figures
Page Table 1 Career and Volunteer Firefighters by Sex in the U.S. by
Population Protected 4 Table 2 Number of Firefighters in the U.S., 1986-2015 5 Figure 1 Number of Career Firefighters and Rate per 1,000 Population 6 Figure 2 Number of Volunteer Firefighters and Rate per 1,000 Population 9 Table 3 Career Firefighter Rates by Population Protected 10 Table 4 Volunteer Firefighter Rates by Population Protected 12 Table 5 Career Firefighters per 1,000 Population for All Career Depts., by Work Week
and Population Protected, 2013-2015 13 Table 6 Median Rates of Career Firefighters per 1,000 Population by Region and
Population Protected 14 Table 7 Median Rates of Volunteer Firefighters per 1,000 Population by Region and
Population Protected 15 Table 8 Number of Firefighters in the U.S. by Age Group 16 Figure 3 Number of Firefighters in the U.S. by Age Group 16 Table 9 Age Profile of Firefighters by Size of Community 17 Figure 4 Percent of Firefighters in the U.S. by Age Group by Year 18 Table 10 Volunteer Firefighter Tenure Period by Number and Percentage 19 Figure 5 Number of Volunteer Firefighters by Tenure Period 20 Table 11 Tenure Profile of Volunteer Firefighters by Size of Community 21 Figure 6 Locations of Fire Departments by Population Protected 23 Table 12 Number of Departments and Percent of U.S. Population Protected by Type of
Department 24 Table 13 Number of Fire Departments in the U.S., by Population Protected 25 Table 14 Fire Department Type by Population Protected 26 Table 15 Average Apparatus and Station Rates per 1,000 Population by Community
Size, 2013-2015 28 Table 16 Pumpers (750 gpm or greater) by Community Size, 2013-2015 29 Table 17 Other Suppression Vehicles by Community Size, 2013-2015 30 Table 18 Aerial Apparatus by Community Size, 2013-2015 31 Table 19 Fire Stations by Community Size, 2013-2015 32
U.S. Fire Department Profile- 2015, 4/17 iii NFPA Research, Quincy, MA
Table 20 Departments Providing Emergency Medical Service, by Community Size (Percent), 2013-2015 34
Table 21 Direct Expenditures on Local Fire Protection 35
List of Tables and Figures (Continued)
Appendix 1 Number of U.S. Fire Departments, 1986-2015 37 Appendix 2 Number of Fire Stations, 1995-2015 38 Appendix 3 Percentage of Firefighters by Gender, Race, and Hispanic or
Latino Ethnicity, 2011-2015 39
U.S. Fire Department Profile- 2015, 4/17 iv NFPA Research, Quincy, MA
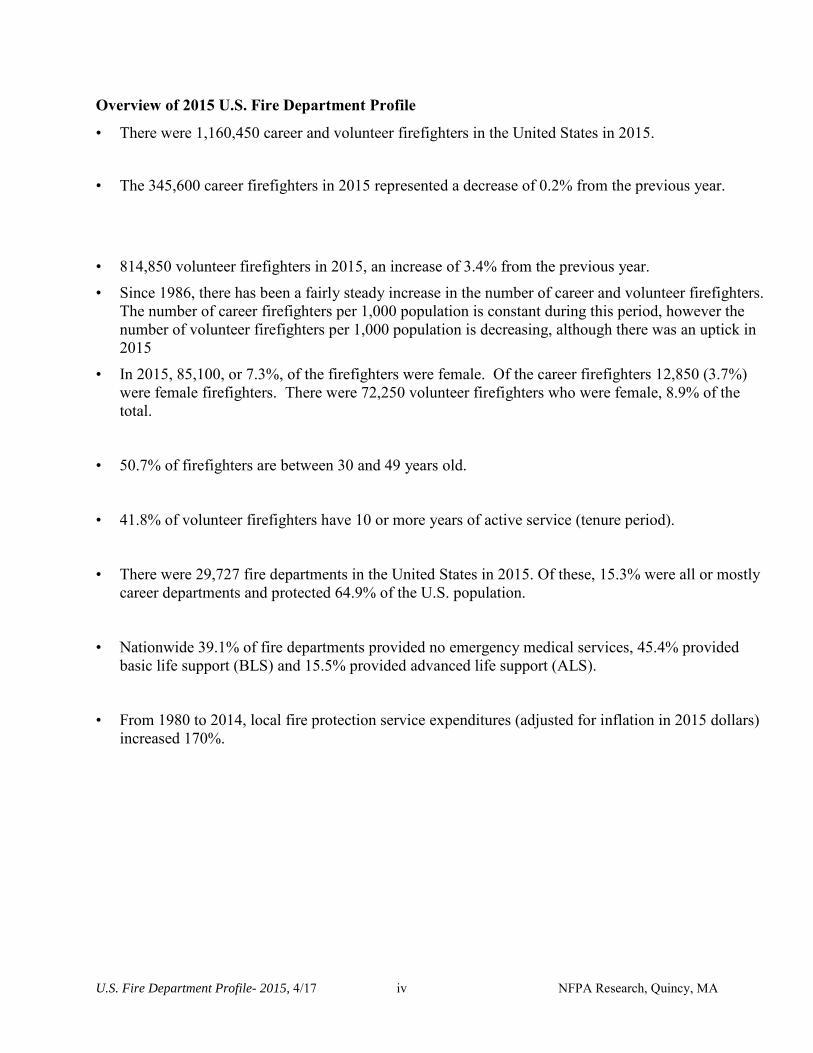
Overview of 2015 U.S. Fire Department Profile
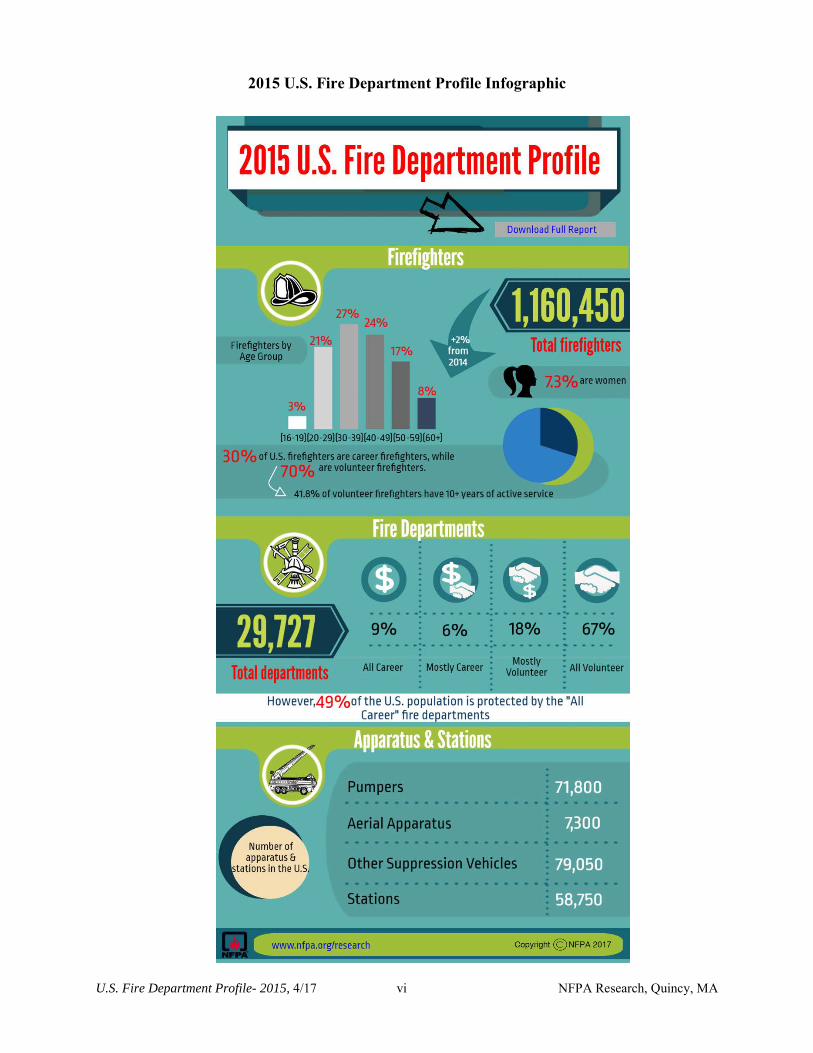
• There were 1,160,450 career and volunteer firefighters in the United States in 2015.
• The 345,600 career firefighters in 2015 represented a decrease of 0.2% from the previous year.
• 814,850 volunteer firefighters in 2015, an increase of 3.4% from the previous year.• Since 1986, there has been a fairly steady increase in the number of career and volunteer firefighters.
The number of career firefighters per 1,000 population is constant during this period, however thenumber of volunteer firefighters per 1,000 population is decreasing, although there was an uptick in2015
• In 2015, 85,100, or 7.3%, of the firefighters were female. Of the career firefighters 12,850 (3.7%)were female firefighters. There were 72,250 volunteer firefighters who were female, 8.9% of thetotal.
• 50.7% of firefighters are between 30 and 49 years old.
• 41.8% of volunteer firefighters have 10 or more years of active service (tenure period).
• There were 29,727 fire departments in the United States in 2015. Of these, 15.3% were all or mostlycareer departments and protected 64.9% of the U.S. population.
• Nationwide 39.1% of fire departments provided no emergency medical services, 45.4% providedbasic life support (BLS) and 15.5% provided advanced life support (ALS).
• From 1980 to 2014, local fire protection service expenditures (adjusted for inflation in 2015 dollars)increased 170%.
U.S. Fire Department Profile- 2015, 4/17 v NFPA Research, Quincy, MA
77,450
207,950 189,200
340,250
050,000
100,000150,000200,000250,000300,000350,000
Less than one year 1-5 years 6-10 years More than 10 years
Num
ber o
f Vol
unte
er
Fire
ifght
ers
Tenure Period
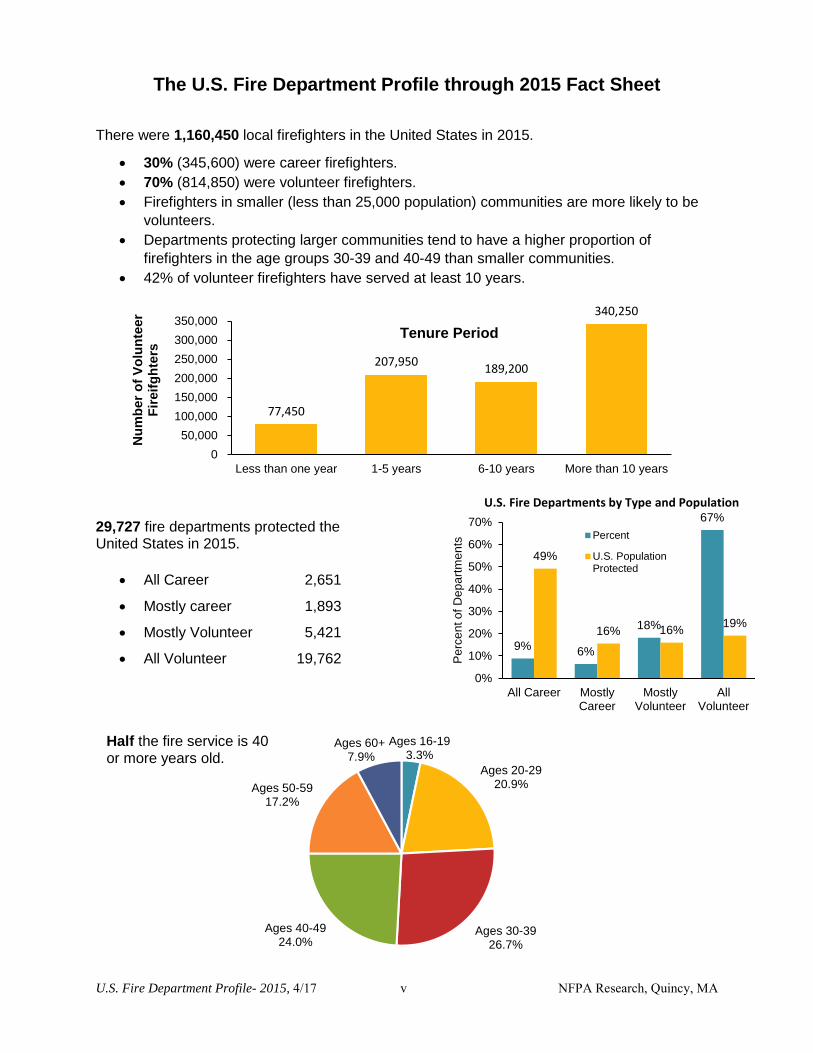
The U.S. Fire Department Profile through 2015 Fact Sheet
There were 1,160,450 local firefighters in the United States in 2015.
• 30% (345,600) were career firefighters.• 70% (814,850) were volunteer firefighters.• Firefighters in smaller (less than 25,000 population) communities are more likely to be
volunteers.• Departments protecting larger communities tend to have a higher proportion of
firefighters in the age groups 30-39 and 40-49 than smaller communities.• 42% of volunteer firefighters have served at least 10 years.
29,727 fire departments protected the United States in 2015.
• All Career 2,651
• Mostly career 1,893
• Mostly Volunteer 5,421
• All Volunteer 19,762
Ages 16-193.3%
Ages 20-2920.9%
Ages 30-3926.7%
Ages 40-4924.0%
Ages 50-5917.2%
Ages 60+7.9%
9% 6%
18%
67%
49%
16% 16% 19%
0%
10%
20%
30%
40%
50%
60%
70%
All Career MostlyCareer
MostlyVolunteer
AllVolunteer
Perc
ent o
f Dep
artm
ents
U.S. Fire Departments by Type and Population
Percent
U.S. PopulationProtected
Half the fire service is 40 or more years old.
U.S. Fire Department Profile- 2015, 4/17 vi NFPA Research, Quincy, MA
2015 U.S. Fire Department Profile Infographic
U.S. Fire Department Profile- 2015, 4/17 1 NFPA Research, Quincy, MA
Background and Objectives
This report provides an overview of local and municipal fire departments in the United States. The analysis includes firefighters, fire departments, apparatus and stations. The results are based on data collected during the NFPA Survey of Fire Departments for U.S. Fire Experience (2015) and the NFPA Fire Service Survey where the data was collected over the period 2013-2015. An earlier report, Fire Loss in the United States during 2015, measured the national fire experience in terms of the number of fires that fire departments responded to and the resulting civilian deaths, civilian injuries, and property losses that occurred.
This year's report includes among its results:
• An estimate of the total number of firefighters (including career, volunteer, gender).
• Trends in the number of career and volunteer firefighters and rates.
• An estimate of the number of fire departments.
• Median rates of firefighters per 1,000 population by U.S. region.
• Number of firefighters by age group and community size.
• Number of volunteer firefighters by tenure period and community size.
• Number of fire departments (including career and volunteer).
• Average apparatus and station rates.
• Departments providing emergency medical services by community size.
• Direct expenditures on local fire protection.
U.S. Fire Department Profile- 2015, 4/17 2 NFPA Research, Quincy, MA
Methods
The report is based on two data sources: the annual NFPA Survey for U.S. Fire
Experience, 2015, and the NFPA Fire Service Survey, 2013-2015.
The U.S. Fire Experience Survey utilizes a sample of fire departments in the United States to
make national projections of the fire problem. The sample is stratified by the size of the community
protected by the fire department. All U.S. fire departments that protect communities with a
population of more than 2,500 are included in the sample. The 13,565 departments in the nine
highest strata protect a population of 300,304,722 or 93% of the U.S. population as of July, 2015.
The remainder of the sample included 8,562 randomly selected departments from stratum
10 (less than 2,500 population protected), for a total sample size of 22,127 (74%) of all known
fire departments to the NFPA in the United States.
A total of 2,605 departments responded to the 2015 fire experience survey. The national
projections are made by weighting sample results according to the proportion of total U.S.
population accounted for by communities of each size. Around any estimate based on a sample
survey, there is a confidence interval that measures the statistical certainty (or uncertainty) of the
estimate. We are confident the actual number of total firefighters falls within five percent of the
estimate.
The NFPA Fire Service Survey is a three year cycle survey which attempts to survey about
one-third of the states in the country each year. The survey includes questions on the number of
career firefighters, the number of volunteer firefighters, length of work week, number of
apparatus and stations, etc. In recent years, the survey has had a response rate of between
13-16% from departments.
The results in this report are based on local and municipal fire departments. State and
federal firefighting entities were not included in this sample. No adjustments were made for
private fire brigades, such as industrial or military installations.
U.S. Fire Department Profile- 2015, 4/17 3 NFPA Research, Quincy, MA
Firefighters
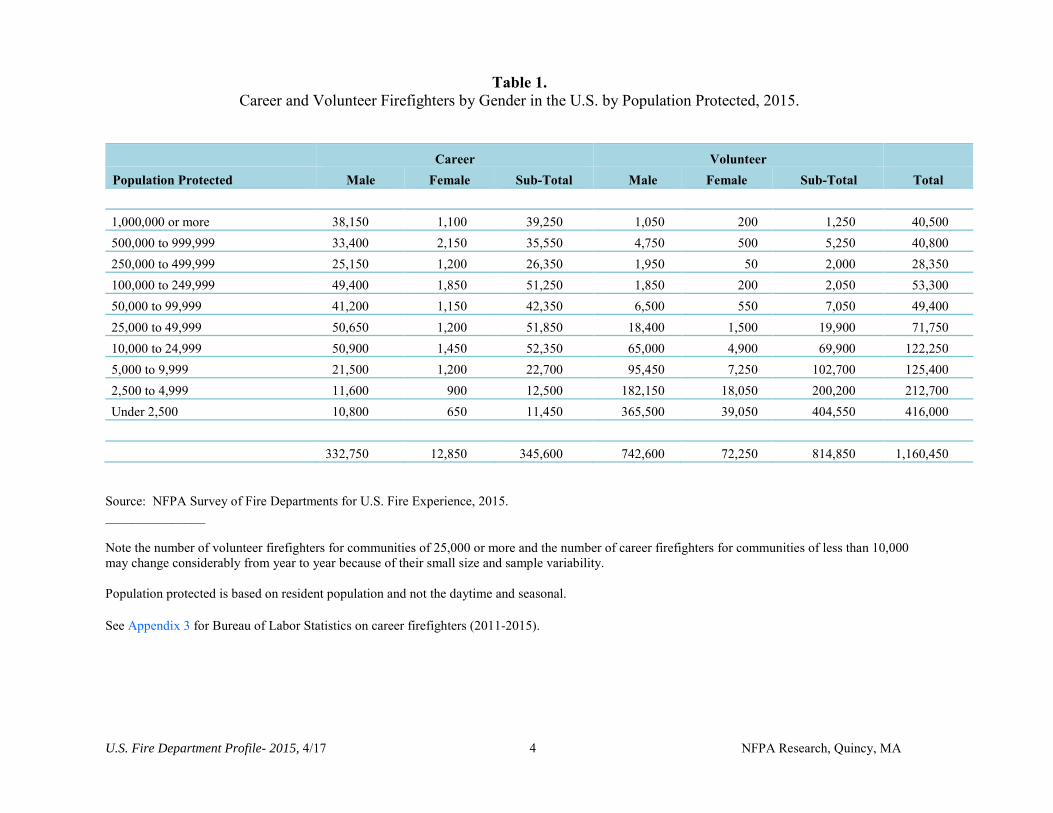
There were approximately 1,160,450 firefighters in the U.S. in 2015, according to estimates
based on NFPA’s 2015 National Fire Experience Survey (Table 1). This is an increase of 2.3%
from 2014 (Table 2).
Career firefighters include full-time uniformed firefighters regardless of assignments, e.g.,
suppression, prevention/inspection, administrative. For the purpose of this survey, career
firefighters include only firefighters in public fire departments that protect people, their
residences, and public buildings; they do not include firefighters working in private fire brigades,
or for state and federal agencies.
Volunteer firefighters include any active part-time (call or volunteer) firefighters. Active
volunteers are defined as being involved in firefighting. Of the total number of firefighters,
345,600 (30%) were career firefighters, while 814,850 (70%) were volunteers.1
Most career firefighters (71%) are in communities that protect 25,000 or more people.
Most volunteer firefighters (95%) are in departments that protect fewer than 25,000 people.
Approximately half of the volunteer firefighters are with small, rural departments that protect
fewer than 2,500 people (Table 1).
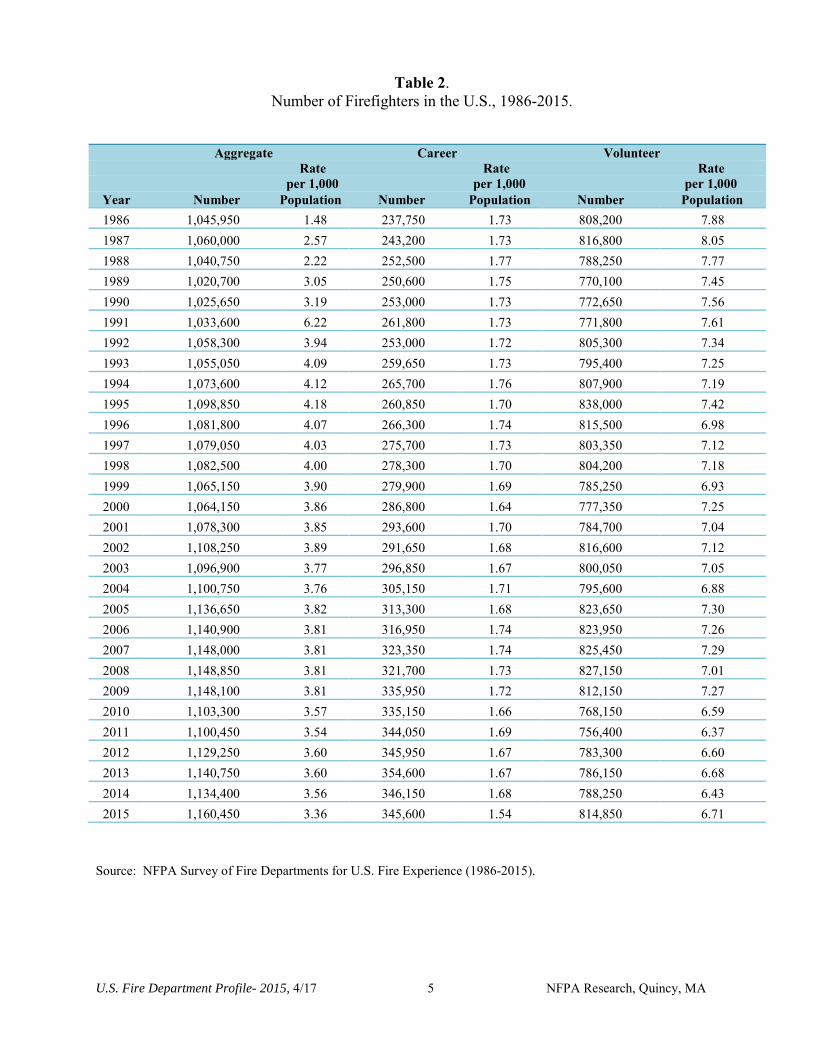
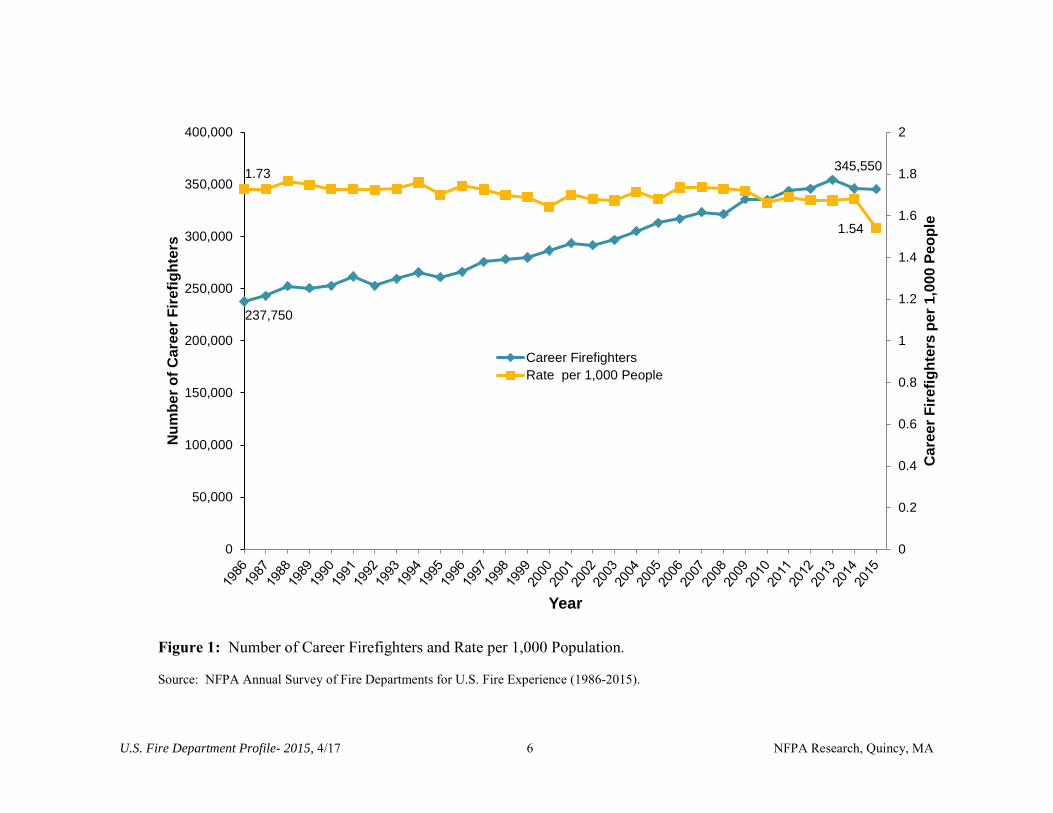
Since 1986, the number of career firefighters in the U.S. has increased steadily from 237,750 in
1986 to 354,600 in 2013, an increase of 49% (Table 2, Figure 1). In 2015 the number of career
firefighters dropped from the high of 2013 to 354,600, a decrease of 2.5%. The rates of career
firefighters per 1,000 people protected for mostly or all career departments have remained in a range of
1.54 to 1.76 career firefighters per 1,000 people protected (Table 2, Figure 1) during this period. Even
though the number of career firefighters has increased overtime, the number of people protected by
career firefighters has remained relatively level as the population in the U.S. has increased.
1 Note that these results are based on a sample survey, and as a result there is a 95% confidence interval associated with each estimate. Based on the data reported by the fire departments responding to the 2015 National Fire Experience Survey, the NFPA is confident that the actual number of career firefighters falls between 340,500 and 350,700; and the actual number of volunteer firefighters falls between 804,500 and 825,200.
U.S. Fire Department Profile- 2015, 4/17 4 NFPA Research, Quincy, MA
Table 1. Career and Volunteer Firefighters by Gender in the U.S. by Population Protected, 2015.
Career Volunteer Population Protected Male Female Sub-Total Male Female Sub-Total Total
1,000,000 or more 38,150 1,100 39,250 1,050 200 1,250 40,500 500,000 to 999,999 33,400 2,150 35,550 4,750 500 5,250 40,800 250,000 to 499,999 25,150 1,200 26,350 1,950 50 2,000 28,350 100,000 to 249,999 49,400 1,850 51,250 1,850 200 2,050 53,300 50,000 to 99,999 41,200 1,150 42,350 6,500 550 7,050 49,400 25,000 to 49,999 50,650 1,200 51,850 18,400 1,500 19,900 71,750 10,000 to 24,999 50,900 1,450 52,350 65,000 4,900 69,900 122,250 5,000 to 9,999 21,500 1,200 22,700 95,450 7,250 102,700 125,400 2,500 to 4,999 11,600 900 12,500 182,150 18,050 200,200 212,700 Under 2,500 10,800 650 11,450 365,500 39,050 404,550 416,000
332,750 12,850 345,600 742,600 72,250 814,850 1,160,450
Source: NFPA Survey of Fire Departments for U.S. Fire Experience, 2015. _______________
Note the number of volunteer firefighters for communities of 25,000 or more and the number of career firefighters for communities of less than 10,000 may change considerably from year to year because of their small size and sample variability.
Population protected is based on resident population and not the daytime and seasonal.
See Appendix 3 for Bureau of Labor Statistics on career firefighters (2011-2015).
U.S. Fire Department Profile- 2015, 4/17 5 NFPA Research, Quincy, MA
Table 2. Number of Firefighters in the U.S., 1986-2015.
Aggregate Career Volunteer Rate Rate Rate
per 1,000 per 1,000 per 1,000 Year Number Population Number Population Number Population 1986 1,045,950 1.48 237,750 1.73 808,200 7.88 1987 1,060,000 2.57 243,200 1.73 816,800 8.05 1988 1,040,750 2.22 252,500 1.77 788,250 7.77 1989 1,020,700 3.05 250,600 1.75 770,100 7.45 1990 1,025,650 3.19 253,000 1.73 772,650 7.56 1991 1,033,600 6.22 261,800 1.73 771,800 7.61 1992 1,058,300 3.94 253,000 1.72 805,300 7.34 1993 1,055,050 4.09 259,650 1.73 795,400 7.25 1994 1,073,600 4.12 265,700 1.76 807,900 7.19 1995 1,098,850 4.18 260,850 1.70 838,000 7.42 1996 1,081,800 4.07 266,300 1.74 815,500 6.98 1997 1,079,050 4.03 275,700 1.73 803,350 7.12 1998 1,082,500 4.00 278,300 1.70 804,200 7.18 1999 1,065,150 3.90 279,900 1.69 785,250 6.93 2000 1,064,150 3.86 286,800 1.64 777,350 7.25 2001 1,078,300 3.85 293,600 1.70 784,700 7.04 2002 1,108,250 3.89 291,650 1.68 816,600 7.12 2003 1,096,900 3.77 296,850 1.67 800,050 7.05 2004 1,100,750 3.76 305,150 1.71 795,600 6.88 2005 1,136,650 3.82 313,300 1.68 823,650 7.30 2006 1,140,900 3.81 316,950 1.74 823,950 7.26 2007 1,148,000 3.81 323,350 1.74 825,450 7.29 2008 1,148,850 3.81 321,700 1.73 827,150 7.01 2009 1,148,100 3.81 335,950 1.72 812,150 7.27 2010 1,103,300 3.57 335,150 1.66 768,150 6.59 2011 1,100,450 3.54 344,050 1.69 756,400 6.37 2012 1,129,250 3.60 345,950 1.67 783,300 6.60 2013 1,140,750 3.60 354,600 1.67 786,150 6.68 2014 1,134,400 3.56 346,150 1.68 788,250 6.43 2015 1,160,450 3.36 345,600 1.54 814,850 6.71
Source: NFPA Survey of Fire Departments for U.S. Fire Experience (1986-2015).
U.S. Fire Department Profile- 2015, 4/17 6 NFPA Research, Quincy, MA
Figure 1: Number of Career Firefighters and Rate per 1,000 Population.
Source: NFPA Annual Survey of Fire Departments for U.S. Fire Experience (1986-2015).
237,750
345,5501.73
1.54
0
0.2
0.4
0.6
0.8
1
1.2
1.4
1.6
1.8
2
0
50,000
100,000
150,000
200,000
250,000
300,000
350,000
400,000
Car
eer F
irefig
hter
s pe
r 1,0
00 P
eopl
e
Num
ber o
f Car
eer F
irefig
hter
s
Year
Career FirefightersRate per 1,000 People
U.S. Fire Department Profile- 2015, 4/17 7 NFPA Research, Quincy, MA
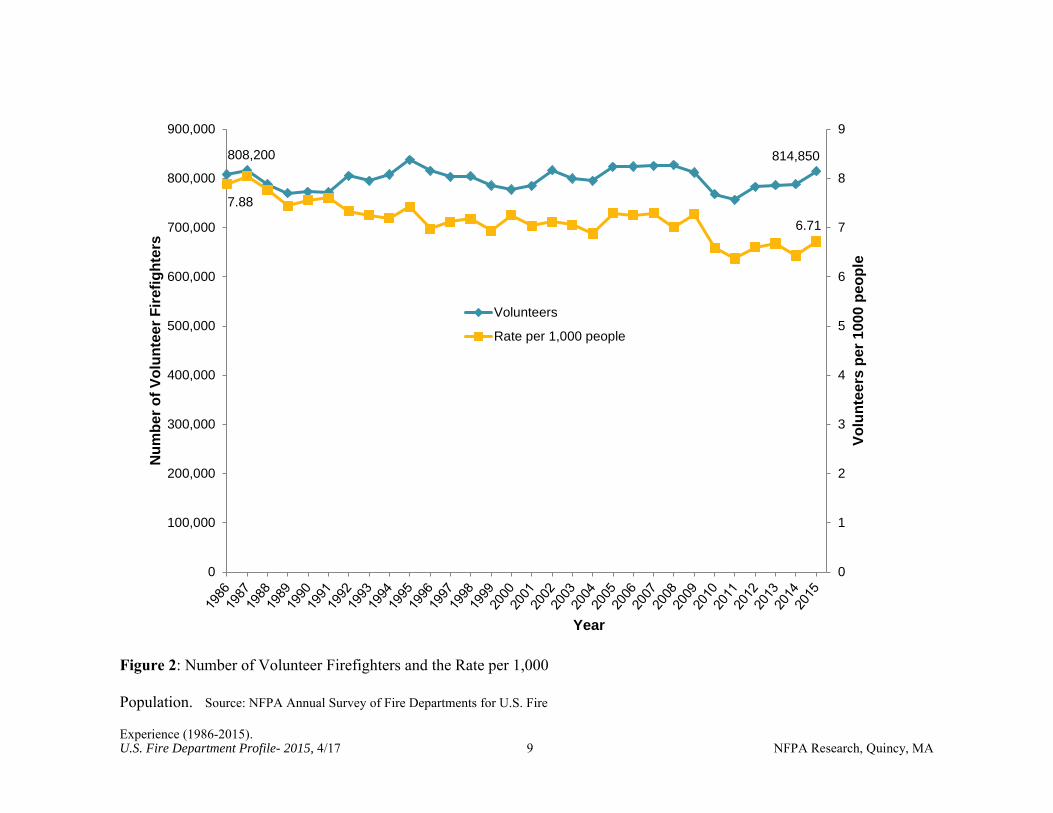
The number of volunteer firefighters declined in the late 1980s and late 1990’s, each time
returning to the same level soon after. From 2005-2009, the number of volunteer firefighters was
stable at a level slightly higher than any previously recorded other than in 1995. (Table 2, Figure 2).
After a dip in 2010-2011, in 2012-2015, the number of volunteers appeared to increase and was in
the range of 783,300 to 814,850, an increase of 4.0% over this period. When the rates of volunteer
firefighters per 1,000 people protected for mostly or all volunteer departments are examined, the
rates show a downward trend and range from a high of 8.05 in 1987 to a low of 6.37 in 2011 per
1,000 population protected. In 2015 the rate increased to 6.71 per 1,000 population protected.
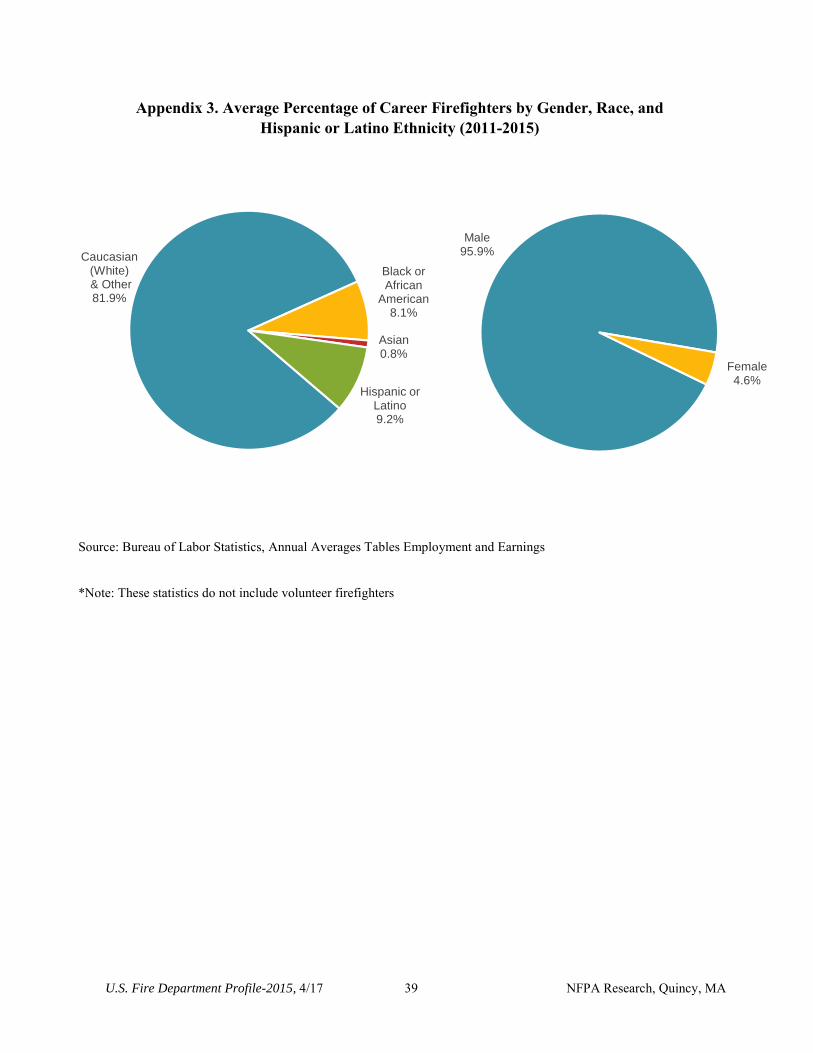
According to the U.S. Department of Labor, Bureau of Labor Statistics for the 2011-2015
periods (Appendix 3), there were on average 27,450 (9.2%) Hispanic or Latino career firefighters;
24,350 (8.1%) African-American career firefighters; 2,500 (0.8%) Asian career firefighters and
13,750 (4.6%) female career firefighters.2 NFPA estimates that in 2015, there were 12,850 female
career firefighters and 72,250 female volunteer firefighters employed by local fire departments.3
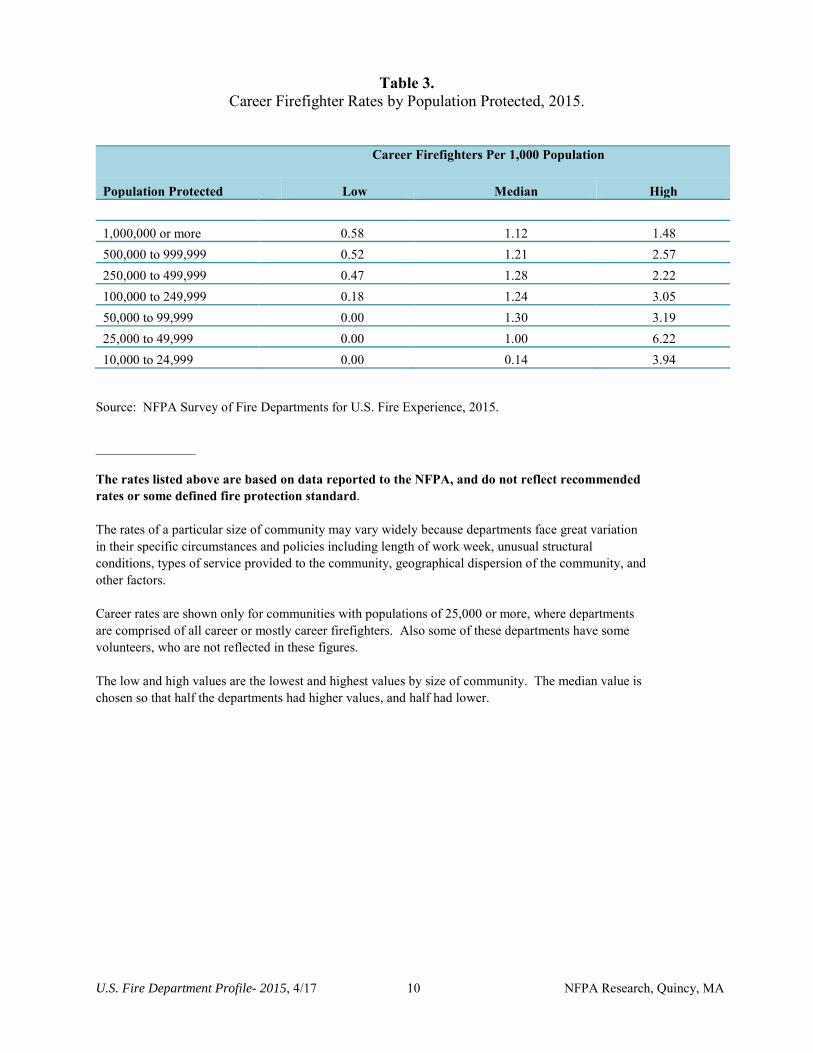
A good way to develop a sense of the size of departments relative to the population they
protect is to examine the rate of firefighters per 1,000 population. Table 3 and Table 4 provide the
range of rates for career firefighters in departments protecting at least 10,000 people and for
volunteer firefighters in departments protecting a population less than 25,000 people. It is
important to note that the rates are based on data reported to the NFPA and do not reflect
recommended rates or some defined fire protection standard.
Fire departments protecting communities of 10,000 people or more had median rates of 0.14
to 1.30 career firefighters per 1,000 people (Table 3). However, ranges for departments varied
2 Figures are from the Annual Averages Tables Employment and Earnings (2011-2015) Bureau of Labor Statistics, Washington D.C. These numbers can change considerably from year to year because of their small size and sample variability.
3 Note that these results are based on a sample survey, and as a result there is a 95% confidence interval associated with each estimate. Based on the data reported by the fire departments responding to the 2015 National Fire Experience Survey, the NFPA is confident that the actual number of female career firefighters falls between 12,300 and 12,850; and the actual number of female volunteer firefighters falls between 70,500 and 74,000.

U.S. Fire Department Profile- 2015, 4/17 8 NFPA Research, Quincy, MA
considerably with community size and particularly for communities protecting fewer than 10,000
people. Note that the rates for a particular size of community varied considerably. Departments
face great variation in their specific circumstances and policies, including length of work week,
unusual hazards, geographical dispersion of the community, and scope of services provided (e.g.,
whether the department handles emergency medical calls).
U.S. Fire Department Profile- 2015, 4/17 9 NFPA Research, Quincy, MA
808,200 814,850
7.88
6.71
0
1
2
3
4
5
6
7
8
9
0
100,000
200,000
300,000
400,000
500,000
600,000
700,000
800,000
900,000
Volu
ntee
rs p
er 1
000
peop
le
Num
ber o
f Vol
unte
er F
irefig
hter
s
Year
Figure 2: Number of Volunteer Firefighters and the Rate per 1,000
Population. Source: NFPA Annual Survey of Fire Departments for U.S. Fire
Experience (1986-2015).
Volunteers
Rate per 1,000 people
U.S. Fire Department Profile- 2015, 4/17 10 NFPA Research, Quincy, MA
Table 3. Career Firefighter Rates by Population Protected, 2015.
Career Firefighters Per 1,000 Population
Population Protected Low Median High
1,000,000 or more 0.58 1.12 1.48 500,000 to 999,999 0.52 1.21 2.57 250,000 to 499,999 0.47 1.28 2.22 100,000 to 249,999 0.18 1.24 3.05 50,000 to 99,999 0.00 1.30 3.19 25,000 to 49,999 0.00 1.00 6.22 10,000 to 24,999 0.00 0.14 3.94
Source: NFPA Survey of Fire Departments for U.S. Fire Experience, 2015.
_______________
The rates listed above are based on data reported to the NFPA, and do not reflect recommended rates or some defined fire protection standard.
The rates of a particular size of community may vary widely because departments face great variation in their specific circumstances and policies including length of work week, unusual structural conditions, types of service provided to the community, geographical dispersion of the community, and other factors.
Career rates are shown only for communities with populations of 25,000 or more, where departments are comprised of all career or mostly career firefighters. Also some of these departments have some volunteers, who are not reflected in these figures.
The low and high values are the lowest and highest values by size of community. The median value is chosen so that half the departments had higher values, and half had lower.
U.S. Fire Department Profile- 2015, 4/17 11 NFPA Research, Quincy, MA
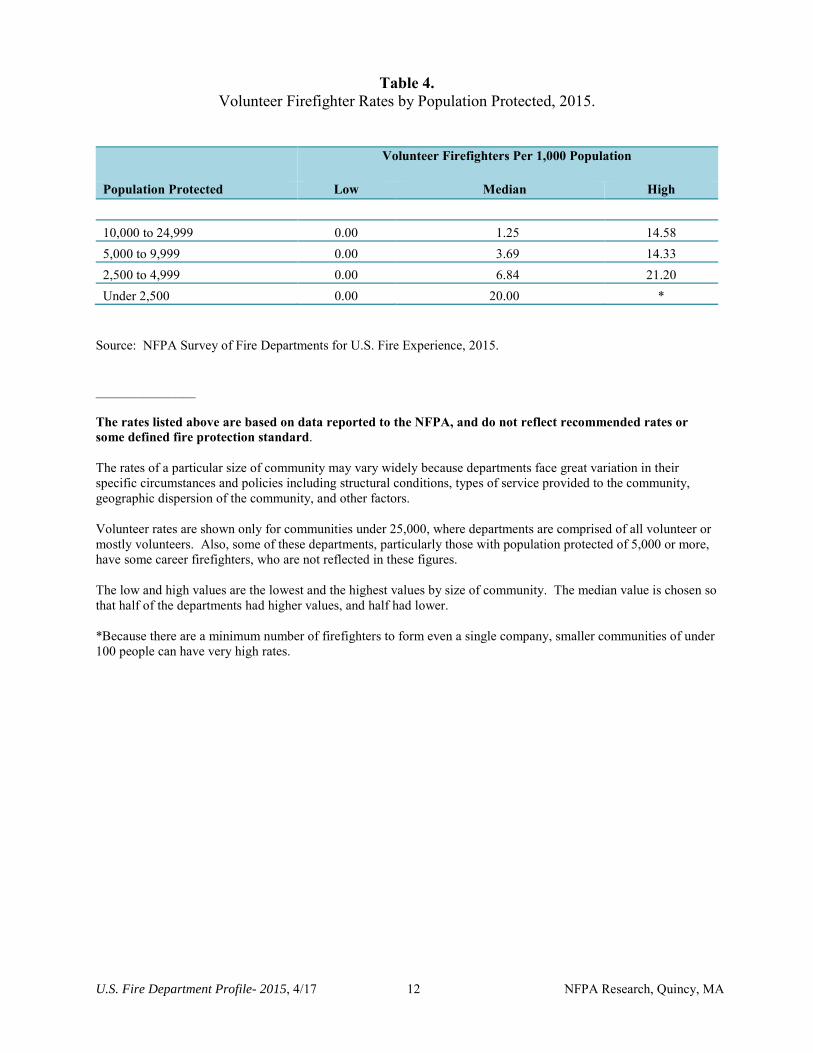
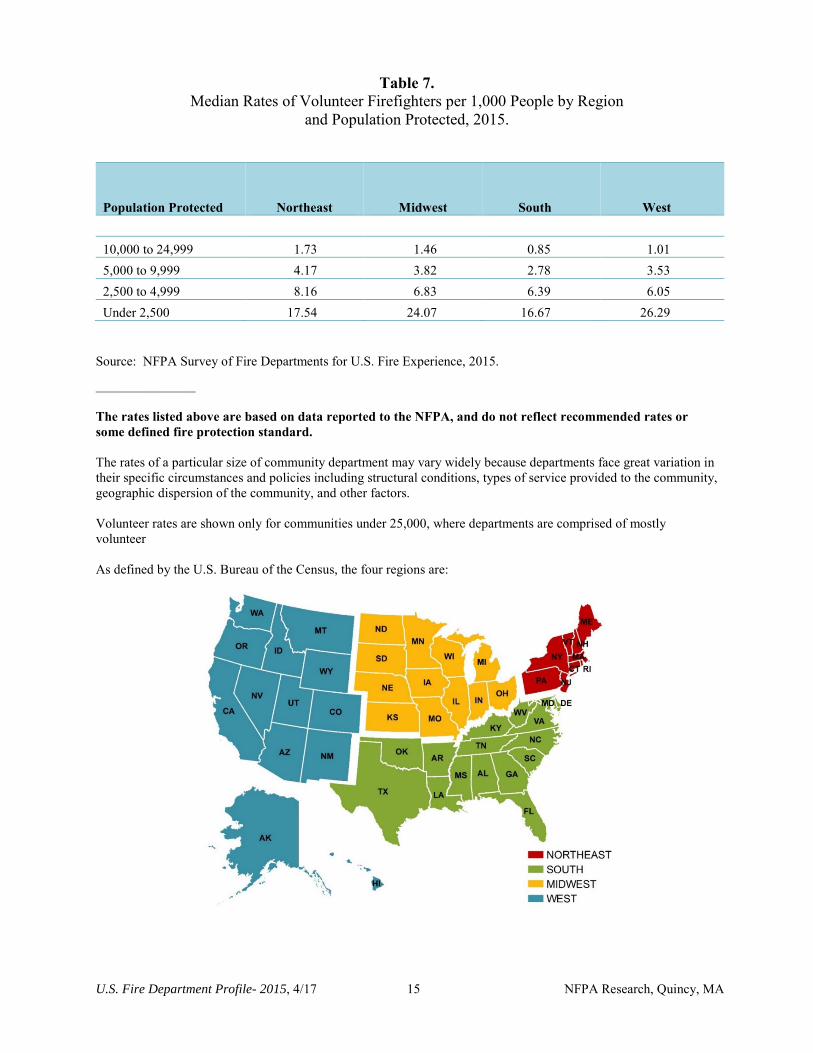
Fire departments protecting less than 25,000 people had median rates of volunteer firefighters
per 1,000 persons in the range of 1.25 to 20.00 (Table 4). This wide range in median rates for smaller
communities reflects the minimum number of firefighters needed to staff a department regardless of
community size. Volunteer firefighters are often available on a part-time basis only; it may take more
volunteers to ensure an adequate response to each alarm. The median rate for volunteer firefighters
increases as population protected decreases.
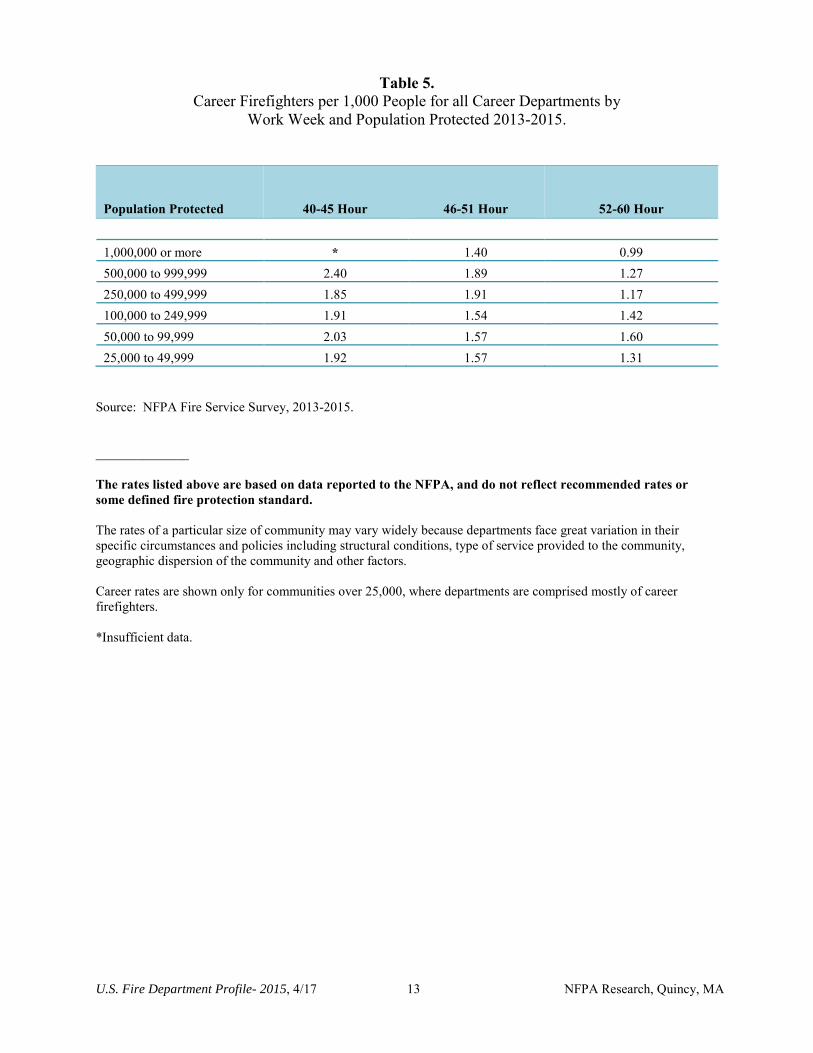
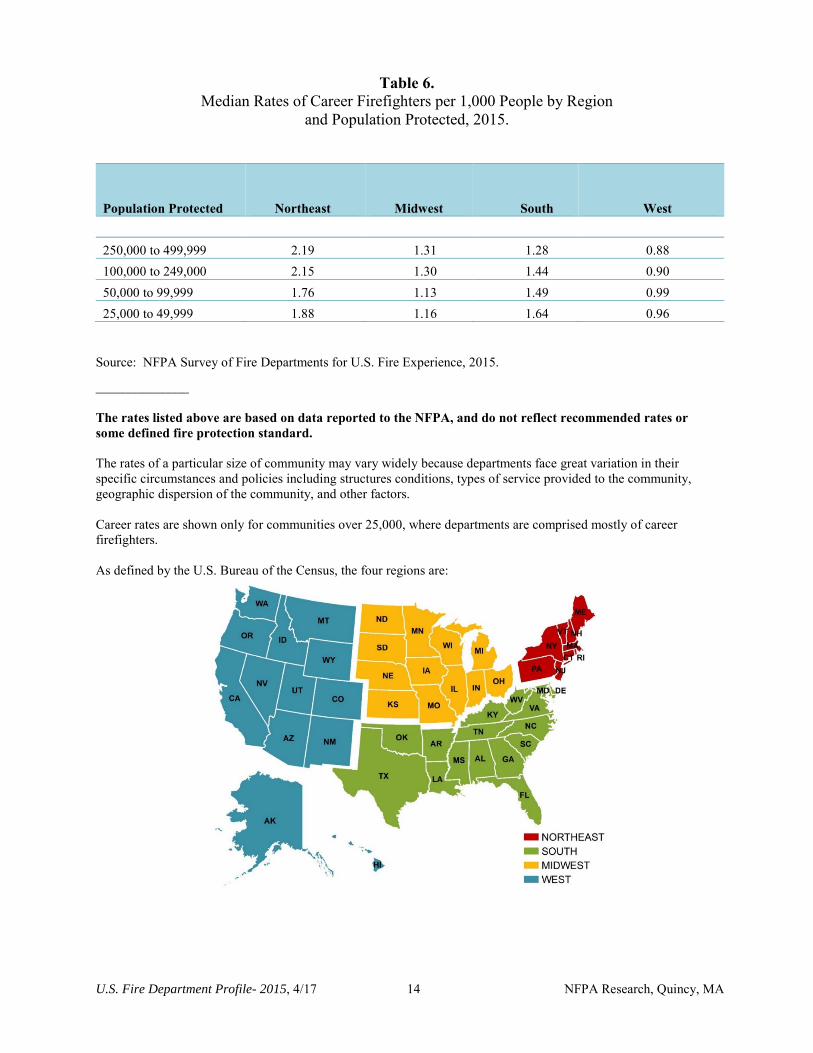
Length of work week and its effect on rate of career firefighters per 1,000 population by size of
community is provided in Table 5. Table 6 and Table 7 provide median rates for career and volunteer
firefighters by region and size of community.
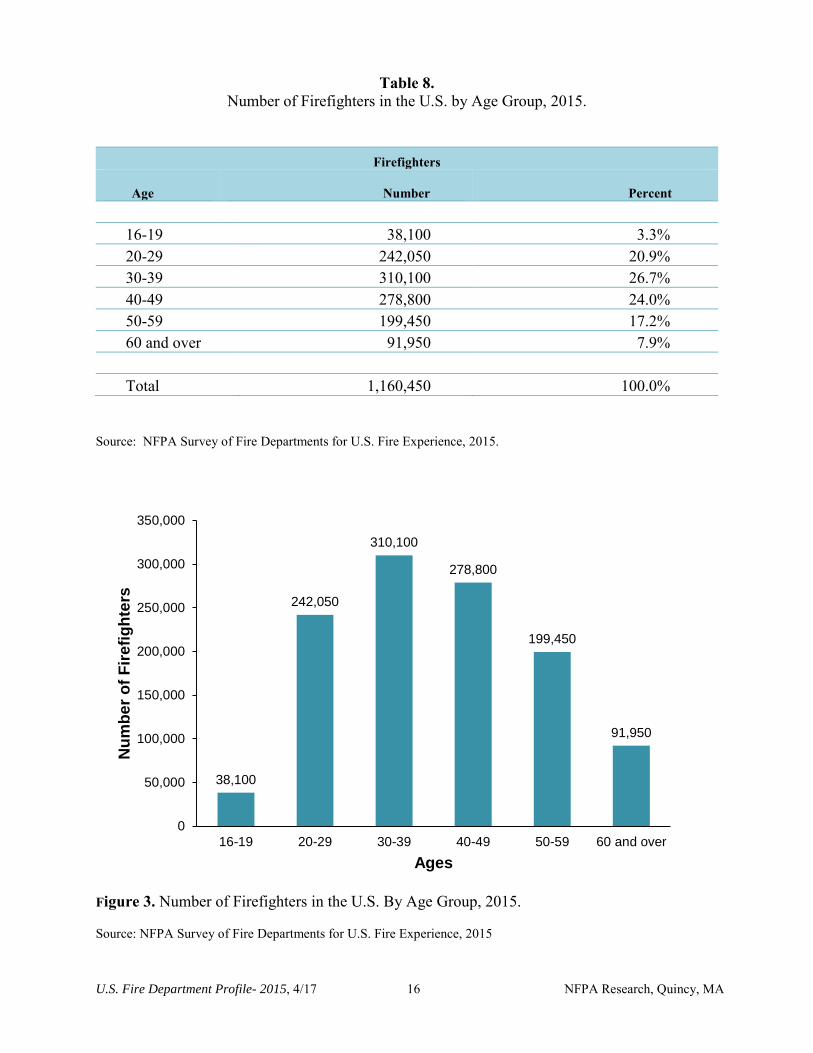
Of the 1,160,450 firefighters, the age group accounting for the largest share of firefighters was
the 30-39 group, 26.7% of all firefighters (Table 8 and Figure 3). Many firefighters fell in the 40-49
age group (24.0%) and the next largest was the 20-29 age group (20.9%). Firefighters, age 50-59
accounted for a smaller share (17.2%), but still more than one-sixth of all firefighters. Few firefighters
fell outside this combined range of 20 to 59 years old. Only 3.3% of firefighters were age 16 to 19,
and another 7.9% were age 60 and over.
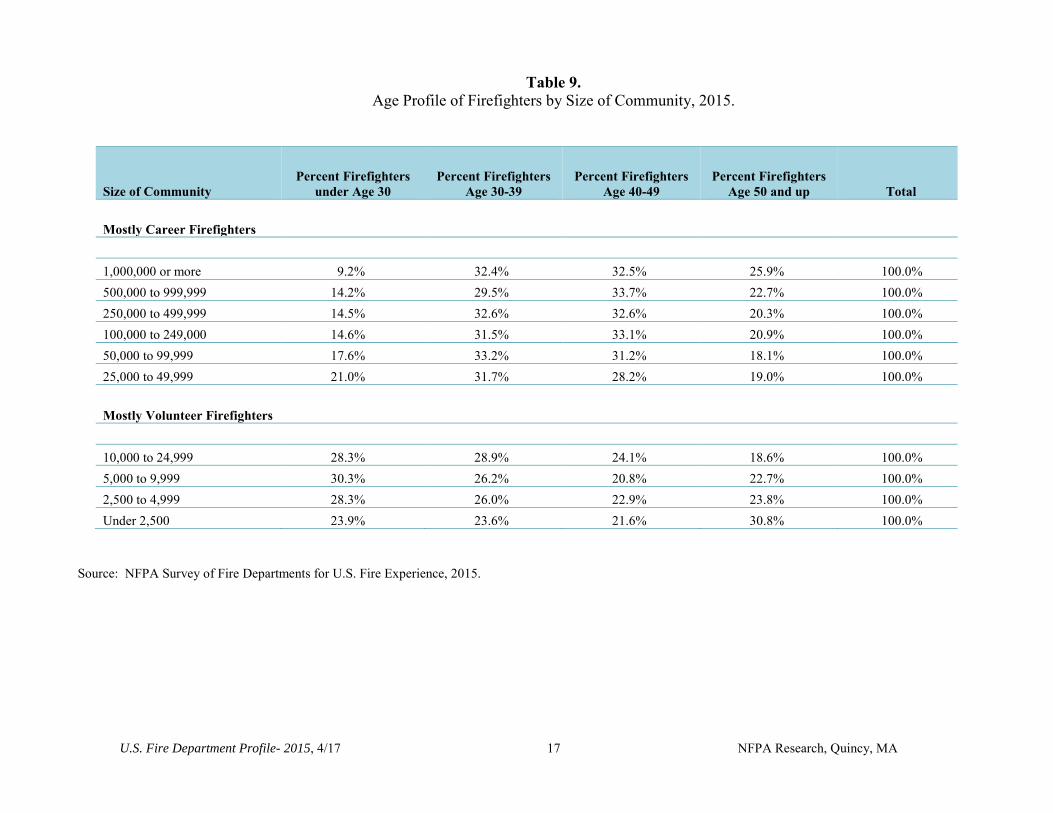
Age group patterns did vary somewhat by population of community protected (Table 9).
Departments that protect less than 25,000 people and comprised mostly of volunteers tended to have
higher proportions of firefighters in the under 30 age group, while departments that protect 25,000
people or more and are comprised mostly of career firefighters had higher proportions of firefighters in
the 30-39 and 40-49 age groups. Departments protecting less than 2,500 people had the highest
percentage of firefighters age 50 and older (30.8%).
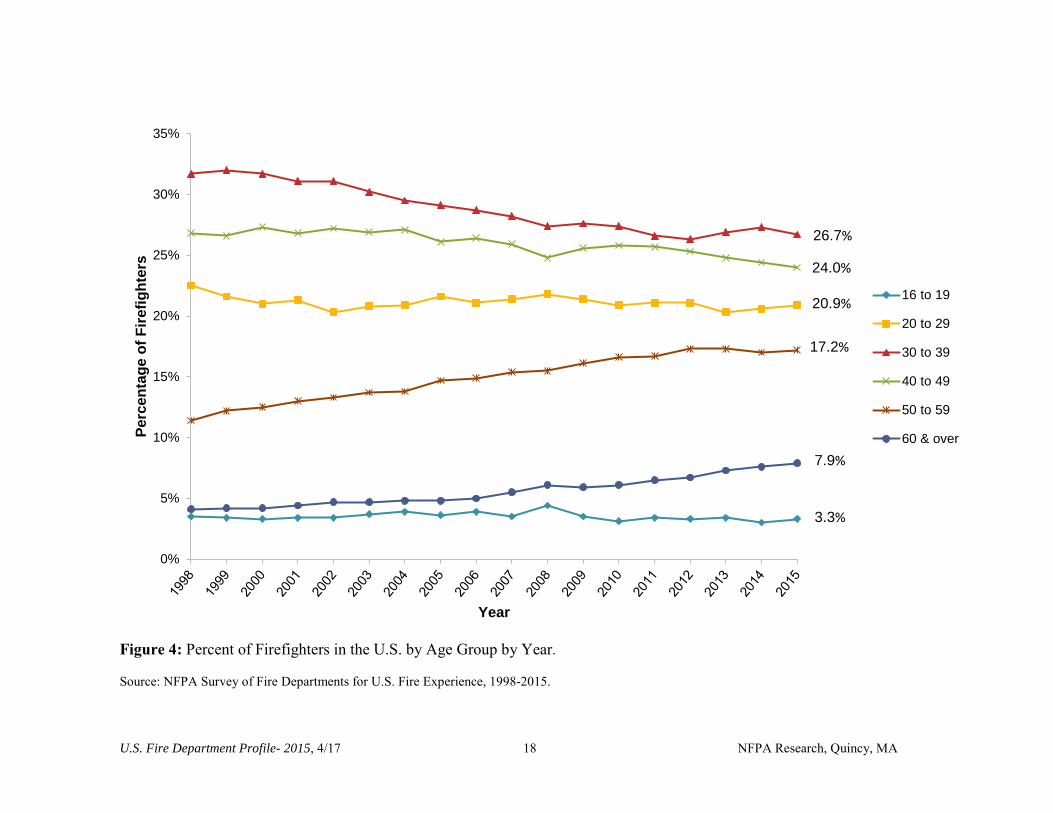
When age group patterns by year are examined for the 1998-2015 period, there were slight
changes over time (Figure 4). The 30-39 and the 40-49 age groups showed slight decreases over the
period, while the 50-59 and 60 and over groups showed moderate increases over the period. Volunteer
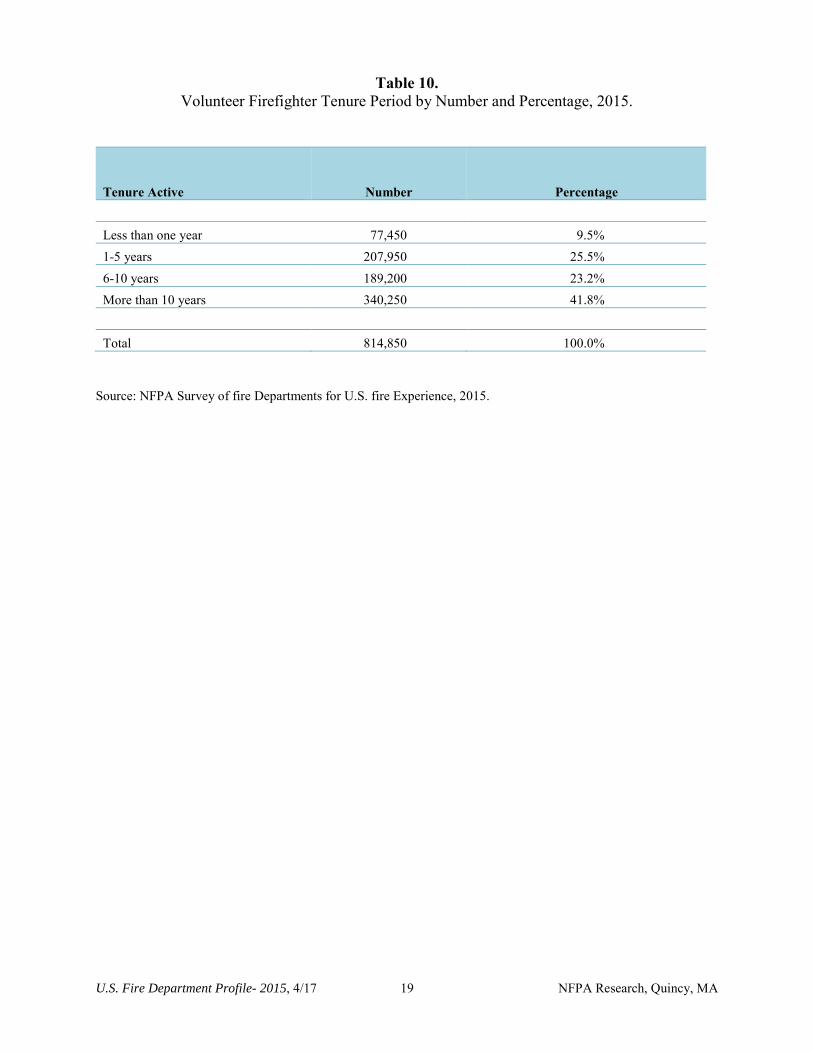
firefighter tenure periods show that more than two of every five (41.8%) volunteers have more than 10
years of active service. Almost two-thirds (65%) of volunteer firefighters have more than 5 years of
active service (Table 10).
U.S. Fire Department Profile- 2015, 4/17 12 NFPA Research, Quincy, MA
Table 4. Volunteer Firefighter Rates by Population Protected, 2015.
Volunteer Firefighters Per 1,000 Population
Population Protected Low Median High
10,000 to 24,999 0.00 1.25 14.58 5,000 to 9,999 0.00 3.69 14.33 2,500 to 4,999 0.00 6.84 21.20 Under 2,500 0.00 20.00 *
Source: NFPA Survey of Fire Departments for U.S. Fire Experience, 2015.
_______________
The rates listed above are based on data reported to the NFPA, and do not reflect recommended rates or some defined fire protection standard.
The rates of a particular size of community may vary widely because departments face great variation in their specific circumstances and policies including structural conditions, types of service provided to the community, geographic dispersion of the community, and other factors.
Volunteer rates are shown only for communities under 25,000, where departments are comprised of all volunteer or mostly volunteers. Also, some of these departments, particularly those with population protected of 5,000 or more, have some career firefighters, who are not reflected in these figures.
The low and high values are the lowest and the highest values by size of community. The median value is chosen so that half of the departments had higher values, and half had lower.
*Because there are a minimum number of firefighters to form even a single company, smaller communities of under100 people can have very high rates.
U.S. Fire Department Profile- 2015, 4/17 13 NFPA Research, Quincy, MA
Table 5. Career Firefighters per 1,000 People for all Career Departments by
Work Week and Population Protected 2013-2015.
Population Protected 40-45 Hour 46-51 Hour 52-60 Hour
1,000,000 or more * 1.40 0.99 500,000 to 999,999 2.40 1.89 1.27 250,000 to 499,999 1.85 1.91 1.17 100,000 to 249,999 1.91 1.54 1.42 50,000 to 99,999 2.03 1.57 1.60 25,000 to 49,999 1.92 1.57 1.31
Source: NFPA Fire Service Survey, 2013-2015.
______________
The rates listed above are based on data reported to the NFPA, and do not reflect recommended rates or some defined fire protection standard.
The rates of a particular size of community may vary widely because departments face great variation in their specific circumstances and policies including structural conditions, type of service provided to the community, geographic dispersion of the community and other factors.
Career rates are shown only for communities over 25,000, where departments are comprised mostly of career firefighters.
*Insufficient data.
U.S. Fire Department Profile- 2015, 4/17 14 NFPA Research, Quincy, MA
Table 6. Median Rates of Career Firefighters per 1,000 People by Region
and Population Protected, 2015.
Population Protected Northeast Midwest South West
250,000 to 499,999 2.19 1.31 1.28 0.88 100,000 to 249,000 2.15 1.30 1.44 0.90 50,000 to 99,999 1.76 1.13 1.49 0.99 25,000 to 49,999 1.88 1.16 1.64 0.96
Source: NFPA Survey of Fire Departments for U.S. Fire Experience, 2015.
______________
The rates listed above are based on data reported to the NFPA, and do not reflect recommended rates or some defined fire protection standard.
The rates of a particular size of community may vary widely because departments face great variation in their specific circumstances and policies including structures conditions, types of service provided to the community, geographic dispersion of the community, and other factors.
Career rates are shown only for communities over 25,000, where departments are comprised mostly of career firefighters.
As defined by the U.S. Bureau of the Census, the four regions are:
U.S. Fire Department Profile- 2015, 4/17 15 NFPA Research, Quincy, MA
Table 7. Median Rates of Volunteer Firefighters per 1,000 People by Region
and Population Protected, 2015.
Population Protected Northeast Midwest South West
10,000 to 24,999 1.73 1.46 0.85 1.01 5,000 to 9,999 4.17 3.82 2.78 3.53 2,500 to 4,999 8.16 6.83 6.39 6.05 Under 2,500 17.54 24.07 16.67 26.29
Source: NFPA Survey of Fire Departments for U.S. Fire Experience, 2015.
_______________
The rates listed above are based on data reported to the NFPA, and do not reflect recommended rates or some defined fire protection standard.
The rates of a particular size of community department may vary widely because departments face great variation in their specific circumstances and policies including structural conditions, types of service provided to the community, geographic dispersion of the community, and other factors.
Volunteer rates are shown only for communities under 25,000, where departments are comprised of mostly volunteer
As defined by the U.S. Bureau of the Census, the four regions are:
U.S. Fire Department Profile- 2015, 4/17 16 NFPA Research, Quincy, MA
Table 8. Number of Firefighters in the U.S. by Age Group, 2015.
Firefighters
Age Number Percent
16-19 38,100 3.3% 20-29 242,050 20.9% 30-39 310,100 26.7% 40-49 278,800 24.0% 50-59 199,450 17.2% 60 and over 91,950 7.9%
Total 1,160,450 100.0%
Source: NFPA Survey of Fire Departments for U.S. Fire Experience, 2015.
Figure 3. Number of Firefighters in the U.S. By Age Group, 2015.
Source: NFPA Survey of Fire Departments for U.S. Fire Experience, 2015
38,100
242,050
310,100
278,800
199,450
91,950
0
50,000
100,000
150,000
200,000
250,000
300,000
350,000
16-19 20-29 30-39 40-49 50-59 60 and over
Num
ber o
f Fire
fight
ers
Ages
U.S. Fire Department Profile- 2015, 4/17 17 NFPA Research, Quincy, MA
Table 9. Age Profile of Firefighters by Size of Community, 2015.
Size of Community Percent Firefighters
under Age 30 Percent Firefighters
Age 30-39 Percent Firefighters
Age 40-49 Percent Firefighters
Age 50 and up Total
Mostly Career Firefighters
1,000,000 or more 9.2% 32.4% 32.5% 25.9% 100.0% 500,000 to 999,999 14.2% 29.5% 33.7% 22.7% 100.0% 250,000 to 499,999 14.5% 32.6% 32.6% 20.3% 100.0% 100,000 to 249,000 14.6% 31.5% 33.1% 20.9% 100.0% 50,000 to 99,999 17.6% 33.2% 31.2% 18.1% 100.0% 25,000 to 49,999 21.0% 31.7% 28.2% 19.0% 100.0%
Mostly Volunteer Firefighters
10,000 to 24,999 28.3% 28.9% 24.1% 18.6% 100.0% 5,000 to 9,999 30.3% 26.2% 20.8% 22.7% 100.0% 2,500 to 4,999 28.3% 26.0% 22.9% 23.8% 100.0% Under 2,500 23.9% 23.6% 21.6% 30.8% 100.0%
Source: NFPA Survey of Fire Departments for U.S. Fire Experience, 2015.
U.S. Fire Department Profile- 2015, 4/17 18 NFPA Research, Quincy, MA
Figure 4: Percent of Firefighters in the U.S. by Age Group by Year.
Source: NFPA Survey of Fire Departments for U.S. Fire Experience, 1998-2015.
0%
5%
10%
15%
20%
25%
30%
35%Pe
rcen
tage
of F
irefig
hter
s
Year
16 to 19
20 to 29
30 to 39
40 to 49
50 to 59
60 & over
26.7%
24.0%
20.9%
17.2%
7.9%
3.3%
U.S. Fire Department Profile- 2015, 4/17 19 NFPA Research, Quincy, MA
Table 10. Volunteer Firefighter Tenure Period by Number and Percentage, 2015.
Tenure Active Number Percentage
Less than one year 77,450 9.5% 1-5 years 207,950 25.5% 6-10 years 189,200 23.2% More than 10 years 340,250 41.8%
Total 814,850 100.0%
Source: NFPA Survey of fire Departments for U.S. fire Experience, 2015.
U.S. Fire Department Profile- 2015, 4/17 20 NFPA Research, Quincy, MA
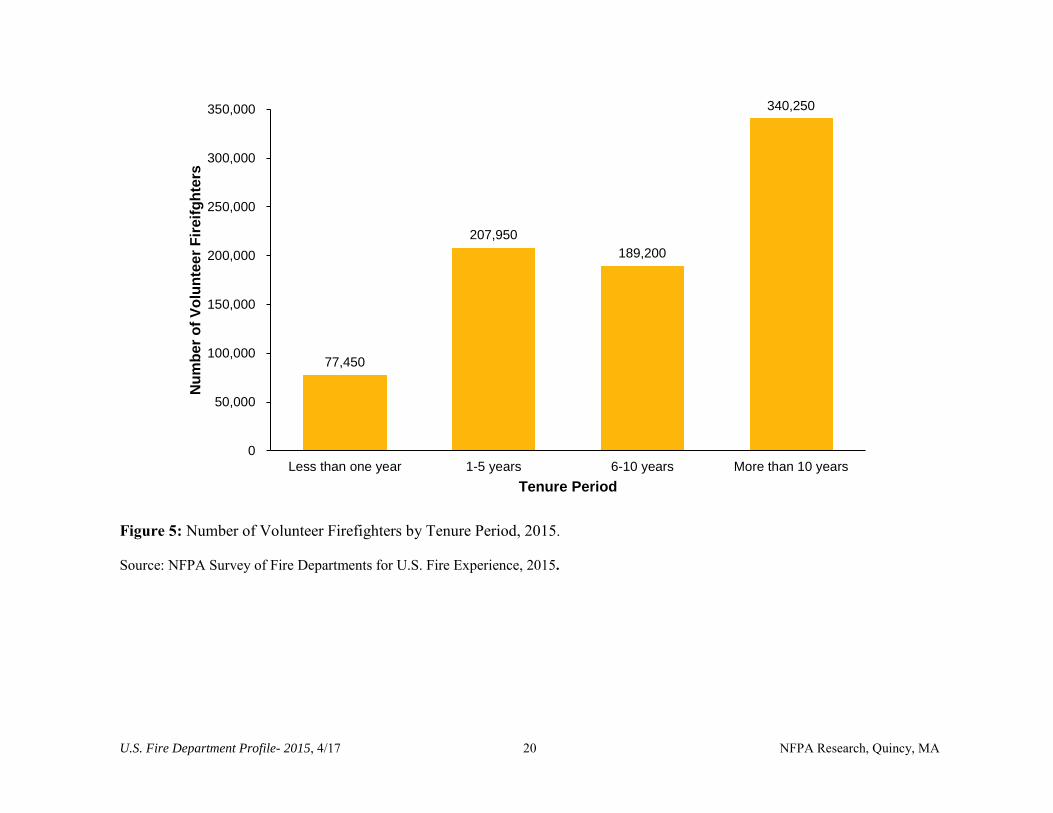
Figure 5: Number of Volunteer Firefighters by Tenure Period, 2015.
Source: NFPA Survey of Fire Departments for U.S. Fire Experience, 2015.
77,450
207,950 189,200
340,250
0
50,000
100,000
150,000
200,000
250,000
300,000
350,000
Less than one year 1-5 years 6-10 years More than 10 years
Num
ber o
f Vol
unte
er F
ireifg
hter
s
Tenure Period
U.S. Fire Department Profile- 2015, 4/17 21 NFPA Research, Quincy, MA
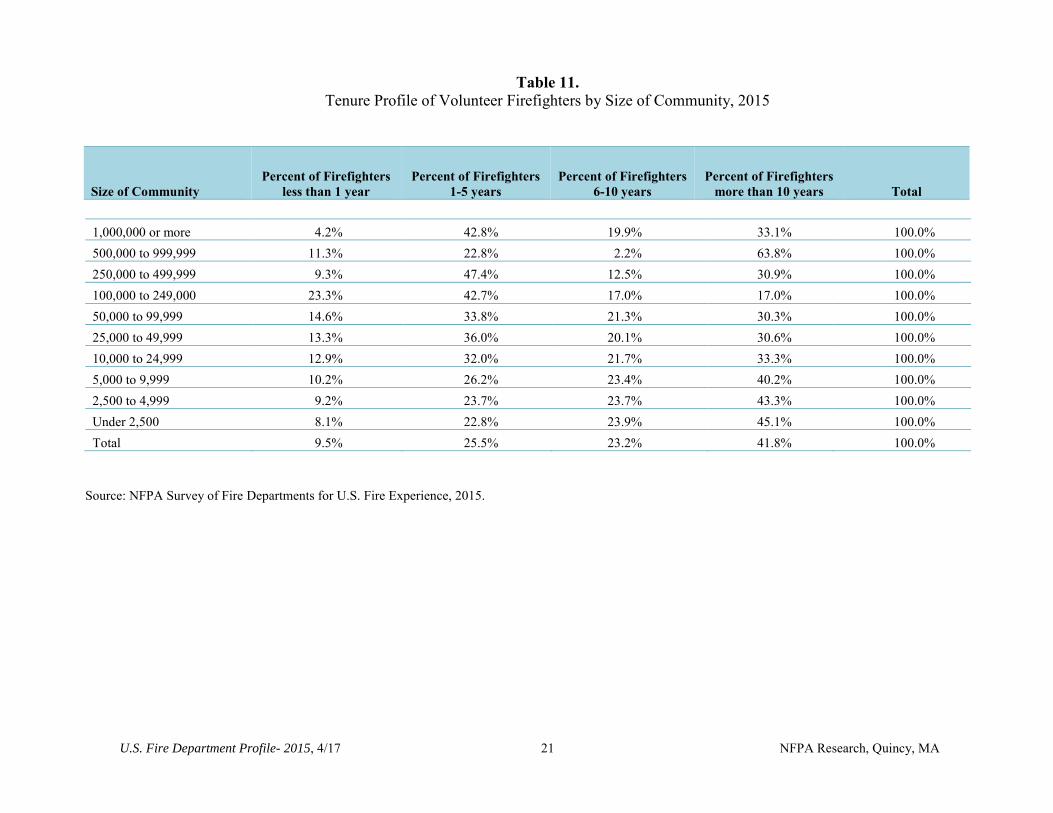
Table 11. Tenure Profile of Volunteer Firefighters by Size of Community, 2015
Size of Community Percent of Firefighters
less than 1 year Percent of Firefighters
1-5 yearsPercent of Firefighters
6-10 yearsPercent of Firefighters
more than 10 years Total
1,000,000 or more 4.2% 42.8% 19.9% 33.1% 100.0% 500,000 to 999,999 11.3% 22.8% 2.2% 63.8% 100.0% 250,000 to 499,999 9.3% 47.4% 12.5% 30.9% 100.0% 100,000 to 249,000 23.3% 42.7% 17.0% 17.0% 100.0% 50,000 to 99,999 14.6% 33.8% 21.3% 30.3% 100.0% 25,000 to 49,999 13.3% 36.0% 20.1% 30.6% 100.0% 10,000 to 24,999 12.9% 32.0% 21.7% 33.3% 100.0% 5,000 to 9,999 10.2% 26.2% 23.4% 40.2% 100.0% 2,500 to 4,999 9.2% 23.7% 23.7% 43.3% 100.0% Under 2,500 8.1% 22.8% 23.9% 45.1% 100.0% Total 9.5% 25.5% 23.2% 41.8% 100.0%
Source: NFPA Survey of Fire Departments for U.S. Fire Experience, 2015.
U.S. Fire Department Profile- 2015, 4/17 22 NFPA Research, Quincy, MA
Fire Departments
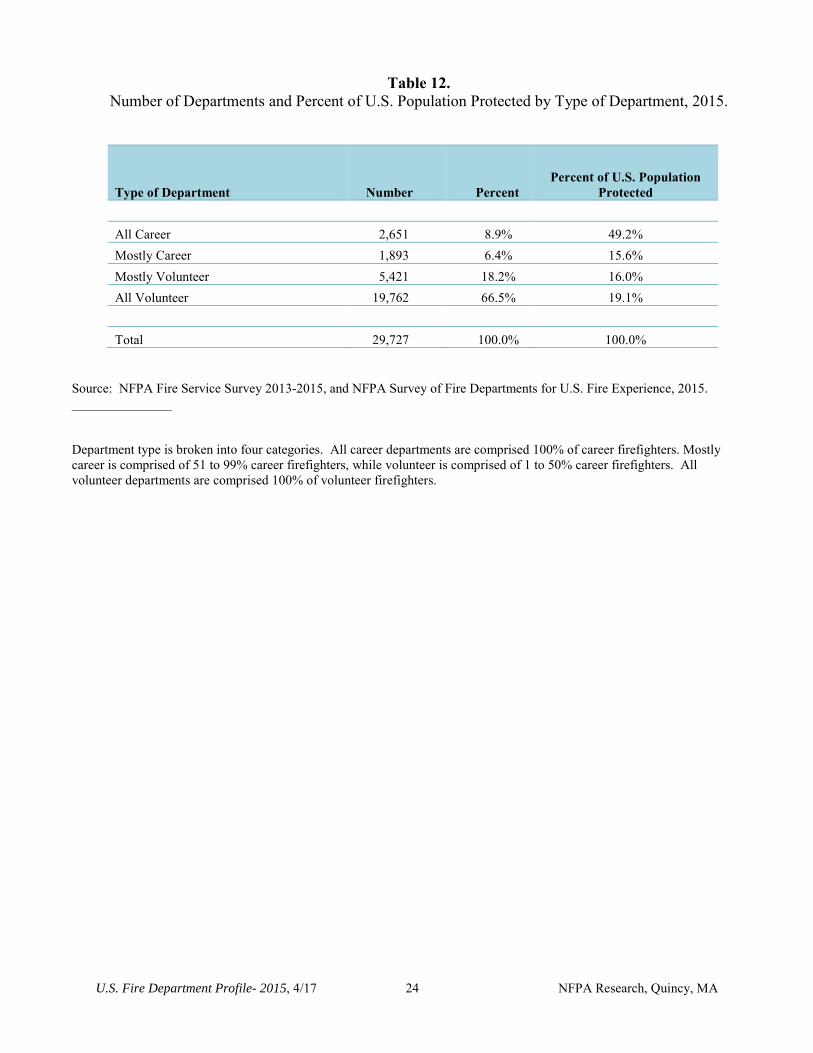
There are an estimated 29,727 fire departments4 in the United States (Table 12). Of these, 2,651 (8.9%) of
departments are comprised solely of career firefighters5, and 19,762 (66.5%) of departments are comprised
of all volunteer firefighters. An estimated 1,893 (6.4%) are mostly career, while 5,421 (18.2%) are mostly
volunteer firefighters (Table 12).
Fire departments categorized as all career or mostly career represent 15.3% of all departments and
protect 64.9% of the U.S. population, while departments categorized as mostly volunteer or all volunteer
represent 85.0% of all departments and protect 35.1% of the U.S. population (Table 12).
The number of career or mostly career departments increased from 3,043 in 1986 to 4,544 in 2015,
an increase of 49.3%, while the number of volunteer or mostly volunteer departments decreased from
26,797 in 1986 to 25,183 in 2015, a decrease of 6.0% (see Appendix 1)
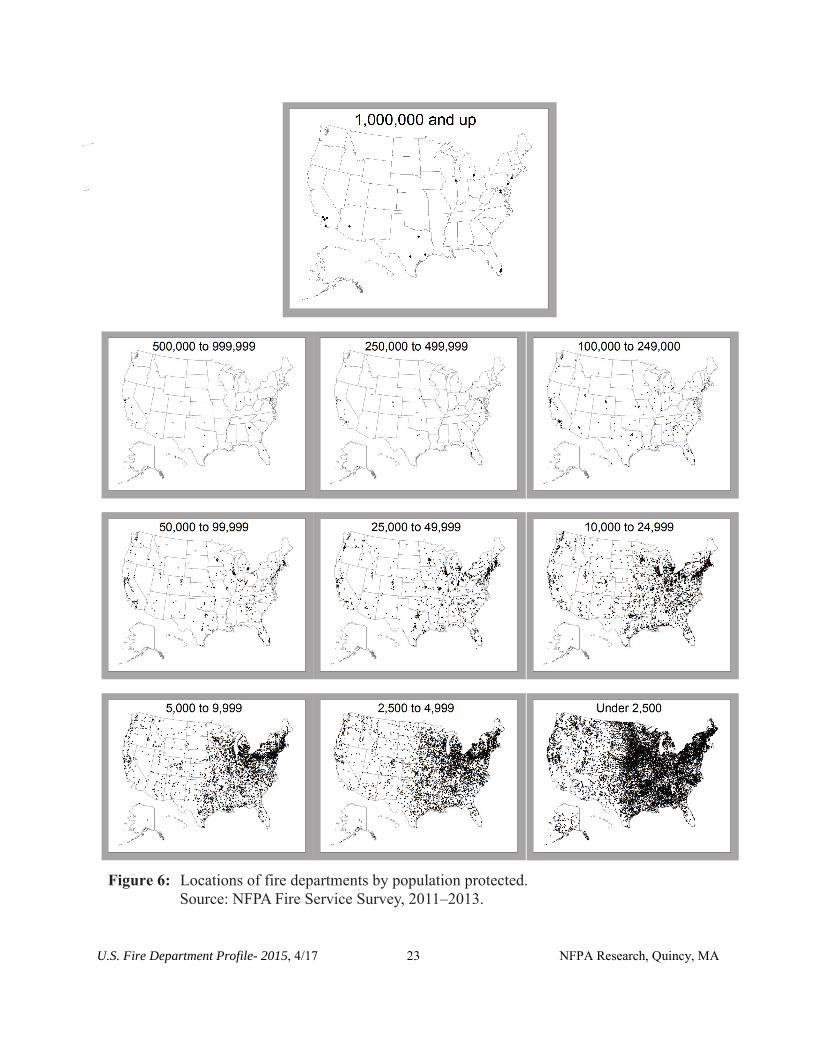
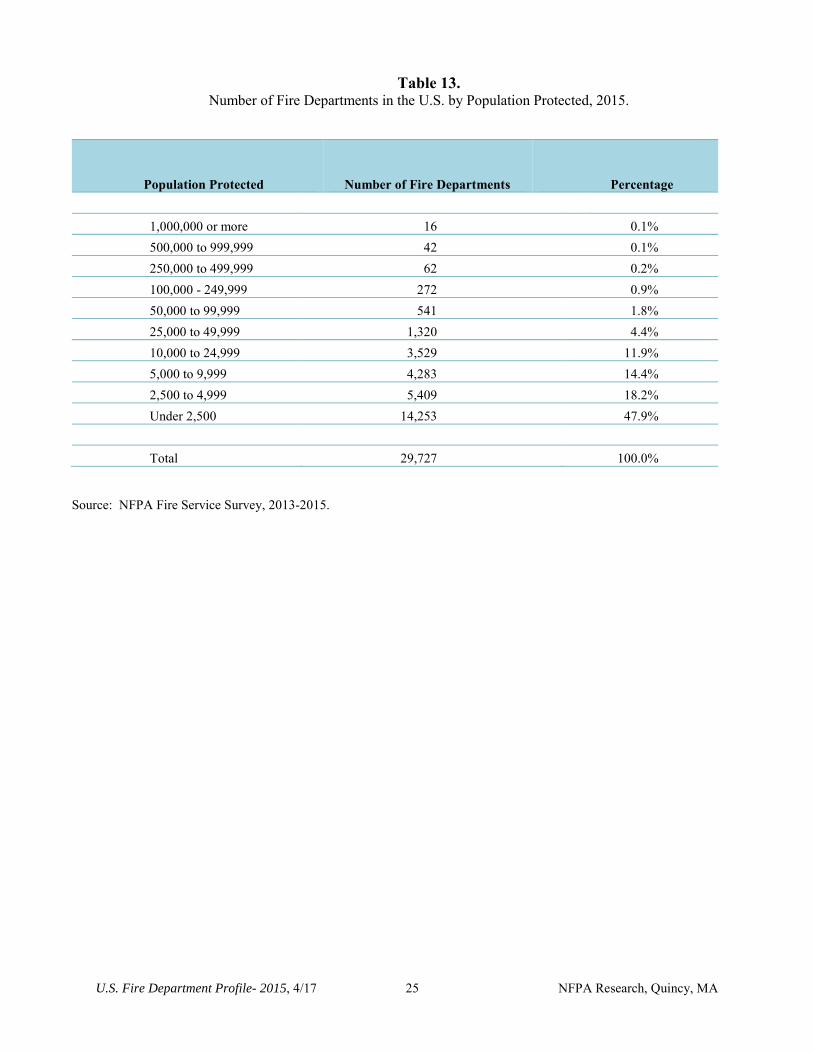
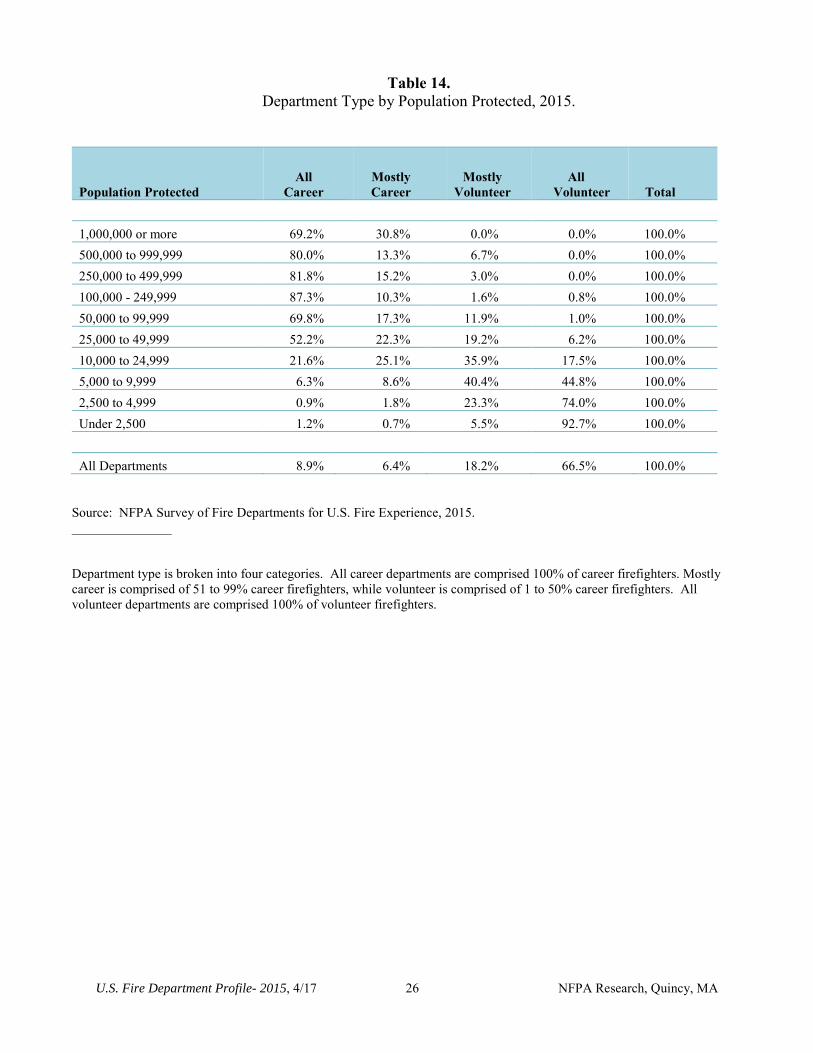
The number of fire departments by size of community is provided in Table 13. Department type did
vary considerably by population protected. For community sizes 25,000 and above, the percentage of
departments classified as all career or mostly career ranged from 74.6 to 100%, while for community sizes
less than 25,000, the percentage of departments classified as all volunteer or mostly volunteer ranged from
53.3 to 98.2% (Table 14).
4 A fire department is a public organization that provides fire prevention, fire suppression and associated emergency and non-emergency services to a jurisdiction such as a county, municipality, or organized fire district.
5 Department type is broken into four categories. All career departments are comprised 100% of career firefighters. Mostly career is comprised of 51 to 99% career firefighters, while volunteer is comprised of 1 to 50% career firefighters. All volunteer departments are comprised 100% of volunteer firefighters.
U.S. Fire Department Profile- 2015, 4/17 23 NFPA Research, Quincy, MA
Figure 6: Locationsoffiredepartmentsbypopulationprotected.Source:NFPAFireServiceSurvey,2011–2013.
U.S. Fire Department Profile- 2015, 4/17 24 NFPA Research, Quincy, MA
Table 12. Number of Departments and Percent of U.S. Population Protected by Type of Department, 2015.
Type of Department Number Percent Percent of U.S. Population
Protected
All Career 2,651 8.9% 49.2% Mostly Career 1,893 6.4% 15.6% Mostly Volunteer 5,421 18.2% 16.0% All Volunteer 19,762 66.5% 19.1%
Total 29,727 100.0% 100.0%
Source: NFPA Fire Service Survey 2013-2015, and NFPA Survey of Fire Departments for U.S. Fire Experience, 2015. _______________
Department type is broken into four categories. All career departments are comprised 100% of career firefighters. Mostly career is comprised of 51 to 99% career firefighters, while volunteer is comprised of 1 to 50% career firefighters. All volunteer departments are comprised 100% of volunteer firefighters.
U.S. Fire Department Profile- 2015, 4/17 25 NFPA Research, Quincy, MA
Table 13. Number of Fire Departments in the U.S. by Population Protected, 2015.
Population Protected Number of Fire Departments Percentage
1,000,000 or more 16 0.1% 500,000 to 999,999 42 0.1% 250,000 to 499,999 62 0.2% 100,000 - 249,999 272 0.9% 50,000 to 99,999 541 1.8% 25,000 to 49,999 1,320 4.4% 10,000 to 24,999 3,529 11.9% 5,000 to 9,999 4,283 14.4% 2,500 to 4,999 5,409 18.2% Under 2,500 14,253 47.9%
Total 29,727 100.0%
Source: NFPA Fire Service Survey, 2013-2015.
U.S. Fire Department Profile- 2015, 4/17 26 NFPA Research, Quincy, MA
Table 14. Department Type by Population Protected, 2015.
Population Protected All
Career Mostly Career
Mostly Volunteer
All Volunteer Total
1,000,000 or more 69.2% 30.8% 0.0% 0.0% 100.0% 500,000 to 999,999 80.0% 13.3% 6.7% 0.0% 100.0% 250,000 to 499,999 81.8% 15.2% 3.0% 0.0% 100.0% 100,000 - 249,999 87.3% 10.3% 1.6% 0.8% 100.0% 50,000 to 99,999 69.8% 17.3% 11.9% 1.0% 100.0% 25,000 to 49,999 52.2% 22.3% 19.2% 6.2% 100.0% 10,000 to 24,999 21.6% 25.1% 35.9% 17.5% 100.0% 5,000 to 9,999 6.3% 8.6% 40.4% 44.8% 100.0% 2,500 to 4,999 0.9% 1.8% 23.3% 74.0% 100.0% Under 2,500 1.2% 0.7% 5.5% 92.7% 100.0%
All Departments 8.9% 6.4% 18.2% 66.5% 100.0%
Source: NFPA Survey of Fire Departments for U.S. Fire Experience, 2015. _______________
Department type is broken into four categories. All career departments are comprised 100% of career firefighters. Mostly career is comprised of 51 to 99% career firefighters, while volunteer is comprised of 1 to 50% career firefighters. All volunteer departments are comprised 100% of volunteer firefighters.
U.S. Fire Department Profile- 2015, 4/17 27 NFPA Research, Quincy, MA
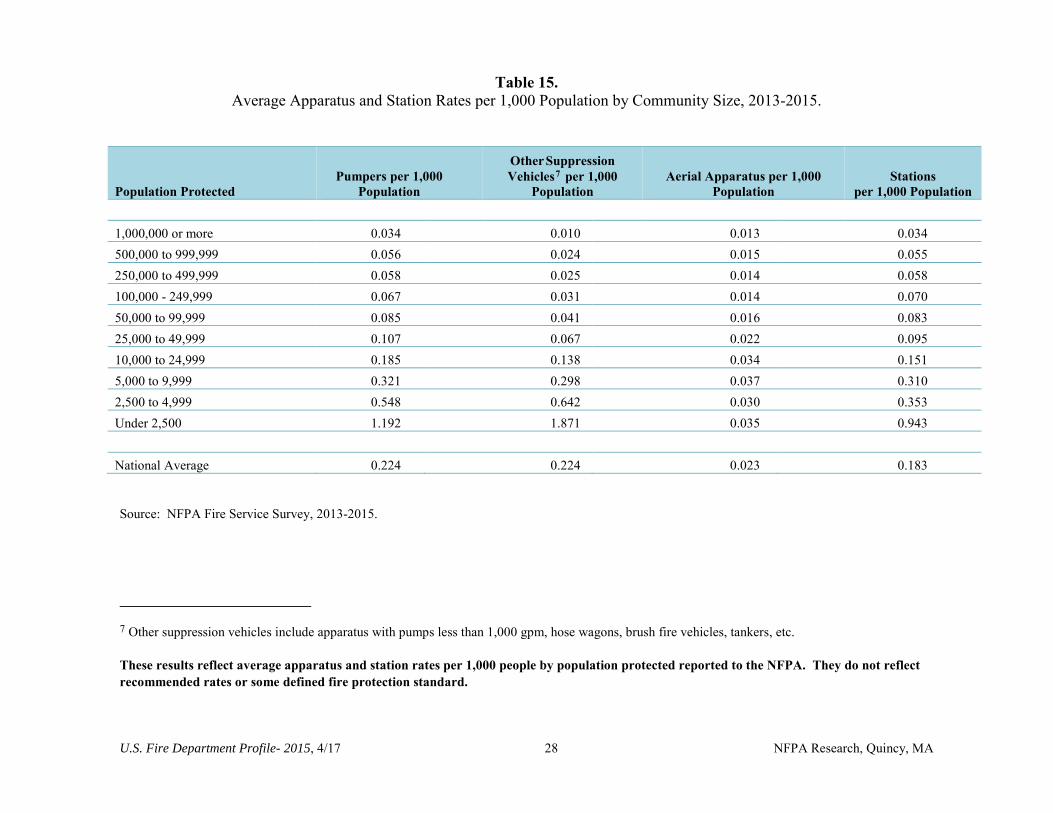
Fire Department Apparatus and Stations
Estimates of the number of apparatus and stations in the United States for the 2013-2015 period
indicate that there were 71,800 pumpers, 7,300 aerial apparatuses, 79,050 other suppression vehicles (which
includes pumpers less than 1,000 gpm, hose usage, brush vehicles, tanker, etc.) and 58,750 stations.
Table 15 provides a breakdown of the average apparatus and station rates by community size.6
It is worth emphasizing what the indicated rates in Table 15 really mean. The numbers reflect
apparatus averages and station rates per 1,000 people by population protected reported to the NFPA.
They do not represent recommended rates or some defined fire protection standard.
The rates are higher for departments protecting smaller communities (under 2,500). This is because it
takes a minimum number of apparatus and stations to operate a fire department regardless of the number of
people protected. For instance, for a department protecting 1,000 people, you would expect according to
Table 15 an average of 1.192 pumpers, 1.871 other suppression vehicles, 0.035 aerial apparatus, and 0.943
stations. The 0.943 stations per 1,000 people is the highest rate shown in Table 15, but for this community
size it is equivalent to one station per department. Another way to put this is that for every 100 departments
protecting 1,000 people, you would expect approximately 119 pumpers, 187 other suppression vehicles, 4
aerial apparatus, and 94 stations. For communities of 25,000 to 999,999, the rates tend to be quite similar:
0.056 - 0.107 pumpers per 1,000 people; and 0.024 - 0.067 other suppression vehicles; 0.014 - 0.022 aerial
apparatus per 1,000 people, and 0.055 - 0.095 stations per 1,000 people.
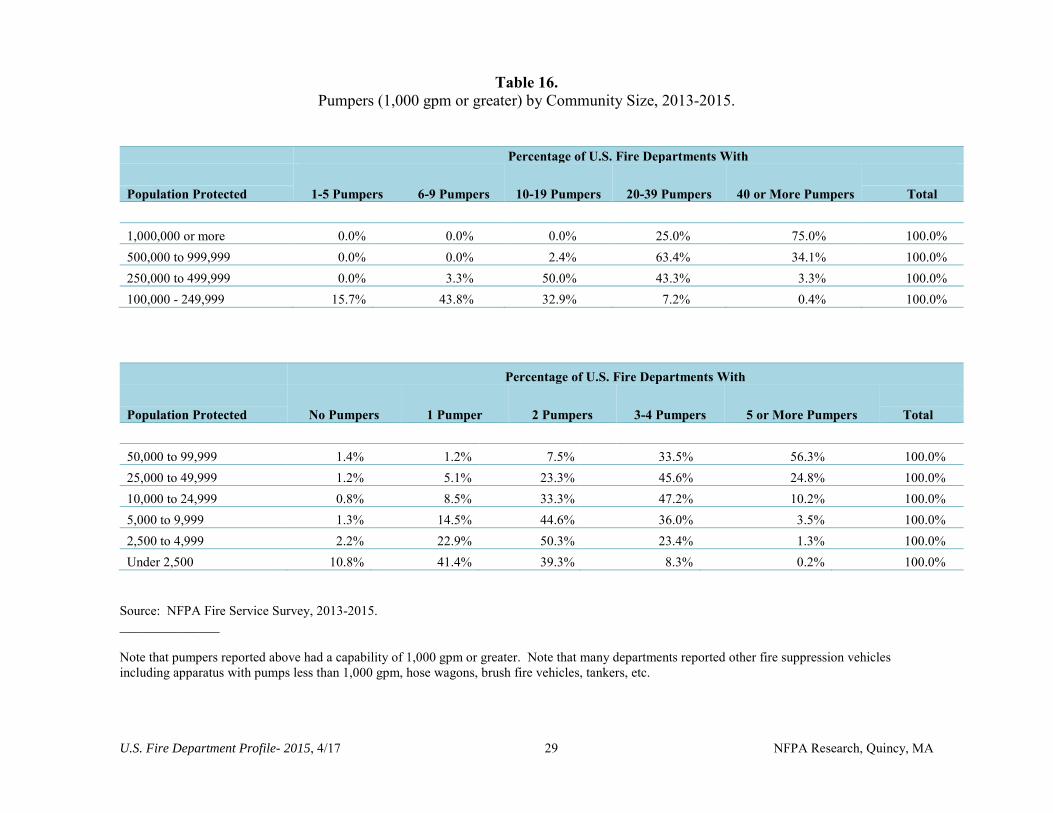
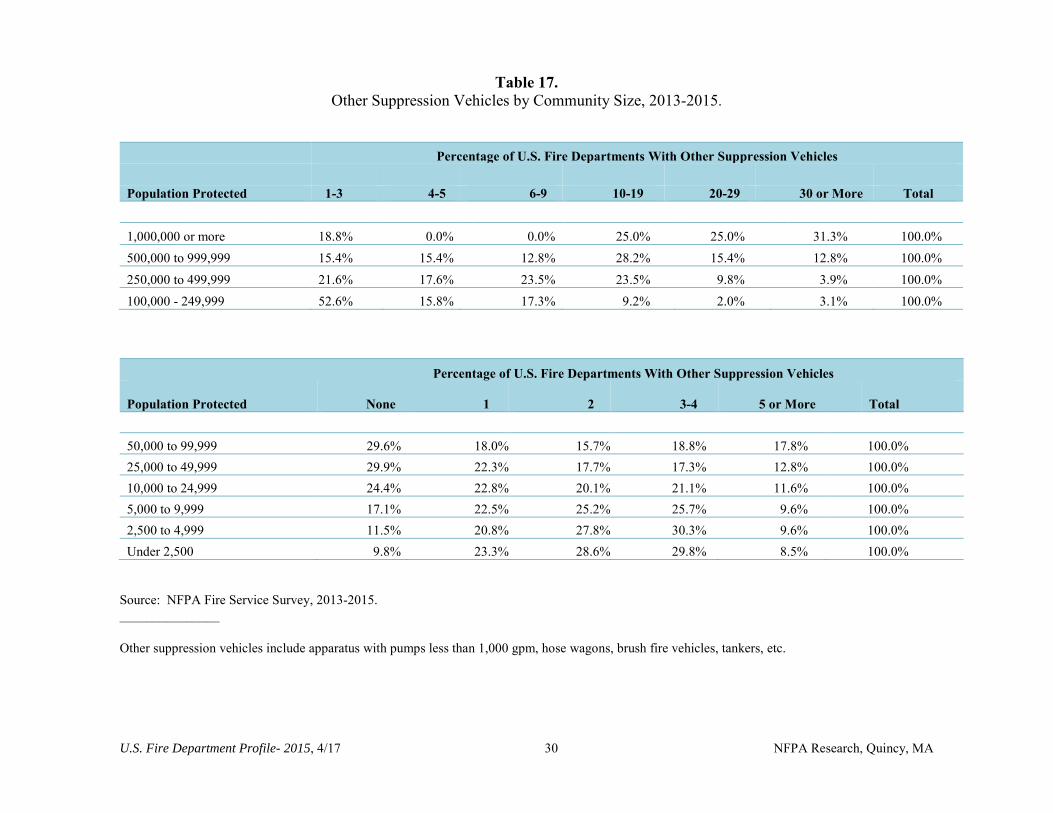
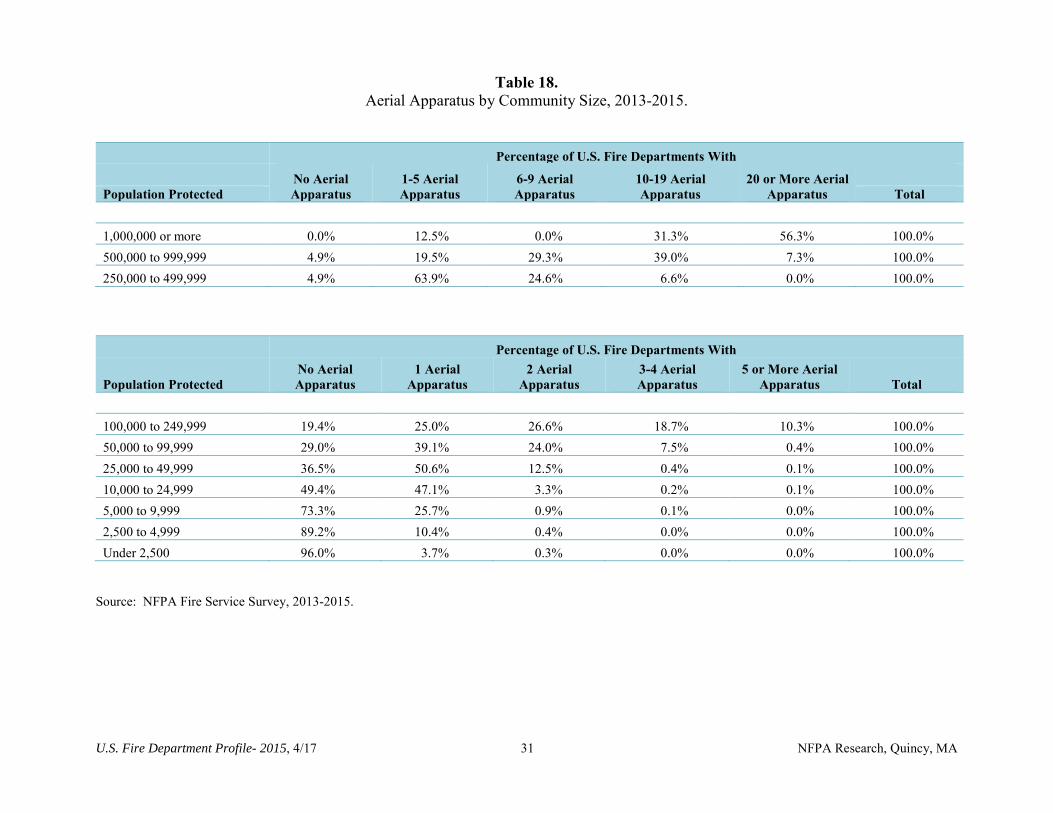
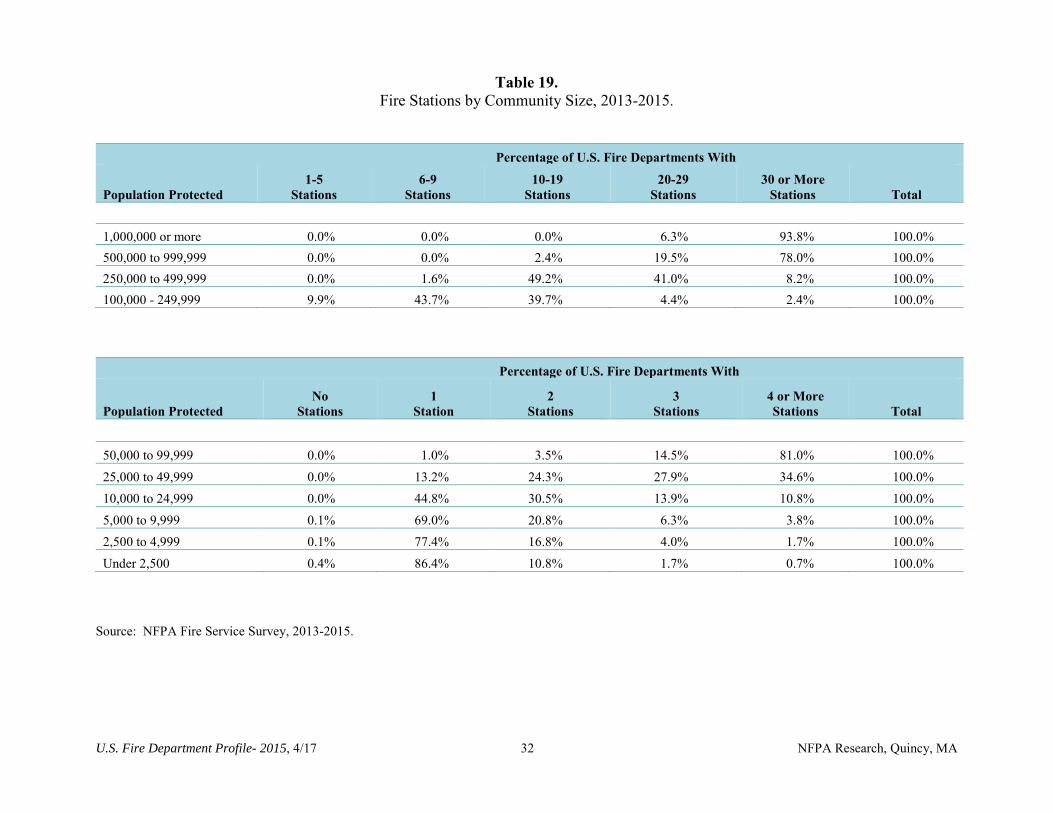
Table 16, Table 17, Table 18, and Table 19 display the prevalence of pumpers, other suppression
vehicles, aerial apparatus, and stations by size of community.
6 Note that these results are based on a sample survey, and as a result there is a confidence interval associated with each estimate. Based on the data reported by fire departments responding to the NFPA Fire Service Survey (2013 -2015), the NFPA is 95% confident that the actual number of pumpers falls between 71,650 and 71,950; aerial apparatus between 7,250 and 7,350; other suppression vehicles between 78,800 and 79,300.
U.S. Fire Department Profile- 2015, 4/17 28 NFPA Research, Quincy, MA
Table 15. Average Apparatus and Station Rates per 1,000 Population by Community Size, 2013-2015.
Population Protected Pumpers per 1,000
Population
Other SuppressionVehicles7 per 1,000
Population Aerial Apparatus per 1,000
Population Stations
per 1,000 Population
1,000,000 or more 0.034 0.010 0.013 0.034 500,000 to 999,999 0.056 0.024 0.015 0.055 250,000 to 499,999 0.058 0.025 0.014 0.058 100,000 - 249,999 0.067 0.031 0.014 0.070 50,000 to 99,999 0.085 0.041 0.016 0.083 25,000 to 49,999 0.107 0.067 0.022 0.095 10,000 to 24,999 0.185 0.138 0.034 0.151 5,000 to 9,999 0.321 0.298 0.037 0.310 2,500 to 4,999 0.548 0.642 0.030 0.353 Under 2,500 1.192 1.871 0.035 0.943
National Average 0.224 0.224 0.023 0.183
Source: NFPA Fire Service Survey, 2013-2015.
7 Other suppression vehicles include apparatus with pumps less than 1,000 gpm, hose wagons, brush fire vehicles, tankers, etc.
These results reflect average apparatus and station rates per 1,000 people by population protected reported to the NFPA. They do not reflect recommended rates or some defined fire protection standard.
U.S. Fire Department Profile- 2015, 4/17 29 NFPA Research, Quincy, MA
Table 16. Pumpers (1,000 gpm or greater) by Community Size, 2013-2015.
Percentage of U.S. Fire Departments With
1-5 Pumpers 6-9 Pumpers 10-19 Pumpers 20-39 Pumpers 40 or More PumpersPopulation Protected Total
1,000,000 or more 0.0% 0.0% 0.0% 25.0% 75.0% 100.0% 500,000 to 999,999 0.0% 0.0% 2.4% 63.4% 34.1% 100.0% 250,000 to 499,999 0.0% 3.3% 50.0% 43.3% 3.3% 100.0% 100,000 - 249,999 15.7% 43.8% 32.9% 7.2% 0.4% 100.0%
Percentage of U.S. Fire Departments With
No Pumpers 1 Pumper 2 Pumpers 3-4 Pumpers 5 or More Pumpers Population Protected Total
50,000 to 99,999 1.4% 1.2% 7.5% 33.5% 56.3% 100.0% 25,000 to 49,999 1.2% 5.1% 23.3% 45.6% 24.8% 100.0% 10,000 to 24,999 0.8% 8.5% 33.3% 47.2% 10.2% 100.0% 5,000 to 9,999 1.3% 14.5% 44.6% 36.0% 3.5% 100.0% 2,500 to 4,999 2.2% 22.9% 50.3% 23.4% 1.3% 100.0% Under 2,500 10.8% 41.4% 39.3% 8.3% 0.2% 100.0%
Source: NFPA Fire Service Survey, 2013-2015. _______________
Note that pumpers reported above had a capability of 1,000 gpm or greater. Note that many departments reported other fire suppression vehicles including apparatus with pumps less than 1,000 gpm, hose wagons, brush fire vehicles, tankers, etc.
U.S. Fire Department Profile- 2015, 4/17 30 NFPA Research, Quincy, MA
Table 17. Other Suppression Vehicles by Community Size, 2013-2015.
Percentage of U.S. Fire Departments With Other Suppression Vehicles
Population Protected 1-3 4-5 6-9 10-19 20-29 30 or More Total
1,000,000 or more 18.8% 0.0% 0.0% 25.0% 25.0% 31.3% 100.0% 500,000 to 999,999 15.4% 15.4% 12.8% 28.2% 15.4% 12.8% 100.0% 250,000 to 499,999 21.6% 17.6% 23.5% 23.5% 9.8% 3.9% 100.0% 100,000 - 249,999 52.6% 15.8% 17.3% 9.2% 2.0% 3.1% 100.0%
Percentage of U.S. Fire Departments With Other Suppression Vehicles
Population Protected None 1 2 3-4 5 or More Total
50,000 to 99,999 29.6% 18.0% 15.7% 18.8% 17.8% 100.0% 25,000 to 49,999 29.9% 22.3% 17.7% 17.3% 12.8% 100.0% 10,000 to 24,999 24.4% 22.8% 20.1% 21.1% 11.6% 100.0% 5,000 to 9,999 17.1% 22.5% 25.2% 25.7% 9.6% 100.0% 2,500 to 4,999 11.5% 20.8% 27.8% 30.3% 9.6% 100.0% Under 2,500 9.8% 23.3% 28.6% 29.8% 8.5% 100.0%
Source: NFPA Fire Service Survey, 2013-2015. _______________
Other suppression vehicles include apparatus with pumps less than 1,000 gpm, hose wagons, brush fire vehicles, tankers, etc.
U.S. Fire Department Profile- 2015, 4/17 31 NFPA Research, Quincy, MA
Table 18. Aerial Apparatus by Community Size, 2013-2015.
Percentage of U.S. Fire Departments With
No Aerial Apparatus
1-5 AerialApparatus
6-9 Aerial Apparatus
10-19 AerialApparatus
20 or More Aerial Apparatus Population Protected Total
1,000,000 or more 0.0% 12.5% 0.0% 31.3% 56.3% 100.0% 500,000 to 999,999 4.9% 19.5% 29.3% 39.0% 7.3% 100.0% 250,000 to 499,999 4.9% 63.9% 24.6% 6.6% 0.0% 100.0%
Percentage of U.S. Fire Departments With
Population Protected No Aerial Apparatus
1 Aerial Apparatus
2 Aerial Apparatus
3-4 AerialApparatus
5 or More Aerial Apparatus Total
100,000 to 249,999 19.4% 25.0% 26.6% 18.7% 10.3% 100.0% 50,000 to 99,999 29.0% 39.1% 24.0% 7.5% 0.4% 100.0% 25,000 to 49,999 36.5% 50.6% 12.5% 0.4% 0.1% 100.0% 10,000 to 24,999 49.4% 47.1% 3.3% 0.2% 0.1% 100.0% 5,000 to 9,999 73.3% 25.7% 0.9% 0.1% 0.0% 100.0% 2,500 to 4,999 89.2% 10.4% 0.4% 0.0% 0.0% 100.0% Under 2,500 96.0% 3.7% 0.3% 0.0% 0.0% 100.0%
Source: NFPA Fire Service Survey, 2013-2015.
U.S. Fire Department Profile- 2015, 4/17 32 NFPA Research, Quincy, MA
Table 19. Fire Stations by Community Size, 2013-2015.
Percentage of U.S. Fire Departments With
Population Protected 1-5
Stations 6-9
Stations 10-19
Stations 20-29
Stations30 or More
Stations Total
1,000,000 or more 0.0% 0.0% 0.0% 6.3% 93.8% 100.0% 500,000 to 999,999 0.0% 0.0% 2.4% 19.5% 78.0% 100.0% 250,000 to 499,999 0.0% 1.6% 49.2% 41.0% 8.2% 100.0% 100,000 - 249,999 9.9% 43.7% 39.7% 4.4% 2.4% 100.0%
Percentage of U.S. Fire Departments With
Population Protected No
Stations 1
Station 2
Stations 3
Stations 4 or More Stations Total
50,000 to 99,999 0.0% 1.0% 3.5% 14.5% 81.0% 100.0% 25,000 to 49,999 0.0% 13.2% 24.3% 27.9% 34.6% 100.0% 10,000 to 24,999 0.0% 44.8% 30.5% 13.9% 10.8% 100.0% 5,000 to 9,999 0.1% 69.0% 20.8% 6.3% 3.8% 100.0% 2,500 to 4,999 0.1% 77.4% 16.8% 4.0% 1.7% 100.0% Under 2,500 0.4% 86.4% 10.8% 1.7% 0.7% 100.0%
Source: NFPA Fire Service Survey, 2013-2015.
U.S. Fire Department Profile-2015, 4/17 33 NFPA Research, Quincy, MA
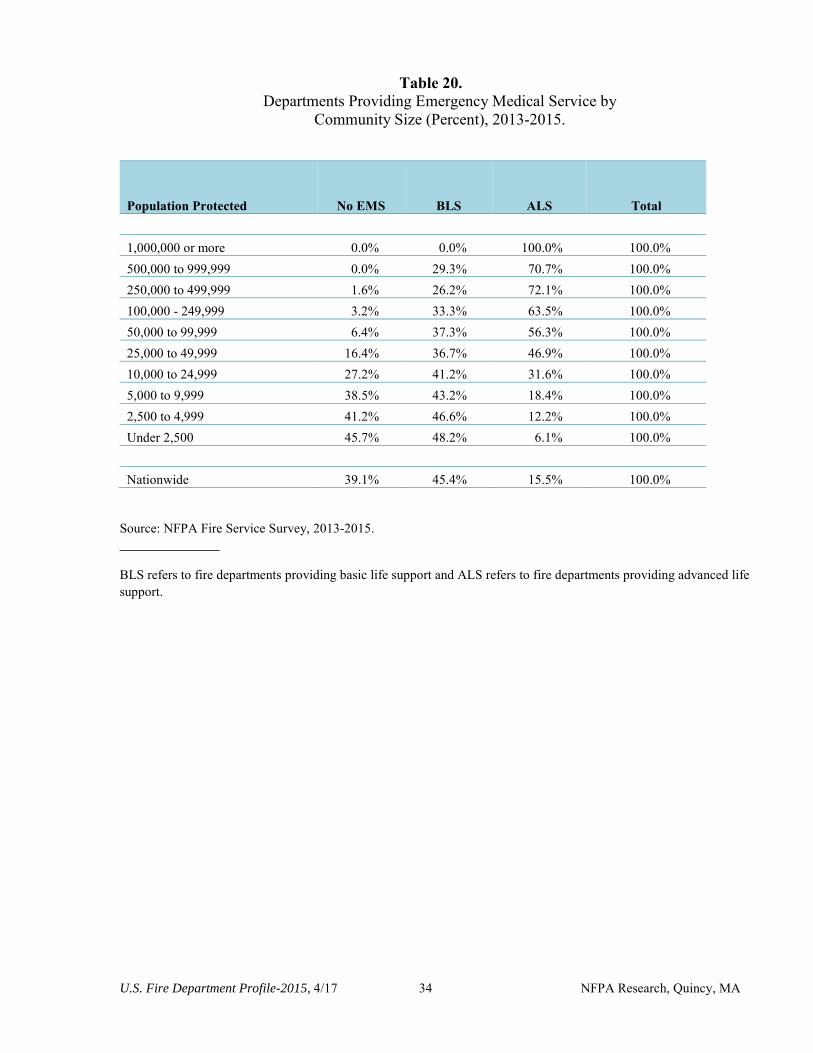
Emergency Medical Services
The level of emergency medical service (EMS) provided by fire departments by size of
community protected for the 2013-2015 period is provided in Table 20. The larger the
community, the more likely EMS service was provided. Nationwide, 13,500 (45.4%)
departments provided EMS with basic life support, 4,617 (15.5%) departments provided EMS
with advanced life support, and 11,610 (39.1%) departments did not provide EMS.
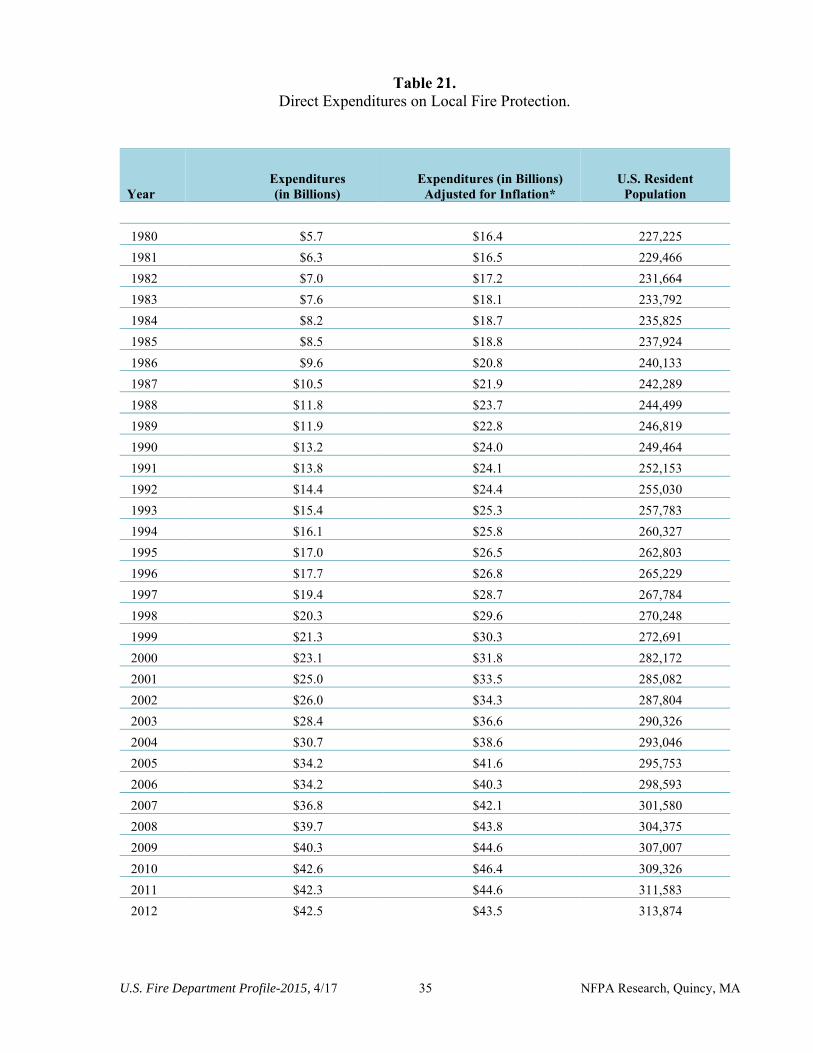
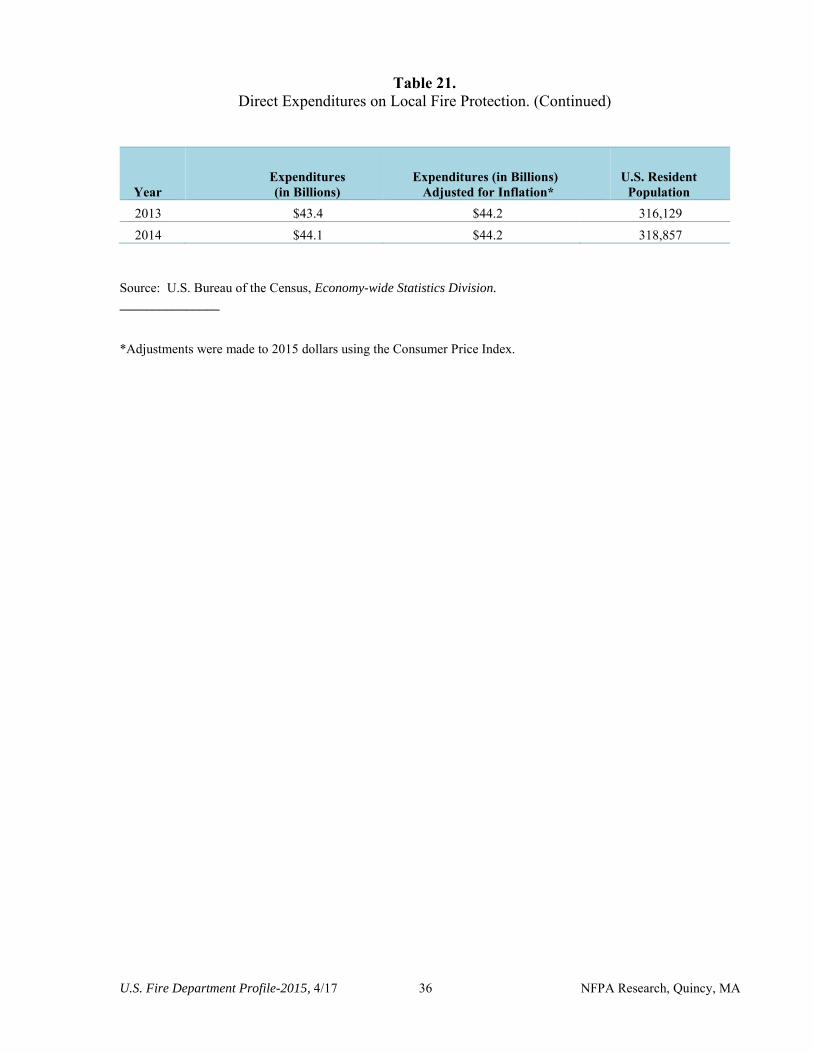
U.S. Expenditures on Local Fire Protection
Table 21 provides expenditures on local fire protection by governments, with and without
adjustment for inflation. Note that these expenditures adjusted for inflation, have risen 170%
from 1980 to 2014. Other municipal service costs like police protection have risen in a similar
manner.
Fire protection costs rose 113% from 1986 to 2014 after adjusting for inflation, while the
number of career firefighters increased 46% (Table 2). Since chiefs of fire departments serving
larger communities report problems with shrinking budgets or with level budgets combined with
increasing responsibilities, this clear pattern of increasing fire department resources nationwide
is difficult to interpret. Some of the factors possibly contributing to this increase in costs are (1)
shrinkage of the work week8 for some departments, which results in a need to increase staffing
and apparatus or to pay firefighters at overtime rates; (2) increased EMS responsibilities that
require increased staffing and, in some communities, a more frequent replacement of apparatus;
and (3) rising costs of retirement and health benefits.
8 This is the result at least to some extent of the Fair Labor Standards Act being applied to municipal fire departments.
U.S. Fire Department Profile-2015, 4/17 34 NFPA Research, Quincy, MA
Table 20. Departments Providing Emergency Medical Service by
Community Size (Percent), 2013-2015.
Population Protected No EMS BLS ALS Total
1,000,000 or more 0.0% 0.0% 100.0% 100.0% 500,000 to 999,999 0.0% 29.3% 70.7% 100.0% 250,000 to 499,999 1.6% 26.2% 72.1% 100.0% 100,000 - 249,999 3.2% 33.3% 63.5% 100.0% 50,000 to 99,999 6.4% 37.3% 56.3% 100.0% 25,000 to 49,999 16.4% 36.7% 46.9% 100.0% 10,000 to 24,999 27.2% 41.2% 31.6% 100.0% 5,000 to 9,999 38.5% 43.2% 18.4% 100.0% 2,500 to 4,999 41.2% 46.6% 12.2% 100.0% Under 2,500 45.7% 48.2% 6.1% 100.0%
Nationwide 39.1% 45.4% 15.5% 100.0%
Source: NFPA Fire Service Survey, 2013-2015. _______________
BLS refers to fire departments providing basic life support and ALS refers to fire departments providing advanced life support.
U.S. Fire Department Profile-2015, 4/17 35 NFPA Research, Quincy, MA
Table 21. Direct Expenditures on Local Fire Protection.
Year Expenditures (in Billions)
Expenditures (in Billions) Adjusted for Inflation*
U.S. Resident Population
1980 $5.7 $16.4 227,225 1981 $6.3 $16.5 229,466 1982 $7.0 $17.2 231,664 1983 $7.6 $18.1 233,792 1984 $8.2 $18.7 235,825 1985 $8.5 $18.8 237,924 1986 $9.6 $20.8 240,133 1987 $10.5 $21.9 242,289 1988 $11.8 $23.7 244,499 1989 $11.9 $22.8 246,819 1990 $13.2 $24.0 249,464 1991 $13.8 $24.1 252,153 1992 $14.4 $24.4 255,030 1993 $15.4 $25.3 257,783 1994 $16.1 $25.8 260,327 1995 $17.0 $26.5 262,803 1996 $17.7 $26.8 265,229 1997 $19.4 $28.7 267,784 1998 $20.3 $29.6 270,248 1999 $21.3 $30.3 272,691 2000 $23.1 $31.8 282,172 2001 $25.0 $33.5 285,082 2002 $26.0 $34.3 287,804 2003 $28.4 $36.6 290,326 2004 $30.7 $38.6 293,046 2005 $34.2 $41.6 295,753 2006 $34.2 $40.3 298,593 2007 $36.8 $42.1 301,580 2008 $39.7 $43.8 304,375 2009 $40.3 $44.6 307,007 2010 $42.6 $46.4 309,326 2011 $42.3 $44.6 311,583 2012 $42.5 $43.5 313,874
U.S. Fire Department Profile-2015, 4/17 36 NFPA Research, Quincy, MA
Table 21. Direct Expenditures on Local Fire Protection. (Continued)
Year Expenditures (in Billions)
Expenditures (in Billions) Adjusted for Inflation*
U.S. Resident Population
2013 $43.4 $44.2 316,129 2014 $44.1 $44.2 318,857
Source: U.S. Bureau of the Census, Economy-wide Statistics Division. _______________
*Adjustments were made to 2015 dollars using the Consumer Price Index.
U.S. Fire Department Profile-2015, 4/17 37 NFPA Research, Quincy, MA
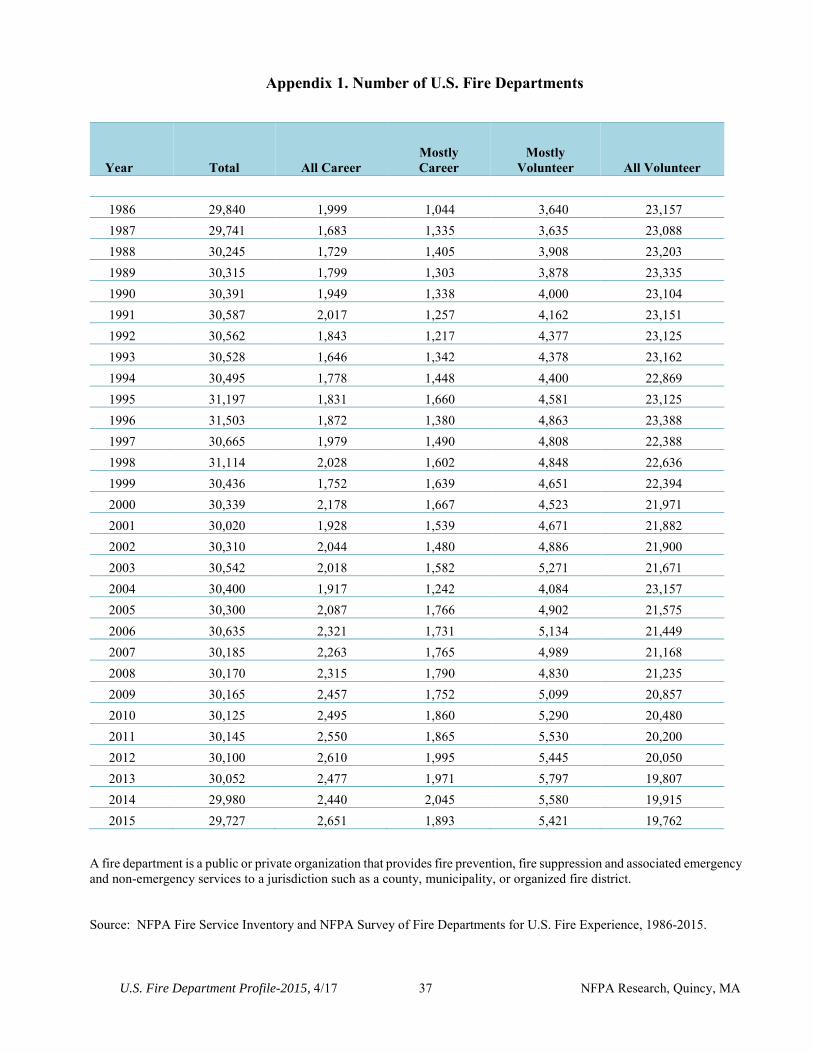
Appendix 1. Number of U.S. Fire Departments
Year Total All Career Mostly Career
Mostly Volunteer All Volunteer
1986 29,840 1,999 1,044 3,640 23,157 1987 29,741 1,683 1,335 3,635 23,088 1988 30,245 1,729 1,405 3,908 23,203 1989 30,315 1,799 1,303 3,878 23,335 1990 30,391 1,949 1,338 4,000 23,104 1991 30,587 2,017 1,257 4,162 23,151 1992 30,562 1,843 1,217 4,377 23,125 1993 30,528 1,646 1,342 4,378 23,162 1994 30,495 1,778 1,448 4,400 22,869 1995 31,197 1,831 1,660 4,581 23,125 1996 31,503 1,872 1,380 4,863 23,388 1997 30,665 1,979 1,490 4,808 22,388 1998 31,114 2,028 1,602 4,848 22,636 1999 30,436 1,752 1,639 4,651 22,394 2000 30,339 2,178 1,667 4,523 21,971 2001 30,020 1,928 1,539 4,671 21,882 2002 30,310 2,044 1,480 4,886 21,900 2003 30,542 2,018 1,582 5,271 21,671 2004 30,400 1,917 1,242 4,084 23,157 2005 30,300 2,087 1,766 4,902 21,575 2006 30,635 2,321 1,731 5,134 21,449 2007 30,185 2,263 1,765 4,989 21,168 2008 30,170 2,315 1,790 4,830 21,235 2009 30,165 2,457 1,752 5,099 20,857 2010 30,125 2,495 1,860 5,290 20,480 2011 30,145 2,550 1,865 5,530 20,200 2012 30,100 2,610 1,995 5,445 20,050 2013 30,052 2,477 1,971 5,797 19,807 2014 29,980 2,440 2,045 5,580 19,915 2015 29,727 2,651 1,893 5,421 19,762
A fire department is a public or private organization that provides fire prevention, fire suppression and associated emergency and non-emergency services to a jurisdiction such as a county, municipality, or organized fire district.
Source: NFPA Fire Service Inventory and NFPA Survey of Fire Departments for U.S. Fire Experience, 1986-2015.
U.S. Fire Department Profile-2015, 4/17 38 NFPA Research, Quincy, MA
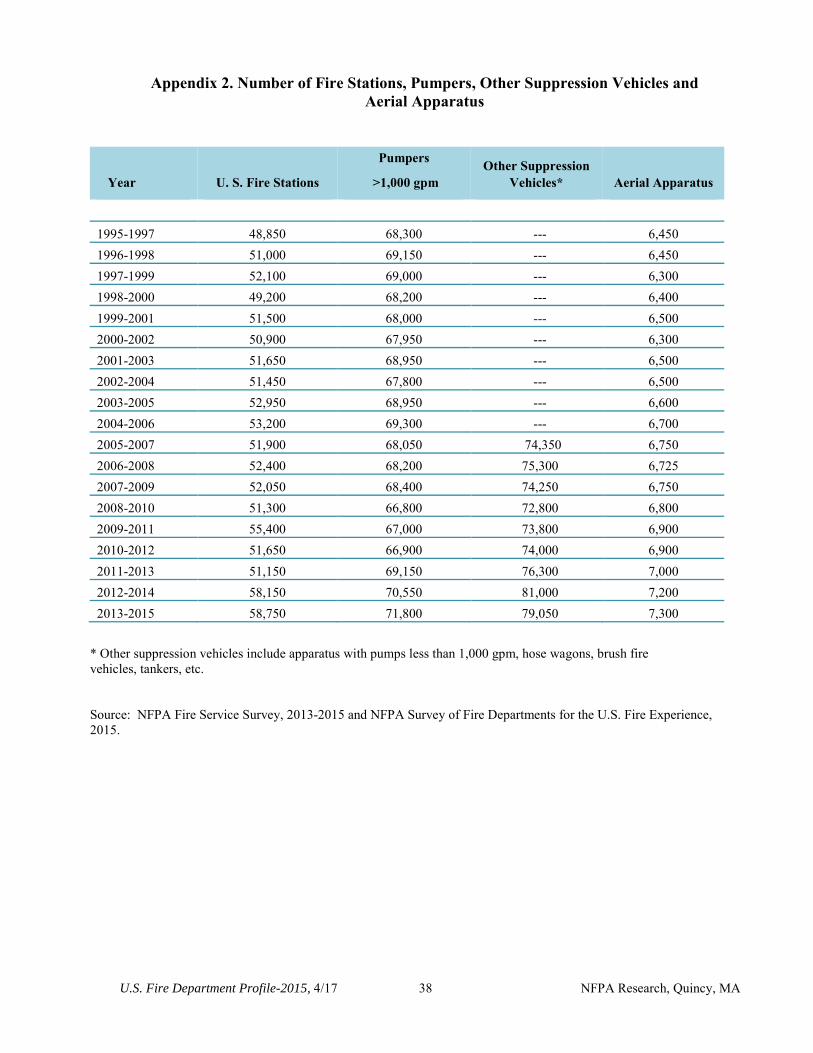
Appendix 2. Number of Fire Stations, Pumpers, Other Suppression Vehicles and Aerial Apparatus
Year U. S. Fire Stations
Pumpers
>1,000 gpmOther Suppression
Vehicles* Aerial Apparatus
1995-1997 48,850 68,300 --- 6,450 1996-1998 51,000 69,150 --- 6,450 1997-1999 52,100 69,000 --- 6,300 1998-2000 49,200 68,200 --- 6,400 1999-2001 51,500 68,000 --- 6,500 2000-2002 50,900 67,950 --- 6,300 2001-2003 51,650 68,950 --- 6,500 2002-2004 51,450 67,800 --- 6,500 2003-2005 52,950 68,950 --- 6,600 2004-2006 53,200 69,300 --- 6,700 2005-2007 51,900 68,050 74,350 6,750 2006-2008 52,400 68,200 75,300 6,725 2007-2009 52,050 68,400 74,250 6,750 2008-2010 51,300 66,800 72,800 6,800 2009-2011 55,400 67,000 73,800 6,900 2010-2012 51,650 66,900 74,000 6,900 2011-2013 51,150 69,150 76,300 7,000 2012-2014 58,150 70,550 81,000 7,200 2013-2015 58,750 71,800 79,050 7,300
* Other suppression vehicles include apparatus with pumps less than 1,000 gpm, hose wagons, brush firevehicles, tankers, etc.
Source: NFPA Fire Service Survey, 2013-2015 and NFPA Survey of Fire Departments for the U.S. Fire Experience, 2015.
U.S. Fire Department Profile-2015, 4/17 39 NFPA Research, Quincy, MA
Appendix 3. Average Percentage of Career Firefighters by Gender, Race, and Hispanic or Latino Ethnicity (2011-2015)
Source: Bureau of Labor Statistics, Annual Averages Tables Employment and Earnings
*Note: These statistics do not include volunteer firefighters
Male95.9%
Female4.6%
Caucasian (White)& Other81.9%
Black or African
American8.1%
Asian0.8%
Hispanic or Latino9.2%


![National Fire Protection Association Report - nfpa.org · PDF fileSecond Revision No. 160-NFPA 13-2014 [ Section No. 2.2 ] 2.2 NFPA Publications. National Fire Protection Association,](https://img.pdfslide.net/doc/110x75/5a7a12e97f8b9ab80d8d1cef/national-fire-protection-association-report-nfpaorg-revision-no-160-nfpa-13-2014.jpg)


![National Fire Protection Association Report - nfpa.org · PDF fileSecond Revision No. 169-NFPA 13-2014 [ Section No. 3.8.1.12 ] 3.8.1.12 Pumper Outlet. The hydrant outlet intended](https://img.pdfslide.net/doc/110x75/5a712a367f8b9abb538c93db/national-fire-protection-association-report-nfpaorg-nbsppdf-filesecond.jpg)


![National Fire Protection Association Report - nfpa.org · PDF fileSecond Revision No. 125-NFPA 13-2014 [ Global Comment ] Revise Chapter 22 in accordance with the attached document](https://img.pdfslide.net/doc/110x75/5a9d94227f8b9a28388be55e/national-fire-protection-association-report-nfpaorg-revision-no-125-nfpa-13-2014.jpg)