Embed Size (px)
Citation preview

www.usfunds.com 1.800.US.FUNDS
U.S. Global Investors Searching for Opportunities, Managing Risk
February 2, 2012 12-022
Frank E. Holmes CEO and CIO
Susan McGee President and General Counsel
Catherine Rademacher CFO
Ryan George Investor Relations

www.usfunds.com February 2012 12-022 2
Today’s Presenters
Frank Holmes Susan McGee Catherine Rademacher Ryan George

www.usfunds.com February 2012 12-022
Forward-Looking Statements
3
During this webcast we may make forward-looking statements about our relative business outlook. Any forward-looking statements and all other statements made during this webcast that don’t pertain to historical facts are subject to risks and uncertainties that may materially affect actual results. Please refer to our press release and the corresponding Form 10-Q filing for more detail on factors that could cause actual results to differ materially from any described today in forward-looking statements. Any such statements are made as of today, and U.S. Global Investors accepts no obligation to update them in the future.

www.usfunds.com February 2012 12-022
GROW Strengths
“Go-to” stock for exposure to emerging markets and resources
Debt-free, strong balance sheet with a reflexive cost structure
Monthly dividend and return on equity discipline
4

www.usfunds.com February 2012 12-022
Top Institutional Holders of GROW
5
1. Royce and Associates 14%
2. Financial and Investment 8% Management Group
3. Perritt Capital Management 4%
4. SunAmerica Asset 3% Management Corp
5. BlackRock Fund Advisors 3% Percentage of shares outstanding as of 9/30/2011
www.usfunds.com February 2012 12-022
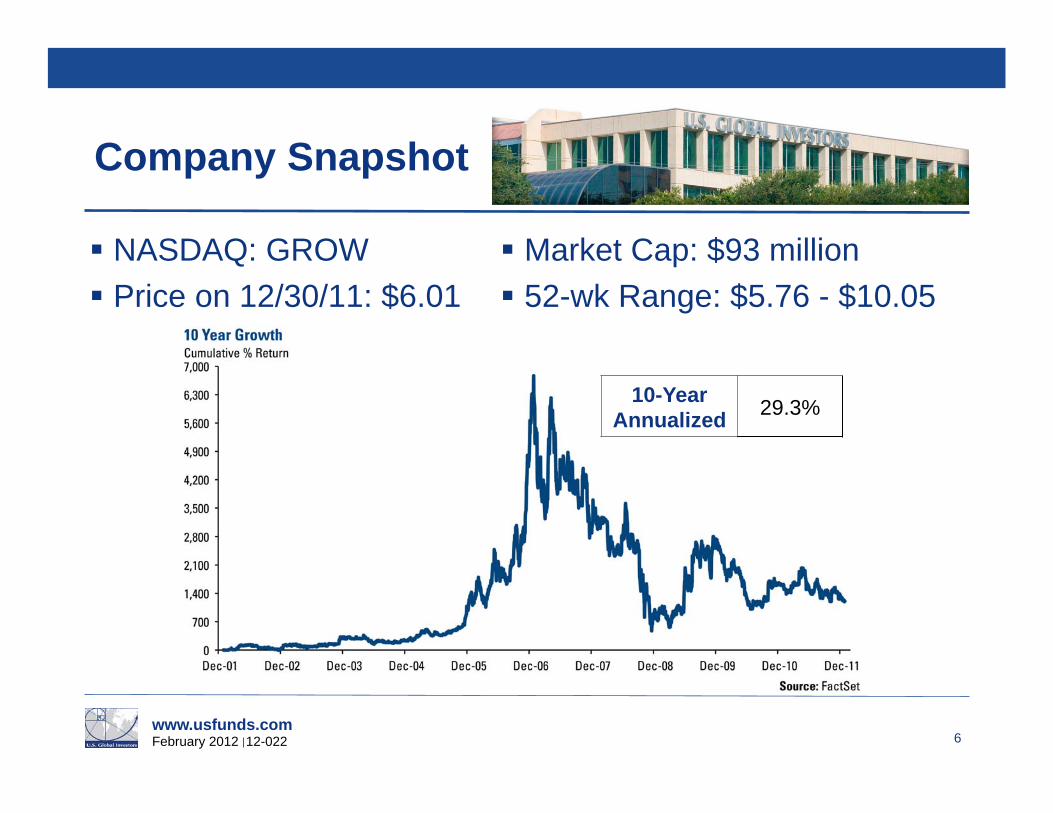
Company Snapshot
6
10-Year Annualized 29.3%
NASDAQ: GROW Price on 12/30/11: $6.01
Market Cap: $93 million 52-wk Range: $5.76 - $10.05

www.usfunds.com February 2012 12-022
2011 Was Worst Year Since 1998 for Active Managers — 48% Lagged
7

www.usfunds.com February 2012 12-022
Asset Breakdown
8
Data for SEC-registered funds as of December 31, 2011.
www.usfunds.com February 2012 12-022 9
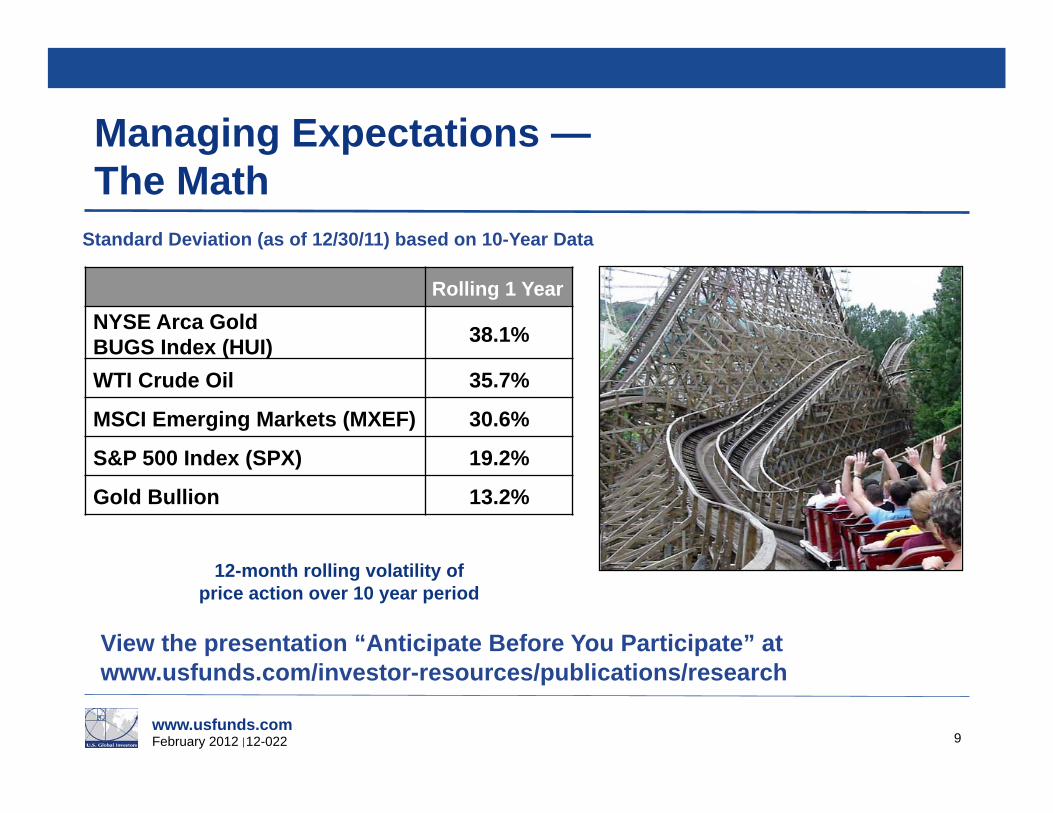
Managing Expectations — The Math
View the presentation “Anticipate Before You Participate” at www.usfunds.com/investor-resources/publications/research
Rolling 1 Year NYSE Arca Gold BUGS Index (HUI) 38.1%
WTI Crude Oil 35.7%
MSCI Emerging Markets (MXEF) 30.6%
S&P 500 Index (SPX) 19.2%
Gold Bullion 13.2%
12-month rolling volatility of price action over 10 year period
Standard Deviation (as of 12/30/11) based on 10-Year Data

www.usfunds.com February 2012 12-022 10
Managing Expectations — Anticipate Before You Participate Measuring Volatility
Number of +10% Moves
Number of -10% Moves
Frequency of ±10% Moves
GROW (U.S. Global Investors) 764 619 53%
NYSE Arca Gold BUGS Index (HUI) 567 300 33%
WTI Crude Oil 483 296 30%
MSCI Emerging Markets (MXEF) 134 170 12%
Gold Bullion 128 60 7%
S&P 500 Index (SPX) 43 93 6%
Calculated over rolling 20-trading day periods. Based on approximately 2,600 total occurrences over the past 10 years as of 12/30/2011.
www.usfunds.com February 2012 12-022
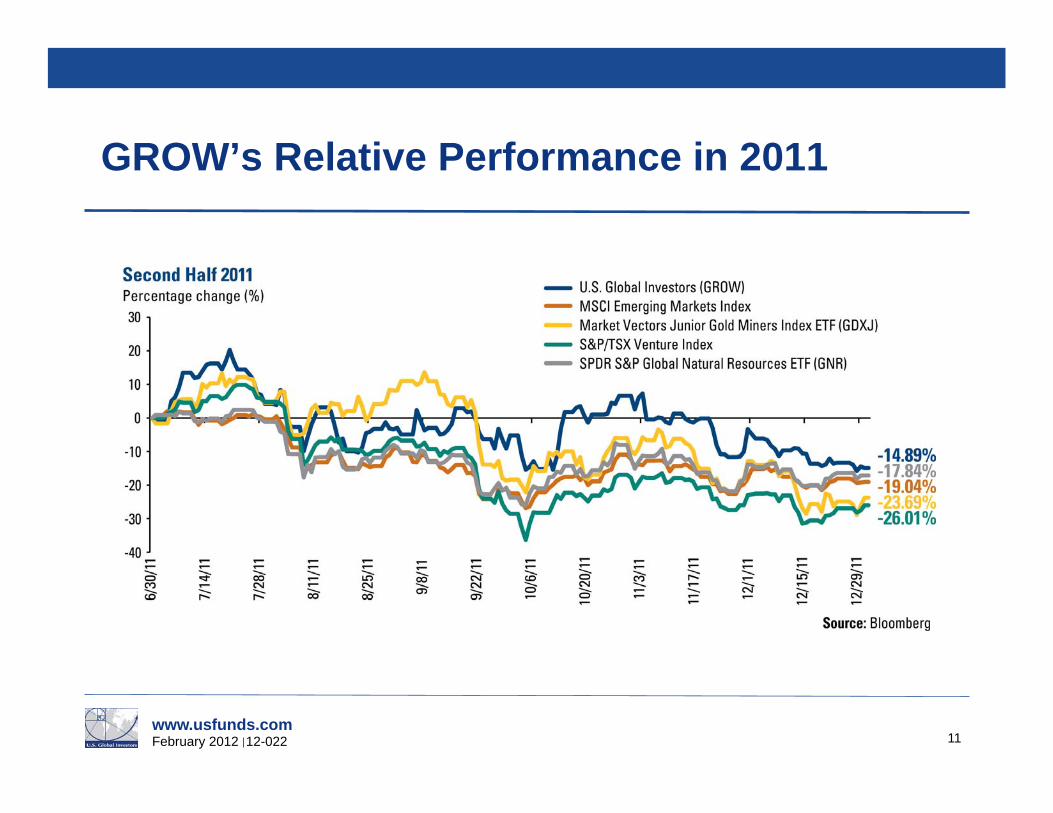
GROW’s Relative Performance in 2011
11
www.usfunds.com February 2012 12-022
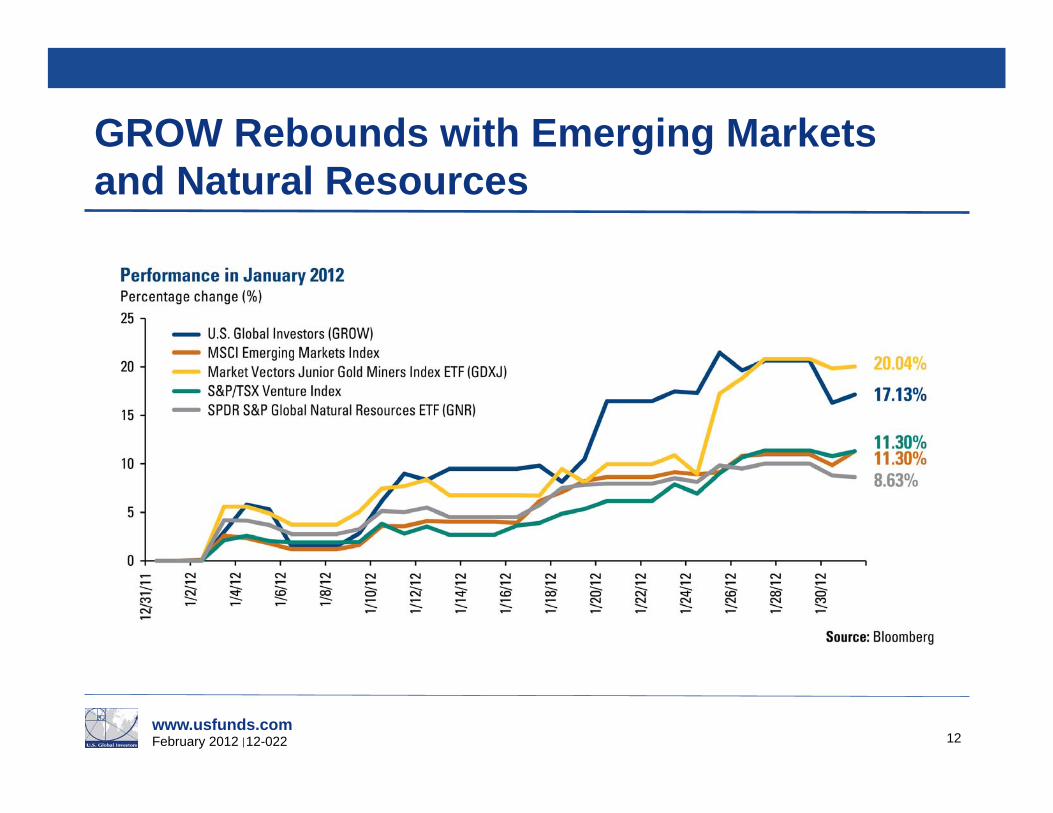
GROW Rebounds with Emerging Markets and Natural Resources
12

www.usfunds.com February 2012 12-022
Dividends — Paid Monthly
13
*At share price of $6.01 as of 12/31/2011 Dividends through December 31, 2011

www.usfunds.com February 2012 12-022
Quarterly Average Assets Under Management
14

www.usfunds.com February 2012 12-022
Earnings Per Share (Quarterly)
15

www.usfunds.com February 2012 12-022
Pre-Tax Profit Margin (Quarterly)
16

www.usfunds.com February 2012 12-022
Balance Sheet Strength – No Debt
17
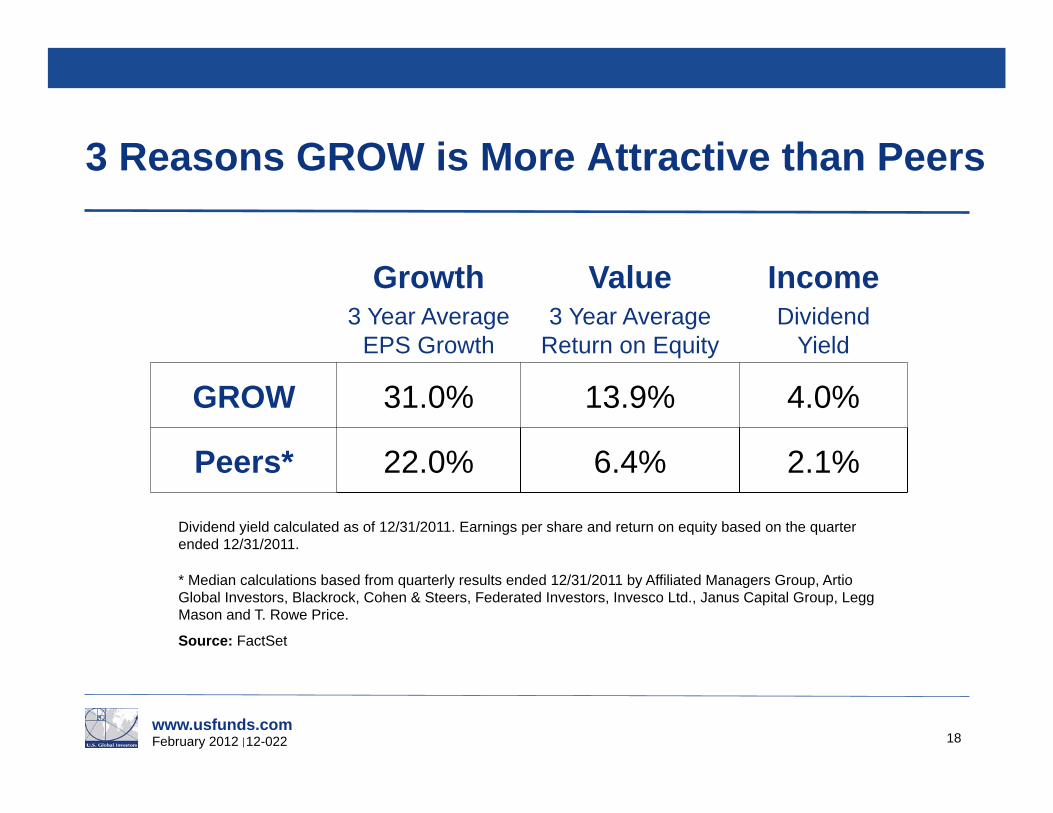
www.usfunds.com February 2012 12-022 18
Growth 3 Year Average
EPS Growth
Value 3 Year Average
Return on Equity
Income Dividend
Yield
GROW 31.0% 13.9% 4.0%
Peers* 22.0% 6.4% 2.1%
3 Reasons GROW is More Attractive than Peers
Dividend yield calculated as of 12/31/2011. Earnings per share and return on equity based on the quarter ended 12/31/2011.
* Median calculations based from quarterly results ended 12/31/2011 by Affiliated Managers Group, Artio Global Investors, Blackrock, Cohen & Steers, Federated Investors, Invesco Ltd., Janus Capital Group, Legg Mason and T. Rowe Price.
Source: FactSet

www.usfunds.com February 2012 12-022
Income Statement – Financial Analysis
19
Catherine Rademacher CFO

www.usfunds.com February 2012 12-022 20
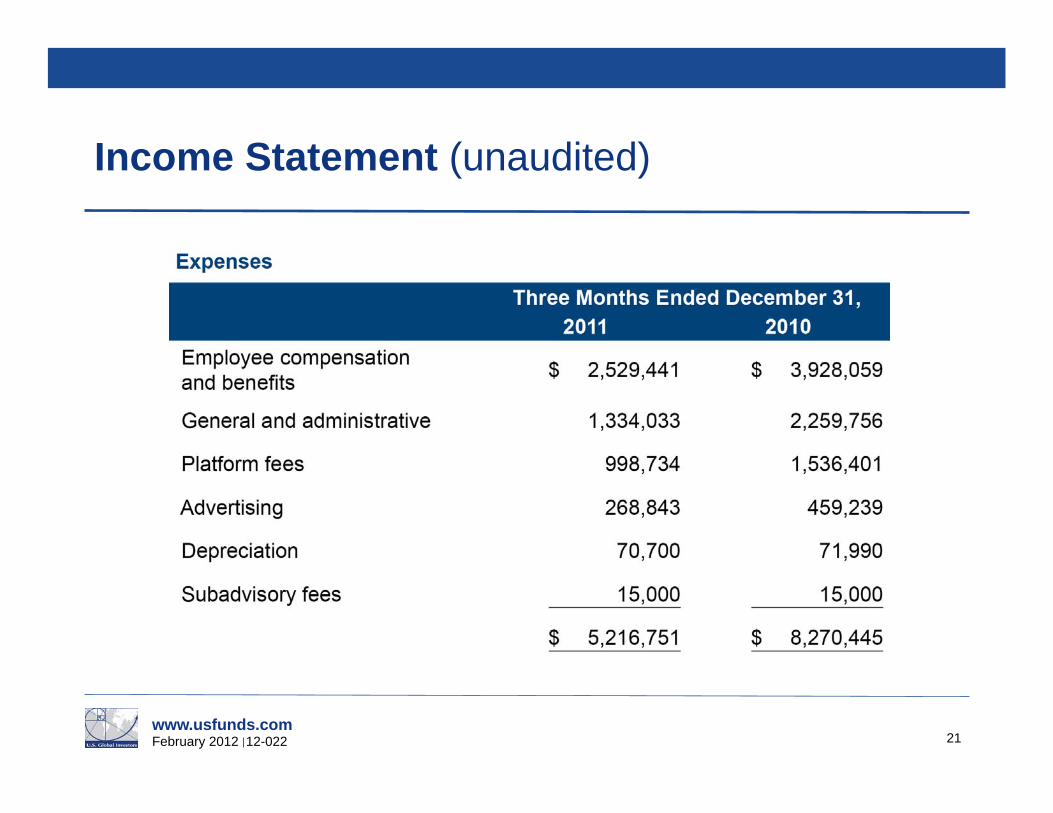
Income Statement (unaudited)
www.usfunds.com February 2012 12-022 21
Income Statement (unaudited)

www.usfunds.com February 2012 12-022 22
Income Statement (unaudited)

www.usfunds.com February 2012 12-022 23
Balance Sheets

www.usfunds.com February 2012 12-022 24
Balance Sheets

www.usfunds.com February 2012 12-022
Significant Events
25
Susan McGee President and General Counsel

www.usfunds.com February 2012 12-022 26
“Performance and Results Oriented”
Winner of 29 Lipper performance awards, certificates and top rankings since 2000
(Four out of 13 U.S. Global Investors Funds received Lipper performance awards from 2005 to 2008, six out of 13 received certificates from 2000 to 2007,
and two out of 13 received top rankings from 2009 to 2010.)
Investment leadership results in performance

www.usfunds.com February 2012 12-022
Fund Recognition: Three Funds Rank in Top 20 for 10 Years
World Precious Minerals Fund (UNWPX) ranked #5
Gold & Precious Metals Fund (USERX) ranked #7
The Global Resources Fund (PSPFX) ranked #16
27
Rankings were provided to The Wall Street Journal and Barron’s by Lipper and include all mutual funds and ETFs tracked by Lipper. Lipper ranked the funds based on 10-year performance data including share prices and reinvested dividends. For funds with multiple share classes, only the largest share class was included. Rankings are based on total annualized return as of 12/31/2011. Past performance is no guarantee of future results.

www.usfunds.com February 2012 12-022
Branding and Marketing of GROW
28
59 Television Appearances 203 Total Interviews 6,891 Web mentions
210 Frank Talk blog entries 643 Newsletter
recommendations
* During calendar year 2011

www.usfunds.com February 2012 12-022
Upcoming Marketing Events
• TD Ameritrade National Conference – Feb 2 in Orlando
• California Resource Investment Conference – Feb 11 in Indian Wells, CA
• Bloomberg Portfolio Manager Mash-up – Feb 16 in NY
• PDAC – March 4 in Toronto
• Texas Energy Conference – March 6 in Dallas
Increased Sales and Marketing Activities
29

www.usfunds.com February 2012 12-022
Global Markets Poised for Rebound in 2012

www.usfunds.com February 2012 12-022
Global PMI Trending Upward
31

www.usfunds.com February 2012 12-022
Strong Momentum for U.S. Stocks
32
www.usfunds.com February 2012 12-022
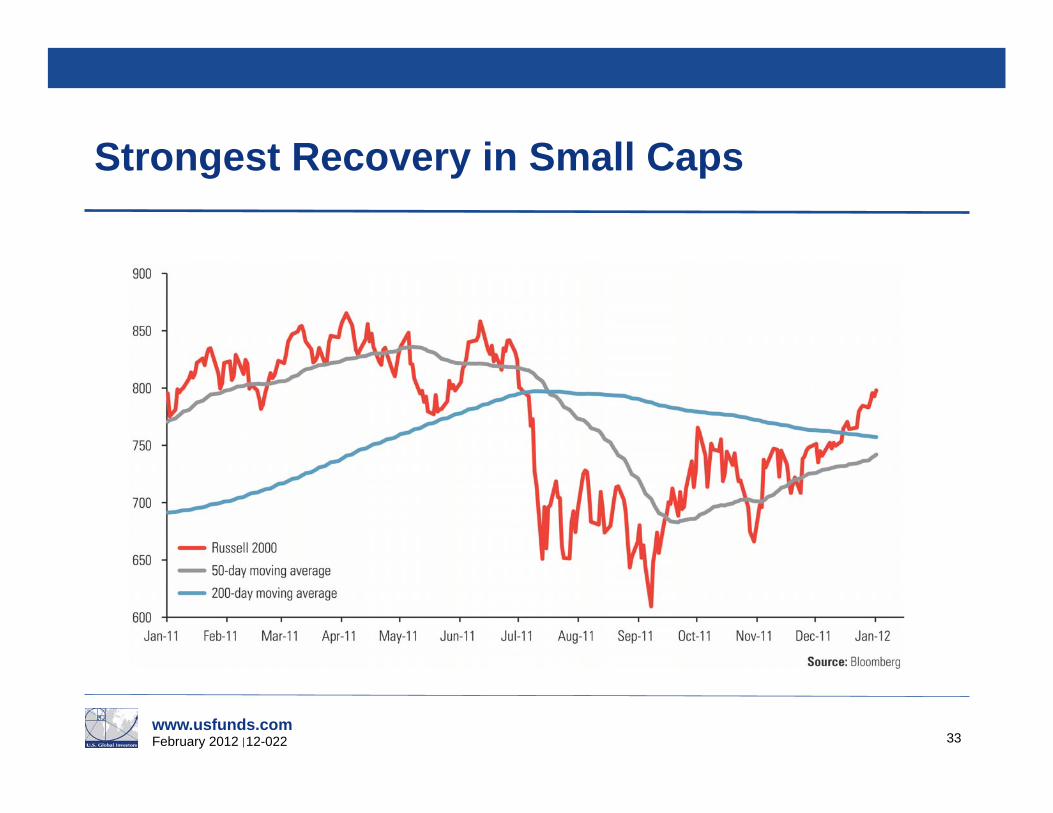
Strongest Recovery in Small Caps
33
www.usfunds.com February 2012 12-022
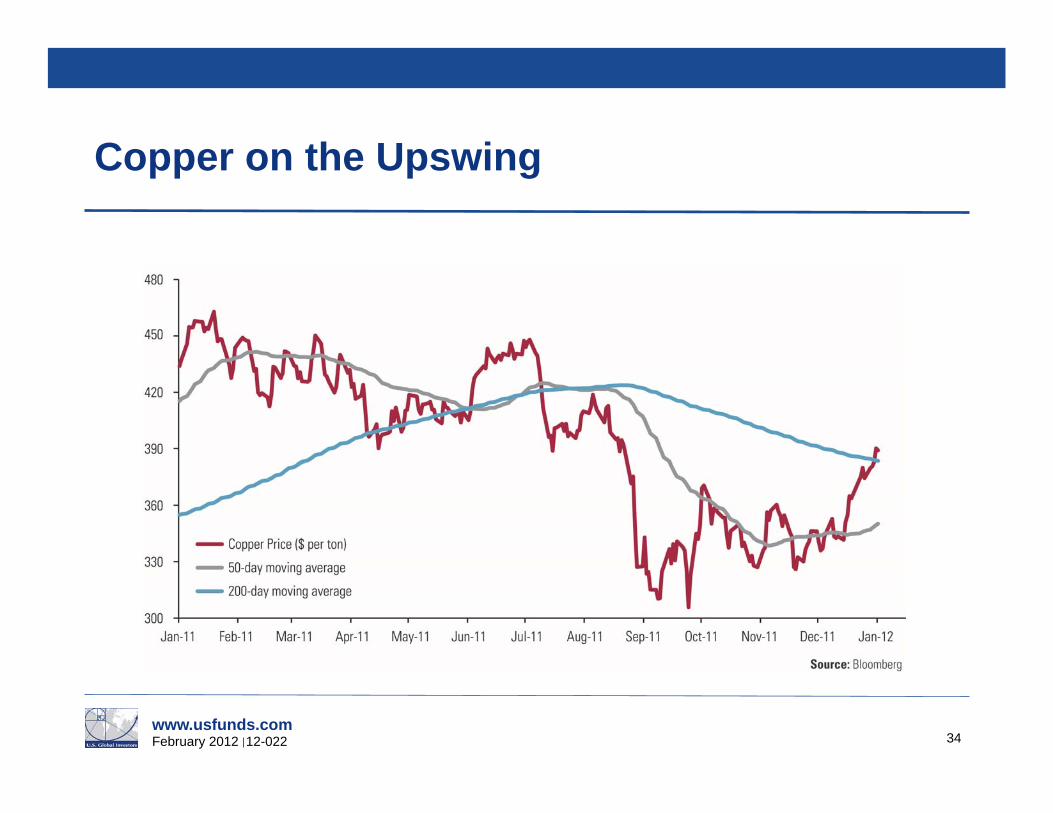
Copper on the Upswing
34

www.usfunds.com February 2012 12-022
Start of an Uptrend for Resources Stocks
35

www.usfunds.com February 2012 12-022
BRICs in Second Half of 2011 Declined Up to 30 Percent
36

www.usfunds.com February 2012 12-022
BRICs Rebound in January 2012
37

www.usfunds.com February 2012 12-022
What’s Driving 2012 Rebound?
Increasing Money Supply
Cuts in Interest Rates
Dropping Reserve Ratios for Banks
38

www.usfunds.com February 2012 12-022
Developed Countries Must Roll Over a Massive $8 Trillion in 2012 — Headwind
39

www.usfunds.com February 2012 12-022
Compare E7 vs G7 Money Supply Growth
40

www.usfunds.com February 2012 12-022
12 Month Rate of Change for Money Supply is Turning Bullish
41
www.usfunds.com February 2012 12-022
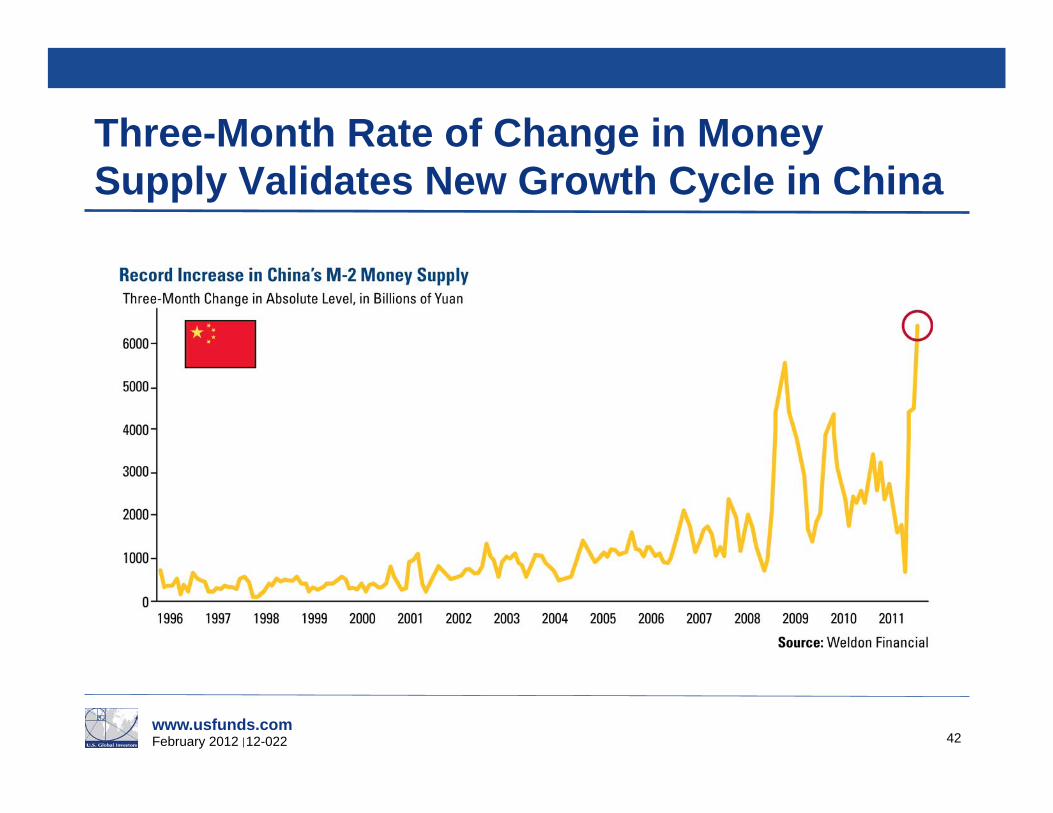
Three-Month Rate of Change in Money Supply Validates New Growth Cycle in China
42

www.usfunds.com February 2012 12-022
Global Money Supply Growth Highest in Over a Decade — Good for Resources
43

www.usfunds.com February 2012 12-022
The S-Curve – Big Question is Where Are We On The Curve?
44
The S-Curve is a type of curve that shows a rapid, exponential increase in growth for a period of time, followed by a tapering or leveling off.

www.usfunds.com February 2012 12-022
China/India Share of World GDP Increased Substantially
45

www.usfunds.com February 2012 12-022 46
Chindia – Rising Middle Class
Source: padanisaa.blogspot.com

www.usfunds.com February 2012 12-022
Bubble — Negative Press on China
47

www.usfunds.com February 2012 12-022
Stay Tuned to the Big S-Curve
48
2009 1966

www.usfunds.com February 2012 12-022 49
Massive Urbanization Trend in India and China
www.usfunds.com February 2012 12-022
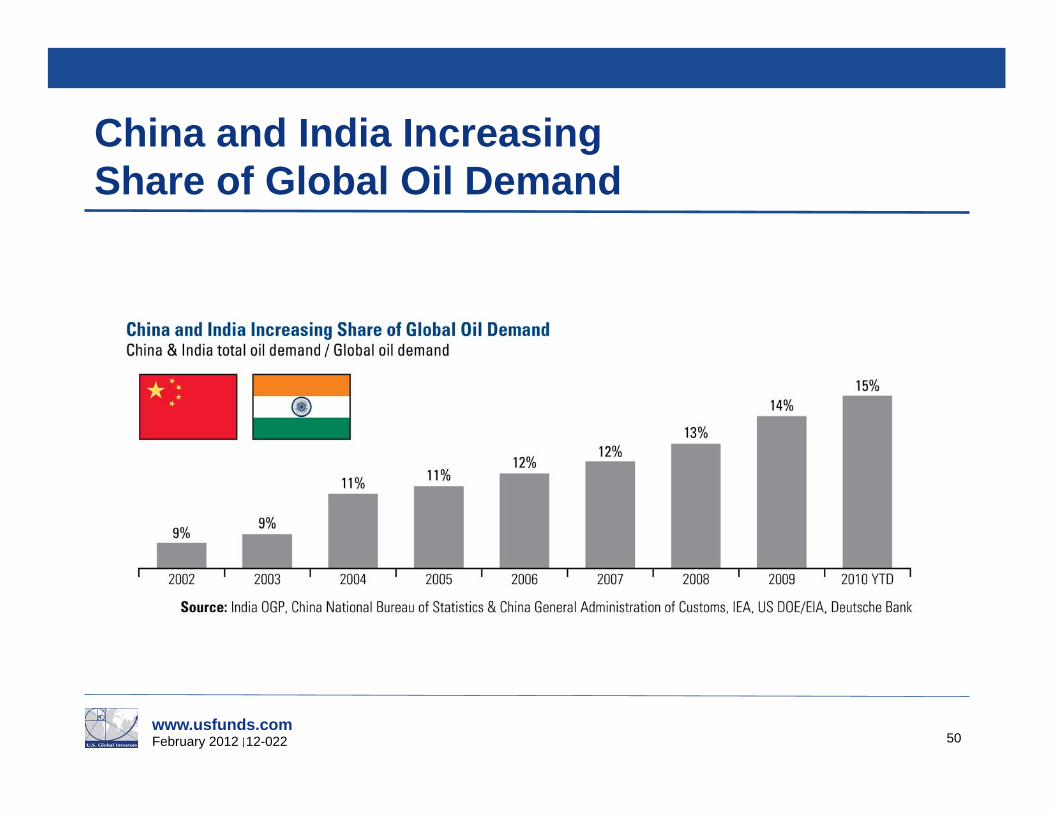
China and India Increasing Share of Global Oil Demand
50

www.usfunds.com February 2012 12-022
Gold “Love Trade” Strong Correlation Between Rising Incomes and Gold Price
51

www.usfunds.com February 2012 12-022
China’s Increasing Jewelry Demand
52
www.usfunds.com February 2012 12-022
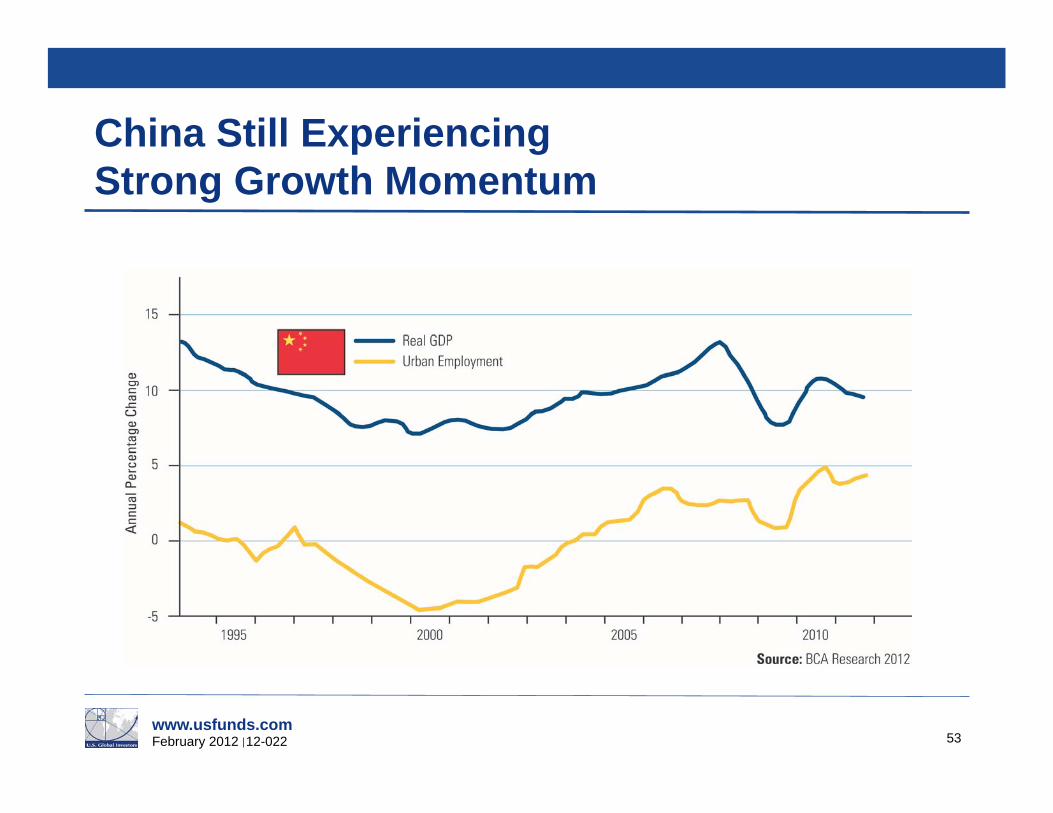
China Still Experiencing Strong Growth Momentum
53

www.usfunds.com February 2012 12-022
Industry Relocation — Going West and North
54

www.usfunds.com February 2012 12-022
Tipping Point Impact is About to Be Felt Quite Soon
55
High Speed Train, China

www.usfunds.com February 2012 12-022
Emerging High-Speed Rail Hub Cities
56
Frank Holmes High Speed Train, China

www.usfunds.com February 2012 12-022
Now, the High-Speed Rail Will Change Everything…
57

www.usfunds.com February 2012 12-022
Reasons for Active Money Management
58
Past performance does not guarantee future results.

www.usfunds.com February 2012 12-022
Reasons for Active Money Management
59
Returns are based on historical spot prices or futures prices. Past performance does not guarantee future results.

www.usfunds.com February 2012 12-022 60
Trying to Stop a Bull Market Has Risks

www.usfunds.com February 2012 12-022 61
Come Visit Us at…
Facebook: www.facebook.com/usfunds
Twitter: www.twitter.com/usfunds
Frank Talk: www.usfunds.com
Investor Alert: www.usfunds.com

www.usfunds.com February 2012 12-022
U.S. Global Investors is Mobile
62
Get Investor Alert and Frank Talk On the Go
Visit www.usfunds.com/apps
www.usfunds.com February 2012 12-022
For more information or questions, please contact our Investor Relations Department:
Ryan George 210.308.1268 [email protected]
63
Contact Us

www.usfunds.com February 2012 12-022 64
Disclosures
Please consider carefully a fund’s investment objectives, risks, charges and expenses. For this and other important information, obtain a fund prospectus by visiting www.usfunds.com or by calling 1-800-US-FUNDS (1-800-873-8637). Read it carefully before investing. Distributed by U.S. Global Brokerage, Inc.
All opinions expressed and data provided are subject to change without notice. Some of these opinions may not be appropriate to every investor.
Gold, precious metals, and precious minerals funds may be susceptible to adverse economic, political or regulatory developments due to concentrating in a single theme. The prices of gold, precious metals, and precious minerals are subject to substantial price fluctuations over short periods of time and may be affected by unpredicted international monetary and political policies. We suggest investing no more than 5% to 10% of your portfolio in these sectors.
Foreign and emerging market investing involves special risks such as currency fluctuation and less public disclosure, as well as economic and political risk. Because the Global Resources Fund concentrates its investments in a specific industry, the fund may be subject to greater risks and fluctuations than a portfolio representing a broader range of industries.
Although Lipper makes reasonable efforts to ensure the accuracy and reliability of the data contained herein, the accuracy is not guaranteed by Lipper. Users acknowledge that they have not relied upon any warranty, condition, guarantee, or representation made by Lipper. Any use of the data for analyzing, managing, or trading financial instruments is at the user's own risk. This is not an offer to buy or sell securities.
The NYSE Arca Gold BUGS (Basket of Unhedged Gold Stocks) Index (HUI) is a modified equal dollar weighted index of companies involved in gold mining. The HUI Index was designed to provide significant exposure to near term movements in gold prices by including companies that do not hedge their gold production beyond 1.5 years. The MSCI Emerging Markets Index is a free float-adjusted market capitalization index that is designed to measure equity market performance in the global emerging markets. The S&P 500 Stock Index is a widely recognized capitalization-weighted index of 500 common stock prices in U.S. companies.

www.usfunds.com February 2012 12-022 65
Disclosures
The S&P/TSX Venture Composite Index is a broad market indicator for the Canadian venture capital market. The index is market capitalization weighted and, at its inception, included 531 companies. A quarterly revision process is used to remove companies that comprise less than 0.05% of the weight of the index, and add companies whose weight, when included, will be greater than 0.05% of the index. The Shanghai Composite Index (SSE) is an index of all stocks that trade on the Shanghai Stock Exchange. The Bovespa Index (IBOV) is a total return index weighted by traded volume and is comprised of the most liquid stocks traded on the Sao Paulo Stock Exchange. The Bombay Stock Exchange Sensitive Index (Sensex) is a cap-weighted index. The selection of the index members has been made on the basis of liquidity, depth, and floating-stock-adjustment depth and industry representation. Sensex has a base date and value of 100 on 1978-1979. The index uses free float. The MICEX Index is the real-time cap-weighted Russian composite index. It comprises 30 most liquid stocks of Russian largest and most developed companies from 10 main economy sectors. The MICEX Index was launched on September 22, 1997, base value 100. The MICEX Index is calculated and disseminated by the MICEX Stock Exchange, the main Russian stock exchange.
The J.P. Morgan Global Purchasing Manager’s Index is an indicator of the economic health of the global manufacturing sector. The PMI index is based on five major indicators: new orders, inventory levels, production, supplier deliveries and the employment environment. The Russell 2000 Index is a U.S. equity index measuring the performance of the 2,000 smallest companies in the Russell 3000. The Russell 3000 Index consists of the 3,000 largest U.S. companies as determined by total market capitalization. The MSCI China Free Index is a capitalization weighted index that monitors the performance of stocks from the country of China. Standard deviation is a measure of the dispersion of a set of data from its mean. The more spread apart the data, the higher the deviation. Standard deviation is also known as historical volatility. M2 Money Supply is a broad measure of money supply that includes M1 in addition to all time-related deposits, savings deposits, and non-institutional money-market funds.
Holdings in the Gold and Precious Metals Fund, World Precious Minerals Fund and Global Resources Fund as a percentage of net assets as of 12/31/2011: Market Vectors Junior Gold Miners ETF 0.00%; SPDR S&P Global Natural Resources ETF 0.00%; McDonalds 0.00%; Starbucks 0.00%; Hermes 0.00%; Coach 0.00%; Yum Brands 0.00%; GE 0.00%; Freeport-McMoRan Copper & Gold (Global Resources Fund 2.18%).