Embed Size (px)
Citation preview
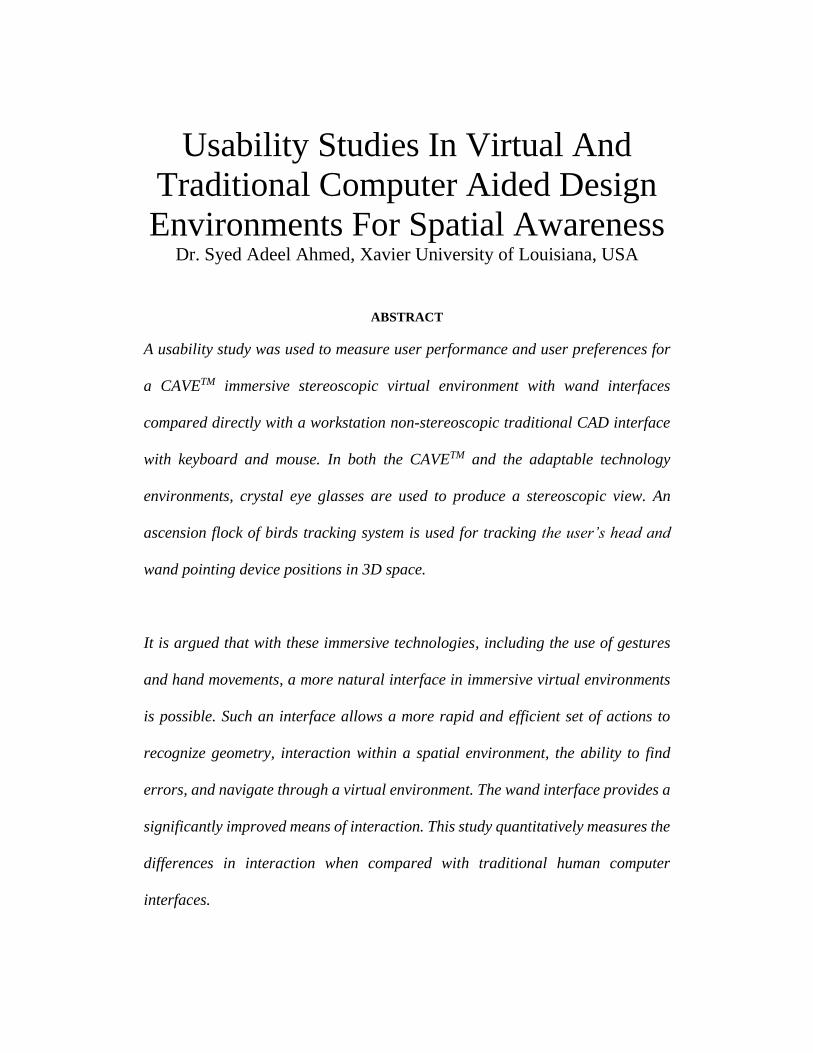
Usability Studies In Virtual And
Traditional Computer Aided Design
Environments For Spatial Awareness Dr. Syed Adeel Ahmed, Xavier University of Louisiana, USA
ABSTRACT
A usability study was used to measure user performance and user preferences for
a CAVETM immersive stereoscopic virtual environment with wand interfaces
compared directly with a workstation non-stereoscopic traditional CAD interface
with keyboard and mouse. In both the CAVETM and the adaptable technology
environments, crystal eye glasses are used to produce a stereoscopic view. An
ascension flock of birds tracking system is used for tracking the user’s head and
wand pointing device positions in 3D space.
It is argued that with these immersive technologies, including the use of gestures
and hand movements, a more natural interface in immersive virtual environments
is possible. Such an interface allows a more rapid and efficient set of actions to
recognize geometry, interaction within a spatial environment, the ability to find
errors, and navigate through a virtual environment. The wand interface provides a
significantly improved means of interaction. This study quantitatively measures the
differences in interaction when compared with traditional human computer
interfaces.
This paper provides analysis via usability study methods for spatial awareness
termed as Benchmark 3. During testing, testers are given some time to “play
around” with the CAVETM environment for familiarity before undertaking a
specific exercise. The testers are then instructed regarding tasks to be completed,
and are asked to work quickly without sacrificing accuracy. The research team
timed each task, and recorded activity on evaluation sheets for spatial awareness
Test. At the completion of the testing scenario involving spatial awareness, the
subject/testers were given a survey document and asked to respond by checking
boxes to communicate their subjective opinions.
Keywords: Usability Analysis; CAVETM (Cave Automatic Virtual Environments); Human
Computer Interface (HCI); Benchmark; Virtual Reality; Virtual Environments; Competitive
Comparison
INTRODUCTION
his paper is an extension of the work done by Satter (2005) on Competitive Usability
Studies of Virtual Environments for Shipbuilding. The key difference is the use of a
new immersive environment called CAVETM. The significance and the detail description of this
study is very well explained by Satter (2012) in his recent paper. Here we only present the details
of this usability study. The CAVETM was developed at the University of Illinois at Chicago and
provides the illusion of immersion by projecting stereo images on the walls and floor of a room-
sized cube. Several users wearing lightweight stereo glasses can enter and walk freely inside the
CAVETM. A head tracking system continuously adjusts the stereo projection to the current position
of the leading viewer. A CAVETM and wand system schematic is shown in Figures 1 & 2.
T

Figure 1: Schematic of the CAVETM System Figure 2: The Wand Interface
1. Description
In order to evaluate the ability of each environment/interface to aid users in their awareness of a
design space, a unique space, totally unknown to the users, was created. For the test, the space
created was a virtual factory space and a machine shop. Into this space the test administrators
were able to inject an obelisk icon (an elongated, gray-white, pyramid topped by a sphere as shown
below in figure 3) that is not normally found in any factory space. Two such icons were randomly
placed into the new space for each pass of the test. From a common starting point, users were
required to navigate through the space looking for the icons within the space. The time required
each user to locate each icon was recorded and the users were asked to note the location for each
(placement within the space).
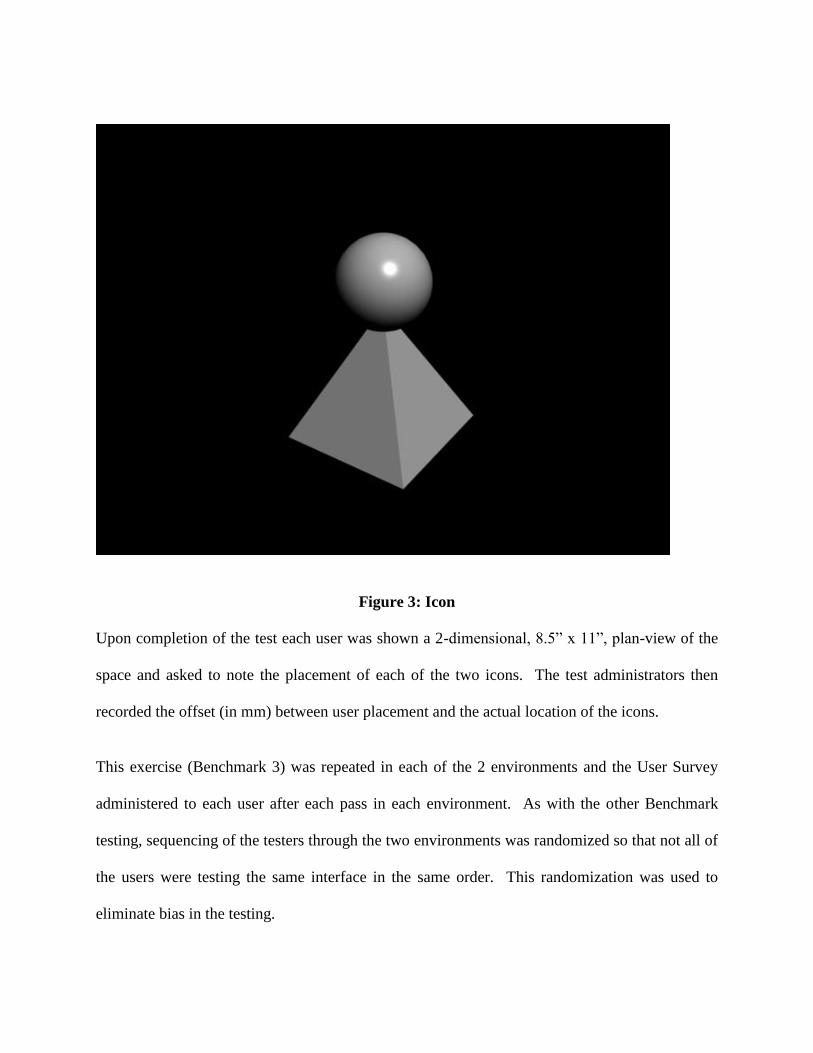
Figure 3: Icon
Upon completion of the test each user was shown a 2-dimensional, 8.5” x 11”, plan-view of the
space and asked to note the placement of each of the two icons. The test administrators then
recorded the offset (in mm) between user placement and the actual location of the icons.
This exercise (Benchmark 3) was repeated in each of the 2 environments and the User Survey
administered to each user after each pass in each environment. As with the other Benchmark
testing, sequencing of the testers through the two environments was randomized so that not all of
the users were testing the same interface in the same order. This randomization was used to
eliminate bias in the testing.
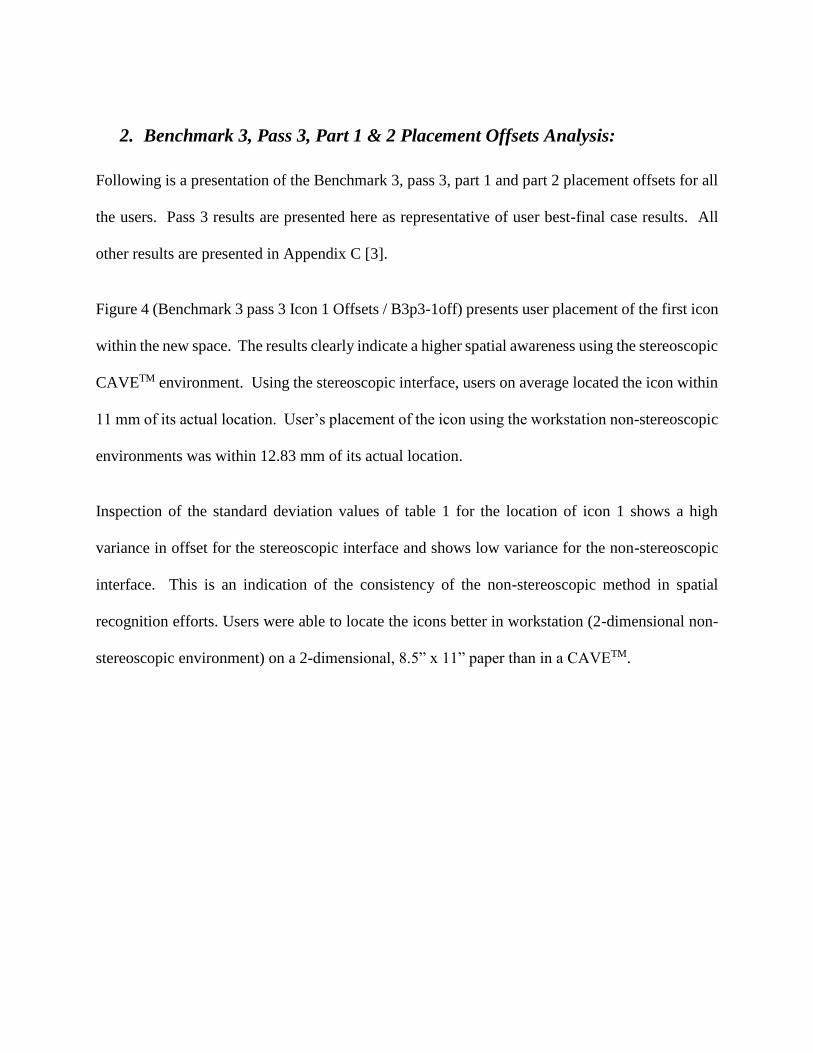
2. Benchmark 3, Pass 3, Part 1 & 2 Placement Offsets Analysis:
Following is a presentation of the Benchmark 3, pass 3, part 1 and part 2 placement offsets for all
the users. Pass 3 results are presented here as representative of user best-final case results. All
other results are presented in Appendix C [3].
Figure 4 (Benchmark 3 pass 3 Icon 1 Offsets / B3p3-1off) presents user placement of the first icon
within the new space. The results clearly indicate a higher spatial awareness using the stereoscopic
CAVETM environment. Using the stereoscopic interface, users on average located the icon within
11 mm of its actual location. User’s placement of the icon using the workstation non-stereoscopic
environments was within 12.83 mm of its actual location.
Inspection of the standard deviation values of table 1 for the location of icon 1 shows a high
variance in offset for the stereoscopic interface and shows low variance for the non-stereoscopic
interface. This is an indication of the consistency of the non-stereoscopic method in spatial
recognition efforts. Users were able to locate the icons better in workstation (2-dimensional non-
stereoscopic environment) on a 2-dimensional, 8.5” x 11” paper than in a CAVETM.
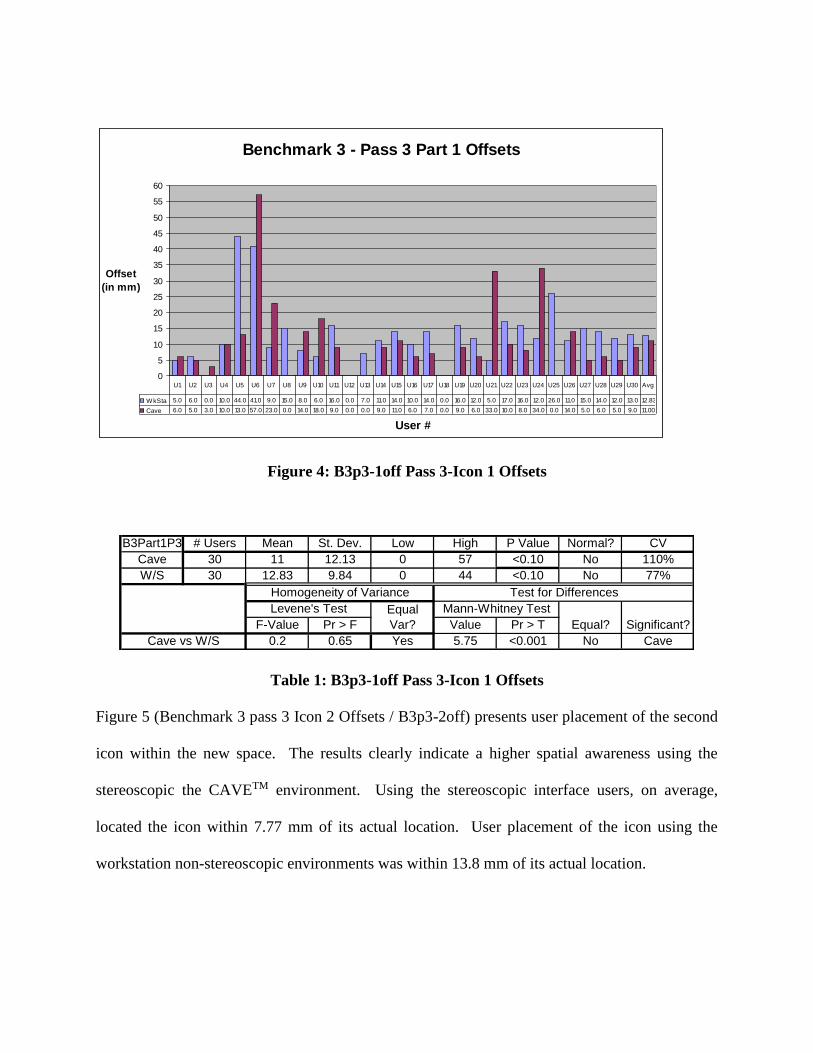
Figure 4: B3p3-1off Pass 3-Icon 1 Offsets
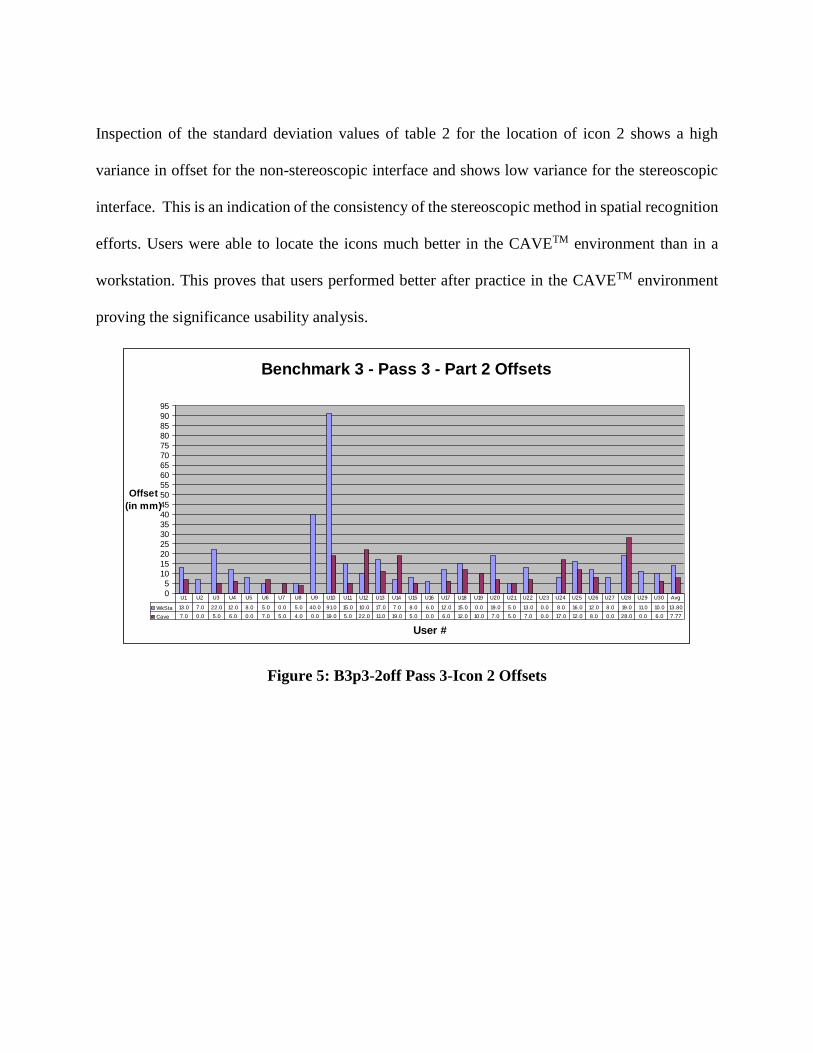
Table 1: B3p3-1off Pass 3-Icon 1 Offsets
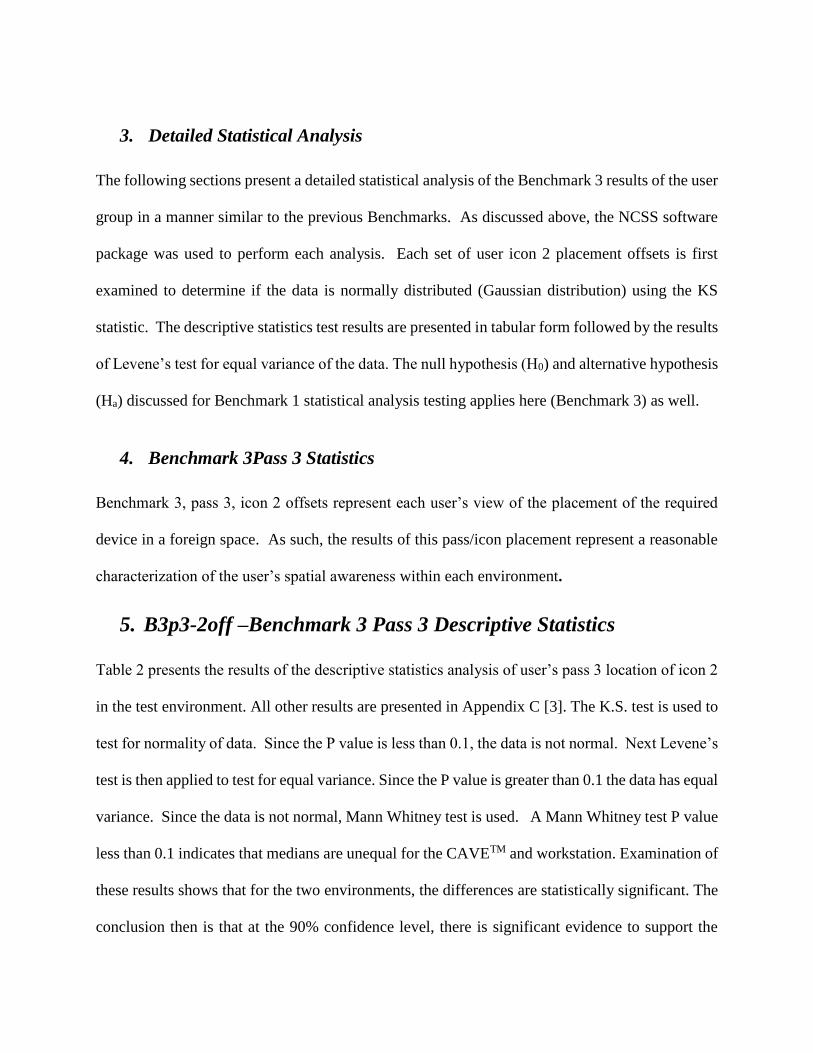
Figure 5 (Benchmark 3 pass 3 Icon 2 Offsets / B3p3-2off) presents user placement of the second
icon within the new space. The results clearly indicate a higher spatial awareness using the
stereoscopic the CAVETM environment. Using the stereoscopic interface users, on average,
located the icon within 7.77 mm of its actual location. User placement of the icon using the
workstation non-stereoscopic environments was within 13.8 mm of its actual location.
Benchmark 3 - Pass 3 Part 1 Offsets
0
5
10
15
20
25
30
35
40
45
50
55
60
User #
Offset
(in mm)
W kSta 5.0 6.0 0.0 10.0 44.0 41.0 9.0 15.0 8.0 6.0 16.0 0.0 7.0 11.0 14.0 10.0 14.0 0.0 16.0 12.0 5.0 17.0 16.0 12.0 26.0 11.0 15.0 14.0 12.0 13.0 12.83
Cave 6.0 5.0 3.0 10.0 13.0 57.0 23.0 0.0 14.0 18.0 9.0 0.0 0.0 9.0 11.0 6.0 7.0 0.0 9.0 6.0 33.0 10.0 8.0 34.0 0.0 14.0 5.0 6.0 5.0 9.0 11.00
U1 U2 U3 U4 U5 U6 U7 U8 U9 U10 U11 U12 U13 U14 U15 U16 U17 U18 U19 U20 U21 U22 U23 U24 U25 U26 U27 U28 U29 U30 Avg
B3Part1P3 # Users Mean St. Dev. Low High P Value Normal? CV
Cave 30 11 12.13 0 57 <0.10 No 110%
W/S 30 12.83 9.84 0 44 <0.10 No 77%
F-Value Pr > F Value Pr > T
0.2 0.65 Yes 5.75 <0.001 No Cave
Homogeneity of Variance Test for Differences
Levene's Test Equal
Var?
Mann-Whitney Test
Equal? Significant?
Cave vs W/S
Inspection of the standard deviation values of table 2 for the location of icon 2 shows a high
variance in offset for the non-stereoscopic interface and shows low variance for the stereoscopic
interface. This is an indication of the consistency of the stereoscopic method in spatial recognition
efforts. Users were able to locate the icons much better in the CAVETM environment than in a
workstation. This proves that users performed better after practice in the CAVETM environment
proving the significance usability analysis.
Figure 5: B3p3-2off Pass 3-Icon 2 Offsets
Benchmark 3 - Pass 3 - Part 2 Offsets
0
5
10
15
20
25
30
35
40
45
50
55
60
65
70
75
80
85
90
95
User #
Offset
(in mm)
WkSta 13.0 7.0 22.0 12.0 8.0 5.0 0.0 5.0 40.0 91.0 15.0 10.0 17.0 7.0 8.0 6.0 12.0 15.0 0.0 19.0 5.0 13.0 0.0 8.0 16.0 12.0 8.0 19.0 11.0 10.0 13.80
Cave 7.0 0.0 5.0 6.0 0.0 7.0 5.0 4.0 0.0 19.0 5.0 22.0 11.0 19.0 5.0 0.0 6.0 12.0 10.0 7.0 5.0 7.0 0.0 17.0 12.0 8.0 0.0 28.0 0.0 6.0 7.77
U1 U2 U3 U4 U5 U6 U7 U8 U9 U10 U11 U12 U13 U14 U15 U16 U17 U18 U19 U20 U21 U22 U23 U24 U25 U26 U27 U28 U29 U30 Avg
3. Detailed Statistical Analysis
The following sections present a detailed statistical analysis of the Benchmark 3 results of the user
group in a manner similar to the previous Benchmarks. As discussed above, the NCSS software
package was used to perform each analysis. Each set of user icon 2 placement offsets is first
examined to determine if the data is normally distributed (Gaussian distribution) using the KS
statistic. The descriptive statistics test results are presented in tabular form followed by the results
of Levene’s test for equal variance of the data. The null hypothesis (H0) and alternative hypothesis
(Ha) discussed for Benchmark 1 statistical analysis testing applies here (Benchmark 3) as well.
4. Benchmark 3Pass 3 Statistics
Benchmark 3, pass 3, icon 2 offsets represent each user’s view of the placement of the required
device in a foreign space. As such, the results of this pass/icon placement represent a reasonable
characterization of the user’s spatial awareness within each environment.
5. B3p3-2off –Benchmark 3 Pass 3 Descriptive Statistics
Table 2 presents the results of the descriptive statistics analysis of user’s pass 3 location of icon 2
in the test environment. All other results are presented in Appendix C [3]. The K.S. test is used to
test for normality of data. Since the P value is less than 0.1, the data is not normal. Next Levene’s
test is then applied to test for equal variance. Since the P value is greater than 0.1 the data has equal
variance. Since the data is not normal, Mann Whitney test is used. A Mann Whitney test P value
less than 0.1 indicates that medians are unequal for the CAVETM and workstation. Examination of
these results shows that for the two environments, the differences are statistically significant. The
conclusion then is that at the 90% confidence level, there is significant evidence to support the
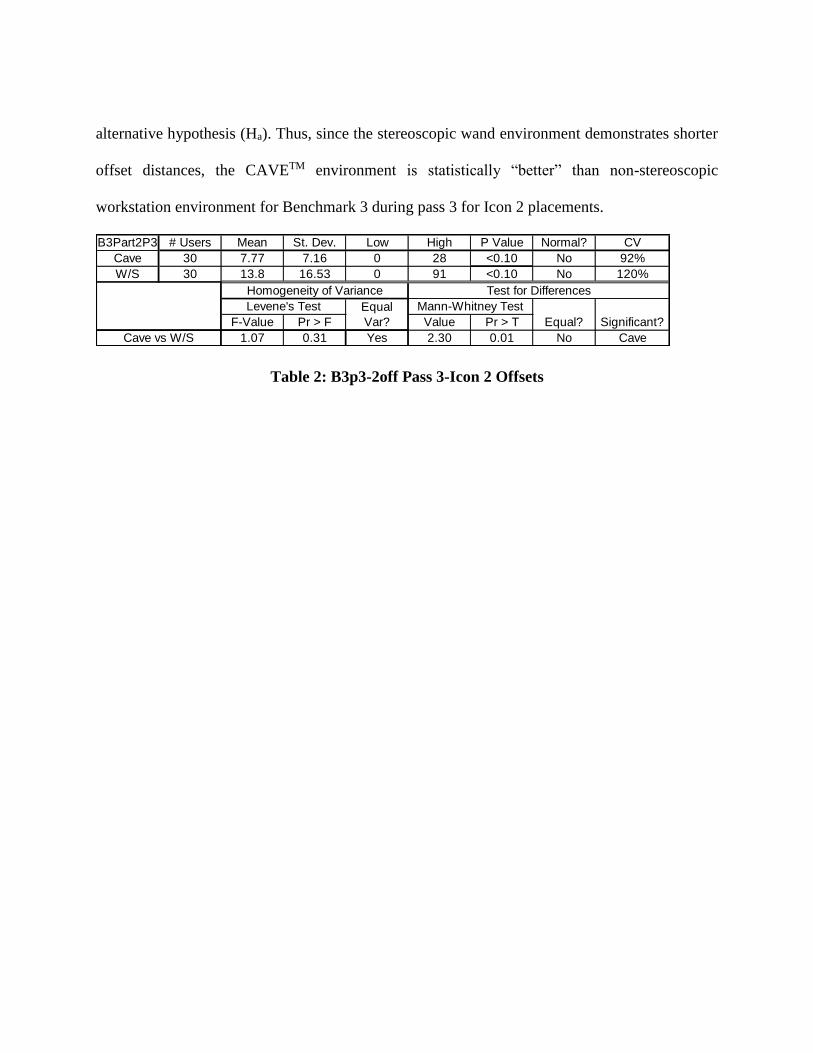
alternative hypothesis (Ha). Thus, since the stereoscopic wand environment demonstrates shorter
offset distances, the CAVETM environment is statistically “better” than non-stereoscopic
workstation environment for Benchmark 3 during pass 3 for Icon 2 placements.
Table 2: B3p3-2off Pass 3-Icon 2 Offsets
B3Part2P3 # Users Mean St. Dev. Low High P Value Normal? CV
Cave 30 7.77 7.16 0 28 <0.10 No 92%
W/S 30 13.8 16.53 0 91 <0.10 No 120%
F-Value Pr > F Value Pr > T
1.07 0.31 Yes 2.30 0.01 No CaveCave vs W/S
Homogeneity of Variance Test for Differences
Levene's Test Equal
Var?
Mann-Whitney Test
Equal? Significant?
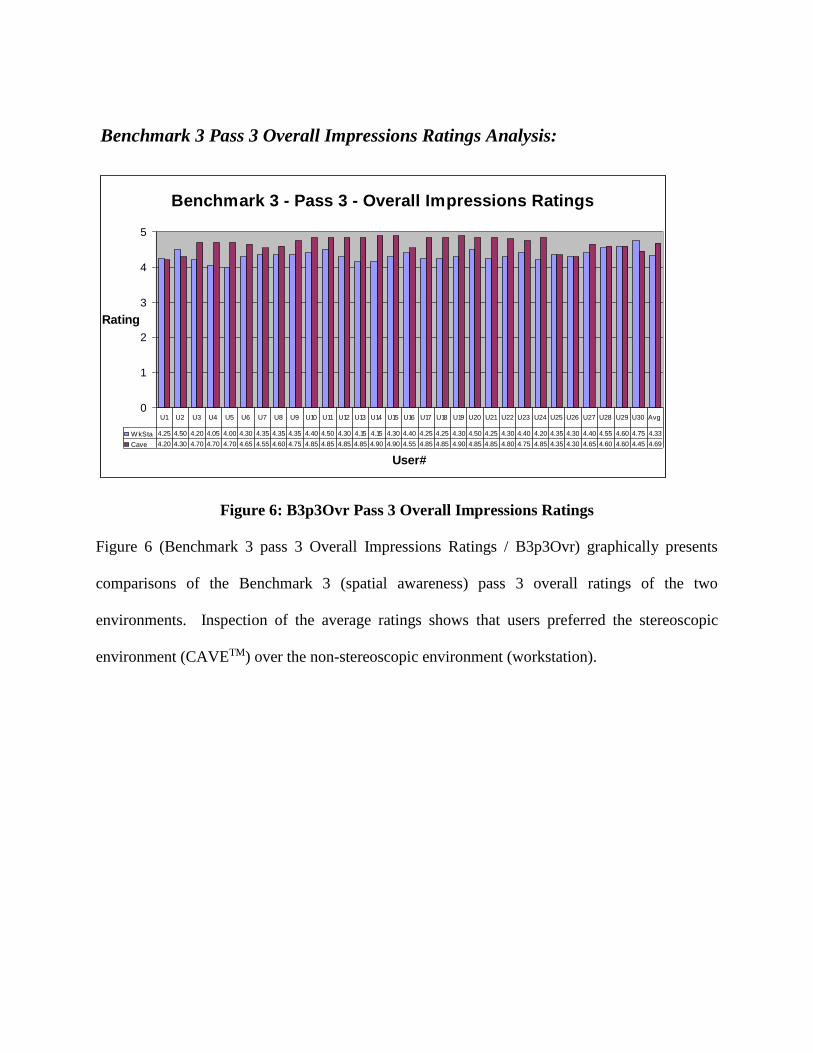
Benchmark 3 Pass 3 Overall Impressions Ratings Analysis:
Figure 6: B3p3Ovr Pass 3 Overall Impressions Ratings
Figure 6 (Benchmark 3 pass 3 Overall Impressions Ratings / B3p3Ovr) graphically presents
comparisons of the Benchmark 3 (spatial awareness) pass 3 overall ratings of the two
environments. Inspection of the average ratings shows that users preferred the stereoscopic
environment (CAVETM) over the non-stereoscopic environment (workstation).
Benchmark 3 - Pass 3 - Overall Impressions Ratings
0
1
2
3
4
5
User#
Rating
W kSta 4.25 4.50 4.20 4.05 4.00 4.30 4.35 4.35 4.35 4.40 4.50 4.30 4.15 4.15 4.30 4.40 4.25 4.25 4.30 4.50 4.25 4.30 4.40 4.20 4.35 4.30 4.40 4.55 4.60 4.75 4.33
Cave 4.20 4.30 4.70 4.70 4.70 4.65 4.55 4.60 4.75 4.85 4.85 4.85 4.85 4.90 4.90 4.55 4.85 4.85 4.90 4.85 4.85 4.80 4.75 4.85 4.35 4.30 4.65 4.60 4.60 4.45 4.69
U1 U2 U3 U4 U5 U6 U7 U8 U9 U10 U11 U12 U13 U14 U15 U16 U17 U18 U19 U20 U21 U22 U23 U24 U25 U26 U27 U28 U29 U30 Avg
6. Detailed Statistical Analysis
The following sections present a detailed statistical analysis of user overall impressions ratings of
the two test environments following their 3rd and final pass of the Benchmark 3 scenario. All
other results are presented in Appendix C[3] . The statistical analysis of these ratings provides
insight into the final opinions of the users. As discussed above, the NCSS software package was
used to perform each analysis. Each set of user overall impressions ratings is first examined to
determine if the data are normally distributed (Gaussian distribution) using the KS statistic. The
descriptive statistics test results are presented in tabular form followed by the results of Levene’s
test for equal variance of the data. The null hypothesis (H0) and alternative hypothesis (Ha)
discussed for Benchmark 1and 2 statistical analysis testing applies here (Benchmark 3) as well.
7. Benchmark 3 Pass 3 Overall Impressions Ratings Statistics
As noted, Benchmark 3, pass 3, overall impressions ratings represent each user’s view of the
placement of the required device in a foreign space. As such, these ratings represent a reasonable
characterization of the user’s overall impressions of the interfaces after the use of each to determine
his/her spatial awareness of a previously unknown environment.
Table 3 presents the results of the descriptive statistics analysis of user’s Benchmark 3 pass 3
overall impressions of the interface. The K.S. test is used to test for normality of data. Since the
P value is less than 0.1 for the CAVETM, the data are not normal. Levene’s test is used to test for
equal variance and since the P value is greater than 0.1 the data have equal variance. Since the
data is not normal, Mann Whitney test is used. With the Mann-Whitney test P value less than 0.1,
which indicates that the medians are unequal for the CAVETM and workstation. Examination of
these results shows that for the two environments, the differences are statistically significant. The
conclusion then is that at the 90% confidence level, there is significant evidence to support the
alternative hypothesis (Ha). This proves that the CAVETM environment is preferred over
workstation for Benchmark 3 pass 3 overall impressions subjective ratings.
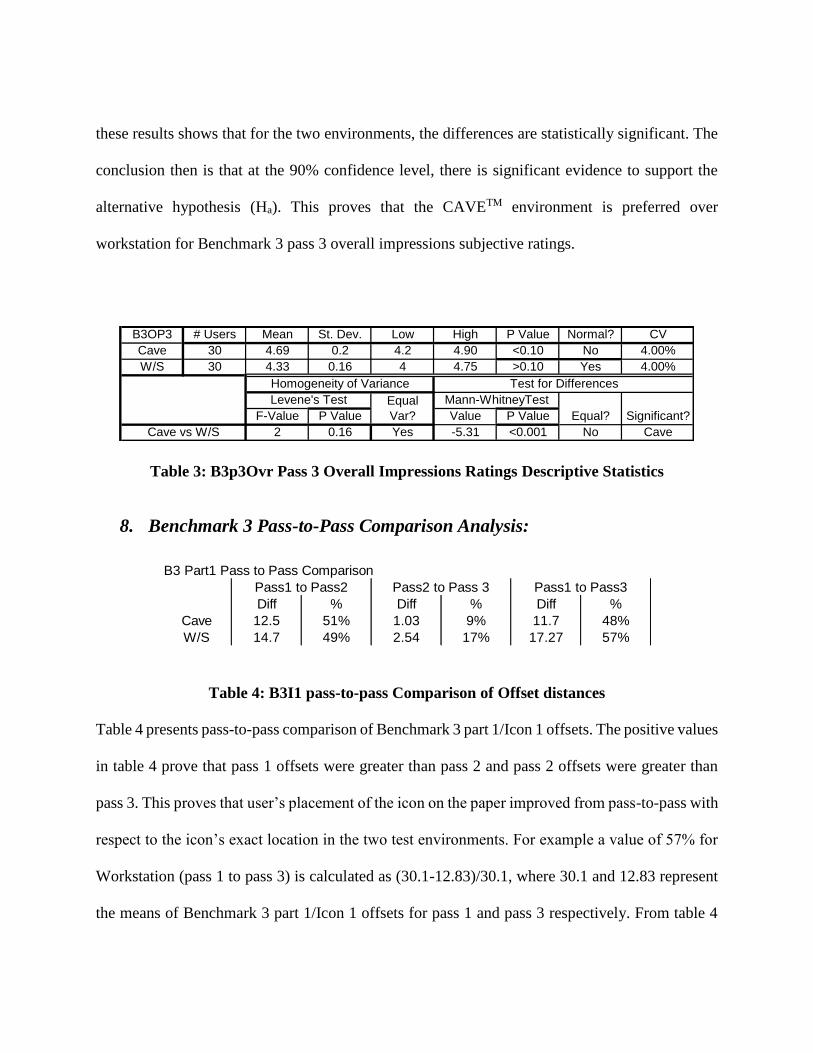
Table 3: B3p3Ovr Pass 3 Overall Impressions Ratings Descriptive Statistics
8. Benchmark 3 Pass-to-Pass Comparison Analysis:
Table 4: B3I1 pass-to-pass Comparison of Offset distances
Table 4 presents pass-to-pass comparison of Benchmark 3 part 1/Icon 1 offsets. The positive values
in table 4 prove that pass 1 offsets were greater than pass 2 and pass 2 offsets were greater than
pass 3. This proves that user’s placement of the icon on the paper improved from pass-to-pass with
respect to the icon’s exact location in the two test environments. For example a value of 57% for
Workstation (pass 1 to pass 3) is calculated as (30.1-12.83)/30.1, where 30.1 and 12.83 represent
the means of Benchmark 3 part 1/Icon 1 offsets for pass 1 and pass 3 respectively. From table 4
B3OP3 # Users Mean St. Dev. Low High P Value Normal? CV
Cave 30 4.69 0.2 4.2 4.90 <0.10 No 4.00%
W/S 30 4.33 0.16 4 4.75 >0.10 Yes 4.00%
F-Value P Value Value P Value
2 0.16 Yes -5.31 <0.001 No Cave
Homogeneity of Variance Test for Differences
Levene's Test Equal
Var?
Mann-WhitneyTest
Equal? Significant?
Cave vs W/S
B3 Part1 Pass to Pass Comparison
Diff % Diff % Diff %
Cave 12.5 51% 1.03 9% 11.7 48%
W/S 14.7 49% 2.54 17% 17.27 57%
Pass1 to Pass2 Pass2 to Pass 3 Pass1 to Pass3

one can conclude that user’s showed more improvement from pass to pass in workstation than in
CAVETM. This is due to the fact that users were able to place the icons better in workstation (2-
dimensional non-stereoscopic environment) on a 2-dimensional, 8.5” x 11” paper than in a
CAVETM.
Table 5: B3I2 pass-to-pass Comparison of Offset distances
Table 5 (Benchmark 3 Icon 2 or part 2 pass-to-pass comparison / B3I2) presents pass-to-pass
comparison of Benchmark 3 part 2/Icon 2 offsets. The positive values in table 5 prove that pass 1
offsets were greater than pass 2 and pass 2 offsets were greater than pass 3. For example a value
of 51% for Workstation (pass 1 to pass 3) is calculated as (28.53-13.8)/28.53, where 28.53 and
13.8 represent the means of Benchmark 3 part 2/Icon 2 offsets for pass 1 and pass 3 respectively.
From table 5 one can conclude that user’s showed more improvement from pass to pass in
workstation than in the CAVETM. This is due to the fact that users were able to place the icons
better in workstation (2-dimensional non-stereoscopic environment) on a 2-dimensional, 8.5” x
11” paper than in a CAVETM.
Table 6: B3 Overall Impressions Ratings pass to pass Comparison
B3 Part2 Pass to Pass Comparison
Diff % Diff % Diff %
Cave 4.5 35% 0.53 6% 5.03 39%
W/S 11 39% 3.7 21% 14.6 51%
Pass1 to Pass2 Pass2 to Pass 3 Pass1 to Pass3
B3 Overall Ratings Pass to Pass Comparison
Diff % Diff % Diff %
Cave -0.82 -23% -0.33 -8% -1.15 -32%
W/S -0.24 7% -0.71 -20% -0.95 -28%
Pass1 to Pass2 Pass2 to Pass 3 Pass1 to Pass3
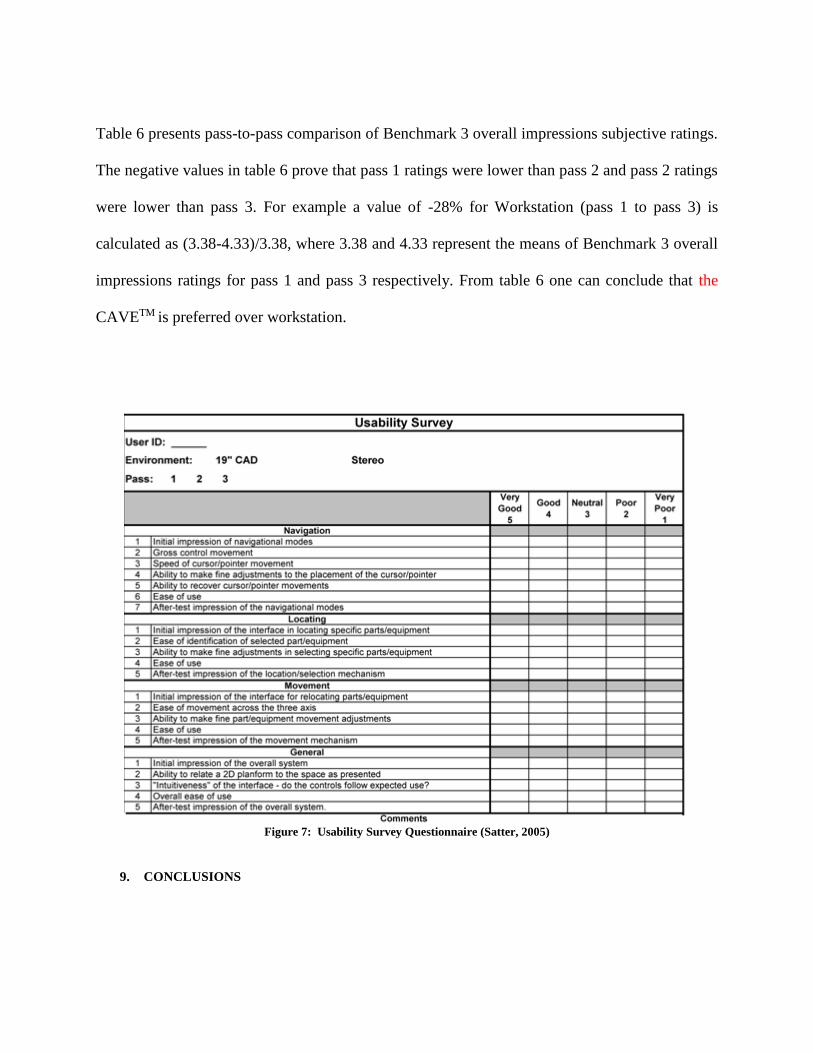
Table 6 presents pass-to-pass comparison of Benchmark 3 overall impressions subjective ratings.
The negative values in table 6 prove that pass 1 ratings were lower than pass 2 and pass 2 ratings
were lower than pass 3. For example a value of -28% for Workstation (pass 1 to pass 3) is
calculated as (3.38-4.33)/3.38, where 3.38 and 4.33 represent the means of Benchmark 3 overall
impressions ratings for pass 1 and pass 3 respectively. From table 6 one can conclude that the
CAVETM is preferred over workstation.
Figure 7: Usability Survey Questionnaire (Satter, 2005)
9. CONCLUSIONS
For Benchmark 3 (spatial awareness) the statistics shows better results (lower offset distances and
higher subjective ratings) for the CAVETM in both objective and subjective measures than the
workstation. We prove that the CAVETM is preferred over workstation by users.
AUTHOR INFORMATION
Syed Adeel Ahmed, Ph.D., Xavier University of Louisiana, 1 Drexel Dr., New Orleans, LA
70125. He is an Assistant Professor of Management at Xavier University of Louisiana and
Editor/Reviewer of UJEEE at HRPUB. E-mail: [email protected] or
[email protected] (Corresponding author)
References
1. Number Cruncher Statistical System (NCSS software, 2004)
2. K. M. Satter, "Competitive Usability Studies of Virtual Environments for Shipbuilding."
PhD Dissertation, Engineering Management, University of New Orleans, 2005.
3. Syed Adeel Ahmed, “Usability Studies with Virtual and Traditional Computer Aided
Design Environments." PhD Dissertation, Engineering Management, University of New
Orleans, 2006.
4. Kurt Satter and Alley Butler, ”Finding the Value of Immersive, Virtual Environments
Using Competitive Usability Analysis”, Transactions of the ASME, Journal of Computing
and Information Science in Engineering, June 2012, Vol, 12.
5. Dr. Syed Adeel Ahmed, & Dr. Kurt M. Satter, (2013), Usability Studies in Virtual and
Traditional Computer Aided Design Environments for Benchmark 1 (Navigation),
International Journal of information Management & Information Systems, Vol.17, number
4. http://www.cluteinstitute.com/ojs/index.php/IJMIS/article/view/8096