Embed Size (px)
Citation preview

User Manual
User Manual
Georgia SPLOST Database & Clearinghouse for Transportation Finance
Prepared by:
Center for Quality Growth and Regional Development
Georgia Institute of Technology College of Architecture
Center for Geographic Information Systems (CGIS)
Georgia Institute of Technology College of Architecture

User Manual
Center for Quality Growth and Regional Development Georgia Institute of Technology
College of Architecture Center Director: Catherine L. Ross, Ph.D., Harry West Professor
760 Spring Street, Suite 213 Atlanta, GA 30308 P: 404.385.5133 F: 404.385.5127
E: [email protected] W: www.cqgrd.gatech.edu
Principal Investigator:
Catherine L. Ross, Ph.D., Director, Center for Quality Growth and Regional Development (CQGRD)
Sponsor:
This project was made possible through generous support from the Woodruff Foundation.
Investigators: Bumseok Chun, Ph.D., Post-Doctoral Researcher, Center for GIS
Weston Clarke, Ph.D., Public Service Associate, Carl Vinson Institute of Government
Subhro Guhathakurta, Ph.D., Director, Center for Geographic Information Systems (GIS)
David Jung-Hwi Lee, Ph.D., Research Scientist II, Center for Quality Growth and Regional Development
Sarah Smith, Research Scientist II, Center for Quality Growth and Regional Development
Research Assistants: Alexandra Frackelton, Anna Harkness, Peter Hylton, Yun Sang Lee, Vignesh Rathinasamy Somasundaram
The contents of this report reflect the views of the authors who are responsible for the facts and the accuracy of the data presented herein. The contents do not necessarily reflect the official views or policies of the Georgia Department of Transportation or the Woodruff Foundation. This report does not constitute a standard, specification, or regulation.

Table of Contents
i
Table of Contents Table of Contents ........................................................................................................................................... i
List of Figures ............................................................................................................................................. i
1. Introduction ............................................................................................................................................... 1
1.1 History of the Project ........................................................................................................................... 1
2. Research Project Team ............................................................................................................................ 3
2.1 Project Team ....................................................................................................................................... 3
3. Research Objectives and Methodology .................................................................................................... 4
3.1 Research Objectives ........................................................................................................................... 4
3.2 Methodology ........................................................................................................................................ 4
4. Project Methods (Detailed Site Development Procedure) ........................................................................ 5
4.1 Construction of the Information Database for Georgia SPLOST ........................................................ 5
5. Using the Site ............................................................................................................................................ 7
5.1 Filter Options ....................................................................................................................................... 7
5.2 Sample Queries ................................................................................................................................... 8
6. Policy Implications and Conclusion ......................................................................................................... 11
6.1 Implications for Policy, Research and Practice ................................................................................. 11
6.2 Conclusion ......................................................................................................................................... 11
7. References .............................................................................................................................................. 12
Appendix A: Data Sources .......................................................................................................................... 13
Description of Data Provided by the Carl Vinson Institute of Government ............................................. 13
Appendix B: Variables ................................................................................................................................. 14
City Revenue and Expenditure Data 1985 to 2010 ................................................................................. 14
Variables Included on the Georgia SPLOST Clearinghouse Website .................................................... 14
ListofFigures
Figure 1: Concept map for the SPLOST data clearinghouse. ...................................................................... 4 Figure 2: Image showing the design of user interface .................................................................................. 7 Figure 3: Existing SPLOSTs Query, Gwinnett County .................................................................................. 8 Figure 4: Education SPLOSTs, July 2010 .................................................................................................... 9 Figure 5: SPLOST revenue query, Gwinnett County .................................................................................. 10 Figure 6: Housing Query, Gwinnett County ................................................................................................ 10
Section 1 Introduction
1
1. Introduction
1.1HistoryoftheProject
Historically motor-fuel taxes have been the primary source of funding for transportation infrastructure projects in the United States. However, revenues from the motor-fuel taxes have increasingly not been sufficient to meet the demand for needed transportation projects (Saginor, Dumbaugh, and Ellis, 2011). Since raising the statewide gasoline tax is politically difficult, many local governments seek alternative funding sources, such as sales taxes, property taxes, bonds, and user fees (Crabbe et al., 2005). These funding options are approved by voters through ballot measures. These ballot measures have resulted in additional funding for transportation infrastructure at both the local and regional levels throughout the United States (Transportation Research Board, 2009). For example, between 2000 and 2005, more than $70 billion of transportation investments were approved by voters in regions throughout 33 different states in the U.S. The trend to approve these measures is a result of citizens’ willingness to pay increased sales taxes, property taxes, and other user fees to develop or maintain improved transportation systems at the local and regional level (Center for Transportation Excellence, 2006). At the same time, financing transportation through voter-approved ballot measures has been an important issue in transportation planning and investment since it provides a critical supplemental funding mechanism for these projects. Strategies to gain a clear understanding of the factors that influence the success rates of these initiatives are necessary.
In Georgia, the Special Purpose Local Option Sales Tax (SPLOST) has been in place since 1985, enabling counties to levy a one percent sales tax to support a variety of local capital projects, such as the development of road, street, bridge, drainage, and storm water infrastructure. While the general Local Option Sales Tax (LOST) enacted in 1975 allows counties to issue a one percent general purpose sales tax from which revenues can be used to support operations, SPLOSTs are used only for capital outlay projects at the county level (Rubenstein and Sjoquist, 2003; Jung, 2001). In addition, to address regional transportation problems and meet increasing demand for transportation infrastructure at this scale, the Georgia General Assembly passed legislation in 2010 allowing counties to establish 12 special tax districts throughout the state based on existing regional commission boundaries to create regional transportation SPLOSTs. Local option sales taxes in Georgia, at both the county and regional level, provide additional resources for struggling local and regional level transportation systems and better quality of life. These resources are particularly beneficial for counties with large commuter populations where regional transportation inadequacies are felt locally.
However, coordination is necessary to maximize cooperation and limit competition between transportation projects and other capital outlay projects, such as schools and facilities for public services, and also between existing county-specific SPLOSTs and new regional SPLOSTs. Given limited resources and voters’ reluctance to increase taxes, any conflicts between types of projects may hinder generation of funds to meet current and future demand for transportation systems. Also, current literature suggests that diverse factors are associated with the success of transportation ballot measures, making it difficult to predict voting results. Factors include voters’ socio-demographic characteristics, infrastructure and financial characteristics, community preferences, and communications and campaign strategies, (Zhao, 2005). Additionally, factors such as voter age, economic characteristics, transportation infrastructure, travel patterns, and existing SPLOSTs have been identified as potential indicators of successful SPLOST initiatives (Ross, Woo & Boston, 2011).
Section 1 Introduction
2
While this suggests that a strategic approach should be pursued to successfully enact SPLOSTs, there has been no comprehensive data source available to assist local, county, regional development centers (RDC), metropolitan planning organizations (MPO) and other regional and state entities to best prepare infrastructure funding strategies for their constituencies. This clearinghouse provides this information, including the results of current, previous and future SPLOSTs and LOSTs, financial conditions such as current indebtedness, issued bonds, other debts and taxes, socio-economic characteristics, and transportation conditions of each county and region. Having this data easily accessible will help guide the framework for local and regional transportation finance.
SPLOSTs can support projects which might not otherwise be funded. However, as previously described, a number of obstacles can stand in the way of securing this funding: competition between transportation projects and other capital outlay projects, such as schools and facilities for public services; competition between existing SPLOSTs and new SPLOSTs; voters’ reluctance to increase taxes; contextual factors; and communications strategies. Overcoming these obstacles to increase the potential success of future potential SPLOST ballot initiatives requires comprehensive information on SPLOST votes. The purpose of this clearinghouse is to provide a comprehensive source for this information, in order to increase understanding and to provide access to Department of Transportation officials and local and county decision makers and legislators. The clearinghouse also provides an opportunity to understand the spatial distribution of these characteristics and resulting implications of this type of data.

Section 2 Research Project Team
3
2. Research Project Team
2.1ProjectTeam
The project team included: the Center for Quality Growth and Regional Development (CQGRD) at the Georgia Institute of Technology, the Center for Geographic Information Systems (CGIS) at the Georgia Institute of Technology, and the Carl Vinson Institute of Government at the University of Georgia.
Section 3 Research Objectives and Methodology
4
3. Research Objectives and Methodology
3.1ResearchObjectives
Given the established need for a comprehensive database to coordinate and promote the success of SPLOST ballot initiatives, this project’s purpose was to develop an interactive clearinghouse of SPLOST related data with a spatial component. It includes development of a web portal and map to provide a centralized repository for transportation agencies and others to query and view the data. The clearinghouse also provides a baseline of data which can be updated and enhanced over time with additional information as it becomes available.
3.2Methodology
An overall framework for data has been developed and utilized to ensure consistency, facilitate data sharing and implement data protocols and standards.
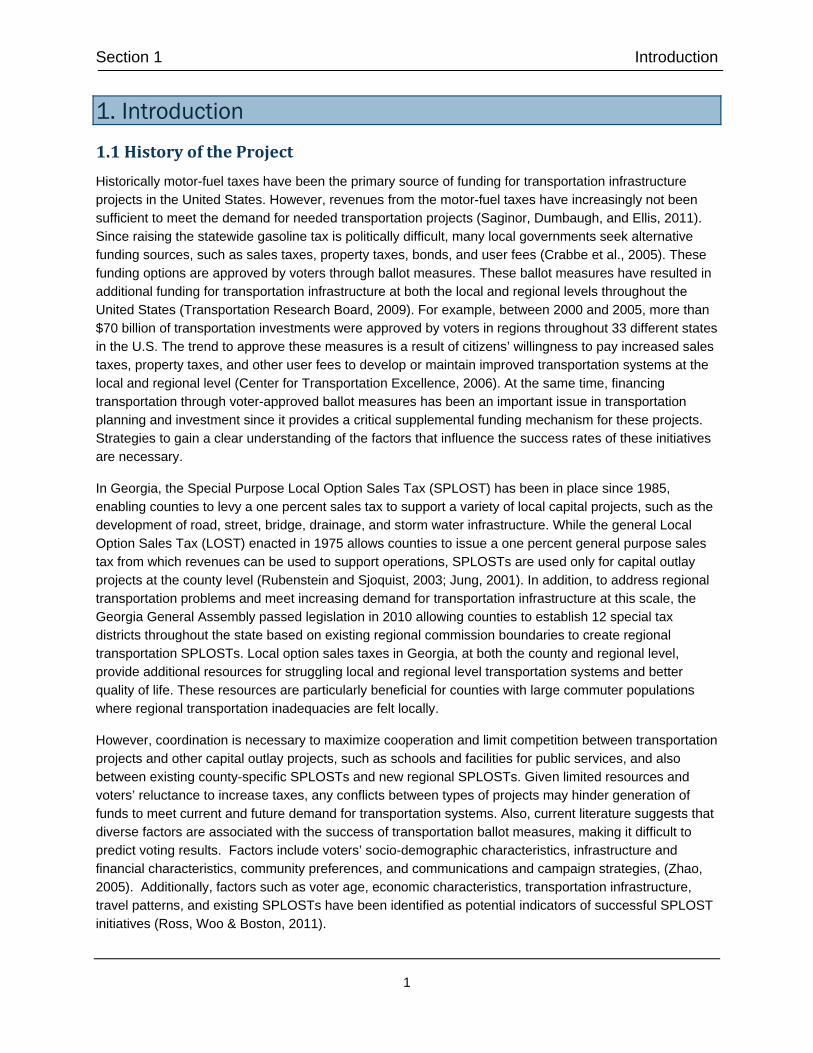
Searchable data collected for the development of the clearinghouse includes historic voting results of county-specific SPLOSTs since 1985 by county and purpose. The tool inventoried data related to the six types of SPLOSTs, described below. Other data available on the site includes an inventory of demographic, economic, and transportation data as well as the financial conditions and constraints for each county and region within the state. The data is available in a dynamic, interactive format, and shows the spatial distribution of the information to inform decision-making across the state. The following flow chart illustrates the site development process.
Figure 1: Concept map for the SPLOST data clearinghouse.
Section 4 Project Methods
5
4. Project Methods (Detailed Site Development Procedure)
4.1ConstructionoftheInformationDatabaseforGeorgiaSPLOST
The data included in the clearinghouse website is based on prior research, which identified the factors that typically influence SPLOST voting outcomes. The clearinghouse has been established to bring together this data from a variety of sources and make it available in one easily accessible location.
Historicalvotingresultsofcounty‐specificSPLOSTssince1985bycountyandpurpose
Since Georgia’s SPLOST enabling legislation was enacted in 1985, the voting results of county-specific SPLOSTs between 1985 and the most recent period were collected from the Georgia Archives. SPLOST projects are divided into six categories: Transportation (roads, streets, and bridges); Education (capital outlay projects for education purposes); Capital Outlay Projects (construction of water and sewer systems, courthouses, jails, administrative building for local jurisdictions, public safety facilities, recreational facilities, landfills, etc.); Transportation and Capital Outlay Project; Mix of Uses Excluding Transportation; and Local Option Sales Tax.
Inventoryoffinancialconditionsofeachcountyandregion(12taxdistricts)
A local government’s existing financial burden can influence whether voters will approve the creation or extension of sales taxes. Therefore the research team identified existing financial obligations incurred by local governments, such as current indebtedness, issued bonds, and other debts and taxes.
The Carl Vinson Institute of Government at the University of Georgia provided two major types of data for the SPLOST Data Clearinghouse. The first is fiscal data, including revenue and expenditure figures from 1985 through 2010, and indebtedness figures for general purpose local governments (i.e. counties and municipalities) for the same period. The second category is economic output data from the Georgia Economic Modeling System (GEMS) that includes complete industry level detail.
The Georgia Department of Community Affairs (DCA) annually collects fiscal data for local governments within the State. The Carl Vinson Institute of Government obtains each year’s data set from DCA and maintains a publically available web-based interface to view revenue and expenditure data called the Tax and Expenditure Data Center (TED). This interface allows the user to view revenues and expenditures at the county, city, and school district levels of government. The data was provided by the Carl Vinson Institute of Government for use in the clearinghouse as a Microsoft Access database with the counties identified by their FIPS codes as designated by the U.S. Census Bureau. Of note, however, is that the Vinson Institute does not audit or confirm that the data is reported accurately to DCA, and does not make any attempt to collect data that is not reported. Therefore, data for some entities may be missing from the dataset. An example of the DCA Fiscal Data Survey is included as Appendix A. The variable names assigned to the revenue and expenditure data are provided in Appendix B.
Inventoryofsignificantdataforeachcountyandregion(12taxdistricts)
The literature suggests that the demographics of the population, such as age, ethnicity, and marital status, can affect the outcome of transportation sales tax ballot initiatives. Also, the research team examined the economic characteristics of counties and regions (particularly the presence of retail), which are the basis of sales tax revenue. For a complete description of the economic data, please see Appendix A.

Section 4 Project Methods
6
Inventoryoftransportationinfrastructureandtraveldataforeachcountyandregion(12taxdistricts)
The miles of interstate located within each county are also included in the database to illustrate the existing transportation infrastructure within each county. Traffic and transportation infrastructure conditions within the county and region influence the potential for a SPLOST vote to pass because voters are likely to respond to an opportunity to potentially address and improve their daily needs.

Section 5 Using the Site
7
5. Using the Site The research team has developed a beta version of the web-based clearinghouse to provide new accessibility to county-level SPLOST data which illustrates demographic, economic, spatial and qualitative indicators. Until now, this data has only been available by consulting both state archives and other data sources. Additionally, the integration of SPLOST related data with a user-friendly mapping interface provides an easily accessible portal for relevant data and SPLOST-related spatial queries.
The objective is not just to collate and organize the data, but also to enable it to be queried through both natural language and spatial parameters. The query functions are incorporated into the web development. The design of the user interface has been constructed to make it user friendly and provide functionality according to the needs of the user. In the center of the interface, the map pane visually displays counties matching the query selected and allows users to select counties by clicking on the map. The graphical results pane displays Race and Ethnicity and Economic Data for a given county. (If the county label names are not visible, zoom into the map to activate them.) The query pane displays the type of query chosen, as well as the county, time frame and/or SPLOST purpose selected by the user. Based on the type of query, the numeric results pane displays the demographic, transportation, financial and economic data relevant for the particular county of interest.
Figure 2: Image showing the design of user interface
5.1FilterOptions
A multilayered data structure was designed at three different scales – county, time period, and purpose of SPLOST measure (capital outlay, education, local option sales tax, mix of uses excluding transportation, transportation, and capital outlay project including transportation). In addition to the ability to search for SPLOST measure results by county, time period and purpose (which is displayed spatially using an ESRI
Section 5 Using the Site
8
mapping interface), the user can also view demographic, economic, financial, transportation and housing data by county. These data can provide additional information to decision-makers on the outcome of SPLOST votes, purpose, changes over time as well as background information on the individual county characteristics.
5.2SampleQueries
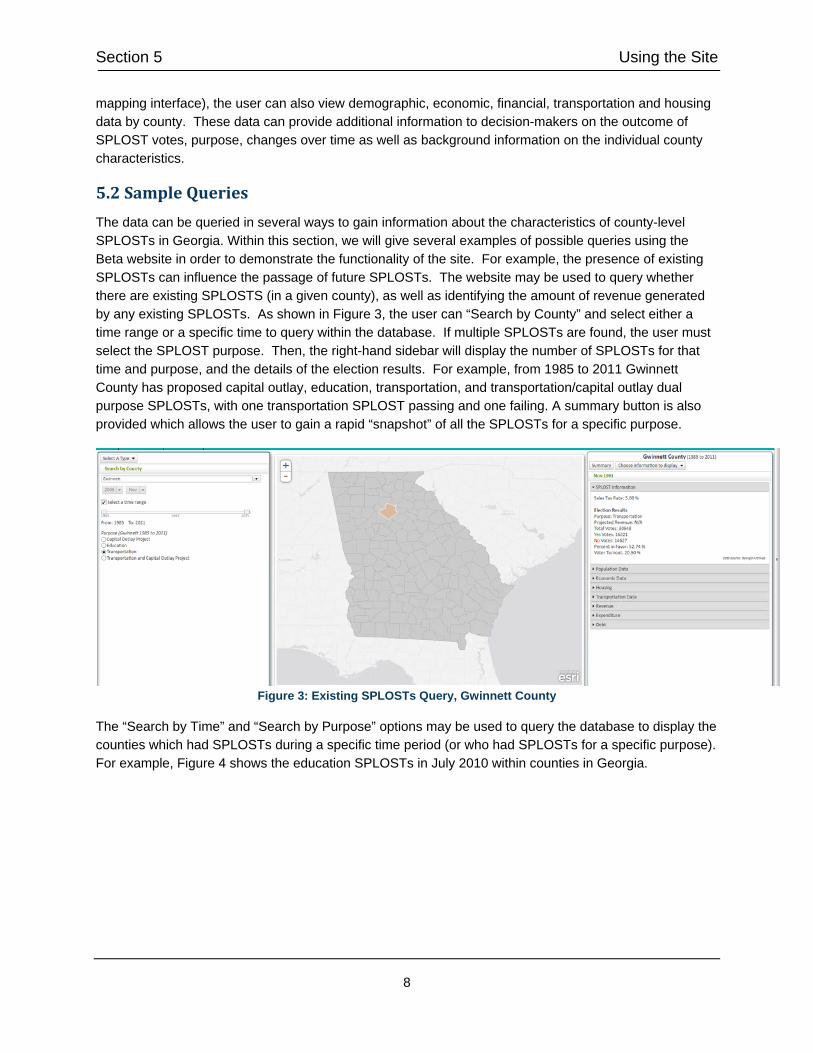
The data can be queried in several ways to gain information about the characteristics of county-level SPLOSTs in Georgia. Within this section, we will give several examples of possible queries using the Beta website in order to demonstrate the functionality of the site. For example, the presence of existing SPLOSTs can influence the passage of future SPLOSTs. The website may be used to query whether there are existing SPLOSTS (in a given county), as well as identifying the amount of revenue generated by any existing SPLOSTs. As shown in Figure 3, the user can “Search by County” and select either a time range or a specific time to query within the database. If multiple SPLOSTs are found, the user must select the SPLOST purpose. Then, the right-hand sidebar will display the number of SPLOSTs for that time and purpose, and the details of the election results. For example, from 1985 to 2011 Gwinnett County has proposed capital outlay, education, transportation, and transportation/capital outlay dual purpose SPLOSTs, with one transportation SPLOST passing and one failing. A summary button is also provided which allows the user to gain a rapid “snapshot” of all the SPLOSTs for a specific purpose.
Figure 3: Existing SPLOSTs Query, Gwinnett County
The “Search by Time” and “Search by Purpose” options may be used to query the database to display the counties which had SPLOSTs during a specific time period (or who had SPLOSTs for a specific purpose). For example, Figure 4 shows the education SPLOSTs in July 2010 within counties in Georgia.

Section 5 Using the Site
9
Figure 4: Education SPLOSTs, July 2010
Additionally, the SPLOST revenue for a specific time (or aggregated over several years) may be queried by displaying the Revenue & Expenditures tab on the right-hand sidebar (see Figure 5). Then, the user can expand the “Taxes” item and examine the “Special Purpose Local” revenue under the “Sales & Use Tax” item. This number will inform the user of the total revenue from SPLOSTs for a specific point in time or time period (in a given county). This data is reported by fiscal year. Fiscal years are determined by each county and may vary between different counties or within a single county over time. The fiscal year reported is that which was supplied by the government entity, and has not been verified or adjusted by the research team. For more information about fiscal years used, please refer to the appropriate government entity.

Section 5 Using the Site
10
Figure 5: SPLOST revenue query, Gwinnett County
Demographic and economic indicators, such as race/ethnicity, commute patterns, transportation data, employment sectors and housing characteristics; have been identified in the literature as factors which influence the election results of SPLOST ballot initiatives (Ross, Woo & Boston, 2011). Again, these indicators can be examined using the SPLOST clearinghouse website. For a given county (using Gwinnett County as an example, Figure 6), the user can expand the “County Info” menu option on the right-hand sidebar. The user can then expand the menus for race/ethnicity, economic data, housing, etc. depending on the variables of interest.
Figure 6: Housing Query, Gwinnett County

Section 6 Policy Implications and Conclusion
11
6. Policy Implications and Conclusion
6.1ImplicationsforPolicy,ResearchandPractice
The State of Georgia SPLOST Clearinghouse provides users with data that has been shown to influence the outcome of SPLOST ballot initiatives. Through development of the web portal, the project provides a centralized repository for transportation agencies to analyze data affecting the likelihood of successful SPLOST initiatives. Through the web-based interactive mapping system, users can view and query SPLOST results by county, time period, and purpose. The website can be used to conduct demographic and economic analyses, relating census and financial data to the results of county-wide SPLOST initiatives in the state of Georgia.
This project has produced a comprehensive data source that will help local, county, regional, and state entities evaluate infrastructure funding strategies for their constituencies. In addition, the results of current, previous and future SPLOSTs and LOSTs, county financial conditions, debts and taxes, county socio-economic characteristics, and transportation conditions across the state can assist the Georgia Department of Transportation to design the framework and guide decisions for local and regional transportation finance.
6.2Conclusion
The Georgia SPLOST Clearinghouse data repository and interactive website will enhance the way that state, county, and local transportation planning officials approach new one-cent sales tax initiatives. SPLOSTs provide a powerful tool for county and regional governments to raise funds for infrastructure, but require the approval of local voters. The SPLOST Clearinghouse provides planning officials with a variety of data related to factors influencing the likelihood of passage for a one-cent sales tax referendum. Using the querying and interactive mapping capabilities of this repository, county governments and planning officials will be able to assess the likelihood of SPLOST passage through innovative approaches to data use.

Section 7 References
12
7. References Center for Transportation Excellence, “Transportation Finance at the Ballot Box: Voters Support
Increased Investment & Choice”, 2006.
Crabbe, A.E., Hiatt, R., Pliwka, S.D., and Wachs, M., “Local Transportation Sales Taxes: California’s Experiment in Transportation Finance”, Institute of Transportation Studies, University of California at Berkeley, 2005.
Jung, C., “Property Tax Relief in Georgia: The Local-Option Sales Tax (LOST)”, Policy Notes. Carl Vinson Institute of Government. The University of Georgia, 2001.
Ross, C., Woo, M. & Boston, T. (2011). Impact of Regional SPLOST on County Infrastructure (Draft Research Report). http://www.utc.gatech.edu/sites/default/files/projects/reports/ ross_and_elliott_impact_of_regional_splost_final_report_regional_splost_clr_07062012.pdf.
Rubenstein, R. and D.L. Sjoquist, “Financing Georgia’s Schools: A Primer”, Fiscal Research Center Report No. 87, Georgia State University, 2003.
Saginor, J., E. Dumbaugh, and D.R. Ellis, “Leveraging Land Development Returns to Finance Transportation Infrastructure Improvements”, Transportation Research Board, Ongoing Research. Accessed May 4, 2010, from http://rip.trb.org/browse/dproject.asp?n=20594, 2011.
Transportation Research Board, “Local and Regional Funding Mechanisms for Public Transportation”, Transit Cooperative Research Program (TCRP) Report 129, 2009.
Zhao, Z. (2005). Motivations, obstacles and resources: The adoption of the general-purpose local option sales tax in Georgia counties. Public Finance Review 33(6), 721-746.
Appendix A Data Sources
13
Appendix A: Data Sources
DescriptionofDataProvidedbytheCarlVinsonInstituteofGovernment
The Carl Vinson Institute of Government provided two major types of data for the SPLOST Data Clearinghouse. The first is fiscal data, including revenue and expenditure figures from 1985 through 2010, and indebtedness figures for general purpose local governments (i.e. counties and municipalities) for the same period. The second category is economic output data from the Georgia Economic Modeling System that includes complete industry level detail.
FiscalData
The fiscal data and indebtedness data for general purpose local governments is collected annually by the Georgia Department of Community Affairs (DCA). The Carl Vinson Institute of Government obtains each year’s data set from DCA as soon as it is available and maintains a web-based interface showing the revenue and expenditure data called the Tax and Expenditure Data Center (TED). The Vinson Institute makes no attempt to audit or confirm that the data was reported accurately to DCA, and it does not collect data that is not reported. Therefore, data for some entities may be missing. The data was supplied to CQGRD as a Microsoft Access database with the counties identified by their FIPS codes as designated by the U.S. Census Bureau. Because the data include a number of revenue and expenditure categories, levels are identified in the variable names. Thus, the total amount of taxes collected in a given year is the variable TAXES1. Tax revenue is broken down into categories for property tax, general sales taxes, and selective sales and use taxes. Those variables are identified with a 2, for second level of detail, in their names and they sum to the amount for taxes at level 1 (TAXES1). The debt data variables collected by DCA also extend back to 1985.
EconomicOutputData
The total value of goods and services produced within a geographic region, or gross domestic product (GDP), is provided for each county in the state going back to 2001. This data was obtained from the Georgia Economic Modeling System (GEMS), a Georgia application of the Regional Dynamics input/output economic modeling tool. The data include economic output for each of 660 industries contained in the North American Industry Classification System (NAICS) at the five-digit level for each of Georgia’s counties. The number of jobs and the wage bill associated with those jobs for each NAICS code are also included. Because the Bureau of Labor Statistics, the Bureau of Economic Analysis, and other agencies within the U.S. Department of Commerce report these data at the county level, GEMS is a county-level model. Therefore, the data the Vinson Institute supplied is for counties. No attempt is made to assign proportions of these amounts to individual municipalities within counties. Complete information on the NAICS codes is found at the NAICS web site http://www.census.gov/eos/www/naics/index.html. The data for 2001 through 2010 are actual data as collected by the U.S. Department of Commerce. The 2011 data is based on an estimate produced by GEMS. As actual data become available for additional years, estimates and forecasts for subsequent years may be updated.

Appendix B Variables
14
Appendix B: Variables
CityRevenueandExpenditureData1985to2010
The following graphic illustrates the type of raw data that the research team utilized to develop the State of Georgia SPLOST Clearinghouse.
VariablesIncludedontheGeorgiaSPLOSTClearinghouseWebsite
PopulationData
Type of (CBSA) Population Density Population Growth Rate Population Under 17 Population Over 65 Race and Ethnicity, 1995 Estimate Race and Ethnicity, 2010 Census
EconomicData
Poverty Rate Employment Growth Rate Per Capita Income GRP (Gross Regional Product) Per Capita Mean Household Income
Appendix B Variables
15
Retail Sales Per Capita Industries
Housing
Owner-occupied housing units Median home value Indoor Plumbing Penetration Water System Penetration Municipal Sewer Penetration
TransportationData
Work at home Travel time to work more than 25 minutes Drive to work alone Carpool to work Interstate Highway Mileage
Revenue
Sales & Use Tax Local Option Sales & Use (LOST) Special Purpose Local Option Sales & Use (SPLOST) Education Local Option Sales & Use (ELOST) Homestead Option Sales & Use (HOST) MARTA Sales & Use Municipal Option Sales & Use Property Tax Selective Sales & Use Other Tax Licenses & Permits Intergovernmental Revenues Charges for Services Fines & Forfeitures Investment Income Contributions & Donations Miscellaneous Other Sources
Expenditure
General Government Judicial Public Safety Public Works Health & Welfare

Appendix B Variables
16
Culture & Recreation Housing & Development
DebtService
Principal General Obligation Other Long-Term Lease Purchase Short-Term Debt Interest General Obligation Other Long-Term Lease Purchase Short-Term Debt


![Database Group, Georgia Tech 1 SQL SQL - intergalactic dataspeak [Stonebraker]](https://img.pdfslide.net/doc/110x75/56649d845503460f94a6b7f2/database-group-georgia-tech-1-sql-sql-intergalactic-dataspeak-stonebraker.jpg)