Embed Size (px)
Citation preview

Uses of Mathematical Models for Understanding Drug
Resistance: Considerations(with a brief detour on animal
abx use)
Marc Lipsitch
Harvard School of Public Health
Outline
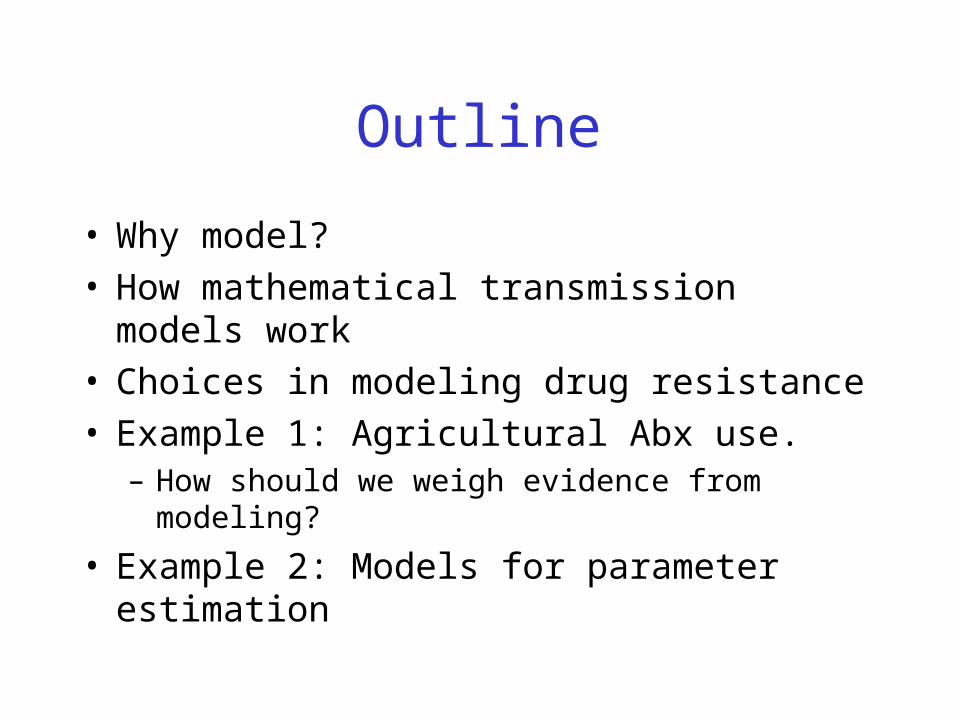
• Why model?• How mathematical transmission models work• Choices in modeling drug resistance• Example 1: Agricultural Abx use.
– How should we weigh evidence from modeling?
• Example 2: Models for parameter estimation

Outline
• Why model?• How mathematical transmission models work• Choices in modeling drug resistance• Example 1: Agricultural Abx use.
– How should we weigh evidence from modeling?
• Example 2: Models for parameter estimation
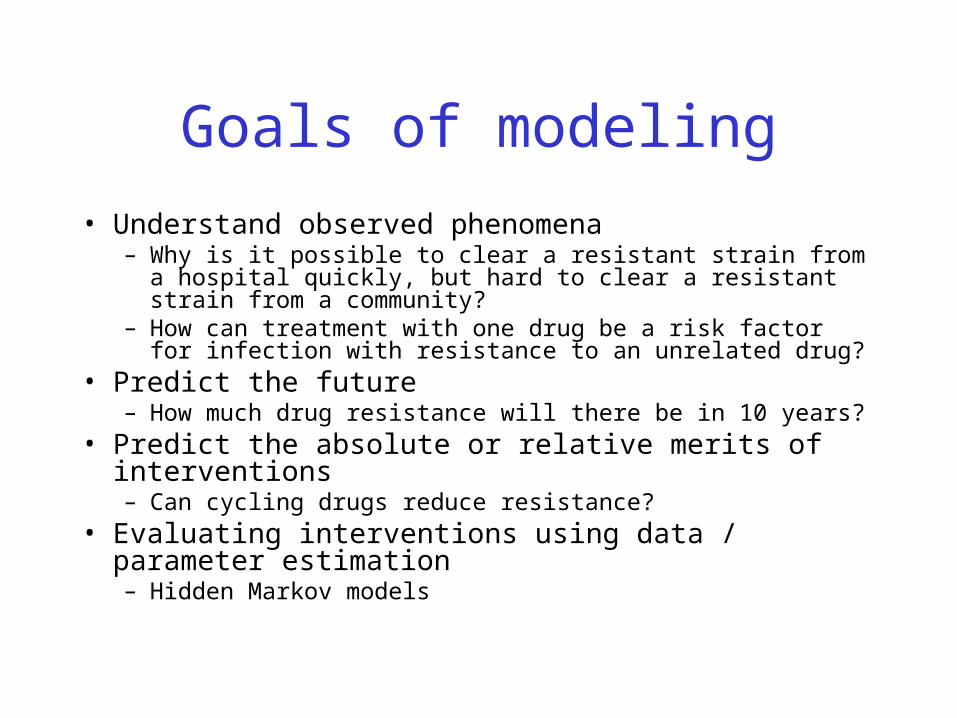
Goals of modeling
• Understand observed phenomena– Why is it possible to clear a resistant strain from a hospital
quickly, but hard to clear a resistant strain from a community?
– How can treatment with one drug be a risk factor for infection with resistance to an unrelated drug?
• Predict the future– How much drug resistance will there be in 10 years?
• Predict the absolute or relative merits of interventions– Can cycling drugs reduce resistance?
• Evaluating interventions using data / parameter estimation– Hidden Markov models


Outline
• Why model?• How mathematical transmission models work• Choices in modeling drug resistance• Example 1: Agricultural Abx use.
– How should we weigh evidence from modeling?
• Example 2: Models for parameter estimation

Classical compartment model
birthSSusceptible
infection
IInfected/ infectious
vaccination
RRecovered (immune)
recovery
bSSusceptible
cSI
IInfected/ infectious
vS
RRecovered (immune)
kI
dI
dR
dS

Deterministic implementation
dRvSkIdt
dR
IdkcSIdt
dI
dScSIvSbdt
dS
)(
bSSusceptible
cSI
IInfected/ infectious
RRecovered (immune)
kI
dI
dR
dS vS

Stochastic implementation
Event Rate S I R Birth b +1 0 0 Death of S dS -1 0 0 Death of I dI 0 -1 0 Death of R dR 0 0 -1 Infection cSI -1 +1 0 Recovery kI 0 -1 +1 Vaccination vS -1 0 +1
TOTAL b+dS+dI+dR+csI+kI+vS
bSSusceptible
cSI
IInfected/ infectious
RRecovered (immune)
kI
dI
dR
dS vS

Realizations of a stochastic model: R0 ~ 2
5 10 15 20 25
20
40
60
80
100
5 10 15
20
40
60
80
100
0.5 1 1.5 2
20
40
60
80
100
2.5 5 7.5 10 12.5 15 17.5
20
40
60
80
100
R
S
I
R
S
I
RS
I
S
RI

Outline
• Why model?• How mathematical transmission models work• Choices in modeling drug resistance• Example 1: Agricultural Abx use.
– How should we weigh evidence from modeling?
• Example 2: Models for parameter estimation

What to include?
• Patients: also HCW vectors?• Drug resistant strain• Drug sensitive strain?• Treatment?
– Event– State– Risk factor
• Disease vs. colonization• Co-colonization: possible?• How do people enter the
model? Colonized or not?
• Considerations:– Biology: what are the
interactions?– Question: need HCW if you
want to assess an intervention on them!
– Duration of treatment


Copyright ©2000 by the National Academy of Sciences
Lipsitch, Marc et al. (2000) Proc. Natl. Acad. Sci. USA 97, 1938-1943

Copyright ©2004 by the National Academy of Sciences
Bergstrom, Carl T. et al. (2004) Proc. Natl. Acad. Sci. USA 101, 13285-13290
Fig. 1. Schematic diagram of the model and the corresponding differential equations
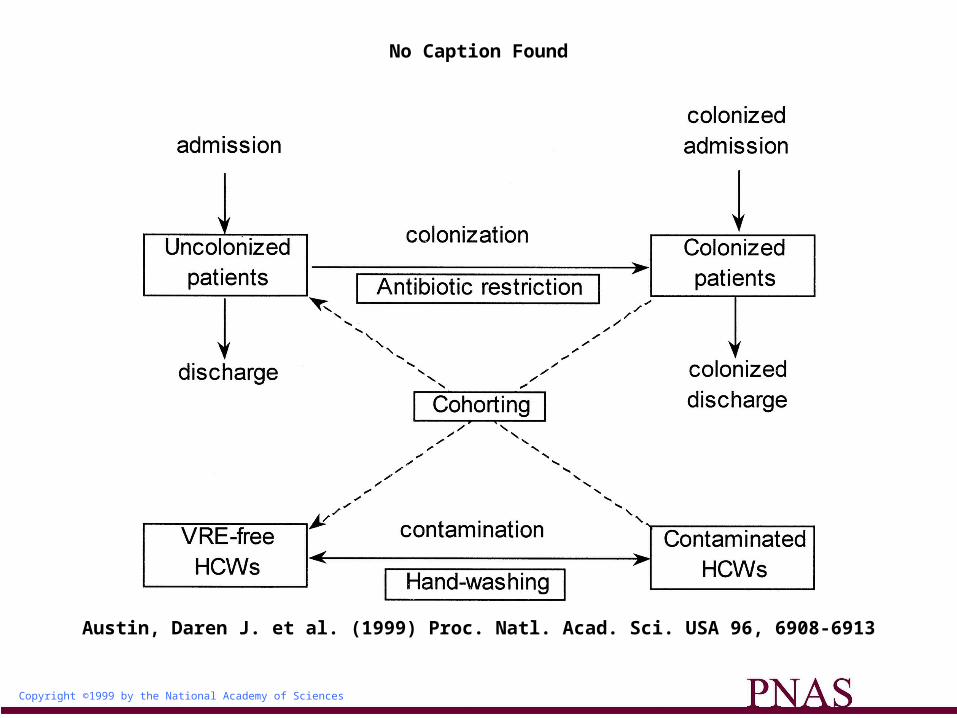
Copyright ©1999 by the National Academy of Sciences
Austin, Daren J. et al. (1999) Proc. Natl. Acad. Sci. USA 96, 6908-6913
No Caption Found

Outline
• Why model?• How mathematical transmission models work• Choices in modeling drug resistance• Example 1: Agricultural Abx use.
– How should we weigh evidence from modeling?
• Example 2: Models for parameter estimation

Antibiotics and Agriculture:Why we have skirted the issue
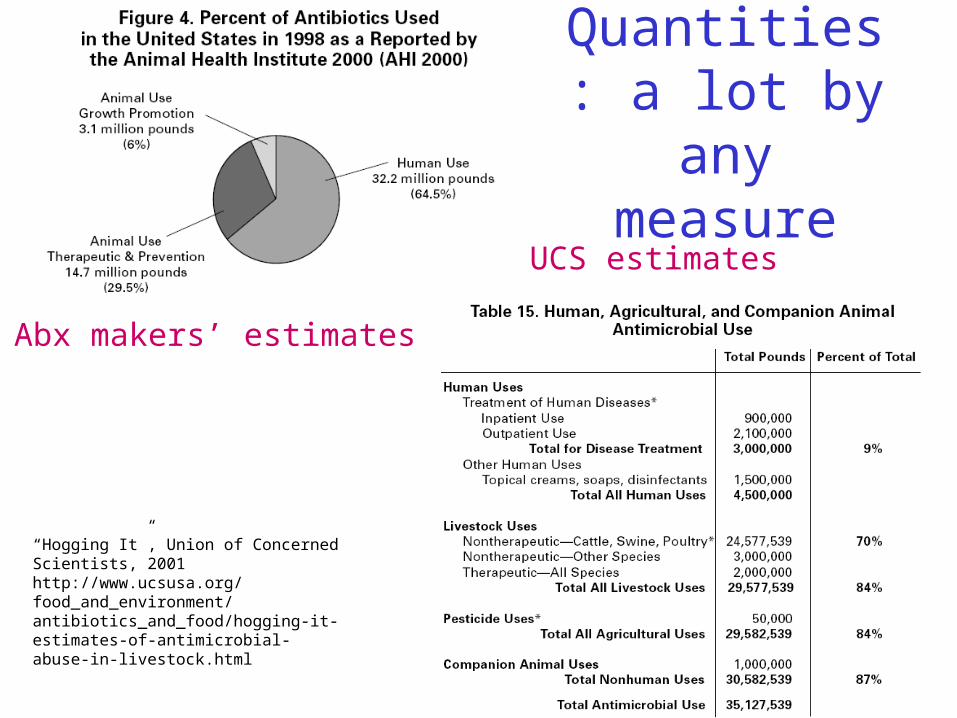
Quantities: a lot by any measure
“Hogging It”, Union of Concerned Scientists, 2001http://www.ucsusa.org/food_and_environment/antibiotics_and_food/hogging-it-estimates-of-antimicrobial-abuse-in-livestock.html
Abx makers’ estimates
UCS estimates

Poundage may be misleading
• (Higher doses may kill resistant strains)• Resistant bacteria are not a problem unless
they– Make people sick– Donate resistance to other strains
• Most bacteria in animals don’t get into people – from the human “bacteriome” perspective abx in animals may contribute far less– Contribution of ag use ~ (relative poundage in ag
use) x (relative contribution of ag bacteria to human bacteria)

Resistanthuman disease
Animal Use and Human Resistance
Bacteria in Animals
Resistancein Bacteria in Animals
AbxAbx
Resistancein Bacteria in Animals
Resistant bacteriain food
Resistanthuman disease
opportunistic
Resistanthuman disease
Campy,Salmonella
Resistant human
commensals
Resistance xfer
Transmission
Resistant human
commensals
E coli,Enterococcus
Food-disease linkquantifiable
Food-disease linkidentifiable
Food-disease linkdifficult to document
in any given case

Almost a smoking
gun: Salmonella DT104 with reduced FQ susceptibility in Denmark
Molbak 1999 NEJM

Evidence
• S. typhimurium DT104 food poisoning outbreak with unusual resistance pattern (5 drugs + nalidixic acid) and other genetic markers
• Same strain in samples of pork from one slaughterhouse
• No other samples of this strain identified in extensive surveillance
• Strain not responsive to ciprofloxacin: nal-R = gyrA• Epidemiologic links for several patients to
contaminated pork, possible links for others• No quinolone use on the farms per vet’s written
statement

As AHI would be quick to point out
• No quinolone-resistant organisms cultured from after treatment
• Circumstantial (though compelling) evidence that quinolone resistance led to treatment failure
• No evidence that the precursor to FQ resistance (Nal-R) was acquired via ag use (later UK outbreak did show such an association – Walker 2000 Vet Record)

Yet
• Clear evidence of a transfer of resistant bacteria from food animals to humans, causing disease
• FQ were being used in agriculture in DK
• Difficult to think of another likely source of resistance in animal isolates

Risk factor studies: show that poultry is a source of resistant infection
Kassenborg HA 2004 Clin Infec Dis Suppl
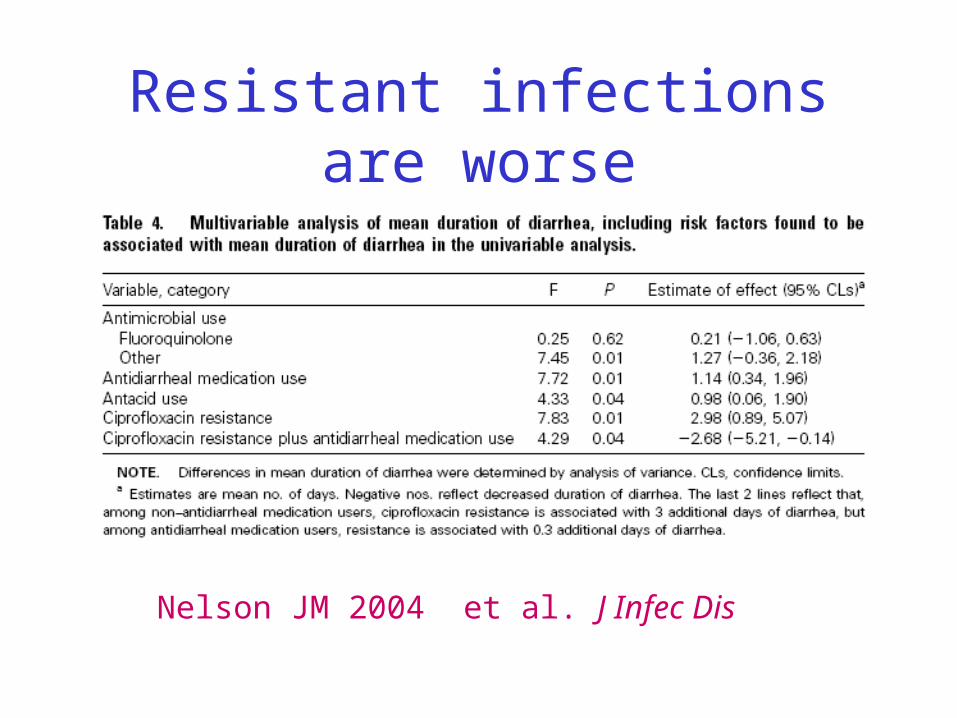
Resistant infections are worse
Nelson JM 2004 et al. J Infec Dis

Resistant infections are worse
Varma JK 2005 et al. J Infec Dis

As I see it….
• Compelling but not smoking gun evidence for every step of the “food poisoning” (food-associated gastroenteritis) process
• Food poisoning is usually self-limiting• Not good but not a major public health
problem• Much of it addressable by hygiene

Resistanthuman disease
Animal Use and Human Resistance
Bacteria in Animals
Resistancein Bacteria in Animals
AbxAbx
Resistancein Bacteria in Animals
Resistant bacteriain food
Resistanthuman disease
opportunistic
Resistanthuman disease
Campy,Salmonella
Resistant human
commensals
Resistance xfer
Transmission
Resistant human
commensals
E coli,Enterococcus
Food-disease linkquantifiable
Food-disease linkidentifiable
Food-disease linkdifficult to document
in any given case

What about the aspects that are harder to document?
• Transfer of resistant E. coli, Enterococcus, etc to humans which later transmit and cause disease (often in others)– VRE example: Europe has much human
carriage of VRE from animals, but little disease!

Copyright ©2002 by the National Academy of Sciences
Smith, David L. et al. (2002) Proc. Natl. Acad. Sci. USA 99, 6434-6439
A modeling approach
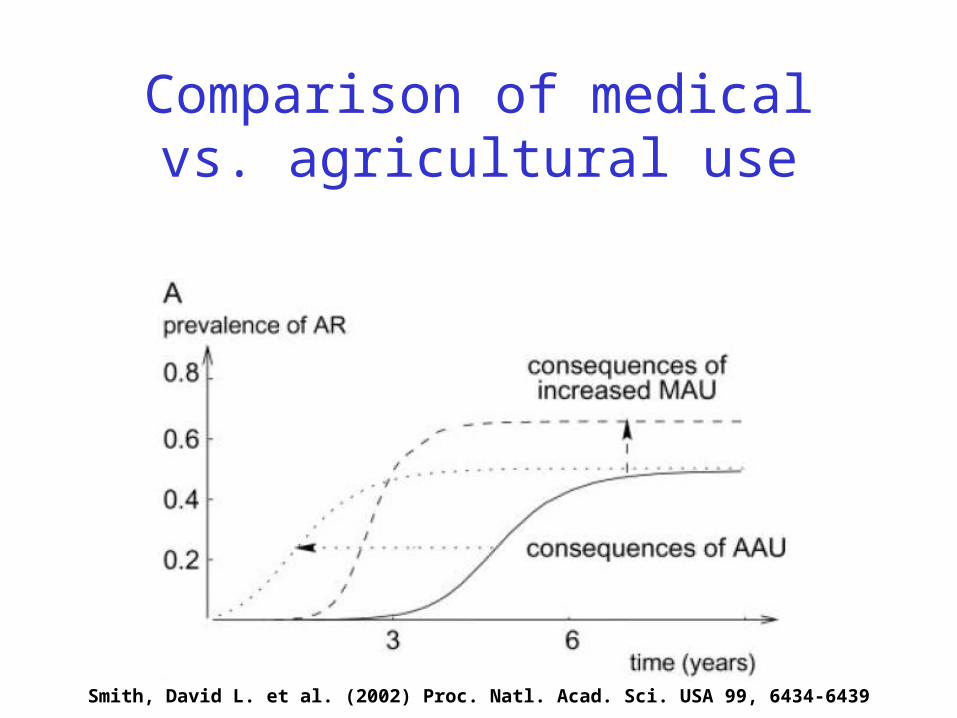
Comparison of medical vs. agricultural use
Smith, David L. et al. (2002) Proc. Natl. Acad. Sci. USA 99, 6434-6439
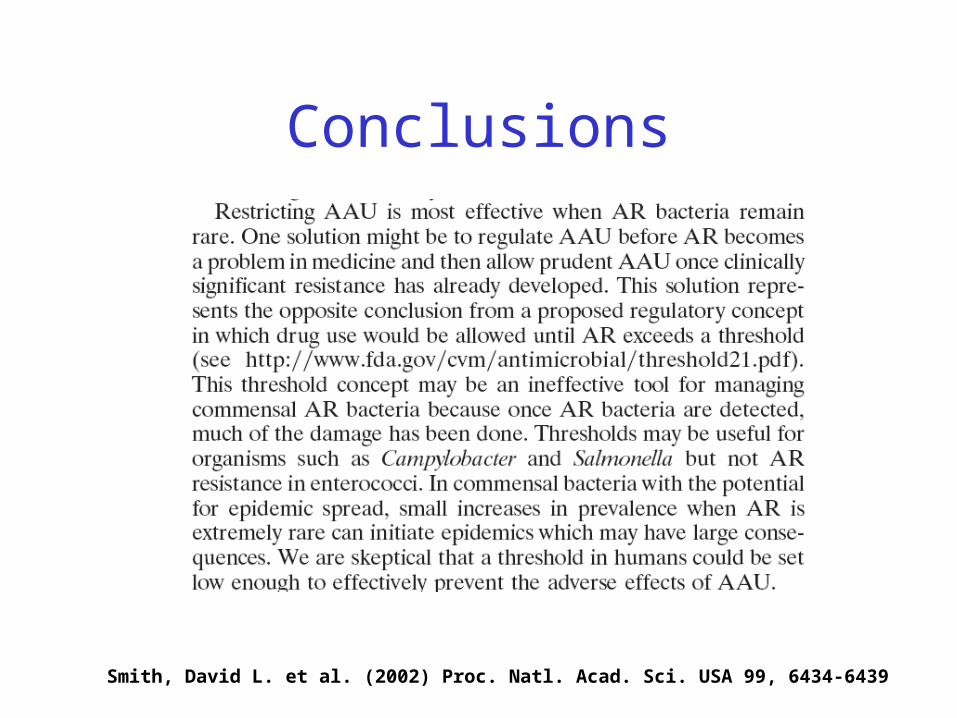
Conclusions
Smith, David L. et al. (2002) Proc. Natl. Acad. Sci. USA 99, 6434-6439

• Impact on human health is likely, though often hard to document; most likely and best-documented for organisms causing food-associated gastroenteritis (Campylobacter, Salmonella)
• Overall magnitude is hard to estimate but likely fairly low
• For commensals/opportunists:– Should try to prevent emergence of novel resistance
determinants via food– Ag use of common human antibiotics for which resistance is
already a clinical problem likely has minimal impact on human health

Outline
• Why model?• How mathematical transmission models work• Choices in modeling drug resistance• Example 1: Agricultural Abx use.
– How should we weigh evidence from modeling?
• Example 2: Models for parameter estimation
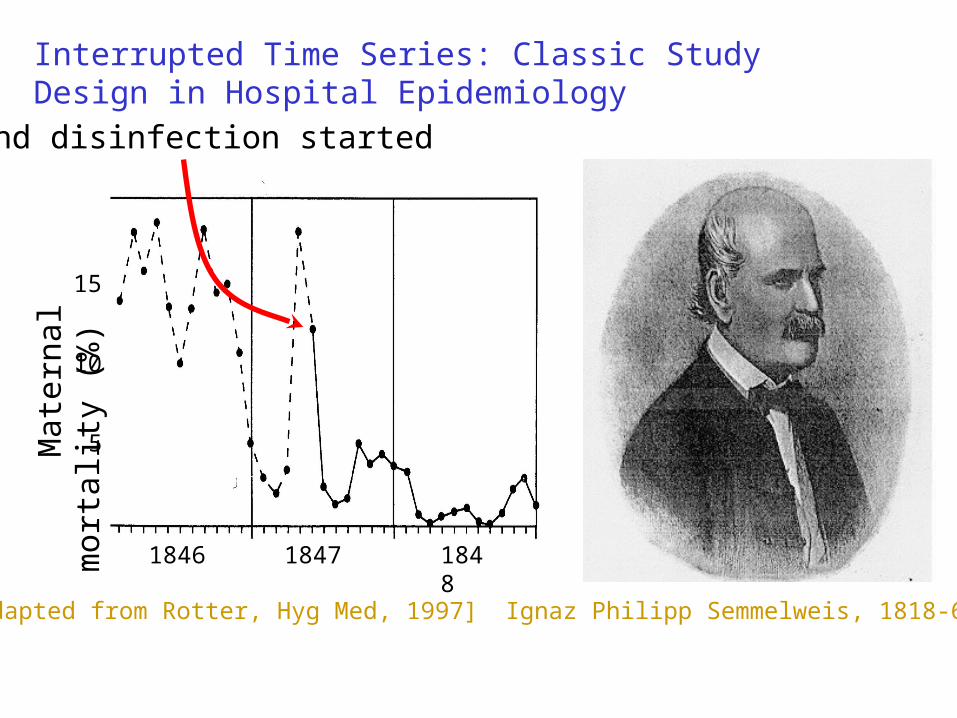
Interrupted Time Series: Classic Study Design in Hospital Epidemiology
Ignaz Philipp Semmelweis, 1818-65
1846 1847 1848
Mat
erna
l mor
tali
ty (
%)
5
10
15
Hand disinfection started
[adapted from Rotter, Hyg Med, 1997]

Onesko KM, Infection Control 1987
Nosocomial MRSA (infections?). ICU & 4 South ward combined.
00.5
11.5
22.5
33.5
Aug Oct Dec Feb Apr Jun Aug Oct Dec Feb Apr Jun
% o
f pat
ien
ts
1983 1984 1985
Non-medicated soap Low-iodine soap
Interrupted time series studies

Usual statistics
Pre-intervention Post-intervention
Uninfected 20 5
Infected 180 195
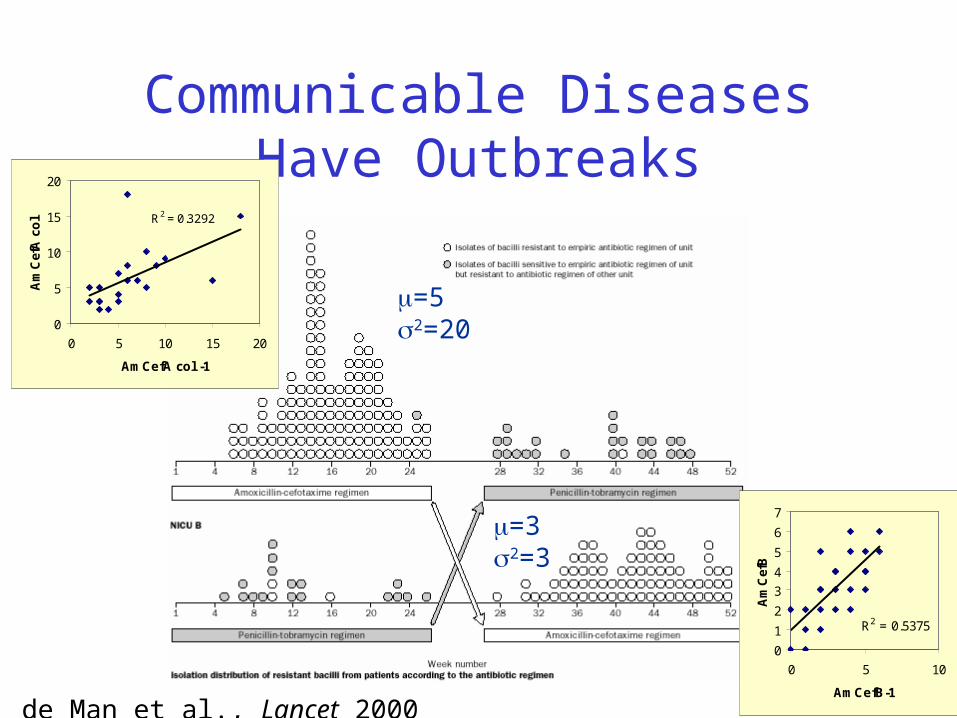
Communicable Diseases Have Outbreaks
P. de Man et al., Lancet 2000
R2 = 0.3292
0
5
10
15
20
0 5 10 15 20
AmCefA col -1
Am
Cef
A c
ol
R2 = 0.5375
0
1
2
3
4
5
6
7
0 5 10
AmCefB-1
Am
Cef
B
=52=20
=32=3

Outbreaks show:
• Serial autocorrelation: this week is like last week
• Overdispersion: Big departures from the mean, due to spread of bugs, or lack of spread
• CONSEQUENCE: Usual statistics, which assume modest deviations from the mean and independent observations, don’t work– 2x2 tables– Poisson regression– Etc.

How wrong will the results be?

How wrong will the results be? To address this question we need data where we know what the correct answer is.

How wrong will the results be? To address this question we need data where we know what the correct answer is.
We can create such data by simulating from a plausible stochastic transmission model:
Cooper, Medley, Scott. J Hosp Infect 1999
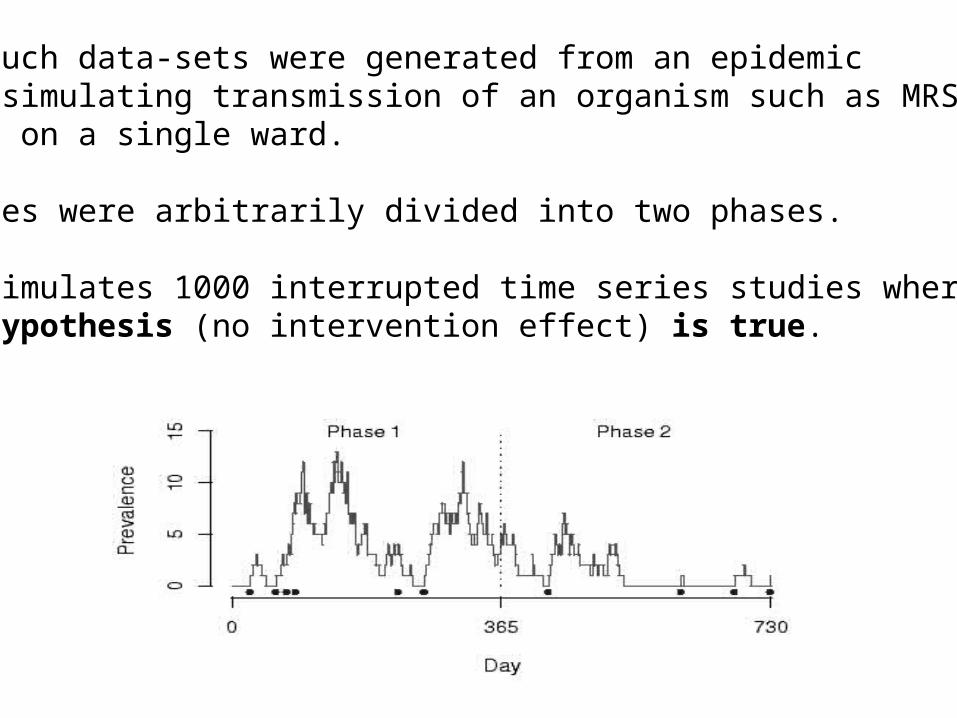
1000 such data-sets were generated from an epidemicmodel simulating transmission of an organism such as MRSAor VRE on a single ward.
Outcomes were arbitrarily divided into two phases.
This simulates 1000 interrupted time series studies where the null hypothesis (no intervention effect) is true.

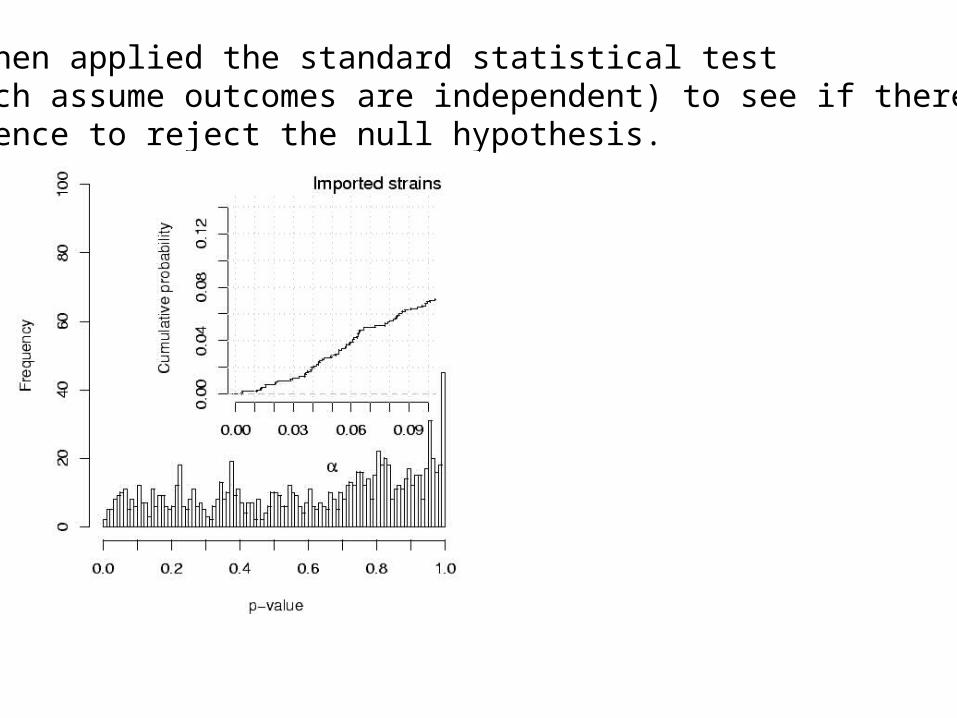
We then applied the standard statistical test (which assume outcomes are independent) to see if there wasevidence to reject the null hypothesis.
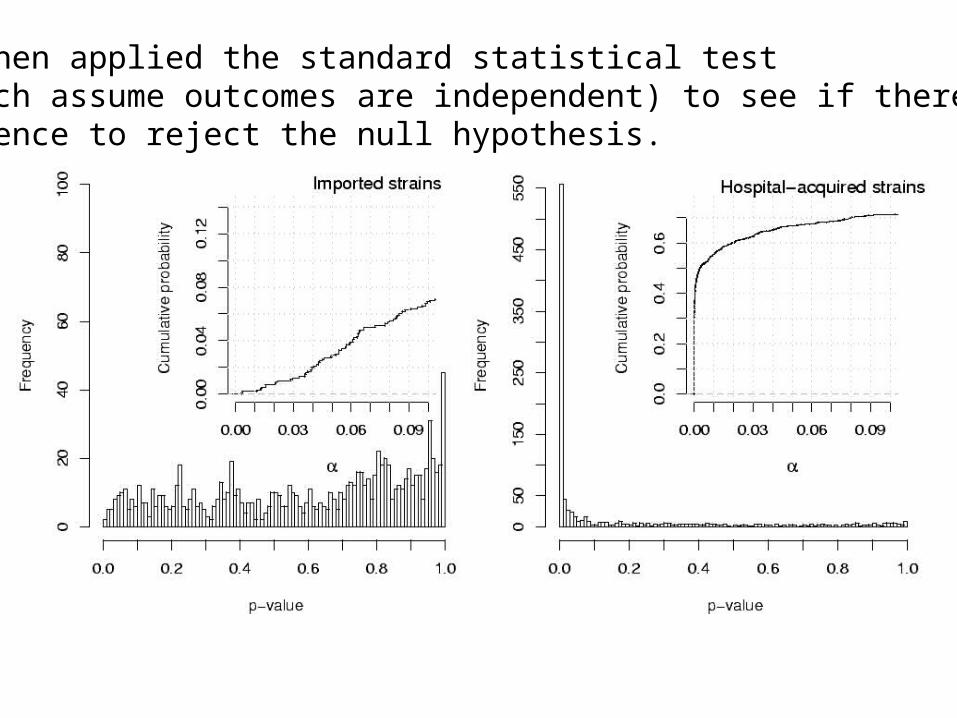
We then applied the standard statistical test (which assume outcomes are independent) to see if there wasevidence to reject the null hypothesis.

Using models to assess the interventions appropriately

Susceptiblepatients
Colonized +- infection
Transmission in a hospital ward
transmissionadmissiondischarge

Susceptiblepatients
Colonized or infected
More typically colonization data is incomplete or only those patients who develop infections are observed :

Susceptiblepatients
Colonized or infected
Simple transmission model for a hospital ward
Assumptions: • Susceptible patients become colonized faster as the number of colonized patients on the ward increases (colonization pressure).•Colonization assumed to last a long time compared to length of stay • The Markov assumption (what happens next depends only on the current state of the system, not on history).
Parameters• Proportion of patients colonized on admission to ward•Transmission rate•Length of stay
Proposed by Pelupessy et al. (PNAS 2002) for analysing hospital infection data. Limitation is that it requires complete colonization data.
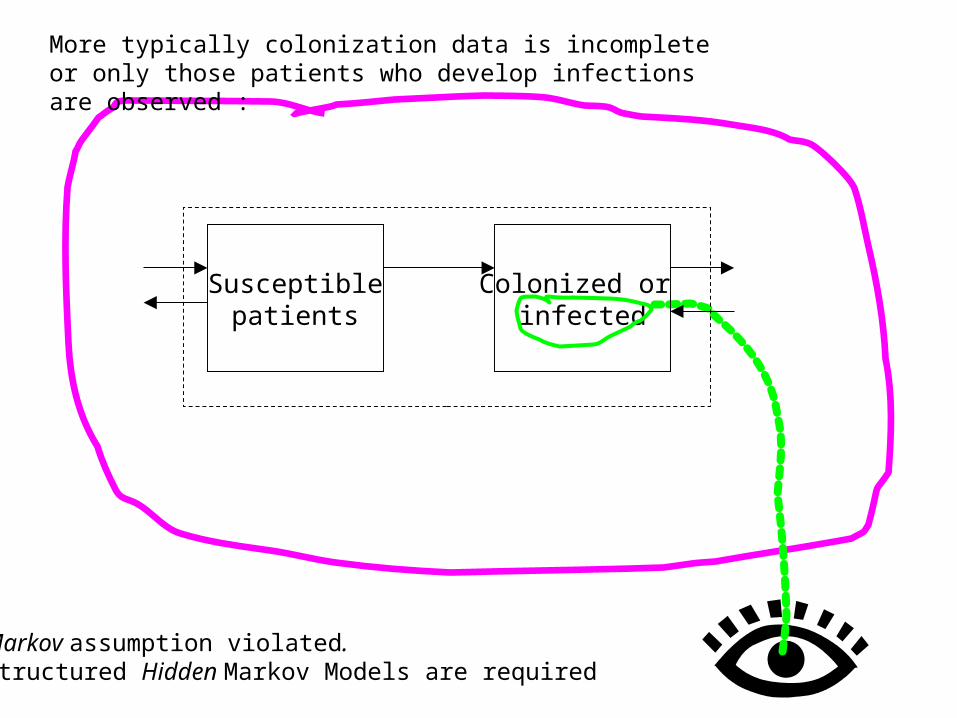
Markov assumption violated. Structured Hidden Markov Models are required
Susceptiblepatients
Colonized or infected
More typically colonization data is incomplete or only those patients who develop infections are observed :
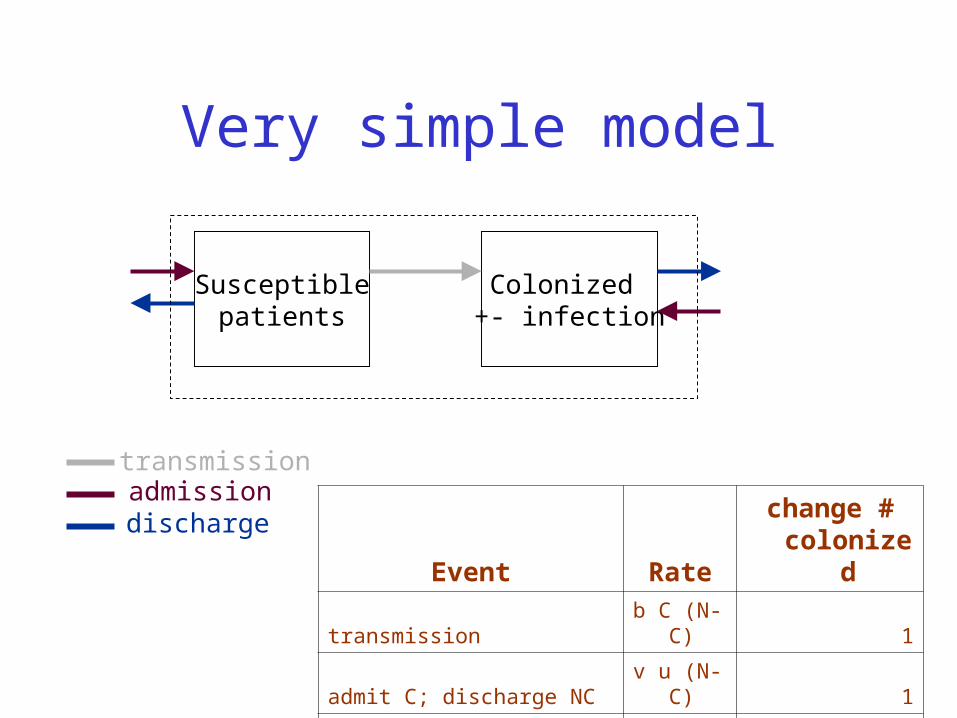
Very simple model
Susceptiblepatients
Colonized +- infection
transmissionadmissiondischarge
Event Ratechange # colonized
transmission b C (N-C) 1
admit C; discharge NC v u (N-C) 1
admit NC; discharge C (1-v) u C -1
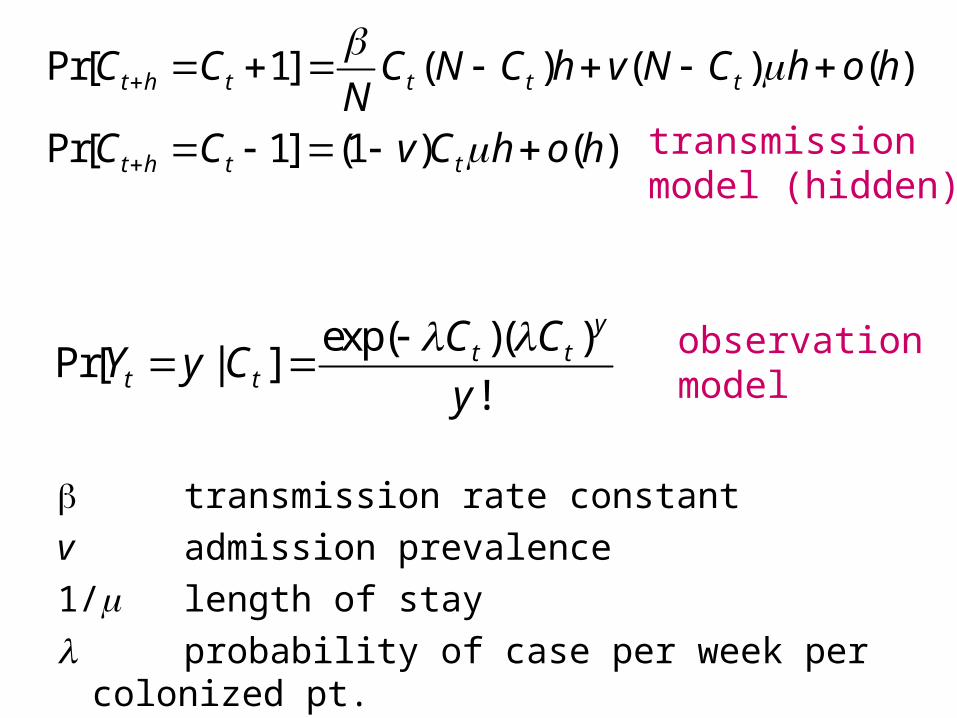
transmission rate constant
v admission prevalence
1/ length of stay
probability of case per week per colonized pt.
Pr[ 1] ( ) ( ) ( )
Pr[ 1] (1 ) ( )
t h t t t t
t h t t
C C C N C h v N C h o hN
C C v C h o h
transmissionmodel (hidden)
observationmodel
exp( )( )Pr[ | ]
!
yt t
t t
C CY y C
y
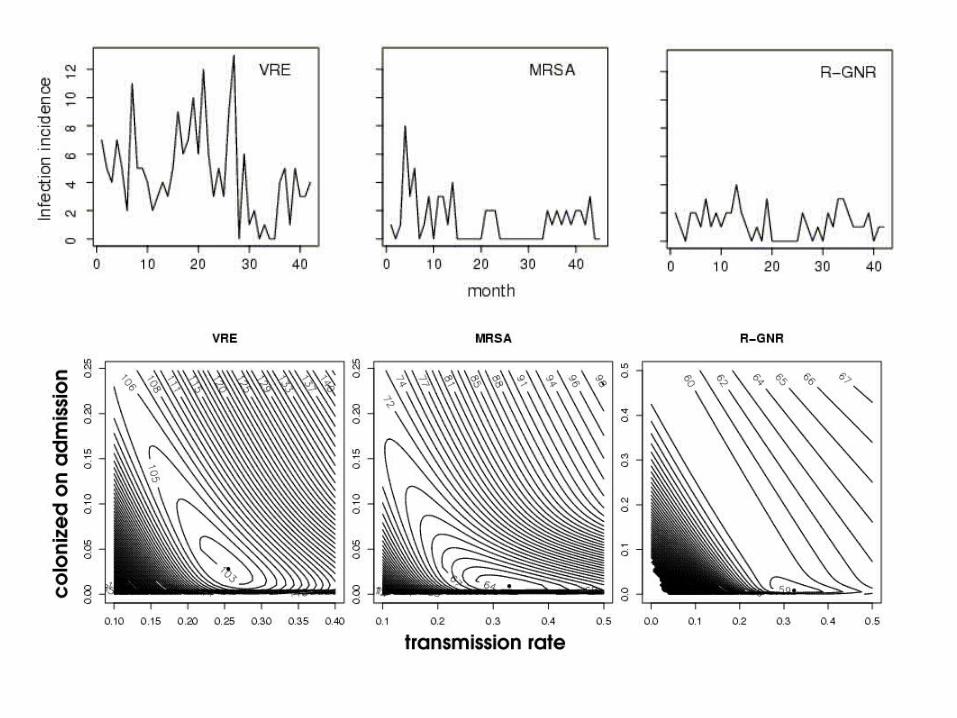

• Test of null hypothesis that there is no transmission:
– For the MRSA and VRE data we reject this hypothesis (p=.0008 and p=0.000002).
– For the R-GNR data there is no evidence to reject this hypothesis (p=0.25) and data are consistent with all cases being colonized with R-GNR on admission.
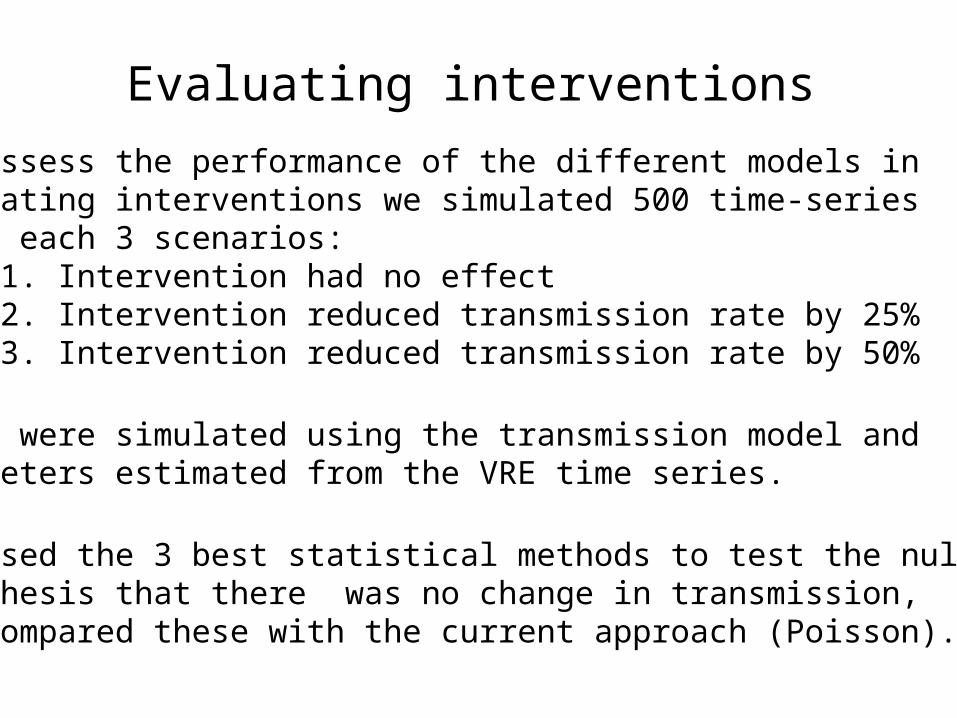
•To assess the performance of the different models in evaluating interventions we simulated 500 time-series under each 3 scenarios:
1. Intervention had no effect2. Intervention reduced transmission rate by 25%3. Intervention reduced transmission rate by 50%
•Data were simulated using the transmission model and parameters estimated from the VRE time series.
•We used the 3 best statistical methods to test the null hypothesis that there was no change in transmission, and compared these with the current approach (Poisson).
Evaluating interventions

Evaluating interventions: results
Structured hidden Markov (transmission model )
Poisson(assumes independence)
Neg.
binomial
autoreg.
Unstructuredhidden Markov
1. No change
0.06 0.20 0.14 0.08
2. 25% reduction in transmission rate
0.49 0.75 0.71 0.31
3. 50% reduction in transmission rate
0.95 1.00 1.00 0.48
Frequency of obtaining p< 0.05

Summary/Conclusions: Statistical analysis based on transmission models
• Hospital infection data: time series of low-numbered counts, serial autocorrelation, overdispersion
• Standard statistical models, almost universally used, don’t fit– Infectious disease modelled without contagion– Fail to capture autocorrelation, overdispersion– Don’t resemble the data– Inflated type 1 error rate

Summary/Conclusions II: Statistical analysis based on transmission models
• Mechanistic (transmission models) provide a basis for estimation with– Better fit– Inference about parameters of interest– Better hypothesis testing characteristics