Embed Size (px)
Citation preview

1
USING A GRAPHIC ORGANIZER TO PROMOTE PROBLEM-SOLVING SKILLS IN A SECONDARY MATHEMATICS CLASSROOM
By
CASSIDY FULLER
A THESIS PRESENTED TO THE GRADUATE SCHOOL OF THE UNIVERSITY OF FLORIDA IN PARTIAL FULFILLMENT
OF THE REQUIREMENTS FOR THE DEGREE OF MASTER OF ARTS IN EDUCATION
UNIVERSITY OF FLORIDA
2009

2
© 2009 Cassidy Fuller

3
To my mom who has always stood by me and motivated me to be a better student and person.

4
ACKNOWLEDGMENTS
I would like to thank Dr. Stephen Pape for his guidance and motivation and Dr.
Tim Jacobbe for his support and understanding. I would also like to thank Karina
Hensberry for helping me stay focused and my brother for his encouragement. Last but
certainly not least, I would like to thank my mother for knowing all the right words to say
and keeping me grounded.

5
TABLE OF CONTENTS page
ACKNOWLEDGMENTS .................................................................................................. 4
LIST OF TABLES ............................................................................................................ 7
LIST OF FIGURES .......................................................................................................... 8
ABSTRACT ..................................................................................................................... 9
CHAPTER
1 INTRODUCTION .................................................................................................... 10
2 REVIEW OF LITERATURE .................................................................................... 12
How Students Learn ............................................................................................... 12
Learning Mathematics ...................................................................................... 12 Experts versus Novices .................................................................................... 16
Problem Solving ...................................................................................................... 19
Graphic Organizers ................................................................................................. 30 Graphic Organizers in Reading ........................................................................ 31
Graphic Organizers, Mathematics, and Reading .............................................. 33 Summary of Literature ............................................................................................ 38
3 METHODS AND PROCEDURES ........................................................................... 40
Participants ............................................................................................................. 40 Instrumentation ....................................................................................................... 40
Procedure and Data Collection ............................................................................... 42 Data Analysis .......................................................................................................... 43
4 RESULTS ............................................................................................................... 46
Research Question 1 .............................................................................................. 46
Research Question 2 .............................................................................................. 47 Student Work .......................................................................................................... 48 Student Attitudes .................................................................................................... 58 Summary of Findings .............................................................................................. 60
5 CONCLUSIONS ..................................................................................................... 63
Discussion .............................................................................................................. 63 Limitations ............................................................................................................... 64 Implications for Future Research ............................................................................ 66

6
APPENDIX
A PRETEST ............................................................................................................... 67
B POSTTEST ............................................................................................................. 68
C GRAPHIC ORGANIZER ......................................................................................... 70
D INTERVIEW PROTOCOL ....................................................................................... 71
E PRETEST AND POSTTEST INTERVIEW RESPONSES ....................................... 72
LIST OF REFERENCES ............................................................................................... 75
BIOGRAPHICAL SKETCH ............................................................................................ 79

7
LIST OF TABLES
Table page 3-1 Problem-solving processes rubric used when coding students’ written
responses. .......................................................................................................... 45
4-1 Pretest Interview, Pretest, and Posttest Problem-Solving Processes Scores and the Number of Students that Achieved that Score. ...................................... 48
4-2 Comparing problem-solving success and process score change from pre to post test. ............................................................................................................. 51

8
LIST OF FIGURES
Figure page 4-1 Participant 5’s pretest. ........................................................................................ 52
4-2 Problem 1 from participant 5’s posttest. ............................................................. 53
4-3 Problem 2 from participant 5’s posttest. ............................................................. 54
4-4 Participant 17’s pretest problem 1. ..................................................................... 55
4-5 Participant 17’s posttest problem 2. .................................................................... 56
4-6 Participant 20’s pretest problem 1. ..................................................................... 57
4-7 Participant 20’s posttest problem 2. .................................................................... 58

9
Abstract of Thesis Presented to the Graduate School of the University of Florida in Partial Fulfillment of the
Requirements for the Master of Arts in Education
USING A GRAPHIC ORGANIZER TO PROMOTE PROBLEM-SOLVING SKILLS IN A SECONDARY MATHEMATICS CLASSROOM
By
Cassidy Fuller
December 2009
Chair: Stephen Pape Major: Mathematics Education
A problem is a task ―for which the student does not have a readily accessible
mathematical means by which to achieve that resolution‖ (Schoenfeld, 1989, p. 88). By
solving problems and facing challenges, students can start to gain expert
characteristics, like metacognitive awareness, and reduce their novice mistakes.
Increasing a student’s problem-solving strategies can help reduce novice mistakes. Like
problem solving, graphic organizers have been used to increase understanding of
concepts and bridge the gap between prior knowledge and incoming information. In this
study a graphic organizer was designed using Polya’s (1985) problem-solving phases
and Schoenfeld’s (1987) questioning techniques to promote problem-solving success
and increase problem-solving processes in student solutions. Students’ success and
process scores increased significantly by using a graphic organizer. During interviews,
students reported that the graphic organizer made them slow down when solving the
problems, causing them to avoid minor mistakes and errors. It was concluded that a
graphic organizer can be used beyond text comprehension in reading and can promote
problem-solving skills and increase problem-solving success in a secondary
mathematics classroom.

10
CHAPTER 1 INTRODUCTION
Mathematics has a reputation of being one of the less popular subjects in school.
Many students give up and do not feel like they are able to succeed at mathematics
once they have had a bad experience. One explanation for this could be the way
mathematics is currently taught in schools. The National Council of Teachers of
Mathematics’ (NCTM, 2000) Principles and Standards for School Mathematics states,
―Students’ understanding of mathematics, their ability to use it to solve problems, and
their confidence in, and disposition toward, mathematics are shaped by the teaching
they encounter in school‖ (p. 16-17). Students tend to see problems as having only one
right answer and only one right way to find that answer. This is a common
misconception and a cause of mathematics anxiety in students (Schoenfeld, 1987).
Problems by their very nature cause confusion and doubt (Lambdin, 2003). For
this reason alone, students hesitate to attempt to find a solution. Problem-solving
methods and strategies give students the tools to feel confident when trying unfamiliar
problems. This does not mean that students will not have difficulty; problem solving in a
mathematics classroom is often a situation where students struggle to find a solution
(Hiebert, 2003). NCTM’s (1980) An Agenda for Action, said that problem solving fosters
conceptual understanding and learning mathematics with such an understanding
increases students’ ability to transfer knowledge (National Research Council (NRC),
2000). It has nearly been thirty years since this call to action and problem solving is still
not found in most classrooms. Students cannot afford the implementation of problem
solving to be delayed any longer.

11
Word problems are often included in problem solving activities. Students’ anxiety
increases toward mathematics when reading comprehension within a problem is also
required (Brennan & Dunlap, 1985). Students have difficulty decoding mathematical
word problems. Decoding involves translating between words, symbols, numbers,
letters, and graphics. In this research study, the use of a graphic organizer was used to
help bridge the gap between mathematics and reading within word problems was
explored. Graphic organizers increase understanding and require students to break
down a problem into manageable pieces and slow down the problem-solving process
(Braselton & Decker, 1994). Furthermore, graphic organizers may support problem-
solving techniques and students’ abilities to think through the individual steps of a
problem as suggested by Polya (1985).
This study examines the impact of a graphic organizer on students’ problem-
solving processes and success on word problems. The graphic organizer created for
this study uses Polya’s (1985) and Schoenfeld’s (1987) problem-solving method and
questions that have been shown to help improve students’ mathematical thinking and
understanding. In this study, a pretest and posttest were created to test the students’
abilities to problem solve before and after being introduced to the graphic organizer.
The researcher investigated how the problem-solving graphic organizer affected student
achievement in a high school mathematics classroom and if the students’ were able to
break down the problem and devise a solution more clearly when using the graphic
organizer. The research questions for this study were:
1. How does using a graphic organizer that includes problem-solving methods influence student achievement on word problems?
2. How will the use of the researcher’s graphic organizer influence students’ use of Polya’s four stages of problem solving?

12
CHAPTER 2 REVIEW OF LITERATURE
How Students Learn
It is important for educators to understand how students learn in order to
effectively teach them. It is imperative that students are developing a conceptual
understanding of the content instead of memorizing and reiterating information on
homework assignments, exams, and other assignments. In order to learn effectively,
students need to find a balance between conceptual understanding and procedural
knowledge.
Learning Mathematics
Mathematics is one of the few content areas in which it is socially acceptable to
admit failure. Many students have a negative outlook toward mathematics because they
feel that they are unable to succeed and cannot improve their mathematics skills.
Students’ mathematical confidence can change and certain teaching strategies can
foster this change. The National Research Council’s (NRC, 2005) How Students Learn
focuses on three well-established principles of learning and points out that mathematics
is rarely taught in a way that makes use of these principles.
Instead of connecting with, building on, and refining the mathematical understandings, intuitions, and resourcefulness that students bring to the classroom (Principle 1), mathematics instruction often overrides students’ reasoning process, replacing them with a set of rules and procedures that disconnects problem solving from meaning making. Instead of organizing the skills and competences required to do mathematics fluently around a set of core mathematical concepts (Principle 2), those skills and competencies are often themselves the center, and sometimes the whole, of instruction. And precisely because the acquisition of procedural knowledge is often divorced from meaning making, students do not use metacognitive strategies (Principle 3) when they engage in solving mathematics problems (p. 217).

13
In order to learn mathematics successfully, a student needs to have
mathematical proficiency. Mathematical proficiency has
five components, or strands:
conceptual understanding—comprehension of mathematical concepts, operations, and relations
procedural fluency—skill in carrying out procedures flexibly, accurately, efficiently, and appropriately
strategic competence—ability to formulate, represent, and solve mathematical problems
adaptive reasoning—capacity for logical thought, reflection, explanation, and justification
productive disposition—habitual inclination to see mathematics as sensible, useful, and worthwhile, coupled with a belief in diligence and one’s own efficacy‖ (NCR, 2001, p. 116).
The five strands are interdependent and interwoven. In order to have success within
mathematics a student needs to possess and use all five.
Learning mathematics needs to be fixed in an understanding of the nature of a
problem and on a student’s own reasoning and strategy development so that the
student feels personally involved in the problem. If it is learned in any other way, solving
problems will depend on procedural fluency and the ability to recall memorized rules
and facts (NRC, 2005) without integrating the other four strands. Learning that is
embedded in a student’s understanding of a problem or concept increases the likelihood
of transfer. Transfer of knowledge is defined as ―the ability to extend what has been
learned in one context to new contexts‖ (NRC, 2000, p. 51). Teachers hope that
students will be able to transfer their learning beyond the classroom and apply their
strategic competence to a variety of problems (NCR, 2001). Knowledge transfer

14
shouldn’t stop after the knowledge has transferred from one problem to the next and
from one school year to another, it should also continue between school and home and
from school to the work place (NRC, 2000). This type of transfer will increase the
amount of prior knowledge a student has and therefore make it easy for them to solve
problems when faced with unknown situations in and outside of the classroom.
―All learning involves transfer from previous experience‖ (NRC, 2000, p. 68).
Principle 1 focuses on building students’ prior knowledge and engaging them in the
classroom so that students will start to see mathematics as more than just procedures
and computation. Building on students’ prior knowledge helps increase engagement in
the classroom and can also act as a source of transfer. With more prior knowledge
comes the ability to see multiple entry points into a problem. Problems that have
multiple strategies can engage more students in the classroom by making each student
feel like their strategy has meaning and value in the classroom. When students believe
that several correct methods exist for a given problem, their eagerness to develop
strategies for problem solving will increase (NRC, 2005).
Principle 2 focuses on how equally important it is for students to understand and
see the link between procedural knowledge and conceptual understanding. When
learning, students build on their previous knowledge and have to condense this
knowledge in order to organize new concepts and procedures. This process creates
networks of understanding that are organized into paths that begin with an informal
concrete understanding of a concept that is soon condensed into a more abstract idea
(NRC, 2005). When students are engaged in a learning activity, they must connect their
―informal knowledge and experience to mathematical abstraction‖ (NRC, 2001, p. 9).

15
When students represent their solution strategies in a more general way, they increase
the probability of positive transfer and decrease the chance of a previous strategy being
used inappropriately (NRC, 2000).
Transfer can be improved by students becoming more aware of themselves as
learners. Metacognitive approaches to instruction increase the degree to which transfer
occurs without the use of explicit prompting (NRC, 2000). Principle 3 highlights how
influential students’ previous experiences can be when solving mathematical problems.
When students are aware of how they monitor themselves while solving a problem and
reflect on their solution strategies, they will be more effective as they approach
unfamiliar problems. Self-monitoring involves a student using adaptive reasoning to
examine if their explanation of the answer is correct and valid. This can include going
back and rechecking each of the steps used to solve the problem. Other examples of
self-monitoring include drawing a picture to help clarify understanding of known and
unknown information and self-questioning to ensure the strategy will likely lead to a
correct solution. Another tool that helps students learn is ―debugging‖ a wrong solution.
―Debugging‖ involves realizing where the error occurred, why it is an error, and how it is
able to be corrected (NRC, 2005). After these self-monitoring techniques are learned
and used, a knowledge base is formed that can be accessed and built upon when
solving new problems. Being metacognitively aware when solving a problem is a difficult
ability to learn but it can change the way students solve problems.
Integrating metacognitive instruction and emphasizing the importance of
understanding all aspects of the solution strategy of a problem, enhances student
achievement and the ability to learn independently (NRC, 2000). Kramarski, Mevarech,

16
and Arami (2002) state that a major element of metacognitive instruction is to train
students to reason mathematically by creating and answering the following questions
and ideas:
a) comprehending the problem (e.g., "What is the problem all about‖?);
b) constructing connections between previous and new knowledge (e.g., ―What are the similarities/differences between the problem at hand and the problems you have solved in the past? and why?‖;
c) using strategies appropriate for solving the problem (e.g., ―What are the strategies/tactics/principles appropriate for solving the problem and why?‖; and in some studies also
d) reflecting on the processes and the solution (e.g., ―What did I do wrong here?‖; ―Does the solution make sense?‖). (p. 228)
The metacognitive instructional tools of self-monitoring and ―debugging‖ are just
a few of the ways to help students become better problem solvers. Being able to
recognize problem schemas combined with metacognitive awareness will elevate all
students’ understanding. Experts in mathematics and other content areas use problem
schemas to attempt new and unfamiliar problems. By introducing students to strategies
and tools that experts use when problem solving, like recognizing schemas, they have
an opportunity to internalize these expert traits and reduce their novice mistakes.
Experts versus Novices
Understanding the thought process and problem-solving skills that an expert
uses can help educators instill expert characteristics into their novice students.
Educators do not expect their students to be experts in any content area but examining
what it means to be an expert on a subject allows teachers to see what successful
learning looks like (NRC, 2000). Knowing this, teachers can use strategies that increase
successful learning.

17
Novices work on the basis of surface features of a problem while experts are
able to make inferences and identify principles that go deeper than surface structures
(Langan-Fox, Albert, & Waycott, 2000). There is a limit to the amount of information that
people are able to hold in their short-term memory. Short-term memory can be
enhanced by chunking information together that has a familiar pattern (NRC, 2000).
According to Chi, Feltovich, and Glaser (1981), ―knowing more‖ means having more
conceptual chunks in memory, more relations or features defining each chunk, more
interrelations among the chunks, and efficient methods for retrieving related chunks and
procedures for applying these informational units in problem-solving contexts. Experts
use this technique and organize knowledge in terms of schemas (Langan-Fox et al.,
2000). Marshall (1995) defines schemas as
vehicles of memory, allowing organization of an individual’s similar experiences in such a way that the individual
can easily recognize additional experiences that are also similar, discriminating between these and ones that are dissimilar;
can access a generic framework that contains the essential elements of all of these similar experiences, including verbal and nonverbal components;
can draw inferences, make estimates, create goals, and develop plans using the framework; and
can utilize skills, procedures, or rules, as needed when faced with a problem for which this particular framework is relevant (p.39).
These schemas invoke sensitivity to patterns of meaningful information that are not
available to novices and help guide how problems are represented and understood
(NRC, 2000).
Experts’ knowledge is ―conditionalized‖ to include an understanding of the
contexts in which the information will be useful. Most traditional forms of curricula and

18
instruction do not aid students in forming conditionalized knowledge. Textbooks often
give students laws of mathematics but do not include how they can be useful in solving
problems. One way for students to learn when, where, and why to use the knowledge
they are learning is through solving word problems that require students to use
appropriate concepts. This will help them learn about conditions of applicability (NRC,
2000) and strengthen their adaptive reasoning. An important aspect of applicability is
recognizing problem types and being able to retrieve the existing schemas related to
that type of problem. Novice students can have the necessary knowledge but not the
ability to understand when and how to apply that knowledge to unfamiliar problems.
During the process of learning, becoming fluent at recognizing types of problems
is necessary. Fluent retrieval does not always mean performing faster on a task. Most
experts spend more time trying to understand problems before jumping into working the
problem out. As mentioned earlier, the amount of information a person can remember
and process in a short period of time is limited, therefore fluency in certain aspects of a
task can ease the processing of new information included in that task (NRC, 2000).
It is critical for students to be able to metacognitively monitor their knowledge
while learning. If a student is able to evaluate their solution strategy and decide that
they do not understand or are lacking information, they can save themselves from
straying away from the goal. Being able to monitor the current level of understanding
and decide when it is not adequate will aid students in taking the necessary steps to
remedy the situation and not limit their current level of knowledge (NRC, 2000).
The characteristics of expertise need to be considered as parts of a whole. They
are interconnected and when analyzed as a whole, can help teachers understand what

19
it means to be a successful learner and part of being a successful learner is being an
effective problem solver. Problem solving is a tool that every expert possesses and can
utilize in different and unknown situations. Equipping students with the tools to be an
effective problem solver will increase their expert traits and decrease their novice
mistakes when solving problems.
Problem Solving
A mathematical problem for any student is defined by Schoenfeld (1989) as ―a
task (a) in which the student is interested and engaged and for which he wishes to
obtain a resolution, and (b) for which the student does not have a readily accessible
mathematical means by which to achieve that resolution‖ (p. 88). A task that relies on
routines and memorized algorithms should be referred to as an exercise. All three
principles from the NRC (2005) emphasize the importance of challenging students to
increase their learning, therefore using problems instead of exercises can increase
student learning.
Problem solving has been defined in many different ways. For the purpose of this
study, problem solving will be defined as ―a form of inquiry learning where existing
knowledge is applied to a new or unfamiliar situation in order to gain new knowledge‖
(Hammouri, 2003, p. 571) where inquiry learning is based on student’s questions. In An
Agenda for Action, the importance of problem solving was emphasized by the National
Council of Teachers of Mathematics (NCTM, 1980). NCTM (1980) raised awareness on
how vital problem solving is in the classroom and the need to make problem solving the
focal point of school mathematics. When problem solving is implemented in the
classroom, students’ focus shifts from memorizing mathematical facts and procedures
to developing a conceptual understanding of the mathematical concepts (Lesh &

20
Zawojewski, 2007; NCTM, 2000; Schoenfeld, 1987). This fosters an environment that
focuses on learning for understanding rather than just rote exercises (NRC, 2005).
Obtaining a connection between procedural and conceptual knowledge increases
students’ understanding and problem solving is a vehicle that helps create this
connection. Problem solving also incorporates the use of a student’s adaptive reasoning
when determining whether the procedure used was appropriate and strategic
competence when the solution strategy is monitored for effectiveness (NCR, 2001).
Before NCTM stated that the curriculum needed to be reformed, George Polya
introduced the term ―modern heuristic‖ to describe the art of problem solving
(Schoenfeld, 2007). Heuristic is an adjective for experienced-based techniques that help
promote problem solving and learning. Heuristic methods, or heuristics, are used to
arrive at a solution that is close to the best possible solution. The method of trial and
error can be seen as a common heuristic. Polya (1954) compared learning mathematics
to the discovery of mathematics. Instead of teachers giving a clear cut solution to the
students, they need to see all additional steps and work that goes into solving a
problem. Polya emphasized that students’ experience with mathematics have to be
consistent with the way mathematics is done. This process includes being given a
problem and going through a process of trial and error until an appropriate solution
strategy is found.
Polya’s (1985) heuristic for problem solving includes four phases that students
must go through in order to effectively solve a problem: (1) understanding the problem;
(2) devising a plan; (3) carrying out the plan; and (4) looking back (p. xvi-xvii).
Understanding the problem emphasizes that students need to fully understand the given
21
information and goal of the problem. Without fully comprehending these characteristics
of the problem, students may choose inappropriate solution strategies (Schoenfeld,
1987) or feel helpless and unable to solve the problem. Polya (1985) lists a few
questions a problem solver should ask at this phase, ―What is the unknown? What are
the data? What is the condition?‖ (p. xvi).
Finding the connection between what is given and what is being asked in the
problem is important in phase two, devising a plan. Polya (1985) suggests thinking of
similar problems to help aid the problem solver in finding the connection and when the
connection is found, a plan should then be constructed before attempting to solve the
problem.
Carrying out the plan is a phase that exists in most students’ solution strategies
but it is important to understanding that carrying out a plan involves more than doing
computational procedures. The problem solver needs to check each step and question
if the plan that was chosen is the best for that problem (Polya, 1985). Checking each
step ensures that there are no errors and allows for constant ―debugging‖ (NRC, 2005).
Questioning the plan and deciding if it was the best choice may include attempting
different strategies and periodically going back to devise a new plan. If problem solvers
do not include this process in their solution strategies they can end up on a wild
mathematical goose chase that wastes lots of valuable time (Schoenfeld, 1987).
Reflecting upon and examining the solution is the basis for phase four, looking
back. This is one of the most neglected steps in Polya’s (1985) problem-solving method
yet the most important. When Polya discusses the importance of the looking back
phase he says, ―by looking back at the completed solution, by reconsidering and

22
reexamining the result and the path that led to it, they could consolidate their knowledge
and develop their ability to solve problems‖ (p. 14-15). Looking back at the problem also
opens up an opportunity to improve and stimulate students’ creative thinking skills
(Krulik & Rudnic, 1994).
These four phases should be used to help students ―think about, reflect on, and
interpret problem situations‖ (Lesh & Zawojewski, 2007, p. 768) rather than a step-by-
step guide when a student is stuck while solving a problem. Engaging in all four steps
will improve understanding and benefit students’ problem-solving skills (Polya, 1985)
and increase their mathematical proficiency.
Having students implement Polya’s problem-solving process can decrease
instances of carelessness and misunderstandings (Jacobbe, 2008). Jacobbe gave 29
students in a mathematics education course for elementary school teachers the
following problem:
Write an equation to represent the relationship between the number of professors and the number of students.
There are six times as many students as there are professors at this university. Use S for the number of students and P for the number of professors. (p. 391)
Seventy-nine percent of the students answered incorrectly. During the following two
months, the students were shown Polya’s problem-solving process and were given
numerous problems to exercise the method with an emphasis on looking back at the
answer and checking for reasonableness of the solution. After two months had passed,
a second problem was given to the students:
Write an equation using the variables C and U to represent the following statements:
23
There are eight times as many people in China as there are in the United States, use C to represent the number of people in China and U to represent the number of people in the United States (p. 391).
During the two month period between the first and second problem, the students
continued learning about elementary school mathematics methods and the initial
problem was never discussed. Eighty six percent of students answered the second
question correctly when using Polya’s four step process. The results showed that
having students look back at the solution process would help students reflect on the
solution and also ―debug‖ their solution of any errors.
Polya’s problem-solving method requires students to reflect on their solutions
and the strategies used to arrive at those solutions. This process supports the
development of students’ metacognitive skills and adaptive reasoning. Like problem
solving, metacognition was a big buzzword in the 1980s. To clear up some of the
confusion of the term, Schoenfeld (1987) describes metacognition as ―three related but
distinct categories of intellectual behavior:
1. Your knowledge about your own thought process. How accurate are you in describing your own thinking?
2. Control, or self-regulation. How well do you keep track of what you’re doing when (for example) you’re solving problems, and how well (if at all) do you use the input from those observations to guide your problem solving actions?
3. Beliefs and institutions. What ideas about mathematics do you bring to your work in mathematics, and how does that shape the way that you do mathematics?‖ (p. 190).
Schoenfeld’s different aspects of self-regulation resemble Polya’s problem-
solving method. Schoenfeld (1987) relates self-regulation to management. The different
aspects of management include ―(a) making sure that you understand what a problem is
all about before you hastily attempt a solution; (b) planning; (c) monitoring, or keeping

24
track of how well things are going during a solution; and (d) allocating resources, or
deciding what to do, and for how long, as you work on the problem‖ (p. 190). In his own
problem-solving courses, Schoenfeld (1987) uses three questions to probe students
while they engage in problem solving: What (exactly) are you doing? (Can you describe
it precisely?) Why are you doing it? (How does it fit into the solution?) How does it help
you? (What will you do with the outcome when you obtain it?) (p. 98). These questions
force students to monitor their strategies and make sure they are still answering the
question that was originally posed.
To describe how important it is to regulate oneself, Schoenfeld (1987) compared
novices (students) and an expert (a mathematician) while they solved a problem. The
students were given a problem to do in twenty minutes and most of them spent the
entire time on a ―wild goose chase‖ (p. 193). They read the problem and then
proceeded to explore one strategy the entire time and never stopped to ask themselves
if they were going in the right direction or if they should try a different strategy. A
mathematician, whose focus was not on Geometry, was given a geometry proof to do in
twenty minutes. He spent the majority of his time thinking about what to do rather than
pursuing a particular solution strategy. When he did try a solution strategy he would
evaluate if he felt that it was going in the right direction and if he was not he would go
back and analyze the problem again. In this situation, the students actually had a
greater advantage when it comes to having knowledge about the presented problem
because their problem relied heavily on their recent prior knowledge but yet it was the
mathematician that successfully solved the problem. This was attributed to the
25
mathematician’s self-regulation while solving the problem which is a characteristic of an
efficient problem solver.
Cognitive and metacognitive behaviors are important when problem solving but
the role of each behavior during the problem-solving process can become confusing.
Generally, metacognition involves choosing, planning, and monitoring what is to be
done and cognition is more involved in the processing of information. Artzt and Armour-
Thomas (1992) examine the two behaviors in a study involving seventh-grade students.
In order to code the observed behaviors, Artzt and Armour-Thomas created a
framework for the protocol analysis that would distinguish between different
metacognitive and cognitive episodes of problem solving observed during the group
work. The episodes were based on a synthesis of the problem-solving steps identified
by Polya (1985) and Schoenfeld (1987). Although Schoenfeld’s framework was used as
the main starting point, the episodes were altered to fit the needs of the study. During
the coding process each of the eight problem-solving episodes (read, understand,
analyze, explore, plan, implement, verify, watch and listen) was categorized as cognitive
or metacognitive even though it was understood that the two behaviors can coexist
during an episode. But for the purpose of the study, the behavior that was most
predominate was used to code that episode.
The episodes that had cognitive and metacognitive as the predominate behaviors
were explore, implement, and verify. Understand, analyze, and plan had more
metacognitive behaviors. The read episodes were mostly cognitive, and the watch and
listen episode was not assigned a cognitive level.

26
Although the students were working in groups, their cognitive levels were coded
individually. Of all the groups, 171 behaviors were coded as metacognitive and the
episodes that the behavior appeared the most in were exploring and understanding
episodes. Interestingly, the only group that did not solve the problem had the lowest
percentage of metacognitive behaviors and the highest percentage of cognitive
behaviors. This shows a correlation between the use of metacognitive strategies and
student achievement.
Similarly, 159 behaviors were coded as cognitive and 96 were in the exploring
category and 38 were in the reading category. All of the episodes occurred intermittently
throughout the group work. Therefore, there is no step-by-step process of solving a
problem, each step has to be revisited and reevaluated through the solution strategy.
Exploring (cognitive and metacognitive together) was the behavior that was seen most
in the group work. The exploratory phase led the way for the creation of plans,
implementing of plans, analysis, and back to more exploration and implementation
episodes. This process is similar to the way the expert mathematician solved the
unfamiliar problem in Schoenfeld’s (1987) observations and plays an important role in
successful problem solving. Polya’s (1985) problem-solving phases occur in a similar
way. Each phase can be revisited and reevaluated to better understand the problem,
strategy, and solution. This study also shows that there is a relationship between the
use of cognitive and metacognitive behaviors that is necessary for student’s problem-
solving efforts to result in a solution in group work but this conclusion can be expanded
to individual student work since the analysis was done on an individual basis.

27
To further investigate the need for metacognitive behaviors to solve a problem,
Lucangeli and Cornoldi (1997) developed a research study that was aimed at seeing
what type of knowledge and awareness was activated in students when confronted with
mathematical tasks. The Emmepiu’ mathematics test was administered and
accompanying it was a researcher constructed metacognitive test. In addition to finding
the answer to the problems, the students were asked questions concerning their
prediction, planning, monitoring, and evaluation skills. The predictions were considered
positive if the outcome matched the prediction. For planning, the students were asked to
state what operations they were going to use to solve the problem and the specific
order. For monitoring, the students picked the strategies to perform the chosen
operations in the planning phase and to keep track of the execution of these strategies.
Evaluation mirrored the prediction operation in that they were to state if they thought
they correctly solved the problem. When the test was administered, students were
asked to answer the prediction and planning items before beginning to solve the
problem. During the process of solving the problem, the students were asked to
describe the strategies used to monitor the performance. Once they were finished they
evaluated their solution.
The use of metacognitive processes positively related to mathematical
achievement. This relationship was stronger for tasks that were less automated (e.g.,
problem solving and geometrical tasks). In both grade levels the problem solving and
geometrical tasks required students to use metacognitive abilities while predicting,
planning, monitoring, and evaluating their solution. Therefore when students perform
automatised arithmetic operations, they are not exercising as much metacognitive skills

28
as they do when they are problem solving. The students have performed the procedural
operations before and do not have to think about their solution strategy as much. This is
because they are familiar with the steps that are necessary for the task, unlike the
problems that required the students to problem solve in order to reach a solution.
Although problem solving does not consist of only word problems, word problems
are often used in classrooms to facilitate problem-solving skills. Teong (2003) examined
the influence of explicit metacognitive training on forty 11 to 12-year-old low achieving
students’ problem-solving success. Teong implemented a problem-solving method that
is similar to Polya’s (1985) and Schoenfeld’s (1987) methods. The CRIME strategy was
used to facilitate problem-solving skills where CRIME stood for Careful reading, Recall
possible strategies, Implement possible strategies, Monitor, and Evaluation. The study
consisted of a two-phase design, an experimental design and a case study design. In
the experimental design students completed a word-problem test and in the case study
design students did problems while prompted to do a think aloud exercise that were
video-recorded. The children were split up into two groups: one group had explicit
metacognitive training using the CRIME acronym and the other group solved problems
without the CRIME strategy. The students were given the two evaluations following an
equal number of instructional sessions. The results from the individual test showed that
the children in the CRIME group outperformed those that did not use it on word-
problems. It was also shown that ―the ability to know when and how to use
metacognitive behaviours when they are needed are important determinants to
successful word-problem solving‖ (p.53).

29
Word problems cause difficulty for students because they require mathematical
problem-solving skills and reading comprehension. Pape (2004) aimed to develop a
description of the behaviors that middle school students exhibit while they solve word
problems. Students participated in a Think Aloud Stimulus that consisted of eight word
problems while the researcher probed students to explain their solution processes
aloud. The data was coded according to problem-solving behavior (direct translation
approach and meaningful approach), success, and type of error.
Students who ―recorded the given information, exhibited greater use of the
context, and provided explanations and justifications for their mathematical steps solved
more problems, committed fewer errors of understanding, and preserved the elements
and structure of the problems better when recalling the problems‖ (p. 208). Therefore
students who engaged in strategies to understand the problem, Polya’s (1985) first
phase, were able to translate the text of the word problem into mathematical
terminology and use their strategic competence to arrive at a solution. Successful
students in the study showed evidence that they translated and organized the given
information from the problem by rewriting it on the paper. They also supplied an
explanation for their mathematical steps and justified their solutions. Hence, students
who engaged in all four of Polya’s (1985) phases were more successful.
All experts are efficient problem solvers. The ability to be able to approach
problems in a variety of ways, while accessing prior knowledge and schemas is not
easily learned by novices but can be acquired over time. A potential method to help
students make the transition between being a novice and becoming an expert is using
graphic organizers. Graphic organizers can catalyze the process of gaining qualities of

30
an expert (Langan-Fox et al., 2000) and increase metacognitive behaviors which are
shown to influence student achievement (Artzt & Armour-Thomas, 1992; Lucangeli &
Cornoldi, 1997). This could be attributed to the visuospatial arrangement of words or
statements that connect key conceptual relationships in graphic organizers (Horton,
Lovitt, & Bergerud, 1990). This arrangement helps novices form a schema similar to
those of experts.
Graphic Organizers
There have been a variety of terms used to describe the graphic display of
information including graphic organizers, structured overviews, concept maps, flow
charts, and tree diagrams. Much research was done in the early 1960s by Ausubel that
focused on organizing prior knowledge so that new knowledge could easily be
assimilated. Learning occurs when the cognitive structure can expand and strengthen
while incorporating new information (Kim, Vaughn, Wanzek, & Wei, 2004). Advanced
organizers facilitate knowledge acquisition from prose and provide a framework for
relating existing knowledge to new material (Ausubel & Fitzgerald, 1961). Ausubel’s
research concluded that advanced organizers have the potential to link prereading
information with a reader’s existing schemata (Ausubel, 1960).
Ausubel believed that advanced organizers were effective in enhancing reading
comprehension. Although his work seemed promising, it was criticized by many for
lacking the proper experimental controls (e.g., Frase, 1975; McEneany, 1990). For
example, McEneany (1990) found the assumption of unfamiliarity with the to-be-learned
material was unfulfilled and seeing that acquiring knowledge of new materials was one
of the preconditions of Ausubel’s research. This raised a question for many. Although
this speculation loomed in researchers’ minds, further studies revealed that advanced
31
organizers were associated with increasing learning and retention (Corkhill, 1992;
Luiten, Ames, & Ackerson, 1980; Stone, 1983).
The shift in the terminology depended on the current use of the organizer.
Advanced organizer was one of the first terms used for graphic representations of
information but others developed over time. Merkley and Jefferies (2001) describe the
terminology transformations as the use shifted from just prereading prose passages in
Ausubel’s research to being an outline format, the name changed from advanced
organizer to structured overview. Once structured overviews were adapted to being
used for prereading, during-reading, and postreading tasks the terminology changed
again to graphic organizers. Novak and Gowin (1984) adapted graphic organizers to
develop schemas, or concept mapping, as a metacognitive tool for learning that would
emphasize the importance of labeling links between concepts. For the purpose of this
study, a graphic organizer is defined as a visual representation of information that
guides the user and enables them to better understand the given problem.
Graphic Organizers in Reading
Most of the research on graphic organizers is in the area of reading and reading
comprehension. All of Ausubel’s research was based on using organizers for
comparative and expository texts. Mayer (1984) examined reading as a process of
storing and taking in information and believed that graphic organizers could be used to
display connections among the incoming information.
In order to better understand the use of graphic organizers, Kim et al. (2004) did
a synthesis of research that focused on graphic organizers and their effects on students’
reading comprehension. Most of their studies they examined were based on students
with a learning disability (LD), who used graphic organizers to assist in learning from

32
expository text. The 21 studies that were chosen included a total of 848 students with
LD and used one of four types of graphic organizers including semantic organizers,
cognitive maps with a mnemonic, cognitive maps without a mnemonic, and framed
outlines. Each organizer served the basic purpose of helping students comprehend
reading passages. The treatments that used semantic organizers found that the
students demonstrated significantly higher scores on research-developed
comprehension measures than students in comparison groups. The students with LD
slightly surpassed regularly developing students. The three treatments that used
cognitive maps with a mnemonic outperformed those using conventional reading
techniques on a reading comprehension test. The seven studies that used cognitive
maps without a mnemonic were associated with higher comprehension scores than
comparison conditions (i.e. typical reading instruction). The two studies that used
framed outlines also showed positive effects on students’ reading comprehension. No
significant differences across elementary to secondary grades were found when
analyzing the effects of the graphic organizers on reading comprehension. Kim et al.
(2004) concluded ―the effects of graphic organizers on the reading comprehension of
students with LD revealed overall beneficial outcomes across the studies‖ (p. 114).
The connection between the use of graphic organizers and reading was strong
but researchers still wanted to know if the use of the graphic organizer extended beyond
just comparative and expository texts. Horton, Lovitt, and Bergerud (2001) investigated
the effectiveness of graphic organizer for content area classes at the secondary level.
Three classes in middle school science, three in middle school social studies, and three
in high school social studies participated. Eight students out of the combined nine

33
classes were considered to have a LD, and the high school social studies class
contained nine remedial students. Two reading passages were chosen for the study.
These passages came from the assigned textbook and were chosen by the
researchers. The graphic organizers were created by the researchers for the two
passages in a hierarchical format that is similar to an outline. The students were given
an incomplete diagram with directions of how to complete the graphic organizer. The
experiments included various ways of testing and comparing the effectiveness of
students’ self-study techniques and use of the graphic organizer. Self-study techniques
included ―making a diagram or outline, writing short sentences of main ideas,
formulating and answering questions, defining key terms using the glossary, or any
other self-study strategy as long as they worked independently, and attempted to
produce a written product‖ (Horton, Lovitt, & Bergeurd, 2001, p.15). The experiments
showed that the graphic organizers produced significantly higher performance than self-
study techniques for students with a LD, remedial students, and regular education
students.
Prior research supports a positive impact of graphic organizers in the classroom
when the content is related to reading a text. Graphic organizers were also shown to
increase comprehension in other content areas such as science and social studies
(Horton, Lovitt, & Bergerud, 2001; Kim et al., 2004). Although these studies include
multiple content areas, the relationship between graphic organizers and mathematics
was not addressed.
Graphic Organizers, Mathematics, and Reading
Reading and mathematics are content areas that are not mutually exclusive.
Mathematics instruction often assumes that the learner has typical language skills (Ives

34
& Hoy, 2003). In addition, mathematics is one of the most difficult content areas to read.
This is due to the number of concepts that exist per word, sentence, and paragraph in
mathematics texts. Reading mathematics requires the reader to switch between
different types of vocabulary and translate between words, symbols, letters, numbers,
and graphics (Braselton & Decker, 1994). Maffei (1973) indicated that reading teachers
were more successful at teaching students how to solve mathematical word problems
than mathematics teachers because of the high level of reading that is involved.
Textbooks used in the curriculum further complicate a student’s ability to read
mathematics. The mathematics content is appropriate for grade level but the reading
level of the text is often one to three years above the reader’s level (Brennan & Dunlap,
1985). One way to close the gap between students’ reading level and mathematics
achievement is the use of graphic organizers (Braselton & Decker, 1994).
In their action research project, Braselton and Decker (1994) designed a graphic
organizer that included five steps: restating the question, deciding what information is
necessary to solve the problem, planning the mathematics to perform, doing the
mathematics, and asking oneself if the answer is reasonable. These five steps are very
similar to Polya’s (1985) problem solving heuristic. When Braselton and Decker
designed their graphic organizer they realized how important the layout and design
were because the strength of the graphic organizer lies in its ability to help the learner
construct the relationship between the information in the story problem and organize
that information so it supports the learners’ acquisition of knowledge. They chose to use
a rhombus shape organizer because it highlighted for the students that they all start with
the same information and end with the same conclusion. The graphic organizer was

35
used with Braselton’s fifth grade class who had previously used the keyword search
strategy to solve word problems. Braselton began by teaching her students how to read
word problems as meaningful passages. Once she felt like the students understood the
basics of problem solving, she introduced and modeled the graphic organizer for the
students by solving a few example problems and performing think-aloud exercises with
them. The think-aloud exercises involved vocalizing each step that the problem-solver
goes through when trying to find the solution of the problem. Braselton soon progressed
to using guided practice and eventually independent practice allowing the students to
use the graphic organizer individually while solving problems.
After using the organizer for several days and having the opportunity to apply it to
multiple problems, Braselton and Decker noticed that the students showed noticeable
improvement in problem solving. The key seemed to be the systematic approach to
analyzing the problems and providing a framework to act as an initial point when trying
to solve a problem. The most effective aspect of the graphic organizer was the ability to
slow the students down. It made them stop and evaluate the problem and look ahead to
the solution strategy instead of rushing into it, similar to Polya’s (1985) heuristic.
Braselton and Decker (1994) stated ―by using strategies that integrated both language
and mathematics skills we can increase students’ abilities to function as independent
problem solvers‖ (p. 281). Graphic organizers can be used to support reading in
mathematics and they can also be used to do more computational and procedural
mathematical operations.
In higher-level secondary education it is difficult to avoid teaching procedural
knowledge due to the content in the curriculum. There are numerous operations that

36
students are expected to be able to execute. Graphic organizers rely on visual/spatial
reasoning and can easily be applied to higher-level mathematics. Most of the procedural
knowledge that is embedded in mathematics relies heavily on the construction of
patterns. Graphic organizers are a vehicle for recognizing and processing those
patterns. In their review of approaches to teaching mathematics, Ives and Hoy (2003)
show that a graphic organizer can be used to teach operations such as positive and
negative integer exponents and solving systems of three linear equations with three
unknowns. Using the graphic organizer, students are able to learn the conceptual
foundation that lies beneath the procedural computations. Once students get
comfortable with using this type of visual representation to relate concepts, they can
begin to generalize it for themselves and apply it to other seemingly procedural
processes (Ives & Hoy, 2003).
In order to support their previous findings, Ives (2007) investigated the
effectiveness of using a graphic organizer to teach secondary students with LDs to
solve systems of linear equations. A two-group comparison was used; the graphic
organizer group consisted of 14 students where 10 had been diagnosed with a LD and
the control group consisted of 16 students, 11 of which had a LD. The graphic organizer
was a two by three array of rectangular cells with Roman numeral column headings.
Typically, when solving a system, the student would work from one cell to another in a
clockwise direction. The top row of the graphic organizer is used to combine equations
so that unknowns can be eliminated until an equation that includes just one unknown is
left.

37
Before students were allowed to see the graphic organizer they were given a
prerequisite skills test including solving linear equations in one unknown and combining
linear equations. Following the preassessment, the classroom teacher began a unit that
taught students how to solve a system with multiple unknowns. The control group was
taught without the use of the graphic organizer while the treatment group used the
graphic organizer during instruction.
After the instructional unit was over, each group received a teacher-generated
assessment that was used as an outcome variable to test for group differences in mean
scores. They also received one version of a content skills test constructed by the
researcher that tested their conceptual understanding of the procedural knowledge used
to solve systems of linear equations with multiple unknowns. Between two and three
weeks after the first content skills test, a second version was administered to both
groups.
The conceptual portion of the content skills test showed that students in the
treatment group had a stronger conceptual foundation for solving linear equations than
the students in the control group on both content skills tests. Therefore the conceptual
understanding that the treatment group demonstrated in the first test was carried over
weeks later on the second content skills test. The retention of knowledge that these
students showed is crucial when learning mathematics because of the scaffolded
structure that it possess. Mathematical concepts build on top of each other. For
example, in order to understand how to solve a system of linear equations, a student
must be able to understand how to solve one step linear equations. Retaining prior
38
knowledge will help increase students’ ability to transfer their knowledge to new material
and create a conceptual understanding of content. This conceptual understanding
Summary of Literature
Understanding how students learn is essential when trying to effectively teach.
Blending procedural knowledge and conceptual understanding in the curricula will
promote students to make more connections and allow for transfer between concepts
and increase adaptive reasoning (NRC, 2005). Problem solving promotes conceptual
understanding and strategic competence by encouraging students to explore concepts
and ideas beyond equations and algorithms and giving them the tools to formulate,
represent, and solve problems. An increase in conceptual understanding will aid in the
students’ transfer of knowledge to other classes, home, and work (Lesh & Zawojewski,
2007; NCTM, 2000; Schoenfeld, 1987).
It is apparent that students retain knowledge better when it is scaffolded and
builds onto their prior knowledge (NRC, 2000; 2005). Graphic organizers help build that
bridge between new and incoming information (Mayer, 1984; Novak & Gowin, 1984)
and support strategic competence. Graphic organizers cause the students to slow down
and really think about the problem and try to relate it to similar problems they have seen
(Braselton & Decker, 1994). This will lead to less errors and more meaningful solution
strategies (Jacobbe, 2008). The metacognitive skills embedded in problem solving
(Schoenfeld, 1987) and the use of graphic organizers (Langan-Fox et al., 2000) can
help a novice exemplify expert qualities in a shorter period of time. The graphic
organizer promotes students to reevaluate and revisit the problem-solving phases which
is a process that experts undergo when problem solving (Artzt & Armour-Thomas, 1992;
Schoenfeld, 1987). Although teachers do not expect their students to be experts at

39
mathematics, having these metacognitive and problem-solving skills will make them a
better student in all content areas.
The use of graphic organizers has been linked to an increase in reading
comprehension in various content areas. The present study aimed to show a stronger
connection between graphic organizers and mathematic problem solving. The goal of
the study was to create a research-based graphic organizer that incorporated problem-
solving methods in order to increase problem-solving success in a high school
classroom.

40
CHAPTER 3 METHODS AND PROCEDURES
The study took place in an Algebra II honors high school classroom at a university
developmental laboratory school. The school serves approximately 1,150 students in
kindergarten through twelfth grade. Of the student body the demographics/ethnicity is
comprised of 24% African-American, 51% Caucasian, 16% Hispanic, 3% Asian, and 5%
multi-racial. The gender of the students is 48% female and 53% male
(http://www.pky.ufl.edu/aboutPK/demographics.php).
Participants
The students in the Algebra II honors class consisted of eleven 11th graders,
twelve 10th graders, and one 9th grader. Twelve of the students were male and 12 were
female. All students were selected for the honors course based on performance during
the previous school year. None of the students were known to have a LD. The
participants were all under the age of 18 and parental consent was given by a parent or
guardian to participate in the study. All 24 students consented to being a part of the
whole class pre and post tests, and 8 students volunteered to participate in the
individual interviews.
Instrumentation
Two data sources were used in the study: (1) pre and post tests and (2)
individual interviews. The pre and post tests consisted of two word problems each
selected from released items on state and international assessments: Florida
Comprehensive Assessment Test (FCAT, 2005; FCAT, 2006), Program for International
Student Assessment (PISA, 2006), and National Assessment of Educational Progress
(NAEP, 2005). The pre and post test questions were similar in content and difficulty

41
level. The two FCAT questions had the MA.C.2.4.1 as the benchmark, a moderate
difficulty level, and similarity as the content focus. Also, 17 percent of students
answered each question correctly. The specific statistics on the PISA and NAEP
questions were not available but each was reviewed by several mathematics educators
who determined that they were similar in content and difficulty level. All of the questions
were approved by the classroom teacher and deemed appropriate.
The first problem on the pretest was selected from the FCAT (2006) and involved
using similar triangle properties to find the length of an unknown side. The second
problem on the pretest was selected from NAEP (2005) and required the students to
determine how many years it would take for a car’s value to depreciate to half the cost
of its original value (see Appendix A).
The first problem on the posttest was selected from PISA (2006) and required the
students to find the better deal when comparing two pizzas with different diameters and
price. The second problem was selected from the FCAT (2005) and required the
students to use the given information about the similar triangles to determine an
unknown side (see Appendix B).
The intervention and posttest used a graphic organizer that was created by the
researcher. The graphic organizer was displayed in a rhombus shape with the word
problem situated in the middle of the rhombus. This shape of the graphic organizer was
inspired by the graphic organizer used by Braselton and Decker (1994). The graphic
organizer has four different steps in which the students engaged. These four steps
reflect Polya’s (1985) four phases problem solving. The graphic organizer also contains
Schoenfeld’s (1987) three questions that encourage the student to think deeper about

42
what they are looking for and what they are doing. The graphic organizer used in this
study can be found in Appendix C.
The individual interviews were conducted with eight of the students. The students
were asked a set of predetermined questions including: ―What are your initial feelings
when given a word problem?‖ and ―How difficult did you find the given problems?‖ A full
list of the prepared questions can be found in Appendix D. These questions were
designed to give the researcher a better understanding of the students’ attitudes toward
word problems and also their feelings about the problems specifically on the pre and
post tests. In addition, students were asked to indicate their perception of the graphic
organizer and whether they felt it helped them understand and solve the problems.
Procedure and Data Collection
The entire study took place over four 50-minute class periods. Before the four
questions for the pre and post test were finalized, a pilot study was conducted to judge
the difficulty level of the questions. Students in a comparable Algebra II honors class at
the same school were given eight questions, and the questions that produced the most
variability in answers were used for the pre and post tests. The pretest was given to the
class. Students were encouraged to show all their work and record any thoughts they
had while solving the problem. Following the pretest, 8 students were interviewed
individually. During the audio taped semi-structured interviews, the students were asked
to explain the steps they took to solve each problem. In addition to the preplanned
interview questions, students were asked questions dependent upon their explanations.
The researcher presented the graphic organizer to the students during the class
period following the pretest administration. The researcher had an informal and
unscripted conversation with the class introducing the graphic organizer, explaining the

43
reasons it is useful, and how to use it. The four steps of Polya’s (1985) problem-solving
method and Schoenfeld’s (1987) self-monitoring questions were presented and
explained to the students. The students were told that the graphic organizer helps them
slow down and examine each aspect of the problem before getting lost in a
mathematical goose chase. The students were also told how the graphic organizer can
decrease anxiety toward word problems and help them justify their reasoning and
solution strategies. To help the students understand how to use the graphic organizer,
the researcher did two think aloud examples with the class. During the think aloud
examples, the researcher demonstrated to the students how one would think through a
problem when using the graphic organizer, making sure to use each step of the
problem-solving process. The students were allowed to ask questions about the graphic
organizer and were also encouraged to help think through the problem with the
researcher.
The students took the posttest the class period after the intervention. The
questions were presented on the graphic organizer and the students were encouraged
to use the graphic organizer to their advantage. Similar to the pretest, the same eight
students were individually interviewed after the test. The same sets of questions were
asked during the posttest interview as the pretest interviews, with the addition of the
student perception questions.
Data Analysis
The students’ solutions were rated for accuracy and student success rates were
compared. The students’ solution strategies and methods were also examined. The
researcher coded each student’s solutions from the pre and post tests using a rubric
(see Table 3-1) adapted from a rubric from Stenmark and Bush (2001, p.46). According

44
to Polya (1985), when solving mathematical problems effectively, the solver should go
through four different stages: understanding the problem, devising a plan, carrying out
the plan, and looking back. Each of these stages was broken down into two
components. The researcher examined the students’ written responses to the problems
and decided whether they achieved each component of the four different stages. If the
student successfully demonstrated one of the characteristics of that stage he or she
received a point toward their final overall score for that problem. Each problem had a
possible score of 8 points, for a total of 16 points. The researcher then compared the
final process score for the pre and post tests to see if there was an increase, decrease,
or no change.
Although the students were instructed to show all their work on the pretest, the
likelihood that they did is low. For this reason, the pretest individual interviewers were
also coded using the rubric in Table 3-1. The researcher listened to the students’
description of their solution method and assigned points based on their verbal
communication of their solution process. This score was then compared to the students’
posttest processes scores.

45
Table 3-1. Problem-solving processes rubric used when coding students’ written responses.
Problem-Solving Processes Rubric Subtotal
Restating the Problem (Understanding the Problem) Student rephrased the problem (1) Student correctly identified the known and unknown information
(1)
Devising a Plan Student selects an appropriate strategy (1) Student explains the plan (1)
Carrying out the Plan Student carries out given plan (1) Student finds the correct solution (1)
Looking Back Student checks steps of the plan (1) Student assesses if the solution is correct and appropriate for
the problem (1)
Total:

46
CHAPTER 4 RESULTS
The results of this research study will examine the impact of the graphic organizer
on problem-solving success and use of Polya’s four stages of problem solving. The first
research question will be based on the students’ achievement scores from pretest to
posttest. The second research question will be investigated through the use of the
problem-solving rubric created by the researcher. Information gained through the
individual interviews will supplement this analysis and help explore the attitudes of the
students toward problem solving and the graphic organizer used in this research study.
Research Question 1
To examine whether the use of the graphic organizer affected student problem-
solving success on word problems, a t-test was performed to compare students’ scores
on the pre and post test. Students’ scores on the posttest (M = 1.33, SD = 0.565) were
significantly higher than students’ achievement scores on the pretest (M =0.25, SD =
0.442), t(23) = 7.399, p < .001.
More specifically, 3 out of the 24 students in the class answered the first question
correctly on the pretest and 4 of the 24 students answered the second question
correctly. All together on the pretest, 6 students scored 1 out of 2 possible points and 18
students scored no points. These results are contrasted significantly by the outcome on
the posttest.
Seventeen of the 24 students answered the first question on the posttest
correctly, and 15 students answered the second question correctly. One student scored
no possible points, 14 students scored 1 out of 2 possible points, and 9 students scored
2 out of 2 possible points.

47
When comparing the pre and post test scores the following was revealed. None
of the students decreased in their scores, and 6 students’ scores remained the same.
Eighteen students’ scores, however, increased from pre to post test. Of the 18 students,
7 increased their scores from 0 to 1, 2 increased their scores from 1 to 2, and 9
increased from 0 to 2.
Research Question 2
To examine whether the graphic organizer affected students’ use of Polya’s
(1985) four stages of problem solving, a t-test was performed to compare students’
processes scores on the pre and post test using the rubric in Table 3-1. Students’
problem-solving processing scores on the posttest (M = 8.75, SD = 3.011) were
significantly higher than students’ processes scores on the pretest (M = 2.88, SD =
3.011), t(23) = 7.832, p < .001.
More specifically, on the pretest 15 students scored between 0 and 3 points and
9 scored between 4 and 7 points. On the posttest, 3 students scored between 0 and 3
points, 3 students scored between 4 and 7 points, 15 students scored between 8 and 11
points, and 4 students scored between 12 and 16 points (see Table 4-1).
Comparing the pre and post test scores, students used more of the problem-
solving stages when using the graphic organizer than prior to using the graphic
organizer. To be more precise, 22 students increased their score, 2 decreased their
scores (by two and three points), and no students had the same score.
Although the students were prompted to show all their work, students may have
not written all the steps taken to solve the problem on the pretest and the rubric used to
assess the pretest was closely aligned to the format of the graphic organizer. Therefore,
in order to increase the validity of the results for research question 2, the 8 individual

48
interviews for the pretest were coded using the rubric in Table 3-1 and compared to the
posttest processes scores. The 8 students’ problem-solving processing scores when
using the graphic organizer (M = 9.75, SD = 2.121) was significantly higher than their
processes scores determined from the interviews prior to using the graphic organizer (M
=5.75, SD = 1.282), t(7) = 3.802, p = .007. The posttest process score was used instead
of the posttest interview process score because the students simply read off of their
graphic organizer during the posttest interview. In contrast, during the pretest interviews
students added additional information to their solution strategy when verbally asked to
explain their solution. As a result of being able to better recognize the students’
strategies from the interview, 7 of the 8 students increased their process score from the
interviews prior to using the graphic organizer to the posttest (see Table 4-1).
Table 4-1. Pretest Interview, Pretest, and Posttest Problem-Solving Processes Scores and the Number of Students that Achieved that Score.
Test Scores Pretest Posttest Pretest Interview
0-3 15 3 0
4-7 9 3 8
8-11 0 15 0
12-16 0 4 0
Student Work
In order to get a better understanding of how the graphic organizer impacted the
students’ solutions, a few students’ work will be examined in more detail. Participant 5
scored no points on the pretest and increased to 2 out of 2 points on the posttest. The
work the student gave on the pretest was minimal. For question one, there is no work or
49
answer shown and for question two the given information was restated and there was
an attempt to create an equation to solve the problem but the student did not follow
through with the plan or produce an answer. Participant 5 was one of the students who
were interviewed after completing the test. During the interview, the student showed
improvement in the process score by providing evidence of using certain problem-
solving phases on the pretest, even though there was no work written on the actual test.
For example, for problem 1 the student mentioned subtracting 360 from the given three
numbers in the problem and using the Pythagorean Theorem as solution strategies she
considered but none of these possible plans were written on the test. Since there was
no work written on the test for problem 1 the student received no points when assessed
using the problem-solving method rubric and 3 points out of 8 on problem 2. However
when coding the individual interview, participant 5’s process score increased to 4 out of
8 points. On the posttest, participant 5 scored 2 out of 2 points. For problem 1 and 2 the
student received 6 points out of 8 for their problem-solving process. Figure 4-1 shows
participant 5’s solutions from the pretest and Figures 4-2 and 4-3 display the posttest
solutions. Participant 5 showed considerably more work on the posttest than the pretest.
Each step was well thought out and explained. In contrast to the pretest where there
was no effort made to try and solve the problems on paper. Although the student used
the wrong area formula for the circular pie, a plan was devised and carried out and the
correct solution was produced.
Participant 17 scored the same on the pre and post test. On the pretest, the
student answered problem 2 correctly but showed little work. It appears that the student
calculated 20% of $30,000 and arrived at $24,000 left over and then calculated 20% of

50
$24,000 and so on until realizing it takes four years to get below $15,000. This is what it
seems like the student is doing but all he has written on his paper is a list of numbers
and the answer. Therefore the student received only two points for carrying out the plan
and finding the correct solution. On the posttest, the student answered problem 1
correctly and received 7 out of 8 process points. The student was able to actively
engage in each of the four problem-solving stages. The only point he didn’t receive was
due to not explaining why the 24 inch pizza was a better deal. When using the graphic
organizer, the student showed more work and the researcher was able to follow the
solution easily and see clearly what the student’s thought process was when solving the
problem. Figure 4-4 and 4-5 shows participant 17’s pretest problem 2 and posttest
problem 1 respectively.
It is important to emphasize when problem solving that the process is more
important than the outcome. The process and the act of solving the problem will help
students succeed on future problems. Participant 20 kept the same score from the pre
to post test. The student was unable to get the correct answer on problem 1 on the
pretest (see Figure 4-6). The Pythagorean Theorem was written down but nothing was
done with it. Needless to say, the student scored no points for the problem-solving
methods on problem 1. Participant 20 was also unable to find the correct solution for
problem 2 on the protest (see Figure 4-7). When comparing the strategies of the two
problems, in the posttest problem the student was able to identify the known and
unknown information, devise a plan, and carry out the plan. Although the problem was
not answered correctly, the student scored four points for the problem-solving
strategies. Although the pre and post test problems were not answered correctly, the

51
student was able to increase the amount of work shown from pre to post test, therefore
showing more of their thought process allowing the researcher to better understand
their method.
When comparing the problem-solving success and process scores, 17 students
increased their success and process score when using the graphic organizer (see Table
4-2). This correlation is significant and shows that using the graphic organizer can help
students increase their success when solving problems and also improve their solution
strategy explanations.
Table 4-2. Comparing problem-solving success and process score change from pre to post test.
Problem-solving success score
Problem-solving process score
Decrease No change Increase
Decrease 0 0 0
No change 0 0 5
Increase 2 0 17

52
Figure 4-1. Participant 5’s pretest.

53
Figure 4-2. Problem 1 from participant 5’s posttest.

54
Figure 4-3. Problem 2 from participant 5’s posttest.

55
Figure 4-4. Participant 17’s pretest problem 2.

56
Figure 4-5. Participant 17’s posttest problem 1.

57
Figure 4-6. Participant 20’s pretest problem 1.
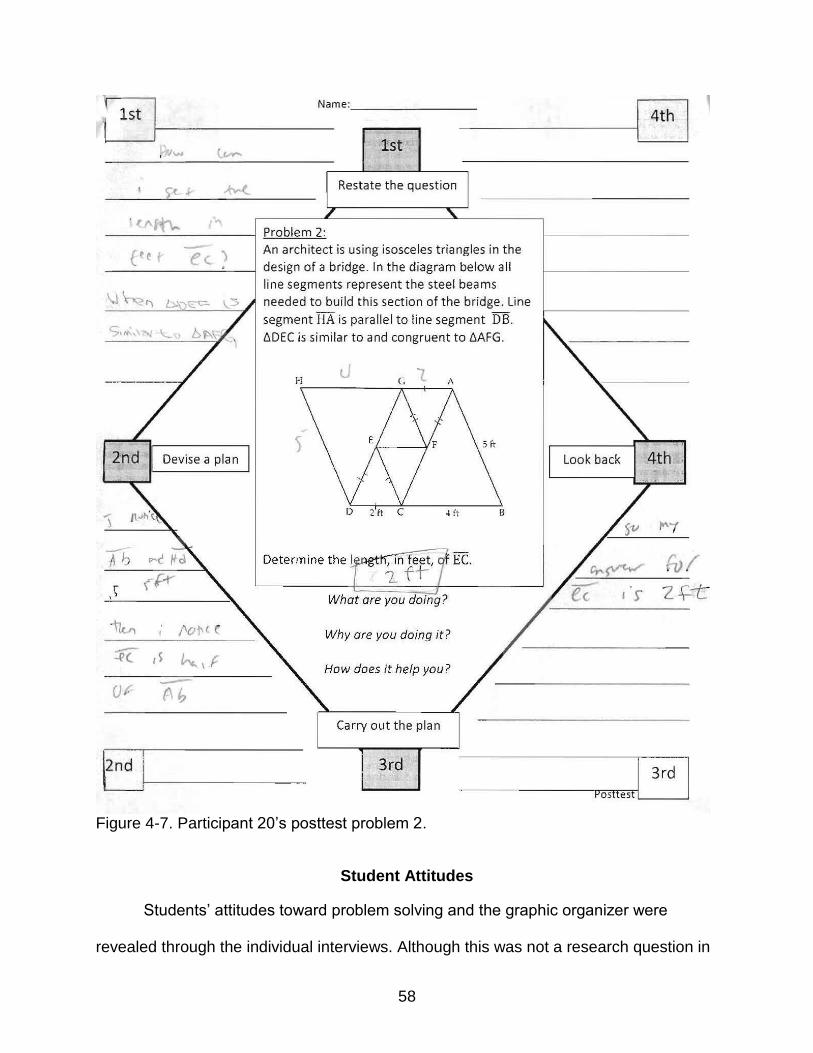
58
Figure 4-7. Participant 20’s posttest problem 2.
Student Attitudes
Students’ attitudes toward problem solving and the graphic organizer were
revealed through the individual interviews. Although this was not a research question in

59
the beginning of the study, the researcher thought the students’ attitudes were important
to discuss. During the interviews following the pretest, the researcher asked the
students how they felt about word problems. All 8 students said they did not like word
problems. The three main reasons why the students did not like word problems were
that they made them nervous, they required more work than other problems, and it is
hard to pick the needed information out of the problem. The students who were nervous
said looking at the problem as a whole makes it seem more complicated, which causes
anxiety when trying to solve the problem. The students who believed that the word
problems were more work felt that word problems don’t give them all the tools
necessary to solve the problem and he or she is left to find strategies to solve the
problem without help. Students who struggled also mentioned that word problems
require too much time to solve, and if they can’t figure the problem out by looking at it
for a few minutes they usually skip it and go on to the next problem.
It is pretty clear that none of the students that were interviewed liked word
problems. Overall, they felt like they were hard, complicated, and took too much time. It
seemed as if the students were unsure how to approach word problems therefore they
get frazzled right from the start.
During the posttest interviews, the students were asked how they felt about the
graphic organizer and whether they thought it was useful to them while working on the
given word problems. Some of the students felt like the graphic organizer was
unnecessary. The students felt that it cluttered the page and made them do extra steps.
Because the graphic organizer takes up the entire page to include all four problem-
solving phases, students felt confused by the amount of information on the page and

60
limited by the amount of space they could use. Students did not like that the graphic
organizer made them do extra steps on paper that they would normally do in their head.
Therefore using the organizer slowed the students down and caused them to write
more. This was hard for them because they were not used to writing out and explaining
their mathematical steps. Separating parts of the solution strategy into one of the four
phases on the graphic organizer required extra thinking that was not desired by the
students.
Although these students felt strongly about the graphic organizer interfering with
their work, there were students that saw positive aspects within the organizer. Students
felt like it gave them more structure and organized their thoughts well. Participant 5,
who indicated being nervous when given word problems, liked that the graphic
organizer helped break down the problems instead of dealing with all the information at
once and getting frazzled. Some students said they already go through these four
phases when solving a problem, hence using the graphic organizer did not negatively
affect them when they were working.
The 8 students’ attitudes were mixed about liking the graphic organizer but they
all said that they felt that they would rather do the problems without the organizer. Their
reasons varied from not liking it, having it slow them down, and simply not being familiar
with the format of the graphic organizer (see Appendix E for a transcription of the
interviews).
Summary of Findings
The graphic organizer was created to foster problem-solving skills and success.
During the research study, the students were instructed on how the organizer should be
used only once. Although the amount of time they were exposed to the graphic

61
organizer was limited, the students’ achievement scores increased from pre to post test
and the increase was significant.
Increasing student achievement is important but developing students’ solutions to
include more detail is equally as important. This study also examined the effect of the
graphic organizer on the students’ use of problem-solving methods. In order to assess
this, the researcher created a rubric that characterized each stage of Polya’s (1985)
four- stage problem-solving process. The process scores increased when using the
graphic organizer when comparing the written test scores and the individual interviews.
The students provided more evidence of using Polya’s four phases when required to
solve the problem using the graphic organizer.
During the individual interviews, the students revealed their dislike for word
problems. Most of them thought that they were time consuming and complicated. The
students also felt more hesitant to attempt a word problem than a computational
problem. Word problems often require the students to translate from words to symbols
and vice versa. The translation process of solving a word problem causes the students
to become confused and overwhelmed. Graphic organizers help aid students while
decoding (Braselton & Decker, 1994).
Although the achievement and problem-solving method scores increased
tremendously when using the graphic organizer, the students’ reaction to the graphic
organizer was not that favorable. A few students felt that the organizer cluttered the
page and confused them more when solving the problem although they succeeded
more when using the graphic organizer. They felt they had to stop and think about the
graphic organizer instead of just thinking about the mathematics. The students were

62
used to doing a lot of the mathematics in their head; therefore the graphic organizer
slowed them down and made them think more instead of just doing what they are used
to which is finding the correct answer. However, this was the main objective of the
graphic organizer, to get the students to slow down and think about each step of the
problem.
All of the students stated that they would have rather done the problems without
the graphic organizer but some students did find it useful. They felt like it helped them
structure their thoughts and relieve some of the stress that they feel when faced with a
word problem. They were able to focus on sections on the problem, rather than getting
frazzled by looking at it as a whole. A student said that he/she normally goes through
these stages in their head when solving a problem so they didn’t feel uneasy using the
graphic organizer. Although the students’ feelings were negative toward the graphic
organizer, it helped them develop their solution strategies in a clear and organized way.
They did not like that it slowed them down but slowing down caused the students to
develop a clear solution strategy and lead them to more successful solutions.

63
CHAPTER 5 CONCLUSIONS
Discussion
Students’ productive disposition to mathematics tends to be negative. Most
students feel they are unable to succeed; therefore there is no reason to try. During this
study, the students’ dislike for word problems was very apparent. With the use of the
graphic organizer, the students were able to slow down and not be overwhelmed by the
amount of information the word problems contained.
When finding the solution, the students used their prior knowledge to construct
new ideas and strategic competence to use those new ideas to formulate, represent,
and solve the problem. Building onto prior knowledge increases the likelihood of
retention and gets the student motivated to learn if they feel like they already have some
idea of what to do. Combining procedural and conceptual knowledge, graphic
organizers help bridge prior knowledge and new incoming information (Ausubel, 1960;
Mayer, 1984; Novak & Gowin, 1984). During the pretest, many students said that they
felt they could do the problem but couldn’t remember an appropriate method to use.
When the graphic organizer was used this did not seem to be as big of an issue, even
though the problems were similar in content. The graphic organizer helped them use
their prior knowledge to solve the unfamiliar problem.
Continuing this process on new and unfamiliar problems causes the students to
stay aware of methods they’ve used in the past and how and when to apply those
methods in the future. Metacognitively monitoring their solution strategies when problem
solving can help students develop qualities of an expert (Langan-Fox et al., 2000;
Schoenfeld, 1987). Many of the students thought the graphic organizer slowed them

64
down and made them think about the problem. This prevented the students from going
on a mathematical wild goose chase (Schoenfeld, 1987) and increased their awareness
of their solution strategies.
Although all phases are important, successfully engaging in the first phase of
Polya’s problem-solving method can reduce translation errors when solving word
problems (Pape, 2004) and engaging in the fourth phase can reduce the amount of
carless mistakes and misunderstandings made while solving a problem (Jacobbe,
2008).The posttest data showed an increase in student achievement and an increase in
the number of students who rephrased the problem, identified the known and unknown
information, checked back over their work, and made sure the solution answered the
problem. The use of the graphic organizer also helped the students increase their
adaptive reasoning by justifying their work (NCR, 2001). Participating in each of Polya’s
(1985) four problem-solving phases, increased their understanding of the problem and
helped them explain their solution strategy more clearly. The graphic organizer may
have also helped foster the metacognitive and cognitive behaviors that are needed to
successfully solve a problem (Artzt & Armour-Thomas, 1992) by giving the students a
structured and organized way to explore the possible problem.
Limitations
There were several limitations to this research study, but the most detrimental
was the close alignment between the rubric and the format of the graphic organizer. The
rubric used to code the pre and post tests had Polya’s (1985) four stages outlined as did
the graphic organizer. Therefore this could have affected the process scores from the
pre and post test.

65
The sample of the students chosen could have also affected the reliability of the
quantitative data. The sample size was only 24 students and the class was an honors
course. Had the sample been larger and included students from regular Algebra II
classes, the data would have been more generalizable. The number of students who
participated in the individual interviews was also low. If the number has been larger, the
pretest process score data could have been more precise.
The lack of time available for the study also limited the research. The classroom
in which the study took place had a curriculum that they needed to follow. Therefore
taking more than three class periods would have hindered the normal class schedule.
The limited time used for the study caused the students’ exposure to the graphic
organizer before the posttests to be restricted. The study required time for the pilot
study, whole class pretest, posttest, intervention, and individual interviews following the
tests, therefore taking up four class periods from the classroom teacher. Hence the
researcher had only one day to introduce, explain, and model the graphic organizer to
the class. When the students received the posttest, they recognized the graphic
organizer but weren’t as comfortable as they could have been given more time before
the test.
Finally, the lack of familiarity with the students’ prior knowledge could have
limited this study. The questions chosen for the pre and post tests were taken from
standardized tests, were similar in content and complexity, and functioned well on a
pilot study class. However, without fully understanding the students’ background
knowledge, the researcher cannot say that the students were unfamiliar with all the
concepts that were tested. This could have skewed the pre or post test scores.

66
Implications for Future Research
The graphic organizer used in this study was not well received by the students.
This could have been because of the lack of time the students were able to interact with
the organizer before being tested. It could have also been a result of the structure of the
organizer. With less clutter and more space for the students to work, the organizer may
have been received more positively. An important question arises from this study. What
qualities should a graphic organizer have in order to be successfully accepted by
students? There has been little research on how to effectively design and create a
graphic organizer although understanding what is needed to make it useful in the
classroom is a necessary key that is still missing.
Even though Polya’s (1985) four stages of problem solving are useful when
dealing with a variety of problems, the question of whether or not the graphic organizer
is useful when dealing with geometric problems arose from the study. Students felt like
it was difficult to describe how they carried out their plan when most of their work was
done on the geometric figure that was present in the problem.
Despite the resistance to the graphic organizer by the students, the quantitative
data collected in the study show that the Polya (1985) and Schoenfeld (1987) inspired
graphic organizer helped increase student achievement and problem-solving skills.
Through the use of problem solving, students can start to develop a conceptual
understanding and metacognitive awareness and no longer be afraid to approach
unfamiliar problems and situations in and outside of the classroom.

67
APPENDIX A PRETEST

68
APPENDIX B POSTTEST

69

70
APPENDIX C GRAPHIC ORGANIZER

71
APPENDIX D INTERVIEW PROTOCOL
The following are initial questions in this open-ended interview. Addition questions
will be asked depending upon students’ responses.
Interview questions for pre and post tests:
1.) Talk about your reaction to the given problems.
2.) Explain how you solved the problems.
3.) Can you tell me why you solved it that way?
4.) How did your solution strategies help you to solve the problems?
5.) What did you find difficult or easy about the problems?
6.) Can you think of another way to solve the problems?
Questions for posttest interview only: 1.) Talk about your reaction to the graphic organizer.
2.) Do you think it helped you solve the problem?
3.) Would you prefer solving a problem with or without the graphic organizer?
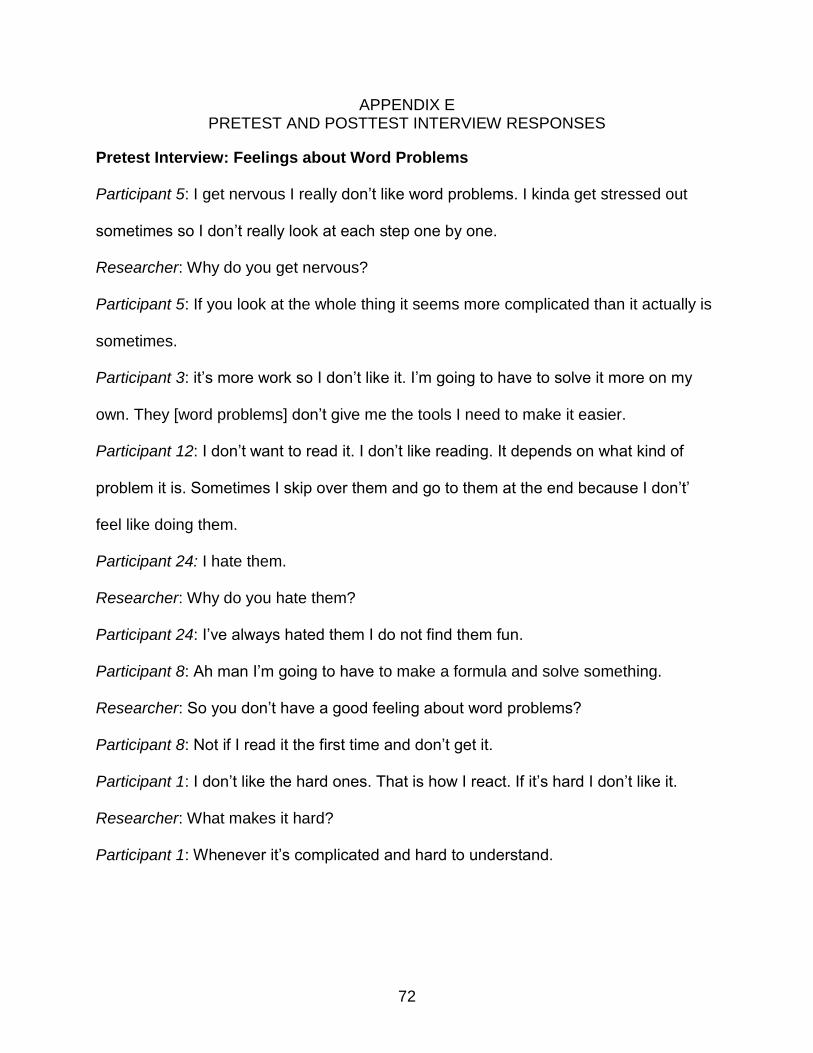
72
APPENDIX E PRETEST AND POSTTEST INTERVIEW RESPONSES
Pretest Interview: Feelings about Word Problems
Participant 5: I get nervous I really don’t like word problems. I kinda get stressed out
sometimes so I don’t really look at each step one by one.
Researcher: Why do you get nervous?
Participant 5: If you look at the whole thing it seems more complicated than it actually is
sometimes.
Participant 3: it’s more work so I don’t like it. I’m going to have to solve it more on my
own. They [word problems] don’t give me the tools I need to make it easier.
Participant 12: I don’t want to read it. I don’t like reading. It depends on what kind of
problem it is. Sometimes I skip over them and go to them at the end because I don’t’
feel like doing them.
Participant 24: I hate them.
Researcher: Why do you hate them?
Participant 24: I’ve always hated them I do not find them fun.
Participant 8: Ah man I’m going to have to make a formula and solve something.
Researcher: So you don’t have a good feeling about word problems?
Participant 8: Not if I read it the first time and don’t get it.
Participant 1: I don’t like the hard ones. That is how I react. If it’s hard I don’t like it.
Researcher: What makes it hard?
Participant 1: Whenever it’s complicated and hard to understand.

73
Participant 23: I struggle on word problems a lot. It’s hard to pick out the information you
need and don’t need. They are actually really hard for me and it takes quite a bit of time
to do them.
Participant 9: I don’t necessarily like them but I’ll do them.
Posttest Interview: Attitude toward Graphic Organizer
Participant 3: I think it makes it more confusing because it clutters your page you don’t
have freedom to do stuff wherever you want to
Participant 23: For me it was extra steps. I do a lot of stuff in my head. For the second
problem I did it in my head and then had to go through and fill out the steps. It is extra
work but it does keep your stuff organized when you look at it. For the second one, for
my work I just did it on here [points to diagram in problem] because I did it in my head.
Participant 1: I’m not used to using a graphic organizer. I just do it in my head or on
paper. This is new. It slowed me down I had to go out and actually write stuff down that I
would usually wouldn’t really need to I go straight to the actual equations and slowing
down is a bad thing.
Participant 9: I found it kind of confusing. I work better when I work it out but when I
have to put it in separate categories it is kind of confusing.
Participant 5: It was organized and structured. In ways it did help solve the problem
because when I look at the problem I freak out and get frazzled instead of breaking it
down so it helps break it down.
Participant 24: umm I guess it was good because this is how I do it anyways.
Participant 8: I had a headache because I’d seen a lot of writing but then I was like
―ohhh interesting.‖ So I liked it.

74
Participant 12: It helped a little bit but I found it harder to write out what I was going to
do just because it’s hard to explain what you’re going to do with math just because I
pretty much think it up in my head but it helped me understand it a bit more because I
read through it more to write down everything.

75
LIST OF REFERENCES
Artzt, A., & Armour-Thomas, E. (1992). Development of a cognitive-metacognitive framework for protocol analysis of mathematical problem solving in small groups. Cognition and Instruction,9, 137–175.
Australian Council for Educational Research. (2006).Program for international student assessment (PISA), 25. Retrieved August 1, 2009, from http://www.pisa.oecd.org/dataoecd/14/10/38709418.pdf
Ausubel, D. P. (1960). The use of advanced organizers in the learning and retention of meaningful verbal material. Journal of Educational Psychology, 51. 267–272.
Ausubel, D. P., & Fitzgerald, D. (1961). The role of discriminability in meaningful verbal learning and retention. Journal of Educational Psychology, 51, 266–274.
Braselton, S., & Decker, B. C. (1994). Using graphic organizers to improve the reading of mathematics. The Reading Teacher, 48, 276–281.
Brennan, A., & Dunlap, W. (1985). What are the prime factors of reading mathematics? Reading Improvement, 22, 152–159.
Chi, M., Feltovich, P., & Glaser, R. (1981). Categorization and representation of physics problems by experts and novices. Cognitive Science, 5, 121–152.
Corkhill, A. J. (1992). Advanced organizers: Facilitators of recall. Educational Psychology Review, 4, 33–67.
Florida Department of Education. (2005). The Florida comprehensive assessment test (FCAT),38. Retrieved August 1, 2009, from http://fcat.fldoe.org/pdf/releasepdf/g10_FCAT_math_AK.pdf
Florida Department of Education. (2006). The Florida comprehensive assessment test (FCAT),58. Retrieved August 1, 2009, from http://fcat.fldoe.org/pdf/releasepdf/06/FL06_Rel_G10M_AK_Cwf001.pdf
Frase, L. T. (1975). Prose processing. In G. H. Bower (Ed.), The psychology of learning and motivation (Vol. 9, pp. 1–47). New York: Academic.
Hammouri, H. A. M. (2003). An investigation of undergraduates’ transformational problem solving strategies: Cognitive/metacognitive processes as predicators of holistic/analytic strategies. Assessment & Evaluation in High Education, 28, 571–586.
76
Hiebert, J. (2003). Signposts for teaching mathematics through problem solving, In F. K. Lester (Ed.) Teaching mathematics through problem solving: Prekindergarten – grade 6 (pp. 53–61). Reston, VA: National Council of Teachers of Mathematics.
Horton, S. V., Lovitt, T. C., & Bergerud, D. (1990). The effectiveness of graphic organizers of three classifications of secondary students in content area classes. Journal of Learning Disabilities, 23, 12–29.
Ives, B. (2007). Graphic organizers applied to secondary algebra instruction for students with learning disabilities. Learning Disabilities Research & Practice, 22, 110–118.
Ives, B., & Hoy, C. (2003). Graphic organizers applied to higher-level secondary mathematics. Learning Disabilities Research & Practice, 18, 36–51.
Jacobbe, T. (2008). Using Polya to overcome translation difficulties. Mathematics Teacher, 101, 390–393.
Kim, A., Vaughn, S., Wanzek, J., & Wei, S. (2004). Graphic organizers and their effects on the reading comprehension of students with LD: A synthesis of research. Journal of Learning Disabilities, 37, 105–118.
Kramarski, B., Mevarech, Z., & Arami, M. (2002). The effects of metacognitive instruction on solving mathematical authentic tasks. Educational Studies in Mathematics, 49, 225–250.
Lambdin, D.V. (2003). Benefits of teaching through problem solving, In F.K. Lester (Ed.) Teaching mathematics through problem solving: Prekindergarten – grade 6 (pp. 3–13). Reston, VA: National Council of Teachers of Mathematics.
Langan-Fox, J., Waycott, J.L., & Albert, K. (2000). Linear and graphic advanced organizers: Properties and processing. International Journal of Cognitive Ergonomics. 4(1), 19–34.
Lesh, R., & Zawojewski, J. (2007). Problem solving and modeling, In F. K. Lester, Jr. (Ed.) Second handbook of research on mathematics teaching and learning (pp. 763–804). Greenwich, CT: IAP.
Lucangeli, D., & Cornoldi, C. (1997). Mathematics and metacognition: What is the nature of the relationship? Mathematical Cognition, 3, 121–139.
Luiten, J., Ames, W., & Ackerson, G. (1980). A meta-analysis of the effects of advance organizers on learning and retention. American Educational Research Journal, 17, 211–218.

77
Maffei, A. C. (1973). Reading analysis in mathematics. Journal of Reading, 16, 546–549.
Marshall, S. P. (1995). Schemas in problem solving. New York: Cambridge University Press.
McEneany, J. E. (1990). Do advanced organizers facilitate learning? A review of subsumption theory. Journal of Research and Development in Education, 23, 89–96.
Merkley, D. M., & Jefferies, D. (2001). Guidelines for implementing a graphic organizer. The Reading Teacher. 54, 351–357.
National Center for Education Statistics. (2005). The national assessment of educational progress (NAEP). Retrieved August 1, 2009, from http://nces.ed.gov/nationsreportcard/itmrlsx/detail.aspx?subject=mathemat ics
National Council of Teachers of Mathematics (NCTM). (1980). An agenda for action: Recommendations for school mathematics of the 1980s, Reston, VA: National Council of Teachers of Mathematics
National Council of Teachers of Mathematics (NCTM). (2000). Principles and standards for school mathematics. Reston, VA: National Council of Teachers of Mathematics.
Novak, J. D., & Gowin, D. B. (1984). Learning how to learn. New York and Cambridge, UK: Cambridge University Press.
National Research Council. (2000). How people Learn: Brain, mind, experience, and school. Washington, D.C.: the National Academic Press.
National Research Council. (2001). Adding it up: Helping children learn mathematics. Washington, DC: the National Academic Press.
National Research Council. (2005). How students learn: History, mathematics, and science in the classroom. Washington, DC: the National Academic Press.
Pape, S. (2004). Middle school children’s problem-solving behavior: A cognitive analysis from a reading comprehension perspective. Journal for Research in Mathematics Education, 35,187–219.
Polya, G. (1985). How to solve it. Princeton, NJ: Princeton University Press.
Schoenfeld, A. H. (1987). What’s all the fuss about metacognition? In A. H Schoenfeld (Ed.) Cognitive science and mathematics education (pp. 189–215). Hillsdale, NJ: Laurence Erlbaum Associates.

78
Schoenfeld, A. H. (1989). Teaching mathematical thinking and problem solving. In L.B. Resnick & L.E. Klopfer (Eds.), Toward the thinking curriculum: Current cognitive research (pp. 83–103). Alexandria, VA: ASCD.
Schoenfeld, A. H. (1992). Learning to think mathematically: Problem solving, metacognition, and sense-making in mathematics. In D. Grouws (Ed.),
Handbook for Research on Mathematics Teaching and Learning (pp. 334–370). New York: MacMillan.
Stenmark, J. K., & Bush W. S. (Eds.). (2001). Mathematics assessment: A practical handbook for grades 3–5. Reston, VA: National Council of Teachers of Mathematics.
Stone, C. L. (1983). A meta-analysis of advance organizer studies. Journal of Experimental Education, 51, 194–199.
Teong, S. K. (2003). The effects of metacognitive training on mathematical word-problem solving. Journal of Computer Assisted Learning. 19, 46–55.

79
BIOGRAPHICAL SKETCH
Cassidy Fuller was born in Dallas, Texas in 1987. She grew up in Richmond,
Virginia with her brother, Austin and mother, Julie. Before entering fourth grade, her
family moved to Orlando, Florida. She graduated with honors from Colonial High School
in 2005 as salutatorian of her class. She went on to attend the University of Florida in
Gainesville, Florida.
From an early age, Cassidy made fake tests and gave them to an imaginary class;
she knew she wanted to be a teacher. In high school, Cassidy had the realization that
she loved mathematics and from then on she knew that is what she wanted to teach.
While at the University of Florida, she studied mathematics. Although it was difficult, she
graduated in the summer of 2008 with cum laude.
Although her minor gave her some teaching experience, she knew that she was
not ready for her own classroom. Therefore Cassidy decided to go to graduate school to
get her Master of Arts in Education in mathematics education.
The program at the College of Education was more than she had expected. The
faculty and students in the program really inspired her and gave her the tools to feel
prepared for her own teaching career and opened her up to the world of problem
solving.
Cassidy plans on teaching in a high school mathematics classroom. Although she
has heard the horror stories of a first year teacher, the University of Florida has
equipped her with the tools and confidence that she needs to be successful.
The future holds a lot of possibilities but with the support of her family and friends,
Cassidy is prepared to take on whatever challenges life puts in her way. Besides, after
an undergraduate degree in mathematics and finishing her thesis, anything is possible!