Embed Size (px)
DESCRIPTION
Using black and white models for classification of medical images. Sergei Kucheryavski, Altai State University, Russia [email protected]. Prehistory: analysis of medical data. Children's hospital of Altai region: - PowerPoint PPT Presentation
Citation preview

Using black and white models for classification of medical images
Sergei Kucheryavski, Altai State University, Russia

Prehistory: analysis of medical data
Children's hospital of Altai region:
– analysis of frequencies of different diseases
occurring in patients with perinatal lesions of the
central nervous system
– analysis and recognition of blood cells
– analysis and recognition of marrow cells
Department of urology and nephrology of AMU
– analysis of ultrasound and X-ray tomograms of
urolitas
– determination of operable/therapeutic state of
disease using ultrasound and X-ray tomograms of
tissues

Prehistory: existent methods of analysis
• Based on the conceptual models – geometrical size of objects and distance between them
– geometrical area of objects or segments
– hue and color intensity
– …
• Rigid requirements to the raw data– low-noise
– high level of contrast and intensity
Morphologya : a branch of biology that deals with the form and structure of animals and plants b : the form and structure of an organism or any of its parts
Merriam-Webster Online Dictionary
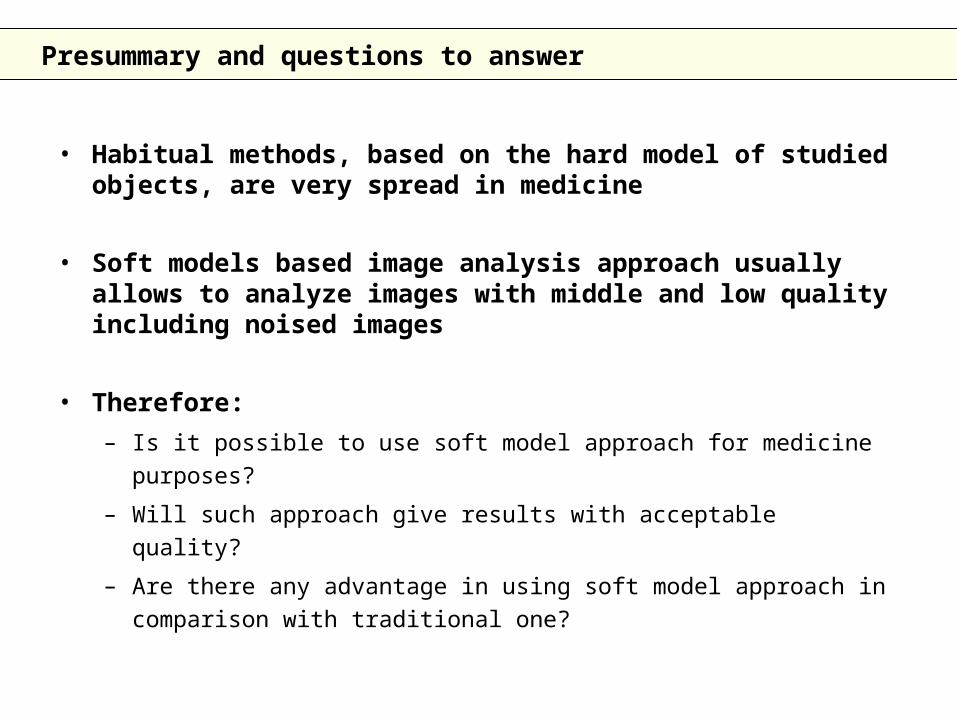
Presummary and questions to answer
• Habitual methods, based on the hard model of studied objects, are very spread in medicine
• Soft models based image analysis approach usually allows to analyze images with middle and low quality including noised images
• Therefore:
– Is it possible to use soft model approach for medicine purposes?
– Will such approach give results with acceptable quality?
– Are there any advantage in using soft model approach in comparison
with traditional one?

Blood cells formation
red cells white cells

Basic white cell types
segmentedrow
Neutrophils LymphocyteMonocyte
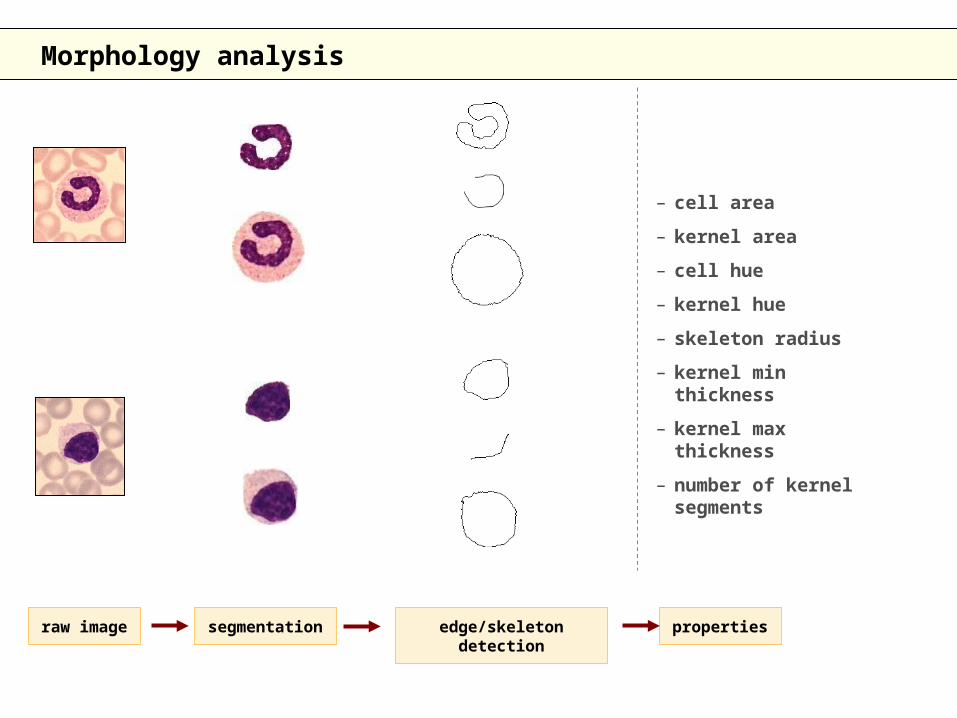
Morphology analysis
raw image segmentation edge/skeleton detection properties
– cell area
– kernel area
– cell hue
– kernel hue
– skeleton radius
– kernel min thickness
– kernel max thickness
– number of kernel segments
Blood cells analysis software
• Conditions– rigid requirements to the image quality– sensitive to presence of noise– rigid requirements to the smear quality
• Effects– poor results for middle and low quality images– rigid requirements to the equipment (microscopes, cameras, etc)– rigid requirements to chemical for smear preparation
• As a result– highly recommended to use such software with equipment and chemical
from the same producer• price for software only: $2 000 – 10 000• price for equipment: $50 000 – 100 000
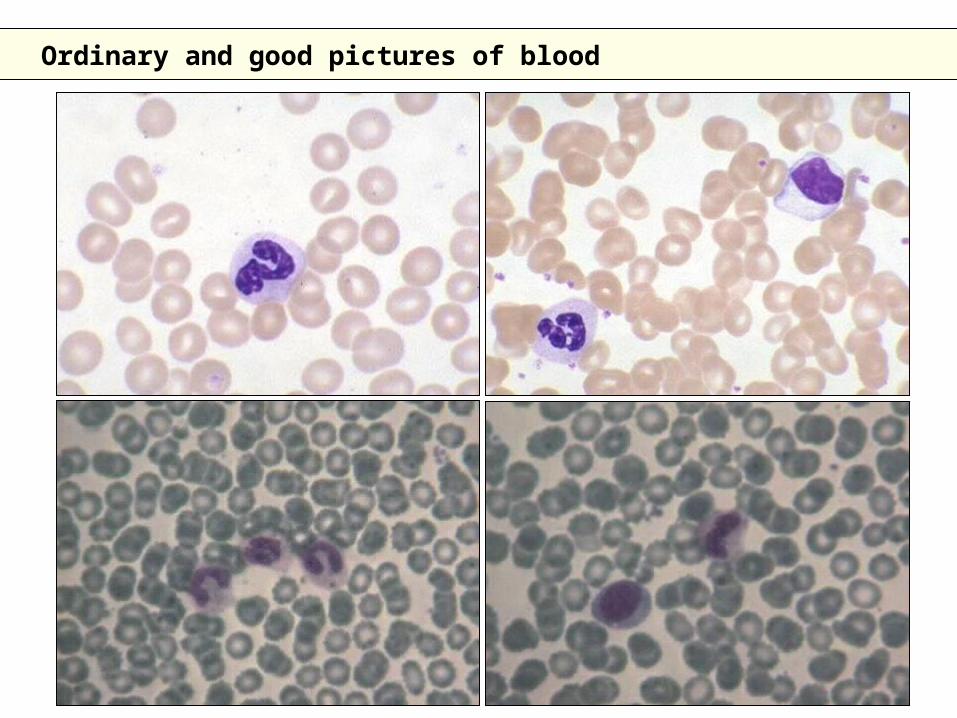
Ordinary and good pictures of blood

Classification algorithm
acquisition
• Digital cameras
• Video capturing and digitizing
preprocessing
• Segmentation
• Contrast stretching
• Brightness enhancement
features extracting classification
• Wavelet transformation
• AMT
• PCA
• PLS-DA

Features vector building
• Wavelet transformation– transforms image from spatial to frequency-spatial domain
• good results in different areas of image recognition and analysis• quick and simple algorithm
• AMT– transforms image from spatial to scale domain
• good result in classification of both heterogeneous images and textures• simple algorithm but relatively slow for big images (1-4 seconds in
comparison with Wavelet transformation –- 0.2-0.8 seconds)

Features vector: wavelet transformation
Raw signal
Smoothed Details
H G
Smoothed Details
H G
…
Gr
Hr
diag
hor
ver
HrHc HrGc GrHc GrGc
r — rows
c — columns
H – gives smoothing signal
G – gives the details
1D signal 2D signal

Features vector: wavelet transformation
For feature vector we calculate metrics of horizontal, vertical and diagonal details:
Feature vector — [ f(dh1),f(dv1), f(dd1),…,f(dhm),f(dvm),f(ddm) ]
1…m level of wavelet transform
dh, dv, dd horizontal, vertical and diagonal details
f() metrics function
Useful metrics:– Energy
– Standard deviation
– Moments

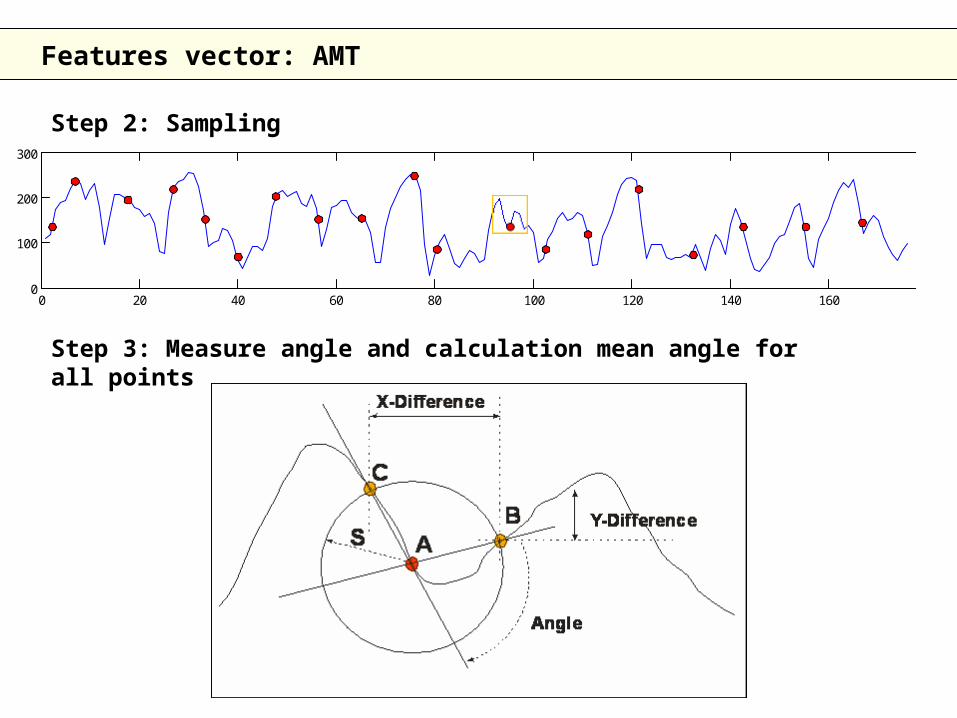
Features vector: AMT
• Was developed by Robert Andrle as a substitute of fractal analysis for the purpose of complexity of geomorphic lines investigation (R. Andrle, Math. Geol., 16, 83-79, (1996))
• Was introduced into chemometrics as generic approach for analysis of measurement series by Esbensen et al(K.H. Esbensen, K, Kvaal, K.H. Hjelmen, J. Chemom., 10, 569-590, (1996))
• Properties– transforms the 2D image into 1D spectra without losses the structure
information
– highly sensitive for changing of typical scales of objects on images
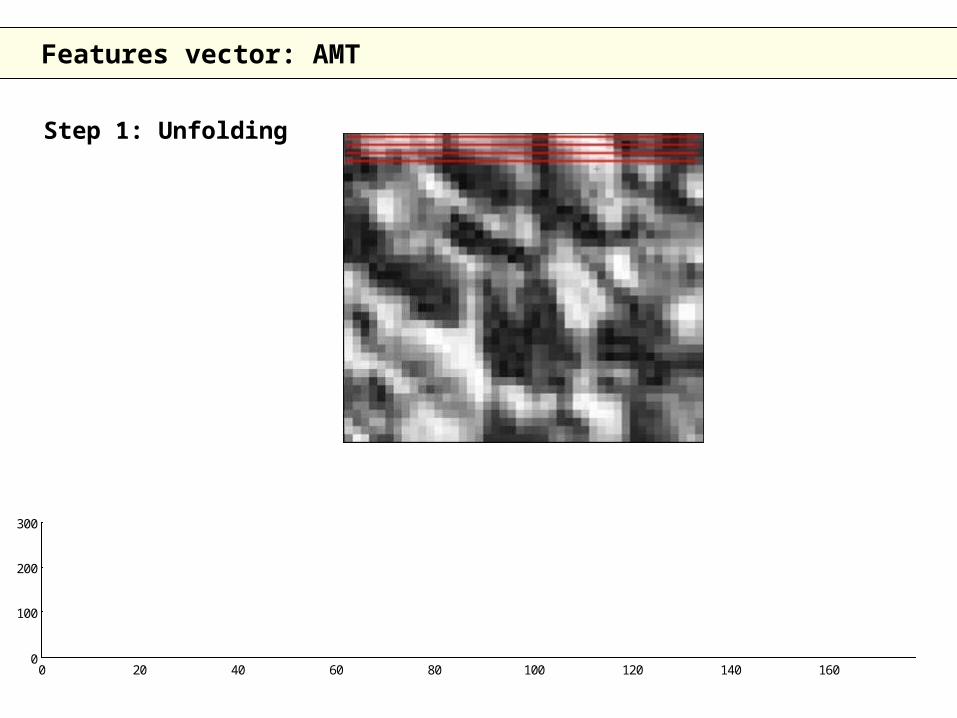
Features vector: AMT
Step 1: Unfolding
0 20 40 60 80 100 120 140 160 1800
100
200
300
Features vector: AMT
0 20 40 60 80 100 120 140 160 1800
100
200
300
Step 2: Sampling
Step 3: Measure angle and calculation mean angle for all points

Features vector: AMT
Step 4: Change radius S and repeat step 3 for mean angle vector (spectrum) building
– Mean angle values (MAS) for each S from S0 to SM compose mean angle
spectrum { MAS0,…,MASM }
Example of MA spectrum
Spectrum can be regarded as a vector of images features on set of scales

Objects for investigations
• Calibration set– 60 samples
– 2 classes
– Samples were taken from different people
– Ordinary microscope and cheap VGA camera were used
• Test set– 96 samples
– Samples were taken from different people
– Samples were taken in other day then calibration set
– Ordinary microscope and cheap VGA camera were used

Objects for investigations
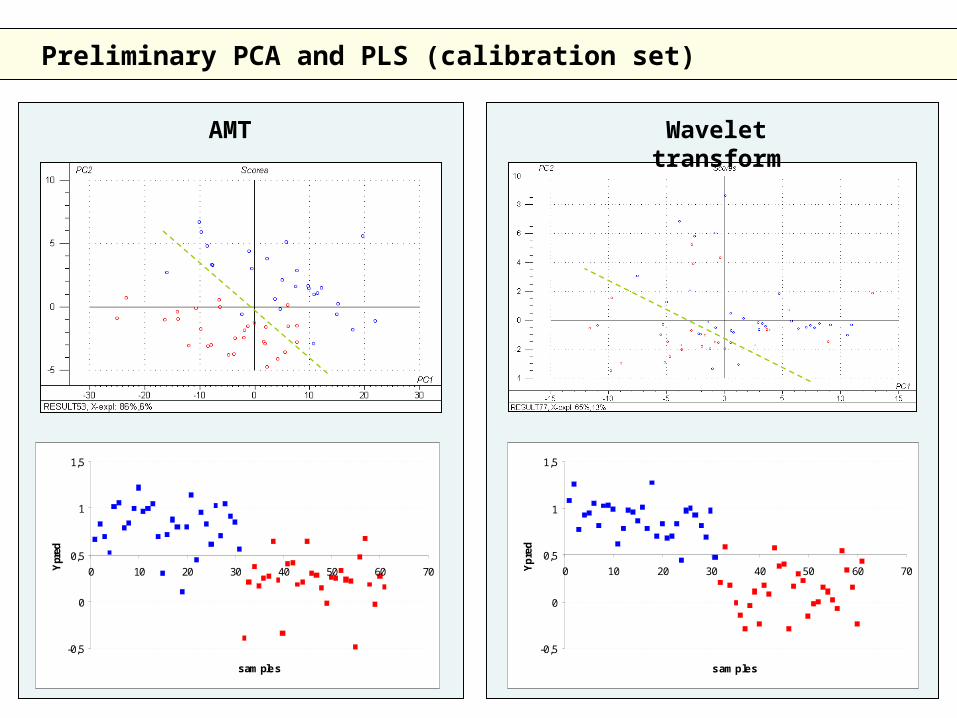
Preliminary PCA and PLS (calibration set)
AMT Wavelet transform
-0,5
0
0,5
1
1,5
0 10 20 30 40 50 60 70
s ample s
Ypred
-0,5
0
0,5
1
1,5
0 10 20 30 40 50 60 70
s ample s
Ypred

Preliminary PLS (test set)
AMT Wavelet transform
-0,5
0,0
0,5
1,0
1,5
0 20 40 60 80 100 120
s ample s
Ypred
-0,5
0,0
0,5
1,0
1,5
0 20 40 60 80 100 120
s ample sYpred

Surf of blood cells
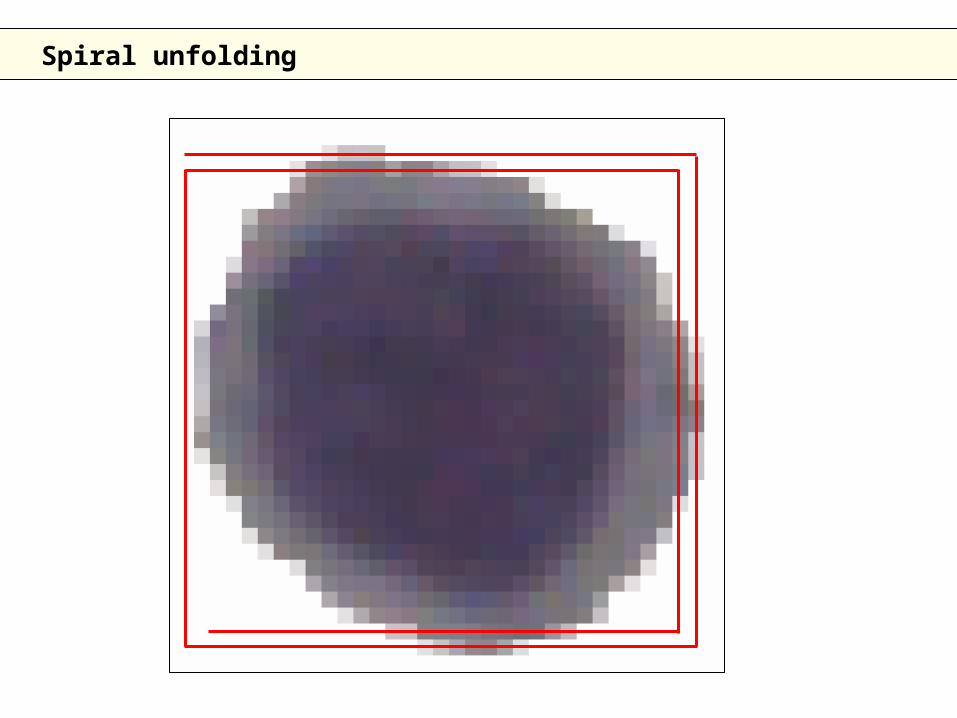
Spiral unfolding

Unfolded images profiles
0 1000 2000 3000 4000 5000 6000 70000
50
100
150
200
250
300c02.bmp
0 1000 2000 3000 4000 5000 6000 70000
50
100
150
200
250
300d01.bmp
0 1000 2000 3000 4000 5000 6000 70000
50
100
150
200
250
300d03.bmp
0 1000 2000 3000 4000 5000 6000 70000
50
100
150
200
250
300c01.bmp
0 1000 2000 3000 4000 5000 6000 70000
50
100
150
200
250
300c03.bmp
0 1000 2000 3000 4000 5000 6000 70000
50
100
150
200
250
300d02.bmp

Preliminary analysis

PLS-DA results
Prediction of calibration set
– 60 samples
– Samples were taken in different days and from different people
Prediction of test set
– 96 samples
– Samples were taken in different days and from different people
-0,5
0
0,5
1
1,5
0 10 20 30 40 50 60 70
s ample s
Ypred
-0,5
0
0,5
1
1,5
0 20 40 60 80 100 120
s ample s
Ypred

Summary
• Conclusions
– Hard-modeling approach that is used to image analysis effective only
for high-quality images
– The soft-modeling approach of image classification was applied to the
task of blood cell type recognition on low-quality images
– The effectiveness of recognition was 96-97% that allows to speak about
advantages of such approach
• To be continued
– Analysis of middle resolution images (1-2 Mp)
– Approximation of cells by ellipse curve and ellipse-like unfolding
– Use other methods for analysis of image profiles

Acknowledgements
• Alexey Pijanzin, docent, doctor of Children's hospital of Altai region
• Ivan Belyaev, M.S. student of Altai State University
• Sergei Zhilin, PhD, docent of Altai State University