Embed Size (px)
DESCRIPTION
The ability to use remote sensing in studying lake ecology lies in the capability of satellite sensors to measure the spectral reflectance of constituents in water bodies. This reflectance can be used to determine the concentration of the constituents of the water column through mathematical relationships. This work identified a simple linear equation for estimating suspended matter in Lake Naivasha with reflectance in Landsat7 ETM+ image. A R² = 0.94, n = 6 for suspended matter was obtained. Archive of Landsat imagery was used to produce maps of suspended matter concentrations in the lake. The suspended matter concentrations at five different locations in the lake over 30 year’s period were then estimated. It was therefore concluded that the ecological changes Lake Naivasha is experiencing is the result of the high water abstraction and the effect of climate change.
Citation preview

Benjamin Ghansah et al. Int. Journal of Engineering Research and Applications www.ijera.com
ISSN: 2248-9622, Vol. 6, Issue 1, (Part - 5) January 2016, pp.01-12
www.ijera.com 1|P a g e
Using Remote Sensing Techniques For Monitoring Ecological
Changes In Lakes: Case Study Of Lake Naivasha
BenjaminGhansaha,*
, David. M. Harperb,,Eric. K. Forkuo
a, RichardAppoh
c
aDepartment of Geomatic Engineering, Kwame Nkrumah University of Science and Technology, Kumasi,
Ghana bDepartment of Biology, University of Leicester, UK
cInstitute of Environment and Sanitation Studies, University of Ghana, Legon
ABSTRACT The ability to use remote sensing in studying lake ecology lies in the capability of satellite sensors to measure
the spectral reflectance of constituents in water bodies. This reflectance can be used to determine the
concentration of the constituents of the water column through mathematical relationships. This work identified a
simple linear equation for estimating suspended matter in Lake Naivasha with reflectance in Landsat7 ETM+
image. A R² = 0.94, n = 6 for suspended matter was obtained. Archive of Landsat imagery was used to
produce maps of suspended matter concentrations in the lake. The suspended matter concentrations at five
different locations in the lake over 30 year’s period were then estimated. It was therefore concluded that the
ecological changes Lake Naivasha is experiencing is the result of the high water abstraction and the effect of
climate change.
KEY WORDS: Archive, Changes in Climate, Ecology, Landsat Imagery, Lake Naivasha, Remote Sensing,
Water Abstraction
I. Introduction Remote sensing is the discipline of acquiring
information from an object without physically being
in contact with the object itself. It involves using
different sensors to remotely pull together radiation
from the object and then analyze to obtain
information about the object. Most of these sensors
are space-borne and measure the electromagnetic
energy that is either reflected or emitted from objects.
The recorded energy is calibrated and converted to
values of picture elements (pixels) which are
interpreted and stored as images of scenes from the
object, (Lillesandet al, 2008). Remote sensing is a
relatively less expensive means of obtaining
information which otherwise would have been more
expensive to do by ground measurements,
(Lillesandet al, 2008; Dekaetal, 2011). However, it
will be ideal to recognize that the interpretation of
images from satellites is a way of spreading out a
limited number of ground measurements to parts and
or periods where ground observations could and will
not cover, (Lillesand, 2002). Remote sensing has
become an integral part of Earth resources data
collection process and have been applied across
different sectors and regions from Agriculture (e.g.
Piccard and Bydekerke, 2012), Environment (e.g.
Battistionet al 2012.), Climate (e.g. Gayetet al, 2012;
Wheeler et al, 2012), Maritime (e.g. Garmo and
Radius, 2012; Tangen, 2012), Business (e.g. Born,
2012; Monks et al, 2012), Water (e.g. Hartmann,
2012), Atmosphere (e.g. Di Nicolantonio and
Cacciari, 2012; Morelli and Flore, 2012). Remote
sensing can offer a suitable approach to integrate
limnological data taken from conventional
measurements, (Duanet al, 2007). The launch of the
Landsat Multispectral Spectral Scanner (MSS),
Thematic Mapper (TM), Enhanced Thematic Mapper
(ETM +) as well as different sensors on SPOT,
MODIS and MERIS satellites have provided
comprehensive data of the globe. The TM, ETM+,
MODIS (Terra) (Lillesand, 2002) and MERIS are
some of the sensors that have been used in
limnological studies. These sensors offers synoptic
view of large areas under study (Brescianiet al,
2011). The advancement in the satellite technology
over the past two decades has provided new-
generational satellite systems that can provide near
real time (Gitelsonet al, 1993) information of the
earth with high accuracy. Geostationary satellite
systems can provide hourly information about
weather patterns with high accuracy. Other near-earth
high velocity satellite systems such as the Moderate
Resolution Imaging Spectro-radiometer (MODIS)
can provide both coarse and fine spatial resolution
and high temporal resolution images of the earth
surface. Numerous products can also be derived
from MODIS images. The Landsat satellite system
has also provided comprehensive data of the earth
surface. The satellite program was developed to
provide data of the land surface and has since 1975,
captured land surface processes at 16 day time
interval. MERIS was specially designed to provide
RESEARCH ARTICLE OPEN ACCESS

Benjamin Ghansah et al. Int. Journal of Engineering Research and Applications www.ijera.com
ISSN: 2248-9622, Vol. 6, Issue 1, (Part - 5) January 2016, pp.01-12
www.ijera.com 2|P a g e
data of water surfaces and can be used to study the
variable characteristics of the ocean as well as inland
water bodies. Other satellites that are constantly
covering and providing data of the earth surface
include ASTER, SPOT, Ikonos, Indian Remote
Sensing, (Lillesandet al, 2004). As such, continuous
data of the earth surface are available, which can
bridge the gap that exists in the conventional field
data capturing process. Most remarkable about these
systems is that the images and the derived products
obtained from these platforms are made available and
at relatively low cost to the public. This has rendered
remote sensing applications very cost effective. Also,
the advancement in computer technology with the
associated high storage and processing capabilities
makes remote an efficient technique as data
processing has become relatively simple. Thus
remote sensing can deliver the extra capabilities
needed in providing continuous data on lakes and
other inland water bodies so that accurate
interpretation of ecological changes that occurs in
lakes can be monitored.
Satellite images over Lake Naivasha are widely
available, but no extensive interpretation of these
images to reflect on the ecological changes of the
lake has been done. Most of the changes reported so
far are based on ground truth observations and
measurements which are relatively costly to
undertake and often have discontinuities in their
observation. As such, most interpretations reflect
only on seasonal changes. Also, most of the models
developed to estimate the lake water quality
parameters so far are either analytical or semi-
analytical algorithms, which are time-costly to use.
This has also made previous and future estimations of
the changes in the lake a difficult task. In line with
these set-backs, this work identified a simple
regression relationship between in situ data and
satellite image values over the lake. It used
reflectance of suspended matter values in Landsat7
ETM+ band 3 and matched it with the ground
observations of suspended matter concentrations to
find the coefficient of determination for the
suspended matter content in the lake. The
mathematical relationship was then applied to archive
of Landsat imagery to develop maps of suspended
matter concentrations of the lake at different times.
The suspended matter values estimated from the
produced maps were then compared and analysed to
study the changes in the lake. Discussions were done
to explain some of the changes the lake has
experienced.
II. 2.0 Remote Sensing For Limnology
Over the past three decades the advancement in
computer technology and the births of high resolution
satellites has provided the grounds for an increase in
the use of remote sensing and its applications,
(Lillesand, 2002). The capability of using remote
sensing to study lakes and reservoirs comes from the
promise that the inherent optical properties of water
column can be related to measured spectra (Dekker et
al, 1997; Miller and McKee, 2004) in a sensor
through mathematical equation(s), especially when
there is a good correlation. Yacobi (1995) obtained a
good coefficient of determination (R²=0.92) of a
linear regression between chlorophyll a from Landsat
(band4/band3) and corresponding ground
measurements. He suggested that the challenge in
using remote sensing for studying water constituents
lies in the difficulties in finding the relationship
between the radiance from the surface of the water
and the spectra within the water column due to
difference in the distribution of constituents in the
water. Lee (2001) studied the properties of the
bottom and water column from Airborne Visible
Infrared Imaging Spectrometer (AVIRIS). The
characteristics of the bottom depth, bottom albedo,
water absorption and backscattering coefficients
observed, were used to estimate the concentrations of
chlorophyll, coloured dissolved organic matter
(CDOM) and suspended sediments from the shallow
water Tampa Bay in Florida. However, the method
used included complicated mathematical
computations which were difficult to compute
manually and thus relied on computer programming
to develop the model. Giardino (2001) developed
empirical algorithms for mapping chlorophyll a
concentration and Secchi disk depth from reflectance
in a TM image that has been atmospherically
corrected. The algorithms gave (R² =0.99) for
chlorophyll a and (R² =0.85) for Secchi disk depth
suggesting that atmospherically correcting image
radiance brings an improvement in the value of R²
obtained. Liu (2003) used remote sensing to quantify
the parameters of shallow lakes. The report stressed
on the variability of water quality parameters and the
limitations of using remote sensing to carry out such
studies, but was however able to quantify parameters
such as sediment particles, phytoplankton, CDOM
and transparency. The paper reported that the
mathematical relation between ground-truth data and
their matching remotely sensed reflectance can either
be linear or non-linear, depending on the site under
study. Conclusion was drawn to the fact that it is of
high significance to correct satellite images for the
effect of the atmosphere and added that the
concentration levels and the spatial variability of
constituents influence the accuracy of using remote
sensing for estimation. Brando and Dekker (2003)
stated that an efficient way of retrieving the
concentrations of water quality parameters through
remote sensing techniques is by using a linear matrix
inversion method (MIM) to relate the remote sensing

Benjamin Ghansah et al. Int. Journal of Engineering Research and Applications www.ijera.com
ISSN: 2248-9622, Vol. 6, Issue 1, (Part - 5) January 2016, pp.01-12
www.ijera.com 3|P a g e
data and the corresponding ground measurements.
The report suggested that this method has the
advantage of being applied to a whole region rather
than a specific site as reported by Liu et al (2003).
Also, the MIM model is easy to solve and can easily
be used in remote sensing applications where each
pixel in an image requires a model to evaluate.
Reflectance from a Hyperion hyperspectral remotely
sensed imagery and in situ data was used to estimate
estuarine and coastal water quality. However, such an
empirical model is relatively difficult to develop and
use, rather than a linear regression relation. Wu
(2008) obtained (R² =0.83, n=25) when Landsat
imagery was used to estimate the Secchi Disk Depth
in Poyang Lake in China. Two image sources,
Landsat TM and MODIS images were used to
develop two multiple regression lines for estimating
water quality parameters in the Poyang Lake. It was
concluded that MODIS images give a good result for
suspended matter estimation than Landsat. However,
due to the relatively low spatial resolution of
MODIS, difficulties arise when it is being used to
study water bodies of smaller spatial extent. Brezonik
(2005) also studied the concentrations of chlorophyll
a and Coloured Dissolved Organic Matter (CDOM)
using Landsat imagery. A simple regression line
between ground measurements of 15 lakes in
Minnesota and Landsat images over the lakes was
developed and used to produce water quality maps of
the lakes. The report reiterated that it is of less
difficulty to predict water quality parameters using
simple regression equations and added that band
ratios are of advantage when atmospheric effects are
significant. The paper also discussed the suitability of
using Landsat TM bands for monitoring different
water column properties. Under the Water
Framework Directive for the European peri-alpine
lakes project, Bresciani (2011) used over 200 MERIS
images to produce water quality maps of the peri-
alpine lakes and generated time series data that can
be used for future chlorophyll a concentration
determination. The report suggested that due to the
frequency and the synoptic view of large areas
provided by satellite images, studying water quality
parameters by remote sensing techniques is very
advantageous. The paper concluded that lentic
ecosystems are highly affected by meteorological
changes and anthropogenic activities which vitally
affect the role these water bodies play in serving as a
drinking water reservoir. Song (2012) reported that
the ratios of Landsat ‘band4/band 3 gives the highest
correlation’ for chlorophyll a concentration in the
Shitoukoumen Reservoir. The study also confirmed
that chlorophyll a is a parameter that can be used to
characterize the trophic states of lakes. The results
obtained also confirm earlier works that used
regression analysis to establish relations between
reflectance of different band combinations and
ground truth data. The paper concluded that the births
of new space-borne platforms with high resolutions
will improve and reduce the limitations of using
remote sensing in limnology.
III. Methodology 3.1 Study Area
Figure 1: Lake Naivasha. Spource: Google
The study area is Lake Naivasha (Figure 1) in Kenya,
which is located at Latitude 0 ° 45’S and Longitude
36° 20’E, in the Eastern Rift Valley, (Hickleyet al,
1994). This location is about 100 km from Nairobi,

Benjamin Ghansah et al. Int. Journal of Engineering Research and Applications www.ijera.com
ISSN: 2248-9622, Vol. 6, Issue 1, (Part - 5) January 2016, pp.01-12
www.ijera.com 4|P a g e
the capital of Kenya and in proximity to Naivasha
and Nakuru towns. The surface area of the water in
the lake fluctuates between 100-150 km² (Harper et
al, 1990; Becht and Harper, 2002) with a catchment
size of 3400 km² (Mireri, 2005). Lake Naivasha is a
shallow freshwater body (Gaudet and Muthuri, 1981)
with depth varying between 2m to 8m. The elevation
of the lake is 1890 m above mean sea level (Harper et
al, 2011) within an enclosed topography (Ballot et al,
2009) and without a surface outlet (Becht and Harper,
2002). The Malewa River, GilgilRiver,Karati River,
rainwater and underground seepage are the
contributors of the water to the lake, (Harper et al;
1990, Hickleyet al, 1994; Bemigisha, 2000) with
Malewa River contributing the majority. The region
around the lake is characterized by different plant and
animal species and that has given the lake and its
environment an ecological place of great
significance.
Water from the lake is also abstracted for the
irrigations of flowers with annual abstraction rate
estimated to be 𝟔𝟎𝒙𝟏𝟎𝟔 m³/year, (Becht and Harper,
2002). This means that water abstraction is on the
rise. Water temperature is between 9°C to 25°C as
minimum and maximum temperatures respectively.
The lake and its vegetative region has also been a
tourist site for about 100 years and have since
attracted many studies as well. Though reports (e.g.
Harper et al, 2011; Food & Water Watch and the
Council of Canadians, 2008) have suggested that the
number of animal species in the ecosystem have
declined, hippopotamus and different types of birds
are still part of the lake’s ecosystem. The lake is
characterized by four geological depressions which
are believed to be the result of volcanic action. These
depressions thus created the main lake, the Crescent
Island Lake, Lake Sonachi and Lake Olodien (Figure
2). Due to the socio-economic importance of Lake
Naivasha and
the associated
over usage of its
resources, the
lake is
experiencing
many ecological
changes (Mireri, 2005).
Table 1: Coordinates of locations selected to monitor ecological changes in Lake Naivasha
POINT LATITUDE LONGITUDE
NEAR MALEWA RIVER 0° 43ˈˈ 15ˈ 36° 20ˈˈ 01ˈ
MID-LAKE 0° 46ˈˈ 05ˈ 36° 20ˈˈ 58ˈ
HIPPO POINT 0° 47ˈˈ 14ˈ 36° 19ˈˈ 08ˈ
CRESENT ISLAND 0° 46ˈˈ 05ˈ 36° 24ˈˈ 42ˈ
LAKE OLIODIEN 0° 48ˈˈ 48ˈ 36° 16ˈˈ 39ˈ
Benjamin Ghansah et al. Int. Journal of Engineering Research and Applications www.ijera.com
ISSN: 2248-9622, Vol. 6, Issue 1, (Part - 5) January 2016, pp.01-12
www.ijera.com 5|P a g e
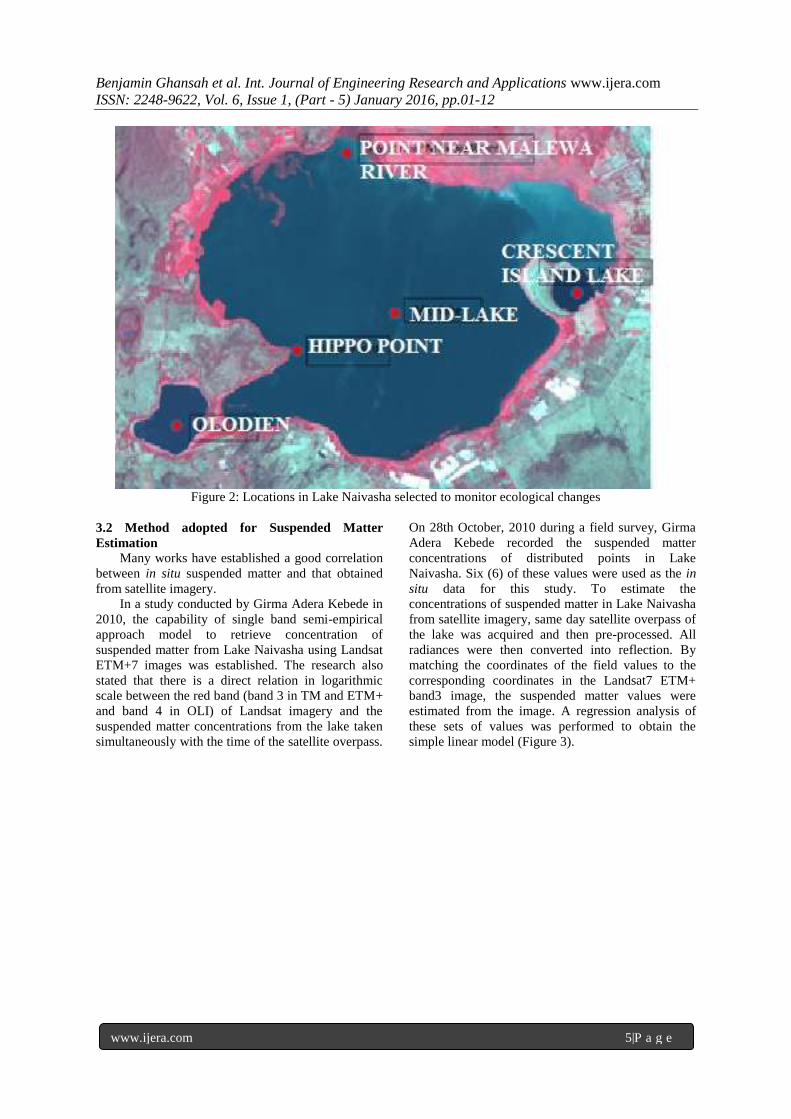
Figure 2: Locations in Lake Naivasha selected to monitor ecological changes
3.2 Method adopted for Suspended Matter
Estimation
Many works have established a good correlation
between in situ suspended matter and that obtained
from satellite imagery.
In a study conducted by Girma Adera Kebede in
2010, the capability of single band semi-empirical
approach model to retrieve concentration of
suspended matter from Lake Naivasha using Landsat
ETM+7 images was established. The research also
stated that there is a direct relation in logarithmic
scale between the red band (band 3 in TM and ETM+
and band 4 in OLI) of Landsat imagery and the
suspended matter concentrations from the lake taken
simultaneously with the time of the satellite overpass.
On 28th October, 2010 during a field survey, Girma
Adera Kebede recorded the suspended matter
concentrations of distributed points in Lake
Naivasha. Six (6) of these values were used as the in
situ data for this study. To estimate the
concentrations of suspended matter in Lake Naivasha
from satellite imagery, same day satellite overpass of
the lake was acquired and then pre-processed. All
radiances were then converted into reflection. By
matching the coordinates of the field values to the
corresponding coordinates in the Landsat7 ETM+
band3 image, the suspended matter values were
estimated from the image. A regression analysis of
these sets of values was performed to obtain the
simple linear model (Figure 3).
Benjamin Ghansah et al. Int. Journal of Engineering Research and Applications www.ijera.com
ISSN: 2248-9622, Vol. 6, Issue 1, (Part - 5) January 2016, pp.01-12
www.ijera.com 6|P a g e
y = 1.1754x - 0.0635
R² = 0.9367
0
10
20
30
40
50
60
0 5 10 15 20 25 30 35 40 45
Measured Suspended
Matter
(mg/l)
Estimated Suspended Matter (mg/l)
RELATION BETWEEN MEASURED SUSPENDED MATTER AND ESTIMATED
SUSPENDED MATTER
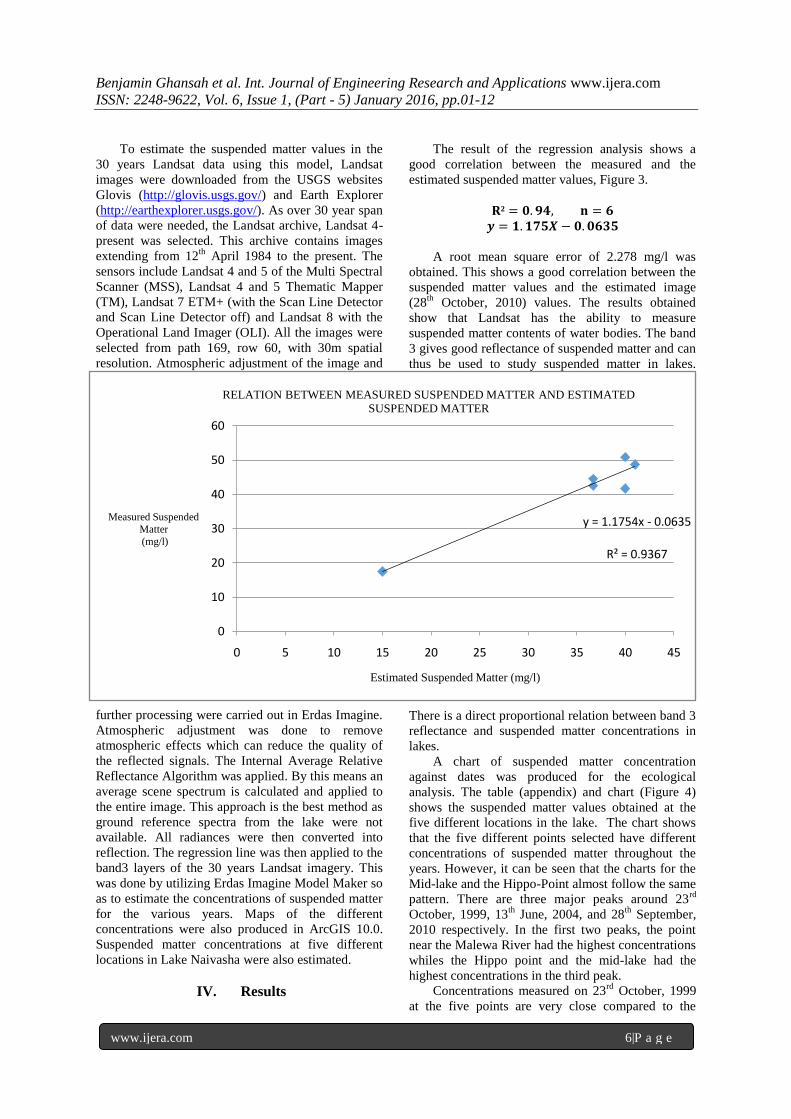
To estimate the suspended matter values in the
30 years Landsat data using this model, Landsat
images were downloaded from the USGS websites
Glovis (http://glovis.usgs.gov/) and Earth Explorer
(http://earthexplorer.usgs.gov/). As over 30 year span
of data were needed, the Landsat archive, Landsat 4-
present was selected. This archive contains images
extending from 12th
April 1984 to the present. The
sensors include Landsat 4 and 5 of the Multi Spectral
Scanner (MSS), Landsat 4 and 5 Thematic Mapper
(TM), Landsat 7 ETM+ (with the Scan Line Detector
and Scan Line Detector off) and Landsat 8 with the
Operational Land Imager (OLI). All the images were
selected from path 169, row 60, with 30m spatial
resolution. Atmospheric adjustment of the image and
further processing were carried out in Erdas Imagine.
Atmospheric adjustment was done to remove
atmospheric effects which can reduce the quality of
the reflected signals. The Internal Average Relative
Reflectance Algorithm was applied. By this means an
average scene spectrum is calculated and applied to
the entire image. This approach is the best method as
ground reference spectra from the lake were not
available. All radiances were then converted into
reflection. The regression line was then applied to the
band3 layers of the 30 years Landsat imagery. This
was done by utilizing Erdas Imagine Model Maker so
as to estimate the concentrations of suspended matter
for the various years. Maps of the different
concentrations were also produced in ArcGIS 10.0.
Suspended matter concentrations at five different
locations in Lake Naivasha were also estimated.
IV. Results
The result of the regression analysis shows a
good correlation between the measured and the
estimated suspended matter values, Figure 3.
𝐑² = 𝟎.𝟗𝟒, 𝐧 = 𝟔
𝒚 = 𝟏.𝟏𝟕𝟓𝑿 − 𝟎.𝟎𝟔𝟑𝟓
A root mean square error of 2.278 mg/l was
obtained. This shows a good correlation between the
suspended matter values and the estimated image
(28th
October, 2010) values. The results obtained
show that Landsat has the ability to measure
suspended matter contents of water bodies. The band
3 gives good reflectance of suspended matter and can
thus be used to study suspended matter in lakes.
There is a direct proportional relation between band 3
reflectance and suspended matter concentrations in
lakes.
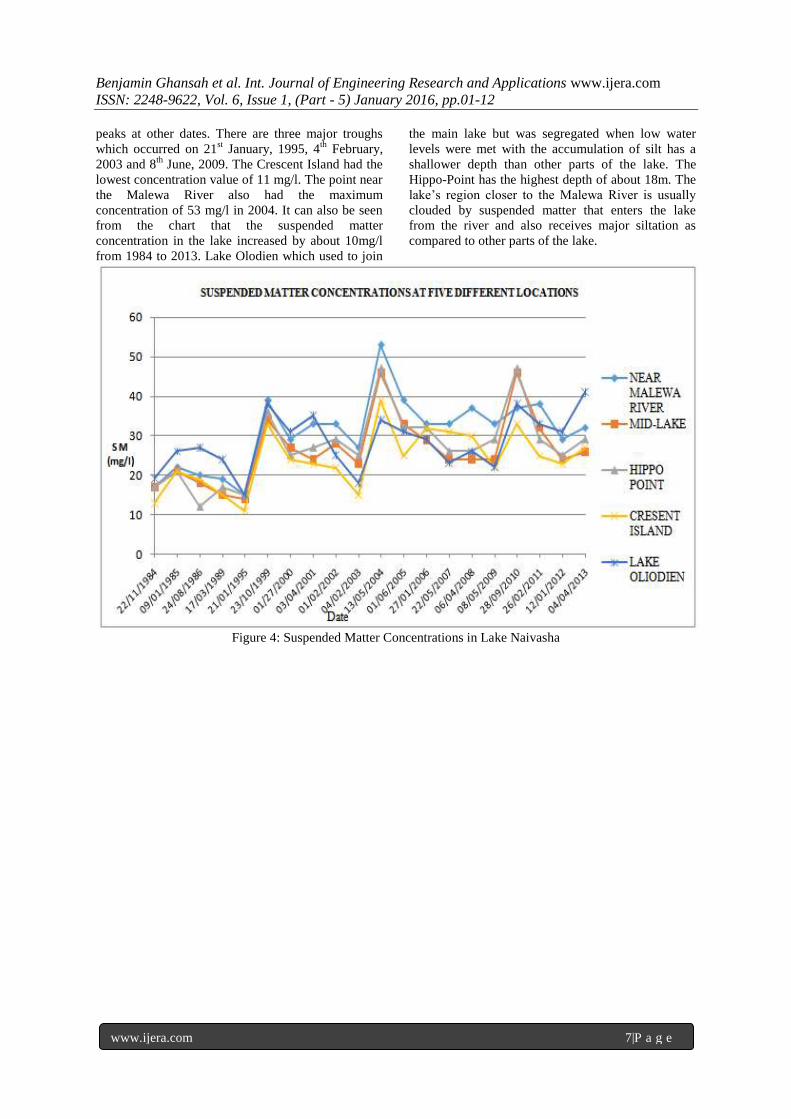
A chart of suspended matter concentration
against dates was produced for the ecological
analysis. The table (appendix) and chart (Figure 4)
shows the suspended matter values obtained at the
five different locations in the lake. The chart shows
that the five different points selected have different
concentrations of suspended matter throughout the
years. However, it can be seen that the charts for the
Mid-lake and the Hippo-Point almost follow the same
pattern. There are three major peaks around 23rd
October, 1999, 13th
June, 2004, and 28th
September,
2010 respectively. In the first two peaks, the point
near the Malewa River had the highest concentrations
whiles the Hippo point and the mid-lake had the
highest concentrations in the third peak.
Concentrations measured on 23rd
October, 1999
at the five points are very close compared to the
Benjamin Ghansah et al. Int. Journal of Engineering Research and Applications www.ijera.com
ISSN: 2248-9622, Vol. 6, Issue 1, (Part - 5) January 2016, pp.01-12
www.ijera.com 7|P a g e
peaks at other dates. There are three major troughs
which occurred on 21st January, 1995, 4
th February,
2003 and 8th
June, 2009. The Crescent Island had the
lowest concentration value of 11 mg/l. The point near
the Malewa River also had the maximum
concentration of 53 mg/l in 2004. It can also be seen
from the chart that the suspended matter
concentration in the lake increased by about 10mg/l
from 1984 to 2013. Lake Olodien which used to join
the main lake but was segregated when low water
levels were met with the accumulation of silt has a
shallower depth than other parts of the lake. The
Hippo-Point has the highest depth of about 18m. The
lake’s region closer to the Malewa River is usually
clouded by suspended matter that enters the lake
from the river and also receives major siltation as
compared to other parts of the lake.
Figure 4: Suspended Matter Concentrations in Lake Naivasha

Benjamin Ghansah et al. Int. Journal of Engineering Research and Applications www.ijera.com
ISSN: 2248-9622, Vol. 6, Issue 1, (Part - 5) January 2016, pp.01-12
www.ijera.com 8|P a g e
10 15 20 25 30 35 40 45 50 55 60
mg/l
Figure 5: Suspended Matter maps of Lake Naivasha
V. Discussion The current ecological changes Lake Naivasha is
experiencing took a major start in the 1980s.
According to Harper (1990), Adams (2002) and
WWF Report (2011), the over abstraction of water
started in the early 1980s and this coincided with low
rainfalls between 1984 and 1988. Also, more than
83% of Papyrus swamps which held the ‘key to the
ecological health’, (Harper et al, 1990) of the lake
were cleared for agricultural activities within the
same period. As a result, the lake recorded its lowest
levels in the century due to the over abstraction of
water and the increased exposure to evaporation.
According to Becht and Harper (2002), there is a
current abstraction rate of 𝟔𝟎𝒙𝟏𝟎𝟔m³/year, due to the
supply of drinking water for the Nakuru and
Naivasha towns as well as geothermal power
generation and the excessive demands of water for
the booming horticultural activities in the catchment.
Space-borne sensors are capable of recording the
properties of lentic waters to reveal the activities of
the benthic ecosystem especially if the water is
shallow (Bresciani, 2011); as has been done in this
study by using the Landsat 7 ETM+ sensor to reveal
the suspended matter content of Lake Naivasha. This
confirms literature that the ecological changes the
lake is experiencing is partly attributed to the effect
of low lake levels vis-à-vis water abstraction and
increased evaporation (Harper et al, 2011).
Ngecu and Mathu (1999) reported of the El Nino
weather phenomenon Kenya experienced between
1997 and 1998. According to the report the El Nino
triggered flooding and landslides which caused
enormous plants destruction. This increased surface
Benjamin Ghansah et al. Int. Journal of Engineering Research and Applications www.ijera.com
ISSN: 2248-9622, Vol. 6, Issue 1, (Part - 5) January 2016, pp.01-12
www.ijera.com 9|P a g e
erosion from higher surface run-offs and filled rivers
and dams with sediments. Gitahi (2002), Mireri,
(2005) also reported that the application of agro-
chemical for farming activities within the closed
catchment of Lake Naivasha is on the rise. Thus the
peaks of suspended matter concentrations on 23rd
October, 1999, 13th
June, 2004, and 28th
September,
2010 reported in this study (figure 4 and figure 5) are
linked with the result of high influx of sediments into
the lake. That is, during seasons of heavy rainfalls
and flooding, agro-chemicals (such as phosphorus
and nitrogen) are transported through surface run-offs
into Lake Naivasha resulting in the bloom of algae.
Moreover, the sequential increase in the rainfall and
flooding amounts as a result of global climatic
changes has made this phenomenon a frequent one
and are thus recurrently experienced in various
regions in Africa and around the world. Thus climatic
changes has been one of the main causes of
ecological changes in Lake Naivasha as has been
revealed using the remote sensing techniques
descried in this study. Other works (e.g. O'Reilly et
al, 2003; Muhozaet al, 2006; Verburget al, 2006;
Assefa, 2010), has also determined climate change to
be the major cause of ecological changes in
freshwaters in the sub-region.
VI. Acknowledgement This work was carried out under government of
Kenya research permission to Professor David
Harper, Department of Biology, University of
Leicester. We thank Girma Adera Kebede for the
ground truthed data. We are also grateful to Professor
Heiko Balzter, Department of Geography, University
of Leicester.
References [1.] Ballot, A., Kotut, K., Novelo, E., Krienitz,
L., 2009. Changes of phytoplankton
communities in Lakes Naivasha and
Oloidien, examples of degradation and
salinization of lakes in the Kenyan Rift
Valley Hydrobiologia 632, 359–363.
[2.] Battistion, S., Fontannaz, D., Maxant, J.,
Frapont, P., 2012. Earth Observation
Satellites-A tool for Environmental
Observatories. The growing use of GMES
across Europe’s regions. NEREUS
publication, October 2012
[3.] Becht, R., Harper, D.M., 2002. Towards an
understanding of human impact upon the
hydrology of Lake Naivasha, Kenya, in:
Lake Naivasha, Kenya. Springer, pp. 1–11.
[4.] Bergamino N., Horion S., Stenuite S.,
Cornet Y., Loiselle S. Plisnier P. D., Descy
J. P., 2010. Spatio-temporal dynamics of
phytoplankton and primary production in
Lake Tanganyika using a MODIS based bio-
optical time series. Remote Sensing of
Environment 114 (2010) 772–780
[5.] Bemigisha, J., 2000. Landcover mapping
and multicriteria modelling, for explaining
the spatial and temporal distribution of
papyrus swamp at Lake Naivasha, Kenya.
International archives of photogrammetry
and remote sensing 33, 165–174.
[6.] Branch, C.S., n.d. Ontario Ministry of
Natural Resources Home Page [WWW
Document]. URL
http://www.mnr.gov.on.ca/en/ (accessed
9.3.13).
[7.] Born, A., 2012. Integrated Services for
Offshore Wind Energy. The Growing Use of
GMES across Europe’s Regions. NEREUS
publication, October 2012
[8.] Brando, V.E., Dekker, A.G., 2003. Satellite
hyperspectral remote sensing for estimating
estuarine and coastal water quality.
Geoscience and Remote Sensing, IEEE
Transactions on 41, 1378–1387.
[9.] Bresciani, M., Stroppiana, D., Odermatt, D.,
Morabito, G., Giardino, C., 2011. Assessing
remotely sensed chlorophyll-a for the
implementation of the Water Framework
Directive in European perialpine lakes.
Science of the Total Environment 409,
3083–3091.
[10.] Brezonik, P., Menken, K.D., Bauer, M.,
2005. Landsat-based remote sensing of lake
water quality characteristics, including
chlorophyll and colored dissolved organic
matter (CDOM). Lake and Reservoir
Management 21, 373–382.
[11.] Deka, J., Tripathi, O.P., Khan, M.L., 2011.
A multi-temporal remote sensing approach
for monitoring changes in spatial extent of
freshwater Lake of DeeporBeelRamsar Site,
a major wetland of Assam. Journal of
Wetlands Ecology 5, 40–47.
[12.] Dekker, A.G., Hoogenboom, H.J., Goddijn,
L.M., Malthus, T.J.M., 1997. The relation
between inherent optical properties and
reflectance spectra in turbid inland waters.
Remote Sensing Reviews 15, 59–74.
[13.] Di Nicolantonio, W., Cacciari, A., 2012.
Satellite-Based Particulate Matter
Monitoring Over Northern Italy. The
Growing Use of GMES across Europe’s
Regions. NEREUS publication, October
2012
[14.] Duan, H., Zhang, Y., Zhang, B., Song, K.,
Wang, Z., Liu, D., Li, F., 2008. Estimation
of chlorophyll-a concentration and trophic
states for inland lakes in Northeast China
from Landsat TM data and field spectral
measurements. International Journal of
Benjamin Ghansah et al. Int. Journal of Engineering Research and Applications www.ijera.com
ISSN: 2248-9622, Vol. 6, Issue 1, (Part - 5) January 2016, pp.01-12
www.ijera.com 10|P a g e
Remote Sensing 29, 767–786.
[15.] Food & Water Watch and the Council of
Canadians, 2008. Lake Naivasha: Withering
Under the Assault of International Flower
Vendors. www.foodandwaterwatch.org or
www.canadians.org.
[16.] Garmo, P. and Radius A., 2012.
Improvement of vessel detection by Satellite
Rader Imagery. The Growing Use of GMES
across Europe’s Regions. NEREUS
publication, October 2012
[17.] Gayet, L. Stephenne, N., De Backer, S.,
Baudot, Y. Mertens, D., 2012. Earth
Observation for Reducing Emissions from
Deforestation and Forest Degradations. The
Growing Use of GMES across Europe’s
Regions NEREUS publication, October
2012
[18.] Giardino, C., Pepe, M., Brivio, P.A., Ghezzi,
P., Zilioli, E., 2001. Detecting chlorophyll,
Secchi disk depth and surface temperature in
a sub-alpine lake using Landsat imagery.
Science of the Total Environment 268, 19–
29.
[19.] Gitahi, S.M., Harper, D.M., Muchiri, S.M.,
Tole, M.P., 2002. Organochlorine and
organophosphorus pesticide concentrations
in water, sediment, and selected organisms
in Lake Naivasha (Kenya). Hydrobiologia
488, 123–128.
[20.] Gitelson, A., Garbuzov, G., Szilagyi, F.,
Mittenzwey, K.H., Karnieli, A., Kaiser, A.,
1993. Quantitative remote sensing methods
for real-time monitoring of inland waters
quality. International Journal of Remote
Sensing 14, 1269–1295.
[21.] Harper, D. M., Mavuti, K., Muchiri, M. S.,
1990. Ecology and management of Lake
Naivasha, Kenya, in relation to climatic
change, alien species’ introductions, and
agricultural development. Environmental
conservation 17.
[22.] Harper, D.M., Morrison, E.H., Macharia,
M.M., Mavuti, K.M., Upton, C., 2011. Lake
Naivasha, Kenya: ecology, society and
future. Freshwater Reviews 4, 89–114.
[23.] Hickley, P., North, R., Muchiri, S.M.,
Harper, D.M., 1994. The diet of largemouth
bass, Micropterussalmoides, in Lake
Naivasha, Kenya. Journal of fish biology 44,
607–619.
[24.] Hartmann, K., Heege, T., 2012. Water
quality monitoring in space and Time in
Aquatic Ecosystem. The Growing Use of
GMES across Europe’s Regions. NEREUS
publication, October 2012
[25.] Hickley, P., Bailey, R., Harper, D.M.,
Kundu, R., Muchiri, M., North, R., Taylor,
A., 2002. The status and future of the Lake
Naivasha fishery, Kenya. Hydrobiologia
488, 181–190.
[26.] Lee, Z., Carder, K.L., Chen, R.F., Peacock,
T.G., 2001. Properties of the water column
and bottom derived from Airborne
Visible Infrared Imaging Spectrometer
(AVIRIS) data. Journal of Geophysical
Research: Oceans (1978–2012) 106, 11639–
11651.
[27.] Lillesand, T.M., 2002. Combining satellite
remote sensing and volunteer Secchi disk
measurement for lake transparency
monitoring, in: Proceedings: National
Monitoring Conference, National Water
Quality Monitoring Council.
[28.] Lillesand, T.M., Kiefer, R.W., Chipman,
J.W., 2008. Remote sensing and image
interpretation. John Wiley & Sons Ltd.
[29.] Lillesand, T.M., Kiefer, R.W., Chipman,
J.W., 2004. Remote sensing and image
interpretation. John Wiley & Sons Ltd.
[30.] Liu, Y., Islam, M.A., Gao, J., 2003.
Quantification of shallow water quality
parameters by means of remote sensing.
Progress in Physical Geography 27, 24–43.
[31.] Mather P. M., 2004. Computer Processing of
Remotely-Sensed Images: An Introduction
[32.] Miller, R.L., McKee, B.A., 2004. Using
MODIS Terra 250 m imagery to map
concentrations of total suspended matter in
coastal waters. Remote sensing of
Environment 93, 259–266.
[33.] Mireri, C., 2005. Challenges Facing the
Conservation of Lake Naivasha, Kenya.
FWU Topics of Integrated Watershed
Management-Proceedings 3, 89–98.
[34.] Monks, P. S., Remedios J. J., Balzter H.,
Wells A., Aimond, S., Muthu, K., Cowsill,
R., Smith, T., 2012. G-step, Boosting
Business from Space. The Growing Use of
GMES across Europe’s Regions. NEREUS
publication, October 2012
[35.] Morelli, M., Flore, F., 2012. Satellite Data
for solar Ultraviolet and Photovoiltic
Management Services. The Growing Use of
GMES across Europe’s Regions. NEREUS
publication, October 2012
[36.] Muhoza S., Sinyenza , S., Makasa D.,
Lukwessa L., Zulu C. I., Phiri, H. (2006).
Climate variability as recorded in Lake
Tanganyika (Climlake): Final report.
Belgian Science Policy. 119 pp.
[37.] O'Reilly, C. M., Alin, S. R., Plisnier, P. -D.,
Cohen, A., & McKee, B. A. (2003). Climate
change decreases aquatic ecosystem
productivity of Lake Tanganyika, Africa.
Nature, 424, 766−768.

Benjamin Ghansah et al. Int. Journal of Engineering Research and Applications www.ijera.com
ISSN: 2248-9622, Vol. 6, Issue 1, (Part - 5) January 2016, pp.01-12
www.ijera.com 11|P a g e
[38.] Piccard, I. and Bydekerke, L., 2012.
Agricultural monitoring and damage
assessment with satellite Images. The
Growing Use of GMES across Europe’s
Regions. NEREUS publication, October
2012
[39.] Song, K., Li, L., Wang, Z., Liu, D., Zhang,
B., Xu, J., Du, J., Li, L., Li, S., Wang, Y.,
2012. Retrieval of total suspended matter
(TSM) and chlorophyll-a (Chl-a)
concentration from remote-sensing data for
drinking water resources. Environmental
monitoring and assessment 184, 1449–1470.
[40.] Tangen, H., 2012. Mapping the Artic Sea
Ice in Higher Resolution than Ever Before.
The Growing Use of GMES across Europe’s
Regions. NEREUS publication, October
2012
[41.] Verburg, P., Hecky, R. E., & Kling, H. J.
(2006). Climate warming decreased primary
productivity in Lake Tanganyika, inferred
from accumulation of dissolved silica and
increased transparency. Verh. Internat.
[42.] Wheeler, J. E. M., Tansey K. J.,Balzter H.,
Rodriguez Veiga, P., Waldram M. S., and
Lynch, J., 2012. Monitoring tropical
deforestation. The Growing Use of GMES
across Europe’s Regions. NEREUS
publication, October 2012
[43.] Wu, G., De Leeuw, J., Skidmore, A.K.,
Prins, H.H., Liu, Y., 2008. Comparison of
MODIS and Landsat TM5 images for
mapping tempo–spatial dynamics of Secchi
disk depths in Poyang Lake National Nature
Reserve, China. International Journal of
Remote Sensing 29, 2183–2198.
[44.] Yacobi, Y.Z., Gitelson, A., Mayo, M., 1995.
Remote sensing of chlorophyll in Lake
Kinneret using highspectral-resolution
radiometer and Landsat TM: spectral
features of reflectance and algorithm
development. Journal of Plankton Research
17, 2155–2173.
Appendix
Figure A1Landsat Imagery of Lake Naivasha. © USGS Copyright 2013

Benjamin Ghansah et al. Int. Journal of Engineering Research and Applications www.ijera.com
ISSN: 2248-9622, Vol. 6, Issue 1, (Part - 5) January 2016, pp.01-12
www.ijera.com 12|P a g e
Table A1 Suspended Matter Concentrations at five different locations in Lake Naivasha
DATE
HIPPO
POINT
(mg/l)
CRESENT
ISLAND
(mg/l)
LAKE
OLIODIEN
(mg/l)
22/11/1984 17 13 19
09/01/1985 21 21 26
24/08/1986 12 19 27
17/03/1989 17 15 24
21/01/1995 15 11 15
23/10/1999 36 33 38
01/27/2000 25 24 31
03/04/2001 27 23 35
01/02/2002 29 22 25
04/02/2003 25 15 18
13/05/2004 47 39 34
01/06/2005 32 25 31
27/01/2006 32 32 29
22/05/2007 26 31 23
06/04/2008 26 30 26
08/05/2009 29 22 22
28/09/2010 47 33 38
26/02/2011 29 25 33
12/01/2012 17 14 20
04/04/2013 28 27 41
DATE
NEAR
MALEWA
RIVER (mg/l)
MID-
LAKE
(mg/l)
22/11/1984 17 17
09/01/1985 22 21
24/08/1986 20 18
17/03/1989 19 15
21/01/1995 15 14
23/10/1999 39 34
01/27/2000 29 27
03/04/2001 33 24
01/02/2002 33 28
04/02/2003 27 23
13/05/2004 53 46
01/06/2005 39 33
27/01/2006 33 29
22/05/2007 33 24
06/04/2008 37 24
08/05/2009 33 24
28/09/2010 37 46
26/02/2011 38 32
12/01/2012 18 18
04/04/2013 32 29