Embed Size (px)
Citation preview

Using Research and Evidence-Based Services to Reduce the Age-Crime Curve
in North Carolina
Buddy HowellArea Consultants Retreat
Atlantic Beach Trinity CenterNov. 30, 2012
Buddy HowellComprehensive Strategy Group
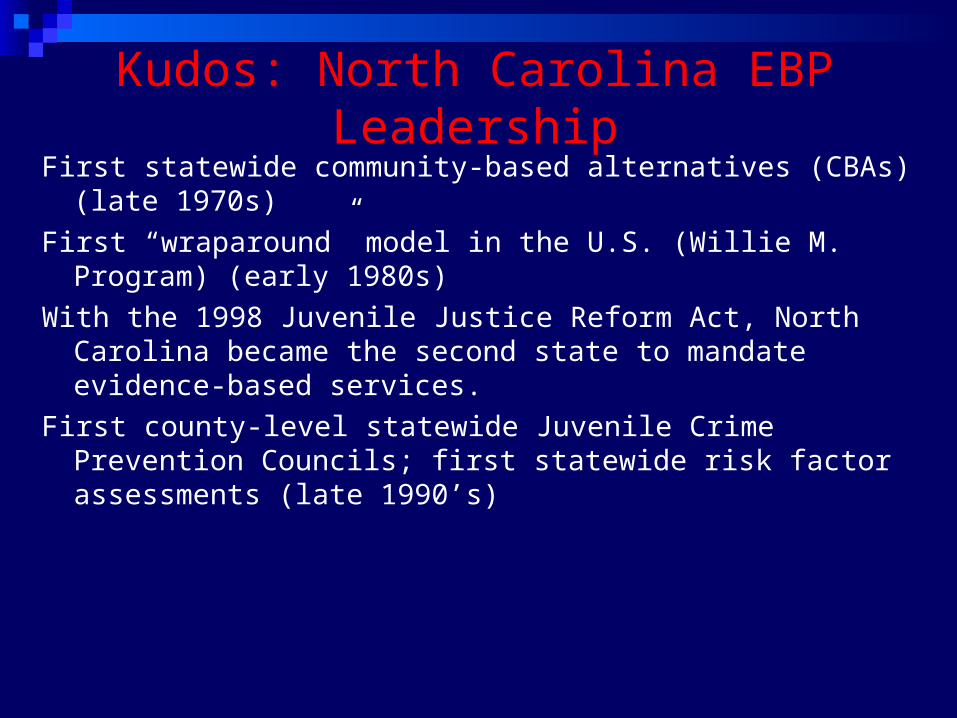
Kudos: North Carolina EBP LeadershipFirst statewide community-based alternatives (CBAs) (late
1970s)
First “wraparound” model in the U.S. (Willie M. Program) (early 1980s)
With the 1998 Juvenile Justice Reform Act, North Carolina became the second state to mandate evidence-based services.
First county-level statewide Juvenile Crime Prevention Councils; first statewide risk factor assessments (late 1990’s)
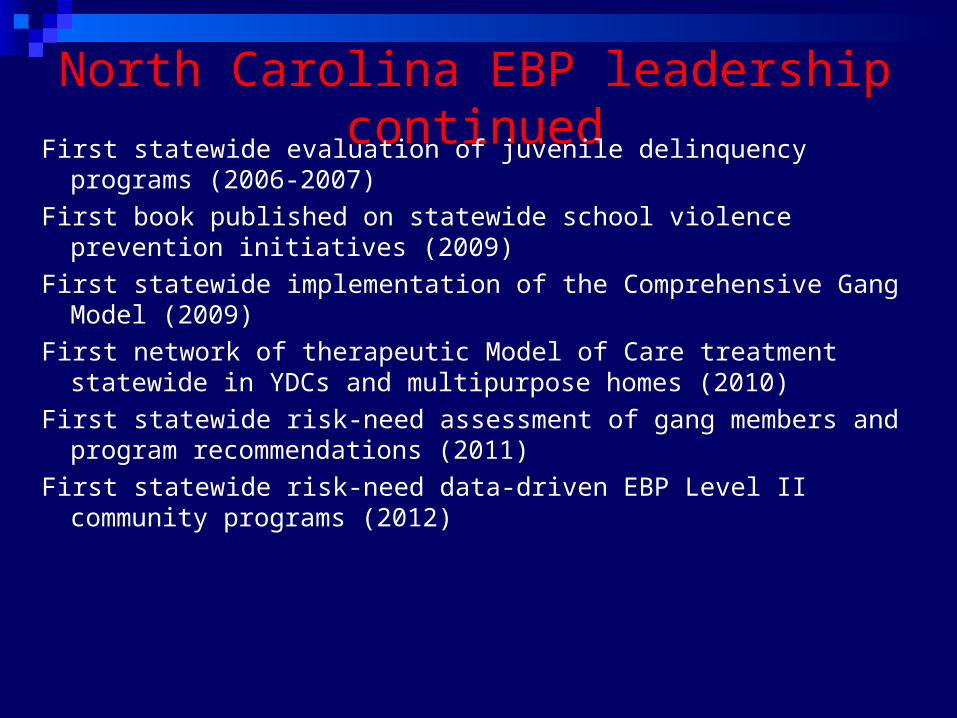
North Carolina EBP leadership continuedFirst statewide evaluation of juvenile delinquency programs (2006-2007)
First book published on statewide school violence prevention initiatives (2009)
First statewide implementation of the Comprehensive Gang Model (2009)
First network of therapeutic Model of Care treatment statewide in YDCs and multipurpose homes (2010)
First statewide risk-need assessment of gang members and program recommendations (2011)
First statewide risk-need data-driven EBP Level II community programs (2012)

More NC EBP Kudos
First state to fully adopt the OJJDP Comprehensive Strategy for Serious, Violent, and Chronic Juvenile Offenders
Most effective statewide use of risk and need assessments of juvenile offenders in conjunction with a disposition matrix to reduce confinement (early 2000s)
The 1998 Juvenile Justice Reform Act required a statewide evaluation of programs funded through the Juvenile Crime Prevention Councils
The Standardized Program Evaluation Protocol (SPEP) was developed specifically for this purpose. It was rolled out in 2006.

Six other states have followed North Carolina’s lead
Arizona Florida Connecticut Pennsylvania Delaware Iowa Milwaukee (not a state; but it’s almost as
large as Delaware!)

Present goal: Reduce the age-crime curve in NC
Source: Loeber & Farrington, 2012

AUTHORITY CONFLICT PATHWAY(before age 12)
OVERT PATHWAY COVERT PATHWAY(before age 15)
AGE OF ONSET:LATE
EARLY
%BOYS/GIRLS:FEW
MANYStubborn Behavior
Defiance/Disobedience
AUTHORITYAVOIDANCE
(truancy, running away,
staying out late)
MINOR AGGRESSION (bullying, annoying others)
PHYSICAL FIGHTING(physical fighting,gang fighting)
VIOLENCE(rape, attack,strong-arm, homicide)
MINOR COVERT BEHAVIOR (shoplifting, frequent lying)
PROPERTY DAMAGE(vandalism, fire-setting)
MODERATELYSERIOUSDELINQUENCY(fraud, pick-pocketing)
SERIOUS DELINQUENCY (auto theft, burglary)
Developmental pathways to serious and violent behavior
© Loeber: Pittsburgh Youth Study
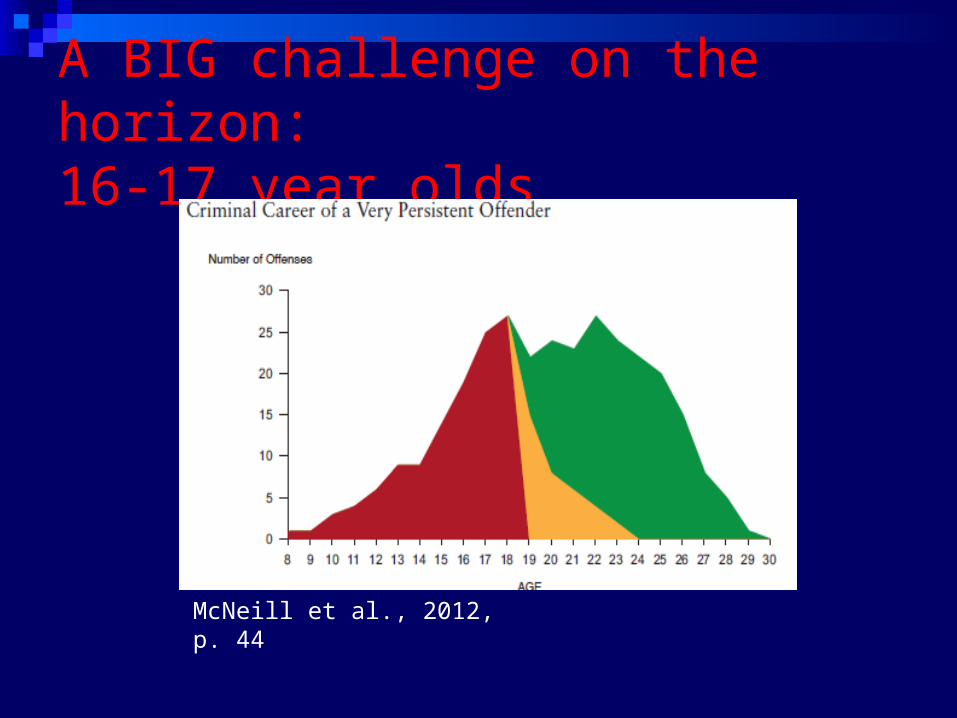
A BIG challenge on the horizon:16-17 year olds
McNeill et al., 2012, p. 44
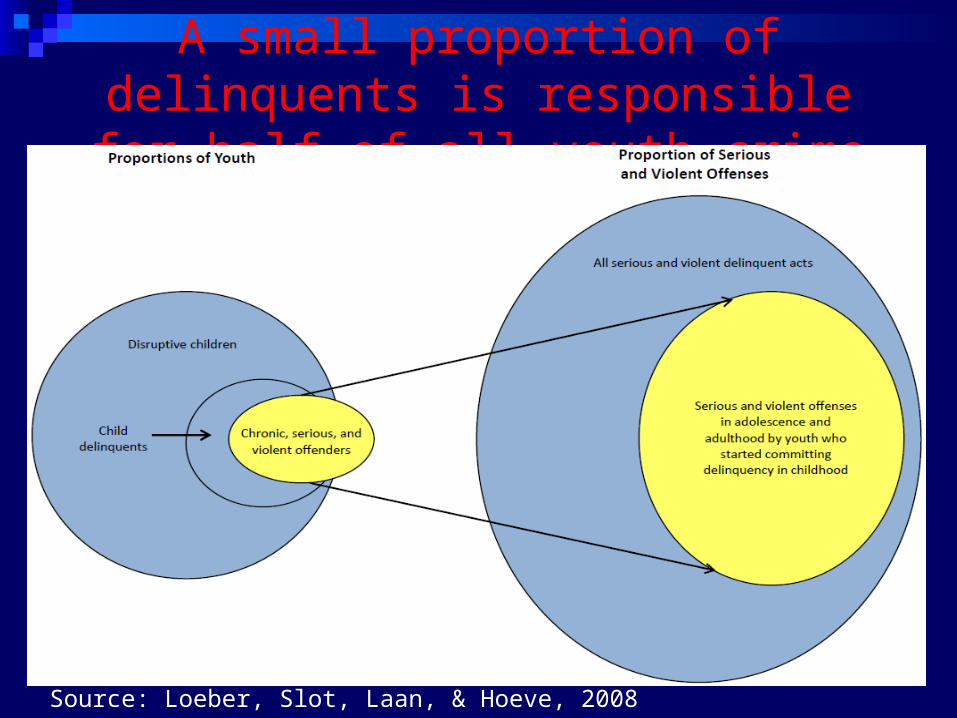
A small proportion of delinquents is responsible for half of all youth crime
Source: Loeber, Slot, Laan, & Hoeve, 2008
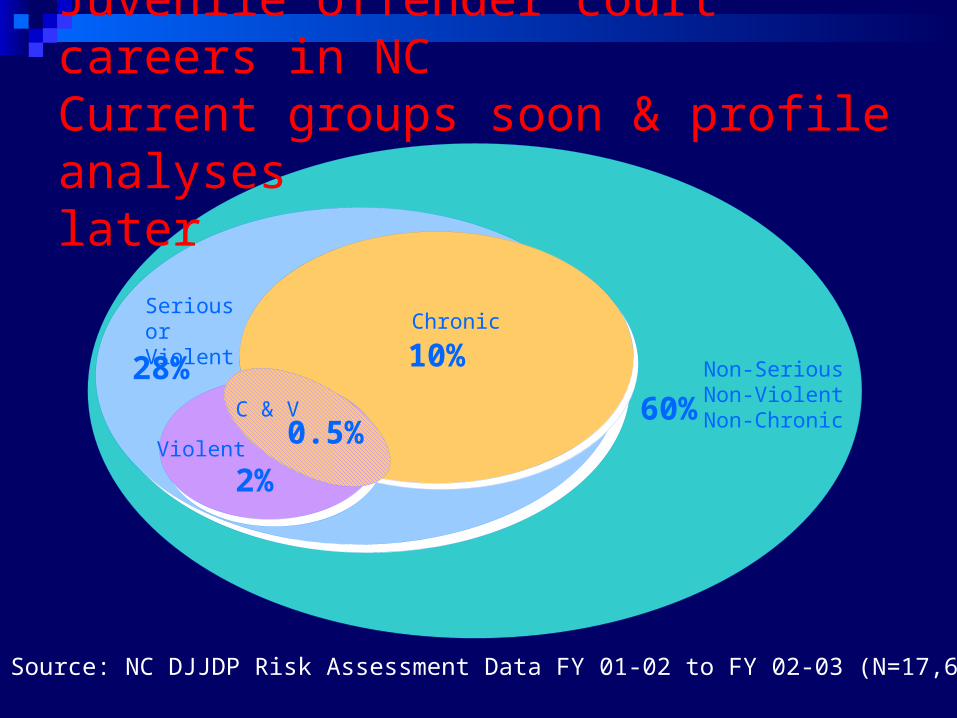
Non-Serious Non-ViolentNon-Chronic60%
Serious or Violent
28%
Chronic
10%
Violent
2%
C & V0.5%
Source: NC DJJDP Risk Assessment Data FY 01-02 to FY 02-03 (N=17,645)
Juvenile offender court careers in NCCurrent groups soon & profile analyseslater
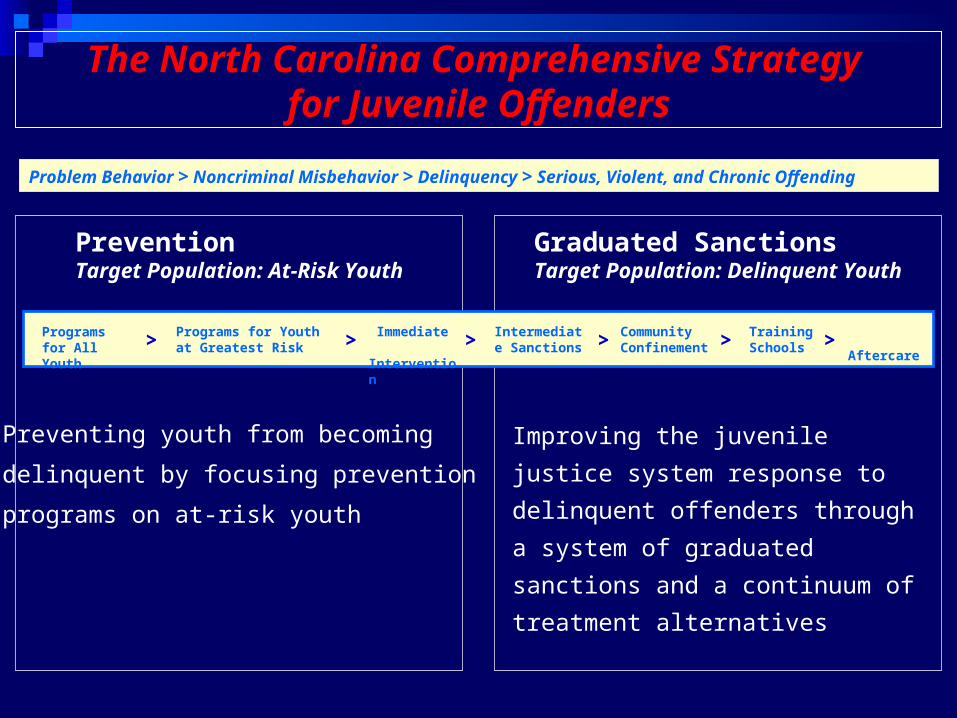
The North Carolina Comprehensive Strategy for Juvenile Offenders
Problem Behavior > Noncriminal Misbehavior > Delinquency > Serious, Violent, and Chronic Offending
PreventionTarget Population: At-Risk Youth
Preventing youth from becoming
delinquent by focusing prevention
programs on at-risk youth
Graduated SanctionsTarget Population: Delinquent Youth
Improving the juvenile justice
system response to delinquent
offenders through a system of
graduated sanctions and a
continuum of treatment
alternatives
> > > > > >Programs for All Youth
Programs for Youth at Greatest Risk
Immediate Intervention
Intermediate Sanctions
Community Confinement
Training Schools
Aftercare
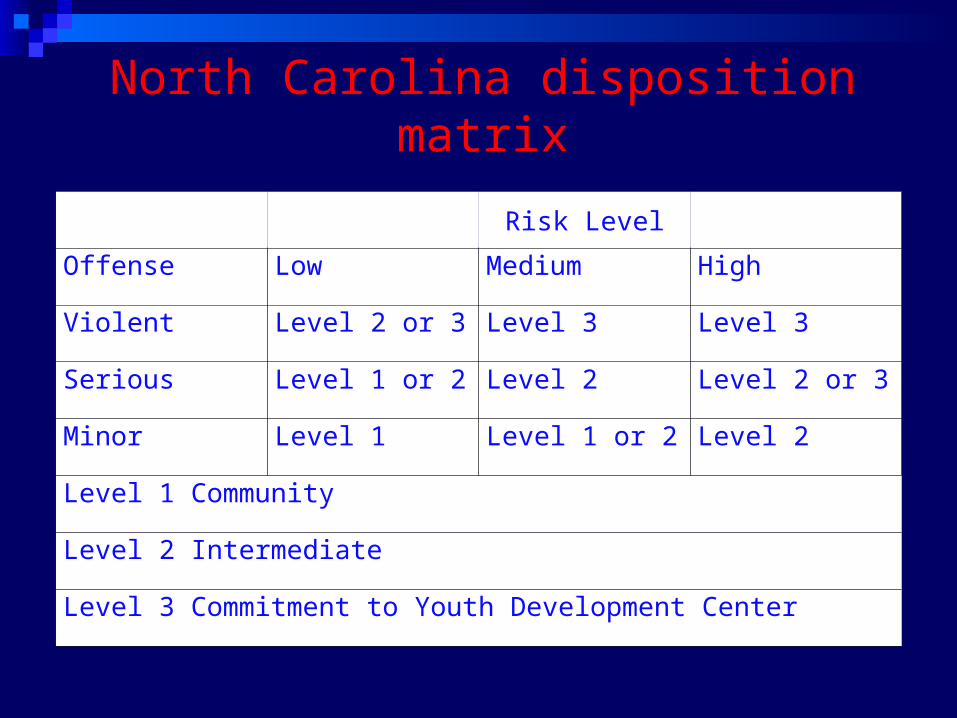
North Carolina disposition matrix
Risk Level
Offense Low Medium High
Violent Level 2 or 3 Level 3 Level 3
Serious Level 1 or 2 Level 2 Level 2 or 3
Minor Level 1 Level 1 or 2 Level 2
Level 1 Community
Level 2 Intermediate
Level 3 Commitment to Youth Development Center
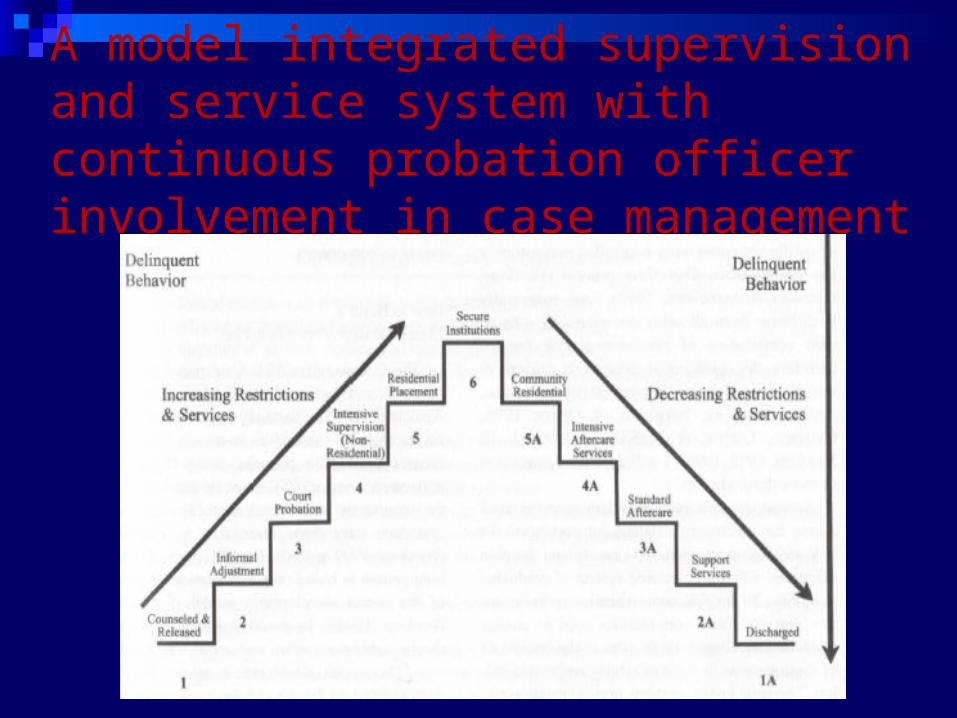
A model integrated supervision and service system with continuous probation officer involvement in case management
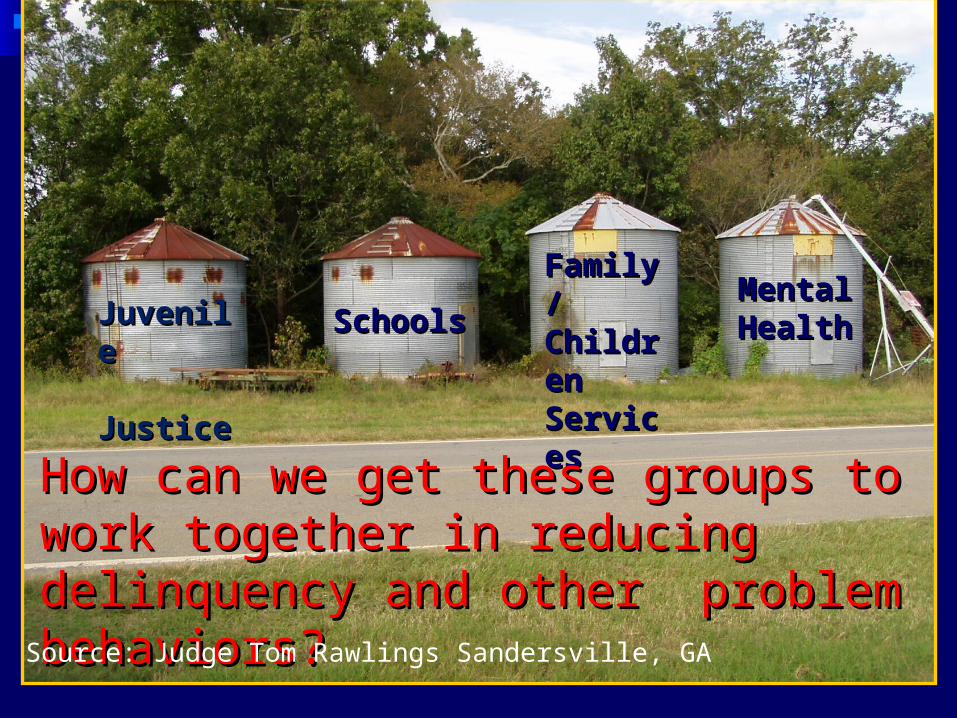
JuvenileJuvenile JusticeJustice
SchoolsSchools
Family/Family/ChildrenChildrenServicesServices
MentalMentalHealthHealth
How can we get these groups to work How can we get these groups to work together in reducing delinquency and together in reducing delinquency and other problem behaviors?other problem behaviors?
Source: Judge Tom Rawlings Sandersville, GA
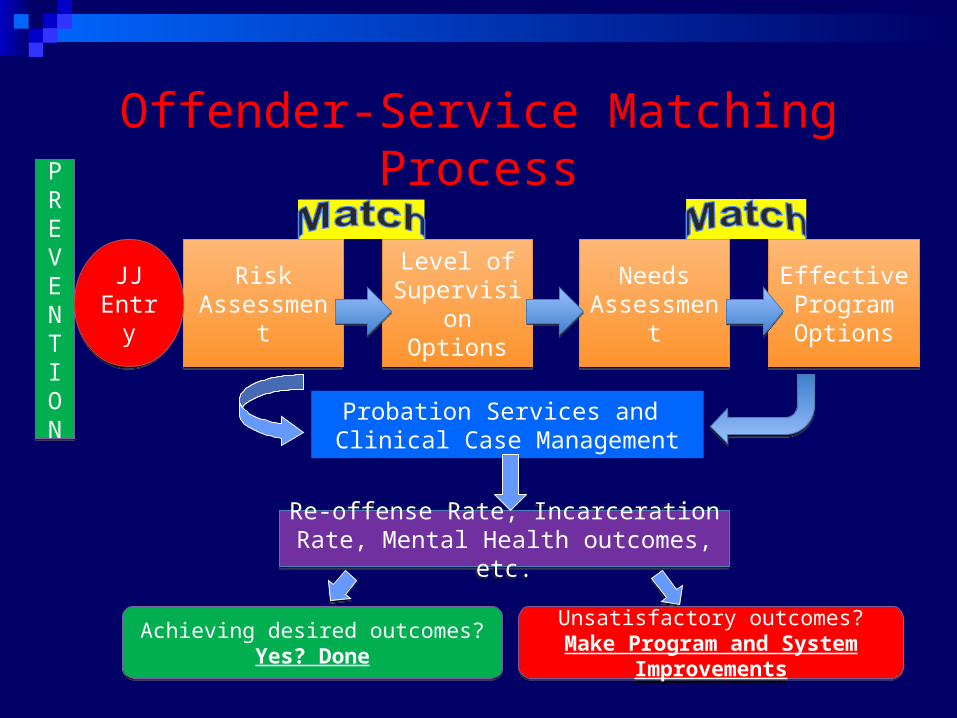
Risk Assessment
Risk Assessment
Level of Supervision
Options
Level of Supervision
Options
Needs Assessment
Needs Assessment
Effective Program Options
Effective Program Options
Re-offense Rate, Incarceration Rate, Mental Health outcomes, etc.
Re-offense Rate, Incarceration Rate, Mental Health outcomes, etc.
PREVENTION
PREVENTION
JJ Entry
JJ Entry
Achieving desired outcomes?Yes? Done
Achieving desired outcomes?Yes? Done
Unsatisfactory outcomes?Make Program and System
Improvements
Unsatisfactory outcomes?Make Program and System
Improvements
Offender-Service Matching Process
Probation Services and Clinical Case Management
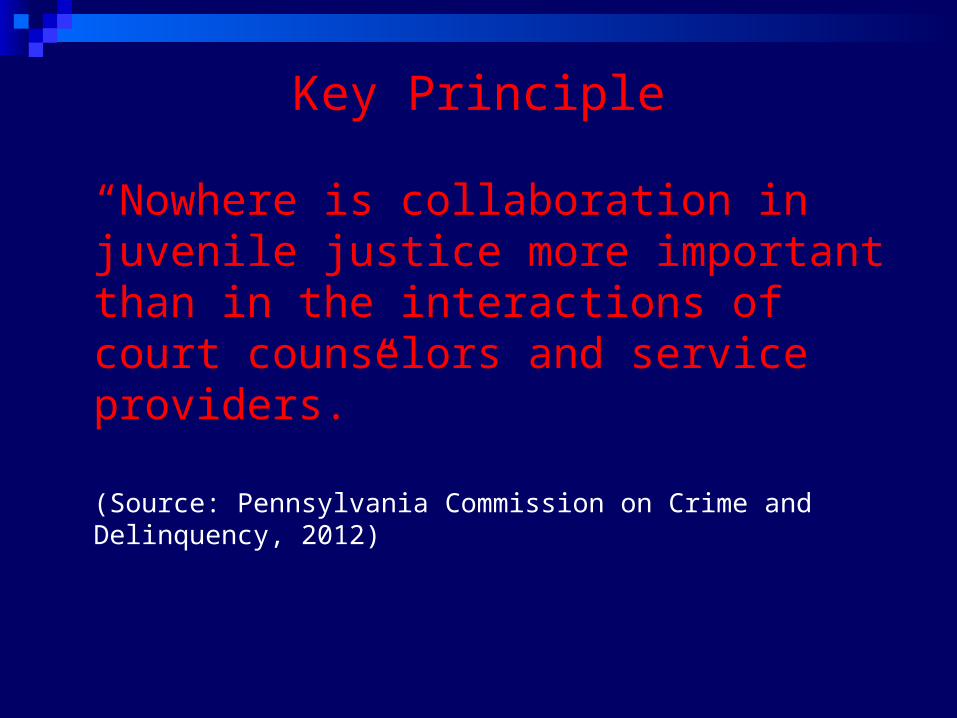
Key Principle
“Nowhere is collaboration in juvenile justice more important than in the interactions of court counselors and service providers.”
(Source: Pennsylvania Commission on Crime and Delinquency, 2012)
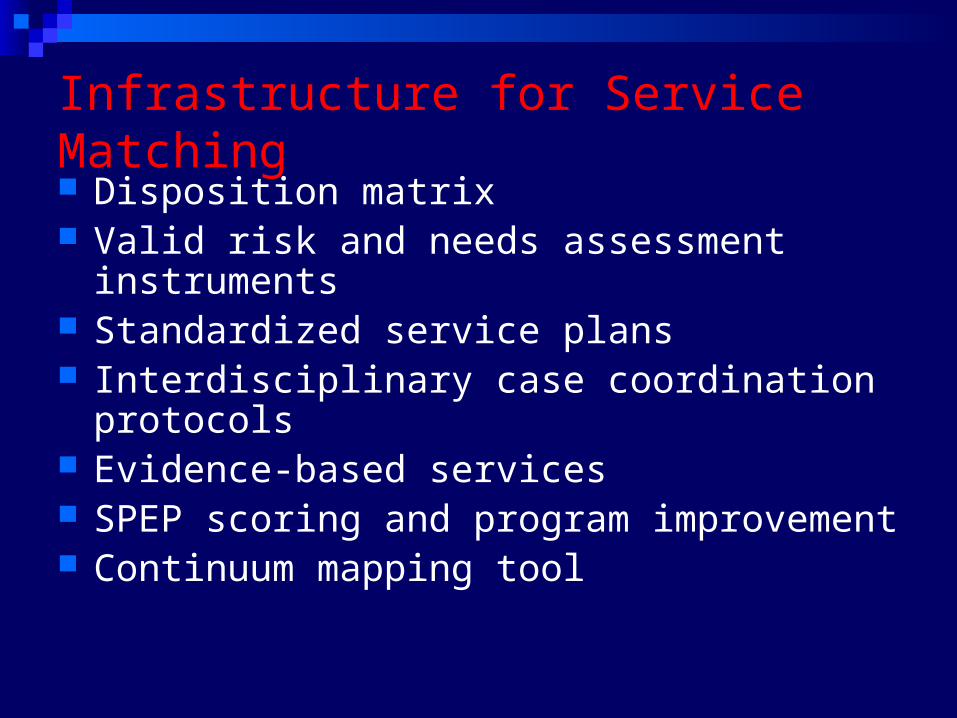
Infrastructure for Service Matching Disposition matrix Valid risk and needs assessment instruments Standardized service plans Interdisciplinary case coordination protocols Evidence-based services SPEP scoring and program improvement Continuum mapping tool
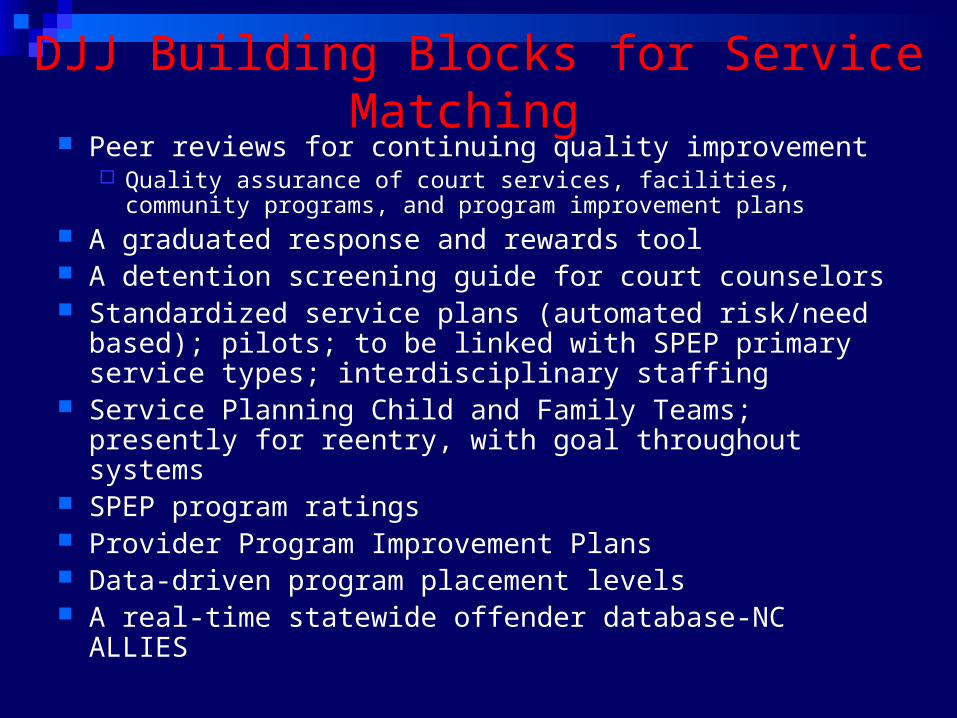
DJJ Building Blocks for Service Matching Peer reviews for continuing quality improvement
Quality assurance of court services, facilities, community programs, and program improvement plans
A graduated response and rewards tool A detention screening guide for court counselors Standardized service plans (automated risk/need
based); pilots; to be linked with SPEP primary service types; interdisciplinary staffing
Service Planning Child and Family Teams; presently for reentry, with goal throughout systems
SPEP program ratings Provider Program Improvement Plans Data-driven program placement levels A real-time statewide offender database-NC ALLIES

Mapping the Existing ContinuumJCPC Planning Tool
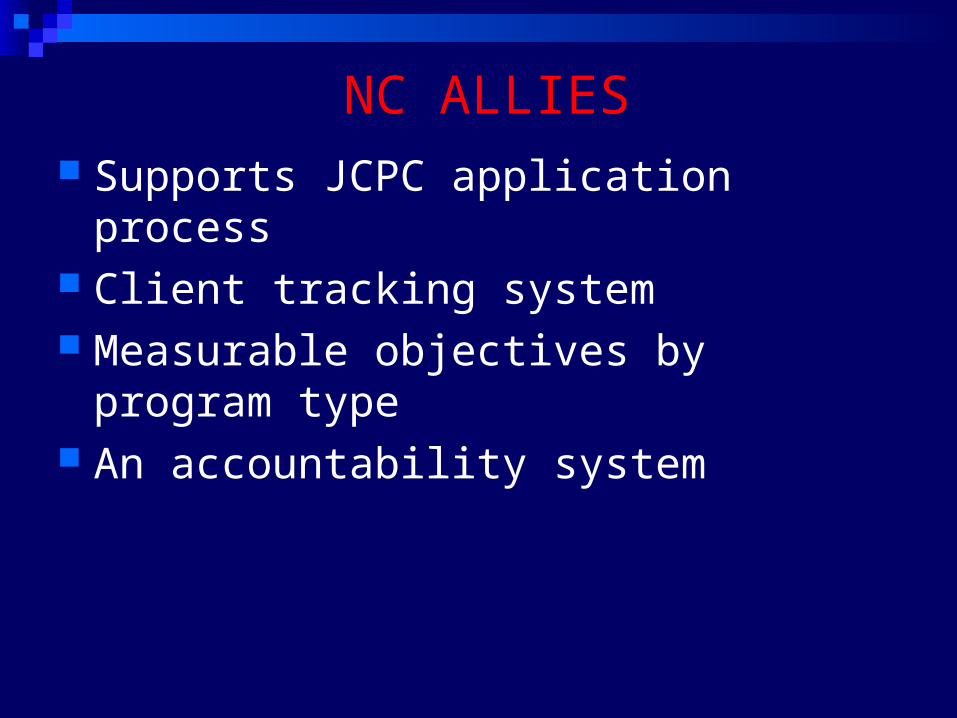
NC ALLIES Supports JCPC application process Client tracking system Measurable objectives by program type An accountability system
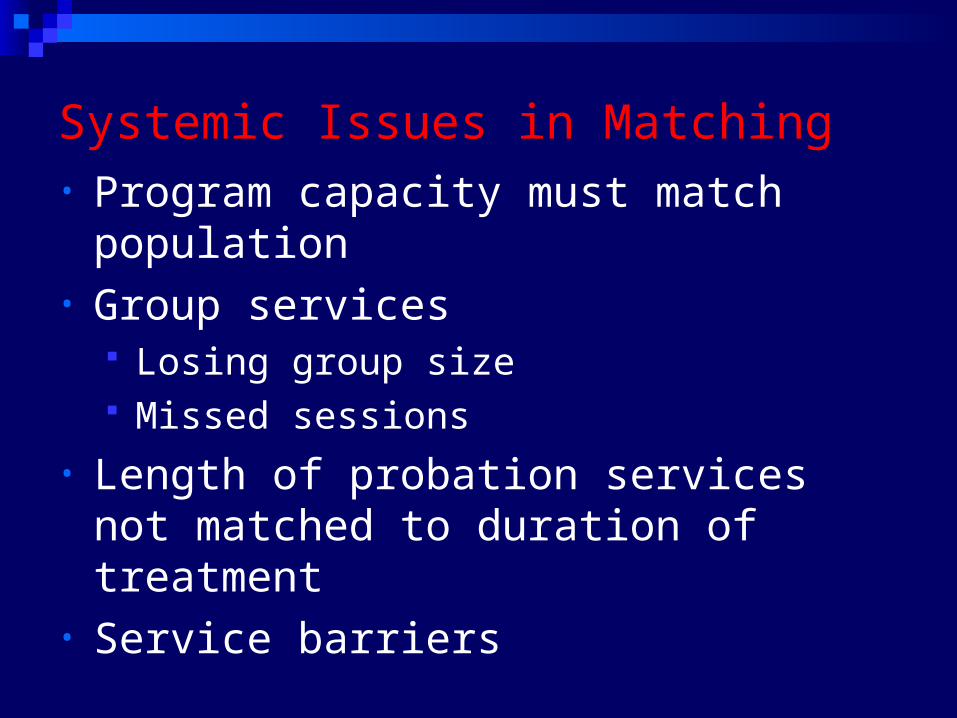
Systemic Issues in Matching • Program capacity must match population• Group services
Losing group size Missed sessions
• Length of probation services not matched to duration of treatment
• Service barriers
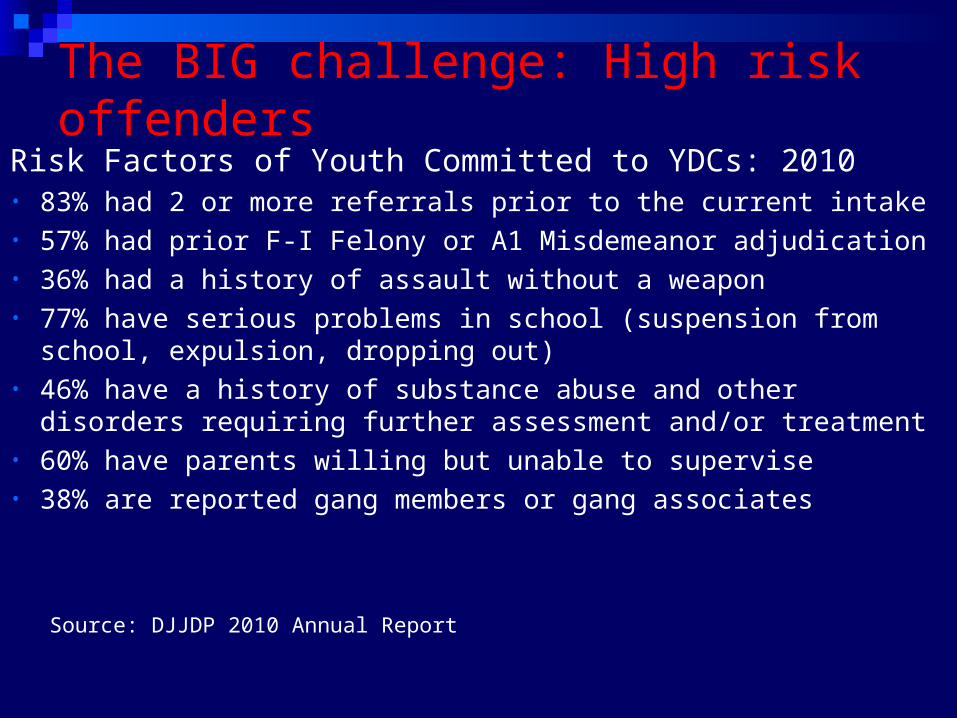
The BIG challenge: High risk offenders
Risk Factors of Youth Committed to YDCs: 2010• 83% had 2 or more referrals prior to the current intake• 57% had prior F-I Felony or A1 Misdemeanor adjudication• 36% had a history of assault without a weapon• 77% have serious problems in school (suspension from school,
expulsion, dropping out)• 46% have a history of substance abuse and other disorders
requiring further assessment and/or treatment• 60% have parents willing but unable to supervise• 38% are reported gang members or gang associates
Source: DJJDP 2010 Annual Report
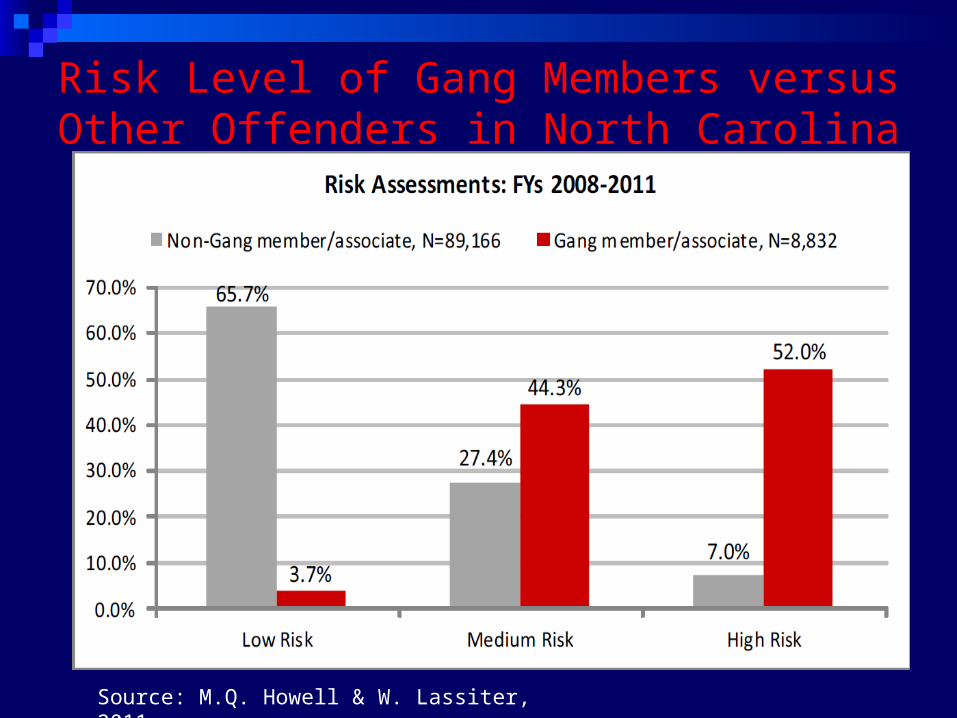
Risk Level of Gang Members versus Other Offenders in North Carolina
Source: M.Q. Howell & W. Lassiter, 2011

Important data on gang members in NC The deeper into the juvenile justice system youth had
penetrated, the more likely they were to be gang-involved (FY 2008-2011): 7% of all juveniles on whom delinquent complaints are filed, 13% of juveniles adjudicated delinquent, 21% of juveniles admitted to short-term detention, and 38% of juveniles committed to secure residential facilities
The most elevated needs of North Carolina gang members identified system-wide (FY 2008-2011): Parents have marginal or inadequate parenting skills (88%) Marital discord or domestic violence in the home (39%) Needs additional mental health assessment or treatment (53%) Youth is generally functioning below grade level or has un-served “Exceptional
Children's” needs (25%)
Source: M.Q. Howell & W. Lassiter, 2011
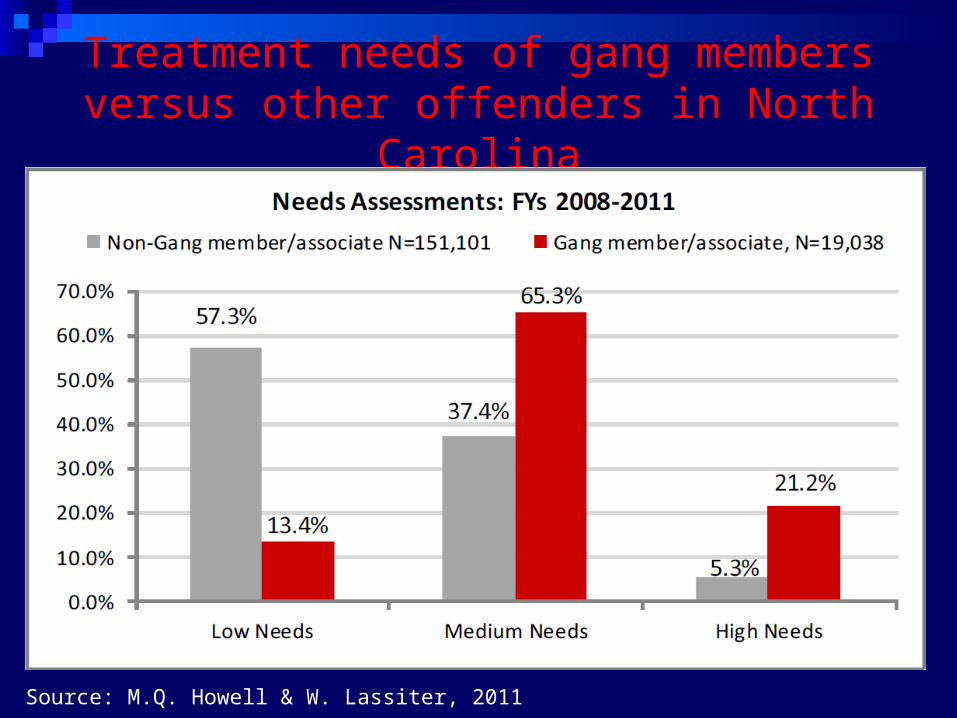
Treatment needs of gang members versus other offenders in North Carolina
Source: M.Q. Howell & W. Lassiter, 2011
Protocol for matching youth with services
Two levels of assessment: Initial screen (current or immediate emotional,
psychological, and behavioral functioning) In-depth, professional clinical assessments of
specific problem behaviorsSubstance Abuse Mental Health Sex OffendingEducation assessment

Next Steps Toward Reducing the Age-Crime Curve in North Carolina
Implement the recalibrated SPEP Update program classifications Make an adjustment in NC ALLIES to collect SPEP-
required data elements Integrate DJJs new quality of services measures
Develop a program improvement protocol Update serious, violent, chronic offender
analysis System-wide measurement of recidivism reductions

Emerging Research
Now mapping risk factors across the life course into early adulthood Key finding: Programs are likely to be more effective if
they do not restrict their focus to one risk domain or one risk factor within a domain
Desistance Research Key predictors: good supervision, low parental stress,
high academic achievement, and high perceived likelihood of getting caught.
Risk factors that hinder desistance: high alcohol use, active drug dealing, gang membership, gun carrying, depressed mood, high anxiety, high violence victimization, and high peer delinquency.
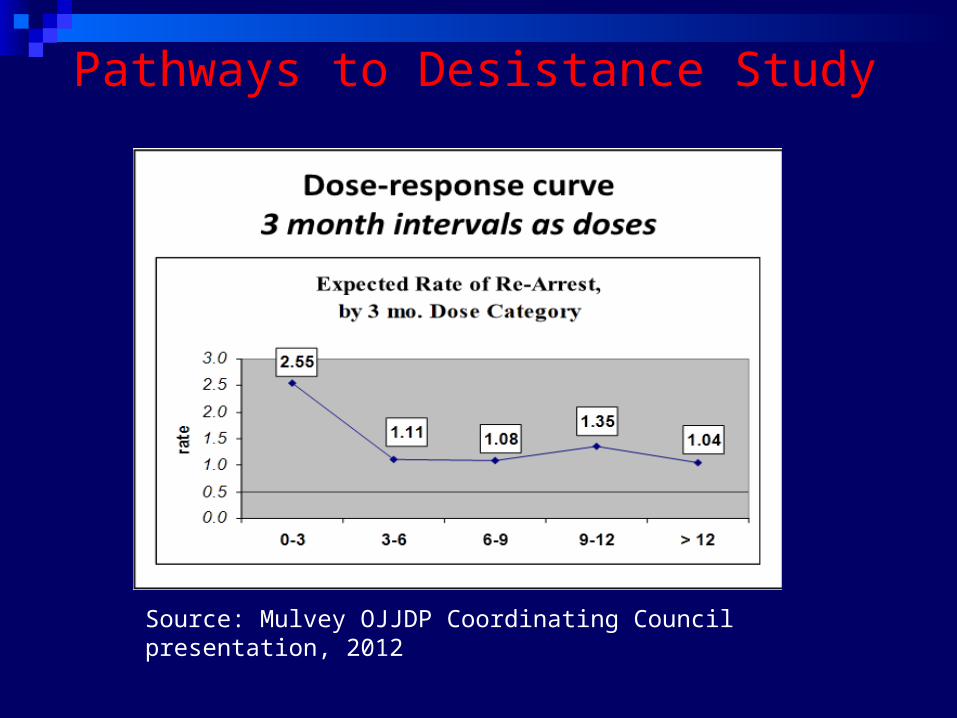
Pathways to Desistance Study
Source: Mulvey OJJDP Coordinating Council presentation, 2012
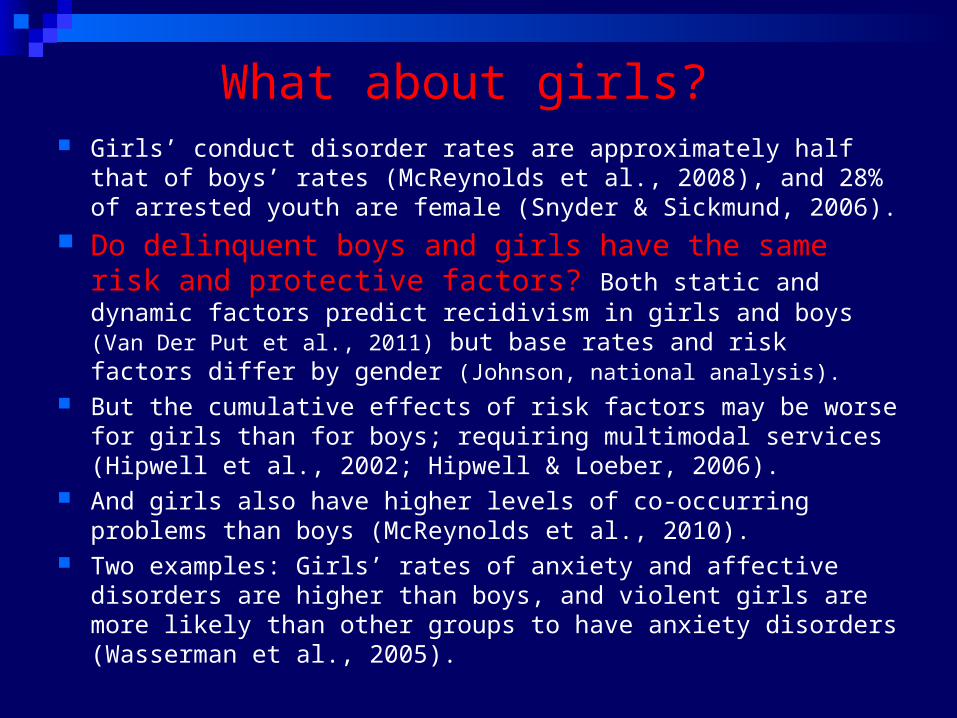
What about girls? Girls’ conduct disorder rates are approximately half that of boys’
rates (McReynolds et al., 2008), and 28% of arrested youth are female (Snyder & Sickmund, 2006).
Do delinquent boys and girls have the same risk and protective factors? Both static and dynamic factors predict recidivism in girls and boys (Van Der Put et al., 2011) but base rates and risk factors differ by gender (Johnson, national analysis).
But the cumulative effects of risk factors may be worse for girls than for boys; requiring multimodal services (Hipwell et al., 2002; Hipwell & Loeber, 2006).
And girls also have higher levels of co-occurring problems than boys (McReynolds et al., 2010).
Two examples: Girls’ rates of anxiety and affective disorders are higher than boys, and violent girls are more likely than other groups to have anxiety disorders (Wasserman et al., 2005).
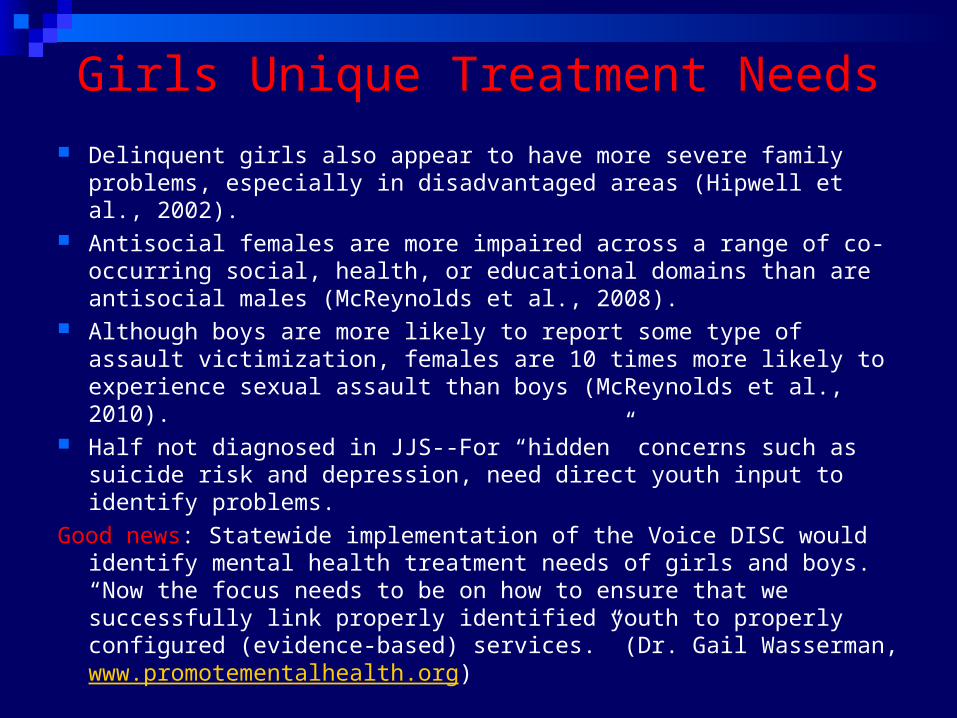
Girls Unique Treatment Needs
Delinquent girls also appear to have more severe family problems, especially in disadvantaged areas (Hipwell et al., 2002).
Antisocial females are more impaired across a range of co-occurring social, health, or educational domains than are antisocial males (McReynolds et al., 2008).
Although boys are more likely to report some type of assault victimization, females are 10 times more likely to experience sexual assault than boys (McReynolds et al., 2010).
Half not diagnosed in JJS--For “hidden” concerns such as suicide risk and depression, need direct youth input to identify problems.
Good news: Statewide implementation of the Voice DISC would identify mental health treatment needs of girls and boys. “Now the focus needs to be on how to ensure that we successfully link properly identified youth to properly configured (evidence-based) services.” (Dr. Gail Wasserman, www.promotementalhealth.org)
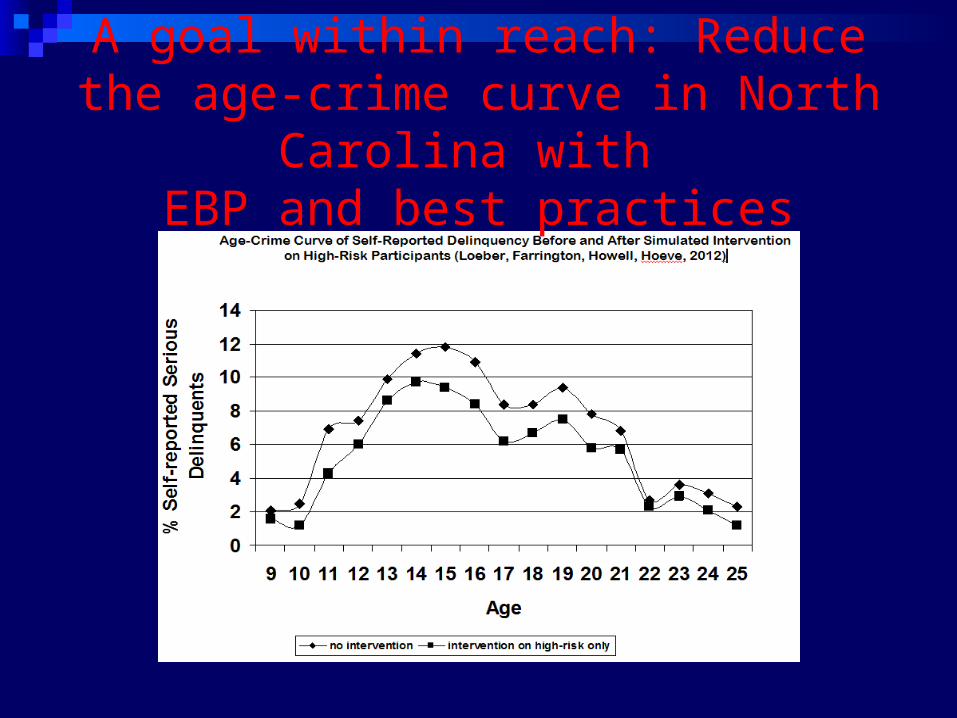
A goal within reach: Reduce the age-crime curve in North Carolina with
EBP and best practices
How will we know what services worked best to reduce the age-crime curve?
Performance measures SPEP program ratings An associated recidivism analysis Statewide recidivism analysis using a
systems approach (next slide)

Arrest
Counsel & release
Diversion;Informal probation
Probation
Incarceration
Level of Supervision
InterventionPrograms
RecidivismOutcomes
Program A
Program B
Program C
Program D
Program E
Program F
U%
V%
W%
X%
Y%
Z%
TotalTotalReoffenseReoffense
RateRate
Pre
ven
tio
n P
rog
ram
s
T%

Thank you!
Questions? Comments?
Contact Information:
Buddy Howell
Managing Partner
Comprehensive Strategy Group, LLC
Ph: 910-235-3708
E-mail: [email protected]