Embed Size (px)
Citation preview

UTENOS TRIKOTAŽAS, AB
CONSOLIDATED AND COMPANY'S INTERIM FINANCIAL STATEMENTS for the 3 months period ended 31 March 2016
(UNAUDITED)

Interim Consolidated Information for the 3 months of 2016 (All amounts are in EUR thousand, unless otherwise stated)
2
Statements of financial position
Group Company
2016.03.31 2015.12.31 2016.03.31 2015.12.31
ASSETS
Non-current assets
Intangible assets 7 711 752 26 29
Property, plant and equipment 8 7 267 7 460 5 608 5 659
Investment property 111 111 111 111
Investments into subsidiaries - - 1 499 1 499
Receivables from subsidiaries - - 2 265 2 356
Deferred income tax asset 49 51 - -
8 138 8 374 9 509 9 654
Current assets
Inventories 9 3 907 3 687 3 720 3 592
Trade receivables 10 1 238 1 109 832 827
Other receivables 214 305 146 129
Cash and cash equivalents 11 1 393 1 079 603 265
6 752 6 180 5 301 4 813
Total assets 14 890 14 554 14 810 14 467
EQUITY AND LIABILITIES
Equity attributable to the shareholders of the Company
Share capital 2 756 2 756 2 756 2 756
Revaluation surplus 12 3 223 3 241 1 783 1 793
Legal reserve 12 574 574 574 574
Reserve for acquisition of own shares 12 269 269 - -
Foreign currency translation reserve 12 120 113 - -
Cash flow hedge reserve 12 (42) (42) (42) (42)
Accumulated retained earnings/ (losses) 12 (974) (938) (112) (70)
5 926 5 973 4 959 5 011
Non-controlling interest 434 427 - -
Total equity 6 360 6 400 4 959 5 011
LIABILITIES
Non-current liabilities
Borrowings 13 3 631 3 617 3 631 3 617
Borrowings from subsidiaries 13 - - 1 922 1 922
Deferred income tax liabilities 329 351 191 193
Non-current portion of derivative financial instruments 28 28 28 28
Provisions for employee benefits 226 226 205 205
4 214 4 222 5 977 5 965
Current liabilities
Current portion of non-current borrowings 13 708 691 708 691
Current portion of derivative financial instruments 23 23 23 23
Trade payables 1 151 1 051 1 114 1 008
Payables to other related parties and subsidiaries 565 518 668 524
Income tax payable 7 10 4 4
Accrued expenses and other current liabilities 14 1 862 1 639 1 357 1 241
4 316 3 932 3 874 3 491
Total liabilities 8 530 8 154 9 851 9 456
Total equity and liabilities 14 890 14 554 14 810 14 467

Interim Consolidated Information for the 3 months of 2016 (All amounts are in EUR thousand, unless otherwise stated)
3
Statements of comprehensive income
Notes
Group Company
January-March January-March
2016 2015 2016 2015
Sales 6,15 4 963 4 340 4 187 3 607
Cost of sales 16 (4 018) (3 718) (3 510) (3 150)
Gross profit 945 622 677 457
Selling expenses 17 (416) (342) (394) (316)
General and administrative expenses 17 (471) (430) (329) (302)
Other operating income 18 44 107 19 18
Other operating expenses 18 (8) (7) (4) (3)
Operating profit (losses) 94 (50) (31) (146)
Finance income 19 15 125 19 59
Finance costs 19 (159) (561) (42) (88)
Profit (losses) before tax (50) (486) (54) (175)
Income tax 2 6 2 5
Net profit (losses) (48) (480) (52) (170)
Net profit (losses) attributable to:
Equity shareholders of the Company 20 (54) (464) - -
Non-controlling interest 6 (16) - -
(48) (480) - -
Other comprehensive income (loss)
Foreign currency translation gain (loss) 8 117 - -
Other comprehensive income (loss) 8 117 - -
Total comprehensive income (loss) for the period (40) (363) - -
Basic/dilutive earnings per share 20 (0,006) (0,049) (0,005) (0,018)

Interim Consolidated Information for the 3 months of 2016 (All amounts are in EUR thousand, unless otherwise stated)
4
Statements of changes in equity
Group
Share
capital
Foreign
currency
translation
reserve
Reserve for
acquisition of
own shares
Other
reserve
Legal
reserve
Revaluation
surplus
Accumulated
retained
earnings/
(losses) Total
Non-
controlling
interest
Total
equity
Balance as of 31 March 2015 2 756 293 - - 574 3 282 (1 112) 5 893 417 6 210
Net profit (loss) - - - - - - 196 196 23 219
Other comprehensive income - (180) - (42) - - 222 - 1 1
Total comprehensive income (loss) - (180) - (42) - - 418 196 24 220
Transfer of revalution surplus to retained earnings - - - - - (41) 25 (16) (14) (30)
Reserve for acquisition of own shares - - 269 - - - (269) - - -
Balance as of 31 December 2015 2 756 113 269 (42) 574 3 241 (938) 5 973 427 6 400
Net profit (loss) - - - - - - (54) (54) 6 (48)
Other comprehensive income - 7 - - - - - 7 1 8
Total comprehensive income (loss) - 7 - - - - (54) (47) 7 (40)
Transfer of revalution surplus to retained earnings - - - - - (18) 18 - - -
Balance as of 31 March 2016 2 756 120 269 (42) 574 3 223 (974) 5 926 434 6 360
Company Share capital
Legal reserve
Revaluation surplus
Other reserve
Accumulated retained
earnings/ (losses) Total
Balance as of 31 March 2015 2 756 574 1 824 - (215) 4 939
Net profit (loss) - - - - 12 12
Other comprehensive income (loss) - - - (42) 102 60
Transfer of revalution surplus to retained earnings - - (31) - 31 -
Balance as of 31 December 2015 2 756 574 1 793 (42) (70) 5 011
Net profit (loss) - - - - (52) (52)
Other comprehensive income (loss) - - - - - -
Transfer of revalution surplus to retained earnings - - (10) - 10 -
Balance as of 31 March 2016 2 756 574 1 783 (42) (112) 4 959

Interim Consolidated Information for the 3 months of 2016 (All amounts are in EUR thousand, unless otherwise stated)
5
Statements of cash flows
Group Company
31 March 31 March
2016 2015 2016 2015
Cash flows from operating activities
Profit (loss) for the period (48) (480) (52) (170)
Adjustments for non-cash items:
Depreciation and amortization 195 224 147 176
(Gain) on disposal of property, plant and equipment and investment
property (4) (74) - (8)
Interest expense, net of interest income 28 24 22 19
Income tax (income) expense (2) 6 (2) 5
Changes in working capital:
(Increase) decrease in inventories (220) 172 (128) 179
Decrease (increase) in trade receivables (129) 166 (5) 272
Decrease (increase) in receivables from subsidiaries - - 90 156
(Increase) decrease in other receivables and other current assets 93 48 (17) 35
(Increase) decrease in trade and other accounts payable 406 509 353 (49)
Increase (decrease) in taxes payable and other current liabilities 91 (39) 24 (5)
Income tax (paid) (8) - (8) -
Net cash generated from operating activities 402 556 424 610
Cash flows from investing activities
Acquisition of property, plant and equipment (94) (61) (94) (16)
Proceeds from sale of property, plant and equipment 4 138 - 8
Interest received - - 15 15
Net cash flows generated from (to) investing activities (90) 77 (79) 7
Cash flows from financing activities
Proceeds from borrowings 200 3 044 200 3 044
Repayment of borrowings and financial lease payments (170) (3 044) (170) (3 044)
Interest paid (28) (24) (37) (34)
Net cash flows from financing activities 2 (24) (7) (34)
Net increase in cash and cash equivalents 314 609 338 583
Cash and cash equivalents at the beginning of the period 1 079 955 265 218
Cash and cash equivalents at the end of the period
1 393 1 564
603 801

Interim Consolidated Information for the 3 months of 2016 (All amounts are in EUR thousand, unless otherwise stated)
6
Notes to the financial statements
1. General information
Utenos Trikotažas AB (hereinafter „the Company“) is a joint-stock company registered in the Republic of Lithuania on 6 December 1994. The address of its registered office is as follows:
Basanavičiaus str. 122, Utena, Lithuania
The Company is engaged in production of knit-wear and textile articles. The shares of Utenos Trikotažas AB are listed on the Official List of the NASDAQ OMX Vilnius Stock Exchange. As of 31 March 2016 and 31 December 2015 the shareholders of the Company were as follows:
As of 31 March 2016
As of 31 December 2015
Number of shares held
Interest held (%)
Number of shares held
Interest held (%)
UAB Koncernas SBA 5 874 61.81 5 874 61.81
Investment Fund “Amber Trust” 1 347 14.18 1 347 14.18
Investment Fund “East Capital Asset” 527 5.55 527 5.55
Investment Fund ,”KJK Fund“ 572 6.02 572 6.02
Other shareholders 1 183 12,44 1 183 12,44
9 503 100.00 9 503 100.00
All the shares are registered ordinary shares with a par value of EUR 0.29 each. As of 31 March 2016 and 31 December 2015 subsidiaries did not hold any shares of the Company. The Company did not hold its own shares within this period. The consolidated group (hereinafter “the Group” ) consists of the Company and the following subsidiaries:
Registered address
Group's share (%)
31 March 2016
31 December
2015 Profile
Šatrija AB
Vilniaus str. 5, Raseiniai
89,78
89,78
Sewing of clothes
Gotija UAB
Laisvės Str. 33, Kaunas
90,50
90,50
Retail trade
PAT MTF Mrija
Motroso Str. 13, Mukachov, Ukraine
98,95
98,95
Production of knitted articles
On 31 of March 2016 the average number of employees of the Group was 1 122, while on 31 of March 2015 it was 1 183 (on 31 of December 2015- 1 148).
Interim Consolidated Information for the 3 months of 2016 (All amounts are in EUR thousand, unless otherwise stated)
7
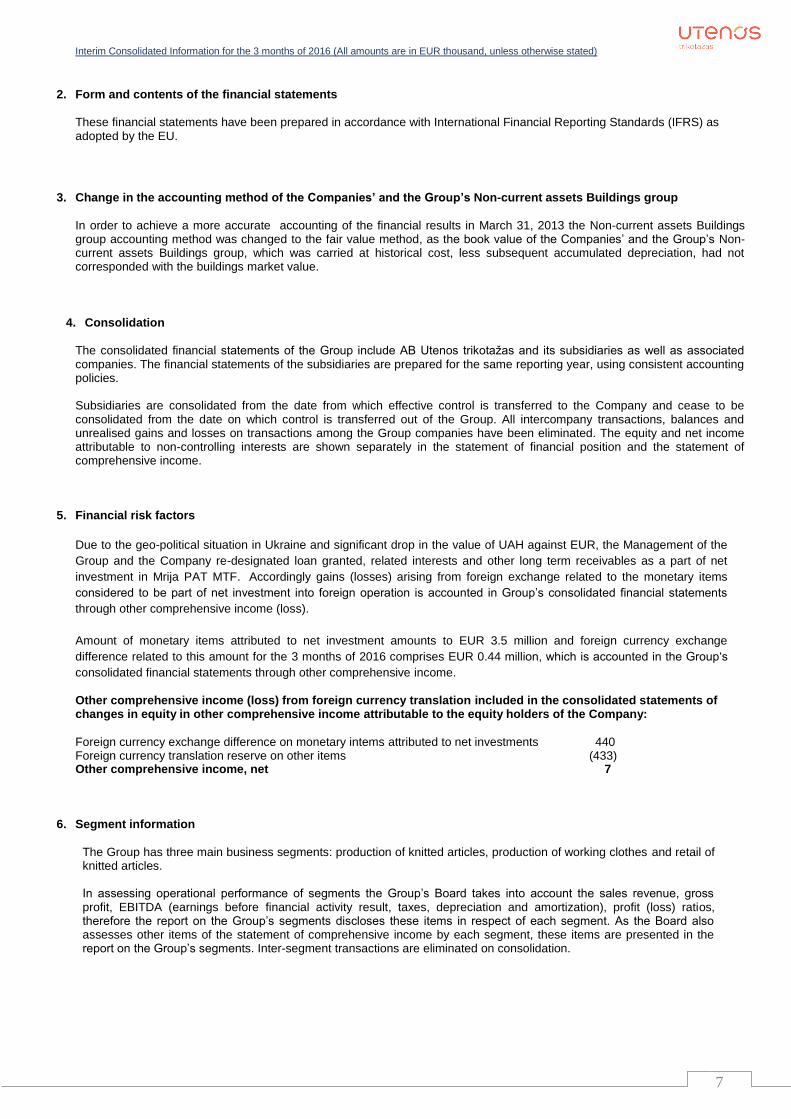
2. Form and contents of the financial statements
These financial statements have been prepared in accordance with International Financial Reporting Standards (IFRS) as adopted by the EU.
3. Change in the accounting method of the Companies’ and the Group’s Non-current assets Buildings group
In order to achieve a more accurate accounting of the financial results in March 31, 2013 the Non-current assets Buildings group accounting method was changed to the fair value method, as the book value of the Companies’ and the Group’s Non-current assets Buildings group, which was carried at historical cost, less subsequent accumulated depreciation, had not corresponded with the buildings market value.
4. Consolidation
The consolidated financial statements of the Group include AB Utenos trikotažas and its subsidiaries as well as associated companies. The financial statements of the subsidiaries are prepared for the same reporting year, using consistent accounting policies. Subsidiaries are consolidated from the date from which effective control is transferred to the Company and cease to be consolidated from the date on which control is transferred out of the Group. All intercompany transactions, balances and unrealised gains and losses on transactions among the Group companies have been eliminated. The equity and net income attributable to non-controlling interests are shown separately in the statement of financial position and the statement of comprehensive income.
5. Financial risk factors
Due to the geo-political situation in Ukraine and significant drop in the value of UAH against EUR, the Management of the
Group and the Company re-designated loan granted, related interests and other long term receivables as a part of net
investment in Mrija PAT MTF. Accordingly gains (losses) arising from foreign exchange related to the monetary items
considered to be part of net investment into foreign operation is accounted in Group’s consolidated financial statements
through other comprehensive income (loss).
Amount of monetary items attributed to net investment amounts to EUR 3.5 million and foreign currency exchange
difference related to this amount for the 3 months of 2016 comprises EUR 0.44 million, which is accounted in the Group‘s
consolidated financial statements through other comprehensive income.
Other comprehensive income (loss) from foreign currency translation included in the consolidated statements of changes in equity in other comprehensive income attributable to the equity holders of the Company:
Foreign currency exchange difference on monetary intems attributed to net investments 440 Foreign currency translation reserve on other items (433) Other comprehensive income, net 7
6. Segment information
The Group has three main business segments: production of knitted articles, production of working clothes and retail of knitted articles. In assessing operational performance of segments the Group’s Board takes into account the sales revenue, gross profit, EBITDA (earnings before financial activity result, taxes, depreciation and amortization), profit (loss) ratios, therefore the report on the Group’s segments discloses these items in respect of each segment. As the Board also assesses other items of the statement of comprehensive income by each segment, these items are presented in the report on the Group’s segments. Inter-segment transactions are eliminated on consolidation.

Interim Consolidated Information for the 3 months of 2016 (All amounts are in EUR thousand, unless otherwise stated)
8
Below, there is a summary of major indicators for the main business segments of the Group included in the statement of comprehensive income for the years 2016 and 2015:
of 31 March 2016
Production of knitted articles
Production of working clothes
Retail in knitted articles Eliminations Total
External sales 4 177 738 48 - 4 963
Internal sales 90 - - (90) -
Total revenue 4 267 738 48 (90) 4 963
Gross profit 772 153 20 - 945
EBITDA 192 92 5 - 289
Profit (loss) (115) 62 5 - (48)
of 31 March 2015
Production of knitted articles
Production of working clothes
Retail in knitted articles Eliminations Total
External sales
3 633
657
50 - 4 340
Internal sales
65
- -
(65) -
Total revenue
3 698
657
50
(65) 4 340
Gross profit
498
102
22
-
622
EBITDA
122
46
6 -
174
Profit (loss)
(502)
15
7
-
(480)
7. Non-current intangible assets
Amortization expenses of intangible assets are included within general and administrative expenses in profit and loss statement.
8. Non-current tangible assets
Depreciation of non-current tangible property amounted to EUR 195 thousand as of 31 March 2016, EUR 157 thousand are included into cost of sales in the Group’s Profit (loss) statement. The remaining amounts were included in general and administrative expenses and inventories in the statement of financial position. In order to achieve a more accurate presentation of the financial results in March 31, 2013 the Non-current assets Buildings group accounting method was changed to the fair value method, as the book value of the Companies’ and the Group’s Non-current assets Buildings group, which was carried at historical cost, less subsequent accumulated depreciation, had not corresponded with the buildings market value.
Interim Consolidated Information for the 3 months of 2016 (All amounts are in EUR thousand, unless otherwise stated)
9
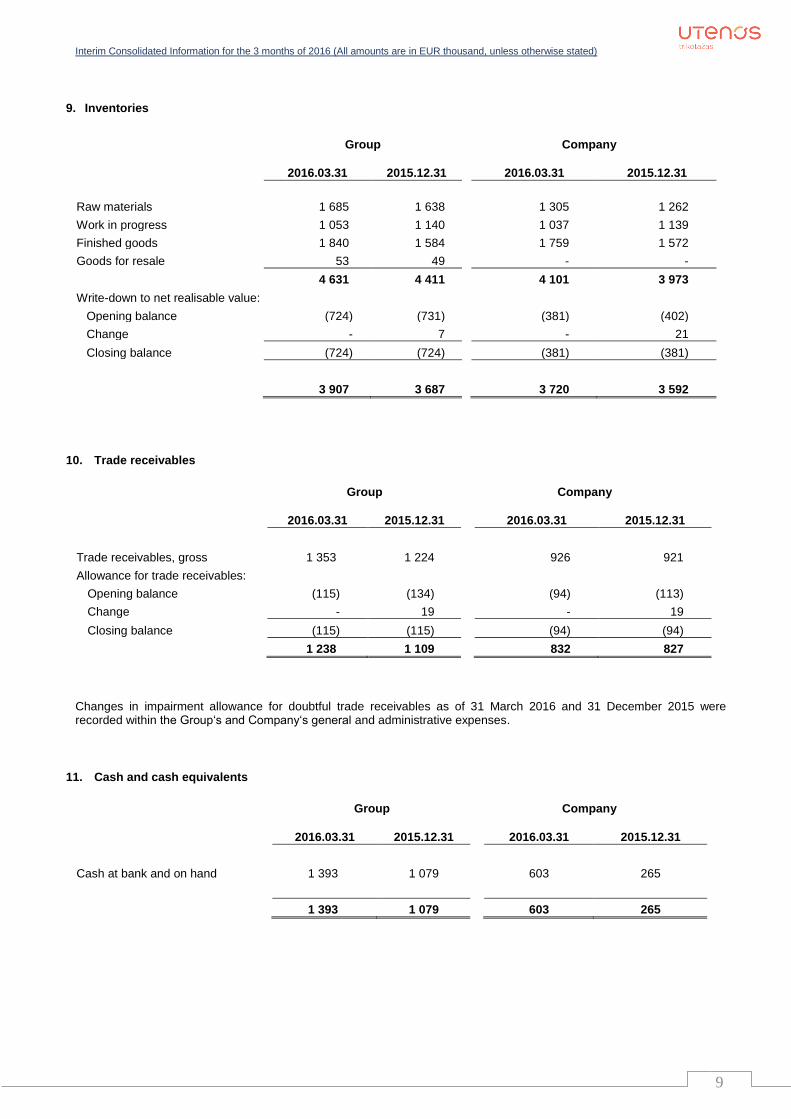
9. Inventories
Group Company
2016.03.31
2015.12.31
2016.03.31
2015.12.31
Raw materials 1 685 1 638 1 305 1 262
Work in progress 1 053 1 140 1 037 1 139
Finished goods 1 840 1 584 1 759 1 572
Goods for resale 53 49 - -
4 631 4 411 4 101 3 973
Write-down to net realisable value:
Opening balance (724) (731) (381) (402)
Change - 7 - 21
Closing balance (724) (724) (381) (381)
3 907 3 687 3 720 3 592
10. Trade receivables
Group Company
2016.03.31
2015.12.31
2016.03.31
2015.12.31
Trade receivables, gross 1 353 1 224 926 921
Allowance for trade receivables:
Opening balance (115) (134) (94) (113)
Change - 19 - 19
Closing balance (115) (115) (94) (94)
1 238 1 109 832 827
Changes in impairment allowance for doubtful trade receivables as of 31 March 2016 and 31 December 2015 were recorded within the Group‘s and Company‘s general and administrative expenses.
11. Cash and cash equivalents
Group Company
2016.03.31
2015.12.31
2016.03.31
2015.12.31
Cash at bank and on hand 1 393 1 079 603 265
1 393 1 079 603 265

Interim Consolidated Information for the 3 months of 2016 (All amounts are in EUR thousand, unless otherwise stated)
10
12. Other reserves and retained earnings (deficit)
Revaluation surplus
Revaluation surplus reflects the result of the revaluation (net of deferred tax) of the property, plant and equipment. Legal reserve A legal reserve is a compulsory reserve under the Lithuanian legislation. Annual transfers of not less than 5 % of net profit of the Company calculated according to the Lithuanian Company’s law, are compulsory until the reserve reaches 10 % of the share capital. As at 31 December 2015 and 2014 the legal reserve is fully formed by the Company. The legal reserve cannot be distributed as dividends but can be used to cover cummulated losses. Foreign currency translation reserve The foreign currency translation reserve represents translation differences arising on consolidation of financial statements of foreign subsidiaries. Reserve for acquisition of own shares
In 2015 according to the decision of the shareholders of Šatrija AB the reserve for acquisition of own shares of EUR 300
thousand was formed.
Cash flow hedge reserve
The Company’s loan with DNB Bank is with floating interest rate that is linked to EURIBOR. On 26 November 2014 the Company signed interest rate swap contract with DNB Bank in order to avoid the interest rate fluctuations. The agreement is valid until 25 November 2019. The fair value of interest rate swap contract used for interest rate risk hedging was EUR 51 thousand as of 31 December 2015 and was accounted for under current (amounting EUR 28 thousand) and non-current liabilities (amounting EUR 23 thousand). Accumulated retained earnings (losses) Pursuant to the provisions of the Law on Limited Liability Companies of the Republic of Lithuania, if the total of retained earnings at the beginning of the financial year and net profit (loss) for the year is negative, the General Shareholders’ Mee ting has to make a decision to cover these losses. Transfers to distributable results should be made in the following sequence: transfer from reserves not used in the reporting financial year; transfer from the compulsory legal reserve; transfer from the share premium. At the date of these financial statements the Company was not informed about any actions of the shareholders of the Co. regarding retained deficit. The balances of other reserves as of 31 March 2016 and 31 December 2015 were as follows:
Group Company
2016.03.31
2015.12.31
2016.03.31
2015.12.31
Revaluation surplus 3 223 3 241 1 783 1 793
Legal reserve 574 574 574 574
Reserve for acquisition of own shares 269 269 - -
Foreign currency translation reserve 120 113 - -
Cash flow hedge reserve (42) (42) (42) (42)
Accumulated retained earnings/ (losses) (974) (938) (112) (70)
3 170 3 217 2 203 2 255
Interim Consolidated Information for the 3 months of 2016 (All amounts are in EUR thousand, unless otherwise stated)
11
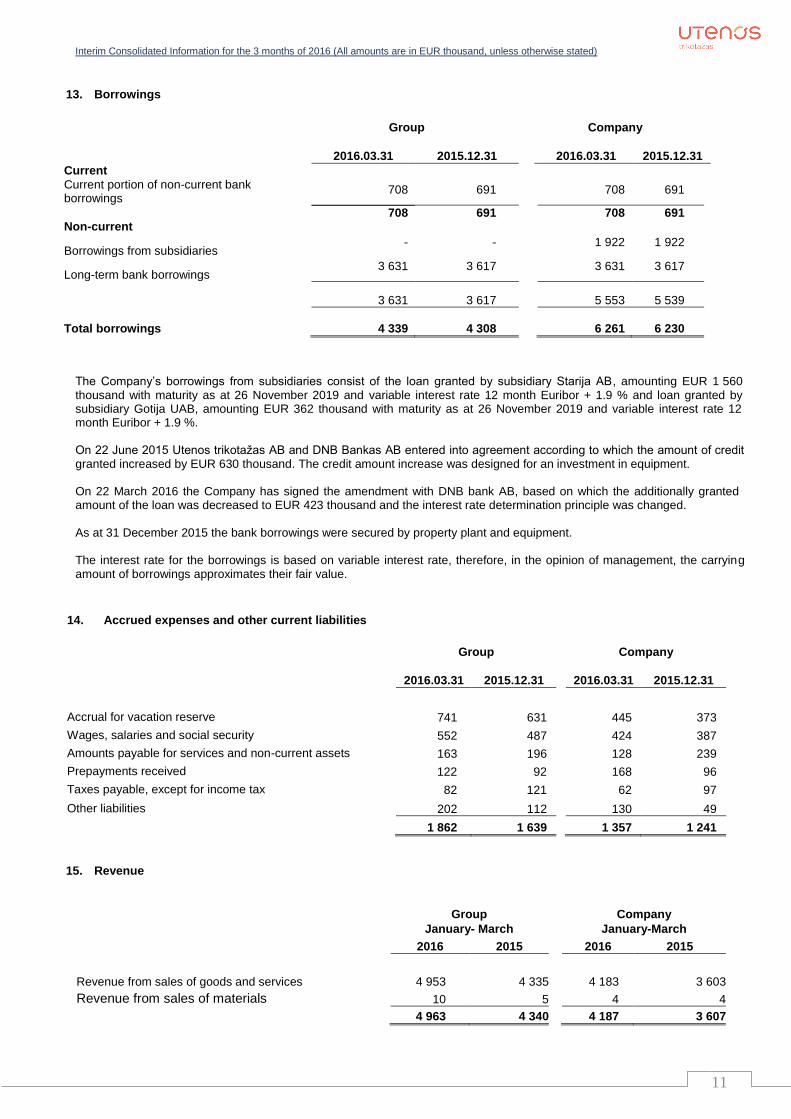
13. Borrowings
Group Company
2016.03.31
2015.12.31
2016.03.31
2015.12.31
Current Current portion of non-current bank borrowings
708 691 708 691
708 691 708 691 Non-current
Borrowings from subsidiaries - - 1 922 1 922
Long-term bank borrowings 3 631 3 617 3 631 3 617
3 631 3 617 5 553 5 539
Total borrowings 4 339 4 308 6 261 6 230
Company
The Company’s borrowings from subsidiaries consist of the loan granted by subsidiary Starija AB, amounting EUR 1 560 thousand with maturity as at 26 November 2019 and variable interest rate 12 month Euribor + 1.9 % and loan granted by subsidiary Gotija UAB, amounting EUR 362 thousand with maturity as at 26 November 2019 and variable interest rate 12 month Euribor + 1.9 %. On 22 June 2015 Utenos trikotažas AB and DNB Bankas AB entered into agreement according to which the amount of credit granted increased by EUR 630 thousand. The credit amount increase was designed for an investment in equipment. On 22 March 2016 the Company has signed the amendment with DNB bank AB, based on which the additionally granted amount of the loan was decreased to EUR 423 thousand and the interest rate determination principle was changed. As at 31 December 2015 the bank borrowings were secured by property plant and equipment. The interest rate for the borrowings is based on variable interest rate, therefore, in the opinion of management, the carrying amount of borrowings approximates their fair value.
14. Accrued expenses and other current liabilities
Group Company
2016.03.31
2015.12.31
2016.03.31
2015.12.31
Accrual for vacation reserve 741 631 445 373
Wages, salaries and social security 552 487 424 387
Amounts payable for services and non-current assets 163 196 128 239
Prepayments received 122 92 168 96
Taxes payable, except for income tax 82 121 62 97
Other liabilities 202 112 130 49
1 862 1 639 1 357 1 241
15. Revenue
Group Company
January- March January-March
2016 2015 2016 2015
Revenue from sales of goods and services 4 953 4 335 4 183 3 603
Revenue from sales of materials 10 5 4 4
4 963 4 340 4 187 3 607

Interim Consolidated Information for the 3 months of 2016 (All amounts are in EUR thousand, unless otherwise stated)
12
16. Cost of sales
Group Company
January- March January-March
2016 2015 2016 2015
Wages and salaries and social security 1 878 1 721 1 419 1 310
Materials 1 574 1 105 1 423 1 067
Other overhead expenses 409 701 546 614
Depreciation and amortisation 157 191 122 159
4 018 3 718 3 510 3 150
17. Selling general and administrative expenses
Group Company
January- March January-March
2016 2015 2016 2015
Selling expenses
Wages and salaries and social security 134 103 119 86
Advertising and marketing costs 72 81 72 81
Other selling expenses 210 158 203 149
416 342 394 316
General and administrative expenses
Wages and salaries and social security 192 197 140 144
Communications and consulting services 67 56 52 44
Depreciation and amortization 27 23 14 8
Taxes other than income tax 25 14 10 10
Security 25 21 13 11
Impairment and write-off (reversal) of inventories 18 - 23 -
Services of financial institutions 16 9 15 8
Premises exploitation expenses 12 11 11 9
Vehicles exploitation expenses 10 17 10 14
Travel expenses 7 13 6 13
Representation expenses 3 9 3 8
Other 69 60 32 33
471 430 329 302
887 772 723 618
Interim Consolidated Information for the 3 months of 2016 (All amounts are in EUR thousand, unless otherwise stated)
13
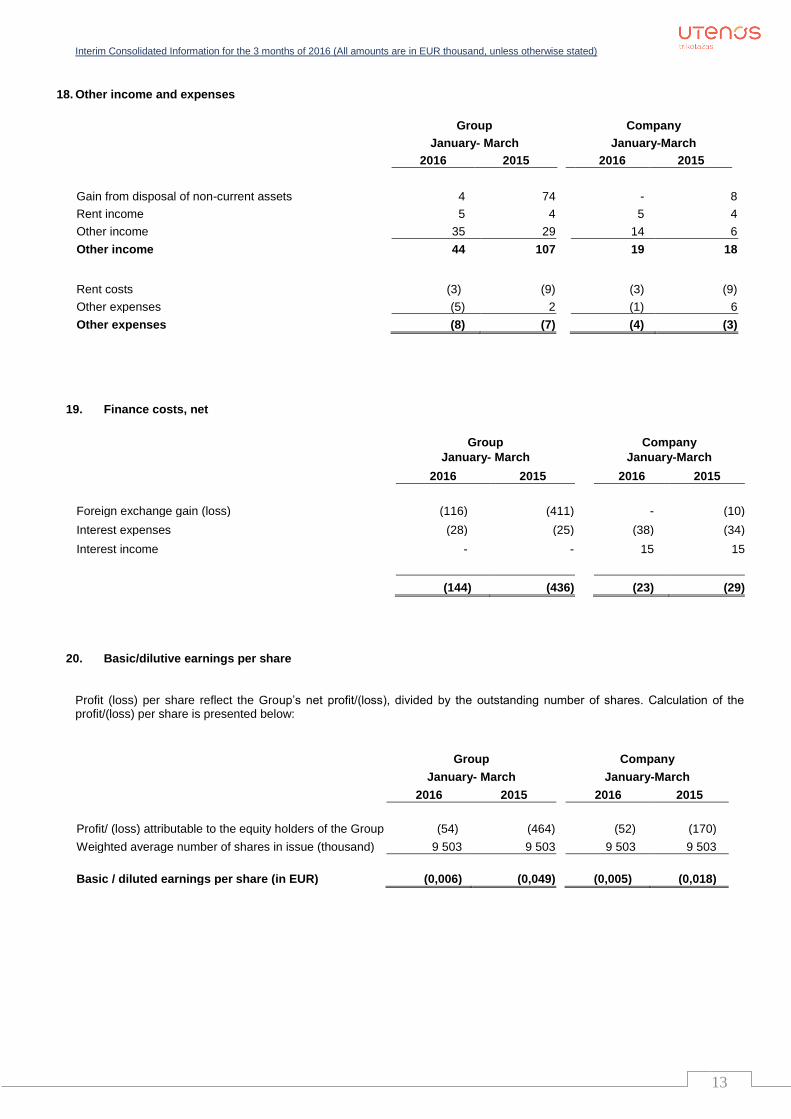
18. Other income and expenses
Group Company
January- March January-March
2016 2015 2016 2015
Gain from disposal of non-current assets 4 74 - 8
Rent income 5 4 5 4
Other income 35 29 14 6
Other income 44 107 19 18
Rent costs (3) (9) (3) (9)
Other expenses (5) 2 (1) 6
Other expenses (8) (7) (4) (3)
19. Finance costs, net
Group Company
January- March January-March
2016 2015 2016 2015
Foreign exchange gain (loss) (116) (411) - (10)
Interest expenses (28) (25) (38) (34)
Interest income - - 15 15
(144) (436) (23) (29)
20. Basic/dilutive earnings per share
Profit (loss) per share reflect the Group’s net profit/(loss), divided by the outstanding number of shares. Calculation of the profit/(loss) per share is presented below:
Group Company
January- March January-March
2016 2015 2016 2015
Profit/ (loss) attributable to the equity holders of the Group (54) (464) (52) (170)
Weighted average number of shares in issue (thousand) 9 503 9 503 9 503 9 503
Basic / diluted earnings per share (in EUR) (0,006) (0,049) (0,005) (0,018)

Interim Consolidated Information for the 3 months of 2016 (All amounts are in EUR thousand, unless otherwise stated)
14
21. Post balance sheet events
There were no other post balance sheet events.