Embed Size (px)
Citation preview
Utility of fiber degrading enzymes in improving utilization of fiber
fractions in corn distillers dried grains with solubles and wheat middling
in pigs: in-vitro and in-vivo approaches
by
Youngji Rho, MSc.
A Thesis
presented to
The University of Guelph
In partial fulfilment of requirements
for the degree of
Doctor of Philosophy
in
Animal Bioscience
Guelph, Ontario, Canada
©Youngji Rho, January 2021
ABSTRACT
Utility of fiber degrading enzymes in improving utilization of fiber
fractions in corn distillers dried grains with solubles and wheat middlings
in pigs: in-vitro and in-vivo approaches
Youngji Rho Advisor:
University of Guelph, 2021 Dr. Elijah Kiarie
Corn distillers dried grains with solubles (DDGS) and wheat middling (WM) are
commonly used in swine diets, however, the high fiber content negatively influences their
nutrient availability and growth performance in pigs. Supplemental fiber degrading
enzymes (FDE) have been used to improve utilization of fibrous ingredients for pigs,
however, results have been inconsistent due to various reasons. It is imperative to match
enzyme activity with target substrates. Moreover, substrates exist in complex relationships
with other components suggesting the need for combined activities. Herein are three
experiments that examined effectiveness of FDE (mix of xylanase, β-glucanase and
cellulase) on fiber fractions in corn DDGS and WM. In experiment 1, FDE was applied
alone or with protease on DDGS or WM in vitro. FDE resulted in greater fiber hydrolysis
and monosaccharide release, however, there were no effects of protease. Therefore, in
experiment 2, digesta was collected from the terminal ileum of growing pigs fed DDGS or
WM diets to determine whether FDE or single xylanase can hydrolyze undigested fiber
fractions. FDE was more effective in releasing monosaccharide than xylanase as illustrated
by an increased fiber hydrolysis. Lastly, in experiment 3, FDE was added in corn plus
DDGS or wheat plus WM diets and fed to growing pigs. FDE improved growth
performance linked to improved fiber digestibility and modulation of gastrointestinal
morphology. In conclusion, FDE improved fiber hydrolysis under in vitro, in vivo- in vitro,
and in vivo conditions. The addition of protease did not increase the fiber degradation
further and FDE was more effective than single xylanase. The improvement seen in in vitro
studies resulted in improved animal performance.
iv
DEDICATION
To my family,
Dr. Gyu-Jin Rho, Soon-Ok Lee, Dr. Na-Young Rho, Jun-Suk Rho
and Kevin Kang.
v
ACKNOWLEDGMENTS
First and foremost, I would like to express my sincere gratitude to my advisor Dr.
Elijah Kiarie for giving me this unforgettable opportunity. Thank you for your guidance,
support, patience and motivation. I have learned so much from you, and I could not think
of a better advisor/mentor for my Ph.D journey.
Thank you to my advisory committee, Drs. Laura Eastwood, Lee-Anne Huber and
Iris Joye for advice and support. Your expertise helped me learn how to approach research
and results from a different point of view, and I am extremely grateful for the time.
Thank you to each and every member of our Monogastric nutrition lab for helping
and encouraging me over the past few years. You guys have made tough and stressful days
more enjoyable and turned them into the most fun days!
Thank you to my family for your love and unconditional support in all that I do and
for believing in me. Special thanks to my fiancé Kevin. You can say this is also your thesis
as you were always there to help no matter what, and I would never have completed it
without you.
Finally, I would like to thank Canadian Bio-Systems, OMAFRA and NSERC, who
funded this research.
vi
TABLE OF CONTENTS
ABSTRACT .......................................................................................................................... ii
ACKNOWLEDGMENTS ....................................................................................................v
LIST OF TABLES .............................................................................................................. ix
LIST OF FIGURES ............................................................................................................ xi
LIST OF ABBREVIATIONS ........................................................................................... xii
1.1 Introduction ............................................................................................................1
1.2 Commonly used co-products in swine diet...........................................................1
1.2.1 Corn distillers dried grains with solubles (DDGS) vs Wheat middlings
(WM) 2
1.3 Main non-starch polysaccharides (NSP) in cereal grains ...................................7
1.3.1 Definition and methods for determining dietary fiber ............................... 9
1.3.2 Arabinoxylans .............................................................................................. 12
1.3.3 Cellulose ........................................................................................................ 14
1.3.4 β-glucan ......................................................................................................... 16
1.3.5 Characteristics of dietary fiber ................................................................... 17
1.4 Effects of fiber in pigs ..........................................................................................18
1.4.1 Fiber and voluntary feed intake ................................................................. 19
1.4.2 Fiber effects on different stage of life in pigs ............................................. 20
1.4.3 Soluble fiber vs Insoluble fiber ................................................................... 22
1.4.4 Short-chain fatty acids ................................................................................. 23
1.5 How fibrous co-products are used in swine industry ........................................27
1.5.1 Particle size ................................................................................................... 27
1.5.2 Fiber degrading enzymes (FDE) ................................................................. 29
1.5.3 Liquid feeding .............................................................................................. 33
1.6 Fiber degrading enzymes in vivo and in vitro ....................................................35
1.6.1 Fiber degrading enzyme in vivo .................................................................. 35
1.6.2 In vitro digestibility method to determine FDE effect .............................. 41
1.7 Conclusion .............................................................................................................46
2 CHAPTER TWO. RESEARCH HYPOTHESIS AND OBJECTIVES..................48
3 CHAPTER THREE. Fiber degrading enzyme increased monosaccharides release
and fermentation in corn distillers dried grains with solubles and wheat middlings
steeped without or with protease .......................................................................................50
vii
3.1 Abstract .................................................................................................................50
3.2 Introduction ..........................................................................................................52
3.3 Materials and methods ........................................................................................55
3.3.1 Feed ingredient samples and treatments ................................................... 55
3.3.2 Experimental procedures ............................................................................ 55
3.3.3 Sample Processing and Laboratory Analyses ........................................... 56
3.3.4 Calculations and statistical analyses .......................................................... 59
3.4 Results ...................................................................................................................59
3.4.1 Chemical composition of corn, wheat, and co-products ........................... 59
3.4.2 Monosaccharides concentration in supernatant of steeped co-products 60
3.4.3 Lactic and acetic acids concentration and pH in supernatant of steeped
co-products .................................................................................................................. 61
3.4.4 Apparent disappearance (AD) of DM, NDF and ADF in the residue of
steeped co-products .................................................................................................... 63
3.5 Discussion ..............................................................................................................64
4 CHAPTER FOUR. Impact of multi-enzyme blend and mono component xylanase
on fiber disappearance and monosaccharide release in ileal digesta from growing pigs
fed corn distillers dried grains with solubles or wheat middlings ..................................83
4.1 Abstract .................................................................................................................83
4.2 Introduction ..........................................................................................................84
4.3 Materials and methods ........................................................................................86
4.3.1 Diets and animals ......................................................................................... 86
4.3.2 In vitro incubation of ileal digesta .............................................................. 87
4.3.3 Sample processing and laboratory analyses .............................................. 89
4.3.4 Calculation and statistics ............................................................................. 91
4.4 Results ...................................................................................................................92
4.4.1 Apparent ileal digestibility (AID) and apparent total tract digestibility
(ATTD) 92
4.4.2 Xylanase activity .......................................................................................... 93
4.4.3 Disappearance of DM, NDF and ADF concentration in post-incubation
residuals ....................................................................................................................... 94
4.4.4 Monosaccharide concentrations in supernatant of incubated samples .. 95
4.4.5 Organic acids and pH in supernatant of incubated samples ................... 96
4.5 Discussion ..............................................................................................................97
viii
5 CHAPTER FIVE. Growth performance, apparent fiber digestibility and
gastrointestinal responses in growing pigs fed corn or wheat-based diets with high co-
products (corn distillers dried grains with solubles (DDGS) or wheat middlings (WM)
with or without fiber degrading enzymes .......................................................................115
5.1 Abstract ...............................................................................................................115
5.2 Introduction ........................................................................................................116
5.3 Materials and methods ......................................................................................117
5.3.1 Diets and animals ....................................................................................... 117
5.3.2 Measurements and samples collection ..................................................... 118
5.3.3 Laboratory analyses .................................................................................. 119
5.3.4 Calculations and statistics ......................................................................... 120
5.4 Results .................................................................................................................122
5.4.1 Diet .............................................................................................................. 122
5.4.2 Animal growth performance ..................................................................... 122
5.4.3 Gastrointestinal tract (GIT) weight, backfat and loin depth ................. 123
5.4.4 Digestibility of dry matter (DM), neutral detergent fiber (NDF) and acid
detergent fiber (ADF) ............................................................................................... 123
5.4.5 Jejunum Morphology ................................................................................ 124
5.4.6 Xylanase activity and pH along the GIT ................................................. 124
5.4.7 Organic acid (OA) concentrations along the GIT................................... 126
5.4.8 Monosaccharide concentrations along the GIT ...................................... 128
5.5 Discussion ............................................................................................................129
6 CHAPTER SIX. General discussion ........................................................................149
6.1 Future studies .....................................................................................................156
7 References ..................................................................................................................158
ix
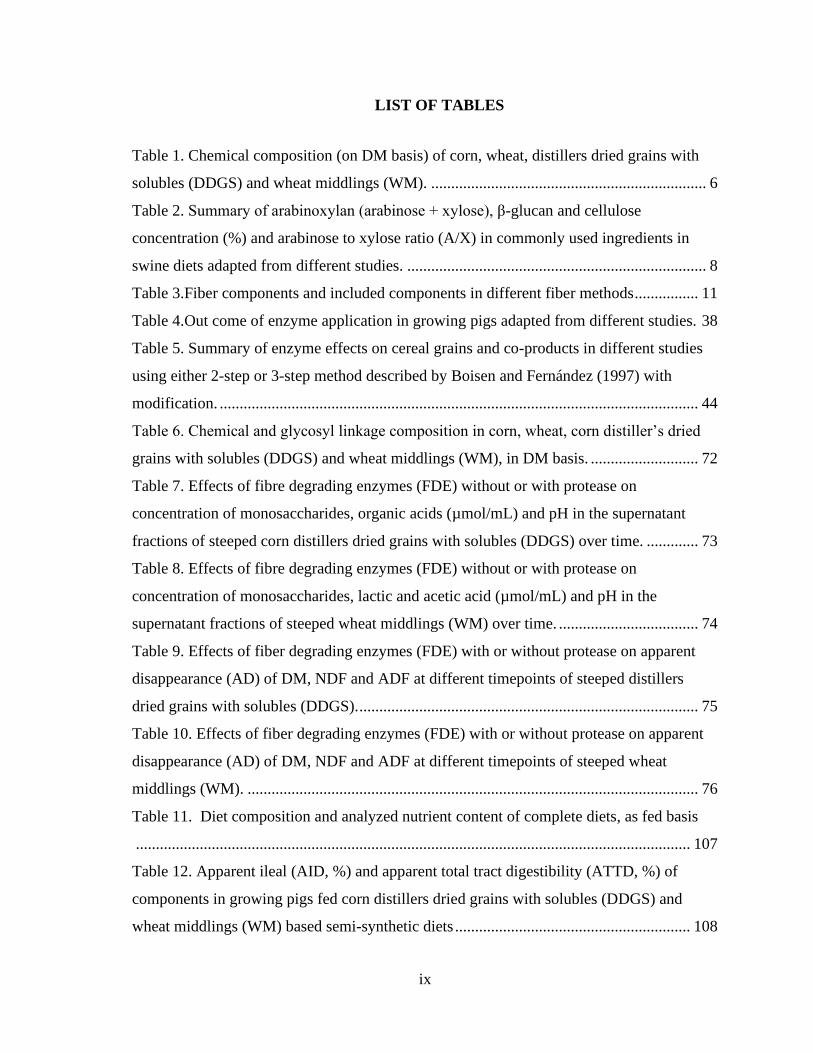
LIST OF TABLES
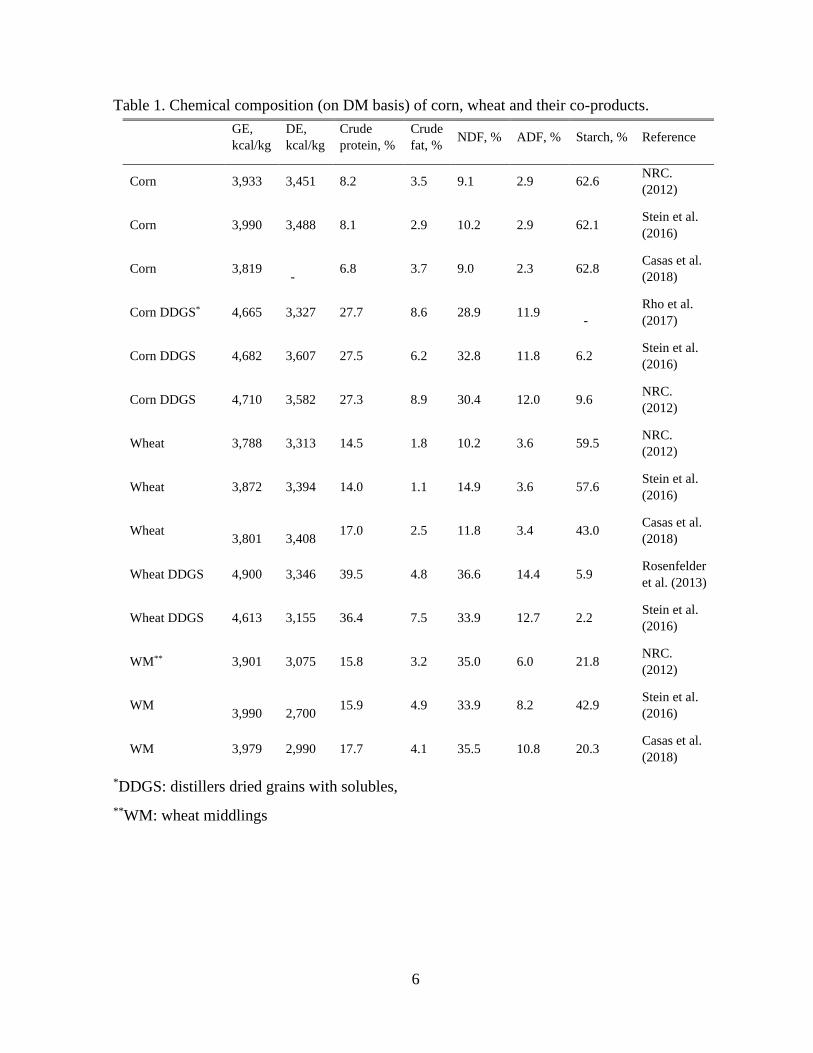
Table 1. Chemical composition (on DM basis) of corn, wheat, distillers dried grains with
solubles (DDGS) and wheat middlings (WM). ..................................................................... 6
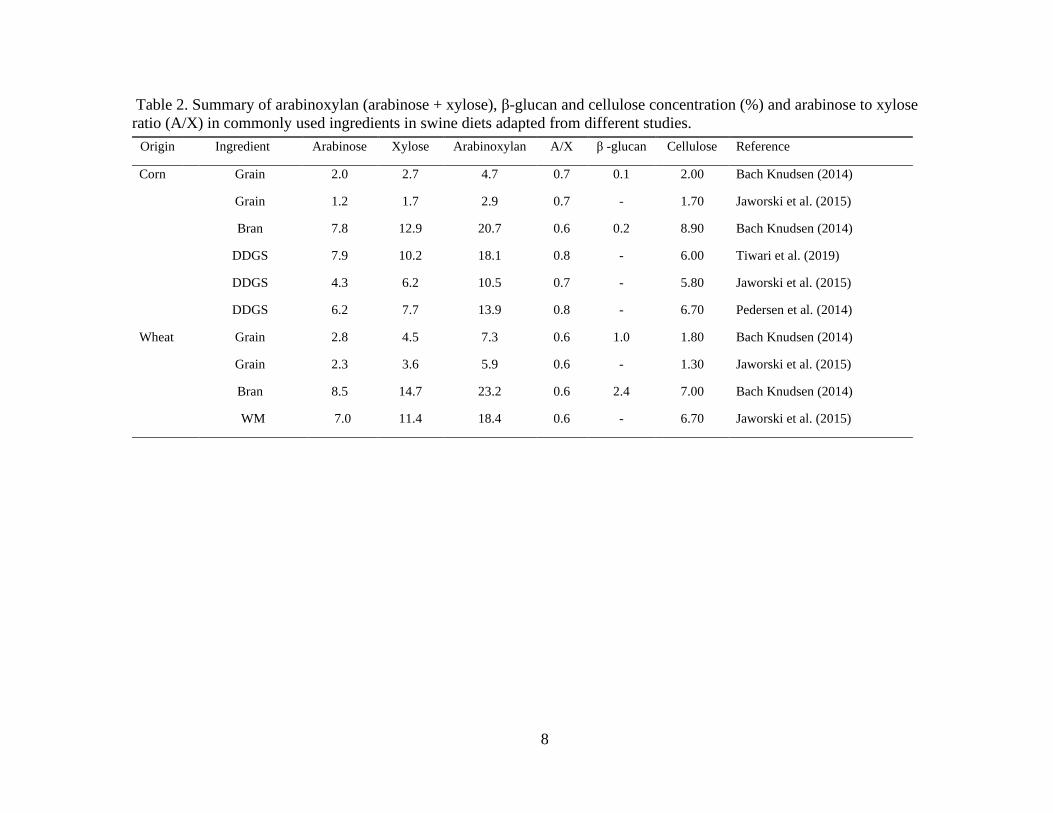
Table 2. Summary of arabinoxylan (arabinose + xylose), β-glucan and cellulose
concentration (%) and arabinose to xylose ratio (A/X) in commonly used ingredients in
swine diets adapted from different studies. ........................................................................... 8
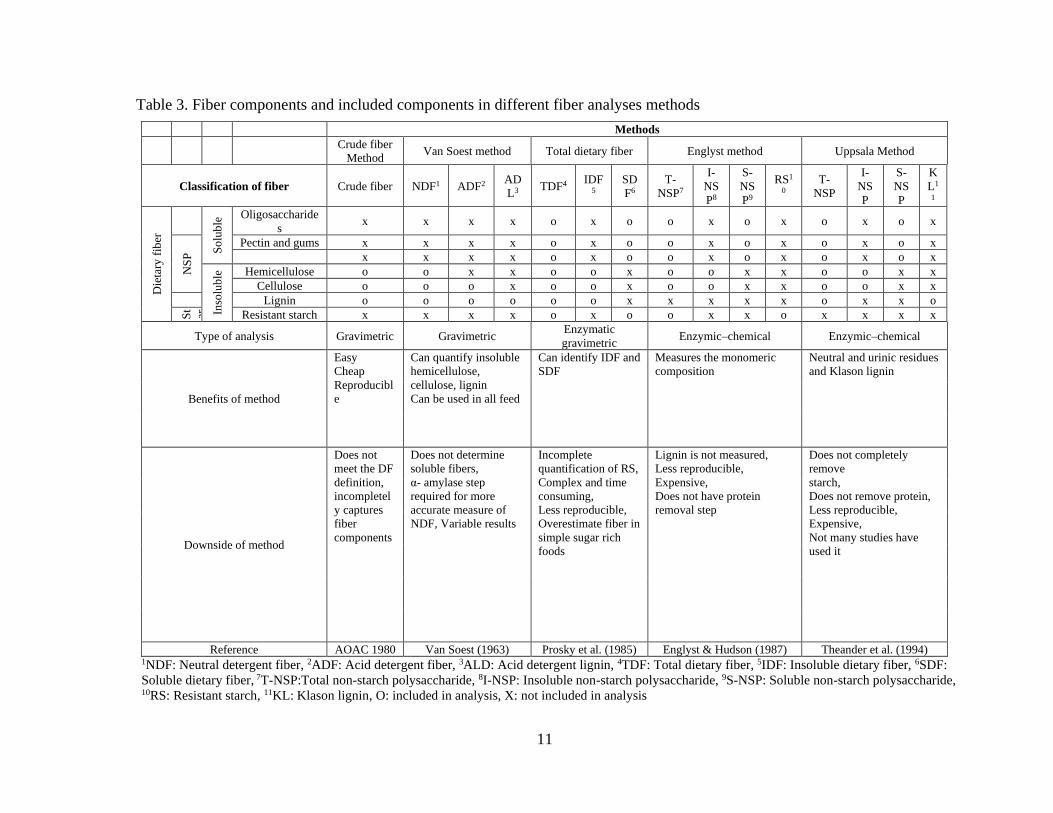
Table 3.Fiber components and included components in different fiber methods ................ 11
Table 4.Out come of enzyme application in growing pigs adapted from different studies. 38
Table 5. Summary of enzyme effects on cereal grains and co-products in different studies
using either 2-step or 3-step method described by Boisen and Fernández (1997) with
modification. ........................................................................................................................ 44
Table 6. Chemical and glycosyl linkage composition in corn, wheat, corn distiller’s dried
grains with solubles (DDGS) and wheat middlings (WM), in DM basis. ........................... 72
Table 7. Effects of fibre degrading enzymes (FDE) without or with protease on
concentration of monosaccharides, organic acids (µmol/mL) and pH in the supernatant
fractions of steeped corn distillers dried grains with solubles (DDGS) over time. ............. 73
Table 8. Effects of fibre degrading enzymes (FDE) without or with protease on
concentration of monosaccharides, lactic and acetic acid (µmol/mL) and pH in the
supernatant fractions of steeped wheat middlings (WM) over time. ................................... 74
Table 9. Effects of fiber degrading enzymes (FDE) with or without protease on apparent
disappearance (AD) of DM, NDF and ADF at different timepoints of steeped distillers
dried grains with solubles (DDGS). ..................................................................................... 75
Table 10. Effects of fiber degrading enzymes (FDE) with or without protease on apparent
disappearance (AD) of DM, NDF and ADF at different timepoints of steeped wheat
middlings (WM). ................................................................................................................. 76
Table 11. Diet composition and analyzed nutrient content of complete diets, as fed basis
........................................................................................................................................... 107
Table 12. Apparent ileal (AID, %) and apparent total tract digestibility (ATTD, %) of
components in growing pigs fed corn distillers dried grains with solubles (DDGS) and
wheat middlings (WM) based semi-synthetic diets ........................................................... 108
x
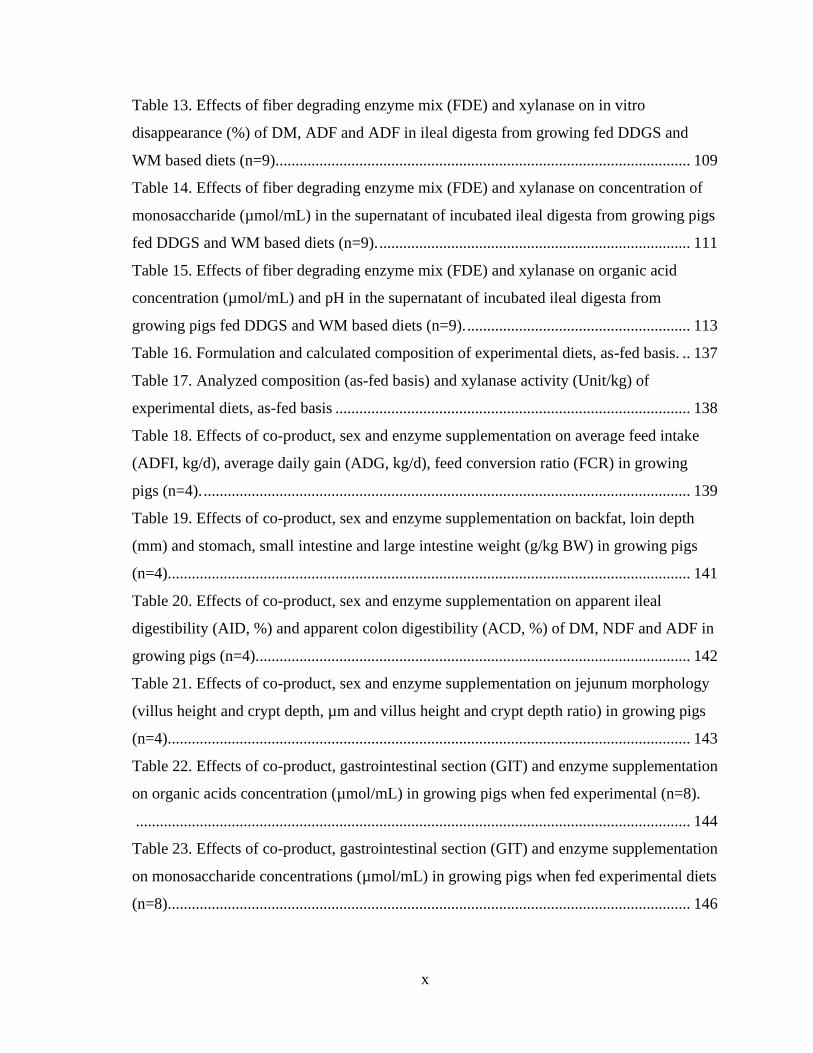
Table 13. Effects of fiber degrading enzyme mix (FDE) and xylanase on in vitro
disappearance (%) of DM, ADF and ADF in ileal digesta from growing fed DDGS and
WM based diets (n=9)........................................................................................................ 109
Table 14. Effects of fiber degrading enzyme mix (FDE) and xylanase on concentration of
monosaccharide (µmol/mL) in the supernatant of incubated ileal digesta from growing pigs
fed DDGS and WM based diets (n=9). .............................................................................. 111
Table 15. Effects of fiber degrading enzyme mix (FDE) and xylanase on organic acid
concentration (µmol/mL) and pH in the supernatant of incubated ileal digesta from
growing pigs fed DDGS and WM based diets (n=9). ........................................................ 113
Table 16. Formulation and calculated composition of experimental diets, as-fed basis. .. 137
Table 17. Analyzed composition (as-fed basis) and xylanase activity (Unit/kg) of
experimental diets, as-fed basis ......................................................................................... 138
Table 18. Effects of co-product, sex and enzyme supplementation on average feed intake
(ADFI, kg/d), average daily gain (ADG, kg/d), feed conversion ratio (FCR) in growing
pigs (n=4). .......................................................................................................................... 139
Table 19. Effects of co-product, sex and enzyme supplementation on backfat, loin depth
(mm) and stomach, small intestine and large intestine weight (g/kg BW) in growing pigs
(n=4)................................................................................................................................... 141
Table 20. Effects of co-product, sex and enzyme supplementation on apparent ileal
digestibility (AID, %) and apparent colon digestibility (ACD, %) of DM, NDF and ADF in
growing pigs (n=4)............................................................................................................. 142
Table 21. Effects of co-product, sex and enzyme supplementation on jejunum morphology
(villus height and crypt depth, µm and villus height and crypt depth ratio) in growing pigs
(n=4)................................................................................................................................... 143
Table 22. Effects of co-product, gastrointestinal section (GIT) and enzyme supplementation
on organic acids concentration (µmol/mL) in growing pigs when fed experimental (n=8).
........................................................................................................................................... 144
Table 23. Effects of co-product, gastrointestinal section (GIT) and enzyme supplementation
on monosaccharide concentrations (µmol/mL) in growing pigs when fed experimental diets
(n=8)................................................................................................................................... 146
xi
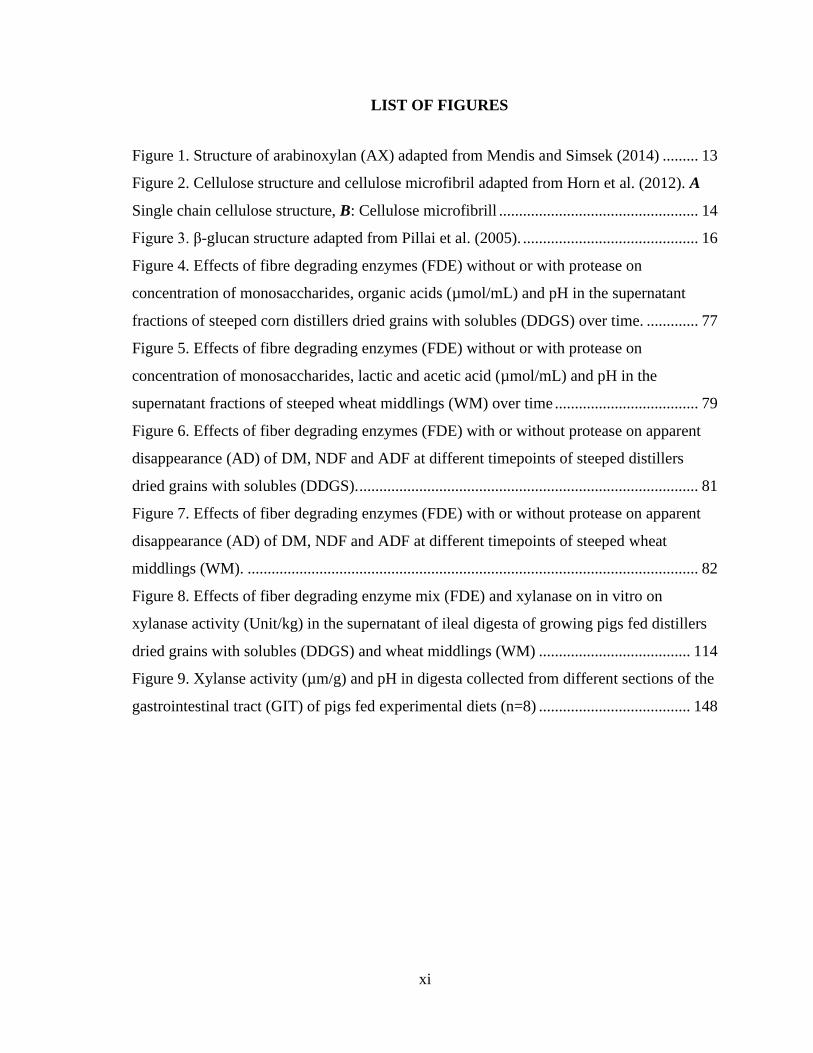
LIST OF FIGURES
Figure 1. Structure of arabinoxylan (AX) adapted from Mendis and Simsek (2014) ......... 13
Figure 2. Cellulose structure and cellulose microfibril adapted from Horn et al. (2012). A
Single chain cellulose structure, B: Cellulose microfibrill .................................................. 14
Figure 3. β-glucan structure adapted from Pillai et al. (2005). ............................................ 16
Figure 4. Effects of fibre degrading enzymes (FDE) without or with protease on
concentration of monosaccharides, organic acids (µmol/mL) and pH in the supernatant
fractions of steeped corn distillers dried grains with solubles (DDGS) over time. ............. 77
Figure 5. Effects of fibre degrading enzymes (FDE) without or with protease on
concentration of monosaccharides, lactic and acetic acid (µmol/mL) and pH in the
supernatant fractions of steeped wheat middlings (WM) over time .................................... 79
Figure 6. Effects of fiber degrading enzymes (FDE) with or without protease on apparent
disappearance (AD) of DM, NDF and ADF at different timepoints of steeped distillers
dried grains with solubles (DDGS). ..................................................................................... 81
Figure 7. Effects of fiber degrading enzymes (FDE) with or without protease on apparent
disappearance (AD) of DM, NDF and ADF at different timepoints of steeped wheat
middlings (WM). ................................................................................................................. 82
Figure 8. Effects of fiber degrading enzyme mix (FDE) and xylanase on in vitro on
xylanase activity (Unit/kg) in the supernatant of ileal digesta of growing pigs fed distillers
dried grains with solubles (DDGS) and wheat middlings (WM) ...................................... 114
Figure 9. Xylanse activity (µm/g) and pH in digesta collected from different sections of the
gastrointestinal tract (GIT) of pigs fed experimental diets (n=8) ...................................... 148
xii
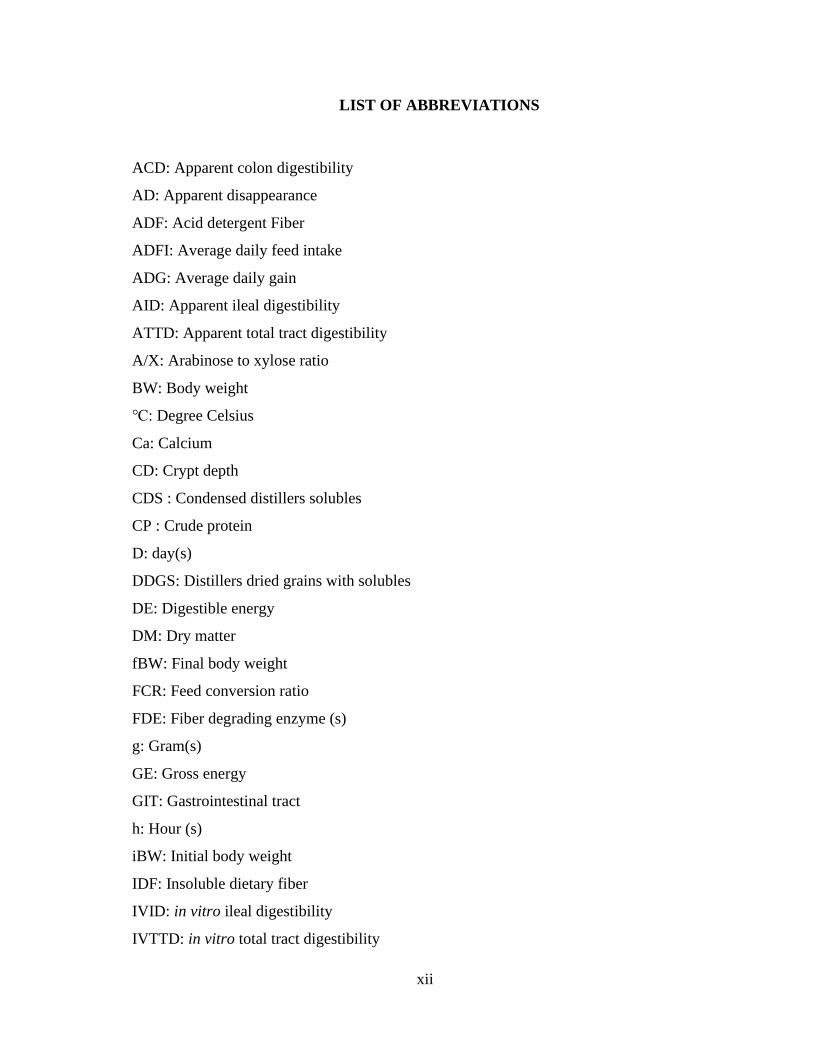
LIST OF ABBREVIATIONS
ACD: Apparent colon digestibility
AD: Apparent disappearance
ADF: Acid detergent Fiber
ADFI: Average daily feed intake
ADG: Average daily gain
AID: Apparent ileal digestibility
ATTD: Apparent total tract digestibility
A/X: Arabinose to xylose ratio
BW: Body weight
℃: Degree Celsius
Ca: Calcium
CD: Crypt depth
CDS : Condensed distillers solubles
CP : Crude protein
D: day(s)
DDGS: Distillers dried grains with solubles
DE: Digestible energy
DM: Dry matter
fBW: Final body weight
FCR: Feed conversion ratio
FDE: Fiber degrading enzyme (s)
g: Gram(s)
GE: Gross energy
GIT: Gastrointestinal tract
h: Hour (s)
iBW: Initial body weight
IDF: Insoluble dietary fiber
IVID: in vitro ileal digestibility
IVTTD: in vitro total tract digestibility
xiii
KL: Klason lignin
LAB: Lactic acid bacteria
LI: Large intestine
NDF: Neutral Detergent Fiber
NSP: Non-starch polysaccharides
OA: Organic acids
SAS: Statistical analysis system
SDF: Soluble dietary fiber
SEM: Standard error of the mean
SCFA: Short chain fatty acids
SI: Small intestine
SID: Standardized ileal digestibility
SBM: Soybean meal
TDF: Total dietary fiber
VH: Villus height
WDG: Wet distillers grain
WM: Wheat middlings
1
CHAPTER ONE. LITERATURE REVIEW
1.1 Introduction
In swine diets, one ingredient cannot sufficiently cover all the nutrient and energy
requirements of the pig. Therefore, in general, to meet the nutrient requirements, diets are
made by combining multiple ingredients. Cereal grains contribute mostly energy, and while
the rest of nutrients mainly come from other feedstuffs such as protein sources, minerals
and vitamins. Corn and wheat are the dominant cereal grains in swine rations in North
America (Woyengo et al. (2014). Corn is highly digestible as it is high in starch and low in
fiber, while wheat has similar energy values as corn (Stein et al., 2016). Other small grains
such as barley, rye, oats are also used in swine feed but to a lesser extent. However, the
cost of corn and wheat have been increasing due to growing demands for human food and
ethanol industries (Kiarie and Nyachoti, 2009; Woyengo et al., 2014). This has raised
challenges in the swine industry as feed accounts for more than 65 to 70% of the cost of the
pork production (Ontario Ministry of Agriculture, Food, and Rural Affairs). Therefore,
interests towards alternative feed ingredients have been growing (Kiarie and Nyachoti,
2009) to replace and/or reduce commonly used energy yielding ingredients (for example,
corn and wheat).
1.2 Commonly used co-products in swine diet
Most cereal grain co-products that are used in swine diets are from the ethanol and
flour milling industries with corn and wheat as the primary raw materials. The primary
reason for using co-products in swine diets is to reduce feed cost as large quantities are
2
available due to increasing demand for ethanol and milled products (Widyaratne and
Zijlstra, 2007; Kiarie and Nyachoti, 2009; Woyengo et al., 2014). Using co-products in
swine feed can reduce the cost of feed, however, the nutritional value can be quite variable
(Slominski et al., 2004). The difference in nutrient values are caused by processing
methods, heating techniques, grain quality and year of harvest among many other factors
(Belyea et al., 2004; Urriola et al., 2010). Co-products from the ethanol industry used in
livestock feed are mostly derived from dry milling process and include condensed distillers
solubles (CDS), wet distillers’ grain (WDG) and combination of both CDS and WGD
(Widyaratne and Zijlstra, 2007; Pedersen et al., 2014). These co-products can be used as-is
in livestock feed diets, however, the dried product, which is distillers dried grains with
solubles (DDGS) is more commonly used as it has a longer shelf-life (McAloon et al.,
2000).
1.2.1 Corn distillers dried grains with solubles (DDGS) vs Wheat middlings (WM)
Distillers dried grains with solubles (DDGS) produced in Canada is mostly from
wheat (West) and corn (East). During ethanol production, approximately 70% of the starch
from the parent grain gets converted into ethanol and carbon dioxide in the fermentation
process (Woyengo et al., 2016). Therefore, DDGS has a higher GE, crude protein (CP),
crude fat and fiber content compared to the parent grain (Table 1) (Stein and Shurson,
2009). Generally, DDGS has a higher CP and gross energy (GE) value but lower
standardized ileal digestibility (SID) of amino acids (AA), digestible energy (DE) and net
energy (NE) values compared to the parent grain (Stein, 2006; Rosenfelder et al., 2013;
Casas et al., 2018). In pigs, the total tract digestibility of fiber in DDGS is less than 50%
3
(Stein and Shurson, 2009). This low fiber digestibility negatively influences digestibility of
DM, other nutrients and energy (Urriola et al., 2010).
The crude protein content is higher in wheat DDGS compared to corn DDGS which
is due to the greater CP content in wheat relative to in corn. However, results show that the
AA digestibility of corn DDGS and wheat DDGS are in most cases comparable (Nyachoti
et al., 2005; Stein and Shurson, 2009; Yang et al., 2010; Kiarie et al., 2013a). In DDGS,
lysine digestibility may be lower due to the heat damage during processing (Kim et al.,
2012a). Therefore, when DDGS is being added to the diet, appropriate supplementation of
crystalline AA and soybean meal (SBM) to balance the supply of available AA is crucial. It
has been reported that DDGS can be included up to 30% in diets for three weeks post-
weaning piglets, grower-finishers, and sows without compromising growth performance or
feed intake (Stein and Shurson, 2009; Zhu et al., 2010; Greiner et al., 2015).
In the flour milling industry, the remaining co-product after flour production are
wheat middlings (WM). Wheat middlings are variably referred to as wheat shorts, wheat
millrun, wheat red dog and wheat bran depending on the crude protein and fiber
concentrations (Rosenfelder et al., 2013). However, in most countries, only WM and wheat
bran are marketed (Stein et al., 2016). Wheat middlings is composed of particles of wheat
bran, wheat shorts, wheat germ, wheat flour and some of the “tail of the mill” residues
(Erickson et al., 1985a). Therefore, the composition of WM may vary as shown in Table 1.
The GE and CP are greater in WM than in wheat. However, the high fiber concentration in
the wheat co-products results in lower DE and SID of AA compared to wheat (Yin et al.,
2000; Eklund et al., 2014). It has been recommended that the inclusion level should be
carefully considered as Cromwell et al. (2000) and Feoli et al. (2006) found that feeding
4
pigs with an increasing amount of WM resulted in decreased growth performance.
Therefore, it has been suggested that the inclusion level of WM should be below10 -20% in
swine diets (Salyer et al., 2012).
The difference in nutrient composition in DDGS and WM is due to different
processing methods. However, in general, both co-products have a greater fiber (NDF and
ADF) and lower starch concentration compared to their parent grain. Overall, there is a
negative correlation between the concentration of fiber and DE in co-products (Huang et
al., 2014) and many on-going and completed studies have been trying to discover new
feeding methods to improve the nutritive value of fibrous co-products. Using these co-
products in swine feed has been shown to increase profitability (Woyengo et al., 2014).
However, when using co-products in swine feed, the inclusion level should be carefully
considered as most co-products have high fiber content compared to their parent grain.
High fiber in diets are found to have adverse effects on nutrient digestibility and growth
performance (Stein, 2006). With the inverse relationship between fiber content and energy
(fat, protein and fiber) digestibility and growth performance well described for fibrous feed
ingredients, it is only logical that development of technologies that degrade fiber, and
thereby improve energy digestibility or voluntary feed intake or reduce manure output, will
be both metabolically and economically beneficial. However, in recent years, dietary fiber
has generated great interest to researchers due to potential gut health benefits. Therefore,
dietary strategies to improve the nutritive value of high fiber co-products is a big interest
nowadays as it has the potential to improve swine health as well as profitability.
Supplementing diets with exogenous fiber degrading enzymes (FDE) has been
shown to improve growth performance and digestibility in some studies however, the
5
results are inconsistent. Thus, many studies are being conducted to understand
inconsistencies in FDE responses. A better understanding of the mechanisms of FDE when
applied to pig diet will allow more efficient use of FDE to improve nutrient and energy
utilization in pigs.
6
Table 1. Chemical composition (on DM basis) of corn, wheat and their co-products.
*DDGS: distillers dried grains with solubles,
**WM: wheat middlings
GE,
kcal/kg
DE,
kcal/kg
Crude
protein, %
Crude
fat, % NDF, % ADF, % Starch, % Reference
Corn 3,933 3,451 8.2 3.5 9.1 2.9 62.6 NRC.
(2012)
Corn 3,990 3,488 8.1 2.9 10.2 2.9 62.1 Stein et al.
(2016)
Corn 3,819 -
6.8 3.7 9.0 2.3 62.8 Casas et al.
(2018)
Corn DDGS* 4,665 3,327 27.7 8.6 28.9 11.9 -
Rho et al.
(2017)
Corn DDGS 4,682 3,607 27.5 6.2 32.8 11.8 6.2 Stein et al.
(2016)
Corn DDGS 4,710 3,582 27.3 8.9 30.4 12.0 9.6 NRC.
(2012)
Wheat 3,788 3,313 14.5 1.8 10.2 3.6 59.5 NRC.
(2012)
Wheat 3,872 3,394 14.0 1.1 14.9 3.6 57.6 Stein et al.
(2016)
Wheat 3,801 3,408
17.0 2.5 11.8 3.4 43.0 Casas et al.
(2018)
Wheat DDGS 4,900 3,346 39.5 4.8 36.6 14.4 5.9 Rosenfelder
et al. (2013)
Wheat DDGS 4,613 3,155 36.4 7.5 33.9 12.7 2.2 Stein et al.
(2016)
WM** 3,901 3,075 15.8 3.2 35.0 6.0 21.8 NRC.
(2012)
WM 3,990 2,700
15.9 4.9 33.9 8.2 42.9 Stein et al.
(2016)
WM 3,979 2,990 17.7 4.1 35.5 10.8 20.3 Casas et al.
(2018)
7
1.3 Main non-starch polysaccharides (NSP) in cereal grains
In animal (monogastric) nutrition, dietary fiber can be defined as “oligosaccharides,
carbohydrate polymers and lignin, that are resistant to pancreatic and intestinal mucosal
endogenous enzymes” as stated by Molist et al. (2014). A wide range of carbohydrate
polymers are considered dietary fiber, including non-starch polysaccharides (NSP), resistant
starch and non-digestible oligosaccharides. Dietary fiber is poorly understood due to its
heterogeneous and extremely complicated structure. The complexity stems from cell walls
formed with a mix of NSP, protein and phenolic compounds while interacting with cellulose
fibrils (Bach Knudsen, 2008).
The NSP is a non-α-glucan polysaccharide, which is in other words a polysaccharide
that cannot be degraded by mammalian amylases (Englyst et al., 1983). The NSP can be
categorized into three groups that are cellulose, non-cellulosic polymers, and pectic
polysaccharides (Choct, 1997). Among cereal grains, arabinoxylans are the major NSP,
followed by cellulose and mixed-linked β-glucans (Bach Knudsen, 1997). The amount of
arabinoxylan, cellulose and β-glucan varies among cereal ingredients and, as reported by Bach
Knudsen et al. (2017), the arabinoxylan, cellulose and β-glucan concentration in corn and
wheat are 4.7, 2.0, 0.1 and 7.3, 1.8, 0.1 %, respectively (Table 2).
8
Table 2. Summary of arabinoxylan (arabinose + xylose), β-glucan and cellulose concentration (%) and arabinose to xylose
ratio (A/X) in commonly used ingredients in swine diets adapted from different studies.
Origin Ingredient Arabinose Xylose Arabinoxylan A/X β -glucan Cellulose Reference
Corn Grain 2.0 2.7 4.7 0.7 0.1 2.00 Bach Knudsen (2014)
Grain 1.2 1.7 2.9 0.7 - 1.70 Jaworski et al. (2015)
Bran 7.8 12.9 20.7 0.6 0.2 8.90 Bach Knudsen (2014)
DDGS 7.9 10.2 18.1 0.8 - 6.00 Tiwari et al. (2019)
DDGS 4.3 6.2 10.5 0.7 - 5.80 Jaworski et al. (2015)
DDGS 6.2 7.7 13.9 0.8 - 6.70 Pedersen et al. (2014)
Wheat Grain 2.8 4.5 7.3 0.6 1.0 1.80 Bach Knudsen (2014)
Grain 2.3 3.6 5.9 0.6 - 1.30 Jaworski et al. (2015)
Bran 8.5 14.7 23.2 0.6 2.4 7.00 Bach Knudsen (2014)
WM 7.0 11.4 18.4 0.6 - 6.70 Jaworski et al. (2015)
9
1.3.1 Definition and methods for determining dietary fiber
There are a number of definitions for dietary fiber that have been suggested by
different scientists and organizations (Champ et al., 2003). The differences in the suggested
definition of dietary fiber are due in part to the diverse physicochemical characteristics of
the fiber (Champ et al., 2003). Therefore, although dietary fiber is generally characterized
by its indigestibility in the upper gut of humans and monogastric animals, so far suggested
definitions cannot cover the vast physiochemical properties of dietary fiber (Champ et al.,
2003). However, in animal (monogastric) nutrition, dietary fiber is commonly defined as
oligosaccharides, carbohydrate polymers, which are not hydrolyzed by the endogenous
enzymes in the small intestine (SI) (Molist et al., 2014).
Similar to the definition, there is not yet an analysis method that can reflect the
whole physiochemical properties of the dietary fiber component (Champ et al., 2003).
However, there are common methods to analyze dietary fiber components in the
feed/ingredients, which can be categorized into chemical-gravimetric, enzymatic-
gravimetric, or enzymatic-chemical methods (Mertens, 2003) (Table 3). Crude fiber
analysis is the oldest and first method developed, which entails a chemical gravimetric
procedure that quantifies cellulose, insoluble hemicellulose and lignin. However, results of
using this method can be quite variable as it does not fully capture complete fiber
components and may only represent 40 to 100% of cellulose, 15 to 20% of hemicellulose,
and 5 to 90% of the lignin depending on feed ingredients (Mertens, 2003). The detergent
fiber method developed by Van Soest (1963) uses detergents to analyze acid detergent fiber
(ADF; cellulose, lignin), neutral detergent fiber (NDF; cellulose, insoluble hemicellulose,
lignin), and acid detergent lignin (ADL; lignin). Although the detergent fiber method is an
10
improved method compared to crude fiber, it still does not measure soluble hemicelluloses,
which can underestimate the total dietary fiber in ingredient/feeds that are rich in soluble
fiber (Dhingra et al., 2012). The TDF method, which is an enzymatic-gravimetric method,
has been developed to measure insoluble and soluble fibers together or separately (Prosky
et al., 1985; Champ et al., 2003). The insoluble fiber fraction includes lignin, cellulose, and
insoluble hemicelluloses, and the soluble fiber fraction includes soluble hemicelluloses
(pectin, β-glucan, and some arabinoxylan) (Prosky et al., 1985). The Uppsala and Englyst
methods are enzymatic-chemical methods which determine the insoluble and total NSP by
measuring the monomeric composition of structural components of cell walls (Mertens,
2003). The Uppsala method, however, does not remove proteins and is time consuming and
expensive (Mertens, 2003), whereas the Englyst method does not include lignin and
resistant starch without an additional analysis step and it lacks reproducibility (Champ et
al., 2003; Dhingra et al., 2012).
Methods for measuring fiber are more variable compared to methods for
determining the contents of other nutrients such as proteins, and out of several fiber
methods, none of them are able to simultaneously determine all the indigestible
components (Champ et al., 2003; Mertens, 2003). Therefore, it is important to understand
the limitations of each method and select the appropriate method depending on the
components that are to be identified.
11
Table 3. Fiber components and included components in different fiber analyses methods
Methods
Crude fiber
Method Van Soest method Total dietary fiber Englyst method Uppsala Method
Classification of fiber Crude fiber NDF1 ADF2 AD
L3 TDF4
IDF5
SD
F6
T-
NSP7
I-
NS
P8
S-
NS
P9
RS1
0
T-
NSP
I-
NS
P
S-
NS
P
K
L1
1
Die
tary
fib
er
So
lub
le Oligosaccharide
s x x x x o x o o x o x o x o x
NS
P
Pectin and gums x x x x o x o o x o x o x o x
x x x x o x o o x o x o x o x
Inso
lub
le Hemicellulose o o x x o o x o o x x o o x x
Cellulose o o o x o o x o o x x o o x x
Lignin o o o o o o x x x x x o x x o
St
ar ch
Resistant starch x x x x o x o o x x o x x x x
Type of analysis Gravimetric Gravimetric Enzymatic
gravimetric Enzymic–chemical Enzymic–chemical
Benefits of method
Easy
Cheap
Reproducibl
e
Can quantify insoluble
hemicellulose,
cellulose, lignin
Can be used in all feed
Can identify IDF and
SDF
Measures the monomeric
composition
Neutral and urinic residues
and Klason lignin
Downside of method
Does not
meet the DF
definition,
incompletel
y captures
fiber
components
Does not determine
soluble fibers,
α- amylase step
required for more
accurate measure of
NDF, Variable results
Incomplete
quantification of RS,
Complex and time
consuming,
Less reproducible,
Overestimate fiber in
simple sugar rich
foods
Lignin is not measured,
Less reproducible,
Expensive,
Does not have protein
removal step
Does not completely
remove
starch,
Does not remove protein,
Less reproducible,
Expensive,
Not many studies have
used it
Reference AOAC 1980 Van Soest (1963) Prosky et al. (1985) Englyst & Hudson (1987) Theander et al. (1994) 1NDF: Neutral detergent fiber, 2ADF: Acid detergent fiber, 3ALD: Acid detergent lignin, 4TDF: Total dietary fiber, 5IDF: Insoluble dietary fiber, 6SDF:
Soluble dietary fiber, 7T-NSP:Total non-starch polysaccharide, 8I-NSP: Insoluble non-starch polysaccharide, 9S-NSP: Soluble non-starch polysaccharide, 10RS: Resistant starch, 11KL: Klason lignin, O: included in analysis, X: not included in analysis
12
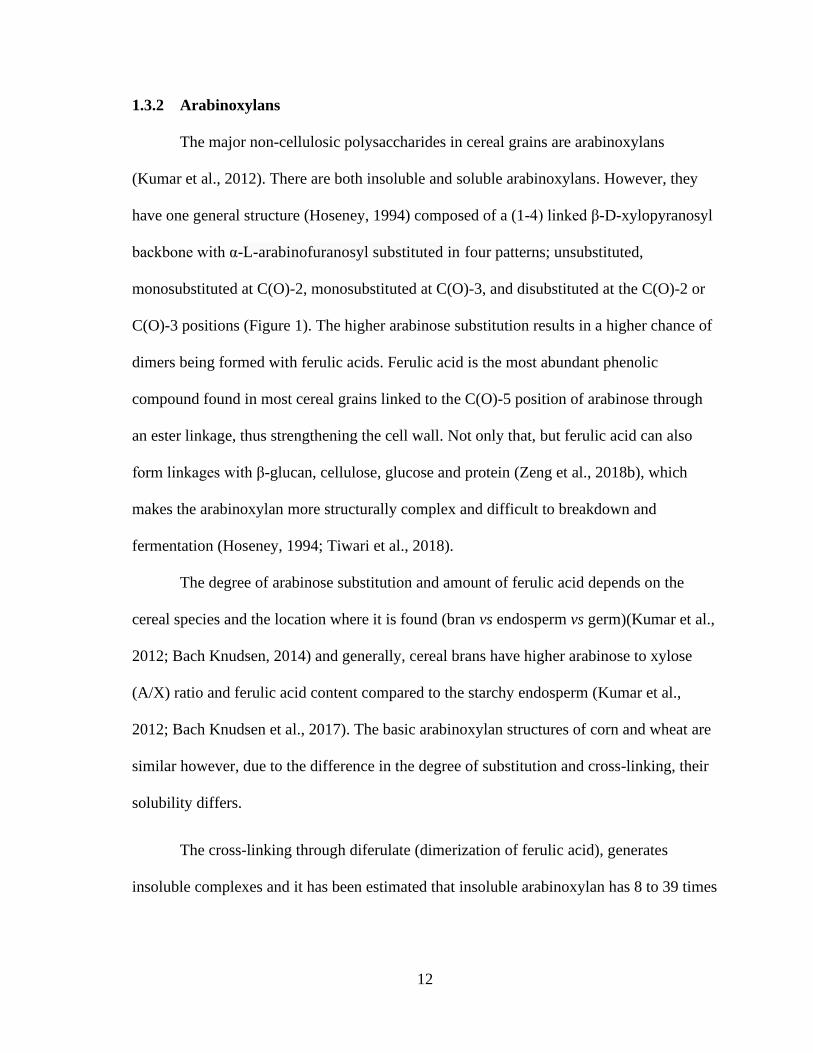
1.3.2 Arabinoxylans
The major non-cellulosic polysaccharides in cereal grains are arabinoxylans
(Kumar et al., 2012). There are both insoluble and soluble arabinoxylans. However, they
have one general structure (Hoseney, 1994) composed of a (1-4) linked β-D-xylopyranosyl
backbone with α-L-arabinofuranosyl substituted in four patterns; unsubstituted,
monosubstituted at C(O)-2, monosubstituted at C(O)-3, and disubstituted at the C(O)-2 or
C(O)-3 positions (Figure 1). The higher arabinose substitution results in a higher chance of
dimers being formed with ferulic acids. Ferulic acid is the most abundant phenolic
compound found in most cereal grains linked to the C(O)-5 position of arabinose through
an ester linkage, thus strengthening the cell wall. Not only that, but ferulic acid can also
form linkages with β-glucan, cellulose, glucose and protein (Zeng et al., 2018b), which
makes the arabinoxylan more structurally complex and difficult to breakdown and
fermentation (Hoseney, 1994; Tiwari et al., 2018).
The degree of arabinose substitution and amount of ferulic acid depends on the
cereal species and the location where it is found (bran vs endosperm vs germ)(Kumar et al.,
2012; Bach Knudsen, 2014) and generally, cereal brans have higher arabinose to xylose
(A/X) ratio and ferulic acid content compared to the starchy endosperm (Kumar et al.,
2012; Bach Knudsen et al., 2017). The basic arabinoxylan structures of corn and wheat are
similar however, due to the difference in the degree of substitution and cross-linking, their
solubility differs.
The cross-linking through diferulate (dimerization of ferulic acid), generates
insoluble complexes and it has been estimated that insoluble arabinoxylan has 8 to 39 times
13
more diferulates than soluble arabinoxylan molecules (Kosik et al., 2017). In addition, it
has been found that corn has 5 to 7 times more diferulates compared to wheat (Pedersen et
al., 2015a).
Arabinoxylans that are not linked to cellulose tend to be soluble in water. Soluble
arabinoxylan forms a highly viscous solution. Therefore, cereal grains with greater
soluble arabinoxylan ratios such as wheat and rye may form a more viscous solution
when mixed with water (Choct, 1997).
To completely breakdown arabinoxylans into monosaccharides, multiple enzymes with
side-chain cleaving and depolymerizing activities are required (Sørensen et al., 2005). To
cleave the xylan backbone, endo-1,4-β-xylanases (EC 3.2.1.8) and β-xylosidases (EC
3.2.1.37) are needed (Sørensen et al., 2005). The side chain cleaving enzymes include α-l-
arabinofuranosidases (EC 3.2.1.55), feruloyl esterases (EC 3.1.1.73), α-glucuronidases (EC
3.2.1.139), and acetylesterases (EC 3.1.1.6) (Paloheimo et al., 2010).
Figure 1. Structure of arabinoxylan (AX) adapted from Mendis and Simsek (2014)
14
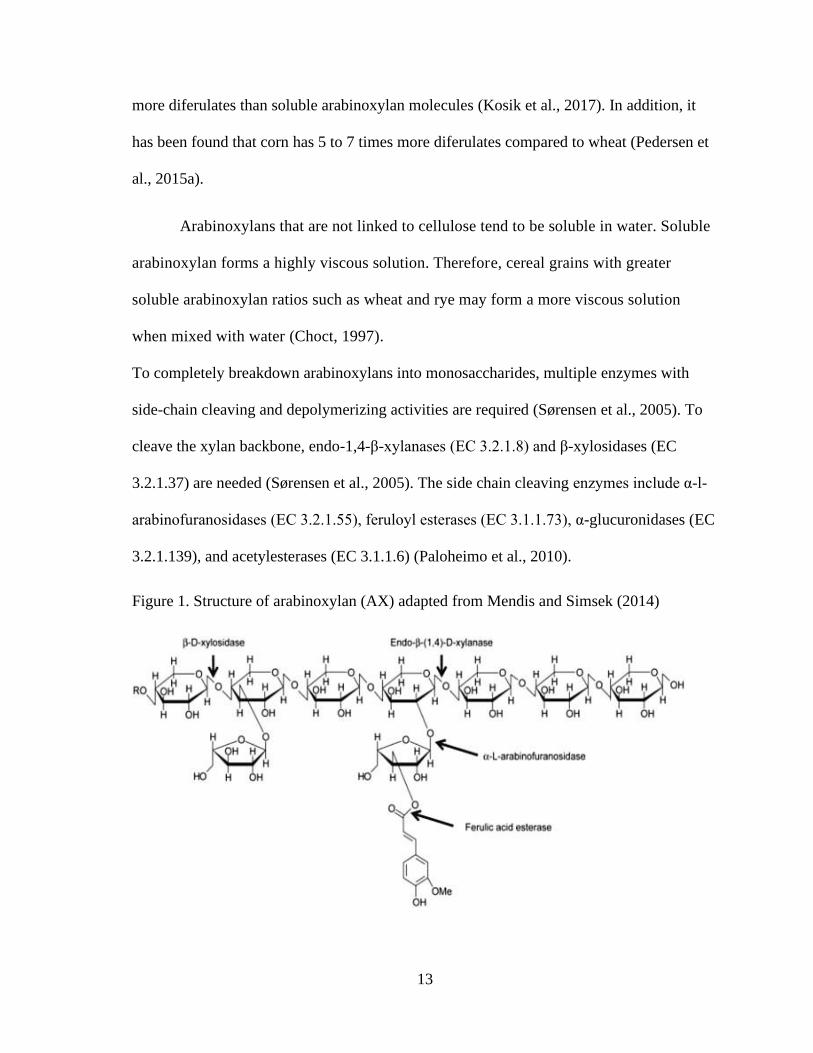
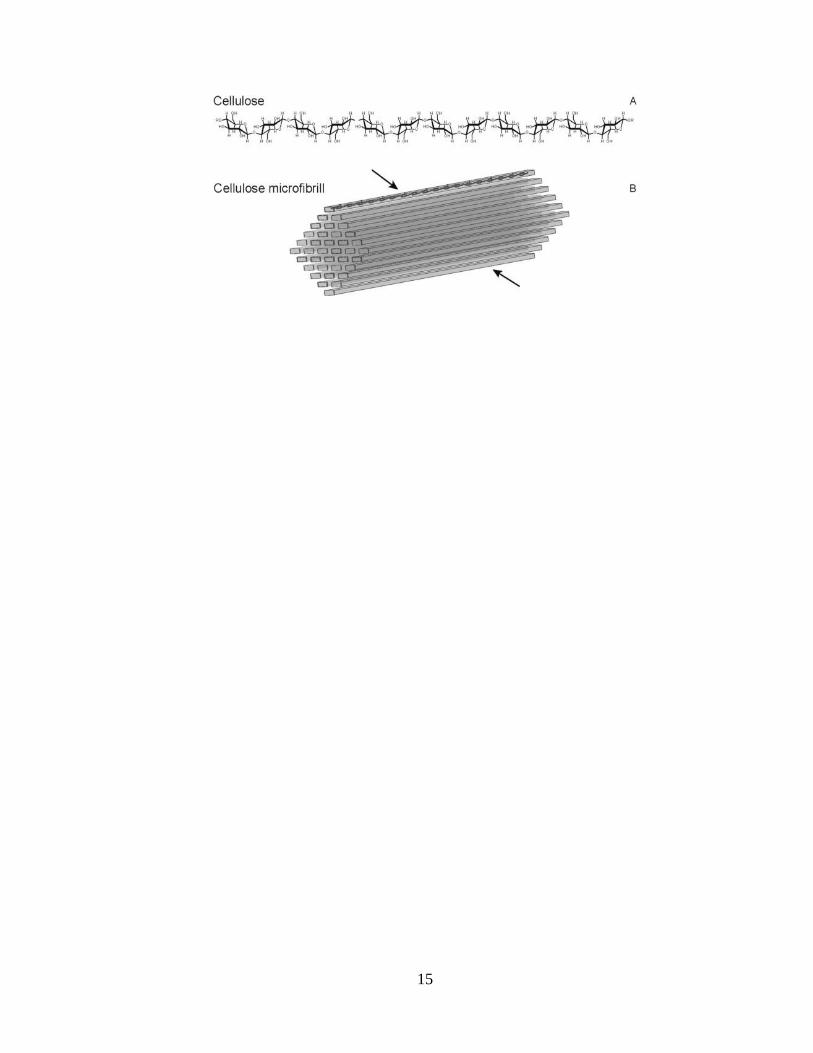
1.3.3 Cellulose
Cellulose is the second most abundant NSP component found in cereal grains and is
composed of hundreds of thousands of linear homopolymers of β- (1-4) linked D-glucose
units (Figure 2) (Bach Knudsen, 2014). The β-(1–4) linkage of glucose units forms a flat
configuration that can be stacked together to form larger microfibrils by hydrogen bonding
and van der Waals interactions (Horn et al., 2012). This rigid linear structure makes
cellulose insoluble and resistant to degradation in humans and animals’ (excluding
ruminant animals) digestive tracts and even in the distilling processes (Van Eylen et al.,
2011). Cellulose is even harder to degrade when the lignin content is greater, as
lignification hampers enzymatic hydrolysis (Grabber, 2005).
Enzymes that can degrade cellulose include endo-1,4-β-glucanases, exo-1,4-β-
glucanases and β-glucosidases, which degrade cellulose by adding water molecule to
cleave glycosidic bonds (Horn et al., 2012).
Figure 2. Cellulose structure and cellulose microfibril adapted from Horn et al. (2012). A
Single chain cellulose structure, B: Cellulose microfibrill
15
16
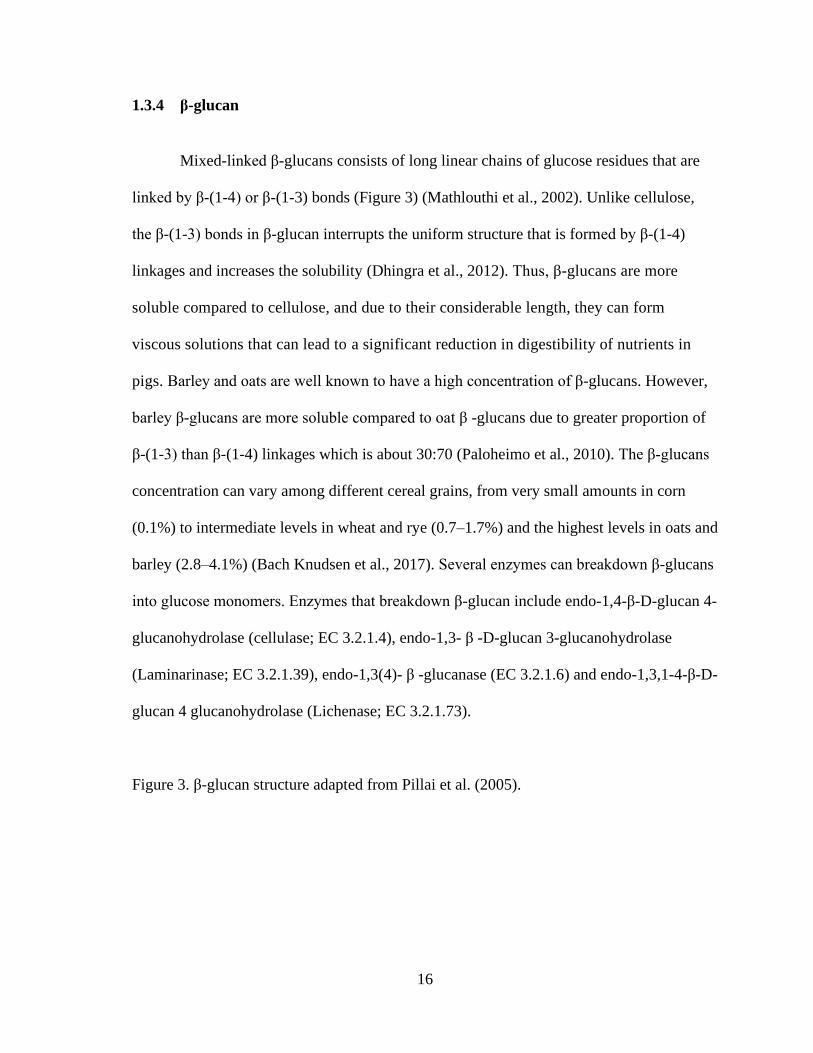
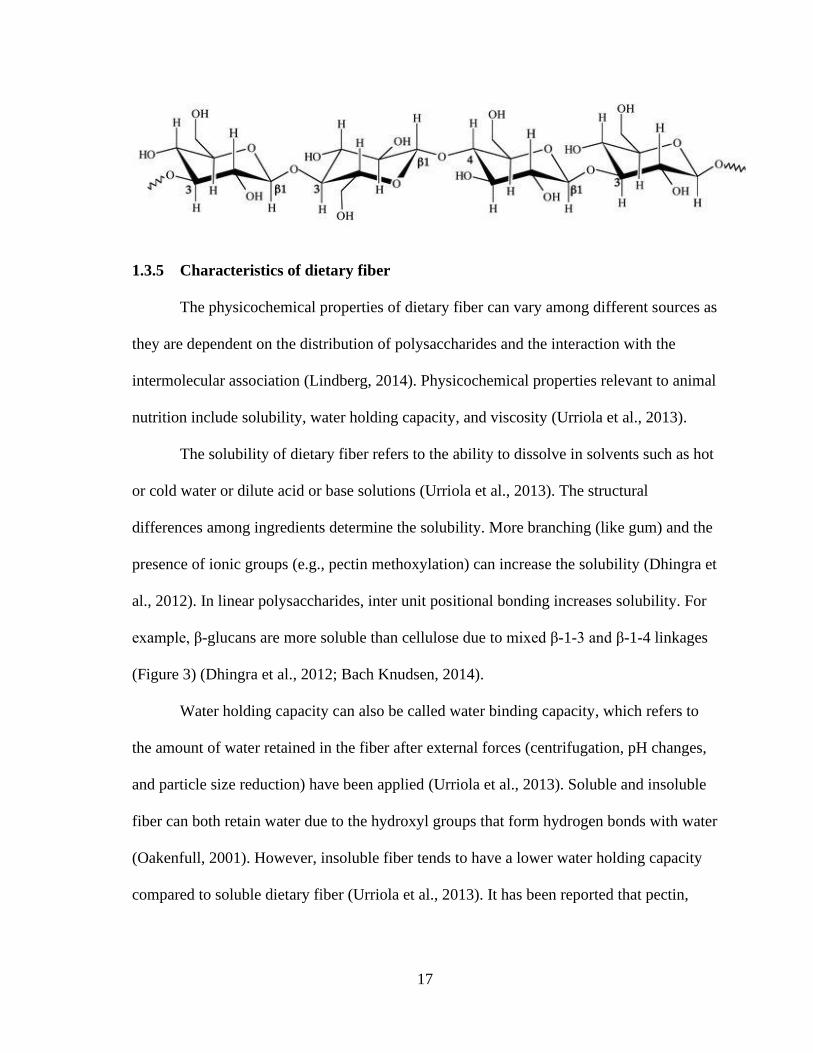
1.3.4 β-glucan
Mixed-linked β-glucans consists of long linear chains of glucose residues that are
linked by β-(1-4) or β-(1-3) bonds (Figure 3) (Mathlouthi et al., 2002). Unlike cellulose,
the β-(1-3) bonds in β-glucan interrupts the uniform structure that is formed by β-(1-4)
linkages and increases the solubility (Dhingra et al., 2012). Thus, β-glucans are more
soluble compared to cellulose, and due to their considerable length, they can form
viscous solutions that can lead to a significant reduction in digestibility of nutrients in
pigs. Barley and oats are well known to have a high concentration of β-glucans. However,
barley β-glucans are more soluble compared to oat β -glucans due to greater proportion of
β-(1-3) than β-(1-4) linkages which is about 30:70 (Paloheimo et al., 2010). The β‐glucans
concentration can vary among different cereal grains, from very small amounts in corn
(0.1%) to intermediate levels in wheat and rye (0.7–1.7%) and the highest levels in oats and
barley (2.8–4.1%) (Bach Knudsen et al., 2017). Several enzymes can breakdown β-glucans
into glucose monomers. Enzymes that breakdown β-glucan include endo-1,4-β-D-glucan 4-
glucanohydrolase (cellulase; EC 3.2.1.4), endo-1,3- β -D-glucan 3-glucanohydrolase
(Laminarinase; EC 3.2.1.39), endo-1,3(4)- β -glucanase (EC 3.2.1.6) and endo-1,3,1-4-β-D-
glucan 4 glucanohydrolase (Lichenase; EC 3.2.1.73).
Figure 3. β-glucan structure adapted from Pillai et al. (2005).
17
1.3.5 Characteristics of dietary fiber
The physicochemical properties of dietary fiber can vary among different sources as
they are dependent on the distribution of polysaccharides and the interaction with the
intermolecular association (Lindberg, 2014). Physicochemical properties relevant to animal
nutrition include solubility, water holding capacity, and viscosity (Urriola et al., 2013).
The solubility of dietary fiber refers to the ability to dissolve in solvents such as hot
or cold water or dilute acid or base solutions (Urriola et al., 2013). The structural
differences among ingredients determine the solubility. More branching (like gum) and the
presence of ionic groups (e.g., pectin methoxylation) can increase the solubility (Dhingra et
al., 2012). In linear polysaccharides, inter unit positional bonding increases solubility. For
example, β-glucans are more soluble than cellulose due to mixed β-1-3 and β-1-4 linkages
(Figure 3) (Dhingra et al., 2012; Bach Knudsen, 2014).
Water holding capacity can also be called water binding capacity, which refers to
the amount of water retained in the fiber after external forces (centrifugation, pH changes,
and particle size reduction) have been applied (Urriola et al., 2013). Soluble and insoluble
fiber can both retain water due to the hydroxyl groups that form hydrogen bonds with water
(Oakenfull, 2001). However, insoluble fiber tends to have a lower water holding capacity
compared to soluble dietary fiber (Urriola et al., 2013). It has been reported that pectin,
18
potato pulp, and sugar beet pulp have greater water holding capacity compared to wheat
and barley (Serena and Bach Knudsen, 2007). The high water holding capacity of fiber can
also influence viscosity (Blackwood et al., 2000).
The viscosity can be described as resistance to flow; the interactions between
polysaccharides molecules in solution are responsible for viscosity (Oakenfull, 2001;
Dhingra et al., 2012). The structure determines the viscosity. For example, greater
molecular weight and chain length of fiber increase viscosity (Bach Knudsen et al., 2012).
Soluble fibers with long-chain polymers tend to bind significant amounts of water and
exhibit high solution viscosity (e.g., guar gum, tragacanth gum). However, highly soluble
fibers that are highly branched or have shorter chain polymers have low viscosity, such as
gum Arabic (Dhingra et al., 2012). The increased viscosity in the digesta is considered
negative as it creates a layer in the intestinal surface that limits the digestion and absorption
of nutrients (Jha and Berrocoso, 2015).
1.4 Effects of fiber in pigs
It has been well documented that high fiber content in swine feed can negatively
influence digestibility of nutrients and energy (Stein and Shurson, 2009) by increasing
digesta transit time and nutrient encapsulation effects. Also, voluntary feed intake is
reduced by high fiber diet which is due to gut fill therefore, ultimately reducing
performance (Agyekum et al., 2014) but, the negative effects of fiber differ among
different stage of life in pigs.
19
Despite these negative effects, dietary fiber also plays an important role in the
animals’ gastrointestinal tract (GIT). The positive effects of dietary fiber include
stimulation of regular physiological function of the gut, increased satiety, improved gut
health, and may improve growth performance in certain situations and reduce diarrhea of
piglets (Jha and Berrocoso, 2015). Dietary fiber can also act as a prebiotic to modify the
microbial environment and the mucosa in the GIT. It stimulates beneficial microorganism
growth such as Lactobacillus spp. and Bifidobacterium spp. that can prevent gut infections
of pathogenic bacteria (Knudsen et al., 2012). Fiber fermentation in the hindgut produces
short chain fatty acids (SCFA), which are known to enhance stimulation of epithelium cell
proliferation and improve the development of gut architecture (Lindberg, 2014). Production
of SCFA can contribute up to approximately 15-25% of maintenance energy for growing
pigs. Not only that, SCFA reduces lumen pH and therefore, prevents harmful pathogen
growth such as Escherichia coli and Salmonella (Brooks et al., 2001a).
1.4.1 Fiber and voluntary feed intake
Fibrous diet can increase bulkiness that may result in reduced feed intake in young
pigs, due to their limited gut size (Owusu-Asiedu et al., 2006; Li and Patience, 2017).
Avelar et al. (2010) observed reduced ADFI with increasing level of DDGS inclusion from
0 to 20 % in weaning pigs. For growing and finishing pigs, voluntary feed intake is affected
by the energy concentration in the ingredient/diet because pigs tend to consume feed until
their energy requirement is fulfilled (Nyachoti et al., 2004). Although growing pigs has less
limitation in gut fill capacity, reduced feed intake has been seen as well. Owusu-Asiedu et
20
al. (2006) demonstrated a reduction in voluntary feed intake and growth performance when
growing pigs were fed diets containing guar gum and cellulose. Interestingly, diets
containing 30 % DDGS did not affect feed intake in growing pigs (Stein and Shurson,
2009; Agyekum et al., 2012). Anguita et al. (2007) and Zhang et al. (2013) observed
reduced feed intake when sugar beet pulp was added compared to other ingredients such as
wheat bran and coarsely grounded corn. The greater decrease in voluntary feed intake seen
in sugar beet pulp and guar gum compared to other ingredients which may be due to
increased water holding capacity properties of the fiber fractions in these ingredients
(Anguita et al., 2007). Therefore, it should be noted that type of fiber may affect feed
intake in pigs.
1.4.2 Fiber effects on different stage of life in pigs
Weaning is the most stressful time for pigs as they deal with multiple stresses.
Reduced feed intake at weaning is very common and it has been shown that 10% of piglets
did not consume any feed during 48 h post weaning (Brooks et al., 2001). This is a major
problem as reduced feed intake impacts GIT development and functions, resulting in
shortened villus length, increased gut permeability, reduced endogenous enzyme activities,
and promotes the production of proinflammatory cytokines (Hu et al., 2013). In order to
reduce the negative effects of weaning, in-feed antibiotics have been used to reduce and/or
prevent negative outcomes (Molist et al., 2014), however, with the raising concerns
towards antibiotic resistant bacteria, the use of antibiotics have been restricted (Maron et
21
al., 2013). In Canada, only licensed veterinarian can prescribe medically important
antimicrobials for swine feed (Government of Canada, 2019)
and therefore, dietary strategies are thought to be one possible solution to reduce negative
results of post weaning stress. In previous studies, inclusion of insoluble fibers in post
weaning diets improved feed intake, increased commensal microbiota population in the
hind gut, reduced proliferation of pathogenic bacteria growth and promoted gut
developments (Högberg and Lindberg, 2006; Gerritsen et al., 2012; Kim et al., 2012b).
However, as piglets have an immature gut, dietary fiber inclusion level should be carefully
considered.
Adult pigs are generally better at digesting fibrous diets due to more developed
GIT, and a higher cellulolytic activity than young pigs (Lindberg, 2014). For example,
inclusion of 30 % soybean hulls or WM reduced growth performance in growing pigs but
not in finishing pigs (Stewart et al., 2013). Compared to any other group of pigs, sows have
the most developed GIT and capability of utilizing fiber. In a study where researchers
compared digestibility of fiber in sows and growing pigs, sows were able to digest 25 to
28 % of NSP in the small intestine whereas most of the NSP were fermented in the hindgut
in growing pigs (Jørgensen et al., 2007). Not only that, sows had greater ability in utilizing
energy derived from the hindgut fermentation (Jørgensen et al., 2007). Fibrous ingredients
can be added to improve satiety in sows, as in general, sows are restricted fed during
pregnancy as excessive weight gain can result in problems during farrowing (Lindberg,
2014).
22
Fibrous ingredients can be used in pig diets of any stage for prebiotic effects since
dietary fibre components are not degraded by the endogenous enzymes, and therefore, can
be the main substrates for microbial fermentation in the hindgut (Jha and Berrocoso, 2015).
Fermentation of fiber produces SCFA (acetate, propionate and butyrate) that can enhance
the growth of the digestive tract by stimulating epithelial cell proliferation. Moreover, by
reducing the pH of the gut, enteric bacterial pathogens, such as Salmonella, E.
coli and Clostridium species are reduced. However, it is important to note that different
dietary fiber types and sources may modulate the gastrointestinal bacterial
communities/populations differently.
1.4.3 Soluble fiber vs Insoluble fiber
The type of fiber should be considered as physiochemical characteristics that
impacts the viscosity and fermentability, hence affecting the digestibility and hindgut
fermentation (Michel and Rérat, 1998; Hooda et al., 2011). Dietary fiber can be divided
into two categories which are soluble fibers and insoluble fibers (Bach Knudsen, 1997).
Insoluble fiber increases fecal bulk while reducing the digestive transit time, gut
fill, and provide substrates to the hindgut microbes (Freire et al., 2000) as little to no
fermentation occurs in the upper gut. Not only that, insoluble fibers can also help prevent
pathogens from attaching to the intestinal epithelium and reduce pathogen growth (Molist
et al., 2014). However, due to reduced digesta transit time, there is less time for digestive
enzymes to digest the substrate, which reduces nutrient and energy digestibility (Wenk,
2001) and it may be a reason why exogenous enzymes are not as efficient in animals.
23
Furthermore, insoluble fiber reduces digestibility of energy, mostly due to the
encapsulating effect and reduced digesta transit time and the negative effect on energy
utilization is greater in insoluble fiber compared to soluble fibers. This is because soluble
fibers are more readily fermented in the hindgut compared to insoluble fiber (Agyekum and
Nyachoti, 2017).
Soluble fibers increase the viscosity, hydration properties such as swelling capacity,
solubility, water binding capacity, and digesta retention time, which reduces the diffusion
of enzymes to substrate resulting in reduced digestion and absorption (Wenk, 2001).
However, soluble fiber is easily fermented and stimulates growth of commensal gut
microbes which leads to increased production of SCFA, and reduced pH in the large
intestine (Bach Knudsen et al., 2012). The produced SCFA plays an important role in
maintaining the gut and can provide up to 15 to 30 % of maintenance energy in pigs (Varel
and Yen, 1997; Fernández et al., 2016). However, with increasing data supporting the
beneficial effects of insoluble fibers, there still isn’t a confirmed recommended inclusion
level (de Lange et al., 2010). Therefore, further research should be conducted to determine
the optimum inclusion level and type of fiber for pigs.
1.4.4 Short-chain fatty acids
Short-chain fatty acids are saturated aliphatic organic acids with a backbone of less
than six carbons and are major end-products from microbial fermentation of carbohydrates
in the large intestine. However, depending on the substrate source and microbiota, the end
product may vary (Brestenský et al., 2017; Feng et al., 2018b). Fermentation of
24
carbohydrates by saccharolytic bacteria results in SCFA such as acetate, propionate and
butyrate and, H2 and CO2 (Macfarlane and Macfarlane, 2003), which mainly occurs in the
proximal colon as carbohydrates are preferred substrates for most microbes (Tiwari et al.,
2019). On the other hand, fermentation of proteins and peptides that contain branched-
chain amino acids occurs in the distal colon and results in short branched-chain fatty acids
such as 2-methylbutyrate, iso-butyrate, iso-valerate, and phenols, amines and CO2 which
are considered harmful as it can cause colonic diseases (Brestenský et al., 2017; Feng et al.,
2018b; Tiwari et al., 2019).
Production of SCFA can contribute up to approximately 15 % of the maintenance
energy requirements for growing pigs and 30% for gestating sows (Varel and Yen, 1997).
Also, SCFA reduce lumen pH and therefore, prevents harmful pathogen growth such as E.
coli and Salmonella (Brooks et al., 2001a). Acetate, a two-carbon SCFA that is the most
abundant SCFA in the GIT can be used for lipogenesis or it can be absorbed in peripheral
tissues where it acts as a direct source of energy by conversion to ATP (Jha and Berrocoso,
2015; Fernández et al., 2016). Propionate is a three-carbon SCFA, which enters into the
portal vein and undergoes gluconeogenesis in the liver (Aumiller et al., 2015; Fernández et
al., 2016). Butyrate is a four-carbon short-chain fatty acid, which is the major energy
source for colonocytes and plays an important role in modulating immune and
inflammatory responses and intestinal barrier function by increasing mucin production and
tight junction integrity (Fernández et al., 2016).
The concentration of SCFA varies along the length of the gut, as degree of
fermentation differs in different parts of GIT. The highest level of SCFA is seen in the
25
cecum and proximal colon, and lower concentrations are seen in small intestine and in the
distal colon (Koh et al., 2016; Brestenský et al., 2017). In the proximal colon, acetate
accounts for approximately 90 % of the SCFA and propionate and butyrate are minimal,
whereas in the distal colon and stool, acetate, propionate and butyrate accounts for
approximately 60, 25 and 15 % or less, respectively of the SCFA present (Brestenský et al.,
2017; Tiwari et al., 2019). In addition to SCFA, other metabolites such as lactate, ethanol
and succinate are also produced from microbial fermentation (Drochner et al., 2004).
Lactate can be produced by lactic acid bacteria (LAB), bifidobacteria, and proteobacteria,
however, most gets converted into different SCFA by other microbial species such as
Eubacteriumhallii (Flint et al., 2015).
Inclusion of dietary arabinoxylan and resistant starch increased
Bifidobacterium population and acetate and butyrate concentration in the feces (Williams et
al., 2011; Hald et al., 2016), and cellulose increased production and absorption of acetate
(Bach Knudsen et al., 2016). Greater propionate and lower butyrate concentration was seen
when feeding wheat starch compared to corn starch (Williams et al., 2011), and lower
propionate and butyrate production were observed when feeding wheat bran compared to
peeled oats (Williams et al., 2005). Feeding growing pigs flaxseed meal or oat hulls in a
corn basal diet had different impact on ileal and ceca fermentation patterns as indicated by
differences in SCFA (Ndou et al., 2017; Ndou et al., 2018). Further analyses indicated
flaxseed meal (rich in soluble fiber) and oat hulls (rich in insoluble fiber) altered the
gastrointestinal development leading to changes in composition and function of
gastrointestinal microbial communities (Ndou et al., 2018). Zhao et al. (2019) found
26
different concentrations of SCFA in ileal digesta from pigs fed diets containing one of the
following high fibrous co-products corn bran, wheat bran, oat bran, soybean hulls, sugar
beet pulp and rice bran. The acetate concentration was greater for oat bran compared to
soybean hulls and rice bran which suggests carbohydrate composition of the substrate is
responsible for these differences.
Fermentation can be also affected by exogenous enzyme supplementation mainly
through reduction of undigested nutrients flowing to the hindgut and production of
fermentable short chain fiber fractions (Kiarie et al., 2016b). Pigs fed a multi-carbohydrase
containing pectinase, cellulase, β-mannanase, xylanase, β-glucanase, and galactanase in a
wheat-barley based diet with or without flaxseed showed increased NSP utilization and was
linked to higher concentrations of lactic acid producing bacteria in the ileum (Kiarie et al.,
2007). Enzyme supplementation with wheat bran and corn cob pig diets resulted in increase
acetate, propionate and total SCFA concentrations in the colon and greater xylanolytic and
cellulolytic activities in the caecum and colon of pigs (Carneiro et al., 2008). The addition
of a multi-enzyme supplement containing supply xylanase, β-glucanase, protease, α-
amylase, and pectinase in a corn and soy bean meal based diet with 30 % corn DDGS
stimulated growth of intestinal bacteria with xylanolytic and cellulolytic activities
(Agyekum et al., 2016). Researchers found that when pigs were fed corn with corn DDGS
or wheat with WM diets supplemental xylanase, the efficacy of xylanase and microbiota
diversity was dependent on the ingredient (Zhang et al., 2018b). Therefore, fermentation
can be affected by available substrates and enzyme supplementation.
27
1.5 How fibrous co-products are used in swine industry
There are numerous approaches that have been used to improve nutrient utilization
of fibrous ingredients in pork production. Some of the dominant approaches include
particle size reduction, chemical treatments, feed enzymes and liquid feeding.
1.5.1 Particle size
Particle size reduction in feed processing is a well accepted approach in optimal
preparation of swine feed for improved feed efficiency in pigs (Hancock and Behnke,
2001; Kiarie and Mills, 2019). Reducing feed particle size increases the surface area,
enhancing exposure of nutrients for enzyme digestion and therefore, resulting in greater
nutrient utilization in finely ground compared to coarsely ground feeds made with corn,
wheat, DDGS or soyhulls (Mavromichalis et al., 2000; Mendoza et al., 2010; Souza et al.,
2012; Saqui-Salces et al., 2017). Reducing particle size to approximately 400 µm was
found to improve feed conversion ratio (FCR) (Wondra et al., 1995; Souza et al., 2012) due
to improved nutrient and energy digestibility. When particle size was reduced from 1300 to
600 µm in a wheat diet, the apparent total tract digestibility (ATTD) of DM and N was
improved (Mavromichalis et al., 2000). Reducing particle size of corn from 1200 to 400
µm increased ATTD of DM, N, and GE (Wondra et al., 1995). Rojas and Stein (2015)
stated that improved digestibility of energy seen when particle size was reduced may be
due to increased starch digestibility.
In fibrous co-products, when particle size was reduced, nutrient digestibility was
improved. In an experiment comparing particle size in corn DDGS, it was found that
28
ATTD of DM and GE were increased by reducing particle size from 818 to 308 µm (Souza
et al., 2012). Saqui-Salces et al. (2017) conducted a study to determine the impact of
particle size as well as different diet compositions that contained soybean meal or DDGS or
soybean hulls on nutrient digestibility. Researchers found no interaction between particle
size and diet composition however, reduced particle size improved feed efficiency for all
diets. The increased feed efficiency was related to improved ATTD of NDF, CP and fat.
The increase in energy digestibility in fibrous ingredients that have low starch content can
be explained by greater disruption of fiber matrix when reducing particle size as nutrients
such as starch, fat and proteins are encapsulated within fiber components (Rojas and Stein,
2017).
However, when diets with smaller particle size are fed to pigs the incidence of
gastric ulcers increases (Kiarie and Mills, 2019). Studies have shown that pigs fed corn and
sorghum ground below 600 μm showed higher gastric ulcer incidents (Cabrera et al., 1993;
Wondra et al., 1995). Interestingly, growth performance was improved even with the
presence of ulcers. Hence, Cabrera et al. (1993) stated that acceptable compromises are
needed. Rojas and Stein (2017) suggested that dietary fiber may reduce the development of
ulcers and reduced particle size of fibrous diets may have less effect on the risk of
developing ulcers. However, no research has been done to confirm this statement.
29
1.5.2 Fiber degrading enzymes (FDE)
Enzymes have been commonly used in animal feed industry since 1925 (Bedford,
2018). In the enzyme market, 60% of enzymes used are phytase followed by 30%
carbohydrase and 10% others (Kiarie et al., 2013b).
As previously presented, NSP can reduce digestibility and performance of pigs but these
effects are dependent on the physicochemical characteristics of the NSP. For example, high
molecular weight arabinoxylan (soluble) and β-glucans can negatively influence
performance due to effects on viscosity, while insoluble NSP such as insoluble
arabinoxylan and cellulose can have a nutrient encapsulating effect (Agyekum and
Nyachoti, 2017). Application of enzymes can alleviate the negative effects of NSP by the
following roles that enzymes have, which are (1) hydrolysis of specific chemical bonds in
feedstuffs, (2) breakdown of cell wall components to eliminate the encapsulation effect on
other nutrients, and (3) solubilisation of insoluble NSP (Kiarie et al., 2016b).
Due to the growing interest of feeding fibrous co-products, the use of exogenous
fiber degrading enzymes (FDE) has received increasing interest and various types of FDE
are commercially available (Kiarie et al., 2016b). Fiber degrading enzymes are used to
breakdown specific NSP or to remove side chains from rigid cell walls (Bedford, 2000)
which can enhance digestibility and performance (Lamsal et al., 2012). The two major FDE
in the market are xylanases and cellulases as most fibrous cereal ingredients contain
arabinoxylans, β-glucan and cellulose therefore, applying specific enzymes to break those
bonds can improve digestibility (Patience et al., 1992; Diebold et al., 2004).
30
1.5.2.1 Xylanase
Xylanase, also called endo-1,4-β-xylanases, that are used to cleave β-1,4-glycosidic
linkage of the xylan backbone from both soluble and insoluble arabinoxylan. This can
potentially result in partial solubilization of insoluble arabinoxylan and breakdown of
soluble arabinoxylan into smaller molecular residues, also referred to as arabinoxylan
oligosaccharides. Xylanase can be produced by various organisms including Aspergillus
oryzae, Aspergillus aculeatus, Humicola insolens, Trichoderma longibrachiatum, Bacillus
subtilis, Penicillium funiculosum, Mycothermus thermophiloides and Thermomyces
lanuginosus (Li et al., 2012). However, biochemically, the majority of xylanases belong to
two main glycoside hydrolase (GH) families, i.e. the GH family 10 and GH family 11. The
GH 10 family comprises plant, fungal and bacterial enzymes, while the GH family 11
family includes fungal and bacterial enzymes (Goesaert et al., 2004; Paloheimo et al.,
2010). Generally, GH 10 enzymes have a greater molecular mass with a ‘salad bowl’-like
shape from a tertiary fold of an (α/β)8 barrel, and family 11 has a ‘β-jelly roll’ structure
that are well-packed with β-sheets (Paloheimo et al., 2010). The different origin, family
and shape of xylanases varies in their substrate specificity. The GH 10 xylanases are less
substrate specific and can hydrolyze substituted xylan to a higher degree compared to GH
11 xylanases which are substrate specific to substrates containing D-xylose (Paloheimo et
al., 2010).
The general concept of application in animal nutrition is that xylanases act upon
arabinoxylans by cleaving glycosidic bonds in the xylan main chain effectively attenuating
the anti-nutritive effect of the fiber structure (Bedford and Schulze, 1998). Indeed, the
31
relationship between the content of dietary arabinoxylans and supplemental xylanase
mediated improvement in nutrient utilization in swine has been demonstrated (Nortey et al.,
2008). Xylanases from different origin can vary in substrate specificities and biochemical
characteristics and therefore animal response. For example, xylanases from different
microbial origins had varied effects on digesta viscosity in broiler chickens, which was
linked to differences in affinity for arabinoxylans (Choct et al., 2004). A xylanase from
Trichoderma reseei exhibited different responses on growth performance, nutrient
utilization and hindgut gut fermentation in broiler chickens and pigs fed diets with corn
DDGS vs WM (Kiarie et al., 2014; Kiarie et al., 2016c). Xylanases of 5 different microbial
origins exhibited differences on growth performance, nutrients digestibility and GIT
microbial activity in pigs fed corn with corn DDGS or wheat with WM diets (Ndou et al.,
2015; Kiarie et al., 2016a; Kiarie et al., 2016c; Zhang et al., 2018b). These studies
indicated that differences associated with the catalytic nature of xylanase, the inclusion
rates, the extent of reduction in nutrient density in the control diet, as well as the source of
dietary fiber could influence the responses seen in animals. It is worth noting that although
FDE like xylanase target well defined substrates, the interpretation of animal responses
across feedstuffs probably suffers from the fact that the knowledge on fiber in swine
nutrition is based on chemical entities defined by analytical methods and ability to
adequately relate analytical measures to fiber utilization from diverse botanical sources is
uncertain. For example, it has been reported that fiber from wheat co-products depressed
growth performance and carcass characteristics more than fiber from corn DDGS whether
32
fed singly or in combination on the basis of NDF concentration in nutritionally balanced
diets (Asmus et al., 2012).
1.5.2.2 Cellulase and β-glucanase
Cellulase is a class of enzymes that can hydrolyse β-1,4-glycosidic bonds to
produce glucose, cellobiose and cello-oligosaccharides (Juturu and Wu, 2014). For
complete cellulose hydrolysis, three cellulases are required: endoglucanases (endo-1,4-β-D-
glucanase, EC 3.2.1.4), cellobiohydrolases (exoglucanase, 1,4-β-D-glucan-
cellobiohydrolase, EC 3.2.1.91) and β-glucosidases or cellobiases (EC 3.2.1.21) (Percival
Zhang et al., 2006; Paloheimo et al., 2010).
The commonly known β-glucanases are endo-acting enzymes (EC 3.2.1.6), cutting
in the middle of the polymer chain and rapidly reducing viscosity, but there is also β-1,3-
1,4-glucanase (lichenase, EC 3.2.1.73), β-1,4-glucanase (cellulase, EC3.2.1.4) and β-1,3-
glucanase (laminarinase, EC 3.2.1.39) (Paloheimo et al., 2010; Patience and Petry, 2019).
Endoglucanases randomly hydrolyze cellulose chains, producing varying length of
cellulose oligomers resulting in new chain ends, while exoglucanases hydrolyze cellulose
chain from the non-reducing end, producing cellobiose. The β-glucosidases completes the
process of cellulose degradation by hydrolyzing short-chain cellulose oligomers and
cellobiose into glucose monomers (Percival Zhang et al., 2006; Juturu and Wu, 2014). The
difference between endo- and exoglucanase is the “structure” as they have the same
function. The exoglucanase has a long tunnel shape, and therefore hydrolyzes the substrate
by threading along. The endoglucanase on the other hand has a shorter loop which allows
33
more direct hydrolysis to intact cellulose chains (Juturu and Wu, 2014). Cellulases are also
grouped into glycoside hydrolases (GH) and can be divided in to ten of the sequence-
derived families (5, 6, 7, 8, 9, 12, 26, 44, 45, 48) and two cellulase-like activity performing
families, 61 and 74 (Schülein, 2000). Endoglucanases are widespread among GH families
such as 5–9, 12, 44, 45, 51, 61, 72, 74 while exoglucanase are largely represented in GH
families 5, 6, 7, 9, 48, and 72 (Juturu and Wu, 2014). Cellulase can be produced by fungi,
bacteria or actinomycetes, but the production from fungi is most common. Most
commercial cellulases are produced from fungi species such as Aspergillus and
Trichoderma (Percival Zhang et al., 2006; Dong et al., 2019).
1.5.3 Liquid feeding
Soaking fibrous ingredients in water prior to feeding provides a favorable
environment for naturally occurring enzymes present in the ingredient to be activated for
short or long periods (Brooks et al., 2001a). Liquid feeding allow for steeping or
fermentation of feed ingredients which can promote production of lactic acid and acetic
acid. Lactic acid and acetic acid reduce the pH, and pH below 4.5 can inhibit pathogenic
bacteria such as coliforms and Salmonella (van Winsen et al., 2001) and can enhance
protein digestion in the stomach (Mikkelsen and Jensen, 1998).
Feeding piglets liquid feed can reduce the incidence of reduced feed intake and/or
anorexia as it is an easier transition from sow’s milk to solid feed. The SCFA contents and
low pH of liquid feed have been shown to reduce pathogens in the pig GIT. Feeding
fermented liquid feed to pigs has also been shown to improve the performance and
34
digestibility of nutrients (Radecko et al., 1988; Missotten et al., 2015). However, results
from many studies of feeding pigs liquid feed have been controversial (Canibe and Jensen,
2012; Wiseman et al., 2017a; Rho et al., 2018b). The inconclusive results may be due to
inconsistency in liquid feed product as many factors such as temperature, time, and species
of microorganisms can influence liquid feed condition. Therefore, it is critical to monitor
and control the liquid feeding system to ensure optimal conditions for controlled
fermentation (Wiseman, 2016).
Good quality liquid feeds can be characterized by three parameters which are: 1)
pH level below 4.5 to prevent pathogens and unwanted organisms (van Winsen et al.,
2001), 2) lactic acid concentrations above 100 mM to reduce Salmonella and E. coli
(Brooks, 2003), and 3) acetic acid concentrations below 40 mM (van Winsen et al., 2001)
as acetic acid has a distinct vinegar taste and smell at high concentrations reducing the
palatability of the feed (Beal et al., 2005). Generally, liquid feed is feed that is mixed with
water at a ratio ranging from 1:1.5 to 1:4. The amount of feed to water ratios should be
considered during mixing as it can influence the pipeline flow of the liquid system, and
pig’s growth performance and digestibility. Optimum ratio for smooth pipeline flow is
considered to be 1 : 2.5 to 1 : 4 (Hurst et al., 2008). Animal performance was not improved
when feed to water ratios of 1 : 1.5 and 1 : 2.5 was used compared to dry feed (Braude and
Rowell, 1967). However, when ratio of 1 : 3 was compared to 1: 1.5, higher ADG and
improved FCR were reported (Hurst et al., 2008). Increasing the water to 1 : 6, reduced the
ADG (Kornegay and Vander Noot, 1968). Therefore, when liquid feeding system is used,
many aspects needs to be carefully monitored.
35
1.6 Fiber degrading enzymes in vivo and in vitro
In vivo and in vitro studies have been conducted to determine the effect of applying
exogenous FDE in fibrous diets for swine. Fiber degrading enzymes can result in a
reduction in the molecular size of the target substrate, thereby reducing intestinal digesta
viscosity, and increasing cell wall degradation that encapsulates nutrients which, in turn,
favors enhanced digestion and absorption of nutrients (Barrera et al., 2004; Masey O'Neill
et al., 2014).
1.6.1 Fiber degrading enzyme in vivo
Feeding weaned pigs a corn-SBM based diet containing DDGS (15 %) with
xylanase and mannose improved ATTD of NDF and ADF while reducing digesta viscosity
(Tiwari et al., 2018). Feeding pigs with diets containing 30 % wheat DDGS with xylanase,
β-glucanase and cellulase improved digestibility of GE, CP, NSP and growth performance
(Emiola et al., 2009a). The addition of multienzyme (β-Glucanase, xylanase, cellulase,
amylase, invertase, mannanase, galactanase, protease) to diets with 30 % DDGS improved
dressing percentage in growing pigs compared to diets with no enzymes. Adding
carbohydrase alone or with phytase in diet containing wheat bran improved apparent ileal
digestibility (AID) of energy, AA and NSP constituents in growing pigs (Zeng et al.,
2018a). Improved AID of NDF and ATTD of GE and N was seen in WM fed pigs when
xylanase was applied (Moran et al., 2016).
Such positive results have been shown in many studies, thus, applying FDE in
swine has gained popularity. However, there are also a number of studies that resulted in
36
no improvement or even reduced digestibility and/or growth performance. In nursery pigs,
supplementing an enzyme mix (xylanase and β-glucanase) to a corn-SBM diet decreased
growth performance (Jones et al., 2010). Nutrient digestibility and growth performance
were not improved when xylanase was supplement in DDGS-based diets fed to growing
pigs (Widyaratne et al., 2009; Yáñez et al., 2011; Asmus et al., 2012), and applying multi-
enzyme (xylanase, amylase, protease) with phytase in a diets containing WM did not
improve growth performance nor digestibility in growing pigs (Olukosi et al., 2007).
There are multiple commercially available FDE. Kerr et al. (2013) conducted a
study to determine the effect of different commercial FDE mixes on growth performance
and nutrient digestibility in starter and finishing pigs fed 30% DDGS diet. Researchers
found no improvement in performance, and nutrient digestibility was inconsistent among
different products. Inconsistent results may be due to multiple factors that include age of
pigs, health status, inclusion levels of fibrous ingredients and enzymes, efficacy of
supplemented enzymes, feed processing, and the housing environment (Rojas and Stein,
2017).
A summary of enzyme effects on growing-finishing pigs from different studies is
shown in Table 4. More consistent enzyme responses such as improved performance and
digestibility have been seen in wheat, rye, oat, and barley-based diets compared to corn
based diets (Abelilla and Stein, 2019). Ingredients such as wheat, rye, oat and barley
generally have higher concentrations of water soluble NSP compared to corn (Bao et al.,
2013). These soluble NSP can increase viscosity of digesta and alter the intestinal transit
time, which could negatively influence digestibility and performance. The addition of FDE
37
can improve nutrient availability for swine by reducing viscosity in such NSP, particularly
arabinoxylans and β-glucans (Masey O'Neill et al., 2014). Thus, the enzyme effect may be
more consistent in ingredients that tend to be more viscous (Bao et al., 2013). Another
reason for less response to FDE in corn-based diets may be due to the arabinoxylans in
corn and its co-products (e.g. DDGS), as it can be lignified, highly branched, and linked to
structural proteins. This makes it difficult for microbial and exogenous enzymes to ferment
compared to wheat and wheat co-products (e.g. WM) (Abelilla and Stein, 2019).
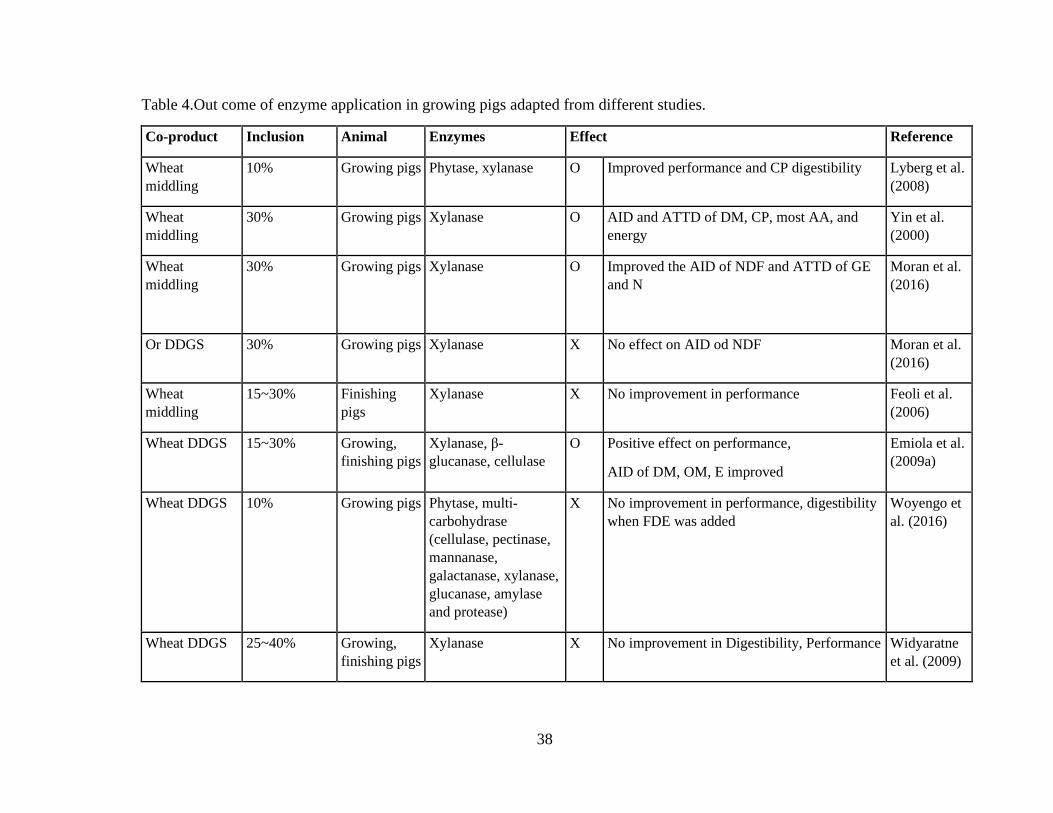
38
Table 4.Out come of enzyme application in growing pigs adapted from different studies.
Co-product Inclusion Animal Enzymes Effect Reference
Wheat
middling
10% Growing pigs Phytase, xylanase O Improved performance and CP digestibility Lyberg et al.
(2008)
Wheat
middling
30% Growing pigs Xylanase O AID and ATTD of DM, CP, most AA, and
energy
Yin et al.
(2000)
Wheat
middling
30% Growing pigs Xylanase O Improved the AID of NDF and ATTD of GE
and N
Moran et al.
(2016)
Or DDGS 30% Growing pigs Xylanase X No effect on AID od NDF Moran et al.
(2016)
Wheat
middling
15~30% Finishing
pigs
Xylanase X No improvement in performance Feoli et al.
(2006)
Wheat DDGS 15~30% Growing,
finishing pigs
Xylanase, β-
glucanase, cellulase
O Positive effect on performance,
AID of DM, OM, E improved
Emiola et al.
(2009a)
Wheat DDGS 10% Growing pigs Phytase, multi‐
carbohydrase
(cellulase, pectinase,
mannanase,
galactanase, xylanase,
glucanase, amylase
and protease)
X No improvement in performance, digestibility
when FDE was added
Woyengo et
al. (2016)
Wheat DDGS 25~40% Growing,
finishing pigs
Xylanase X No improvement in Digestibility, Performance Widyaratne
et al. (2009)
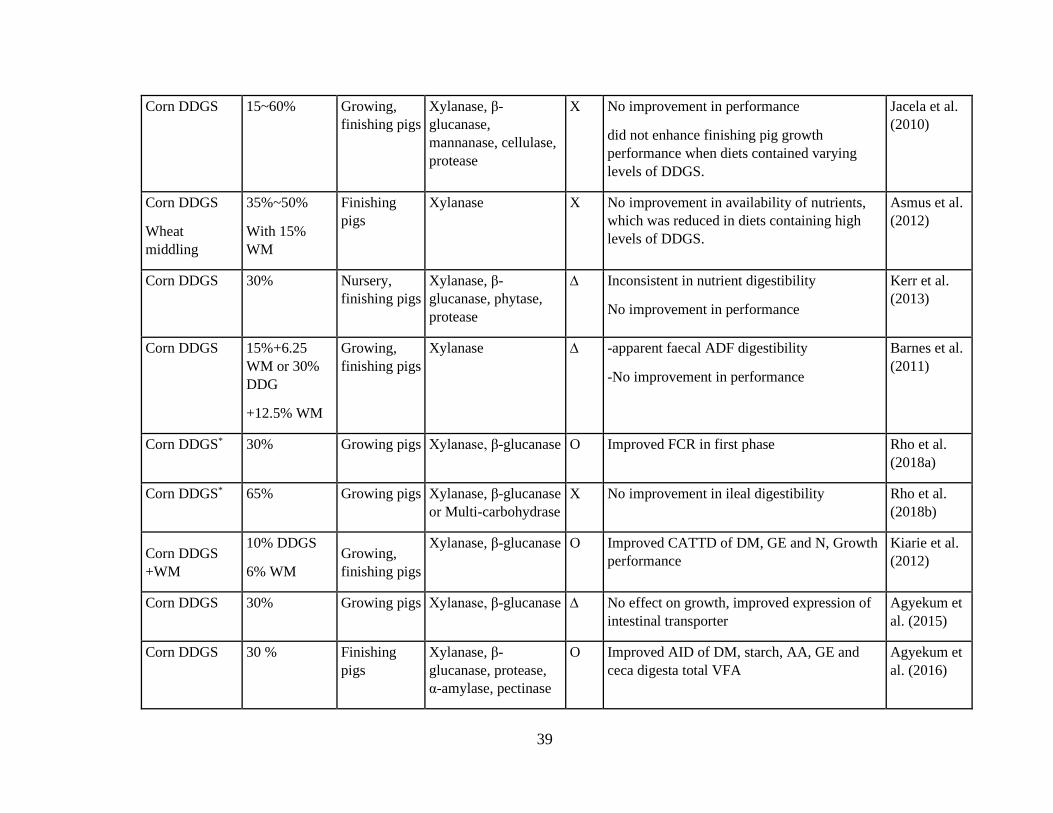
39
Corn DDGS 15~60% Growing,
finishing pigs
Xylanase, β-
glucanase,
mannanase, cellulase,
protease
X No improvement in performance
did not enhance finishing pig growth
performance when diets contained varying
levels of DDGS.
Jacela et al.
(2010)
Corn DDGS
Wheat
middling
35%~50%
With 15%
WM
Finishing
pigs
Xylanase X No improvement in availability of nutrients,
which was reduced in diets containing high
levels of DDGS.
Asmus et al.
(2012)
Corn DDGS 30% Nursery,
finishing pigs
Xylanase, β-
glucanase, phytase,
protease
∆ Inconsistent in nutrient digestibility
No improvement in performance
Kerr et al.
(2013)
Corn DDGS 15%+6.25
WM or 30%
DDG
+12.5% WM
Growing,
finishing pigs
Xylanase ∆ -apparent faecal ADF digestibility
-No improvement in performance
Barnes et al.
(2011)
Corn DDGS* 30% Growing pigs Xylanase, β-glucanase O Improved FCR in first phase Rho et al.
(2018a)
Corn DDGS* 65% Growing pigs Xylanase, β-glucanase
or Multi-carbohydrase
X No improvement in ileal digestibility Rho et al.
(2018b)
Corn DDGS
+WM
10% DDGS
6% WM
Growing,
finishing pigs
Xylanase, β-glucanase O Improved CATTD of DM, GE and N, Growth
performance
Kiarie et al.
(2012)
Corn DDGS 30% Growing pigs Xylanase, β-glucanase ∆ No effect on growth, improved expression of
intestinal transporter
Agyekum et
al. (2015)
Corn DDGS 30 % Finishing
pigs
Xylanase, β-
glucanase, protease,
α-amylase, pectinase
O Improved AID of DM, starch, AA, GE and
ceca digesta total VFA
Agyekum et
al. (2016)
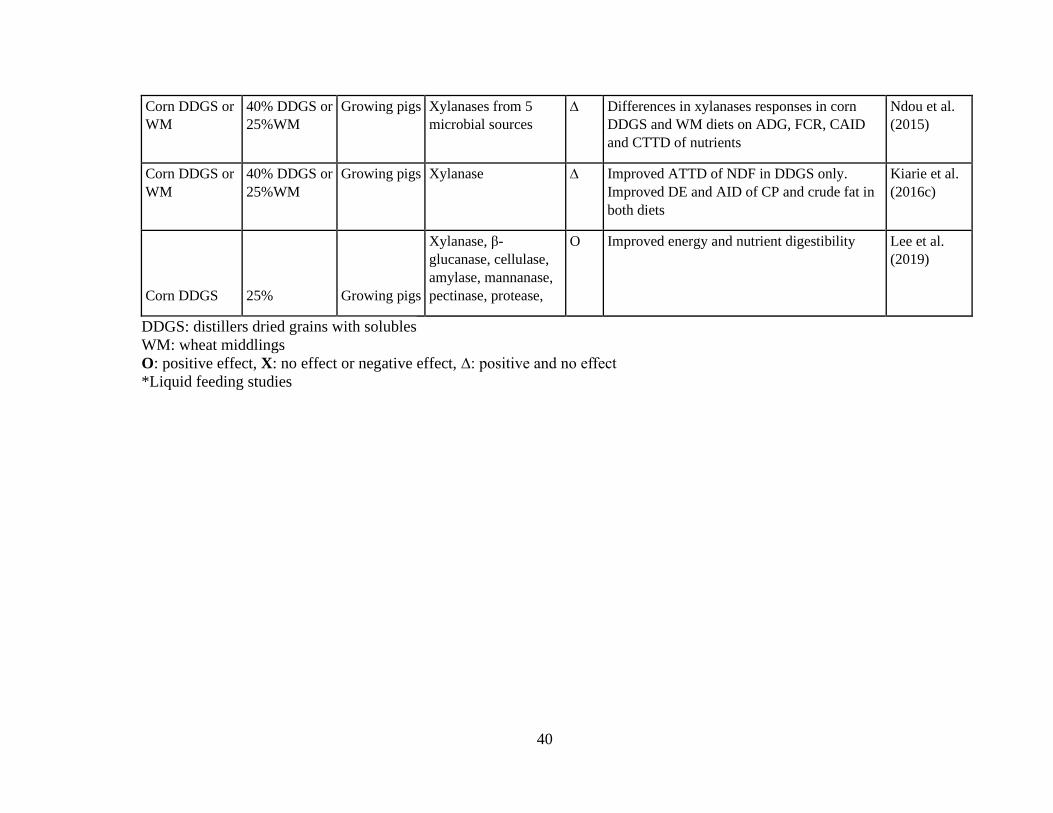
40
Corn DDGS or
WM
40% DDGS or
25%WM
Growing pigs Xylanases from 5
microbial sources
∆ Differences in xylanases responses in corn
DDGS and WM diets on ADG, FCR, CAID
and CTTD of nutrients
Ndou et al.
(2015)
Corn DDGS or
WM
40% DDGS or
25%WM
Growing pigs Xylanase ∆ Improved ATTD of NDF in DDGS only.
Improved DE and AID of CP and crude fat in
both diets
Kiarie et al.
(2016c)
Corn DDGS 25% Growing pigs
Xylanase, β-
glucanase, cellulase,
amylase, mannanase,
pectinase, protease,
O Improved energy and nutrient digestibility Lee et al.
(2019)
DDGS: distillers dried grains with solubles
WM: wheat middlings
O: positive effect, X: no effect or negative effect, ∆: positive and no effect
*Liquid feeding studies
41
1.6.2 In vitro digestibility method to determine FDE effect
The in vitro digestibility methods can mimic the pig’s GIT, therefore have been
increasingly used to predict the digestibility of nutrients in various feedstuffs (Graham et
al., 1989; Regmi et al., 2008; Jaworski et al., 2015). The benefit of using in vitro
digestibility methods is that they are less expensive, fast, reproducible and have less ethical
concerns compared to in vivo studies (Coles et al., 2005; Regmi et al., 2008; Hasjim et al.,
2010). The methods to determine in vitro digestibility are modified from a procedure
developed by Boisen and Fernández (1997) which involves inclusion of exogenous
enzymes or inoculum to simulate hindgut digestion after pepsin and pancreatin digestion
(3-step in vitro method). The exogenous enzyme that can be used are Viscozyme®, which is
a multi-enzyme complex containing carbohydrases, or cellulase alone. However, it has
been found that using fecal inoculum is a better option than exogenous enzymes
(Viscozyme® or cellulase) to study disappearance of DM during in vitro hindgut
digestibility (Regmi et al., 2009; Urriola, 2010).
A summary of enzyme effects on cereal grains and coproducts are shown in Table
5. Results from using the in vitro method showed that xylanase increased wheat NSP
degradation, and combination with cellulose further increased the effect (Tervilä-Wilo et
al., 1996). Applying an enzyme mix (β-glucanase, xylanase and cellulase) to barley in an in
vitro study increased the in vitro digestibility of DM, CP, and crude fiber (Li et al., 2004).
Vangsøe et al. (2020) performed an in vitro digestion study with wheat, corn, and rice
using FDE, resulting in solubilization of NSP in wheat, corn, and rice grains however, the
FDE effect on wheat was greater than in corn and rice. Park et al. (2016a) also found
improved in vitro ileal digestibility (IVID) of DM in wheat but not in corn when xylanase
42
was added. The better effectiveness in wheat than in corn can be explained by the
abovementioned physiochemical characteristics of the two grains. However, in a different
study, IVID of DM was increased with enzymes in both corn and wheat, but in vitro total
tract digestibility (IVTTD) of DM was only improved in corn (Park et al., 2016b). Kong et
al. (2015) tested 9 ingredients in a in vitro digestibility method and found increased or
numerically greater IVID of DM in corn, wheat, barley, copra meal, palm kernel meal,
cottonseed meal, and in DDGS when an enzyme mix (xylanase, protease and phytase) was
applied.
Unlike in whole grains, when FDE were tested on co-products, the results were not
as consistent, which can be explained by lower concentration of readily digestible starch
compared to whole grains (Bindelle et al., 2011; Vangsøe et al., 2020), the higher NSP
concentration and complex structure of co-products. For example, IVIDM was not
improved in corn DDGS, WDG, or wheat bran (Bindelle et al., 2011; de Vries et al., 2013;
Park et al., 2016b; Zangaro, 2018; Vangsøe et al., 2020). Also, the total SCFA and gas
production were different from study to study. Increased gas, acetate, propionate, total
SCFA production was seen when enzymes (xylanase and mannanase) were added to DDGS
(Tiwari et al., 2018), but enzyme addition in wheat bran reduced the total SCFA production
in a study by Bindelle et al. (2011). The reason for different outcomes may be due to
different enzyme mixes that were used, the compositional differences among the co-
products, and differences in the modification of experiments.
After conducting an in vitro study to determine the enzyme (xylanase, mannanase
and protease) effect, Park et al. (2016a) tested the enzymes in pigs fed barley, corn or
wheat diets and found no difference in digestible and metabolizable energy. It is important
43
to understand that there are limitations when using in vitro digestibility method, as it does
not account for on-going SCFA production and absorption like in vivo, duration of
fermentation may be different in vivo (Jha and Zijlstra, 2019), and the fact that the
enzymatic reaction in the in vitro digestion method is homogeneous compare to in vivo
digestion which is more heterogeneous environment (different section of intestine,
enzymes, microbiome) (Hasjim et al., 2010).
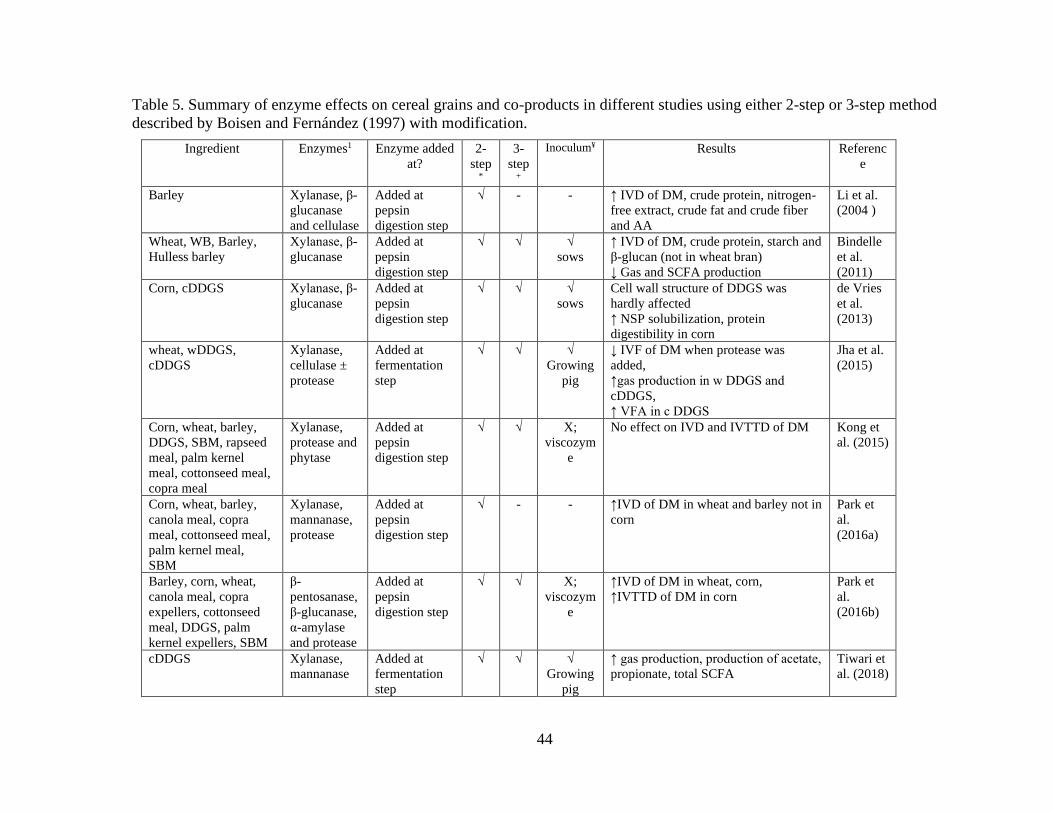
44
Table 5. Summary of enzyme effects on cereal grains and co-products in different studies using either 2-step or 3-step method
described by Boisen and Fernández (1997) with modification.
Ingredient Enzymes1 Enzyme added
at?
2-
step*
3-
step+
Inoculum¥ Results Referenc
e
Barley Xylanase, β-
glucanase
and cellulase
Added at
pepsin
digestion step
√ - - ↑ IVD of DM, crude protein, nitrogen-
free extract, crude fat and crude fiber
and AA
Li et al.
(2004 )
Wheat, WB, Barley,
Hulless barley
Xylanase, β-
glucanase
Added at
pepsin
digestion step
√ √ √
sows
↑ IVD of DM, crude protein, starch and
β-glucan (not in wheat bran)
↓ Gas and SCFA production
Bindelle
et al.
(2011)
Corn, cDDGS Xylanase, β-
glucanase
Added at
pepsin
digestion step
√ √ √
sows
Cell wall structure of DDGS was
hardly affected
↑ NSP solubilization, protein
digestibility in corn
de Vries
et al.
(2013)
wheat, wDDGS,
cDDGS
Xylanase,
cellulase ±
protease
Added at
fermentation
step
√ √ √
Growing
pig
↓ IVF of DM when protease was
added,
↑gas production in w DDGS and
cDDGS,
↑ VFA in c DDGS
Jha et al.
(2015)
Corn, wheat, barley,
DDGS, SBM, rapseed
meal, palm kernel
meal, cottonseed meal,
copra meal
Xylanase,
protease and
phytase
Added at
pepsin
digestion step
√ √ X;
viscozym
e
No effect on IVD and IVTTD of DM Kong et
al. (2015)
Corn, wheat, barley,
canola meal, copra
meal, cottonseed meal,
palm kernel meal,
SBM
Xylanase,
mannanase,
protease
Added at
pepsin
digestion step
√ - - ↑IVD of DM in wheat and barley not in
corn
Park et
al.
(2016a)
Barley, corn, wheat,
canola meal, copra
expellers, cottonseed
meal, DDGS, palm
kernel expellers, SBM
β-
pentosanase,
β-glucanase,
α-amylase
and protease
Added at
pepsin
digestion step
√ √ X;
viscozym
e
↑IVD of DM in wheat, corn,
↑IVTTD of DM in corn
Park et
al.
(2016b)
cDDGS Xylanase,
mannanase
Added at
fermentation
step
√ √ √
Growing
pig
↑ gas production, production of acetate,
propionate, total SCFA
Tiwari et
al. (2018)
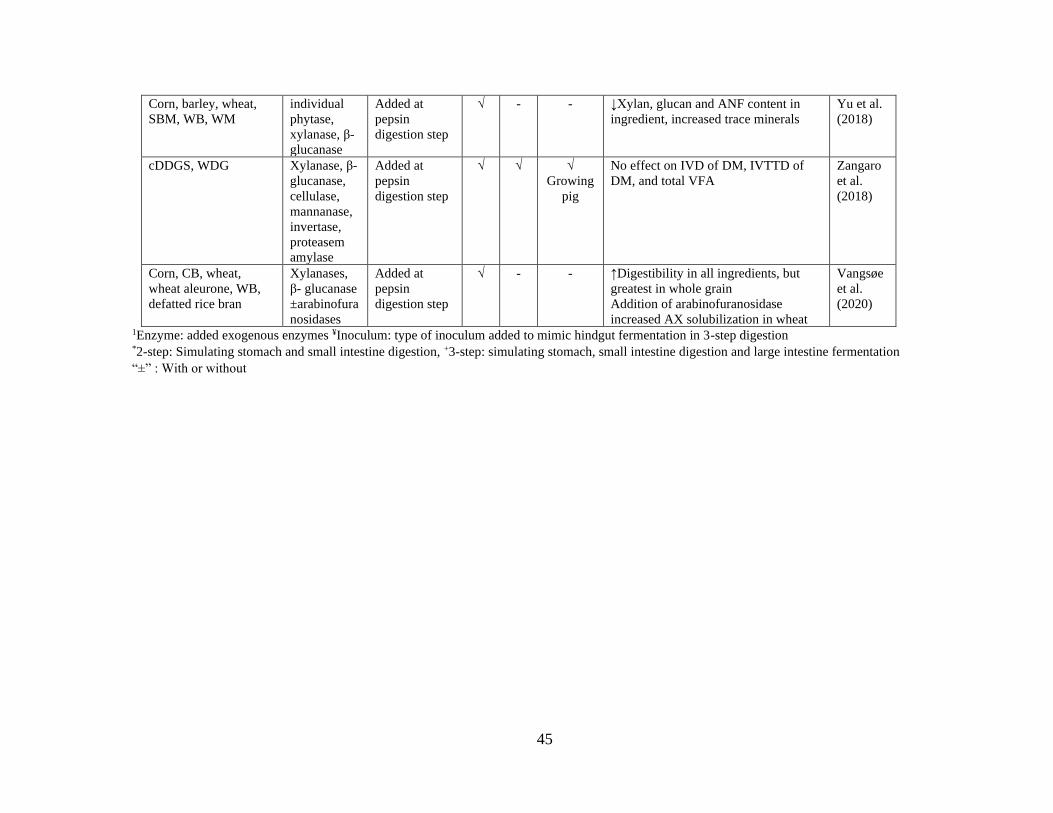
45
Corn, barley, wheat,
SBM, WB, WM
individual
phytase,
xylanase, β-
glucanase
Added at
pepsin
digestion step
√ - - ↓Xylan, glucan and ANF content in
ingredient, increased trace minerals
Yu et al.
(2018)
cDDGS, WDG Xylanase, β-
glucanase,
cellulase,
mannanase,
invertase,
proteasem
amylase
Added at
pepsin
digestion step
√ √ √
Growing
pig
No effect on IVD of DM, IVTTD of
DM, and total VFA
Zangaro
et al.
(2018)
Corn, CB, wheat,
wheat aleurone, WB,
defatted rice bran
Xylanases,
β- glucanase
±arabinofura
nosidases
Added at
pepsin
digestion step
√ - - ↑Digestibility in all ingredients, but
greatest in whole grain
Addition of arabinofuranosidase
increased AX solubilization in wheat
Vangsøe
et al.
(2020)
1Enzyme: added exogenous enzymes ¥Inoculum: type of inoculum added to mimic hindgut fermentation in 3-step digestion *2-step: Simulating stomach and small intestine digestion, +3-step: simulating stomach, small intestine digestion and large intestine fermentation
“±” : With or without
46
1.7 Conclusion
The use of co-products from the biofuel and milling industries have been increasing
in swine diets. This results in higher fiber concentration in swine rations, as co-products
generally have greater fiber contents. The high fiber content influences the digestibility and
fermentation rate in the GIT, and although less efficient than upper gut digestion, the end-
product i.e., SCFA, from hindgut fermentation can provide energy to the animal. The
limitation that pigs have in utilizing fiber sources is clear, as pigs do not secrete digestive
enzymes that can breakdown fiber fractions. Therefore, to improve the feeding value of
fibrous ingredients, many feeding strategies have been suggested, such as reducing particle
size, liquid feeding, and exogenous enzyme application.
Applying FDE has been widely used in fibrous diets in order to break down fiber
components. However, the results of applying FDE are not always positive. The reason for
such inconsistency is unclear, however, the diverse and complex structure of fiber as
described in the literature review may be one of the reasons. Furthermore, enzymes are
substrate-specific, therefore, understanding the fiber components of the ingredients can aid
with better enzyme selection. To determine the effects of adding FDE to fibrous
ingredients, the in vitro method has been increasingly used since it is less costly, faster and
reproducible compared to in vivo methods. The in vitro method from Boisen and Fernández
(1997) mimics the stomach, upper gut and lower gut digestion by applying acids and
enzymes or fecal inoculum although there are some pitfalls, as described above. Thus, the
positive effects that may be seen in an in vitro study may not accurately reflect what will
happen in vivo.
47
Therefore, the scope of this thesis was to investigate FDE effects when applied to raw
ingredients in vitro and undigested digesta content from pigs, followed by a pig
performance study.
48
2 CHAPTER TWO. RESEARCH HYPOTHESIS AND OBJECTIVES
It is hypothesized that supplementing exogenous fiber degrading enzymes (FDE) in
corn distillers dried grains with solubles (DDGS) and wheat middlings (WM) will result in
a more favorable fiber hydrolysis while increasing the monosaccharide availability. The
overall objective is to determine the effects of supplementing an FDE mix to DDGS and
WM in vitro, in vivo-in vitro and in vivo. The specific hypothesis and objectives for each
experiment are as follows:
Experiment one (in vitro)
Hypothesis: Fiber hydrolysis will be increased in DDGS and WM, by applying a
combination of FDE and protease relative to what is observed for FDE or protease alone.
Objective: To determine the effects of applying FDE mix (xylanase, β-glucanase, and
cellulase) with or without protease to DDGS or WM on the release of monosaccharides,
fermentation, and apparent disappearance of fiber fractions.
Experiment two (in vivo- in vitro)
Hypothesis: Undigested fiber fractions from ileal digesta will be hydrolyzed more
effectively, releasing more monosaccharides with the addition of FDE mix compared to
only adding xylanase alone or no enzymes, and WM digesta will have a better response to
FDE.
Objective: 1) To determine the effect of applying FDE or xylanase alone to ileal digesta
collected from pigs fed DDGS or WM diets, 2) to determine whether FDE will have a
49
different response on the digesta from co-products from different cereal grains (corn vs
wheat).
Experiment three (in vivo)
Hypothesis: Fiber degrading enzymes will enhance performance of pigs by improving fiber
digestibility and hydrolysis across the GIT in DDGS and WM based diets. Furthermore,
supplemented enzyme activity will decrease across the GIT.
Objective: to determine growth performance, apparent digestibility of fiber, gastrointestinal
weight and digesta concentration of xylanase, organic acids, monosaccharides in pigs fed
corn and DDGS or wheat and WM-based diets without or with FDE.
50 Published.
Y. Rho, R. Patterson, I. Joye, M. Martinez, J. E. Squires and E. Kiarie. Journal of Translational
Animal Science 2020. Volume 4, Issue 3, July 2020, txaa153, https://doi.org/10.1093/tas/txaa15350
3 CHAPTER THREE. Fiber degrading enzyme increased monosaccharides release
and fermentation in corn distillers dried grains with solubles and wheat
middlings steeped without or with protease
3.1 Abstract
Treating fibrous feed ingredients with exogenous feed enzymes may improve their
utilization in monogastric animals. An in vitro study was conducted to determine the
effects of steeping corn distillers dried grains with solubles (DDGS) or wheat middlings
(WM) with exogenous feed enzymes. Four treatments were arranged as follows: 1) co-
product steeped with water (CON), 2) CON plus 0.5 g fiber degrading enzymes (FDE), 3)
CON plus 0.5 g protease (PRO), and 4) CON plus 0.5 g FDE and 0.5 g PRO (FDEPRO).
The FDE contained about 62,000, 37,000, and 8,000 U/g of xylanase, cellulase, and β-
glucanase, respectively whereas activities in PRO amounted to 2,500,000, 1,300,000 and
800,000 U/g of acid, alkaline and neutral proteases, respectively. Briefly, 50 g of DDGS or
WM samples (n=8) were mixed with 500 mL water with or without enzymes and steeped
for 0 to 72 h at 37℃ with continuous agitation. The pH, concentration of monosaccharides,
and organic acids in the supernatant and apparent disappearance (AD) of fiber in solids
were measured at 0, 12, 24, 48, and 72 h. There was treatment and time interaction
(P<0.005) on monosaccharides concentration. At 12 h, arabinose and glucose
concentrations were similar (P>0.05) between FDE and FDEPRO but higher (P=0.002)
than for CON in DDGS. At 12 h, FDE and FDEPRO had higher (P<0.001) xylose
51
concentration than CON and PRO in WM whereas glucose concentration was higher (P <
0.001) for enzymes than CON in WM. At 24 h, FDEPRO had higher (P < 0.001) xylose
concentration than CON in WM whereas xylose concentration for FDE and PRO was
intermediate. There was an interaction (P < 0.05) between treatment and time effect on
lactic acid concentration in DDGS and WM (P < 0.005), and acetic acid concentration in
WM (P < 0.001). In general, monosaccharides concentration was higher between 12 and 24
h and decreased after 48 h, whereas the pH decreased, and concentration of organic acids
increased continuously over time (P < 0.05). The AD of NDF and ADF in DDGS was
greater (P = 0.001) for FDE and FDEPRO than CON and PRO at 72 h. In WM, enzymes
increased (P = 0.007) AD of NDF relative to CON at 72 h. Nonetheless, greater (P < 0.05)
AD of fiber was observed between 48 and 72-h. In conclusion, although there were
differences in responses among co-products, fiber degrading enzymes increased the release
of fermentable monosaccharides from co-products at 12 to 24 h of steeping and these
effects were not extended with the addition of protease.
Key words: Distillers dried grains with solubles, fiber degrading enzymes and protease,
pre-treatment, fiber solubilization, fermentation, wheat middlings
52
3.2 Introduction
Utilization of co-products such as corn distillers dried grains with solubles (DDGS)
and wheat middlings (WM) in monogastric farm animal diets has become more common
(Woyengo et al., 2014). Compared with cereal grains, these co-products have higher
contents of crude protein and fat concentrations (Casas et al., 2018; Loy and Lundy, 2019).
However, they are fiber-rich, a property that negatively influences digestion resulting in
decreased feed efficiency (Urriola et al., 2010; Rosenfelder et al., 2013). The major fiber
fractions in cereal co-products are arabinoxylans, cellulose, and mixed-linkage β-glucans
(de Lange, 2000; Jaworski et al., 2015). Monogastric animals such as pigs and poultry do
not secrete endogenous fibrolytic enzymes to degrade fiber and exhibit variable microbial
fermentation in the hindgut (Choct et al., 1996; Jorgensen et al., 1997). The gastrointestinal
tract is colonized with diverse microbiota, and the different exogenous and endogenous
substrates that are available for fermentation results in various metabolites (Brooks et al.,
2011; Brestenský et al., 2017). It has been shown that less than 40% of the fiber in cereal
co-products is fermentable (Just et al., 1983; Jaworski and Stein, 2017). The high
concentration of insoluble relative to soluble fiber is the main challenge to utilization of
fibrous cereal co-products in monogastric animals because insoluble fiber fractions are
hydrophobic, crystalline and recalcitrant to microbial fermentation (Bach Knudsen, 2011;
Bach Knudsen, 2014). In addition, cereal fiber has a complex structure as it is formed as
heteropolysaccharides with varying substituent groups (Paloheimo et al., 2010). Therefore,
the various monosaccharide composition and linkages that are involved determines the
functional properties and physiological effects of different dietary fiber sources (Cui et al.,
2011).
53
Soaking these fibrous co-products with exogenous fiber degrading enzymes (FDE)
allows pre-digestion of the fibrous substrates. Liquid feeding has been reported to improve
feed efficiency in pigs compared with dry feeding (Lyberg et al., 2006; Hurst et al., 2008).
Further improvement in feed efficiency was achieved by applying FDE to fermented or
non-fermented liquid feed compared with the control feed (Rho et al., 2018b). The results
of this study suggested that FDE could be a good strategy to solubilize insoluble fiber
fractions to enhance fermentability in the animal’s large intestine. For example, steeping
undigested ileal contents collected from pigs fed 96 % corn or wheat DDGS diet with
xylanase (2,000 to 20,000 U/kg) increased release of soluble arabinoxylans in a dose
dependent manner irrespective of substrate source (Walsh et al., 2016). However, the
results of liquid feeding with enzymes vary with different feedstuffs. When pigs were fed
liquid steeped DDGS or WM based diets, an improved digestibility of NDF was observed
in DDGS steeped with xylanase compared with DDGS steeped without xylanase (Moran et
al., 2016). However, there was no effect of xylanase in steeped WM (Moran et al., 2016).
It is imperative to select and match enzymes used during steeping to target specific
polysaccharides, as dietary fiber structure and composition may vary widely (Jaworski et
al., 2015; Kiarie et al., 2016b). Moreover, steeping time is also an important factor as time
can change the nutrient and microbial profile of the liquid feed. High lactic acid
concentrations and low pH is considered an ideal liquid feed (Brooks et al., 2003). Mixing
feed or ingredient with water alone is not enough to reach these parameters. Previous
studies reported that higher lactic acid concentration in liquid feed resulted from steeping
for 10 to 72 hours (Brooks et al., 2001b; Wiseman, 2016). However, to achieve ideal liquid
feed, careful monitoring is required to prevent unwanted pathogen growth as such
54
contaminants may lead to production of high acetic or ethanol instead of lactic acid
(Missotten et al., 2015).
Plant cell walls are mainly composed of cellulose microfibrils that are intertwined
with hemicellulose, lignin, and structural proteins (Berglund et al., 2016). In co-products,
the proportion of cell wall material is significantly greater than in the parent grains (Stein
and Shurson, 2009). Corn and wheat DDGS subjected to in vitro digestion and
fermentation simulation without or with a mixture of FDE and protease revealed aggregates
of protein-fiber-starch matrix material in both DDGS types as well as different responses to
the enzyme application (Jha et al., 2015). Microscopy visualization revealed DDGS was
more porous than WM, making enzymes more effective (Jha et al., 2015). These results
suggested that applying a combination of FDE and protease may be more effective in
breaking down complex structures. This research is in its infancy and additional screening
of FDE and protease activities are required with the aim of developing specific enzyme
products to be supplemented to the feed to increase fiber solubilization.
The objective of the present study was to determine the effect of applying FDE
containing xylanase, β-glucanase, and cellulase activities with or without protease in
steeped DDGS or WM on the release of monosaccharides, fermentation, and apparent
disappearance (AD) of fiber fractions. It was hypothesized that fiber hydrolysis will be
increased by applying a combination of FDE and protease relative to what is observed for
FDE or protease alone.
55
3.3 Materials and methods
3.3.1 Feed ingredient samples and treatments
The sample of DDGS used was from IGPC Ethanol Inc. (Aylmer, ON, Canada) and
corn, wheat and WM samples from Floradale Feed Mill Limited (Floradale, ON, Canada).
The samples were used as received, without further processing. The mean particle size and
SD of DDGS and WM were 271.80 ± 6.58 µm and 203.05 ± 9.86 µm, respectively. Each
co-product (DDGS and WM) was tested in an independent experiment. Four treatments
were tested per co-product: 1) co-product steeped with water excluding enzymes (CON), 2)
CON with 0.5 g FDE (FDE) 3) CON with 0.5 g protease (PRO) 4) CON with 0.5 g FDE
and 0.5 g protease (FDEPRO). This was in alignment with the manufacturer
recommendation of the substrate to enzyme ratio. Enzyme activities in FDE were 62,000
U/g of xylanase, 8,000 U/g of β-glucanase and 37,000 U/g of cellulase. The enzyme
activity for PRO were 2,500,000 U/g of acid protease, 800,000 U/g of neutral protease, and
1,300,000 U/g of alkaline protease. The enzyme mixtures and enzyme activity data were
provided by Canadian Bio-systems Inc. (Calgary, AB, Canada).
3.3.2 Experimental procedures
In sterile plastic bottles, 50 g of DDGS or WM was weighed, and hand mixed with
500 mL of deionized water with or without enzymes. The bottles were sealed tightly with
their screw cap to limit additional air coming into the bottle. The samples were incubated in
a semi-aerobic condition as no additional gas was flushed into the headspace of bottles.
Samples were aliquoted to individual bottles for time points: 0, 12, 24, 48, and 72 h. A total
of 4 batches of steeping was conducted with 2 bottles per treatment per batch resulting to 8
56
bottles per treatment at each time point. At time point 0 h, the pH was measured
immediately after hand mixing using Fisher Scientific Accumet AB 150 pH meter (Fisher
Scientific, Toronto, ON, Canada) standardized with certified pH 4.0, 7.0 and 10.0 buffer
solutions (Fisher Scientific, Toronto, ON, Canada) and the bottles stored at 4℃ for the
solids to settle for 12 h. The mixtures for time points 12 up to 72 h were incubated at 37℃
with continuous agitation (200 rpm) using a floor incubator (Controlled Environment
Incubator Shaker, New Brunswick Scientific, Enfield, CT, USA). At their assigned time
points, bottles were withdrawn from the incubator, hand mixed, pH read and stored at 4℃
for the solids to settle for 12 h. After the solids were settled, the supernatant was carefully
transferred into a 15-mL centrifuge tube and centrifuged at 30,000 g for 15 min at 4℃.
Aliquots of the supernatant were transferred into 2-mL tubes and were stored at -20˚C for
organic acid and monosaccharides analyses. After the supernatant was sampled the
remaining solids and supernatant in the bottle were mixed and transferred into an
aluminum container and were freeze dried. After freeze-drying, the samples were weighed
to calculate the AD of dry matter (DM) and fiber components (neutral detergent fiber, NDF
and acid detergent fiber, ADF) post-steeping.
3.3.3 Sample Processing and Laboratory Analyses
The DDGS and WM samples were analyzed for particle size using Ro-Tap Sieve®
Shaker (W.S. TylerRX-30E model, Hoskin Scientific Ltd, Burlington, ON, Canada).
Freeze dried samples of steeped DDGS, WM, and independent corn and wheat grain
samples were finely ground (< 1 mm) with a coffee grinder (KitchenAid, Benton Harbor,
MI). Corn grain, DDGS, wheat grain, and WM were analyzed for DM, ash, crude fat, crude
57
protein (CP), NDF ADF, sugar monomers and glycosyl linkages. The freeze-dried steeped
co-products were analyzed for DM, NDF and ADF. The supernatant of steeped DDGS and
WM were analyzed for concentration of organic acids (lactic and acetic) and
monosaccharides (arabinose, xylose, and glucose). Dry matter was determined using
method 930.15 (AOAC, 2004) and ash content was determined according to method
942.05 (AOAC, 2004). Crude fat content was analyzed using an ANKOM XT 20 Extractor
(Ankom Technology, Macedon, NY, USA). Nitrogen was determined with a CNS-2000
carbon, N, and sulfur analyzer (Leco Corporation, St. Joseph, MI, USA) according to the
combustion method 968.06 (AOAC, 2004). Crude protein values were calculated by
multiplying the analyzed N values by 6.25 (AOAC, 2004). Neutral detergent fiber and
ADF concentrations were measured by using the Ankom 200 Fiber Analyzer (Ankom
Technology, Macedon, NY, USA) according to Van Soest et al. (1991).
Monosaccharides and glycosyl linkage characterization were carried out using the
method described by Pettolino et al. (2012). Monosaccharides were analyzed with gas
chromatography equipped with a capillary column SP-2330 (SUPELCO, Bellefonte, PA).
Briefly, prior to sample analysis, hydrolysis was conducted with 2.50 M trifluoroacetic acid
for 90 min followed by a reduction in a 1.00 M sodium borodeuteride mixed with 2.00 M
ammonium hydroxide and an acetylation reaction. The gas chromatography–mass
spectrometry (GC-MS) conditions were as follows: injector volume, 2.0 μL; injector
temperature, 240°C; detector temperature, 300°C; carrier gas (helium), velocity 1.9 m/s;
split ratio, 1:2; temperature program over the elution profile was 160°C for 6 min, then
4°C/min to 220°C for 4 min, then 3°C/min to 240°C for 5 min, and then 11°C/min to
255°C for 5 min. The glycosyl-linkage characterization was performed by GC–flame
58
ionization detector–MS (7890A and 5975C inert mass selective detector with a Triple-Axis
detector, Agilent Technologies, Inc., Santa Clara, CA) on a SP-2330 capillary column SP-
2330 (SUPELCO, Bellefonte, PA). Samples were partially methylated and subsequently
hydrolyzed with 2.00 M trifluoroacetic acid. Partially methylated residues were analyzed as
partially methylated alditol acetates. The GC-MS was set as follows for analysis: injector
volume, 1 μl; injector temperature, 240°C; detector temperature, 300°C; carrier gas
(helium), velocity of 1.9 m/s; split ratio, 100:1; temperature program was 100°C for 2 min,
and then 8 °C/min to 240°C for 20 min.
Concentrations of organic acids (lactic and acetic acid) and monosaccharides
(arabinose, xylose and glucose) in supernatants of steeped co-products were analyzed using
high-performance liquid chromatography (HPLC) (Agilent 1100 Series, Agilent
Technologies, Santa Clara, CA, USA) (Leung et al., 2018). Briefly, samples were thawed
to room temperature, vigorously mixed by vortexing and subsequently centrifuged at
30,000 g for 15 minutes. An aliquot of 160 µL was mixed with 640 µL of 0.005 N H2SO4
and then filtered with a 13mm syringe filter (Fisher Scientific, Toronto, ON, Canada) and
transferred to HPLC vials. Prepared samples were separated over a 300 x 7.8 mm 8µ
Rezex™ ROA-Organic Acid H+ (8%) column (Phenomenex, Torrance, CA, USA). The
HPLC was set as follows for analysis: column temperature, 60°C; injection volume, 20μl;
refractive index detector (Agilent 1100 Series, Agilent Technologies, Santa Clara, CA,
USA) temperature, 400°C; mobile phase (0.005 N sulfuric acid) velocity, 0.5ml/min; cycle
time 45 min. The retention times for lactic and acetic acid, glucose, xylose and arabinose
were found to be 16.9, 19.9, 12.5, 13.4 and 14.4 min, respectively.
59
3.3.4 Calculations and statistical analyses
The AD of DM, NDF and ADF was calculated using the following equation:
AD (%) = [𝐶𝑜𝑛𝑐𝑒𝑛𝑡𝑟𝑎𝑡𝑖𝑜𝑛 𝑏𝑒𝑓𝑜𝑟𝑒 𝑠𝑡𝑒𝑒𝑝𝑖𝑛𝑔 − 𝐶𝑜𝑛𝑐𝑒𝑛𝑡𝑟𝑎𝑡𝑖𝑜𝑛 𝑎𝑓𝑡𝑒𝑟 𝑠𝑡𝑒𝑒𝑝𝑖𝑛𝑔
𝐶𝑜𝑛𝑐𝑒𝑛𝑡𝑟𝑎𝑡𝑖𝑜𝑛 𝑏𝑒𝑓𝑜𝑟𝑒 𝑠𝑡𝑒𝑒𝑝𝑖𝑛𝑔]
× 100
where AD could be calculated for DM, NDF or ADF. ‘Before steeping’ refers to the values
obtained from co-products before mixing with water and enzymes, while ‘after steeping’
are the values obtained from samples steeped for 0, 12, 24, 48 or 72 h, followed by 12 h of
settling.
All data were analyzed using the GLIMMIX procedure of SAS 9.2 (SAS Inst. Inc.,
Cary, NC). The model had treatment, sampling time, and their interactions as fixed effects
and batches of steeping as a random effect. LSMeans were separated using the Tukey’s
test. Data for DDGS and WM were analyzed as independent experiments. Significant
differences were declared when P < 0.05.
3.4 Results
3.4.1 Chemical composition of corn, wheat, and co-products
The chemical composition of the co-products and cereal grain samples are shown in
Table 6. The DDGS and WM showed greater ADF, NDF, fat, and CP concentration than
the grains. The NDF level was 2.42 times higher for DDGS than for corn, and 2.23 times
greater in WM than in wheat. Co-products had 2.76 times greater ADF concentration than
grains. Crude fat and CP contents were 2.68 and 3.77 times higher in DDGS than corn, and
2.79 and 1.48 times higher in WM than in wheat. The A/X was higher for DDGS and WM
than corn and wheat. The most abundant glycosyl linkage in corn, wheat, DDGS, and WM
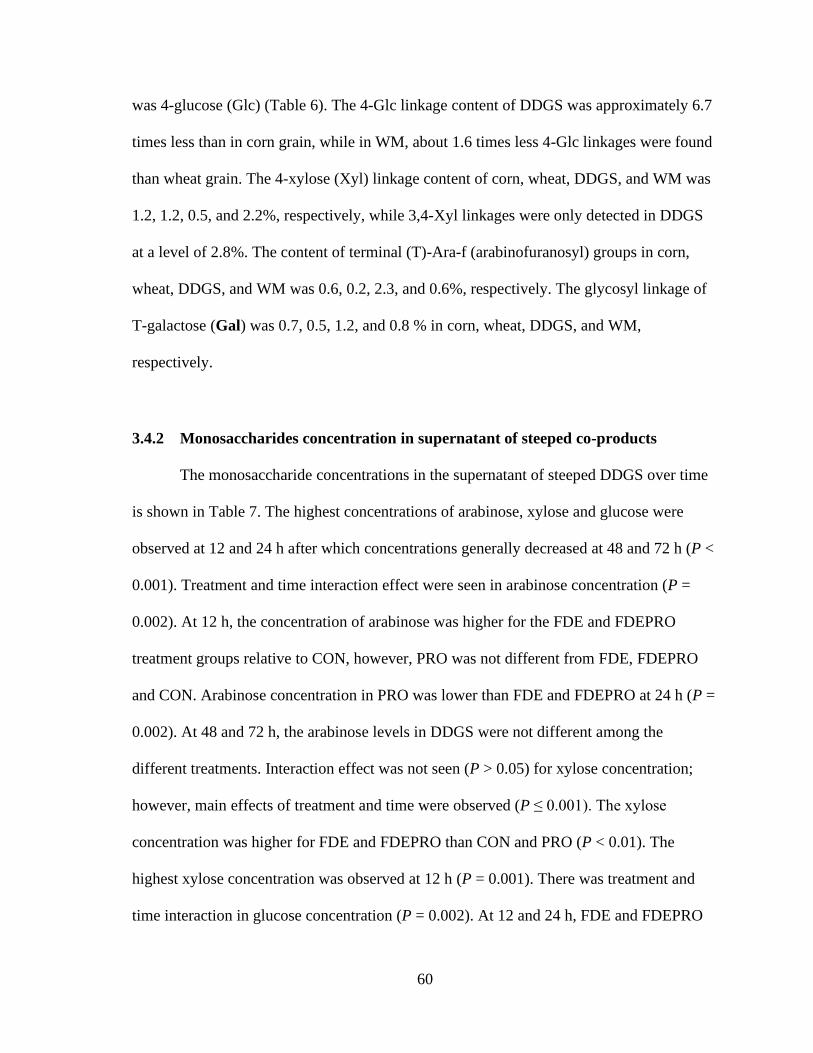
60
was 4-glucose (Glc) (Table 6). The 4-Glc linkage content of DDGS was approximately 6.7
times less than in corn grain, while in WM, about 1.6 times less 4-Glc linkages were found
than wheat grain. The 4-xylose (Xyl) linkage content of corn, wheat, DDGS, and WM was
1.2, 1.2, 0.5, and 2.2%, respectively, while 3,4-Xyl linkages were only detected in DDGS
at a level of 2.8%. The content of terminal (T)-Ara-f (arabinofuranosyl) groups in corn,
wheat, DDGS, and WM was 0.6, 0.2, 2.3, and 0.6%, respectively. The glycosyl linkage of
T-galactose (Gal) was 0.7, 0.5, 1.2, and 0.8 % in corn, wheat, DDGS, and WM,
respectively.
3.4.2 Monosaccharides concentration in supernatant of steeped co-products
The monosaccharide concentrations in the supernatant of steeped DDGS over time
is shown in Table 7. The highest concentrations of arabinose, xylose and glucose were
observed at 12 and 24 h after which concentrations generally decreased at 48 and 72 h (P <
0.001). Treatment and time interaction effect were seen in arabinose concentration (P =
0.002). At 12 h, the concentration of arabinose was higher for the FDE and FDEPRO
treatment groups relative to CON, however, PRO was not different from FDE, FDEPRO
and CON. Arabinose concentration in PRO was lower than FDE and FDEPRO at 24 h (P =
0.002). At 48 and 72 h, the arabinose levels in DDGS were not different among the
different treatments. Interaction effect was not seen (P > 0.05) for xylose concentration;
however, main effects of treatment and time were observed (P ≤ 0.001). The xylose
concentration was higher for FDE and FDEPRO than CON and PRO (P < 0.01). The
highest xylose concentration was observed at 12 h (P = 0.001). There was treatment and
time interaction in glucose concentration (P = 0.002). At 12 and 24 h, FDE and FDEPRO
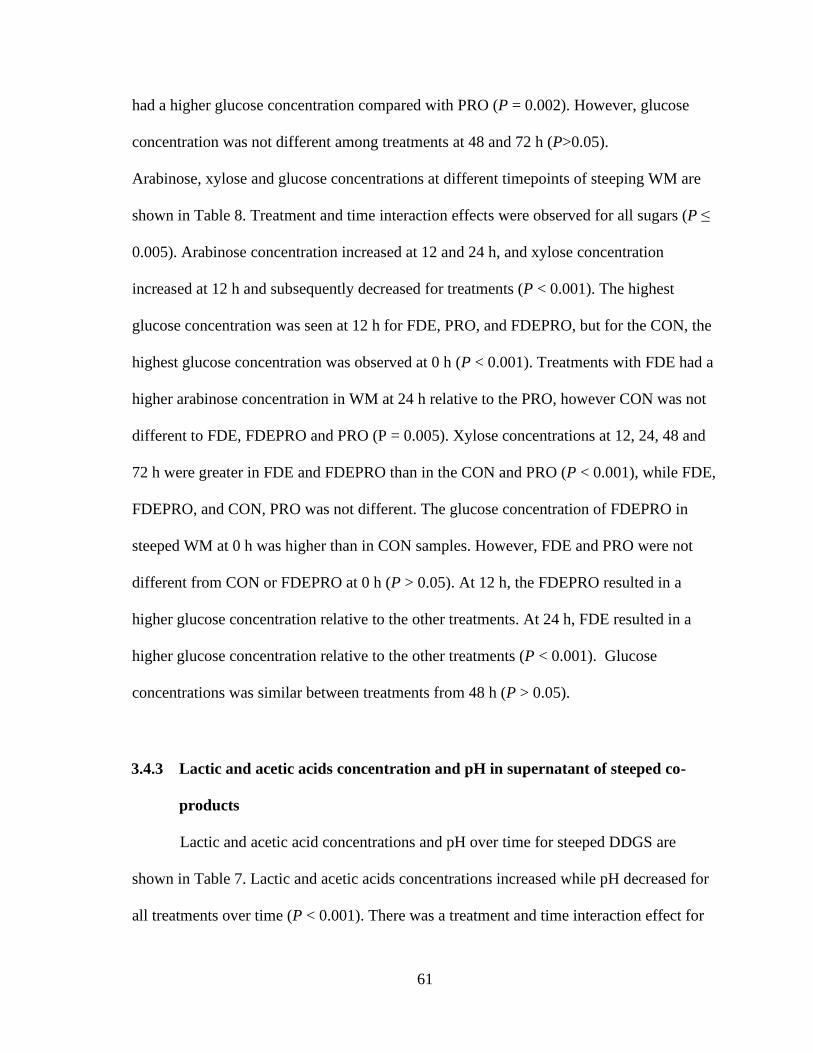
61
had a higher glucose concentration compared with PRO (P = 0.002). However, glucose
concentration was not different among treatments at 48 and 72 h (P>0.05).
Arabinose, xylose and glucose concentrations at different timepoints of steeping WM are
shown in Table 8. Treatment and time interaction effects were observed for all sugars (P ≤
0.005). Arabinose concentration increased at 12 and 24 h, and xylose concentration
increased at 12 h and subsequently decreased for treatments (P < 0.001). The highest
glucose concentration was seen at 12 h for FDE, PRO, and FDEPRO, but for the CON, the
highest glucose concentration was observed at 0 h (P < 0.001). Treatments with FDE had a
higher arabinose concentration in WM at 24 h relative to the PRO, however CON was not
different to FDE, FDEPRO and PRO (P = 0.005). Xylose concentrations at 12, 24, 48 and
72 h were greater in FDE and FDEPRO than in the CON and PRO (P < 0.001), while FDE,
FDEPRO, and CON, PRO was not different. The glucose concentration of FDEPRO in
steeped WM at 0 h was higher than in CON samples. However, FDE and PRO were not
different from CON or FDEPRO at 0 h (P > 0.05). At 12 h, the FDEPRO resulted in a
higher glucose concentration relative to the other treatments. At 24 h, FDE resulted in a
higher glucose concentration relative to the other treatments (P < 0.001). Glucose
concentrations was similar between treatments from 48 h (P > 0.05).
3.4.3 Lactic and acetic acids concentration and pH in supernatant of steeped co-
products
Lactic and acetic acid concentrations and pH over time for steeped DDGS are
shown in Table 7. Lactic and acetic acids concentrations increased while pH decreased for
all treatments over time (P < 0.001). There was a treatment and time interaction effect for
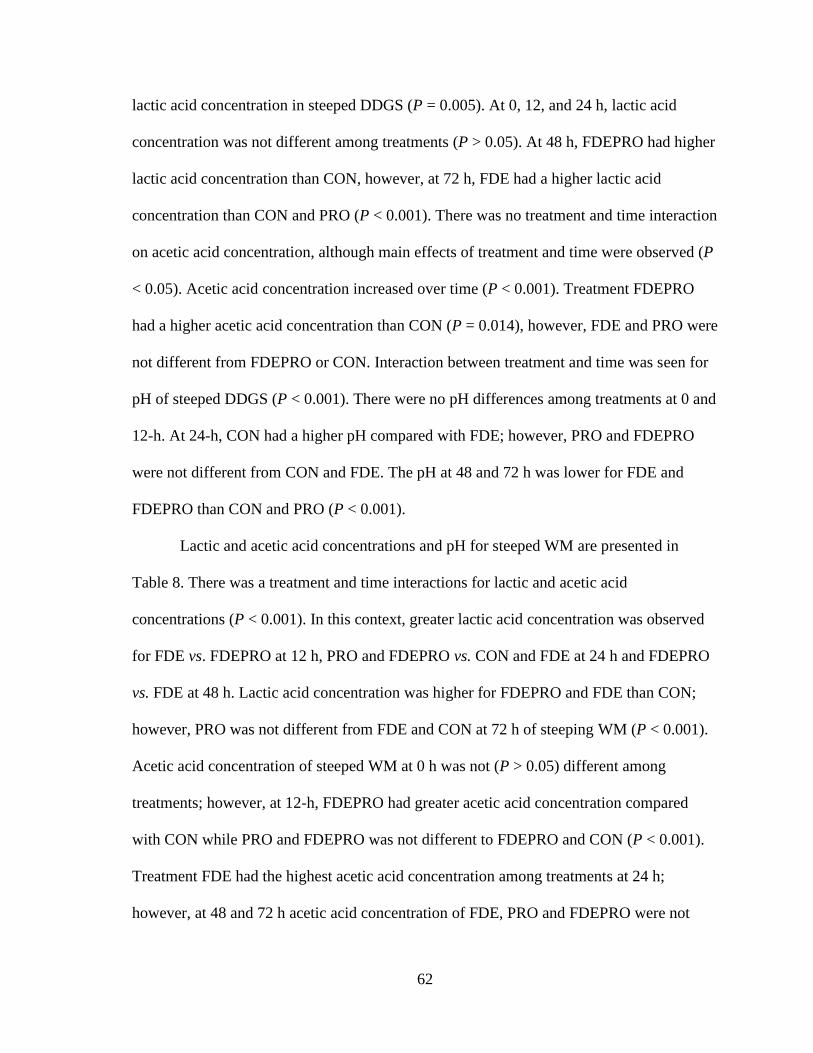
62
lactic acid concentration in steeped DDGS (P = 0.005). At 0, 12, and 24 h, lactic acid
concentration was not different among treatments (P > 0.05). At 48 h, FDEPRO had higher
lactic acid concentration than CON, however, at 72 h, FDE had a higher lactic acid
concentration than CON and PRO (P < 0.001). There was no treatment and time interaction
on acetic acid concentration, although main effects of treatment and time were observed (P
< 0.05). Acetic acid concentration increased over time (P < 0.001). Treatment FDEPRO
had a higher acetic acid concentration than CON (P = 0.014), however, FDE and PRO were
not different from FDEPRO or CON. Interaction between treatment and time was seen for
pH of steeped DDGS (P < 0.001). There were no pH differences among treatments at 0 and
12-h. At 24-h, CON had a higher pH compared with FDE; however, PRO and FDEPRO
were not different from CON and FDE. The pH at 48 and 72 h was lower for FDE and
FDEPRO than CON and PRO (P < 0.001).
Lactic and acetic acid concentrations and pH for steeped WM are presented in
Table 8. There was a treatment and time interactions for lactic and acetic acid
concentrations (P < 0.001). In this context, greater lactic acid concentration was observed
for FDE vs. FDEPRO at 12 h, PRO and FDEPRO vs. CON and FDE at 24 h and FDEPRO
vs. FDE at 48 h. Lactic acid concentration was higher for FDEPRO and FDE than CON;
however, PRO was not different from FDE and CON at 72 h of steeping WM (P < 0.001).
Acetic acid concentration of steeped WM at 0 h was not (P > 0.05) different among
treatments; however, at 12-h, FDEPRO had greater acetic acid concentration compared
with CON while PRO and FDEPRO was not different to FDEPRO and CON (P < 0.001).
Treatment FDE had the highest acetic acid concentration among treatments at 24 h;
however, at 48 and 72 h acetic acid concentration of FDE, PRO and FDEPRO were not
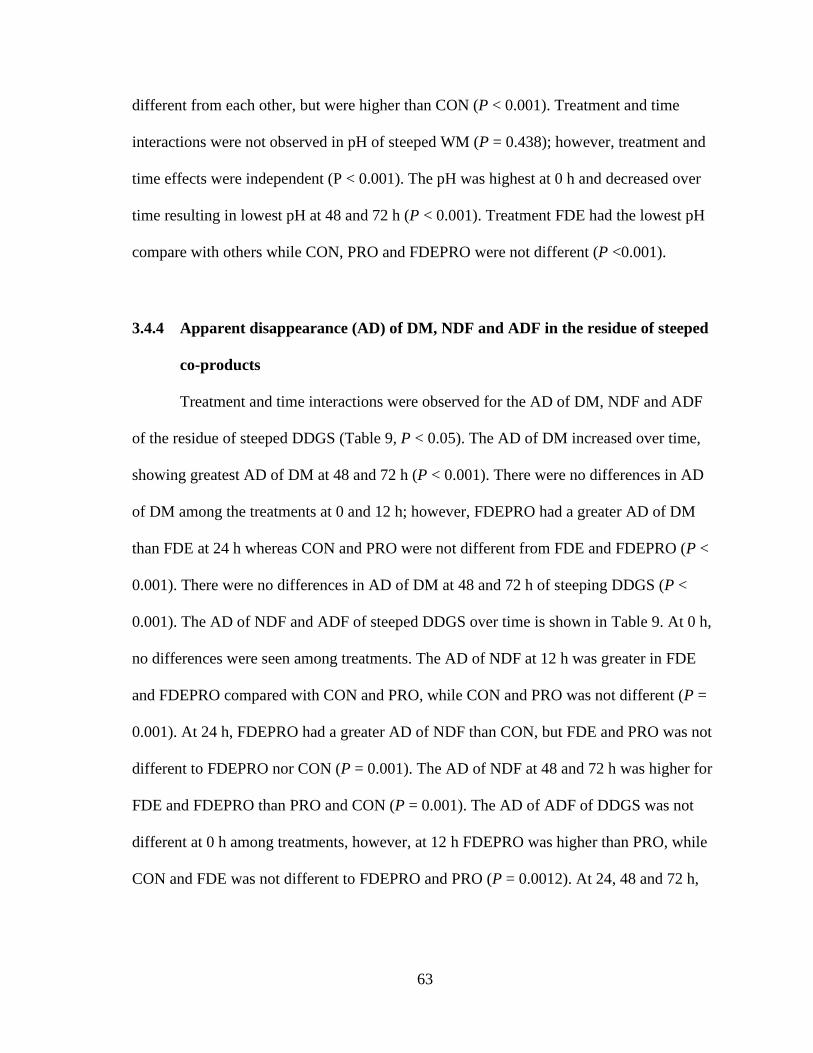
63
different from each other, but were higher than CON (P < 0.001). Treatment and time
interactions were not observed in pH of steeped WM (P = 0.438); however, treatment and
time effects were independent (P < 0.001). The pH was highest at 0 h and decreased over
time resulting in lowest pH at 48 and 72 h (P < 0.001). Treatment FDE had the lowest pH
compare with others while CON, PRO and FDEPRO were not different (P <0.001).
3.4.4 Apparent disappearance (AD) of DM, NDF and ADF in the residue of steeped
co-products
Treatment and time interactions were observed for the AD of DM, NDF and ADF
of the residue of steeped DDGS (Table 9, P < 0.05). The AD of DM increased over time,
showing greatest AD of DM at 48 and 72 h (P < 0.001). There were no differences in AD
of DM among the treatments at 0 and 12 h; however, FDEPRO had a greater AD of DM
than FDE at 24 h whereas CON and PRO were not different from FDE and FDEPRO (P <
0.001). There were no differences in AD of DM at 48 and 72 h of steeping DDGS (P <
0.001). The AD of NDF and ADF of steeped DDGS over time is shown in Table 9. At 0 h,
no differences were seen among treatments. The AD of NDF at 12 h was greater in FDE
and FDEPRO compared with CON and PRO, while CON and PRO was not different (P =
0.001). At 24 h, FDEPRO had a greater AD of NDF than CON, but FDE and PRO was not
different to FDEPRO nor CON (P = 0.001). The AD of NDF at 48 and 72 h was higher for
FDE and FDEPRO than PRO and CON (P = 0.001). The AD of ADF of DDGS was not
different at 0 h among treatments, however, at 12 h FDEPRO was higher than PRO, while
CON and FDE was not different to FDEPRO and PRO (P = 0.0012). At 24, 48 and 72 h,
64
AD of ADF for FDE and FDEPRO was similar but greater than for CON and PRO (P <
0.05), while CON and PRO was not different (P = 0.0012).
The AD of DM, NDF, and ADF of steeped WM is shown in Table 10. Treatment
and time interactions were seen in AD of DM of steeped WM (P < 0.001). There was no
difference in AD of DM among treatment at 0 and 12 h. However, at 24, 48, and 72 h,
FDEPRO, PRO and FDE had a greater AD of DM than CON (P < 0.001). An interactive
effect was seen for AD of NDF (P = 0.007) such that FDE and FDEPRO had higher AD of
NDF than PRO and CON; however, PRO was greater than CON all over time points (P =
0.007). There was a treatment and time interaction for AD of ADF of steeped WM (P <
0.0001). The AD of ADF at 0 and 12 h was not different among treatments, however, FDE
and FDEPRO had a greater AD of ADF compared with PRO and CON at 24 h. The AD of
ADF at 48 h was higher for FDE compared to CON, but FDEPRO and PRO were not
different to FDEPRO and CON (P < 0.001). At 72 h, FDEPRO and FDE were not different
from each other but higher than CON, however, PRO was not different from all other
treatments (P < 0.001).
3.5 Discussion
The chemical composition of DDGS and WM used in the present study was
comparable to the values presented in other publications (Salim et al., 2010; Rosenfelder et
al., 2013; Huang et al., 2017; Casas et al., 2018). As the NDF fraction includes
hemicellulose, cellulose, lignin, and ADF includes cellulose and lignin, hemicellulose can
be calculated after measuring cellulose and lignin. Hemicelluloses are a group of
heteropolysaccharides complexed with cellulose fibrils in plant cell walls (Cui et al., 2011)
65
and are more easily hydrolyzed to constituent monosaccharides than cellulose (Wyman et
al., 2005). Arabinoxylans, arabinogalactans, xyloglucans, xylans, and mixed-linkage
glucans are the main hemicelluloses in cereal grains (de Lange, 2000; Cui et al., 2011).
Hemicellulose concentration was 2.27 times greater for DDGS than concentration found in
corn and 2.04 times greater for WM than the concentration found in wheat. This can be
explained by co-product production processes. Ethanol is produced by fermenting starches
in grains; therefore, DDGS typically contains higher concentrations of nonfermentable
constituents such as fat and protein (Woyengo et al., 2016). The fiber concentration in WM
is also greater than in wheat because it is a mixture of wheat bran, shorts, germ, flour and
some of the “tail of the mill” residues (Erickson et al., 1985b). Therefore, co-products from
wheat flour milling contains a higher concentration of fiber than the parent grain
(Widyaratne and Zijlstra, 2007). The monosaccharide concentration in DDGS contained
greater xylose, arabinose, mannose, and galactose, and in WM, greater xylose, arabinose
and galactose contents were seen relative to the parent grains. However, grains had a
greater concentration of glucose which may be reflecting the higher starch content. The
glucose concentration in WM was lower than in wheat, however, a considerable amount of
glucose was still found in WM. This may be because WM still has a high starch content
due to ‘contamination’ of mixed fractions with endosperm tissue as reflected in the high
glucose content of this fraction.
In most cereal-based ingredients, the concentration of non-starch polysaccharide
(NSP) is high and is especially rich in arabinoxylans, cellulose, β-glucans, xyloglucans,
xylans, and arabinogalactans (Bach Knudsen, 1997; de Lange, 2000; Rumpagaporn et al.,
2015). Arabinoxylans are hemicelluloses consisting of β-1,4-linked D-xylose residues
66
substituted with arabinose side chains (Lu et al., 2000) and are abundantly found in the cell
walls of corn and wheat (Bach Knudsen, 1997). Therefore, the higher xylose and arabinose
concentrations relate to the higher concentration of arabinoxylan in co-products than in the
grains. The degree of substitution of arabinose depends on the cereal species and cell wall
types, which affects the solubility of the arabinoxylan and the susceptibility to enzymatic
hydrolysis (Bach Knudsen, 1997; Bach Knudsen, 2014). The arabinose to xylose ratio
(A/X) can give an idea of the degree arabinose substitution. Therefore, the A/X is an
important parameter. The A/X of DDGS and WM was 0.73 and 0.62 from a study
conducted by Jaworski et al. (2015), which was lower than the value presented in the
current study. The difference can be due to inherent quantitative differences in the
concentration of arabinose and xylose due to varietal differences and growing conditions of
the parent grains (Pedersen et al., 2014). In general, cereal bran has a higher A/X than other
parts of grains, however, corn bran has a greater A/X compared to wheat bran (Zhang et al.,
2014). The A/X was higher for DDGS and WM than in corn and wheat pointing to a more
densely substituted structure in DDGS and WM (de Vries et al., 2013; Pedersen et al.,
2014). These more densely substituted structures are harder to hydrolyze and ferment.
More 5-Ara-f linkages in co-products suggested that more ferulic acid residues
were attached to arabinoxylans. Ferulic acids are indeed mainly linked to the fifth carbon
of the arabinose side chain of arabinoxylan (Buanafina, 2009). Highly feruloylated
arabinoxylans are more resistant to hydrolytic degradation and fermentation (Snelders et
al., 2014). This is caused by cross-linking through diferulic acid bridges of the
polysaccharide chains and the associated formation of lignin–ferulate–xylan complexes
(Buanafina, 2009), which decreases the solubility. The 3,4-Glc, 4,6-Glc, and 3,4,6-Glc
67
linkage content was higher in grains than co-products indicating richer starch content. The
4-xylose (Xyl) linkage concentration was higher in WM while 3,4-Xyl linkages were only
detected in DDGS. This suggested that corn, wheat, and WM have more linear 1,4-linked
xylose structures compared with DDGS. Branched structures can be estimated by analyzing
terminal glycosyl linkages. Greater T-Ara-f contents in DDGS is another indication of
more densely substituted structure of arabinoxylan as compared to the arabinoxylan
molecules found in the other ingredients. The T-Gal linkage stems from arabinogalactans
that are present in cereals but higher concentration in co-products. Arabinogalactan is a
proteoglycan formed by a backbone of 1-4 linked galactose residues carrying arabinose
substitutions at the O-3 positions of a select part of the backbone galactose residues
(Cipriani et al., 2009; Bader Ul Ain et al., 2018). Studies have reported that a considerable
amount of arabinogalactans are found in cereal hulls and husks (Saeed et al., 2011);
therefore, the increased levels of T-Gal in co-products compared with corn and wheat was
expected.
The efficacy of the FDE is dependent on types of grain and ingredients (Myers and
Patience, 2014; Kiarie et al., 2016c). In the present study, FDE and FDEPRO treatments
increased arabinose concentration at 12 h in DDGS and xylose in WM. The majority of
fiber fractions in DDGS are arabinoxylans that are cross-linked with arabinofuranosyl or
glucuronic acid residues which can potentially prevent xylanase from accessing xylan
backbones (de Vries et al., 2013). As shown in the present study, the A/X ratio and
glycosyl linkage of arabinose (T-Ara-f and 5-Ara-f) of DDGS and WM was 1.33, 2.52,
2.30 and 1.02, 0.68, 1.36, respectively, which suggested a more complex structure in
DDGS (Pedersen et al., 2014). de Vries et al. (2013) reported that when DDGS was treated
68
with a combination of enzymes and different processing techniques, such as wet milling,
extrusion, autoclaving, and hydrothermal acid treatment, the cell walls were barely
affected; therefore, FDE may have been less effective in DDGS. Glucose concentration for
CON, PRO, FDE and FDEPRO at 12 h was 5.36, 6.34, 37.19 and 31.16 for DDGS and
5.54, 41.26, 38.73 and 56.85 for WM, respectively. Greater glucose concentration
compared with arabinose concentrations seen in FDE treatments may be because, β-glucans
and to some extent cellulose are easily hydrolyzed compared with arabinoxylans
(Karppinen et al., 2000).
At 0-h, the concentration of monosaccharides in the supernatant were greater in
steeped WM than in supernatant of steeped DDGS, which may be due to wheat
arabinoxylan being more soluble or because WM does not undergo an ethanol extraction
process where carbohydrates are extracted. Izydorczyk and Biliaderis (1995) reported that
wheat arabinoxylans are more soluble than arabinoxylans found in barley, oat and corn.
The concentration of arabinose, xylose and glucose was similar between CON and PRO in
steeped DDGS, however, in steeped WM, PRO had greater xylose and glucose
concentrations than CON. This can be explained by the complex protein-fiber structure of
DDGS perhaps linked to heating processes. Heat treatment during ethanol production,
forms protein-fiber complexes due to Maillard reactions (Jha et al., 2015). The increase of
monosaccharide concentrations at 12-24 h followed by a decrease at 48 -72-h can be
explained by microbes utilizing these monosaccharides for energy source while producing
organic acids. It has been well reported that natural fermentation of cereal grains results in
carbohydrates and other indigestible poly and oligosaccharide concentrations to decrease
(Blandino et al., 2003).
69
The hydrolysis, biochemical metabolism, and microbial activity during cereal
fermentation results in organic acids as end products (Blandino et al., 2003).
Heterofermentative organisms are known to be the predominant endogenous microbial
flora in grains (Nanson and Fields, 1984; Khetarpaul and Chauhan, 1989). The different
trends of organic acid concentrations over time in steeped DDGS vs. steeped WM may be
related to varying types and complexity of glycosyl linkages, monosaccharide arrangement
and types, and solubility and physical properties of dietary fibers as these factors can affect
the fermentation rate (Wang et al., 2019). In the present study, greater glucose
concentration in WM than in DDGS may have influenced the higher lactic acid
concentration in steeped WM. However, other factors such as different microbes and
enzymes inherent to the material can also cause different outcomes (Canibe and Jensen,
2012). Regardless of enzymes application and different co-products, the decrease in pH and
increase of lactic and acetic acid concentrations over time as seen in the current study
agrees with past fermentation/incubation studies (Mikkelsen and Jensen, 2000; Dujardin et
al., 2014; Wiseman et al., 2017b; Rho et al., 2018a). Mikkelsen and Jensen (2000)
observed that the pH was reduced below 4.5 in both liquid feeds that were fermented with
or without microbial inoculums. This is because as soon as feedstuff is soaked with water,
naturally occurring enzymes, bacteria and yeasts start to produce lactic and acetic acid
(which reduce the pH), and ethanol (Canibe and Jensen, 2012). Therefore, reduced pH and
increased lactic and acetic acid in all the treatments over time was expected.
The AD of DM for CON, PRO, FDE and FDEPRO at 72 h for DDGS was 9.49,
9.26, 11.04 and 11.58 and for WM, 7.36, 11.34, 11.86 and 13.04, respectively. Greater AD
of DM for FDEPRO compared with FDE in both co-products may be due to increased
70
protein degradation (Pedersen et al., 2015b). However, this could not be ascertained in the
present study as the disappearance of CP was not determined. In DDGS, the AD of NDF
and ADF for CON, PRO, FDE and FDEPRO at 72 h was 3.43, 5.40, 20.36, 19.39 and 9.8,
5.02, 27.6, 28.57, respectively. In WM the AD of NDF and ADF for CON, PRO, FDE and
FDEPRO at 72 h was 17.79, 35.94, 42.74, 43.29 and 17.29, 22.44, 28.98, 29.50. Compared
to CON, this reflected more disappearance of hemicellulose such as arabinoxylans, in
DDGS than in WM. However, as mentioned previously, wheat arabinoxylans are more
soluble than arabinoxylans found corn (Izydorczyk and Biliaderis, 1995); therefore, in
steeped WM, the difference in AD of NDF and ADF between CON and enzyme treated
samples may not have been as great as in steeped DDGS, as soaking WM in water has been
shown to lead to considerable breakdown of fiber (Moran et al., 2016). Xylanase inhibitors
which are more concentrated in wheat than other cereals can reduce the xylanase activity
(Elliott et al., 2003b; Gusakov, 2010). However, in the current study the xylanase inhibitor
levels in co-products were not measured. Nonetheless, the AD of NDF and ADF along with
monosaccharides release indicated FDE was effective in hydrolyzing wheat fiber;
therefore, we can predict that the xylanase inhibitors were not an issue when FDE was
included in steeped WM.
Applying FDE mixture increased arabinose, xylose, and glucose release
concomitant with the disappearance of NDF and ADF fractions in both DDGS and WM at
certain timepoints. The FDE mixture used in the present study contained xylanase, β-
glucanase, and cellulase activities to target arabinoxylan, β-glucan, and cellulose
components in cereal co-products. However, different trends seen in organic acids and
monosaccharide concentrations in DDGS and WM may be due to differences in fiber
71
structure as it can be related to concentrations of monosaccharides and glycosyl linkages.
Therefore, when applying the same enzymes to different co-products, the magnitude of
response can vary, and the enzyme mix should be aligned with the specific feed
composition, and steeping hour should be carefully chosen. However, steeping DDGS and
WM with FDE mixture containing xylanase, β-glucanase and cellulase activities were
effective in hydrolyzing fiber components and release monosaccharides in cereal co-
products at 12, 24 or 72 h of steeping. In general protease, alone or in combination with
FDE, had only limited effects on fiber hydrolysis. Which indicates the minor role of
protease in hydrolysing fiber fractions in co-products, despite the steeping time in the
present study. Further research is warranted to validate the in vivo effects of FDE,
particularly in solubilizing fiber fractions in co-products that are typically resistant to
gastrointestinal microbial fermentation.
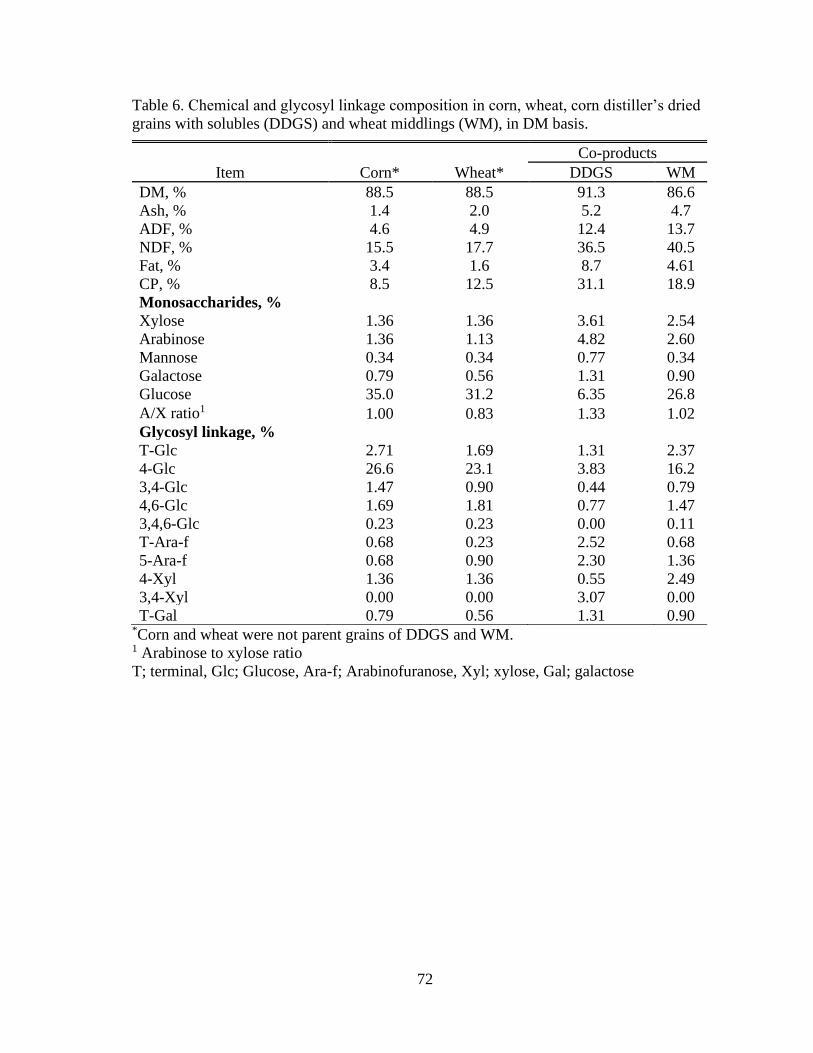
72
Table 6. Chemical and glycosyl linkage composition in corn, wheat, corn distiller’s dried
grains with solubles (DDGS) and wheat middlings (WM), in DM basis.
Co-products
Item Corn* Wheat* DDGS WM
DM, % 88.5 88.5 91.3 86.6
Ash, % 1.4 2.0 5.2 4.7
ADF, % 4.6 4.9 12.4 13.7
NDF, % 15.5 17.7 36.5 40.5
Fat, % 3.4 1.6 8.7 4.61
CP, % 8.5 12.5 31.1 18.9
Monosaccharides, % Xylose 1.36 1.36 3.61 2.54
Arabinose 1.36 1.13 4.82 2.60
Mannose 0.34 0.34 0.77 0.34
Galactose 0.79 0.56 1.31 0.90
Glucose 35.0 31.2 6.35 26.8
A/X ratio1 1.00 0.83 1.33 1.02
Glycosyl linkage, % T-Glc 2.71 1.69 1.31 2.37
4-Glc 26.6 23.1 3.83 16.2
3,4-Glc 1.47 0.90 0.44 0.79
4,6-Glc 1.69 1.81 0.77 1.47
3,4,6-Glc 0.23 0.23 0.00 0.11
T-Ara-f 0.68 0.23 2.52 0.68
5-Ara-f 0.68 0.90 2.30 1.36
4-Xyl 1.36 1.36 0.55 2.49
3,4-Xyl 0.00 0.00 3.07 0.00
T-Gal 0.79 0.56 1.31 0.90 *Corn and wheat were not parent grains of DDGS and WM. 1 Arabinose to xylose ratio
T; terminal, Glc; Glucose, Ara-f; Arabinofuranose, Xyl; xylose, Gal; galactose
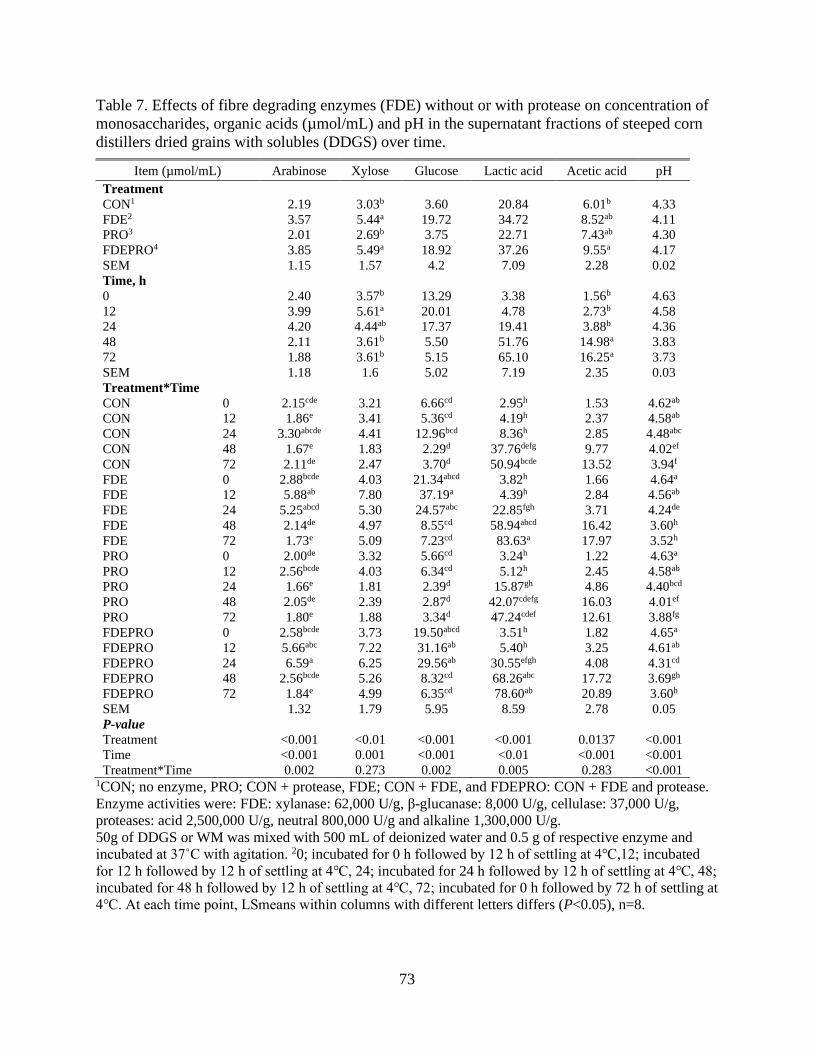
73
Table 7. Effects of fibre degrading enzymes (FDE) without or with protease on concentration of
monosaccharides, organic acids (µmol/mL) and pH in the supernatant fractions of steeped corn
distillers dried grains with solubles (DDGS) over time.
Item (µmol/mL) Arabinose Xylose Glucose Lactic acid Acetic acid pH
Treatment
CON1 2.19 3.03b 3.60 20.84 6.01b 4.33
FDE2 3.57 5.44a 19.72 34.72 8.52ab 4.11
PRO3 2.01 2.69b 3.75 22.71 7.43ab 4.30
FDEPRO4 3.85 5.49a 18.92 37.26 9.55a 4.17
SEM 1.15 1.57 4.2 7.09 2.28 0.02
Time, h
0 2.40 3.57b 13.29 3.38 1.56b 4.63
12 3.99 5.61a 20.01 4.78 2.73b 4.58
24 4.20 4.44ab 17.37 19.41 3.88b 4.36
48 2.11 3.61b 5.50 51.76 14.98a 3.83
72 1.88 3.61b 5.15 65.10 16.25a 3.73
SEM 1.18 1.6 5.02 7.19 2.35 0.03
Treatment*Time
CON 0 2.15cde 3.21 6.66cd 2.95h 1.53 4.62ab
CON 12 1.86e 3.41 5.36cd 4.19h 2.37 4.58ab
CON 24 3.30abcde 4.41 12.96bcd 8.36h 2.85 4.48abc
CON 48 1.67e 1.83 2.29d 37.76defg 9.77 4.02ef
CON 72 2.11de 2.47 3.70d 50.94bcde 13.52 3.94f
FDE 0 2.88bcde 4.03 21.34abcd 3.82h 1.66 4.64a
FDE 12 5.88ab 7.80 37.19a 4.39h 2.84 4.56ab
FDE 24 5.25abcd 5.30 24.57abc 22.85fgh 3.71 4.24de
FDE 48 2.14de 4.97 8.55cd 58.94abcd 16.42 3.60h
FDE 72 1.73e 5.09 7.23cd 83.63a 17.97 3.52h
PRO 0 2.00de 3.32 5.66cd 3.24h 1.22 4.63a
PRO 12 2.56bcde 4.03 6.34cd 5.12h 2.45 4.58ab
PRO 24 1.66e 1.81 2.39d 15.87gh 4.86 4.40bcd
PRO 48 2.05de 2.39 2.87d 42.07cdefg 16.03 4.01ef
PRO 72 1.80e 1.88 3.34d 47.24cdef 12.61 3.88fg
FDEPRO 0 2.58bcde 3.73 19.50abcd 3.51h 1.82 4.65a
FDEPRO 12 5.66abc 7.22 31.16ab 5.40h 3.25 4.61ab
FDEPRO 24 6.59a 6.25 29.56ab 30.55efgh 4.08 4.31cd
FDEPRO 48 2.56bcde 5.26 8.32cd 68.26abc 17.72 3.69gh
FDEPRO 72 1.84e 4.99 6.35cd 78.60ab 20.89 3.60h
SEM 1.32 1.79 5.95 8.59 2.78 0.05
P-value Treatment <0.001 <0.01 <0.001 <0.001 0.0137 <0.001
Time <0.001 0.001 <0.001 <0.01 <0.001 <0.001
Treatment*Time 0.002 0.273 0.002 0.005 0.283 <0.001 1CON; no enzyme, PRO; CON + protease, FDE; CON + FDE, and FDEPRO: CON + FDE and protease.
Enzyme activities were: FDE: xylanase: 62,000 U/g, β-glucanase: 8,000 U/g, cellulase: 37,000 U/g,
proteases: acid 2,500,000 U/g, neutral 800,000 U/g and alkaline 1,300,000 U/g.
50g of DDGS or WM was mixed with 500 mL of deionized water and 0.5 g of respective enzyme and
incubated at 37˚C with agitation. 20; incubated for 0 h followed by 12 h of settling at 4℃,12; incubated
for 12 h followed by 12 h of settling at 4℃, 24; incubated for 24 h followed by 12 h of settling at 4℃, 48;
incubated for 48 h followed by 12 h of settling at 4℃, 72; incubated for 0 h followed by 72 h of settling at
4℃. At each time point, LSmeans within columns with different letters differs (P<0.05), n=8.
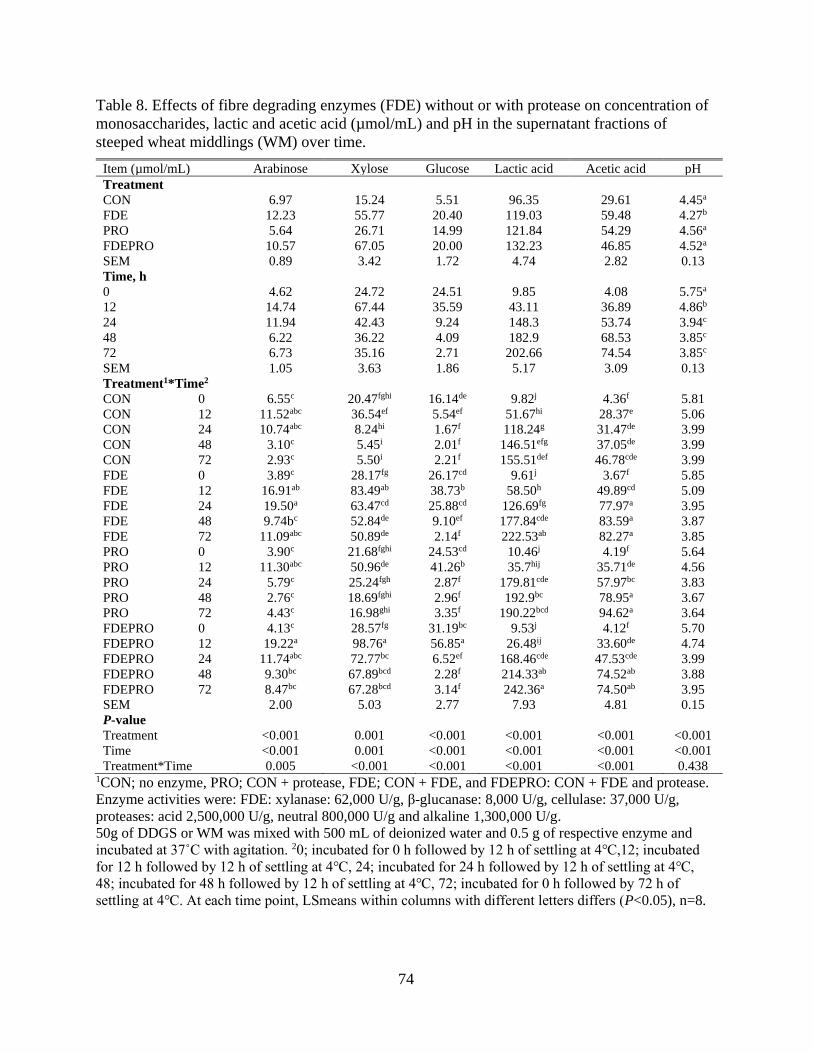
74
Table 8. Effects of fibre degrading enzymes (FDE) without or with protease on concentration of
monosaccharides, lactic and acetic acid (µmol/mL) and pH in the supernatant fractions of
steeped wheat middlings (WM) over time.
Item (µmol/mL) Arabinose Xylose Glucose Lactic acid Acetic acid pH
Treatment
CON 6.97 15.24 5.51 96.35 29.61 4.45a
FDE 12.23 55.77 20.40 119.03 59.48 4.27b
PRO 5.64 26.71 14.99 121.84 54.29 4.56a
FDEPRO 10.57 67.05 20.00 132.23 46.85 4.52a
SEM 0.89 3.42 1.72 4.74 2.82 0.13
Time, h
0 4.62 24.72 24.51 9.85 4.08 5.75a
12 14.74 67.44 35.59 43.11 36.89 4.86b
24 11.94 42.43 9.24 148.3 53.74 3.94c
48 6.22 36.22 4.09 182.9 68.53 3.85c
72 6.73 35.16 2.71 202.66 74.54 3.85c
SEM 1.05 3.63 1.86 5.17 3.09 0.13
Treatment1*Time2
CON 0 6.55c 20.47fghi 16.14de 9.82j 4.36f 5.81
CON 12 11.52abc 36.54ef 5.54ef 51.67hi 28.37e 5.06
CON 24 10.74abc 8.24hi 1.67f 118.24g 31.47de 3.99
CON 48 3.10c 5.45i 2.01f 146.51efg 37.05de 3.99
CON 72 2.93c 5.50i 2.21f 155.51def 46.78cde 3.99
FDE 0 3.89c 28.17fg 26.17cd 9.61j 3.67f 5.85
FDE 12 16.91ab 83.49ab 38.73b 58.50h 49.89cd 5.09
FDE 24 19.50a 63.47cd 25.88cd 126.69fg 77.97a 3.95
FDE 48 9.74bc 52.84de 9.10ef 177.84cde 83.59a 3.87
FDE 72 11.09abc 50.89de 2.14f 222.53ab 82.27a 3.85
PRO 0 3.90c 21.68fghi 24.53cd 10.46j 4.19f 5.64
PRO 12 11.30abc 50.96de 41.26b 35.7hij 35.71de 4.56
PRO 24 5.79c 25.24fgh 2.87f 179.81cde 57.97bc 3.83
PRO 48 2.76c 18.69fghi 2.96f 192.9bc 78.95a 3.67
PRO 72 4.43c 16.98ghi 3.35f 190.22bcd 94.62a 3.64
FDEPRO 0 4.13c 28.57fg 31.19bc 9.53j 4.12f 5.70
FDEPRO 12 19.22a 98.76a 56.85a 26.48ij 33.60de 4.74
FDEPRO 24 11.74abc 72.77bc 6.52ef 168.46cde 47.53cde 3.99
FDEPRO 48 9.30bc 67.89bcd 2.28f 214.33ab 74.52ab 3.88
FDEPRO 72 8.47bc 67.28bcd 3.14f 242.36a 74.50ab 3.95
SEM 2.00 5.03 2.77 7.93 4.81 0.15
P-value
Treatment <0.001 0.001 <0.001 <0.001 <0.001 <0.001
Time <0.001 0.001 <0.001 <0.001 <0.001 <0.001
Treatment*Time 0.005 <0.001 <0.001 <0.001 <0.001 0.438 1CON; no enzyme, PRO; CON + protease, FDE; CON + FDE, and FDEPRO: CON + FDE and protease.
Enzyme activities were: FDE: xylanase: 62,000 U/g, β-glucanase: 8,000 U/g, cellulase: 37,000 U/g,
proteases: acid 2,500,000 U/g, neutral 800,000 U/g and alkaline 1,300,000 U/g.
50g of DDGS or WM was mixed with 500 mL of deionized water and 0.5 g of respective enzyme and
incubated at 37˚C with agitation. 20; incubated for 0 h followed by 12 h of settling at 4℃,12; incubated
for 12 h followed by 12 h of settling at 4℃, 24; incubated for 24 h followed by 12 h of settling at 4℃,
48; incubated for 48 h followed by 12 h of settling at 4℃, 72; incubated for 0 h followed by 72 h of
settling at 4℃. At each time point, LSmeans within columns with different letters differs (P<0.05), n=8.
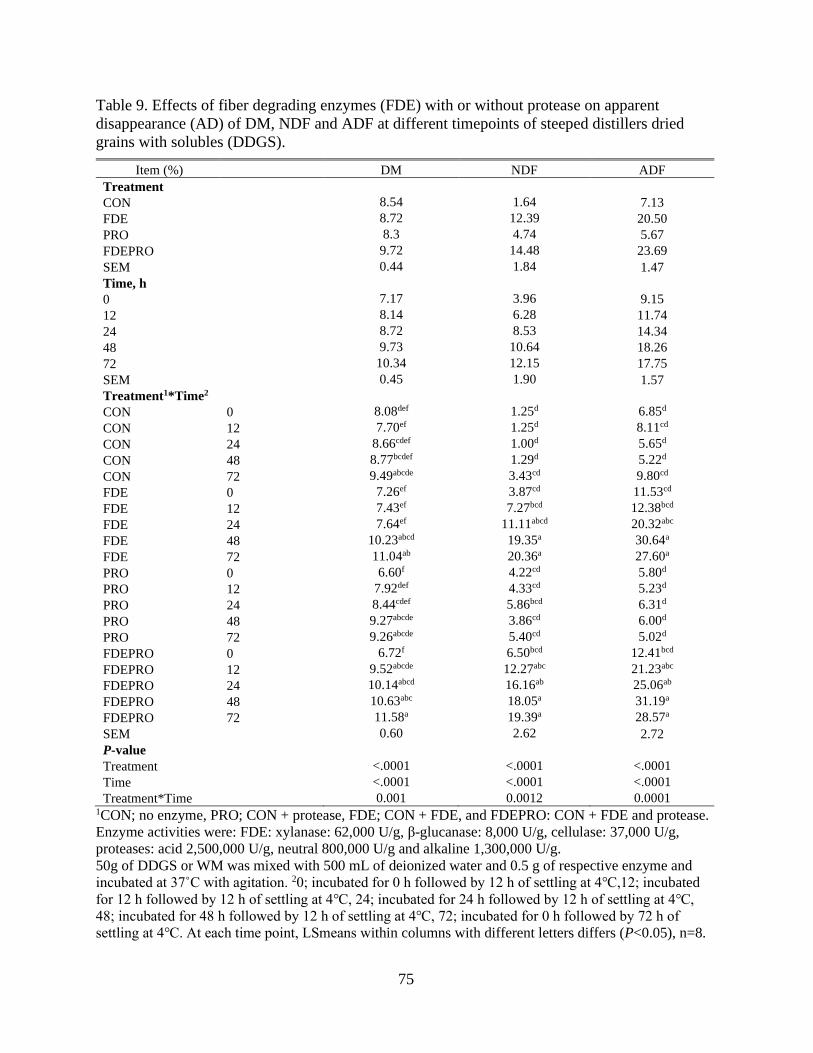
75
Table 9. Effects of fiber degrading enzymes (FDE) with or without protease on apparent
disappearance (AD) of DM, NDF and ADF at different timepoints of steeped distillers dried
grains with solubles (DDGS).
Item (%) DM NDF ADF
Treatment
CON 8.54 1.64 7.13
FDE 8.72 12.39 20.50
PRO 8.3 4.74 5.67
FDEPRO 9.72 14.48 23.69
SEM 0.44 1.84 1.47
Time, h
0 7.17 3.96 9.15
12 8.14 6.28 11.74
24 8.72 8.53 14.34
48 9.73 10.64 18.26
72 10.34 12.15 17.75
SEM 0.45 1.90 1.57
Treatment1*Time2 CON 0 8.08def 1.25d 6.85d
CON 12 7.70ef 1.25d 8.11cd
CON 24 8.66cdef 1.00d 5.65d
CON 48 8.77bcdef 1.29d 5.22d
CON 72 9.49abcde 3.43cd 9.80cd
FDE 0 7.26ef 3.87cd 11.53cd
FDE 12 7.43ef 7.27bcd 12.38bcd
FDE 24 7.64ef 11.11abcd 20.32abc
FDE 48 10.23abcd 19.35a 30.64a
FDE 72 11.04ab 20.36a 27.60a
PRO 0 6.60f 4.22cd 5.80d
PRO 12 7.92def 4.33cd 5.23d
PRO 24 8.44cdef 5.86bcd 6.31d
PRO 48 9.27abcde 3.86cd 6.00d
PRO 72 9.26abcde 5.40cd 5.02d
FDEPRO 0 6.72f 6.50bcd 12.41bcd
FDEPRO 12 9.52abcde 12.27abc 21.23abc
FDEPRO 24 10.14abcd 16.16ab 25.06ab
FDEPRO 48 10.63abc 18.05a 31.19a
FDEPRO 72 11.58a 19.39a 28.57a
SEM 0.60 2.62 2.72
P-value Treatment <.0001 <.0001 <.0001
Time <.0001 <.0001 <.0001
Treatment*Time 0.001 0.0012 0.0001 1CON; no enzyme, PRO; CON + protease, FDE; CON + FDE, and FDEPRO: CON + FDE and protease.
Enzyme activities were: FDE: xylanase: 62,000 U/g, β-glucanase: 8,000 U/g, cellulase: 37,000 U/g,
proteases: acid 2,500,000 U/g, neutral 800,000 U/g and alkaline 1,300,000 U/g.
50g of DDGS or WM was mixed with 500 mL of deionized water and 0.5 g of respective enzyme and
incubated at 37˚C with agitation. 20; incubated for 0 h followed by 12 h of settling at 4℃,12; incubated
for 12 h followed by 12 h of settling at 4℃, 24; incubated for 24 h followed by 12 h of settling at 4℃,
48; incubated for 48 h followed by 12 h of settling at 4℃, 72; incubated for 0 h followed by 72 h of
settling at 4℃. At each time point, LSmeans within columns with different letters differs (P<0.05), n=8.
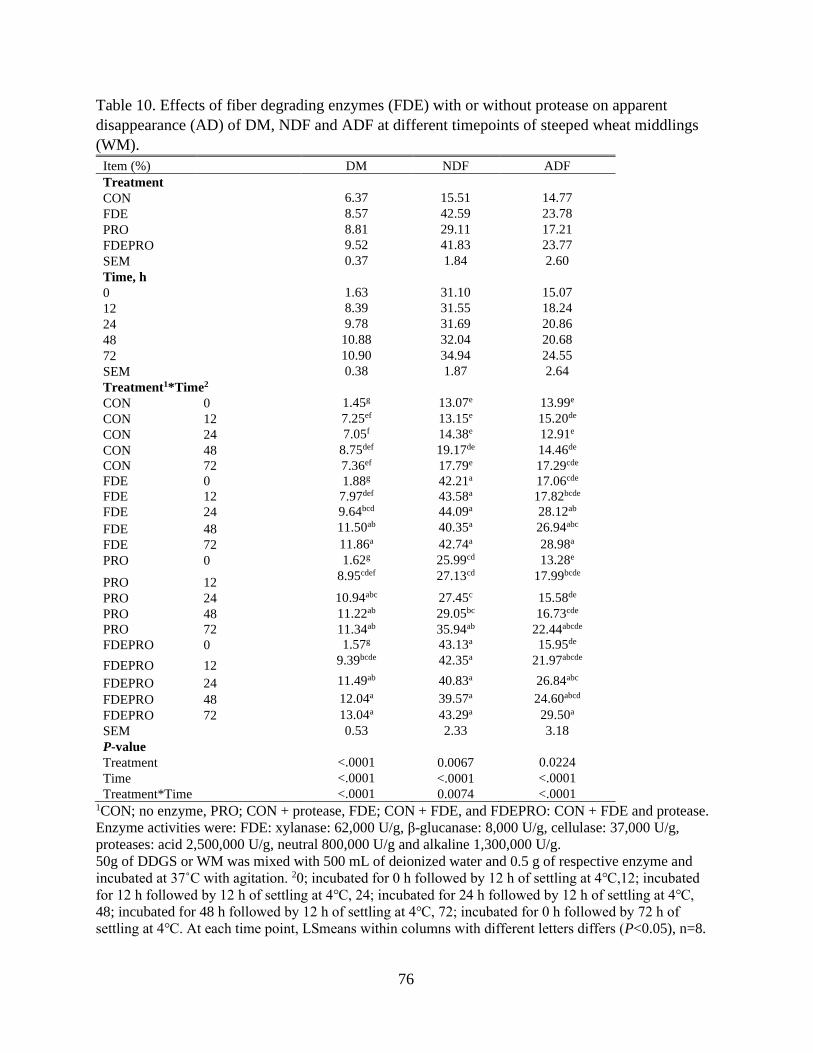
76
Table 10. Effects of fiber degrading enzymes (FDE) with or without protease on apparent
disappearance (AD) of DM, NDF and ADF at different timepoints of steeped wheat middlings
(WM).
Item (%) DM NDF ADF
Treatment
CON 6.37 15.51 14.77
FDE 8.57 42.59 23.78
PRO 8.81 29.11 17.21
FDEPRO 9.52 41.83 23.77
SEM 0.37 1.84 2.60
Time, h
0 1.63 31.10 15.07
12 8.39 31.55 18.24
24 9.78 31.69 20.86
48 10.88 32.04 20.68
72 10.90 34.94 24.55
SEM 0.38 1.87 2.64
Treatment1*Time2 CON 0 1.45g 13.07e 13.99e
CON 12 7.25ef 13.15e 15.20de
CON 24 7.05f 14.38e 12.91e
CON 48 8.75def 19.17de 14.46de
CON 72 7.36ef 17.79e 17.29cde
FDE 0 1.88g 42.21a 17.06cde
FDE 12 7.97def 43.58a 17.82bcde
FDE 24 9.64bcd 44.09a 28.12ab
FDE 48 11.50ab 40.35a 26.94abc
FDE 72 11.86a 42.74a 28.98a
PRO 0 1.62g 25.99cd 13.28e
PRO 12 8.95cdef 27.13cd 17.99bcde
PRO 24 10.94abc 27.45c 15.58de
PRO 48 11.22ab 29.05bc 16.73cde
PRO 72 11.34ab 35.94ab 22.44abcde
FDEPRO 0 1.57g 43.13a 15.95de
FDEPRO 12 9.39bcde 42.35a 21.97abcde
FDEPRO 24 11.49ab 40.83a 26.84abc
FDEPRO 48 12.04a 39.57a 24.60abcd
FDEPRO 72 13.04a 43.29a 29.50a
SEM 0.53 2.33 3.18
P-value Treatment <.0001 0.0067 0.0224
Time <.0001 <.0001 <.0001
Treatment*Time <.0001 0.0074 <.0001 1CON; no enzyme, PRO; CON + protease, FDE; CON + FDE, and FDEPRO: CON + FDE and protease.
Enzyme activities were: FDE: xylanase: 62,000 U/g, β-glucanase: 8,000 U/g, cellulase: 37,000 U/g,
proteases: acid 2,500,000 U/g, neutral 800,000 U/g and alkaline 1,300,000 U/g.
50g of DDGS or WM was mixed with 500 mL of deionized water and 0.5 g of respective enzyme and
incubated at 37˚C with agitation. 20; incubated for 0 h followed by 12 h of settling at 4℃,12; incubated
for 12 h followed by 12 h of settling at 4℃, 24; incubated for 24 h followed by 12 h of settling at 4℃,
48; incubated for 48 h followed by 12 h of settling at 4℃, 72; incubated for 0 h followed by 72 h of
settling at 4℃. At each time point, LSmeans within columns with different letters differs (P<0.05), n=8.
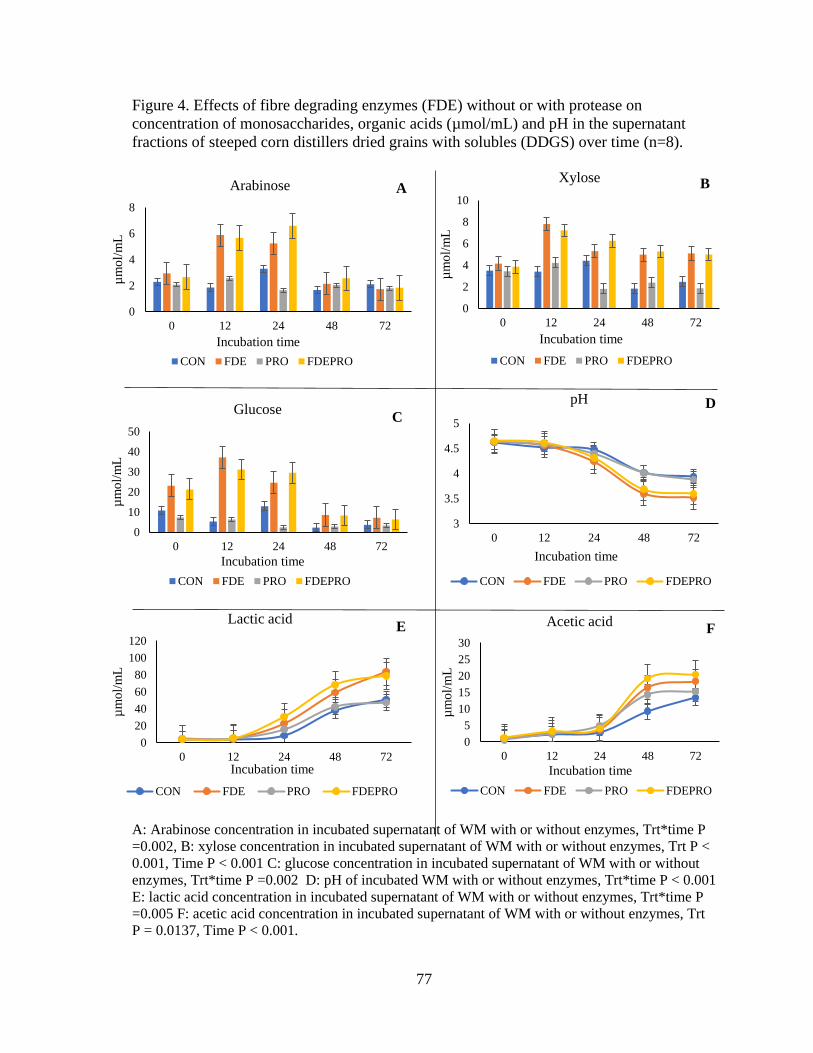
77
Figure 4. Effects of fibre degrading enzymes (FDE) without or with protease on
concentration of monosaccharides, organic acids (µmol/mL) and pH in the supernatant
fractions of steeped corn distillers dried grains with solubles (DDGS) over time (n=8).
A: Arabinose concentration in incubated supernatant of WM with or without enzymes, Trt*time P
=0.002, B: xylose concentration in incubated supernatant of WM with or without enzymes, Trt P <
0.001, Time P < 0.001 C: glucose concentration in incubated supernatant of WM with or without
enzymes, Trt*time P =0.002 D: pH of incubated WM with or without enzymes, Trt*time P < 0.001
E: lactic acid concentration in incubated supernatant of WM with or without enzymes, Trt*time P
=0.005 F: acetic acid concentration in incubated supernatant of WM with or without enzymes, Trt
P = 0.0137, Time P < 0.001.
0
2
4
6
8
0 12 24 48 72
µm
ol/
mL
Incubation time
Arabinose
CON FDE PRO FDEPRO
A
0
2
4
6
8
10
0 12 24 48 72
µm
ol/
mL
Incubation time
Xylose
CON FDE PRO FDEPRO
B
0
10
20
30
40
50
0 12 24 48 72
µm
ol/
mL
Incubation time
Glucose
CON FDE PRO FDEPRO
C
3
3.5
4
4.5
5
0 12 24 48 72
Incubation time
pH
CON FDE PRO FDEPRO
D
0
20
40
60
80
100
120
0 12 24 48 72
µm
ol/
mL
Incubation time
Lactic acid
CON FDE PRO FDEPRO
E
0
5
10
15
20
25
30
0 12 24 48 72
µm
ol/
mL
Incubation time
Acetic acid
CON FDE PRO FDEPRO
F
78
See text and Table 7 for details of significant interaction differences.
CON (blue); no enzyme, PRO (grey); CON + protease, FDE (orgnge); CON + FDE, and FDEPRO
(yellow): CON + FDE and protease.
Enzyme activities were: FDE: xylanase: 62,000 U/g, β-glucanase: 8,000 U/g, cellulase: 37,000 U/g,
proteases: acid 2,500,000 U/g, neutral 800,000 U/g and alkaline 1,300,000 U/g.
50g of DDGS was mixed with 500 mL of deionized water and 0.5 g of respective enzyme and
incubated at 37˚C with agitation. 0; incubated for 0 h followed by 12 h of settling at 4℃,12;
incubated for 12 h followed by 12 h of settling at 4℃, 24; incubated for 24 h followed by 12 h of
settling at 4℃, 48; incubated for 48 h followed by 12 h of settling at 4℃, 72; incubated for 0 h
followed by 72 h of settling at 4℃.
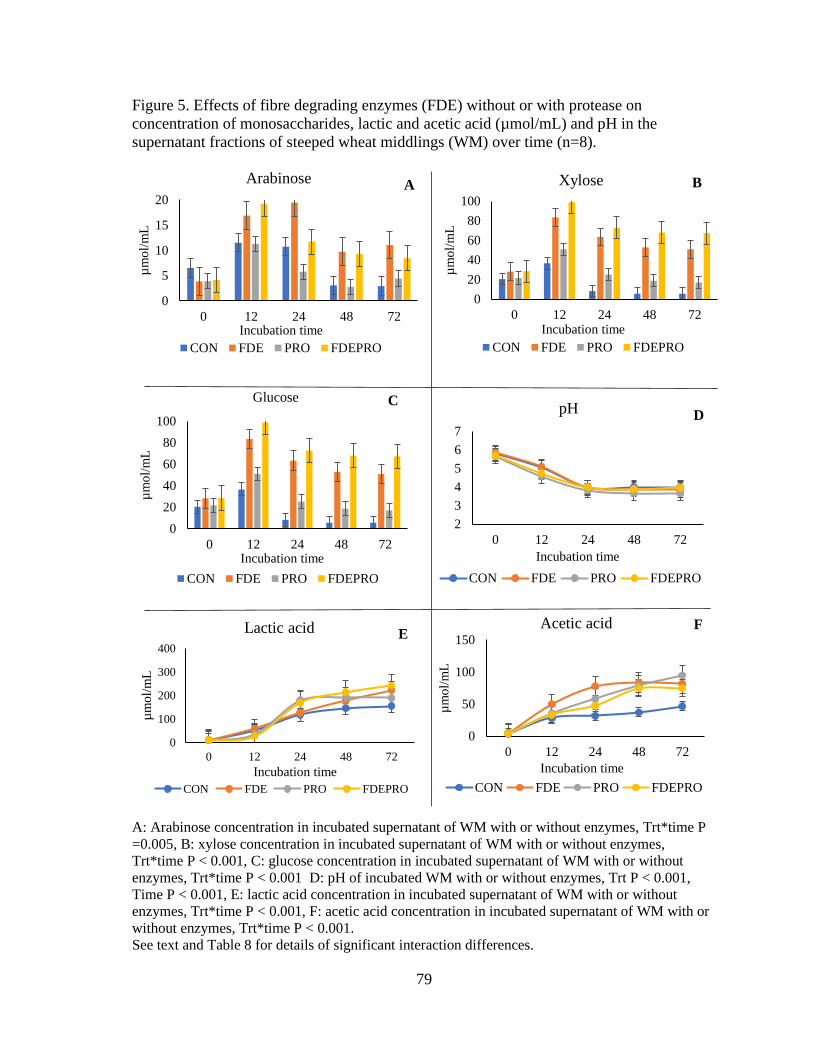
79
Figure 5. Effects of fibre degrading enzymes (FDE) without or with protease on
concentration of monosaccharides, lactic and acetic acid (µmol/mL) and pH in the
supernatant fractions of steeped wheat middlings (WM) over time (n=8).
A: Arabinose concentration in incubated supernatant of WM with or without enzymes, Trt*time P
=0.005, B: xylose concentration in incubated supernatant of WM with or without enzymes,
Trt*time P < 0.001, C: glucose concentration in incubated supernatant of WM with or without
enzymes, Trt*time P < 0.001 D: pH of incubated WM with or without enzymes, Trt P < 0.001,
Time P < 0.001, E: lactic acid concentration in incubated supernatant of WM with or without
enzymes, Trt*time P < 0.001, F: acetic acid concentration in incubated supernatant of WM with or
without enzymes, Trt*time P < 0.001.
See text and Table 8 for details of significant interaction differences.
0
5
10
15
20
0 12 24 48 72
µm
ol/
mL
Incubation time
Arabinose
CON FDE PRO FDEPRO
A
0
20
40
60
80
100
0 12 24 48 72
µm
ol/
mL
Incubation time
Xylose
CON FDE PRO FDEPRO
B
0
20
40
60
80
100
0 12 24 48 72
µm
ol/
mL
Incubation time
Glucose
CON FDE PRO FDEPRO
C
2
3
4
5
6
7
0 12 24 48 72
Incubation time
pH
CON FDE PRO FDEPRO
D
0
100
200
300
400
0 12 24 48 72
µm
ol/
mL
Incubation time
Lactic acid
CON FDE PRO FDEPRO
E
0
50
100
150
0 12 24 48 72
µm
ol/
mL
Incubation time
Acetic acid
CON FDE PRO FDEPRO
F
80
CON (blue); no enzyme, PRO (grey); CON + protease, FDE (orgnge); CON + FDE, and FDEPRO
(yellow): CON + FDE and protease.
Enzyme activities were: FDE: xylanase: 62,000 U/g, β-glucanase: 8,000 U/g, cellulase: 37,000 U/g,
proteases: acid 2,500,000 U/g, neutral 800,000 U/g and alkaline 1,300,000 U/g.
50g of WM was mixed with 500 mL of deionized water and 0.5 g of respective enzyme and
incubated at 37˚C with agitation. 0; incubated for 0 h followed by 12 h of settling at 4℃,12;
incubated for 12 h followed by 12 h of settling at 4℃, 24; incubated for 24 h followed by 12 h of
settling at 4℃, 48; incubated for 48 h followed by 12 h of settling at 4℃, 72; incubated for 0 h
followed by 72 h of settling at 4℃.
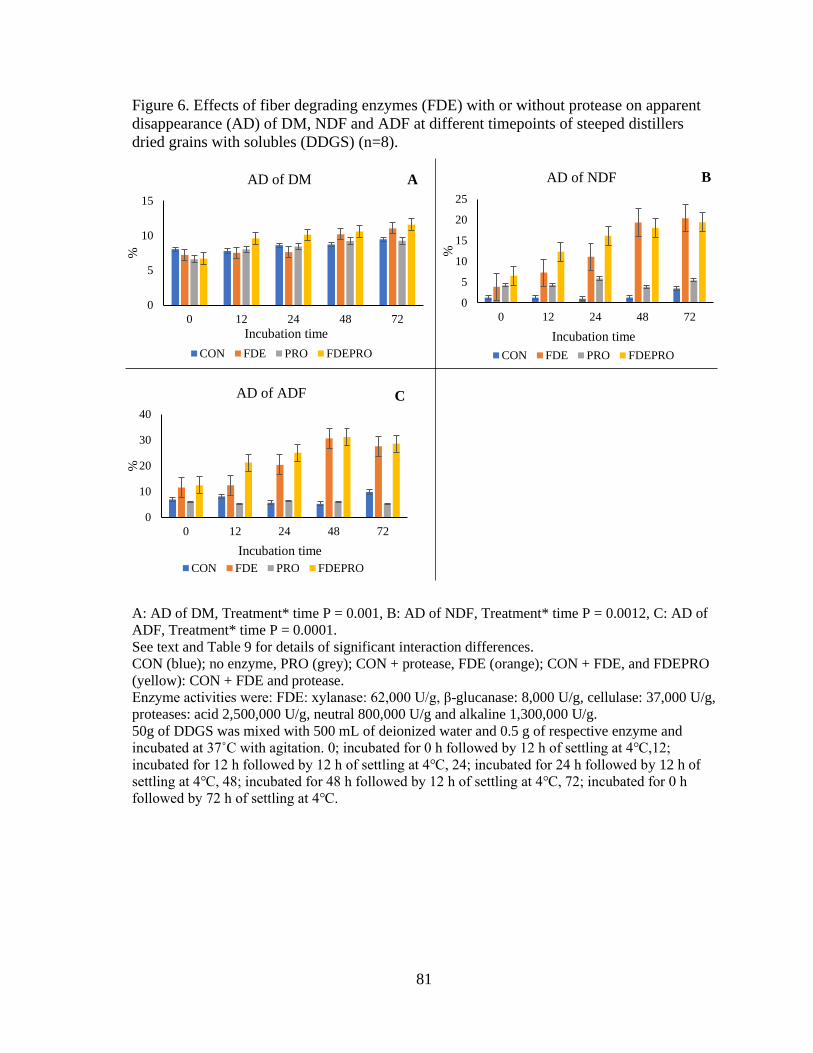
81
Figure 6. Effects of fiber degrading enzymes (FDE) with or without protease on apparent
disappearance (AD) of DM, NDF and ADF at different timepoints of steeped distillers
dried grains with solubles (DDGS) (n=8).
A: AD of DM, Treatment* time P = 0.001, B: AD of NDF, Treatment* time P = 0.0012, C: AD of
ADF, Treatment* time P = 0.0001.
See text and Table 9 for details of significant interaction differences.
CON (blue); no enzyme, PRO (grey); CON + protease, FDE (orange); CON + FDE, and FDEPRO
(yellow): CON + FDE and protease.
Enzyme activities were: FDE: xylanase: 62,000 U/g, β-glucanase: 8,000 U/g, cellulase: 37,000 U/g,
proteases: acid 2,500,000 U/g, neutral 800,000 U/g and alkaline 1,300,000 U/g.
50g of DDGS was mixed with 500 mL of deionized water and 0.5 g of respective enzyme and
incubated at 37˚C with agitation. 0; incubated for 0 h followed by 12 h of settling at 4℃,12;
incubated for 12 h followed by 12 h of settling at 4℃, 24; incubated for 24 h followed by 12 h of
settling at 4℃, 48; incubated for 48 h followed by 12 h of settling at 4℃, 72; incubated for 0 h
followed by 72 h of settling at 4℃.
0
5
10
15
0 12 24 48 72
%
Incubation time
AD of DM
CON FDE PRO FDEPRO
A
0
5
10
15
20
25
0 12 24 48 72
%
Incubation time
AD of NDF
CON FDE PRO FDEPRO
B
0
10
20
30
40
0 12 24 48 72
%
Incubation time
AD of ADF
CON FDE PRO FDEPRO
C
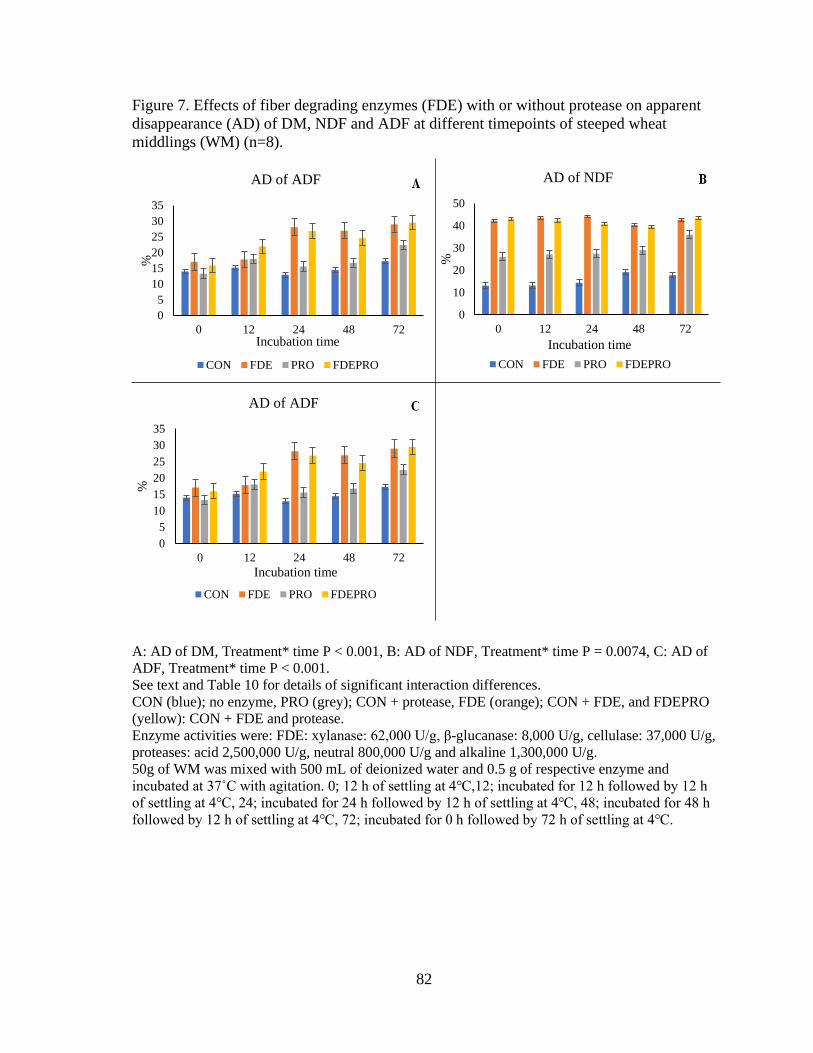
82
Figure 7. Effects of fiber degrading enzymes (FDE) with or without protease on apparent
disappearance (AD) of DM, NDF and ADF at different timepoints of steeped wheat
middlings (WM) (n=8).
A: AD of DM, Treatment* time P < 0.001, B: AD of NDF, Treatment* time P = 0.0074, C: AD of
ADF, Treatment* time P < 0.001.
See text and Table 10 for details of significant interaction differences.
CON (blue); no enzyme, PRO (grey); CON + protease, FDE (orange); CON + FDE, and FDEPRO
(yellow): CON + FDE and protease.
Enzyme activities were: FDE: xylanase: 62,000 U/g, β-glucanase: 8,000 U/g, cellulase: 37,000 U/g,
proteases: acid 2,500,000 U/g, neutral 800,000 U/g and alkaline 1,300,000 U/g.
50g of WM was mixed with 500 mL of deionized water and 0.5 g of respective enzyme and
incubated at 37˚C with agitation. 0; 12 h of settling at 4℃,12; incubated for 12 h followed by 12 h
of settling at 4℃, 24; incubated for 24 h followed by 12 h of settling at 4℃, 48; incubated for 48 h
followed by 12 h of settling at 4℃, 72; incubated for 0 h followed by 72 h of settling at 4℃.
0
5
10
15
20
25
30
35
0 12 24 48 72
%
Incubation time
AD of ADF
CON FDE PRO FDEPRO
0
10
20
30
40
50
0 12 24 48 72
%
Incubation time
AD of NDF
CON FDE PRO FDEPRO
0
5
10
15
20
25
30
35
0 12 24 48 72
%
Incubation time
AD of ADF
CON FDE PRO FDEPRO
83
4 CHAPTER FOUR. Impact of multi-enzyme blend and mono component xylanase
on fiber disappearance and monosaccharide release in ileal digesta from growing
pigs fed corn distillers dried grains with solubles or wheat middlings
4.1 Abstract
Fiber degrading enzymes (FDE) and a single xylanase were applied to digesta
collected from pigs fed corn distillers dried grains with soluble (DDGS) or wheat
middlings (WM) to investigate the effect of enzymes on fiber disappearance, organic acid
and monosaccharide concentration in vitro. Six growing pigs surgically fitted with a T-
cannula at the distal ileum were fed DDGS or WM diet. Diets were fed in two phases.
Each phase was for 12 days and ileal digesta and fecal samples were collected. In vitro
treatments include; 1) DDGS digesta with no enzyme additives (D-CON), 2) D-CON with
FDE mix (D-FDE) 3) D- CON with xylanase (D-XY), 4) WM digesta with no enzyme
additives (W-CON), 5) W-CON with FDE mix (W-FDE) 6) W- CON with xylanase (W-
XY). Briefly, freeze dried digesta were mixed with phosphate buffer with or without
enzymes and were incubated for 24 h at 38℃. The supernatant of each incubated samples
were analyzed for monosaccharide, organic acid concentrations, and the remaining solids
were analyzed for DM and fiber. Pigs fed WM had a greater apparent ileal digestibility
(AID) of NDF and ADF compared to DDGS (P < 0.05). The apparent total tract
digestibility (ATTD) of ADF was greater in DDGS than WM (P < 0.001) but ATTD of
NDF was not different. Enzyme treatments had a higher xylanase activity compared to
CON, however, xylanase activity declined at 24 h (P = 0.02). Disappearance of DM, ADF
and NDF were highest for FDE treatments at 24 h compared to other time and treatments
(P ≤0.03). At all timepoints, FDE had a greater glucose concentration than CON and XY
84
for both DDGS and WM. Xylose was higher for FDE and XY at 8 and 24 h for both
ingredients compared to 0 h and CON (P = 0.004). The arabinose concentration was higher
in W-FDE and W-XY (P < 0.001), and WM at 24 h (P < 0.001) compared to other
treatments and hour. Lactic acid was not detected in DDGS treatments but W-XY was
higher than W-CON (P = 0.012). However, D-CON had the highest acetic acid followed
by D-FDE, D-XY and WM treatments (P < 0.001). The pH was reduced towards 24 h,
however WM had a lower pH than DDGS (P < 0.001). In conclusion, incubating DDGS
and WM digesta for 24 h with FDE improved DM, NDF and ADF disappearance,
however, monosaccharide availability was higher in WM with FDE and XY versus for
DDGS.
4.2 Introduction
The high fiber content in co-products that are being used as pig feed ingredients is
an issue as it can decrease nutrient digestibility and absorption and therefore, compromise
the growth performance of pigs (Stein and Shurson, 2009). It has been reported that the
ATTD of fiber in DDGS is less than 50 % and specifically, reported ATTD of NDF in
DDGS and WM are only 25.3 and 56.2 %, respectively (Stein and Shurson, 2009; Casas et
al., 2018). Therefore, to alleviate the negative effect of adding fibrous co-products to swine
diets, applying fiber degrading enzymes (FDE) is a commonly used strategy as enzymes
can promote hydrolysis and solubilize insoluble fiber fractions and thereby improve the
digestibility and fermentability of nutrients (Jha et al., 2015). A previous study (Rho et al.,
2020) demonstrated the positive effects of applying FDE to co-products, as steeping
DDGS and WM with a FDE mix consisting of xylanase, β-glucanase and cellulase in vitro
85
resulted in increased fiber disappearance and monosaccharide release. However, unlike the
previous study, the efficacy of applying FDE to pig diets containing DDGS or WM has
been reported to be inconsistent (Feoli et al., 2006; Lyberg et al., 2008; Agyekum et al.,
2015; Moran et al., 2016). The reason for inconsistent results of applying FDE is unclear,
however it may be due to the following reasons: 1) different types of fiber within each
ingredient as enzymes are substrate specific, 2) pH and acidic environment across the
gastrointestinal tract (GIT), which may reduce or inactivate the enzyme activity (Selle et
al., 2009; Chen et al., 2016), and 3) enzymes may have an interaction with the microbes
that reside in the GIT, which may be the cause of inconsistent results when enzymes are
applied to pig diet. Therefore, the current study was conducted to determine whether FDE
can further break down fiber fractions that are resistant to upper gut digestion in a
controlled in vitro environment.
The objectives of this study were to determine 1) the enzyme activity among two
co-products over time, 2) the effects of applying FDE mix or xylanase alone to ileal digesta
collected from pigs fed DDGS or WM diets, 3) whether FDE will have different response
on the digesta collected from pigs fed co-products from different cereal grains (corn vs
wheat). It was hypothesized that enzyme activity would remain constant overtime in a
controlled environment. Furthermore, undigested fiber fractions from ileal digesta will be
hydrolyzed more effectively, releasing more monosaccharides with the addition of FDE
mix compared with xylanase alone or no enzymes, particularly for WM digesta.
86
4.3 Materials and methods
Animal care and use protocols were approved by the University of Guelph Animal
Care and Use Committee. Pigs were cared for in accordance with the Canadian Council on
Animal Care guidelines (CCAC, 2009).
4.3.1 Diets and animals
The corn DDGS was obtained from IGPC Inc. (Aylmer, ON, Canada), and WM
were provided by Floradale Feed Mill Ltd. (Floradale, ON, Canada). Two semi-purified
diets were prepared with DDGS or WM. Diets contained 56 % DDGS, or 53 % WM. Diets
were formulated to contain 18 % neutral detergent fiber (NDF), 17 % crude protein, and
3,300 kcal/kg digestible energy (DE). The DDGS and WM were the only source for NDF.
Minerals and vitamins were added to meet nutrient requirements for growing pigs (NRC,
2012), and titanium dioxide was included in both diets at 0.3 % as an indigestible marker.
Enzymes were not added to the diets.
Six barrows (Yorkshire*Landrace ♀ X Duroc ♂; initial BW 30 kg) were obtained
from the University of Guelph’s Arkell research station (Guelph, ON, Canada) and were
housed at the University of Guelph Animal Biosciences department. Pigs were kept in a
temperature controlled (20 to 22℃) room in individual pens lined with plexiglass. Pigs
were surgically fitted with a T-cannula at the end of the ileum before the ileo-cecal
junction (de Lange et al., 1998). To avoid infections, the surgical area was cleaned every
day with warm water, and zinc oxide cream was applied after the area was fully dried.
Experimental diets were fed to pigs when they were approximately 50 kg.
87
Diets were restricted fed to meet 2.8 times maintenance requirements as
recommended in NRC (2012) in two equal meals at 0800 am and 1600 h each day.
Experimental diets were fed separately in two periods such that DDGS diets were fed in
the first period then WM in the second period. The diets were fed in such a way as the
main focus of this study was to test the FDE effect on fiber content from collected digesta
and not digestibility. Each period lasted for 12 days, which consisted of five days of
adaptation followed by two days of grab fecal collection on d 6 and d 7 and four days of
ileal digesta collection on d 8, 9, 11 and 12. Collected fecal samples were pooled by pig
and mixed with a KitchenAid stand mixer (Benton Harbor, MI) then kept in – 20 ℃ prior
to freeze drying. Digesta collection was not conducted on d 10 in order to allow the animal
a day to rest. Ileal digesta samples were collected for 8 hours (0800 am - 1600 pm) by
attaching a plastic bag filled with 10 mL of 10 % formic acid to the cannula with an elastic
band. Plastic bags were exchanged as needed. Once collected, samples were immediately
stored in a fridge and were pooled by each pig at the end of the collection. Pooled ileal
digesta samples were freeze dried (Stellar® Laboratory Freeze Dryer, Millrock
Technology, Kingston, NY, USA) and finely ground with a coffee grinder (KitchenAid,
Benton Harbor, MI) before further analyses.
4.3.2 In vitro incubation of ileal digesta
Due to the space and time limitation, it was not possible to run in vitro incubation
for digesta from individual pigs, therefore, collected digesta from six pigs were pooled by
diet: DDGS digesta and WM digesta. Before pooling the digesta, AID of DM, NDF, ADF
88
were analyzed to confirm the variation of digestibility from pig to pig. The finely ground
freeze dried digesta samples from each pig were pooled into the KitchenAid stand mixer
(Benton Harbor, MI) and were mixed.
Three in vitro treatments were each tested on pooled DDGS digesta and WM
digesta, making six treatments in total. The treatments were; 1) 4 g of freeze dried DDGS
digesta with no enzyme additives (D-CON), 2) D-CON with 0.04 g of FDE mix (D-FDE)
3) D- CON with 0.03 g of xylanase (D-XY), 4) 4 g of freeze dried WM digesta with no
enzyme additives (W-CON), 5) W-CON with 0.04 g of FDE mix (W-FDE) 6) W- CON
with 0.03 g of xylanase (W-XY). Enzyme activities (U/g) in FDE were: 62,000, 8,000,
and 37,000 for xylanase, β-glucanase and cellulase, respectively, whereas XY had 240,000
U of xylanase.
Briefly, in a 50-mL tube, 4 g of freeze dried ileal digesta (DDGS digesta or WM
digesta) was mixed with 20 mL of phosphate buffer (0.1M, pH 6.0). The tubes were sealed
tightly with parafilm and a plastic lid and were incubated for 24 h. The 24 h length was
selected since the highest concentration of monosaccharides was released at 12 and/or 24 h
in a previous study (Rho et al., 2020). For FDE treatments (D-FDE and W-FDE), 0.04 g of
FDE was added for target xylanase activity of 62,000 U/g. For XY treatments (D-XY and
W-XY), 0.03 g of xylanase target activity was 186,000 U/g, 3 times xylanase activity of
FDE treatment. This was to determine whether single xylanase with higher enzyme activity
can be more effective than a combination of FDE with lower activity of xylanase. A total
of 3 sets of incubations were performed. For each incubation, three samples per treatment
and time points were put into the water bath to obtain a total of 9 samples per treatment
(CON, FDE and XY) per time point (0, 8, and 24 h). The water bath (Thermo precision
89
2870 shaking water bath, Fisher Scientific, Toronto, ON, Canada) was maintained at 38℃
with continuous agitation.
Samples for 0 h were not incubated and were sampled right after mixing. Individual
sample tubes were taken out from the water bath at a regular interval (8 and 24 h), pH was
measured, and the tubes were immediately stored at -20 ˚C until further analyses.
4.3.3 Sample processing and laboratory analyses
The diets and freeze dried ileal digesta and fecal samples collected from pigs were
ground finely with a coffee grinder (KitchenAid, Benton Harbor, MI) and analyzed for dry
matter (DM), ash, crude protein, crude fat, titanium dioxide, neutral detergent fiber (NDF)
and acid detergent fiber (ADF). Samples from in vitro incubation were thawed and were
centrifuged at 30,000 g for 15 min at 4℃. The supernatant was collected and transferred
into 2-mL tubes and stored at -20 ˚C for monosaccharides and organic acid analyses. The
remaining solids were freeze dried and stored at -4 ˚C until required for DM, NDF and
ADF analyses.
Dry matter and ash contents were analyzed by using method 930.15 (AOAC, 2004)
and method 942.05 (AOAC, 2004), respectively. Crude protein (CP) was determined by
nitrogen analysis using method 968.06 (AOAC,2004) with a CNS-2000 carbon, N, and
sulfur analyzer (Leco Corporation, St. Joseph, MI, USA). Titanium content was measured
on a UV spectrophotometer following the method described by Myers et al. (2004). The
analyzed N value was multiplied by 6.25 for the CP value. Neutral detergent fiber and ADF
concentrations were analyzed by methods described by Van Soest et al. (1991), using the
Ankom 200 Fiber Analyzer (Ankom Technology, Macedon, NY, USA).
90
Organic acid (lactic and acetic acid) and monosaccharides (arabinose, xylose and
glucose) concentrations in supernatants from the in vitro experiment were analyzed using
high-performance liquid chromatography (HPLC) (Agilent 1100 Series, Agilent
Technologies, Santa Clara, CA, USA) following the method described in the previous
chapter (Chapter 3). Briefly, samples were vigorously mixed by vortexing followed by
centrifuged at 30,000 g for 15 minutes at 4 ℃. Before transferring the samples to the HPLC
vials, 640 µL of 0.005 N H2SO4, was mixed with 60 µL of sample supernatant. The mixed
sample was then filtered with a 13mm syringe filter (Fisher Scientific, Toronto, ON, Canada)
and transferred to HPLC vials. Prepared samples were separated over a 300 x 7.8 mm 8µ
Rezex™ ROA-Organic Acid H+ (8%) column (Phenomenex, Torrance, CA, USA). The
HPLC was set as follows for analysis: column temperature, 60°C; injection volume, 20μl;
detector temperature, 400°C; mobile phase (0.005 N sulfuric acid) velocity, 0.5ml/min; cycle
time 45 min. The retention times for lactic and acetic acid, glucose, xylose and arabinose
were found to be 16.9, 19.9, 12.5, 13.4 and 14.4 min, respectively.
Xylanase (endo-ß-(l,4)-xylanase; EC 3.2.1.8) activity was determined by the method
described by McCleary and McGeough (2015) with modification. Briefly, test tubes with 1-
mL wheat arabinoxylan substrate (Arabinoxylan Wheat Flour; Megazyme, Bray, Ireland)
were pre-equilibrated for 5 min at 40°C. Supernatant of incubated samples were diluted with
acetic acid buffer (pH 4.5), and by adding 1-mL of diluted samples to the test tube, the
reaction was initiated. The reaction was terminated after 10 min of incubation by adding 2-
ml 3,5-dinitro salicylic acid (DNS) reagent, followed by boiling for 8 min. The absorbance
was measured at 540 nm after cooling, with a spectrophotometer (Cytation 5, BioTek
Instruments, Inc, USA). The activity was calculated as µmol of xylose reducing sugar
91
equivalent released per minute. One unit is the amount of enzyme which will produce 1 μmol
of reducing sugar (expressed as xylose) per minute at 40 °C and pH 4.5.
4.3.4 Calculation and statistics
The AID and ATTD were calculated according to de Lange et al. (1998), with the
following equation.
𝐴𝐼𝐷 𝑜𝑟 𝐴𝑇𝑇𝐷 𝑜𝑓 𝑛𝑢𝑡𝑟𝑖𝑒𝑛𝑡 (%) = (1 − (𝑁𝑑
𝑁𝑓) ∗ (
𝑇𝑑
𝑇𝑓)) × 100
Where Nd represents nutrient concentration in the digesta or feces and Nf representing
nutrient concentration in the feed. The Tf and Td represents titanium concentration in feed
and in the digesta or feces, respectively.
The disappearance of DM, NDF and ADF was calculated with the equation below.
It was calculated relative to unincubated values (0 h).
𝐷𝑖𝑠𝑎𝑝𝑝𝑒𝑎𝑟𝑎𝑛𝑐𝑒, %
=𝐶𝑜𝑛𝑐𝑒𝑛𝑡𝑟𝑎𝑡𝑖𝑜𝑛 𝑎𝑡 0 ℎ 𝑜𝑓 𝑖𝑛𝑐𝑢𝑏𝑎𝑡𝑖𝑜𝑛 − 𝑐𝑜𝑛𝑐𝑒𝑛𝑡𝑟𝑎𝑡𝑖𝑜𝑛 𝑎𝑓𝑡𝑒𝑟 𝑖𝑛𝑐𝑢𝑏𝑎𝑡𝑖𝑜𝑛
𝐶𝑜𝑛𝑐𝑒𝑛𝑡𝑟𝑎𝑡𝑖𝑜𝑛 𝑎𝑡 0 ℎ 𝑜𝑓 𝑖𝑛𝑐𝑢𝑏𝑎𝑡𝑖𝑜𝑛
× 100
The disappearance was calculated for DM, NDF or ADF. Concentration at 0 h
incubation refers to the freeze dried ileal digesta (either DDGS or WM digesta) mixed well
with 20 mL phosphate buffer (pH 6) solution with or without enzymes and was not
incubated. Concentration after incubation refers to freeze dried ileal digesta (either DDGS
or WM digesta) mixed well with 20 mL phosphate buffer solution with or without enzymes
and incubated for 8 or 24 h.
92
All data were analyzed using the GLIMMIX procedure of SAS 9.2 (SAS Inst. Inc.,
Cary, NC). The apparent ileal digestibility (AID) and apparent total tract digestibility
(ATTD) of DM, NDF and ADF was analyzed with ingredient (diet type) as fixed effect.
Model for monosaccharides, organic acid concentrations, xylanase activity and pH
of post incubation liquid medium and DM, NDF and ADF disappearance in the residue had
ingredient (DDGS vs WM), treatment (CON vs FDE vs XY), time (0 vs 8 vs 24), and their
interactions as fixed effects. Batches of steeping was set as a random effect. Means were
calculated using the LSMEANS statement in SAS and differences were separated by using
the Tukey’s test. A P-value below 0.05 was used to determine significance among dietary
treatments.
4.4 Results
All pigs were successfully cannulated and had no issues throughout the study with
exception of one pig that was euthanized when feeding WM diet due to cannula becoming
detached. Therefore, there were only 5 observations for WM data. Experimental diet
compositions are shown in Table 11. The NDF and CP of formulated diets were higher
than expected values.
4.4.1 Apparent ileal digestibility (AID) and apparent total tract digestibility (ATTD)
The AID and ATTD of DM, NDF, ADF, CP, fat and GE are shown in Table 12.
The WM had a greater AID of DM, NDF, ADF, CP and GE (P < 0.05) compared to
93
DDGS, however, AID of fat was higher in DDGS (P = 0.033). The AID of NDF and ADF
was 30.21 and 26.43 % for DDGS and 33.32 and 29.48 % for WM, respectively. The
ATTD of DM, CP and GE were higher (P < 0.05) for WM diet compared to DDGS diet.
There was no difference in ATTD of fat and NDF between diets however, ATTD of ADF
was greater for DDGS (P < 0.0001), which was 56.77 % for DDGS and 40.34 % for WM.
4.4.2 Xylanase activity
Xylanase activity data in the supernatant of incubated digesta are shown in Figure
8. There were treatment by time (P = 0.002), ingredient by time (P = 0.025), and treatment
by ingredient (P < 0.001) interactions. For the treatment by time interaction, XY at 0 and 8
h had the highest xylanase activity whereas CON had the least xylanase activity among
other treatments at any time point. The xylanase activity in the incubated digesta for XY at
24 h was lower than XY at 0, 8 h, however, xylanase activity of XY was greater than FDE
at all time points. The xylanase activity for FDE was greater at 0 h than at 24 h, while
intermediate xylanase activity was observed at 8 h. In all treatments, the xylanase activity
decreased by 24 h (P = 0.02). The ingredient by time interaction was such that incubated
digesta from pigs fed DDGS had a greater xylanase activity than in digesta from pigs fed
WM at all time points (P = 0.025). The xylanase activity of digesta from pigs fed DDGS at
24 h was lower than 0 and 8 h. Ingredient by treatment interactions showed that the
xylanase activity was highest in D-XY followed by D-FDE, W-XY, W-FDE and CON
treatments (P < 0.001).
94
4.4.3 Disappearance of DM, NDF and ADF concentration in post-incubation
residuals
The disappearance of DM, NDF and ADF are shown in Table 13. There was a
treatment by ingredient interaction (P = 0.01), treatment by time interaction (P = 0.03) and,
ingredient by time interaction (P < 0.01) for DM disappearance. The treatment by
ingredient interaction (P = 0.01) was such that both D-FDE and W- FDE had a greater DM
disappearance compared to CON of DDGS and WM and W-XY, however, D-XY was not
different from FDE treated DDGS and WM, and W-XY. The lowest DM disappearance
was seen in D-CON, but W-CON and W-XY were not different to D-CON. For treatment
by time interaction (P = 0.03), FDE at 24 h had a greater DM disappearance compared to
any other treatment at 8 or 24 h. The XY at 24 h had a greater DM disappearance than XY
at 8 h, and CON at 8 and 24 h, but, FDE at 8 h was not different. The interaction between
ingredient and time (P < 0.01) was such that DDGS at 24 h had a greater DM
disappearance compared to DDGS and WM at 8 h, however, at 24 h WM and DDGS had
similar DM disappearance, which were comparable to WM at 8 h.
For ADF and NDF disappearance, there were treatment by ingredient (P ≤ 0.01)
and treatment by time (P < 0.01) interactions. The treatment by ingredient interaction (P =
0.01) effect for disappearance of ADF was such that the highest disappearance was seen
for digesta from pigs fed DDGS-FDE and digesta from pigs fed WM-FDE followed by W-
XY, D-XY and CON of both ingredients. The effect of treatment and time interactions of
ADF disappearance showed that the FDE at 24 h had the greatest ADF disappearance
compared to other treatments and times. The ADF disappearance of FDE at 8 h was higher
than CON at 8 and 24 h, and XY at 8 h, but XY at 24 h was not different to FDE at 8 h but
95
greater than CON 8 and 24 h (P < 0.01). The treatment by ingredient interaction (P <
0.001) on NDF disappearance showed that W-FDE was greater than other treatments and
ingredients except that W- XY was not different from W-FDE. There was no difference
among W-XY, D-XY, D-FDE, and D-CON. The W-CON had a lower NDF disappearance
than D- FDE, however D-CON was not different with either one of them. The
disappearance of NDF was influenced by the interaction of treatment by time (P = 0.001).
The FED at 24 h had greater NDF disappearance compared to other treatments and times.
The XY at 24 h had a greater NDF disappearance than CON at 8, 24 h and XY at 8 h,
however, FDE at 8 h was not different to XY at 24 h, CON at 8 and 24 h.
4.4.4 Monosaccharide concentrations in supernatant of incubated samples
Monosaccharide concentrations in the supernatant of incubated digesta including
glucose, xylose and arabinose concentrations are shown in Table 14. There were treatment,
time and ingredient interaction effect for glucose and xylose concentrations (P ≤ 0.004).
The interaction effect of glucose showed that in the two ingredients and treatments,
glucose concentration increased over time. The highest glucose concentration was
observed in W-FDE at 24 h. The lowest glucose concentration was seen in D-CON and D-
XY at all time points. At 0 h, D-CON and D-XY had the lowest glucose concentrations
compared to any other treatment. The glucose concentration at 0 h of D-CON was 3.49 and
for W-CON was 16.90 mmol. At all timepoints, FDE had a greater glucose concentration
than CON and XY for both DDGS and WM. At 24 h, glucose concentration for D-XY and
D- FDE was 1.19 and 5.35 times greater compared to D-CON, and for W-XY and W-FDE
was 1.31 and 1.80 times greater than W-CON.
96
The treatment, time and interaction (P = 0.004) effects on xylose concentration were such
that the highest xylose concentration was observed at 8 and 24 h, in WM-XY and WM-
FDE compared to other treatments. At 0 h, digesta from pigs fed WM treated with
enzymes had a higher xylose concentration then CON at 0 and 8 h and the DDGS
treatments of all time points. The W-CON at 24 h was not different to W-XY and W- FDE
at 0 h or W-CON at 8 h. For digesta from pigs fed DDGS, there was no difference in
xylose concentration over time and xylose concentration was not affected by treatments.
The arabinose concentration had a treatment and ingredient interaction (P < 0.05)
as well as time and ingredient interaction (P < 0.05). The highest arabinose concentration
was seen for W-XY and W-FDE compared to other treatments and ingredients. The D-
FDE had a greater arabinose concentration compared to D-CON and D-XY however, the
arabinose concentration was lower than WM digesta treatments. The time and ingredient
interaction (P < 0.05) effect was such that arabinose concentration was highest at 24 h for
digesta from pigs fed WM compared to other time points of DDGS digesta and WM
digesta. For WM digesta, arabinose concentration increased over time, however, there was
no significant differences across timepoints for digesta from pigs fed DDGS. The
arabinose concentration for WM digesta was greater than in DDGS digesta at all time
points.
4.4.5 Organic acids and pH in supernatant of incubated samples
The organic acid concentration and pH are shown in Table 15. Lactic acid
concentration had a treatment by ingredient interaction (P = 0.012). The WM digesta
treatments had a greater concentration compared to DDGS digesta as lactic acid
97
concentration was not detected for DDGS digesta. The highest lactic acid concentration
was seen at W- XY followed by W-FDE and W-CON.
There were treatment by ingredient, and ingredient by time interactions (P < 0.05)
for acetic acid concentration. All treatments for digesta from pigs fed DDGS had a greater
acetic acid concentration compared to WM digesta treatments. Among WM digesta
treatments, W-XY and W-FDE had a greater acetic acid concentration than W-CON. The
ingredient and time interaction for acetic acid was such that acetic acid concentration was
not different among DDGS digesta treatments at different time point, however DDGS
digesta at any timepoint was greater than in WM digesta treatments. The WM digesta at 24
h had a greater acetic acid concentration than WM digesta at 0 h, however, WM digesta at
8 h was not different from either.
The pH had a time by ingredient interaction effect (P < 0.001). Over time pH
decreased for both digestas. The pH for DDGS digesta at 8 and 24 h had the lowest pH,
while WM digesta at 0 and 8 h was the highest. The pH for DDGS digesta was higher for 0
h compared to DDGS digesta at 8 and 24 h, but 8 and 24 h was not different. The DDGS
digesta at 8 and 24 h had the lowest pH, while WM digesta at 8 h was the highest.
4.5 Discussion
The current study was performed to determine whether fiber components from
digesta collected from pigs fed two different co-products (DDGS vs WM) can be further
broken down by XY and FDE using an in vitro method. The purpose of using phosphate
buffer (0.1 M, pH 6) was to mimic the GIT pH environment as pH ranges from 5 to 7 in
the ileum to large intestine. This allows to determine whether enzymes can be effective in
98
breaking down unbroken fiber fraction in the digesta in a similar pH environment as the
GIT. However, the microbial inoculum was not added in the in vitro incubation and formic
acid was added during ileal digesta collection. Therefore, we can assume that there was
less microbial activity and fermentation than in other published in vitro studies, and the
reduction of fiber concentration and increase of sugar concentration is mainly due to the
enzyme effect.
The CP, crude fat, NDF and ADF were 31.1, 8.7, 36.5 and 12.4 % (on DM basis)
of DDGS and 18.9, 4.61, 40.5 and 13.7 % (on DM basis) for WM, respectively; the
monosaccharide linkage is reported in the previous chapter (Chapter 3). The nutrient
composition of the ingredients was similar to that reported in previous studies (De Jong et
al., 2014; Casas et al., 2018). Both diets were formulated for a target of 18% NDF.
However, DDGS and WM diet had 1.05 and 1.08 times more NDF than expected.
The greater AID of NDF and ADF seen for WM diets than in DDGS diets agrees
with previous studies (Kiarie et al., 2016c; Jaworski and Stein, 2017)). This may be due to
the difference in fiber structure in the two ingredients. For instance, DDGS is a co-product
that has gone through enzyme fermentation and heat treatment. Therefore, it is possible
that the Millard reaction may have occurred during the process, which can create an
aggregate of protein and fiber in grain components that survived different steps of the
ethanol production process (Jha et al., 2015). However, due to the greater fat concentration
in the DDGS, AID of fat was higher in DDGS fed pigs compared to WM fed pigs. (4.1 %
vs 2.1 %). The greater AID of CP in WM diet compared to DDGS diet may be due to the
higher inclusion of blood meal and it’s CP digestibility (NRC., 2012).
99
The AID and ATTD of GE were lower for the DDGS diet compared to the WM
diet, which agrees with the results found from Widyaratne and Zijlstra (2007); Jaworski
and Stein (2017). The greater AID and ATTD of GE in WM is likely due to greater
digestibility of nutrients compared to DDGS. Not only that, the greater ATTD of GE in
WM may also be due to higher soluble fiber concentration in WM than in DDGS, as
soluble fibers are easier to ferment compared to insoluble fibers (Bach Knudsen, 2014;
Jaworski and Stein, 2017). Therefore, a higher concentration of soluble fiber can contribute
to increased ATTD of GE. The soluble fiber concentration was not measured in the current
study, however Jaworski and Stein (2017) reported that the soluble and insoluble fiber
concentration was 2.64, 34.47 % in WM, and 1.74, 36.98 % in DDGS, which is 1.52 times
more soluble fiber in WM than in DDGS.
The greater xylanase activity in XY than in FDE was expected as XY had 3 times
more xylanase activity included. However, within each enzyme treatment (FDE and XY),
xylanase activity was reduced over time. This may be due to the buffer solution (pH 6)
or/and the temperature (38℃) used during the incubation period. It has been found that
xylanase stability for pH ranges from pH 3 to 10, and for temperature is from 25 to 60°C
(Bhardwaj et al., 2019), however the optimum pH and temperature for xylanase is pH 5
and 60°C (Isil and Nilufer, 2005). Another explanation is that the enzymes (XY and FDE)
may have reached their turnover number. The turnover number is the number of moles of
substrate that can be converted by mole of enzymes, therefore the reduction in the
concentration of substrates overtime may have caused the rate of enzyme activity to slow
down or to be reduced (Robinson, 2015).
100
The xylanase activity was greater in DDGS digesta treatments than in WM digesta
treatments at all timepoints, which may be due to xylanase inhibitors in wheat. The two
types of proteinaceous xylanase inhibitors in cereals are Triticum aestivum xylanase
inhibitor-type (TAXI) and xylanase inhibitor protein-type (XIP). The TAXI-types are
commonly found in wheat, barley and rye. The XIP-type are also seen in the previously
mentioned grains and also in corn and rice (Gusakov, 2010), however, the activity level are
lower or below the detectable level for corn and rice (Elliott et al., 2003a; Goesaert et al.,
2004). Both TAXI, and XIP are competitive inhibitors, which inhibits fungal and bacterial
xylanase by competing for the active site of the xylanases (Fierens et al., 2007). Therefore,
although not analyzed for, a greater chance of having xylanase inhibitors in WM may have
reduced the xylanase activity in the current study.
The disappearance of DM in D-FDE and D-XY was 2.90 and 2.49 time more than
D-CON, and W-FDE and W-XY were 2.13 and 1.07 times more than W-CON. The greater
DM disappearance with FDE agrees with previous research. Jha et al. (2015) observed
increased degradation of corn/wheat DDGS when multi-carbohydrase were applied in an in
vitro porcine fermentation. This can be explained by multiple enzymes in FDE breaking
down different parts and layers of insoluble fibers. The DM disappearance was highest at
24 h in DDGS digesta treatments while no difference was observed in DM disappearance
in WM digesta treatments between timepoints. This may be due to more soluble fiber and
less insoluble fiber in WM than in DDGS (Jaworski and Stein, 2017). The soluble fiber can
be easily degraded, while insoluble fibers are much more crystalline therefore, it takes a
much longer time for degradation (Wilfart et al., 2007). The differences and complexity of
fiber stem from cell walls formed with a mix of polysaccharides, protein and phenolic
101
compounds (Bach Knudsen, 2008). The different formation of polysaccharides, due to two
ring form of monosaccharides (pyranose vs furanose) and possible location of linkages,
results in various three-dimensional conformations (Bach Knudsen, 2008).
The FDE had a greater effect on NDF disappearance in WM digesta, compared to
DDGS digesta. The WM undergoes minimal to no drying and fermentation during
processing compared to DDGS. Therefore, the fiber fraction in WM may have been more
easily degraded which can be explained by greater AID of NDF and ADF in WM
compared to DDGS. Moreover, the increase in NDF disappearance may also be due to the
higher hemicellulose content in WM than in DDGS (Jaworski and Stein, 2017).
Hemicelluloses are heteropolysaccharides consisting of xylan backbones in plant cell walls
such as arabinoxylans and mixed-linked β-glucans (Harris and Ramalingam, 2010;
Rumpagaporn et al., 2015). Therefore, the xylanase, β-glucanase and cellulase in FDE
could have been more effective in breaking down hemicellulose components in WM
digesta. The greater fiber (NDF and ADF) disappearance at 24 h in FDE compared to XY
and CON can be explained by the synergic effect of time and multiple carbohydrases
targeting different parts of fiber fractions more effectively. As stated above, due to the
crystalline structure much longer time is needed to break down insoluble fiber (Wilfart et
al., 2007).
The ADF includes cellulose and lignin therefore, the greater ADF disappearance in
FDE than in XY or CON in both DDGS and WM may be explained by mostly cellulose
degradation, by cellulase in FDE. Cellulose is an insoluble highly crystalline NSP that is
found in most of plant cell walls and is composed of a linear homopolymer of β-1-4 linked
D-glucose units (Bach Knudsen, 2014). The β-(1–4) linkage of glucose units forms a flat
102
configuration that can be stacked together to form larger microfibrils. This linear structure
makes cellulose resistant to degradation in humans and animals’ (excluding ruminant
animals) digestive tract.
Lignin degradation may also play a part in increased ADF disappearance however,
even with time, only small amounts of lignin can be solubilized but not digested. Lignin is
also resistant to bacterial and fungal degradation (in the rumen) (Bach Knudsen, 2014;
Raffrenato et al., 2017). Therefore, the contribution of lignin disappearance in ADF
concentration may be minimal.
In the current study, the detergent fiber method (Van Soest, 1963) was used to
determine dietary fiber components, although this method does not measure soluble fiber
which can underestimate the total dietary fiber (Dhingra et al., 2012). However, the soluble
fiber content ranges from 0 to 1.6 % in DDGS (Urriola et al., 2010) and 1.10 to 3.90 % in
WM (Casas et al., 2018). Not only that, soluble fibers are mostly digested in the upper gut,
therefore, the detergent fiber method is thought to be appropriate in determining fiber
content in the current study.
The glucose concentration at 0 h of supernatant of DDGS digesta was 3.49 and
WM digesta was 16.90 mmol. This is likely due to WM containing more starch than
DDGS (Erickson et al., 1985b). The glucose concentration was greater for FDE compared
to XY among each ingredient. The xylanase, β-glucanase and cellulase in FDE can target
the interconnected hemicellulose and cellulose microfibrils (Somerville et al., 2004). The
greater glucose seen at 24 h for W-FDE compared to D-FDE may be due to greater
cellulose concentration in DDGS as the cellulose concentration in DDGS and WM was
reported to be 12.95 and 6.62 %, respectively (Jaworski and Stein, 2017). Due to the
103
stacked complex microfibril structure, the cellulase may not have been as effective as the
concentration of cellulose is higher. Also, the greater glucose concentration in W-FDE may
be due to resistant starch 1 (RS1) type starch which is resistant to upper gut digestion. The
RS1 type starch are starches that are physically inaccessible as they are located inside the
fiber-protein matrix (Tiwari et al., 2019). Therefore, the FDE may have released the
trapped starch from fiber hydrolysis.
Although β-glucans concentration is not as high as in oats and barley, wheat bran
has greater β-glucan content than corn bran (Bach Knudsen, 2014). The distilling process
of DDGS also results in less soluble fiber fractions. Therefore, it can be assumed that WM
contains more β-glucan than DDGS. The β-glucanase targets β-glucan which is a linear
homopolymer of D-glucose residue like cellulose. The difference from cellulose is that the
residues are linked by two or three β-1,4-linkages with a single β-1,3-linkage in between
(Mathlouthi et al., 2002). This structure makes β-glucan much more easily degradable
(Karppinen et al., 2000).
The concentration of arabinoxylan relative to total NSP is greater in DDGS than in
WM (49 % vs. 41 %) (Jaworski et al., 2015). However, the release of arabinose and xylose
were greater in WM treatments compared to DDGS treatments. The greater arabinose to
xylose ratio (A/X) and uronic acid to xylose ratio (U/X) in corn DDGS compared to wheat
co-products (wheat DDGS and WM) was reported in several studies (Pedersen et al., 2014;
Pedersen et al., 2015b; Zeng et al., 2018b). The greater A/X is related to a negative
relationship with enzyme efficacy as it indicates a more complex structure of heteroxylan
in corn DDGS than in wheat co-products (Pedersen et al., 2014). Also, ferulic acid can be
linked to C(O)-5 position of arabinose through ester linkage forms a cross-linking of
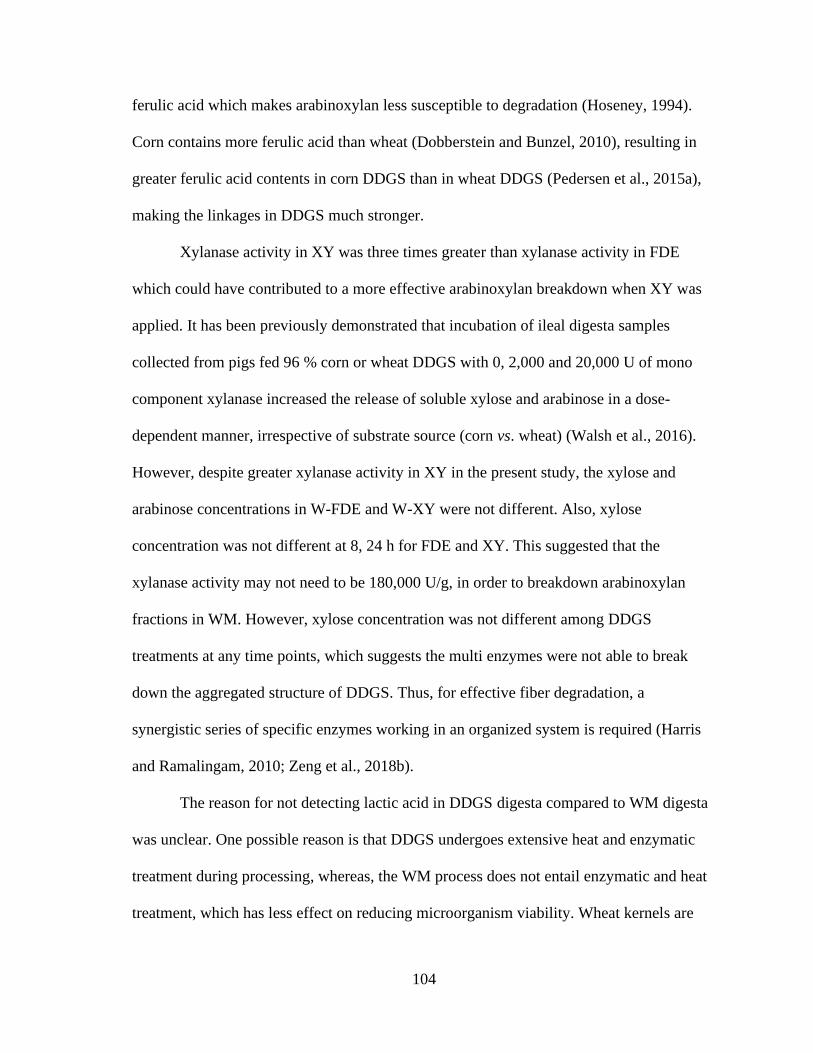
104
ferulic acid which makes arabinoxylan less susceptible to degradation (Hoseney, 1994).
Corn contains more ferulic acid than wheat (Dobberstein and Bunzel, 2010), resulting in
greater ferulic acid contents in corn DDGS than in wheat DDGS (Pedersen et al., 2015a),
making the linkages in DDGS much stronger.
Xylanase activity in XY was three times greater than xylanase activity in FDE
which could have contributed to a more effective arabinoxylan breakdown when XY was
applied. It has been previously demonstrated that incubation of ileal digesta samples
collected from pigs fed 96 % corn or wheat DDGS with 0, 2,000 and 20,000 U of mono
component xylanase increased the release of soluble xylose and arabinose in a dose-
dependent manner, irrespective of substrate source (corn vs. wheat) (Walsh et al., 2016).
However, despite greater xylanase activity in XY in the present study, the xylose and
arabinose concentrations in W-FDE and W-XY were not different. Also, xylose
concentration was not different at 8, 24 h for FDE and XY. This suggested that the
xylanase activity may not need to be 180,000 U/g, in order to breakdown arabinoxylan
fractions in WM. However, xylose concentration was not different among DDGS
treatments at any time points, which suggests the multi enzymes were not able to break
down the aggregated structure of DDGS. Thus, for effective fiber degradation, a
synergistic series of specific enzymes working in an organized system is required (Harris
and Ramalingam, 2010; Zeng et al., 2018b).
The reason for not detecting lactic acid in DDGS digesta compared to WM digesta
was unclear. One possible reason is that DDGS undergoes extensive heat and enzymatic
treatment during processing, whereas, the WM process does not entail enzymatic and heat
treatment, which has less effect on reducing microorganism viability. Wheat kernels are
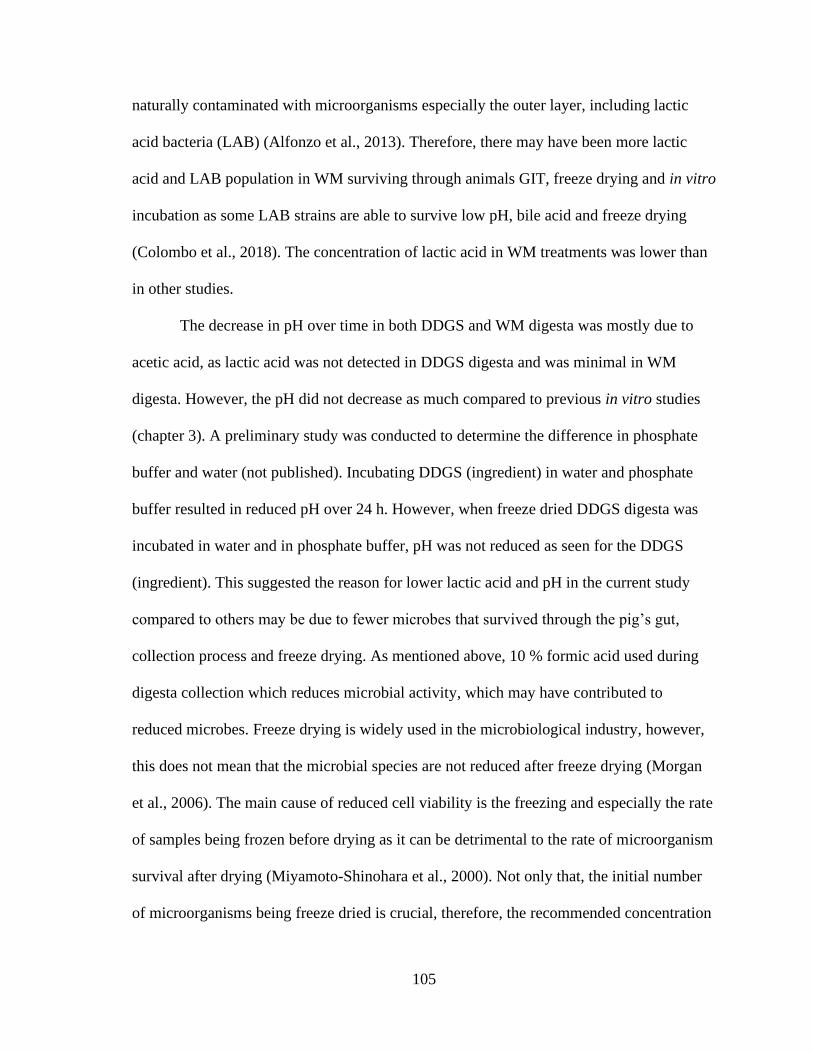
105
naturally contaminated with microorganisms especially the outer layer, including lactic
acid bacteria (LAB) (Alfonzo et al., 2013). Therefore, there may have been more lactic
acid and LAB population in WM surviving through animals GIT, freeze drying and in vitro
incubation as some LAB strains are able to survive low pH, bile acid and freeze drying
(Colombo et al., 2018). The concentration of lactic acid in WM treatments was lower than
in other studies.
The decrease in pH over time in both DDGS and WM digesta was mostly due to
acetic acid, as lactic acid was not detected in DDGS digesta and was minimal in WM
digesta. However, the pH did not decrease as much compared to previous in vitro studies
(chapter 3). A preliminary study was conducted to determine the difference in phosphate
buffer and water (not published). Incubating DDGS (ingredient) in water and phosphate
buffer resulted in reduced pH over 24 h. However, when freeze dried DDGS digesta was
incubated in water and in phosphate buffer, pH was not reduced as seen for the DDGS
(ingredient). This suggested the reason for lower lactic acid and pH in the current study
compared to others may be due to fewer microbes that survived through the pig’s gut,
collection process and freeze drying. As mentioned above, 10 % formic acid used during
digesta collection which reduces microbial activity, which may have contributed to
reduced microbes. Freeze drying is widely used in the microbiological industry, however,
this does not mean that the microbial species are not reduced after freeze drying (Morgan
et al., 2006). The main cause of reduced cell viability is the freezing and especially the rate
of samples being frozen before drying as it can be detrimental to the rate of microorganism
survival after drying (Miyamoto-Shinohara et al., 2000). Not only that, the initial number
of microorganisms being freeze dried is crucial, therefore, the recommended concentration
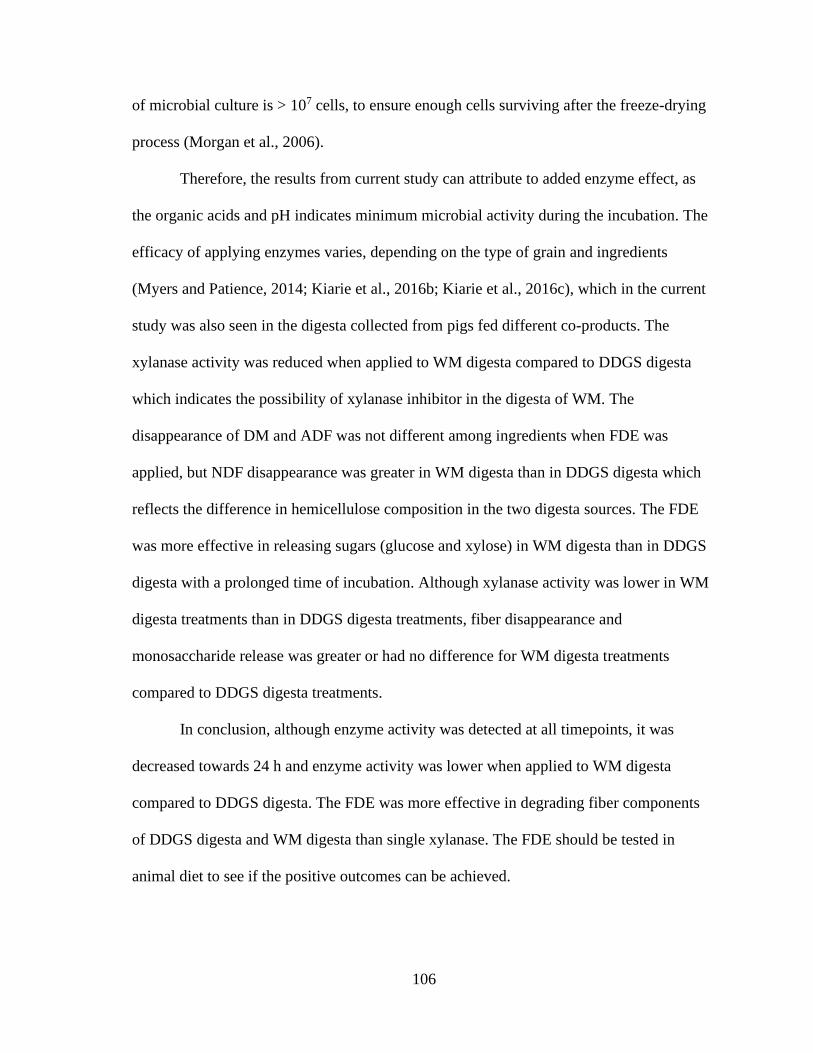
106
of microbial culture is > 107 cells, to ensure enough cells surviving after the freeze-drying
process (Morgan et al., 2006).
Therefore, the results from current study can attribute to added enzyme effect, as
the organic acids and pH indicates minimum microbial activity during the incubation. The
efficacy of applying enzymes varies, depending on the type of grain and ingredients
(Myers and Patience, 2014; Kiarie et al., 2016b; Kiarie et al., 2016c), which in the current
study was also seen in the digesta collected from pigs fed different co-products. The
xylanase activity was reduced when applied to WM digesta compared to DDGS digesta
which indicates the possibility of xylanase inhibitor in the digesta of WM. The
disappearance of DM and ADF was not different among ingredients when FDE was
applied, but NDF disappearance was greater in WM digesta than in DDGS digesta which
reflects the difference in hemicellulose composition in the two digesta sources. The FDE
was more effective in releasing sugars (glucose and xylose) in WM digesta than in DDGS
digesta with a prolonged time of incubation. Although xylanase activity was lower in WM
digesta treatments than in DDGS digesta treatments, fiber disappearance and
monosaccharide release was greater or had no difference for WM digesta treatments
compared to DDGS digesta treatments.
In conclusion, although enzyme activity was detected at all timepoints, it was
decreased towards 24 h and enzyme activity was lower when applied to WM digesta
compared to DDGS digesta. The FDE was more effective in degrading fiber components
of DDGS digesta and WM digesta than single xylanase. The FDE should be tested in
animal diet to see if the positive outcomes can be achieved.
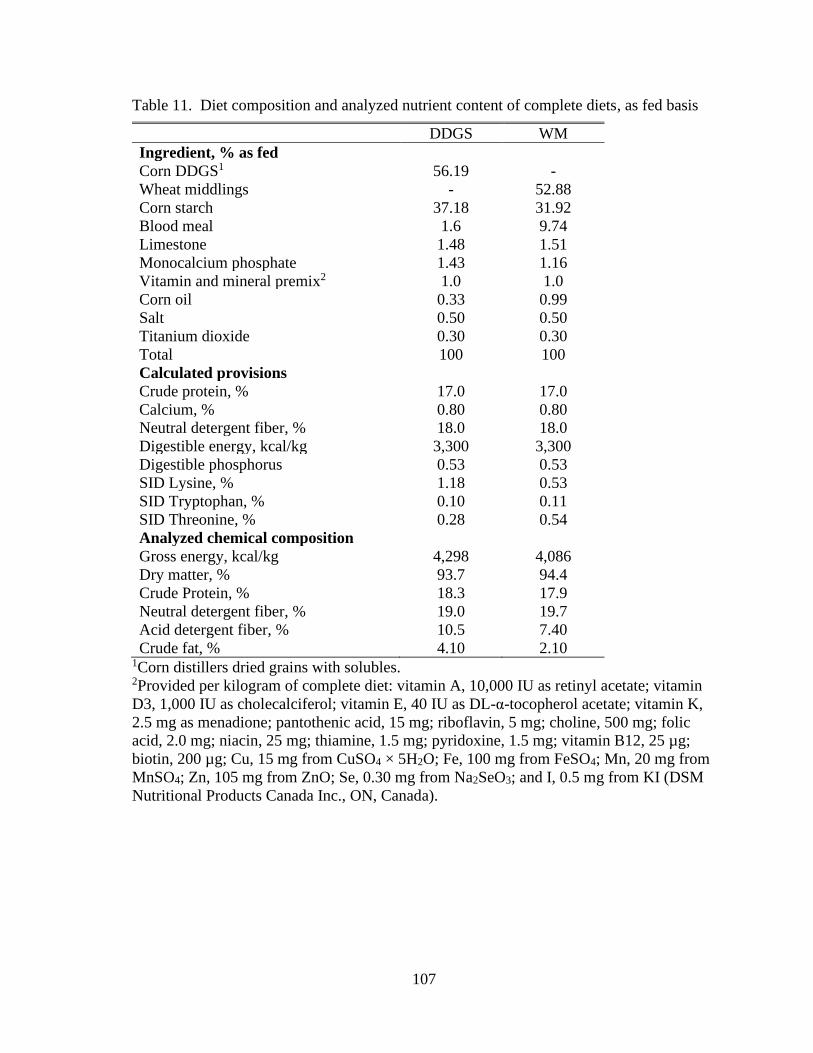
107
Table 11. Diet composition and analyzed nutrient content of complete diets, as fed basis
DDGS WM
Ingredient, % as fed
Corn DDGS1 56.19 -
Wheat middlings - 52.88
Corn starch 37.18 31.92
Blood meal 1.6 9.74
Limestone 1.48 1.51
Monocalcium phosphate 1.43 1.16
Vitamin and mineral premix2 1.0 1.0
Corn oil 0.33 0.99
Salt 0.50 0.50
Titanium dioxide 0.30 0.30
Total 100 100
Calculated provisions Crude protein, % 17.0 17.0
Calcium, % 0.80 0.80
Neutral detergent fiber, % 18.0 18.0
Digestible energy, kcal/kg 3,300 3,300
Digestible phosphorus 0.53 0.53
SID Lysine, % 1.18 0.53
SID Tryptophan, % 0.10 0.11
SID Threonine, % 0.28 0.54
Analyzed chemical composition
Gross energy, kcal/kg 4,298 4,086
Dry matter, % 93.7 94.4
Crude Protein, % 18.3 17.9
Neutral detergent fiber, % 19.0 19.7
Acid detergent fiber, % 10.5 7.40
Crude fat, % 4.10 2.10 1Corn distillers dried grains with solubles. 2Provided per kilogram of complete diet: vitamin A, 10,000 IU as retinyl acetate; vitamin
D3, 1,000 IU as cholecalciferol; vitamin E, 40 IU as DL-α-tocopherol acetate; vitamin K,
2.5 mg as menadione; pantothenic acid, 15 mg; riboflavin, 5 mg; choline, 500 mg; folic
acid, 2.0 mg; niacin, 25 mg; thiamine, 1.5 mg; pyridoxine, 1.5 mg; vitamin B12, 25 µg;
biotin, 200 µg; Cu, 15 mg from CuSO4 × 5H2O; Fe, 100 mg from FeSO4; Mn, 20 mg from
MnSO4; Zn, 105 mg from ZnO; Se, 0.30 mg from Na2SeO3; and I, 0.5 mg from KI (DSM
Nutritional Products Canada Inc., ON, Canada).
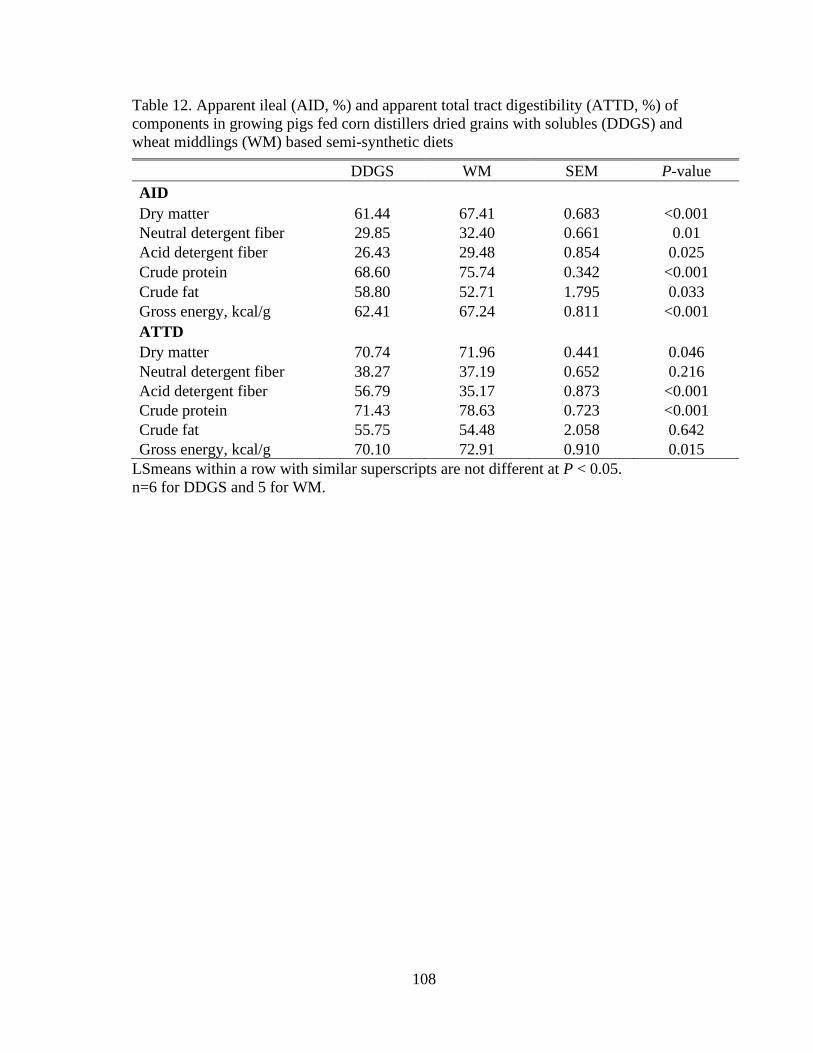
108
Table 12. Apparent ileal (AID, %) and apparent total tract digestibility (ATTD, %) of
components in growing pigs fed corn distillers dried grains with solubles (DDGS) and
wheat middlings (WM) based semi-synthetic diets
DDGS WM SEM P-value
AID
Dry matter 61.44 67.41 0.683 <0.001
Neutral detergent fiber 29.85 32.40 0.661 0.01
Acid detergent fiber 26.43 29.48 0.854 0.025
Crude protein 68.60 75.74 0.342 <0.001
Crude fat 58.80 52.71 1.795 0.033
Gross energy, kcal/g 62.41 67.24 0.811 <0.001
ATTD
Dry matter 70.74 71.96 0.441 0.046
Neutral detergent fiber 38.27 37.19 0.652 0.216
Acid detergent fiber 56.79 35.17 0.873 <0.001
Crude protein 71.43 78.63 0.723 <0.001
Crude fat 55.75 54.48 2.058 0.642
Gross energy, kcal/g 70.10 72.91 0.910 0.015
LSmeans within a row with similar superscripts are not different at P < 0.05.
n=6 for DDGS and 5 for WM.
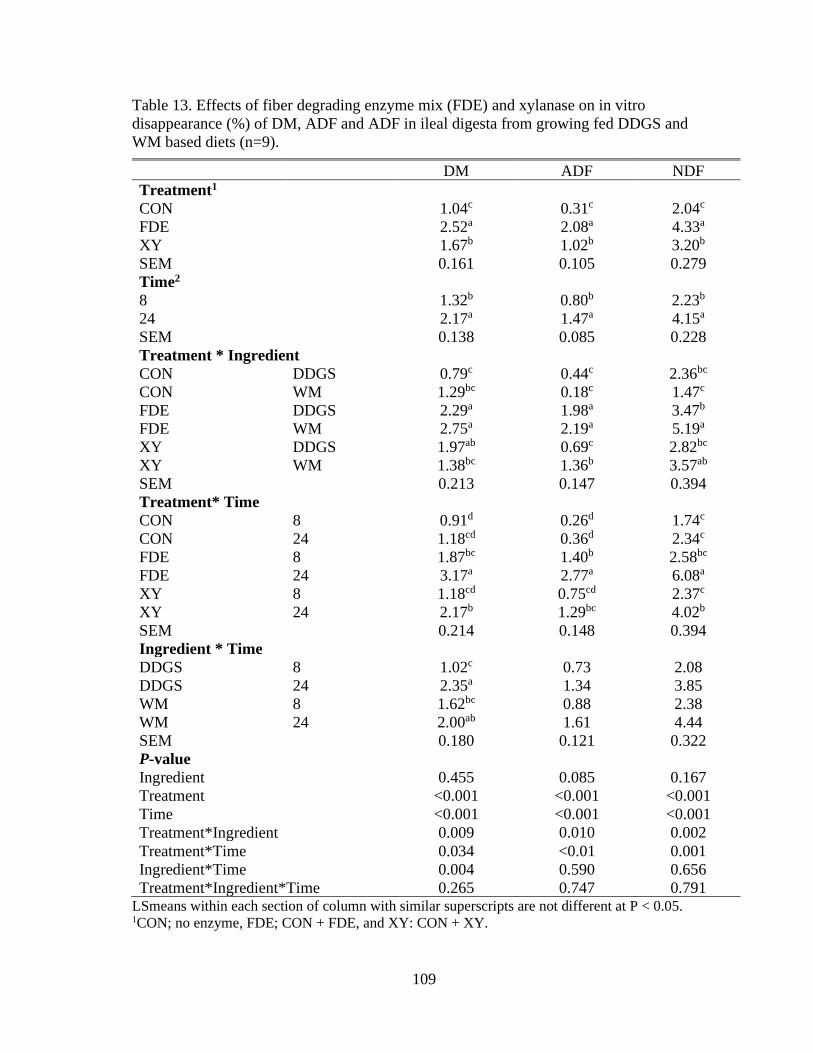
109
Table 13. Effects of fiber degrading enzyme mix (FDE) and xylanase on in vitro
disappearance (%) of DM, ADF and ADF in ileal digesta from growing fed DDGS and
WM based diets (n=9).
DM ADF NDF
Treatment1 CON 1.04c 0.31c 2.04c
FDE 2.52a 2.08a 4.33a
XY 1.67b 1.02b 3.20b
SEM 0.161 0.105 0.279
Time2 8 1.32b 0.80b 2.23b
24 2.17a 1.47a 4.15a
SEM 0.138 0.085 0.228
Treatment * Ingredient CON DDGS 0.79c 0.44c 2.36bc
CON WM 1.29bc 0.18c 1.47c
FDE DDGS 2.29a 1.98a 3.47b
FDE WM 2.75a 2.19a 5.19a
XY DDGS 1.97ab 0.69c 2.82bc
XY WM 1.38bc 1.36b 3.57ab
SEM 0.213 0.147 0.394
Treatment* Time CON 8 0.91d 0.26d 1.74c
CON 24 1.18cd 0.36d 2.34c
FDE 8 1.87bc 1.40b 2.58bc
FDE 24 3.17a 2.77a 6.08a
XY 8 1.18cd 0.75cd 2.37c
XY 24 2.17b 1.29bc 4.02b
SEM 0.214 0.148 0.394
Ingredient * Time DDGS 8 1.02c 0.73 2.08
DDGS 24 2.35a 1.34 3.85
WM 8 1.62bc 0.88 2.38
WM 24 2.00ab 1.61 4.44
SEM 0.180 0.121 0.322
P-value Ingredient 0.455 0.085 0.167
Treatment <0.001 <0.001 <0.001
Time <0.001 <0.001 <0.001
Treatment*Ingredient 0.009 0.010 0.002
Treatment*Time 0.034 <0.01 0.001
Ingredient*Time 0.004 0.590 0.656
Treatment*Ingredient*Time 0.265 0.747 0.791 LSmeans within each section of column with similar superscripts are not different at P < 0.05. 1CON; no enzyme, FDE; CON + FDE, and XY: CON + XY.
110
Enzyme activities were: FDE: xylanase: 62,000 U/g, β-glucanase: 8,000 U/g, cellulase: 37,000 U/g,
XY: xylanase: 186,000 U/g
4g of ileal digesta from pigs fed DDGS or WM diet was mixed with 20 mL of phosphate buffer
(pH 6) and respective enzyme and incubated at 37˚C with continuous agitation. 28; incubated for 8 h, 24; incubated for 24 h.
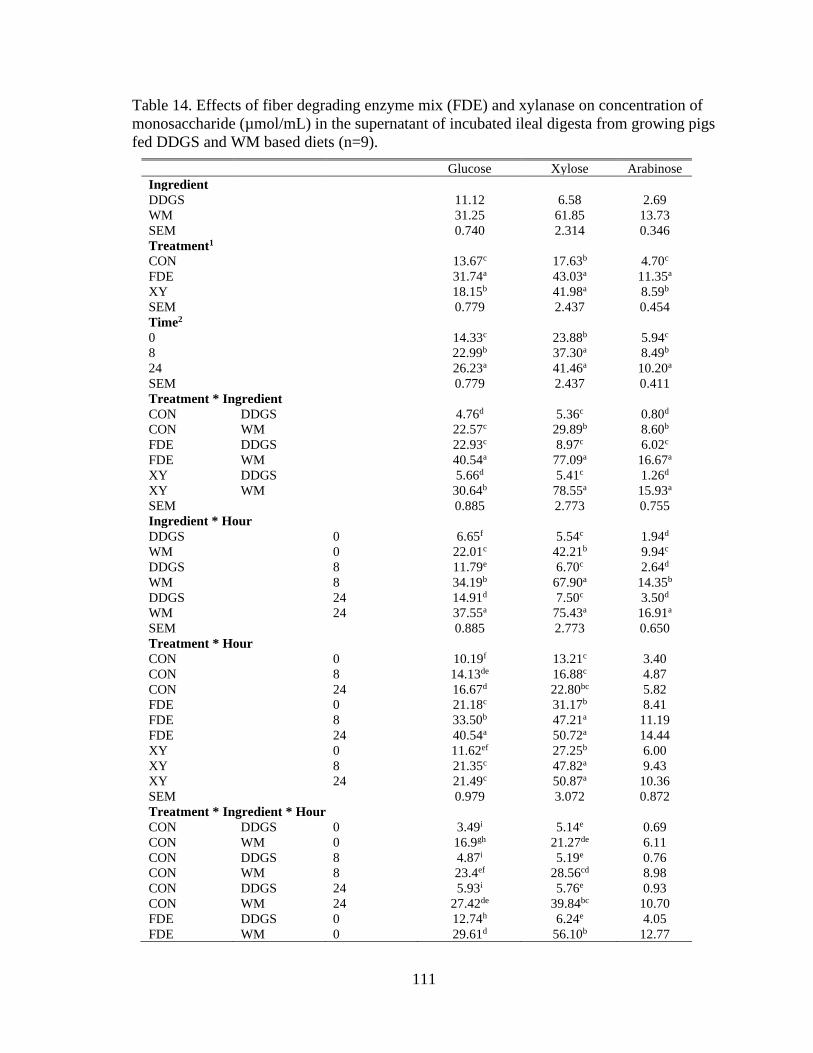
111
Table 14. Effects of fiber degrading enzyme mix (FDE) and xylanase on concentration of
monosaccharide (µmol/mL) in the supernatant of incubated ileal digesta from growing pigs
fed DDGS and WM based diets (n=9).
Glucose Xylose Arabinose
Ingredient
DDGS 11.12 6.58 2.69
WM 31.25 61.85 13.73
SEM 0.740 2.314 0.346
Treatment1
CON 13.67c 17.63b 4.70c
FDE 31.74a 43.03a 11.35a
XY 18.15b 41.98a 8.59b
SEM 0.779 2.437 0.454
Time2
0 14.33c 23.88b 5.94c
8 22.99b 37.30a 8.49b
24 26.23a 41.46a 10.20a
SEM 0.779 2.437 0.411
Treatment * Ingredient
CON DDGS 4.76d 5.36c 0.80d
CON WM 22.57c 29.89b 8.60b
FDE DDGS 22.93c 8.97c 6.02c
FDE WM 40.54a 77.09a 16.67a
XY DDGS 5.66d 5.41c 1.26d
XY WM 30.64b 78.55a 15.93a
SEM 0.885 2.773 0.755
Ingredient * Hour
DDGS 0 6.65f 5.54c 1.94d
WM 0 22.01c 42.21b 9.94c
DDGS 8 11.79e 6.70c 2.64d
WM 8 34.19b 67.90a 14.35b
DDGS 24 14.91d 7.50c 3.50d
WM 24 37.55a 75.43a 16.91a
SEM 0.885 2.773 0.650
Treatment * Hour
CON 0 10.19f 13.21c 3.40
CON 8 14.13de 16.88c 4.87
CON 24 16.67d 22.80bc 5.82
FDE 0 21.18c 31.17b 8.41
FDE 8 33.50b 47.21a 11.19
FDE 24 40.54a 50.72a 14.44
XY 0 11.62ef 27.25b 6.00
XY 8 21.35c 47.82a 9.43
XY 24 21.49c 50.87a 10.36
SEM 0.979 3.072 0.872
Treatment * Ingredient * Hour
CON DDGS 0 3.49i 5.14e 0.69
CON WM 0 16.9gh 21.27de 6.11
CON DDGS 8 4.87i 5.19e 0.76
CON WM 8 23.4ef 28.56cd 8.98
CON DDGS 24 5.93i 5.76e 0.93
CON WM 24 27.42de 39.84bc 10.70
FDE DDGS 0 12.74h 6.24e 4.05
FDE WM 0 29.61d 56.10b 12.77
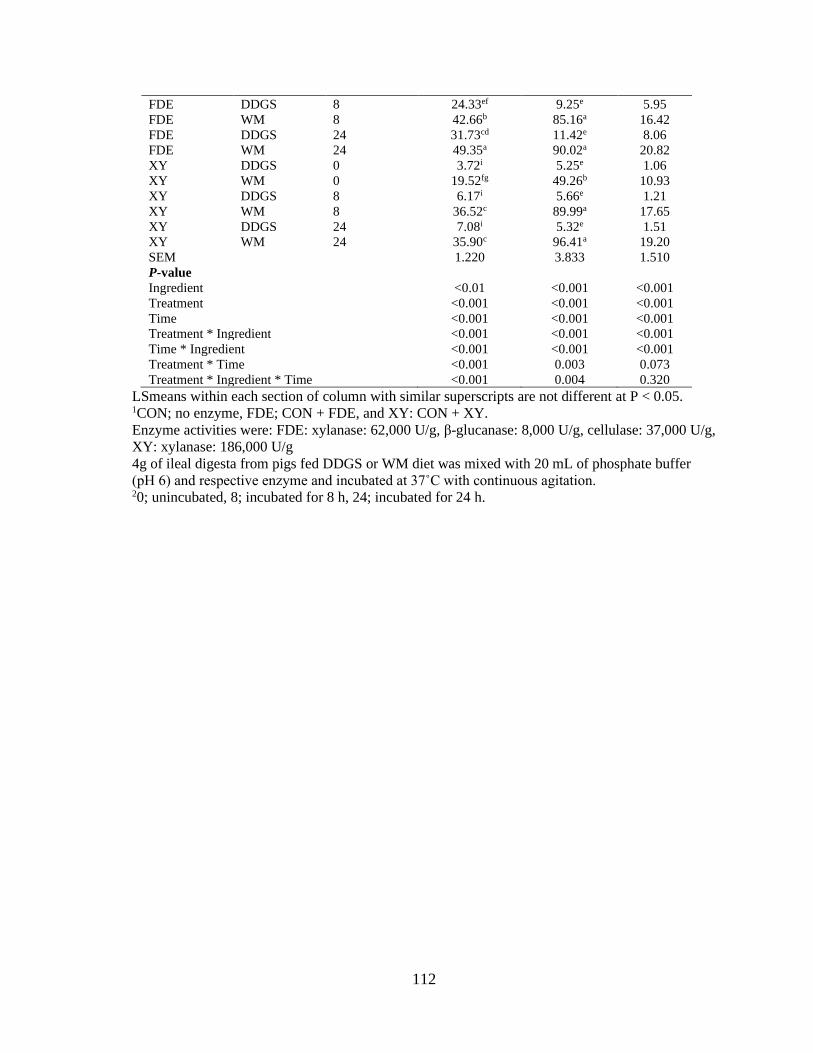
112
FDE DDGS 8 24.33ef 9.25e 5.95
FDE WM 8 42.66b 85.16a 16.42
FDE DDGS 24 31.73cd 11.42e 8.06
FDE WM 24 49.35a 90.02a 20.82
XY DDGS 0 3.72i 5.25e 1.06
XY WM 0 19.52fg 49.26b 10.93
XY DDGS 8 6.17i 5.66e 1.21
XY WM 8 36.52c 89.99a 17.65
XY DDGS 24 7.08i 5.32e 1.51
XY WM 24 35.90c 96.41a 19.20
SEM 1.220 3.833 1.510
P-value
Ingredient <0.01 <0.001 <0.001
Treatment <0.001 <0.001 <0.001
Time <0.001 <0.001 <0.001
Treatment * Ingredient <0.001 <0.001 <0.001
Time * Ingredient <0.001 <0.001 <0.001
Treatment * Time <0.001 0.003 0.073
Treatment * Ingredient * Time <0.001 0.004 0.320
LSmeans within each section of column with similar superscripts are not different at P < 0.05. 1CON; no enzyme, FDE; CON + FDE, and XY: CON + XY.
Enzyme activities were: FDE: xylanase: 62,000 U/g, β-glucanase: 8,000 U/g, cellulase: 37,000 U/g,
XY: xylanase: 186,000 U/g
4g of ileal digesta from pigs fed DDGS or WM diet was mixed with 20 mL of phosphate buffer
(pH 6) and respective enzyme and incubated at 37˚C with continuous agitation. 20; unincubated, 8; incubated for 8 h, 24; incubated for 24 h.
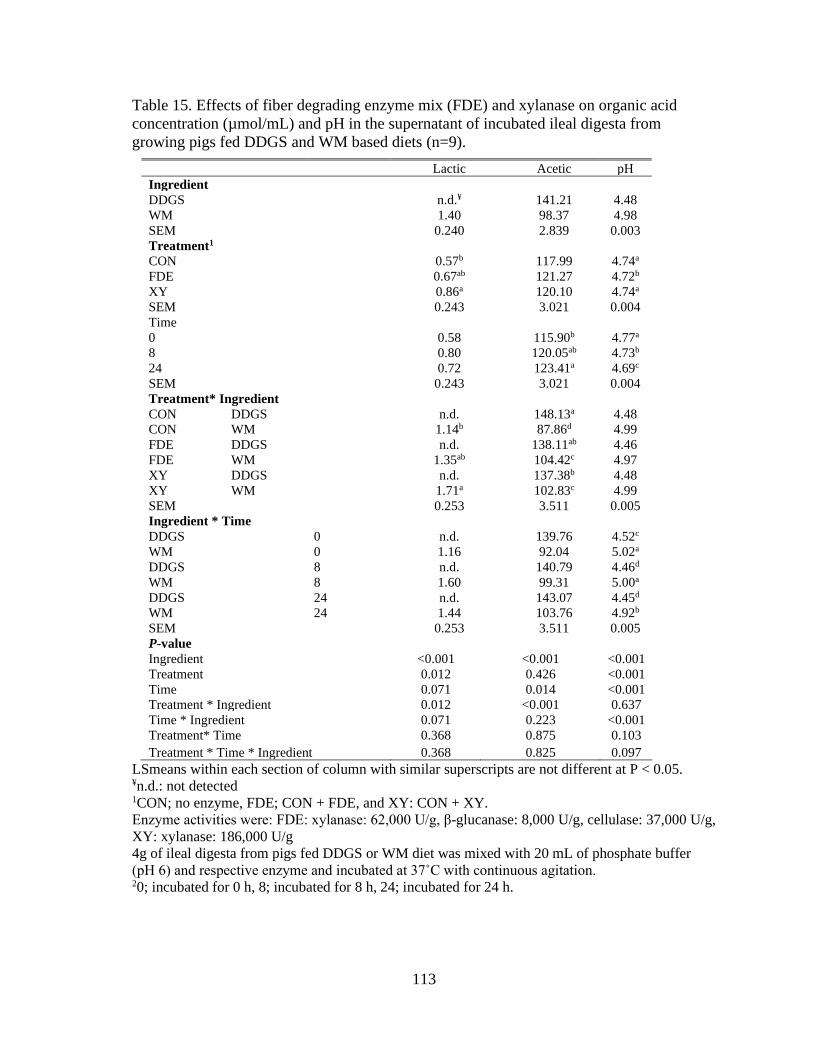
113
Table 15. Effects of fiber degrading enzyme mix (FDE) and xylanase on organic acid
concentration (µmol/mL) and pH in the supernatant of incubated ileal digesta from
growing pigs fed DDGS and WM based diets (n=9).
Lactic Acetic pH
Ingredient
DDGS n.d.¥ 141.21 4.48
WM 1.40 98.37 4.98
SEM 0.240 2.839 0.003
Treatment1
CON 0.57b 117.99 4.74a
FDE 0.67ab 121.27 4.72b
XY 0.86a 120.10 4.74a
SEM 0.243 3.021 0.004
Time
0 0.58 115.90b 4.77a
8 0.80 120.05ab 4.73b
24 0.72 123.41a 4.69c
SEM 0.243 3.021 0.004
Treatment* Ingredient
CON DDGS n.d. 148.13a 4.48
CON WM 1.14b 87.86d 4.99
FDE DDGS n.d. 138.11ab 4.46
FDE WM 1.35ab 104.42c 4.97
XY DDGS n.d. 137.38b 4.48
XY WM 1.71a 102.83c 4.99
SEM 0.253 3.511 0.005
Ingredient * Time
DDGS 0 n.d. 139.76 4.52c
WM 0 1.16 92.04 5.02a
DDGS 8 n.d. 140.79 4.46d
WM 8 1.60 99.31 5.00a
DDGS 24 n.d. 143.07 4.45d
WM 24 1.44 103.76 4.92b
SEM 0.253 3.511 0.005
P-value
Ingredient <0.001 <0.001 <0.001
Treatment 0.012 0.426 <0.001
Time 0.071 0.014 <0.001
Treatment * Ingredient 0.012 <0.001 0.637
Time * Ingredient 0.071 0.223 <0.001
Treatment* Time 0.368 0.875 0.103
Treatment * Time * Ingredient 0.368 0.825 0.097
LSmeans within each section of column with similar superscripts are not different at P < 0.05. ¥n.d.: not detected 1CON; no enzyme, FDE; CON + FDE, and XY: CON + XY.
Enzyme activities were: FDE: xylanase: 62,000 U/g, β-glucanase: 8,000 U/g, cellulase: 37,000 U/g,
XY: xylanase: 186,000 U/g
4g of ileal digesta from pigs fed DDGS or WM diet was mixed with 20 mL of phosphate buffer
(pH 6) and respective enzyme and incubated at 37˚C with continuous agitation. 20; incubated for 0 h, 8; incubated for 8 h, 24; incubated for 24 h.
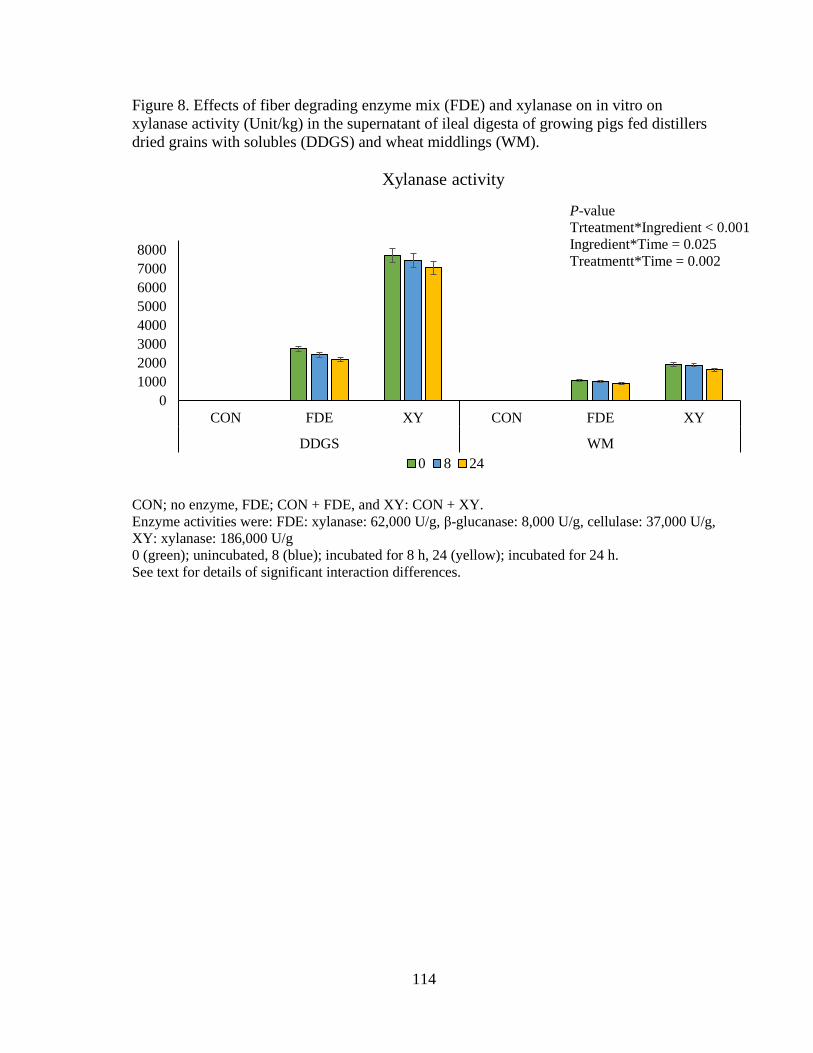
114
Figure 8. Effects of fiber degrading enzyme mix (FDE) and xylanase on in vitro on
xylanase activity (Unit/kg) in the supernatant of ileal digesta of growing pigs fed distillers
dried grains with solubles (DDGS) and wheat middlings (WM).
CON; no enzyme, FDE; CON + FDE, and XY: CON + XY.
Enzyme activities were: FDE: xylanase: 62,000 U/g, β-glucanase: 8,000 U/g, cellulase: 37,000 U/g,
XY: xylanase: 186,000 U/g
0 (green); unincubated, 8 (blue); incubated for 8 h, 24 (yellow); incubated for 24 h.
See text for details of significant interaction differences.
0
1000
2000
3000
4000
5000
6000
7000
8000
CON FDE XY CON FDE XY
DDGS WM
Xylanase activity
0 8 24
P-value
Trteatment*Ingredient < 0.001
Ingredient*Time = 0.025
Treatmentt*Time = 0.002
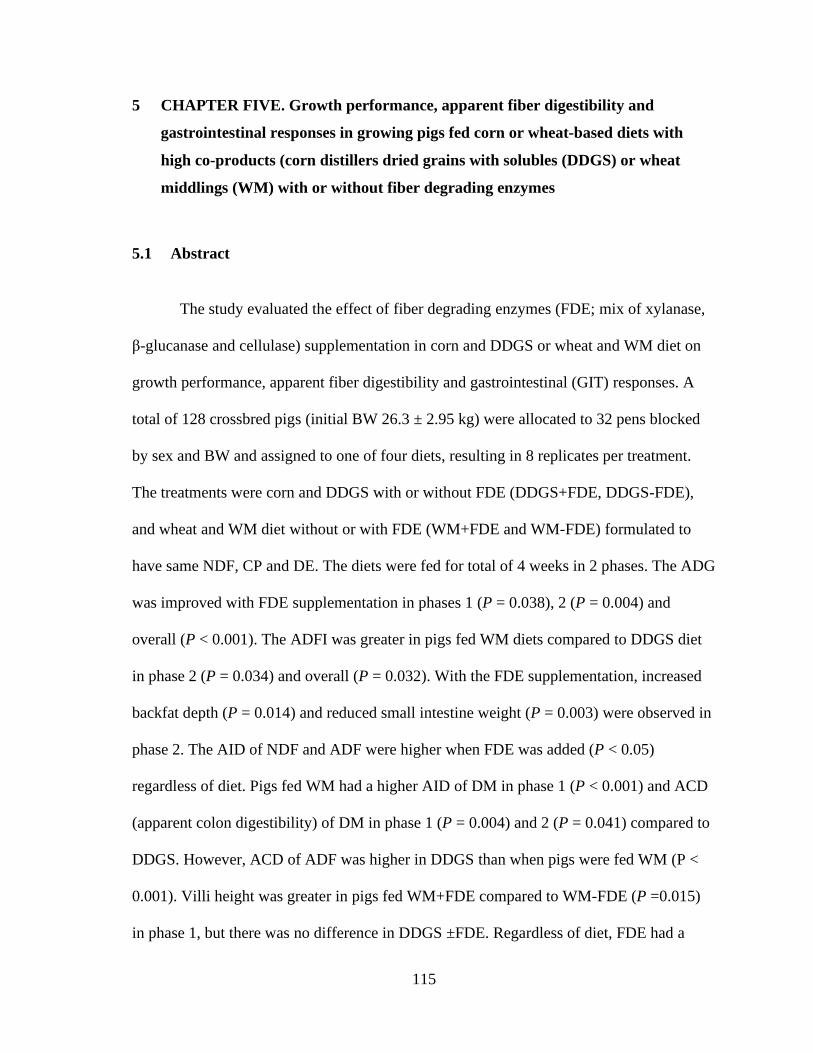
115
5 CHAPTER FIVE. Growth performance, apparent fiber digestibility and
gastrointestinal responses in growing pigs fed corn or wheat-based diets with
high co-products (corn distillers dried grains with solubles (DDGS) or wheat
middlings (WM) with or without fiber degrading enzymes
5.1 Abstract
The study evaluated the effect of fiber degrading enzymes (FDE; mix of xylanase,
β-glucanase and cellulase) supplementation in corn and DDGS or wheat and WM diet on
growth performance, apparent fiber digestibility and gastrointestinal (GIT) responses. A
total of 128 crossbred pigs (initial BW 26.3 ± 2.95 kg) were allocated to 32 pens blocked
by sex and BW and assigned to one of four diets, resulting in 8 replicates per treatment.
The treatments were corn and DDGS with or without FDE (DDGS+FDE, DDGS-FDE),
and wheat and WM diet without or with FDE (WM+FDE and WM-FDE) formulated to
have same NDF, CP and DE. The diets were fed for total of 4 weeks in 2 phases. The ADG
was improved with FDE supplementation in phases 1 (P = 0.038), 2 (P = 0.004) and
overall (P < 0.001). The ADFI was greater in pigs fed WM diets compared to DDGS diet
in phase 2 (P = 0.034) and overall (P = 0.032). With the FDE supplementation, increased
backfat depth (P = 0.014) and reduced small intestine weight (P = 0.003) were observed in
phase 2. The AID of NDF and ADF were higher when FDE was added (P < 0.05)
regardless of diet. Pigs fed WM had a higher AID of DM in phase 1 (P < 0.001) and ACD
(apparent colon digestibility) of DM in phase 1 (P = 0.004) and 2 (P = 0.041) compared to
DDGS. However, ACD of ADF was higher in DDGS than when pigs were fed WM (P <
0.001). Villi height was greater in pigs fed WM+FDE compared to WM-FDE (P =0.015)
in phase 1, but there was no difference in DDGS ±FDE. Regardless of diet, FDE had a
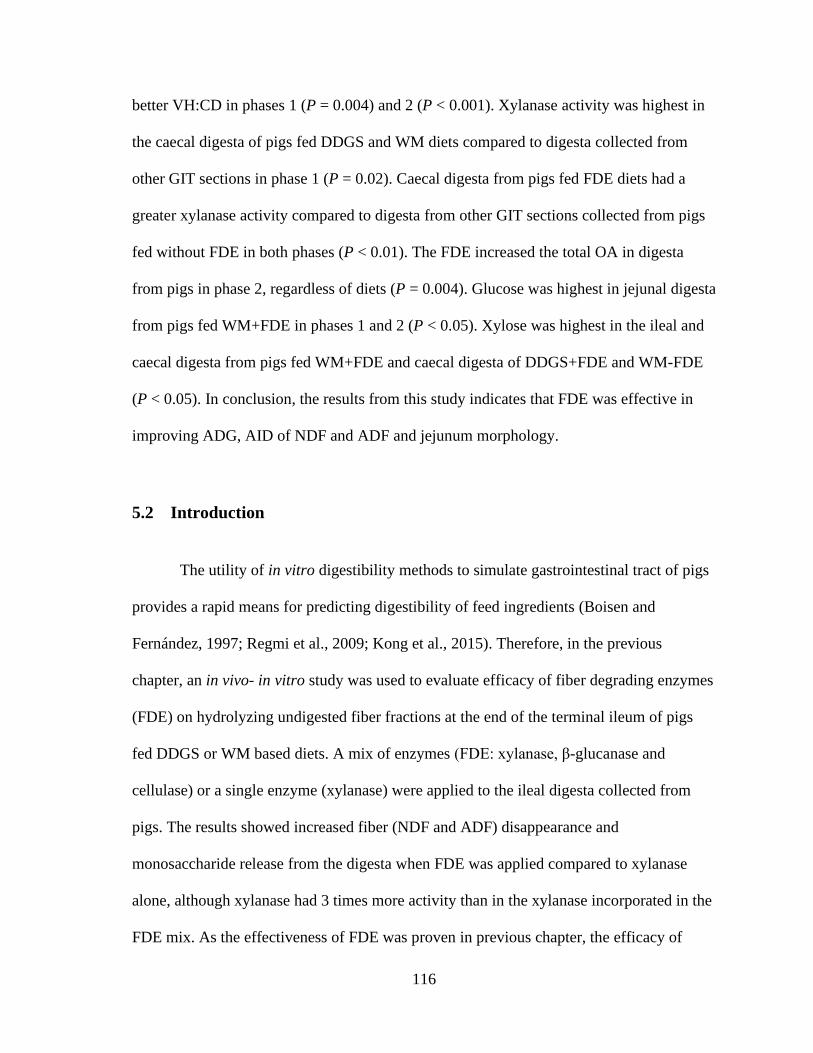
116
better VH:CD in phases 1 (P = 0.004) and 2 (P < 0.001). Xylanase activity was highest in
the caecal digesta of pigs fed DDGS and WM diets compared to digesta collected from
other GIT sections in phase 1 (P = 0.02). Caecal digesta from pigs fed FDE diets had a
greater xylanase activity compared to digesta from other GIT sections collected from pigs
fed without FDE in both phases (P < 0.01). The FDE increased the total OA in digesta
from pigs in phase 2, regardless of diets (P = 0.004). Glucose was highest in jejunal digesta
from pigs fed WM+FDE in phases 1 and 2 (P < 0.05). Xylose was highest in the ileal and
caecal digesta from pigs fed WM+FDE and caecal digesta of DDGS+FDE and WM-FDE
(P < 0.05). In conclusion, the results from this study indicates that FDE was effective in
improving ADG, AID of NDF and ADF and jejunum morphology.
5.2 Introduction
The utility of in vitro digestibility methods to simulate gastrointestinal tract of pigs
provides a rapid means for predicting digestibility of feed ingredients (Boisen and
Fernández, 1997; Regmi et al., 2009; Kong et al., 2015). Therefore, in the previous
chapter, an in vivo- in vitro study was used to evaluate efficacy of fiber degrading enzymes
(FDE) on hydrolyzing undigested fiber fractions at the end of the terminal ileum of pigs
fed DDGS or WM based diets. A mix of enzymes (FDE: xylanase, β-glucanase and
cellulase) or a single enzyme (xylanase) were applied to the ileal digesta collected from
pigs. The results showed increased fiber (NDF and ADF) disappearance and
monosaccharide release from the digesta when FDE was applied compared to xylanase
alone, although xylanase had 3 times more activity than in the xylanase incorporated in the
FDE mix. As the effectiveness of FDE was proven in previous chapter, the efficacy of
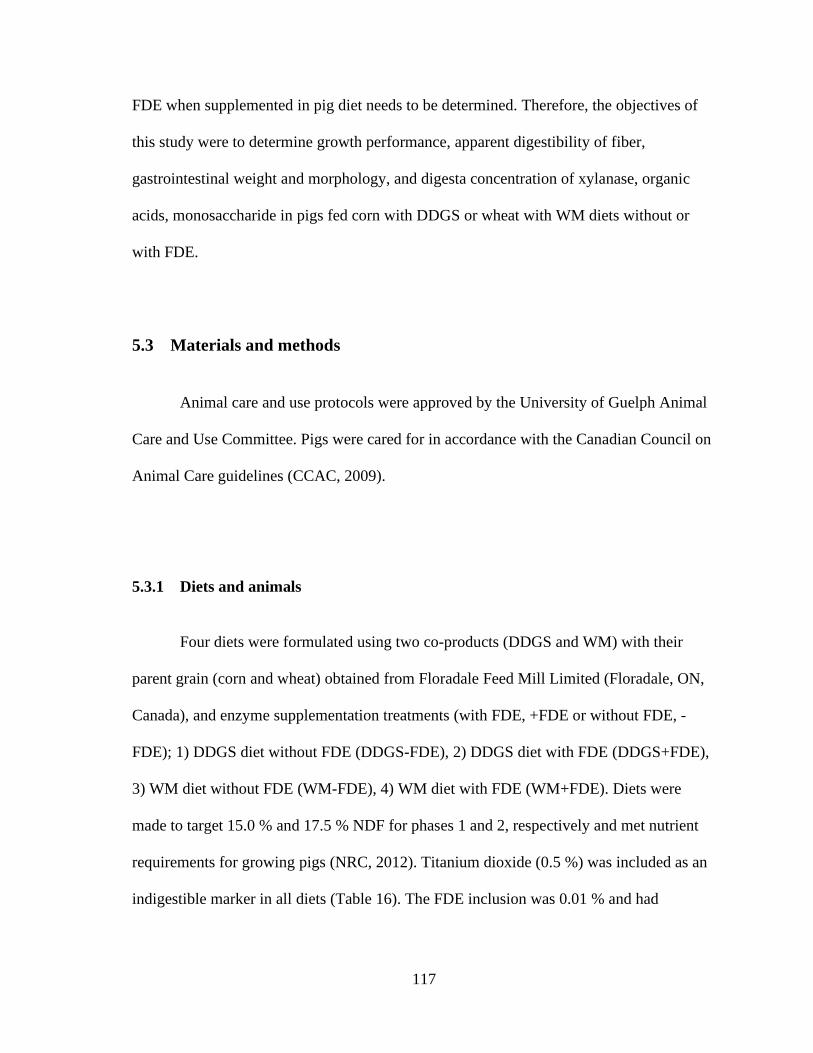
117
FDE when supplemented in pig diet needs to be determined. Therefore, the objectives of
this study were to determine growth performance, apparent digestibility of fiber,
gastrointestinal weight and morphology, and digesta concentration of xylanase, organic
acids, monosaccharide in pigs fed corn with DDGS or wheat with WM diets without or
with FDE.
5.3 Materials and methods
Animal care and use protocols were approved by the University of Guelph Animal
Care and Use Committee. Pigs were cared for in accordance with the Canadian Council on
Animal Care guidelines (CCAC, 2009).
5.3.1 Diets and animals
Four diets were formulated using two co-products (DDGS and WM) with their
parent grain (corn and wheat) obtained from Floradale Feed Mill Limited (Floradale, ON,
Canada), and enzyme supplementation treatments (with FDE, +FDE or without FDE, -
FDE); 1) DDGS diet without FDE (DDGS-FDE), 2) DDGS diet with FDE (DDGS+FDE),
3) WM diet without FDE (WM-FDE), 4) WM diet with FDE (WM+FDE). Diets were
made to target 15.0 % and 17.5 % NDF for phases 1 and 2, respectively and met nutrient
requirements for growing pigs (NRC, 2012). Titanium dioxide (0.5 %) was included as an
indigestible marker in all diets (Table 16). The FDE inclusion was 0.01 % and had
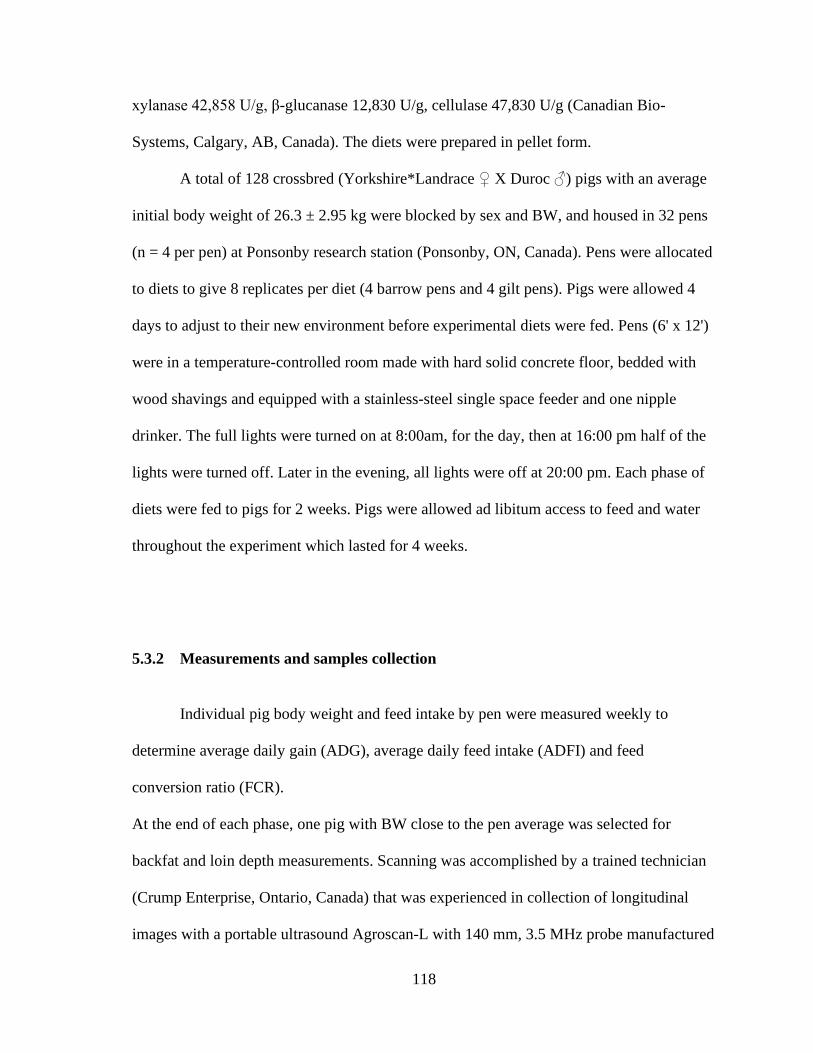
118
xylanase 42,858 U/g, β-glucanase 12,830 U/g, cellulase 47,830 U/g (Canadian Bio-
Systems, Calgary, AB, Canada). The diets were prepared in pellet form.
A total of 128 crossbred (Yorkshire*Landrace ♀ X Duroc ♂) pigs with an average
initial body weight of 26.3 ± 2.95 kg were blocked by sex and BW, and housed in 32 pens
(n = 4 per pen) at Ponsonby research station (Ponsonby, ON, Canada). Pens were allocated
to diets to give 8 replicates per diet (4 barrow pens and 4 gilt pens). Pigs were allowed 4
days to adjust to their new environment before experimental diets were fed. Pens (6' x 12')
were in a temperature-controlled room made with hard solid concrete floor, bedded with
wood shavings and equipped with a stainless-steel single space feeder and one nipple
drinker. The full lights were turned on at 8:00am, for the day, then at 16:00 pm half of the
lights were turned off. Later in the evening, all lights were off at 20:00 pm. Each phase of
diets were fed to pigs for 2 weeks. Pigs were allowed ad libitum access to feed and water
throughout the experiment which lasted for 4 weeks.
5.3.2 Measurements and samples collection
Individual pig body weight and feed intake by pen were measured weekly to
determine average daily gain (ADG), average daily feed intake (ADFI) and feed
conversion ratio (FCR).
At the end of each phase, one pig with BW close to the pen average was selected for
backfat and loin depth measurements. Scanning was accomplished by a trained technician
(Crump Enterprise, Ontario, Canada) that was experienced in collection of longitudinal
images with a portable ultrasound Agroscan-L with 140 mm, 3.5 MHz probe manufactured
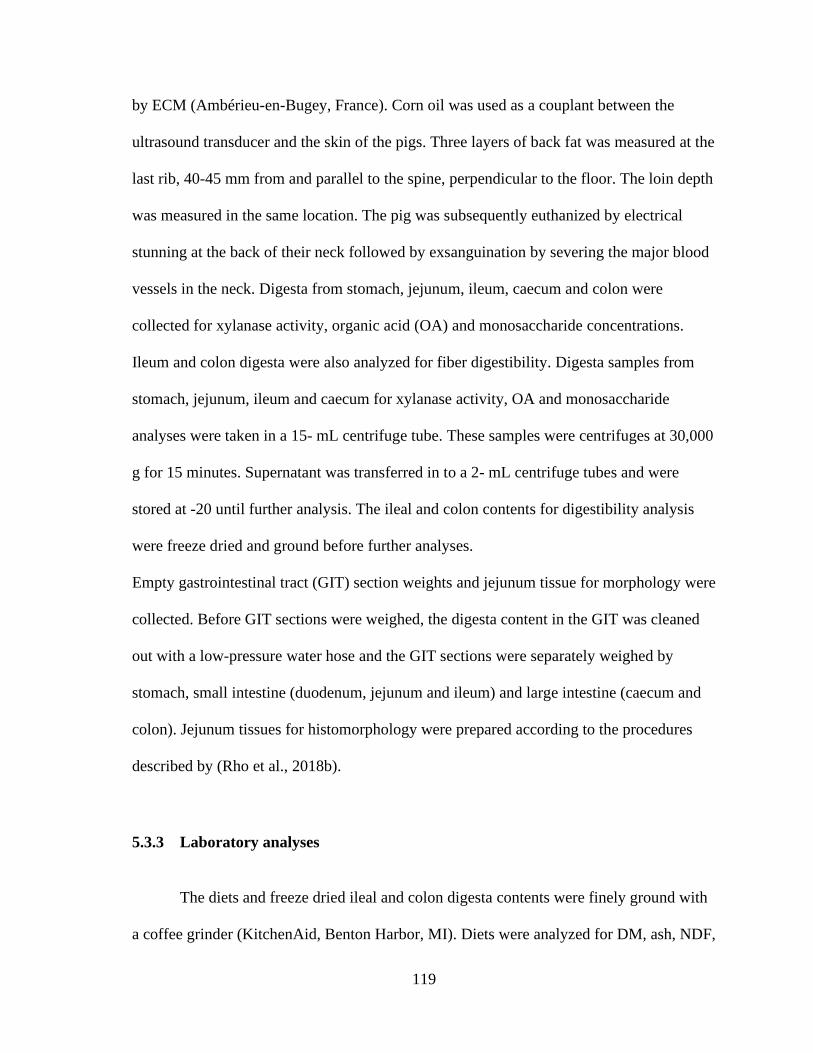
119
by ECM (Ambérieu-en-Bugey, France). Corn oil was used as a couplant between the
ultrasound transducer and the skin of the pigs. Three layers of back fat was measured at the
last rib, 40-45 mm from and parallel to the spine, perpendicular to the floor. The loin depth
was measured in the same location. The pig was subsequently euthanized by electrical
stunning at the back of their neck followed by exsanguination by severing the major blood
vessels in the neck. Digesta from stomach, jejunum, ileum, caecum and colon were
collected for xylanase activity, organic acid (OA) and monosaccharide concentrations.
Ileum and colon digesta were also analyzed for fiber digestibility. Digesta samples from
stomach, jejunum, ileum and caecum for xylanase activity, OA and monosaccharide
analyses were taken in a 15- mL centrifuge tube. These samples were centrifuges at 30,000
g for 15 minutes. Supernatant was transferred in to a 2- mL centrifuge tubes and were
stored at -20 until further analysis. The ileal and colon contents for digestibility analysis
were freeze dried and ground before further analyses.
Empty gastrointestinal tract (GIT) section weights and jejunum tissue for morphology were
collected. Before GIT sections were weighed, the digesta content in the GIT was cleaned
out with a low-pressure water hose and the GIT sections were separately weighed by
stomach, small intestine (duodenum, jejunum and ileum) and large intestine (caecum and
colon). Jejunum tissues for histomorphology were prepared according to the procedures
described by (Rho et al., 2018b).
5.3.3 Laboratory analyses
The diets and freeze dried ileal and colon digesta contents were finely ground with
a coffee grinder (KitchenAid, Benton Harbor, MI). Diets were analyzed for DM, ash, NDF,
120
ADF, CP, GE, titanium dioxide and xylanase activity. Concentrations of OA and
monosaccharides were analyzed in the supernatant of digesta collected from stomach,
jejunum, ileum, caecum and colon. Xylanase activity was analyzed in the supernatant of
digesta from the stomach, jejunum, ileum and caecum. Neutral detergent fiber, ADF and
titanium dioxide were analyzed in the freeze-dried ileum and colon content.
Dry matter, ash, CP, NDF, ADF, GE and titanium dioxide were analyzed as
described in previous chapters. The OA (lactic, acetic, propionic, iso-butyric, n-butyric
acid) and monosaccharide (glucose, xylose and arabinose) concentration in the supernatant
of digesta collected from different sections of GIT were prepared and analyzed as
described in previous chapter. The retention times for lactic, acetic, propionic, iso-butyric
and n-butyric acid were 17.3, 20.6, 23.7, 27.2 and 29.5 min, and for glucose, xylose and
arabinose were found to be 12.9, 13.6, and 14.9 min, respectively.
Xylanase activity was measured as described in chapter 4. For jejunum
morphology, fixed jejunal tissues were embedded in paraffin, sectioned (5 μm), and
stained with hematoxylin and eosin for morphological examinations. In each cross-
sectioned tissue, at least 8 - 10 complete villous-crypt structures were examined under a
Leica DMR microscope (Leica Microsystems, Wetzlay, Germany). Villous height (VH)
and crypt depth (CD) were measured using a calibrated micrometer.
5.3.4 Calculations and statistics
The ADG, ADFI and FCR were calculated by the following equations.
𝑨𝑫𝑮 (𝐾𝑔/𝑑) =𝐹𝑖𝑛𝑎𝑙 𝐵𝑊 − 𝐼𝑛𝑖𝑡𝑖𝑎𝑙 𝐵𝑊
𝑁𝑢𝑚𝑏𝑒𝑟 𝑜𝑓 𝑓𝑒𝑒𝑑𝑖𝑛𝑔 𝑑𝑎𝑦𝑠
121
𝑨𝑫𝑭𝑰(𝐾𝑔/𝑑)
=(𝑇𝑜𝑡𝑎𝑙 𝑓𝑒𝑒𝑑 𝑎𝑑𝑑𝑒𝑑 𝑎𝑡 𝑡ℎ𝑒 𝑠𝑡𝑎𝑟𝑡 𝑜𝑓 𝑤𝑒𝑒𝑘 − 𝑟𝑒𝑚𝑎𝑖𝑛𝑖𝑛𝑔 𝑓𝑒𝑒𝑑 𝑎𝑓𝑡𝑒𝑟 𝑎 𝑤𝑒𝑒𝑘
𝑁𝑢𝑚𝑏𝑒𝑟 𝑜𝑓 𝑓𝑒𝑒𝑑𝑖𝑛𝑔 𝑑𝑎𝑦𝑠)
𝑛𝑢𝑚𝑏𝑒𝑟 𝑜𝑓 𝑝𝑖𝑔𝑠 𝑖𝑛 𝑝𝑒𝑛
𝑭𝑪𝑹 =𝐴𝐷𝐹𝐼
𝐴𝐷𝐺
The apparent ileal digestibility (AID) and apparent colon digestibility (ACD) were
calculated according to de Lange et al. (1998), with the following equation.
𝑨𝑰𝑫 𝒐𝒓 𝑨𝑪𝑫 𝒐𝒇 𝒏𝒖𝒕𝒓𝒊𝒆𝒏𝒕 (%) = (1 − (𝑁𝑑
𝑁𝑓) ∗ (
𝑇𝑑
𝑇𝑓)) × 100
Where Nd represents nutrient concentration in the ileal or colon content and Nf
representing nutrient concentration in the feed. The Tf and Td represents titanium
concentration in feed and in the ileal or colon content, respectively. The total OA was
calculated by adding acetic, propionic, iso-butyric and n-butyric acid without lactic acid.
Data were analyzed using GLIMMIXED procedure of SAS 9.4 (SAS Inst. Inc.,
Cary, NC). The pen was the experimental unit for growth performance, and pig was the
experimental unit for GIT weight, jejunum morphology, OA and monosaccharide,
xylanase activity, AID and ACD. For the growth performance, GIT weight, jejunum
morphology, and digestibility data the model included diet (DDGS vs WM), enzyme
inclusion (+FDE vs -FDE), sex (male vs female) and their interactions as fixed effects. For
the performance data, a random statement for pen and repeated measure for week were
included in the model. For organic acids, monosaccharide concentrations and xylanase
activity the model included diet (DDGS vs WM), enzyme inclusion (+FDE vs -FDE) and
gastrointestinal section (stomach vs, jejunum vs, ileum vs caecum) and their interactions as
122
fixed effect. An alpha level of 0.05 was used to determine statistical significance among
dietary treatment means and means were separated using a Tukey’s test.
5.4 Results
5.4.1 Diet
Chemical analyses in the experimental diets are shown in Table 17. The analyzed
NDF ranged from 14.2 to 14.8 and 17.3 to 17.9 % for phase 1 and 2 diet, respectively.
Xylanase recovery in DDGS-FDE and DDGS+FDE in phase 1 and 2 were 64, 165 and
4,324, 3,658 U/kg, respectively, and in WM-FDE and WM+FDE in phase 1 and 2 were
752, 368 and 8,021, 9,496 U/kg, respectively.
5.4.2 Animal growth performance
There were no (P > 0.05) two- or three-way interactions between diet type, FDE
and sex on initial body weight and growth performance in phase 1. Main effects were only
observed for FDE, where ADG of pigs fed +FDE was higher (0.97 vs. 0.94 kg/d; P =
0.038) than pigs fed -FDE in phase 1. Diets had no affect on ADFI and FCR in phase 1
(Table 18). In phase 2, an interaction (P = 0.047) between diet and sex was observed, such
that for WM diets, male pigs had a greater ADFI compared to DDGS and female pigs fed
any diet. There was individual diet (P = 0.039), FDE (P = 0.004) and sex (P < 0.001) effect
for ADG in phase 2 as WM, FDE supplement, and male pigs had a higher ADG compared
to DDGS, no supplement and female pigs (P < 0.001), respectively. Male pigs had a better
feed efficiency than in female pigs in phase 2 (2.16 vs 1.98; P = 0.049). The overall ADFI
123
was greater for pigs fed diets containing WM compared to DDGS (2.01 vs 1.89 kg/d; P =
0.032), and male pigs had a greater ADFI than in female pigs (2.07 vs 1.84 kg/d; P <
0.001). The overall ADG was greater in FDE supplementation (P < 0.001), and male pigs
had a better ADG (P < 0.001) however, there was no differences in FCR. Final body
weight (fBW) had a diet (P = 0.006) and sex (P = 0.008) effect, where WM and male pigs
had a greater fBW than DDGS and female pigs (Table 18).
5.4.3 Gastrointestinal tract (GIT) weight, backfat and loin depth
The backfat, loin depth and GIT weight relative to body weight is shown in Table
19. There was a diet by FDE interaction (P = 0.007) for backfat in phase 1, such that
WM+FDE and DDGS-FDE was greater than WM-FDE and DDGS+FDE. However, there
was no diet, FDE, or interaction effect on loin depth, stomach, small intestine and large
intestine weight in phase 1. In phase 2, there was an FDE effect for backfat (P = 0.014) and
small intestine weight (P < 0.001). Supplementation of FDE resulted in greater back fat,
but lower small intestine weight compared to without FDE.
5.4.4 Digestibility of dry matter (DM), neutral detergent fiber (NDF) and acid
detergent fiber (ADF)
The AID and ACD of DM, NDF and ADF are shown in Table 20. There was a diet
effect on AID and ACD of DM (P < 0.01) in phase 1, where WM diet had a higher AID
and ACD of DM compared to DDGS diet. A FDE effect was observed for AID of NDF (P
= 0.012) and ADF (P = 0.049) with FDE supplementation having a greater AID of NDF
124
(32.47 vs 25.97 %) and ADF (30.63 vs 26.13 %) compared to diets without FDE. In phase
2, individual ingredient (P = 0.041) and FDE (P = 0.002) main effects were seen for ACD
of DM, such that WM diet, and +FDE had a greater ACD of DM compared to DDGS diet
and -FDE. There was an FDE effect in AID of NDF and ADF where +FDE had a greater
AID of NDF (42.25 vs 27.90 %; P = 0.002) and ADF (39.45 vs 30.03 %; P = 0.012)
compared to -FDE. Apparent ileal digestibility (P = 0.018) and ACD (P < 0.01) of ADF
had a diet effect as DDGS diet had a greater AID and ACD of ADF than WM diet.
5.4.5 Jejunum Morphology
Jejunum morphology is shown in Table 21. There was a diet by FDE interaction (P
= 0.015) for villi height (VH) in phase 1, where WM+ FDE had a greater VH than WM-
FDE, but DDGS+FDE or DDGS-FDE were not different among the diets. In phase 2, VH
had an FDE effect (P < 0.01) such that +FDE resulting in a greater VH compared to -FDE.
The greater VH: CD was seen for pigs fed +FDE in phase 1 (5.93 vs 5.33; P = 0.004) and
phase 2 (6.43 vs 5.28; P < 0.01).
5.4.6 Xylanase activity and pH along the GIT
Xylanase activity of digesta is shown in Figure 9. In phase 1, there was a diet by
GIT section (P = 0.02) interaction such that xylanase activity was highest in the digesta of
pigs fed DDGS and WM in the caecum compared to other GIT sections, followed by
ileum, jejunum and stomach. The FDE and GIT section interaction (P < 0.001) was also
seen for xylanase activity in phase 1, with highest xylanase activity in digesta from pigs
125
fed +FDE diet in the caecum followed by the ileum. Xylanase activity was not different
between jejunal digesta from +FDE diets and ceacal digesta from -FDE diets, however, it
was greater than jejunal digesta from -FDE fed pigs or stomach digesta from -FDE fed
pigs.
In phase 2, diet by FDE interaction (P = 0.02) and FDE by GIT section interaction
(P < 0.01) were observed. The diet by FDE interaction was such that digesta from pigs fed
WM+FDE had the greatest xylanase activity followed by DDGS+FDE being intermediate
and WM-FDE and DDGS-FDE being the lowest. For the FDE by GIT section interaction,
caecal digesta from pigs fed +FDE diet had the highest xylanase activity. Digesta from
pigs fed +FDE diets from the ileum and jejunum had a greater xylanase activity compared
to digesta from pigs fed -FDE diet in ileum and jejunum, and digesta from +FDE or -FDE
in stomach. Caecal digesta from pigs fed -FDE diet was not different to ileal or jejunal
digesta from +FDE diet fed pigs.
The pH across the GIT in pigs fed experimental diets are shown in Figure 9 on the
secondary axis. There was a diet by GIT section interaction (P = 0.01) and FDE by GIT
section interaction (P = 0.03) for phase 1. The highest pH was seen in the jejunun of
DDGS and WM fed pigs followed by ileum and caecum of DDGS and WM fed pigs. In the
stomach, the pH was lower in the WM fed pigs compared to those fed DDGS. The FDE
and GIT section interaction (P = 0.03) was such that the jejunum content from pigs fed
+FDE and -FDE had the highest pH, ileum and caecum digesta from pigs fed +FDE and -
FDE being intermediate, followed by digesta from pigs fed +FDE in stomach, and digesta
from pigs fed -FDE from stomach being the lowest. In phase 2, the pH had a diet, FDE and
126
GIT section interaction (P < 0.001), where the pH in the jejunum was higher than in
stomach in DDGS and WM with or without FDE.
5.4.7 Organic acid (OA) concentrations along the GIT
The OA concentration along the GIT of pigs fed DDGS±FDE and WM±FDE are
shown in Table 22. A diet by FDE interaction effect (P = 0.027) was seen for lactic acid
concentration in phase 1, such that digesta from pigs fed DDGS+FDE had the highest
concentration compared to others. In phase 1, acetic acid, propionic acid, n-butyric acid
and total OA concentration had a diet by GIT section interaction (P < 0.01). Acetic acid
concentration was highest in caecal and colon digesta from pigs fed WM diet and colon
digesta from pigs fed DDGS diet, followed by caecal digesta from pigs fed DDGS diet
being intermediate, and the rest being the lowest (P < 0.01). Propionic acid concentration
was higher in colon digests from pigs fed DDGS diet than other treatments however,
caecal digesta from pigs fed WM diet was not different. The colon digests from pigs fed
WM diet had a greater propionic acid concentration than in digesta from pigs fed WM diet
in ileum, jejunum, and stomach, however, caecal digesta from pigs fed DDGS diet was not
different to colon digesta collected from pigs fed WM.
The concentration of n-butyric acid was highest in colon digesta from pigs fed
DDGS diet (P = 0.0056). The colon digesta from pigs fed WM had a greater concentration
than in caecal digesta from pigs fed DDGS, however, caecal digesta from WM diet fed
pigs was not different. In the stomach, jejunum and ileal digesta from pigs fed DDGS and
WM diet, n-butyric acid was below the detection.
127
Total OA concentration was highest in colon digesta from pigs fed DDGS diet
compared to others. The caecal and colon digesta from pigs fed WM diet was higher than
digesta from WM diet fed pigs in ileum, jejunum and stomach and digesta from pigs fed
DDGS diet in caecum, ileum, jejunum and stomach. However, caecal digesta from pigs fed
DDGS diet had a greater total OA concentration than ileal digesta from WM diet fed pigs,
but the ileal digesta from WM diet fed pigs was higher than stomach digesta from pigs fed
DDGS diet (P < 0.01).
In phase 2, lactic acid and total OA concentration had an individual FDE and GIT
section effect (P < 0.05). The FDE supplement increased the lactic acid (25.39 vs 20.82
µmol/g; P = 0.03) and total OA concentration (108.5 vs 95.6 µmol/g; P = 0.004). The GIT
section effect showed that lactic acid concentration was highest in digesta from the ileum
followed by the caecum, with the jejunal digesta being intermediate, and stomach and
colon digesta being the lowest (P < 0.01). For total OA concentration, the highest was
observed in the caecal digesta followed by the colon, ileum, jejunal and stomach digesta.
However, total OA concentration in digesta from the jejunum was not different to that of
the ileum and stomach (P < 0.01). Acetic, propionic and iso-butyric acid concentrations
had a GIT section effect (P < 0.01). The highest concentration of acetic and propionate
acids in digesta were seen in the caecum followed by colon, with all other sections being
the lowest (P < 0.01). For iso-butyric acid, the highest concentration was observed in
digesta from the colon compared to other sections (P < 0.01). The concentration in caecal
digesta was greater than in jejunal and stomach digesta, however, the ileal digesta was not
different to caecum or jejunum. There was a diet by GIT section interaction (P = 0.003) for
n-butyric acid, such that caecal digesta from pigs fed WM diet had the highest
128
concentration then colon digesta from WM fed pigs, and caecal and colon digesta from
DDGS fed pigs. In the n-butyric acid concentration was below the detection level in the
stomach, jejunal and ileal digesta from pigs fed both diets.
5.4.8 Monosaccharide concentrations along the GIT
Glucose, xylose and arabinose concentrations are shown in Table 23. In phase 1
and 2, there was a diet by FDE by GIT section interaction (P < 0.05) for glucose and
xylose concentration, and a diet by GIT section interaction was seen for arabinose
concentration (P = 0.003). In phase 1, glucose concentration was highest in digesta
collected from pigs fed WM+FDE fed pigs in the jejunum (P = 0.017). Across the GIT, for
all treatments, glucose concentration in the digesta was increased in the jejunum. In phase
2, the highest glucose concentration was seen in jejunal digesta from WM+FDE fed pigs
however, jejunal digesta from pigs fed DDGS+FDE and WM-FDE diet were not different
(P = 0.006).
Xylose concentration in phase 1, was highest in caecal digesta from pigs fed
WM+FDE, however, ileal digesta from WM+FDE, caecal digesta from WM-FDE and
DDGS+FDE, and ileum and colon digesta from DDGS+FDE were not different (P =
0.007). The xylose concentration in digesta of pigs fed DDGS-FDE was not different
across the GIT, however, pigs fed DDGS+FDE, WM+FDE and WM-FDE had an increase
in ileum or caecum and decrease in the colon. In phase 2, xylose concentration was
highest in caecal digesta from pigs fed WM+FDE but ileal digesta from WM+FDE, caecal
digesta from WM-FDE and DDGS+FDE were not different (P = 0.001). The xylose
concentration in digesta from pigs fed DDGS-FDE was not different across the GIT
129
sections, however digesta from pigs fed WM+FDE, WM-FDE and DDGS+FDE, there was
an increase in the caecum (P = 0.001).
In phase 1, arabinose concentration was highest in caecal digesta from pigs fed WM
diet followed caecal digesta from DDGS diet fed pigs, then the remaining treatment groups
(P = 0.003). In phase 2, caecal digesta from DDGS fed pigs had the highest arabinose
concentration followed by caecal digesta from pigs fed WM, but ileal digesta from WM
diet and DDGS diet fed pigs was not different to caecal digesta from WM diet fed pigs (P
= 0.023).
5.5 Discussion
The NDF and CP in experimental diets in phases 1 and 2 was close to expected
values of 15 and 17.5 %, respectively. The expected xylanase activity in the +FDE diets
was 4,285.80 U/kg at an inclusion rate of 0.01 %. In both phases, +FDE treatments had a
greater xylanase activity compared to -FDE diets. However, significant amount of xylanase
activity was observed in WM-FDE diet. Compared to DDGS+FDE diets, WM+FDE
showed approximately 2 times more xylanase activity. The greater xylanase activity in
WM diets compared to DDGS diets may be due to naturally occurring endogenous
xylanase and microbial xylanase in wheat. The endo-xylanases are not equally distributed
in the cereal kernels as the xylanase level increases from the inner endosperm to outer
pericarp and microbial xylanases are mostly found on the outer surface of the kernels
(Dornez et al., 2009). The majority of xylanases found on the surface of grains are from
microbial origin, which can be removed by debranning or treating the surface with sodium
hypochlorite (Dornez et al., 2006). However, as WM includes particles of wheat bran,
130
wheat shorts, wheat germ, wheat flour and some of the “tail of the mill” residues (Erickson
et al., 1985a), it is likely that more naturally occurring xylanase was detected in the WM
diet compared to DDGS diet as DDGS which goes through heating, enzyme and
fermentation processes (Urriola et al., 2010).
The FDE supplementation improved ADG in both phases in the current study,
which agrees with other published studies using corn, wheat or/and their co-products with
FDE (Emiola et al., 2009b; Yoon et al., 2010; Kiarie et al., 2012; Ndou et al., 2015; Jerez-
Bogota et al., 2020). The improved ADG with FDE supplementation can be explained by
increased fiber (NDF and ADF) digestibility. The FDE supplementation also increased
backfat in phase 2, which is most likely due to improved ADG and digestibility.
In addition, pigs fed WM diets had greater ADFI. This may be due to less
palatability of diets containing DDGS. Results from study conducted by Hastad et al.
(2005) and Wu et al. (2016) showed reduced ADFI when diets containing 30 to 40 %
DDGS was fed to growing pigs. When pigs were given a choice of diet (i.e. corn-soybean
meal vs diet with DDGS) pigs prefer to consume a corn–soybean meal diet over the other
diet (Hastad et al., 2005). Furthermore, it has been reported that feed intake was increased
when pigs were fed diets with higher insoluble fibers than soluble fiber as physicochemical
properties of insoluble fiber increases digesta passage rate while soluble fibers have higher
water holding capacity and viscosity which delays the passage rate (Jha and Berrocoso,
2015; Wiseman, 2016). The insoluble and soluble fibers were not measured in the current
study however, the reported insoluble and soluble fiber contents were 34.49, 2.04 and 12.8,
1.10 % in WM and wheat, respectively (Casas et al., 2018) and 29.6, 2.9 and 7.3, 0.6 % for
DDGS and corn respectively (Pedersen et al., 2014). By calculating the insoluble and
131
soluble content of the experimental diets using the values from mentioned studies
(Soybean meal; insoluble 16.3, soluble; 2 % (Casas et al., 2018)), WM diets had a greater
insoluble fiber and lower soluble fiber content compared to DDGS diets, which for
insoluble fiber were 1.09 and 1.08 times greater in phases 1 and 2, and soluble fiber was
0.91 and 0.87 times less in phases 1 and 2 of WM diet compared to DDGS diets.
The small intestine weight in phase 2 was reduced in pigs fed the WM+FDE diet.
Previous studies have observed increases in visceral organ weights with increasing
amounts of fiber in the diets of growing pigs (Wenk, 2001; Len et al., 2009) which is due
to greater secretion of digestive fluids, enzymes and gut movement that results in the
enlargement of the organs (Wenk, 2001). Therefore, the supplementation of FDE which
improved the fiber digestion, may have been able to reduce the extra activity of the organs.
However, there was no difference between DDGS+FDE versus DDGS-FDE, and no
differences in stomach, and large intestine weight.
The greater AID and ACD of DM seen in phases 1 and 2 for pigs fed WM diets
than those fed the DDGS diets agrees with previous studies (Cadogan and Choct, 2015;
Kiarie et al., 2016c) which may be due to the difference in fiber structure among the
ingredients. The AID of NDF and ADF in pigs fed the DDGS and WM diets were close to
values obtained from other studies. However, the ACD of NDF and ADF was lower than
the ATTD from other studies (Moran et al., 2016; Jaworski and Stein, 2017; Casas et al.,
2018) as the ACD was measured from the middle section of the colon whereas other
studies have analyzed it on the fecal level. Therefore, the ACD from the current study may
not have fully captured the total digestibility. As expected, FDE supplementation improved
AID of NDF and ADF in both phases, and AID of NDF and ADF was 1.25, 1.17 and 1.51,
132
1.31 times greater in +FDE diets than -FDE diets for phases 1 and 2, respectively. The
FDE supplement had no effect on ACD of NDF and ADF, which can be explained by the
enzyme shifting part of hindgut fermentation towards the small intestine by enzymatic
digestion (Park et al., 2020), or as stated above, due to the collection site.
In the current study, the VH and VH:CD ratio was improved with FDE
supplementation, which agrees with other studies (Duarte et al., 2019; Chen et al., 2020)
where an improvement in VH or/and VH:CD ratio was observed when xylanase was
applied to the diet. The increase in VH and improved VH:CD ratio with FDE
supplementation indicates the reduction of oxidative stress as VH reduction is caused by
increased cell losses that results in crypt cells proliferation and, consequently, deeper CD
(Pluske et al., 1997). According to Duarte et al. (2019); Petry et al. (2020), xylanase has an
antioxidant effect within the ileum. Although the reason is unclear, one potential
mechanism suggested is the improved bioavailability of phenolic compounds from
arabinoxylan which could serve as antioxidants.
The low xylanase activity in the stomach is due to low pH in the stomach which
can inactivate the supplemented enzymes (Inborr et al., 1999). It has been found that
xylanase activity is lost or reduced under pH 2.5 (Chen et al., 2016). However, the increase
in xylanase activity in the jejunum was expected as the optimum pH for xylanase activity
ranges from pH 5 to 6 (Isil and Nilufer, 2005) and the pH of proximal small intestine is pH
5.7- 6.8 (Braude et al., 1976) which was seen in the current study. Regardless of FDE
supplementation, xylanase activity was observed across the GIT but was highest in the
caecum. The greater xylanase activity in the caecum is due to the larger and more variable
microbial population as the caecum is the main fermentation site in the GIT (Brestenský et
133
al., 2017). It has been found that some microbes have the ability to produce
arabinoxylan hydrolases. From study conducted by Zhang et al. (2018a), feeding pigs
wheat bran, which has more arabinoxylan compared to soybean hulls resulted in greater
Lactobacillus in the ileal digesta and feces. The members of Lactobacillus and
Bifidobacterium have been known to produce several arabinoxylan hydrolases such as α-L-
arabinofuranosidase, β-D-xylosidase and endo-1, 4-β-xylanase, and they can also grow on
xylo-oligosaccharides and arabinoxylan (van den Broek et al., 2008). However, α-L-
arabinofuranosidase, β-1,4-xylanase and β-D-xylosidase activity have been detected in
fecal inoculum from pigs fed controlled diets containing no arabinoxylan (Feng et al.,
2018a). Therefore, the xylanase activity seen in the digesta without FDE can be considered
xylanase produced from microbes in the gut. The apparent xylanase activity in the caecal
digesta from DDGS+FDE and WM+FDE fed pigs were 31.35, 34.7 and 26.59, 42.1 in
phase 1 and 2, respectively. However, the apparent xylanase activity does not account for
the synergic effect that enzyme supplementation may have on microbial xylanase
production, as enzyme supplementation can influence microbial diversity (Vardakou et al.,
2008; Zhang et al., 2018a).
Organic acids are produced from the microbial fermentation of
polysaccharides, oligosaccharides, proteins and other non digestible components.
Therefore, the composition of OA’s produced can be variable depending on the substrate
and the microbial population. In the current study, higher concentrations of acetic,
propionic, iso-butyric and n-butyric acid, and reduced lactic acid were seen in the caecum
and colon compared to the proximal intestine, which agrees a study conducted by
(Brestenský et al., 2017). The greater OA concentration in the caecum and colon is
134
assumed to be caused by more intensive fermentation that occurs due to greater microbial
populations as stated above. However, the lactic acid concentration was higher in ileum
compared to caecum and the colon which can be explained by microbes using or
converting the lactic acid to other OA such as acetic, propionic, and butyric acid
(Belenguer et al., 2006). The iso-butyric was highest in the colon compared to other GIT
sections in this study, which can be explained by less saccharolytic fermentation and
more proteolytic fermentation that occurs in the distal ileum as carbohydrates are
preferred substrates for most microbes and occurs mostly in the proximal GIT (Tiwari et
al., 2019).
In general, OA concentrations are lower in the distal colon compared to the
caecum due to absorption (Tiwari et al., 2019), which was seen in the current study where
total OA concentration in phase 2 was greater in the caecum compared to colon.
However, in phase 1, the total OA concentration in the caecum and colon were not
different from pigs fed WM, but in DDGS fed pigs, the colon had a higher total OA
concentration than caecum. This may be due to the chemical and structural differences of
fiber components entering into the caecum among the two diets, as microbial
fermentation is substrate dependant (Brestenský et al., 2017).
Enzyme supplementation increased the total OA concentration throughout the
whole GIT in phase 2 in the current study, which was 1.13 times more than in the GIT of
pigs fed no enzymes. This indicates that there was more available nutrients and solubilized
fiber for microbial fermentation, which can be seen from the improved NDF and ADF
digestibility and the monosaccharide concentrations. A study conduced by Yin et al.
(2000), also observed increased OA with xylanase supplementation in pigs fed wheat bran.
135
The highest xylose and arabinose concentrations seen in the ileal and caecal digesta
reflects the increased fermentation and degradation toward the distal GIT. Also, it indicates
that arabinoxylans require a longer time to be broken down compared to β-glucans
(Karppinen et al., 2000). The digesta from pigs fed DDGS+FDE had 2.01 and 1.22 times
more xylose concentration than that of pigs fed DDGS-FDE in the caecum in phase 1 and
2. Digesta from pigs fed WM+FDE had 1.85 and 1.56 times greater xylose compared to
digesta from pigs fed WM-FDE in the caecum in phase 1 and 2. The reduced FDE efficacy
in phase 2 compared to phase 1 indicates the improved ability to digest fiber as it has been
shown that older pigs are able to digest fibrous diet better than in younger pigs (Lindberg,
2014).
The increase in glucose concentration in the jejunal digesta represents starch
digestion. The difference in glucose concentrations between pigs fed with or without FDE
can be as attributed to glucose from β-glucan and cellulose breakdown, as the FDE used
contained a mix of xylanase, β-glucanase and cellulase. The glucose concentration in
jejunum was 1.79 and 1.18 times greater in digesta from pigs fed WM+FDE compared to
those fed WM-FDE in phase 1 and 2, respectively. For pigs fed DDGS, FDE treatment
showed 0.90 and 1.82 times more glucose in digesta compared to pigs that did not receive
FDE in phase 1 and 2 respectively. However, it is unclear whether the glucose is mostly
from β-glucans or cellulose because of three reasons: 1) in DDGS and WM, the
concentration of β-glucans is low but variable and therefore, the glucose concentration
could have been minimal, 2) β-glucans are more easily degraded compared to cellulose,
therefore, the majority of glucose in jejunum may have been from β-glucans, and while
glucose from distal GIT from cellulose, and 3) the diets had other ingredients such as
136
wheat and corn, which may have contributed to differences in starch content between the
two diets.
The FDE used in the currently study had a different enzyme profile compared to
FDE used in previous chapters, which had 19,142 U/g lower xylanase, and 4,830 U/g and
10,830 U/g higher β-glucanase and cellulase respectively. Even with the lower xylanase
activity, positive results were seen, however, there is no way to identify whether the
current FDE mixture was more or less effective compared to FDE used in previous
chapters. Therefore, research is needed to determine the optimum inclusion level of each
individual enzymes and the FDE.
In conclusion, although there were differences in monosaccharide and OA
concentrations among the treatments, feeding corn and DDGS diet and wheat and WM diet
with FDE to growing pigs increased ADG and AID of NDF and ADF.
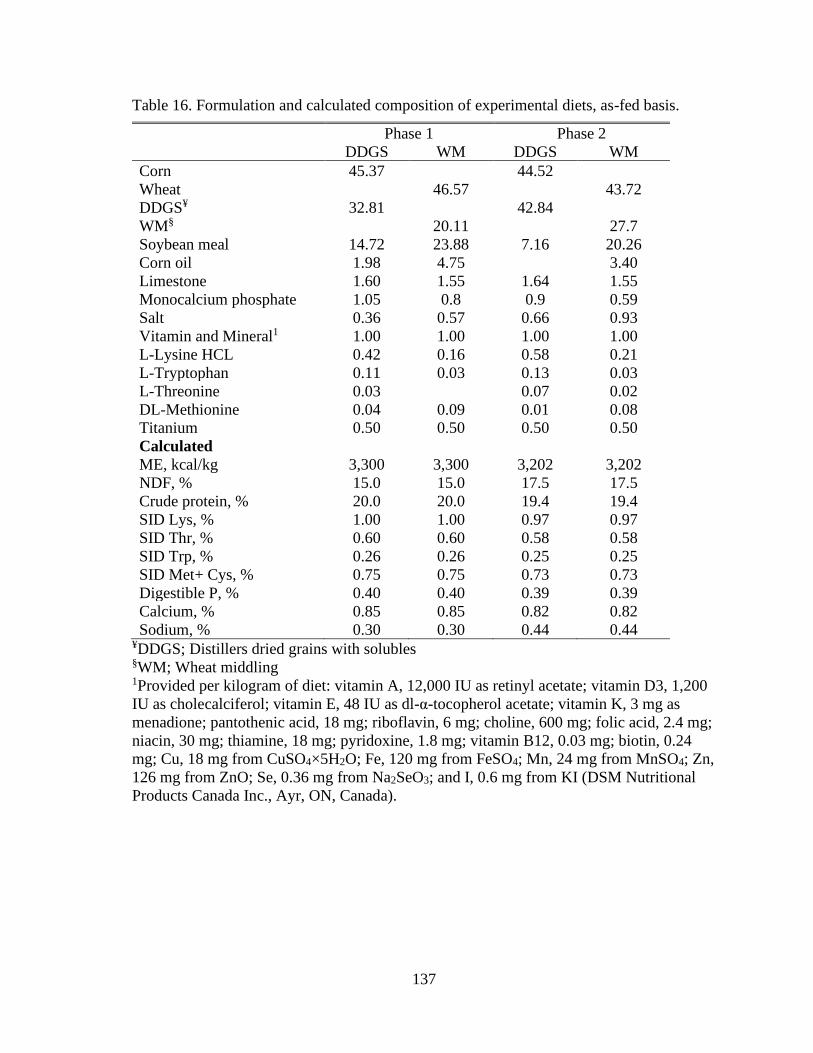
137
Table 16. Formulation and calculated composition of experimental diets, as-fed basis.
Phase 1 Phase 2
DDGS WM DDGS WM
Corn 45.37
44.52
Wheat
46.57
43.72
DDGS¥ 32.81
42.84
WM§
20.11
27.7
Soybean meal 14.72 23.88 7.16 20.26
Corn oil 1.98 4.75
3.40
Limestone 1.60 1.55 1.64 1.55
Monocalcium phosphate 1.05 0.8 0.9 0.59
Salt 0.36 0.57 0.66 0.93
Vitamin and Mineral1 1.00 1.00 1.00 1.00
L-Lysine HCL 0.42 0.16 0.58 0.21
L-Tryptophan 0.11 0.03 0.13 0.03
L-Threonine 0.03
0.07 0.02
DL-Methionine 0.04 0.09 0.01 0.08
Titanium 0.50 0.50 0.50 0.50
Calculated
ME, kcal/kg 3,300 3,300 3,202 3,202
NDF, % 15.0 15.0 17.5 17.5
Crude protein, % 20.0 20.0 19.4 19.4
SID Lys, % 1.00 1.00 0.97 0.97
SID Thr, % 0.60 0.60 0.58 0.58
SID Trp, % 0.26 0.26 0.25 0.25
SID Met+ Cys, % 0.75 0.75 0.73 0.73
Digestible P, % 0.40 0.40 0.39 0.39
Calcium, % 0.85 0.85 0.82 0.82
Sodium, % 0.30 0.30 0.44 0.44 ¥DDGS; Distillers dried grains with solubles §WM; Wheat middling 1Provided per kilogram of diet: vitamin A, 12,000 IU as retinyl acetate; vitamin D3, 1,200
IU as cholecalciferol; vitamin E, 48 IU as dl-α-tocopherol acetate; vitamin K, 3 mg as
menadione; pantothenic acid, 18 mg; riboflavin, 6 mg; choline, 600 mg; folic acid, 2.4 mg;
niacin, 30 mg; thiamine, 18 mg; pyridoxine, 1.8 mg; vitamin B12, 0.03 mg; biotin, 0.24
mg; Cu, 18 mg from CuSO4×5H2O; Fe, 120 mg from FeSO4; Mn, 24 mg from MnSO4; Zn,
126 mg from ZnO; Se, 0.36 mg from Na2SeO3; and I, 0.6 mg from KI (DSM Nutritional
Products Canada Inc., Ayr, ON, Canada).
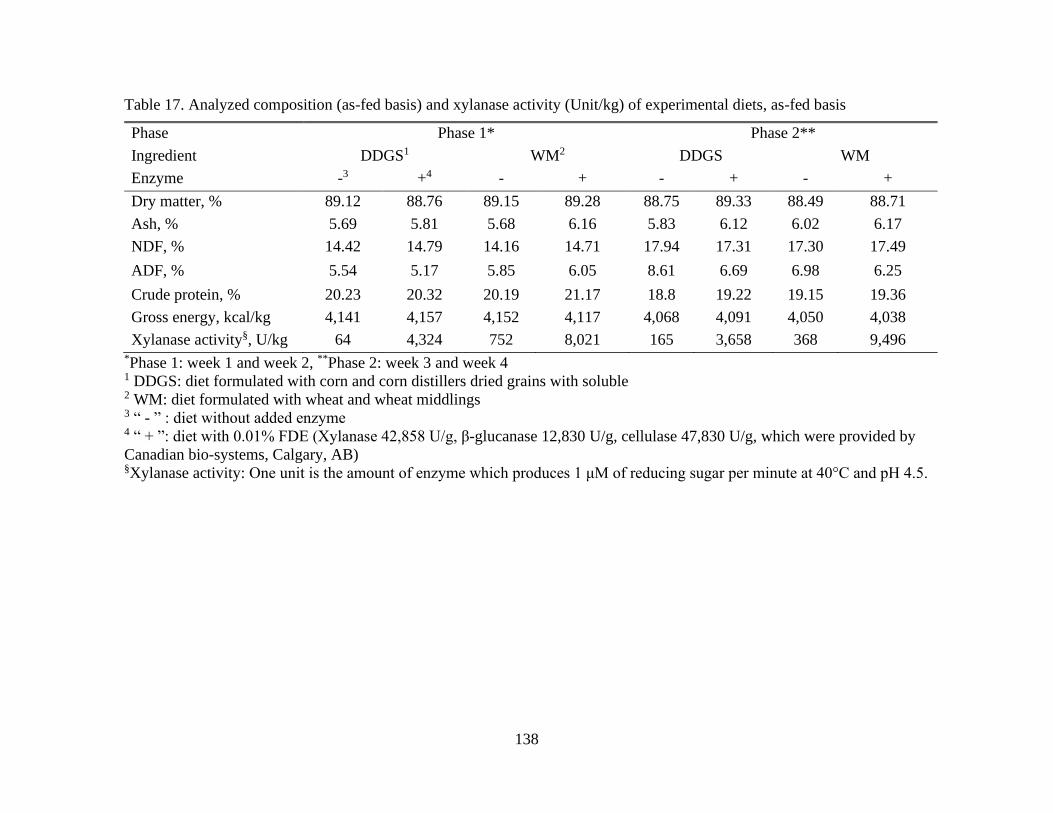
138
Table 17. Analyzed composition (as-fed basis) and xylanase activity (Unit/kg) of experimental diets, as-fed basis
Phase Phase 1* Phase 2**
Ingredient DDGS1 WM2 DDGS WM
Enzyme -3 +4 - + - + - +
Dry matter, % 89.12 88.76 89.15 89.28 88.75 89.33 88.49 88.71
Ash, % 5.69 5.81 5.68 6.16 5.83 6.12 6.02 6.17
NDF, % 14.42 14.79 14.16 14.71 17.94 17.31 17.30 17.49
ADF, % 5.54 5.17 5.85 6.05 8.61 6.69 6.98 6.25
Crude protein, % 20.23 20.32 20.19 21.17 18.8 19.22 19.15 19.36
Gross energy, kcal/kg 4,141 4,157 4,152 4,117 4,068 4,091 4,050 4,038
Xylanase activity§, U/kg 64 4,324 752 8,021 165 3,658 368 9,496 *Phase 1: week 1 and week 2, **Phase 2: week 3 and week 4 1 DDGS: diet formulated with corn and corn distillers dried grains with soluble 2 WM: diet formulated with wheat and wheat middlings 3 “ - ” : diet without added enzyme 4 “ + ”: diet with 0.01% FDE (Xylanase 42,858 U/g, β-glucanase 12,830 U/g, cellulase 47,830 U/g, which were provided by
Canadian bio-systems, Calgary, AB) §Xylanase activity: One unit is the amount of enzyme which produces 1 μM of reducing sugar per minute at 40°C and pH 4.5.
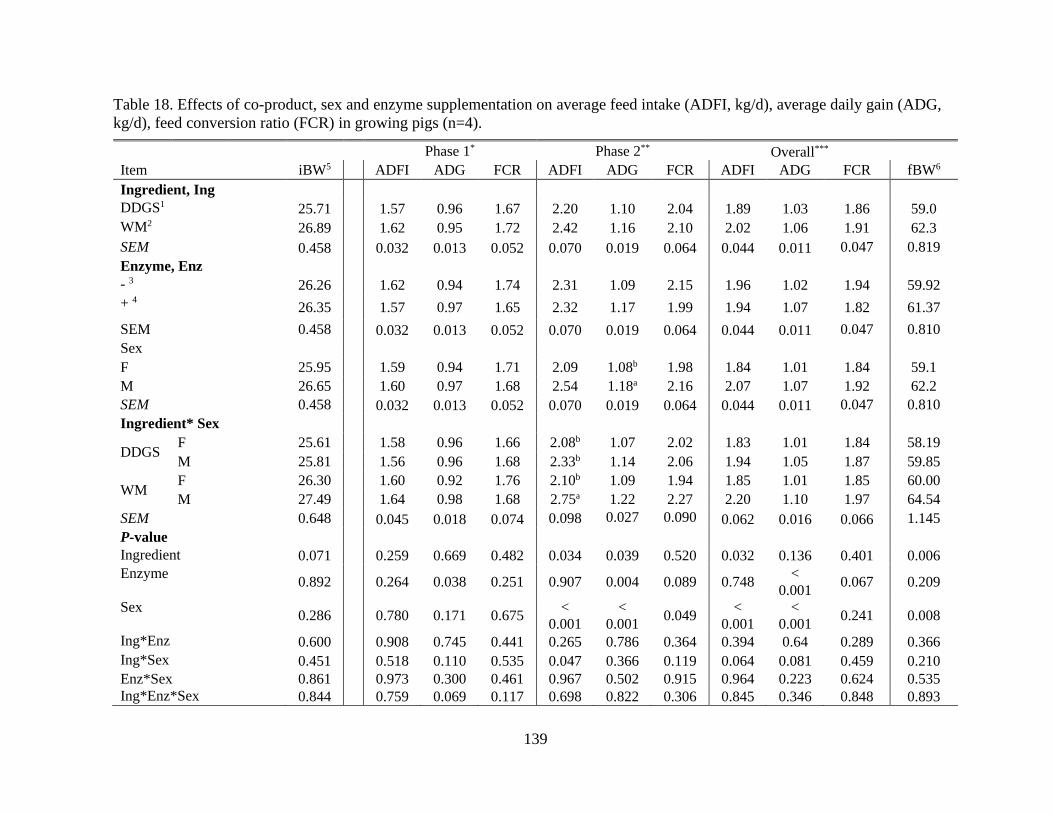
139
Table 18. Effects of co-product, sex and enzyme supplementation on average feed intake (ADFI, kg/d), average daily gain (ADG,
kg/d), feed conversion ratio (FCR) in growing pigs (n=4).
Phase 1* Phase 2** Overall*** Item iBW5 ADFI ADG FCR ADFI ADG FCR ADFI ADG FCR fBW6
Ingredient, Ing
DDGS1 25.71 1.57 0.96 1.67 2.20 1.10 2.04 1.89 1.03 1.86 59.0
WM2 26.89 1.62 0.95 1.72 2.42 1.16 2.10 2.02 1.06 1.91 62.3
SEM 0.458 0.032 0.013 0.052 0.070 0.019 0.064 0.044 0.011 0.047 0.819
Enzyme, Enz
- 3 26.26 1.62 0.94 1.74 2.31 1.09 2.15 1.96 1.02 1.94 59.92
+ 4 26.35 1.57 0.97 1.65 2.32 1.17 1.99 1.94 1.07 1.82 61.37
SEM 0.458 0.032 0.013 0.052 0.070 0.019 0.064 0.044 0.011 0.047 0.810
Sex
F 25.95 1.59 0.94 1.71 2.09 1.08b 1.98 1.84 1.01 1.84 59.1
M 26.65 1.60 0.97 1.68 2.54 1.18a 2.16 2.07 1.07 1.92 62.2
SEM 0.458 0.032 0.013 0.052 0.070 0.019 0.064 0.044 0.011 0.047 0.810
Ingredient* Sex
DDGS F 25.61 1.58 0.96 1.66 2.08b 1.07 2.02 1.83 1.01 1.84 58.19
M 25.81 1.56 0.96 1.68 2.33b 1.14 2.06 1.94 1.05 1.87 59.85
WM F 26.30 1.60 0.92 1.76 2.10b 1.09 1.94 1.85 1.01 1.85 60.00
M 27.49 1.64 0.98 1.68 2.75a 1.22 2.27 2.20 1.10 1.97 64.54
SEM 0.648 0.045 0.018 0.074 0.098 0.027 0.090 0.062 0.016 0.066 1.145
P-value
Ingredient 0.071 0.259 0.669 0.482 0.034 0.039 0.520 0.032 0.136 0.401 0.006
Enzyme 0.892
0.264 0.038 0.251 0.907 0.004 0.089 0.748
<
0.001 0.067 0.209
Sex 0.286
0.780 0.171 0.675
<
0.001
<
0.001 0.049
<
0.001
<
0.001 0.241 0.008
Ing*Enz 0.600 0.908 0.745 0.441 0.265 0.786 0.364 0.394 0.64 0.289 0.366
Ing*Sex 0.451 0.518 0.110 0.535 0.047 0.366 0.119 0.064 0.081 0.459 0.210
Enz*Sex 0.861 0.973 0.300 0.461 0.967 0.502 0.915 0.964 0.223 0.624 0.535
Ing*Enz*Sex 0.844 0.759 0.069 0.117 0.698 0.822 0.306 0.845 0.346 0.848 0.893
140
Means within column with similar superscripts are not different at P < 0.05 *Phase 1: week 1 and week 2, **Phase 2: week 3 and week 4, ***Overall: week 1 to week 4
1 DDGS: diet formulated with corn and corn distillers dried grains with soluble 2 WM: diet formulated with wheat and wheat middlings 3 “ - ” : diet without added enzyme, 4 “ + ”: diet with 0.01% FDE (Xylanase 42,858 U/g, β-glucanase 12,830 U/g, cellulase 47,830
U/g, which were provided by Canadian bio-systems, Calgary, AB) 5iBW: initial body weigh, 6fBW: final body weight
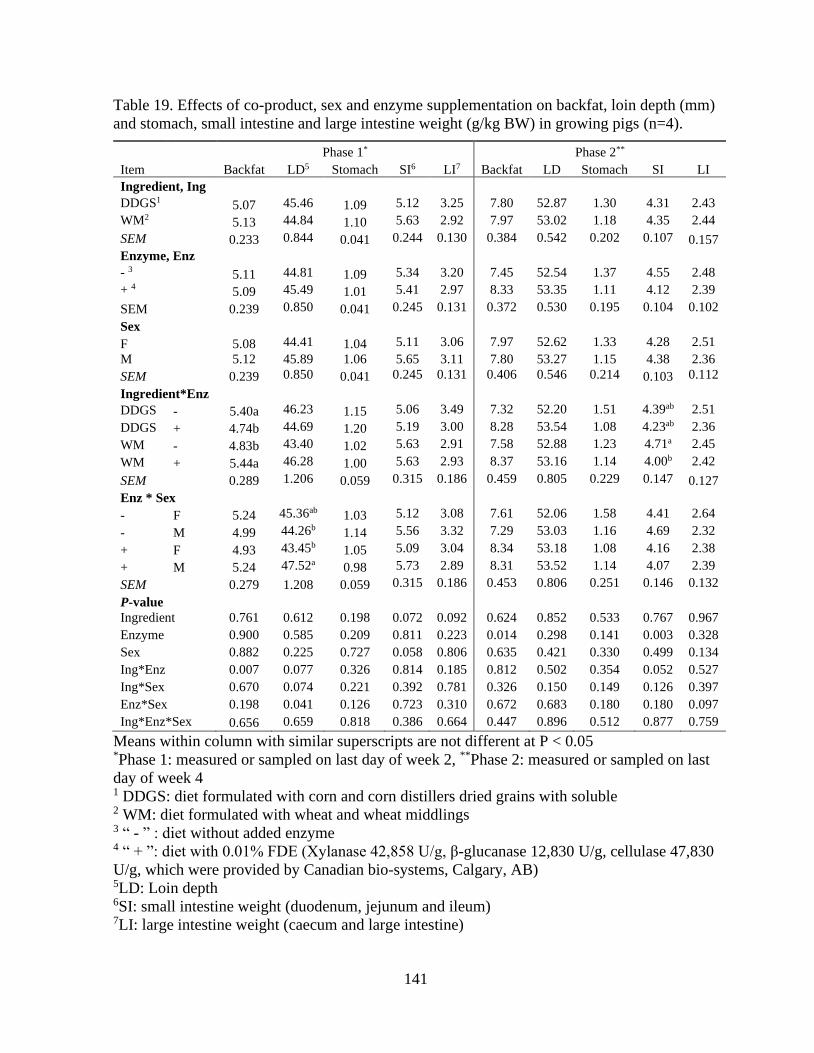
141
Table 19. Effects of co-product, sex and enzyme supplementation on backfat, loin depth (mm)
and stomach, small intestine and large intestine weight (g/kg BW) in growing pigs (n=4).
Phase 1* Phase 2**
Item Backfat LD5 Stomach SI6 LI7 Backfat LD Stomach SI LI
Ingredient, Ing DDGS1 5.07 45.46 1.09 5.12 3.25 7.80 52.87 1.30 4.31 2.43
WM2 5.13 44.84 1.10 5.63 2.92 7.97 53.02 1.18 4.35 2.44
SEM 0.233 0.844 0.041 0.244 0.130 0.384 0.542 0.202 0.107 0.157
Enzyme, Enz - 3 5.11 44.81 1.09 5.34 3.20 7.45 52.54 1.37 4.55 2.48
+ 4 5.09 45.49 1.01 5.41 2.97 8.33 53.35 1.11 4.12 2.39
SEM 0.239 0.850 0.041 0.245 0.131 0.372 0.530 0.195 0.104 0.102
Sex F 5.08 44.41 1.04 5.11 3.06 7.97 52.62 1.33 4.28 2.51
M 5.12 45.89 1.06 5.65 3.11 7.80 53.27 1.15 4.38 2.36
SEM 0.239 0.850 0.041 0.245 0.131 0.406 0.546 0.214 0.103 0.112
Ingredient*Enz DDGS - 5.40a 46.23 1.15 5.06 3.49 7.32 52.20 1.51 4.39ab 2.51
DDGS + 4.74b 44.69 1.20 5.19 3.00 8.28 53.54 1.08 4.23ab 2.36
WM - 4.83b 43.40 1.02 5.63 2.91 7.58 52.88 1.23 4.71a 2.45
WM + 5.44a 46.28 1.00 5.63 2.93 8.37 53.16 1.14 4.00b 2.42
SEM 0.289 1.206 0.059 0.315 0.186 0.459 0.805 0.229 0.147 0.127
Enz * Sex - F 5.24 45.36ab 1.03 5.12 3.08 7.61 52.06 1.58 4.41 2.64
- M 4.99 44.26b 1.14 5.56 3.32 7.29 53.03 1.16 4.69 2.32
+ F 4.93 43.45b 1.05 5.09 3.04 8.34 53.18 1.08 4.16 2.38
+ M 5.24 47.52a 0.98 5.73 2.89 8.31 53.52 1.14 4.07 2.39
SEM 0.279 1.208 0.059 0.315 0.186 0.453 0.806 0.251 0.146 0.132
P-value
Ingredient 0.761 0.612 0.198 0.072 0.092 0.624 0.852 0.533 0.767 0.967
Enzyme 0.900 0.585 0.209 0.811 0.223 0.014 0.298 0.141 0.003 0.328
Sex 0.882 0.225 0.727 0.058 0.806 0.635 0.421 0.330 0.499 0.134
Ing*Enz 0.007 0.077 0.326 0.814 0.185 0.812 0.502 0.354 0.052 0.527
Ing*Sex 0.670 0.074 0.221 0.392 0.781 0.326 0.150 0.149 0.126 0.397
Enz*Sex 0.198 0.041 0.126 0.723 0.310 0.672 0.683 0.180 0.180 0.097
Ing*Enz*Sex 0.656 0.659 0.818 0.386 0.664 0.447 0.896 0.512 0.877 0.759
Means within column with similar superscripts are not different at P < 0.05 *Phase 1: measured or sampled on last day of week 2, **Phase 2: measured or sampled on last
day of week 4 1 DDGS: diet formulated with corn and corn distillers dried grains with soluble 2 WM: diet formulated with wheat and wheat middlings 3 “ - ” : diet without added enzyme 4 “ + ”: diet with 0.01% FDE (Xylanase 42,858 U/g, β-glucanase 12,830 U/g, cellulase 47,830
U/g, which were provided by Canadian bio-systems, Calgary, AB) 5LD: Loin depth 6SI: small intestine weight (duodenum, jejunum and ileum) 7LI: large intestine weight (caecum and large intestine)
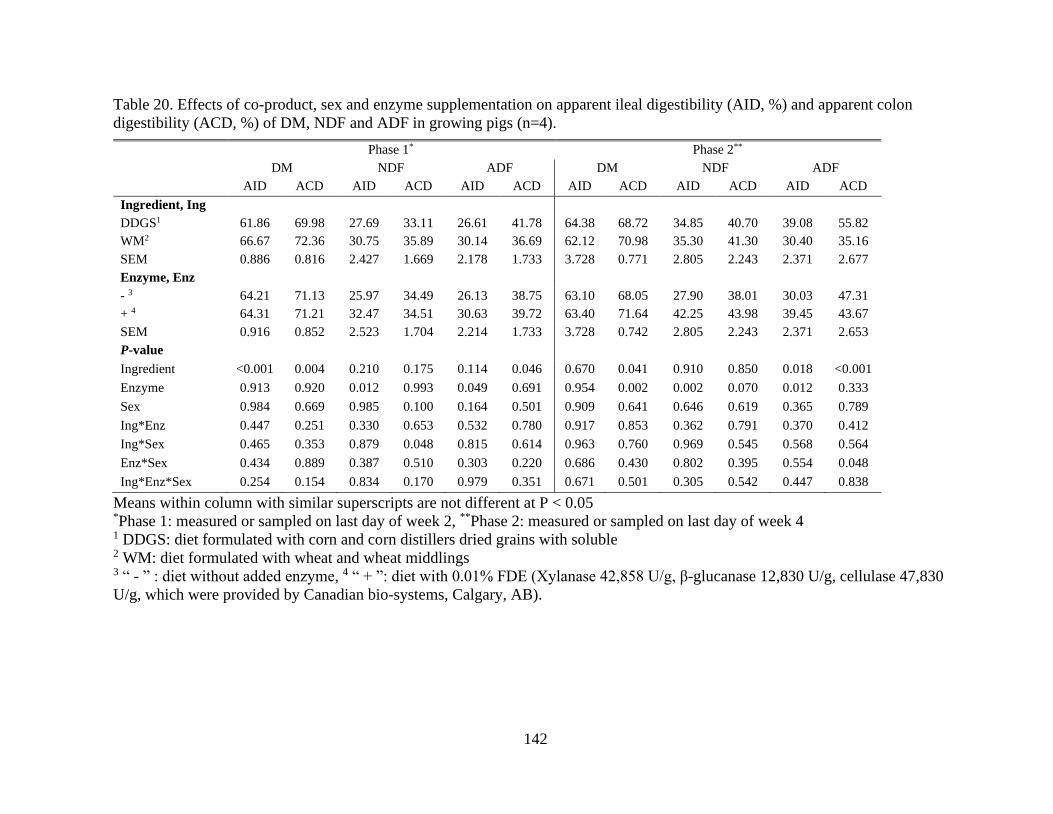
142
Table 20. Effects of co-product, sex and enzyme supplementation on apparent ileal digestibility (AID, %) and apparent colon
digestibility (ACD, %) of DM, NDF and ADF in growing pigs (n=4).
Phase 1* Phase 2** DM NDF ADF DM NDF ADF
AID ACD AID ACD AID ACD AID ACD AID ACD AID ACD
Ingredient, Ing
DDGS1 61.86 69.98 27.69 33.11 26.61 41.78 64.38 68.72 34.85 40.70 39.08 55.82
WM2 66.67 72.36 30.75 35.89 30.14 36.69 62.12 70.98 35.30 41.30 30.40 35.16
SEM 0.886 0.816 2.427 1.669 2.178 1.733 3.728 0.771 2.805 2.243 2.371 2.677
Enzyme, Enz
- 3 64.21 71.13 25.97 34.49 26.13 38.75 63.10 68.05 27.90 38.01 30.03 47.31
+ 4 64.31 71.21 32.47 34.51 30.63 39.72 63.40 71.64 42.25 43.98 39.45 43.67
SEM 0.916 0.852 2.523 1.704 2.214 1.733 3.728 0.742 2.805 2.243 2.371 2.653
P-value
Ingredient <0.001 0.004 0.210 0.175 0.114 0.046 0.670 0.041 0.910 0.850 0.018 <0.001
Enzyme 0.913 0.920 0.012 0.993 0.049 0.691 0.954 0.002 0.002 0.070 0.012 0.333
Sex 0.984 0.669 0.985 0.100 0.164 0.501 0.909 0.641 0.646 0.619 0.365 0.789
Ing*Enz 0.447 0.251 0.330 0.653 0.532 0.780 0.917 0.853 0.362 0.791 0.370 0.412
Ing*Sex 0.465 0.353 0.879 0.048 0.815 0.614 0.963 0.760 0.969 0.545 0.568 0.564
Enz*Sex 0.434 0.889 0.387 0.510 0.303 0.220 0.686 0.430 0.802 0.395 0.554 0.048
Ing*Enz*Sex 0.254 0.154 0.834 0.170 0.979 0.351 0.671 0.501 0.305 0.542 0.447 0.838
Means within column with similar superscripts are not different at P < 0.05 *Phase 1: measured or sampled on last day of week 2, **Phase 2: measured or sampled on last day of week 4 1 DDGS: diet formulated with corn and corn distillers dried grains with soluble 2 WM: diet formulated with wheat and wheat middlings 3 “ - ” : diet without added enzyme, 4 “ + ”: diet with 0.01% FDE (Xylanase 42,858 U/g, β-glucanase 12,830 U/g, cellulase 47,830
U/g, which were provided by Canadian bio-systems, Calgary, AB).
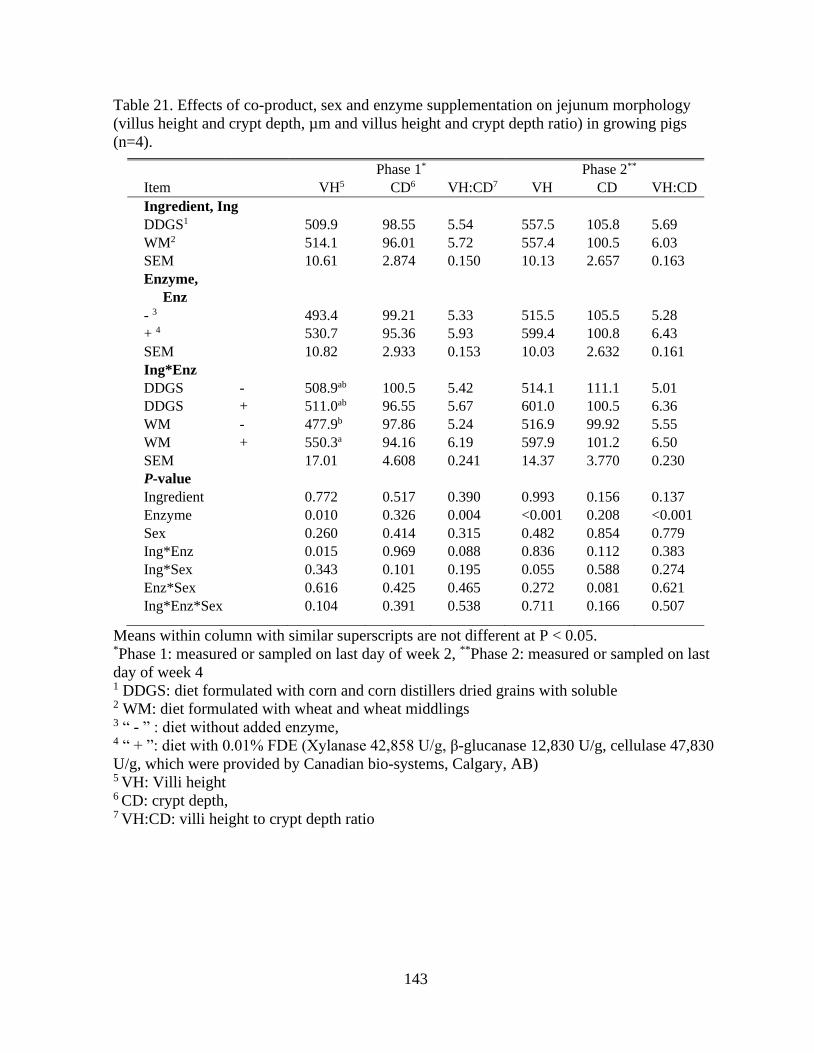
143
Table 21. Effects of co-product, sex and enzyme supplementation on jejunum morphology
(villus height and crypt depth, µm and villus height and crypt depth ratio) in growing pigs
(n=4).
Phase 1* Phase 2**
Item VH5 CD6 VH:CD7 VH CD VH:CD
Ingredient, Ing
DDGS1 509.9 98.55 5.54 557.5 105.8 5.69
WM2 514.1 96.01 5.72 557.4 100.5 6.03
SEM 10.61 2.874 0.150 10.13 2.657 0.163
Enzyme,
Enz
- 3 493.4 99.21 5.33 515.5 105.5 5.28
+ 4 530.7 95.36 5.93 599.4 100.8 6.43
SEM 10.82 2.933 0.153 10.03 2.632 0.161
Ing*Enz
DDGS - 508.9ab 100.5 5.42 514.1 111.1 5.01
DDGS + 511.0ab 96.55 5.67 601.0 100.5 6.36
WM - 477.9b 97.86 5.24 516.9 99.92 5.55
WM + 550.3a 94.16 6.19 597.9 101.2 6.50
SEM 17.01 4.608 0.241 14.37 3.770 0.230
P-value
Ingredient 0.772 0.517 0.390 0.993 0.156 0.137
Enzyme 0.010 0.326 0.004 <0.001 0.208 <0.001
Sex 0.260 0.414 0.315 0.482 0.854 0.779
Ing*Enz 0.015 0.969 0.088 0.836 0.112 0.383
Ing*Sex 0.343 0.101 0.195 0.055 0.588 0.274
Enz*Sex 0.616 0.425 0.465 0.272 0.081 0.621
Ing*Enz*Sex 0.104 0.391 0.538 0.711 0.166 0.507
Means within column with similar superscripts are not different at P < 0.05. *Phase 1: measured or sampled on last day of week 2, **Phase 2: measured or sampled on last
day of week 4 1 DDGS: diet formulated with corn and corn distillers dried grains with soluble 2 WM: diet formulated with wheat and wheat middlings 3 “ - ” : diet without added enzyme, 4 “ + ”: diet with 0.01% FDE (Xylanase 42,858 U/g, β-glucanase 12,830 U/g, cellulase 47,830
U/g, which were provided by Canadian bio-systems, Calgary, AB) 5 VH: Villi height 6 CD: crypt depth, 7 VH:CD: villi height to crypt depth ratio
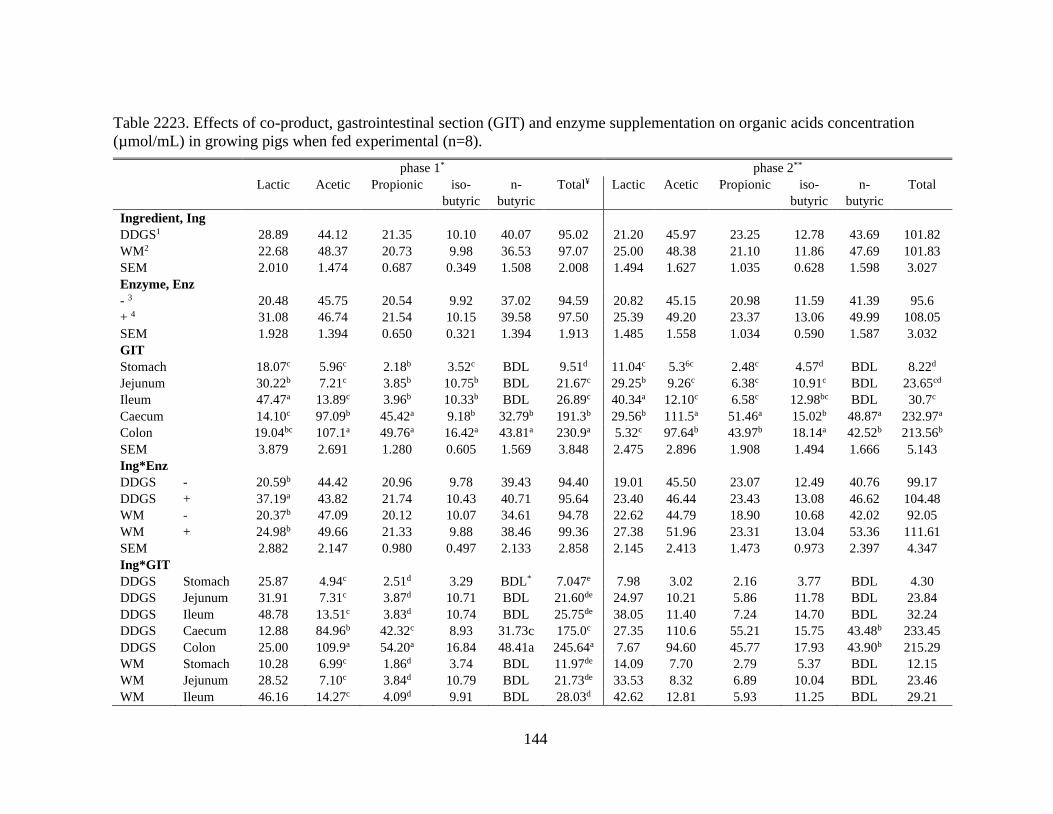
144
Table 2223. Effects of co-product, gastrointestinal section (GIT) and enzyme supplementation on organic acids concentration
(µmol/mL) in growing pigs when fed experimental (n=8).
phase 1* phase 2** Lactic Acetic Propionic iso-
butyric
n-
butyric
Total¥ Lactic Acetic Propionic iso-
butyric
n-
butyric
Total
Ingredient, Ing
DDGS1 28.89 44.12 21.35 10.10 40.07 95.02 21.20 45.97 23.25 12.78 43.69 101.82
WM2 22.68 48.37 20.73 9.98 36.53 97.07 25.00 48.38 21.10 11.86 47.69 101.83
SEM 2.010 1.474 0.687 0.349 1.508 2.008 1.494 1.627 1.035 0.628 1.598 3.027
Enzyme, Enz
- 3 20.48 45.75 20.54 9.92 37.02 94.59 20.82 45.15 20.98 11.59 41.39 95.6
+ 4 31.08 46.74 21.54 10.15 39.58 97.50 25.39 49.20 23.37 13.06 49.99 108.05
SEM 1.928 1.394 0.650 0.321 1.394 1.913 1.485 1.558 1.034 0.590 1.587 3.032
GIT
Stomach 18.07c 5.96c 2.18b 3.52c BDL 9.51d 11.04c 5.36c 2.48c 4.57d BDL 8.22d
Jejunum 30.22b 7.21c 3.85b 10.75b BDL 21.67c 29.25b 9.26c 6.38c 10.91c BDL 23.65cd
Ileum 47.47a 13.89c 3.96b 10.33b BDL 26.89c 40.34a 12.10c 6.58c 12.98bc BDL 30.7c
Caecum 14.10c 97.09b 45.42a 9.18b 32.79b 191.3b 29.56b 111.5a 51.46a 15.02b 48.87a 232.97a
Colon 19.04bc 107.1a 49.76a 16.42a 43.81a 230.9a 5.32c 97.64b 43.97b 18.14a 42.52b 213.56b
SEM 3.879 2.691 1.280 0.605 1.569 3.848 2.475 2.896 1.908 1.494 1.666 5.143
Ing*Enz
DDGS - 20.59b 44.42 20.96 9.78 39.43 94.40 19.01 45.50 23.07 12.49 40.76 99.17
DDGS + 37.19a 43.82 21.74 10.43 40.71 95.64 23.40 46.44 23.43 13.08 46.62 104.48
WM - 20.37b 47.09 20.12 10.07 34.61 94.78 22.62 44.79 18.90 10.68 42.02 92.05
WM + 24.98b 49.66 21.33 9.88 38.46 99.36 27.38 51.96 23.31 13.04 53.36 111.61
SEM
2.882 2.147 0.980 0.497 2.133 2.858 2.145 2.413 1.473 0.973 2.397 4.347
Ing*GIT
DDGS Stomach 25.87 4.94c 2.51d 3.29 BDL* 7.047e 7.98 3.02 2.16 3.77 BDL 4.30
DDGS Jejunum 31.91 7.31c 3.87d 10.71 BDL 21.60de 24.97 10.21 5.86 11.78 BDL 23.84
DDGS Ileum 48.78 13.51c 3.83d 10.74 BDL 25.75de 38.05 11.40 7.24 14.70 BDL 32.24
DDGS Caecum 12.88 84.96b 42.32c 8.93 31.73c 175.0c 27.35 110.6 55.21 15.75 43.48b 233.45
DDGS Colon 25.00 109.9a 54.20a 16.84 48.41a 245.64a 7.67 94.60 45.77 17.93 43.90b 215.29
WM Stomach 10.28 6.99c 1.86d 3.74 BDL 11.97de 14.09 7.70 2.79 5.37 BDL 12.15
WM Jejunum 28.52 7.10c 3.84d 10.79 BDL 21.73de 33.53 8.32 6.89 10.04 BDL 23.46
WM Ileum 46.16 14.27c 4.09d 9.91 BDL 28.03d 42.62 12.81 5.93 11.25 BDL 29.21
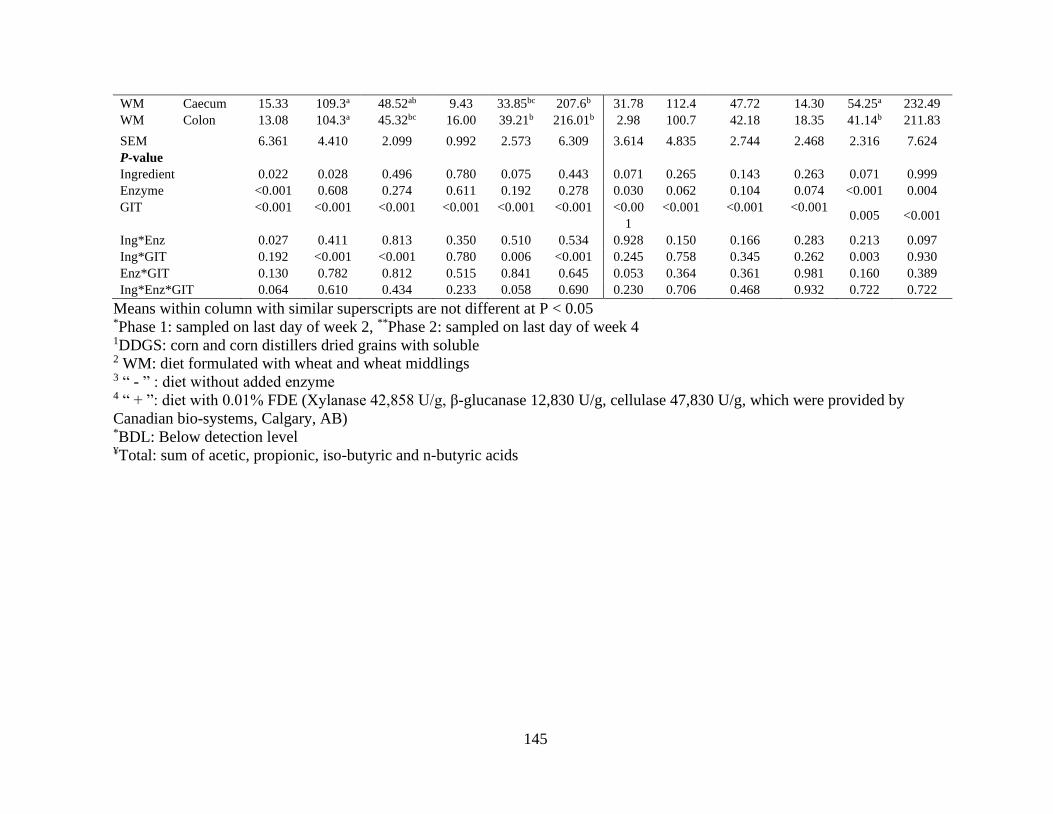
145
WM Caecum 15.33 109.3a 48.52ab 9.43 33.85bc 207.6b 31.78 112.4 47.72 14.30 54.25a 232.49
WM Colon 13.08 104.3a 45.32bc 16.00 39.21b 216.01b 2.98 100.7 42.18 18.35 41.14b 211.83
SEM
6.361 4.410 2.099 0.992 2.573 6.309 3.614 4.835 2.744 2.468 2.316 7.624
P-value
Ingredient 0.022 0.028 0.496 0.780 0.075 0.443 0.071 0.265 0.143 0.263 0.071 0.999
Enzyme <0.001 0.608 0.274 0.611 0.192 0.278 0.030 0.062 0.104 0.074 <0.001 0.004
GIT <0.001 <0.001 <0.001 <0.001 <0.001 <0.001 <0.00
1
<0.001 <0.001 <0.001 0.005 <0.001
Ing*Enz 0.027 0.411 0.813 0.350 0.510 0.534 0.928 0.150 0.166 0.283 0.213 0.097
Ing*GIT 0.192 <0.001 <0.001 0.780 0.006 <0.001 0.245 0.758 0.345 0.262 0.003 0.930
Enz*GIT 0.130 0.782 0.812 0.515 0.841 0.645 0.053 0.364 0.361 0.981 0.160 0.389
Ing*Enz*GIT 0.064 0.610 0.434 0.233 0.058 0.690 0.230 0.706 0.468 0.932 0.722 0.722
Means within column with similar superscripts are not different at P < 0.05 *Phase 1: sampled on last day of week 2, **Phase 2: sampled on last day of week 4 1DDGS: corn and corn distillers dried grains with soluble 2 WM: diet formulated with wheat and wheat middlings 3 “ - ” : diet without added enzyme 4 “ + ”: diet with 0.01% FDE (Xylanase 42,858 U/g, β-glucanase 12,830 U/g, cellulase 47,830 U/g, which were provided by
Canadian bio-systems, Calgary, AB) *BDL: Below detection level ¥Total: sum of acetic, propionic, iso-butyric and n-butyric acids
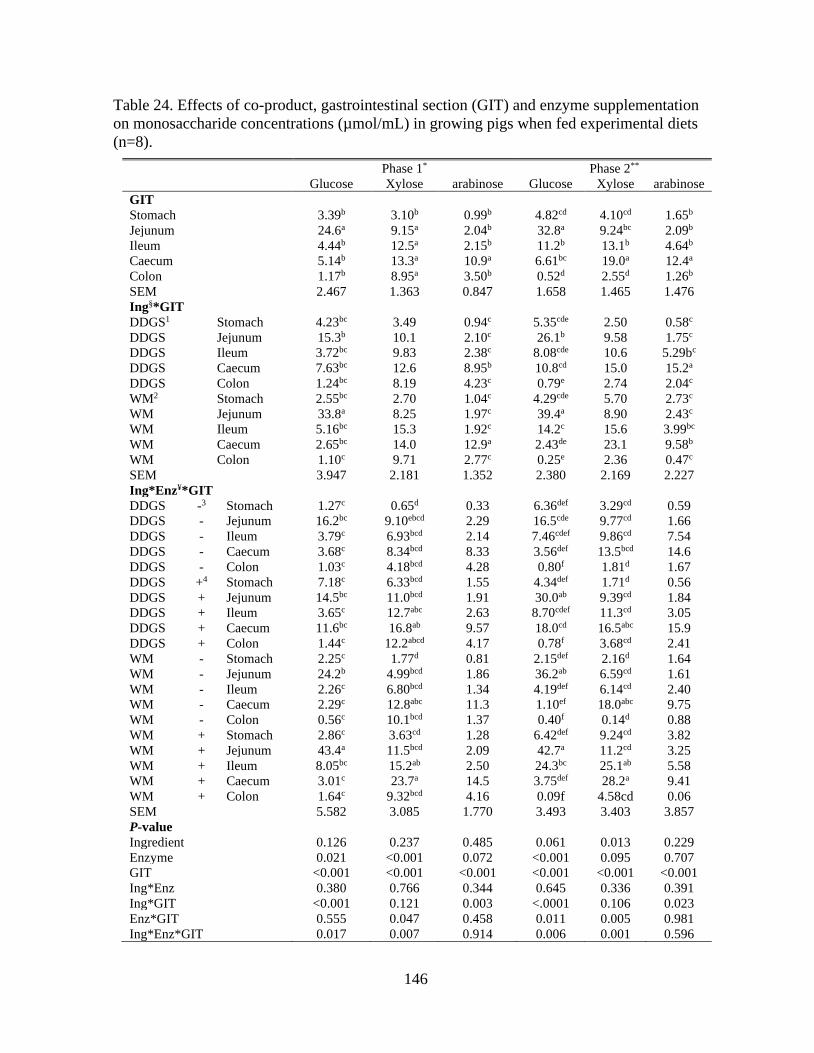
146
Table 24. Effects of co-product, gastrointestinal section (GIT) and enzyme supplementation
on monosaccharide concentrations (µmol/mL) in growing pigs when fed experimental diets
(n=8).
Phase 1* Phase 2** Glucose Xylose arabinose Glucose Xylose arabinose
GIT
Stomach 3.39b 3.10b 0.99b 4.82cd 4.10cd 1.65b
Jejunum 24.6a 9.15a 2.04b 32.8a 9.24bc 2.09b
Ileum 4.44b 12.5a 2.15b 11.2b 13.1b 4.64b
Caecum 5.14b 13.3a 10.9a 6.61bc 19.0a 12.4a
Colon 1.17b 8.95a 3.50b 0.52d 2.55d 1.26b
SEM 2.467 1.363 0.847 1.658 1.465 1.476
Ing§*GIT
DDGS1 Stomach 4.23bc 3.49 0.94c 5.35cde 2.50 0.58c
DDGS Jejunum 15.3b 10.1 2.10c 26.1b 9.58 1.75c
DDGS Ileum 3.72bc 9.83 2.38c 8.08cde 10.6 5.29bc
DDGS Caecum 7.63bc 12.6 8.95b 10.8cd 15.0 15.2a
DDGS Colon 1.24bc 8.19 4.23c 0.79e 2.74 2.04c
WM2 Stomach 2.55bc 2.70 1.04c 4.29cde 5.70 2.73c
WM Jejunum 33.8a 8.25 1.97c 39.4a 8.90 2.43c
WM Ileum 5.16bc 15.3 1.92c 14.2c 15.6 3.99bc
WM Caecum 2.65bc 14.0 12.9a 2.43de 23.1 9.58b
WM Colon 1.10c 9.71 2.77c 0.25e 2.36 0.47c
SEM 3.947 2.181 1.352 2.380 2.169 2.227
Ing*Enz¥*GIT
DDGS -3 Stomach 1.27c 0.65d 0.33 6.36def 3.29cd 0.59
DDGS - Jejunum 16.2bc 9.10ebcd 2.29 16.5cde 9.77cd 1.66
DDGS - Ileum 3.79c 6.93bcd 2.14 7.46cdef 9.86cd 7.54
DDGS - Caecum 3.68c 8.34bcd 8.33 3.56def 13.5bcd 14.6
DDGS - Colon 1.03c 4.18bcd 4.28 0.80f 1.81d 1.67
DDGS +4 Stomach 7.18c 6.33bcd 1.55 4.34def 1.71d 0.56
DDGS + Jejunum 14.5bc 11.0bcd 1.91 30.0ab 9.39cd 1.84
DDGS + Ileum 3.65c 12.7abc 2.63 8.70cdef 11.3cd 3.05
DDGS + Caecum 11.6bc 16.8ab 9.57 18.0cd 16.5abc 15.9
DDGS + Colon 1.44c 12.2abcd 4.17 0.78f 3.68cd 2.41
WM - Stomach 2.25c 1.77d 0.81 2.15def 2.16d 1.64
WM - Jejunum 24.2b 4.99bcd 1.86 36.2ab 6.59cd 1.61
WM - Ileum 2.26c 6.80bcd 1.34 4.19def 6.14cd 2.40
WM - Caecum 2.29c 12.8abc 11.3 1.10ef 18.0abc 9.75
WM - Colon 0.56c 10.1bcd 1.37 0.40f 0.14d 0.88
WM + Stomach 2.86c 3.63cd 1.28 6.42def 9.24cd 3.82
WM + Jejunum 43.4a 11.5bcd 2.09 42.7a 11.2cd 3.25
WM + Ileum 8.05bc 15.2ab 2.50 24.3bc 25.1ab 5.58
WM + Caecum 3.01c 23.7a 14.5 3.75def 28.2a 9.41
WM + Colon 1.64c 9.32bcd 4.16 0.09f 4.58cd 0.06
SEM 5.582 3.085 1.770 3.493 3.403 3.857
P-value
Ingredient 0.126 0.237 0.485 0.061 0.013 0.229
Enzyme 0.021 <0.001 0.072 <0.001 0.095 0.707
GIT <0.001 <0.001 <0.001 <0.001 <0.001 <0.001
Ing*Enz 0.380 0.766 0.344 0.645 0.336 0.391
Ing*GIT <0.001 0.121 0.003 <.0001 0.106 0.023
Enz*GIT 0.555 0.047 0.458 0.011 0.005 0.981
Ing*Enz*GIT 0.017 0.007 0.914 0.006 0.001 0.596
147
Means within column with similar superscripts are not different at P < 0.05. *Phase 1: sampled on last day of week 2, **Phase 2: sampled on last day of week 4 § Ing: ingredient ¥ Enz: enzyme 1 DDGS: diet formulated with corn and corn distillers dried grains with soluble 2 WM: diet formulated with wheat and wheat middlings 3 “ - ” : diet without added enzyme 4 “ + ”: diet with 0.01% FDE (Xylanase 42,858 U/g, β-glucanase 12,830 U/g, cellulase 47,830
U/g, which were provided by Canadian bio-systems, Calgary, AB)
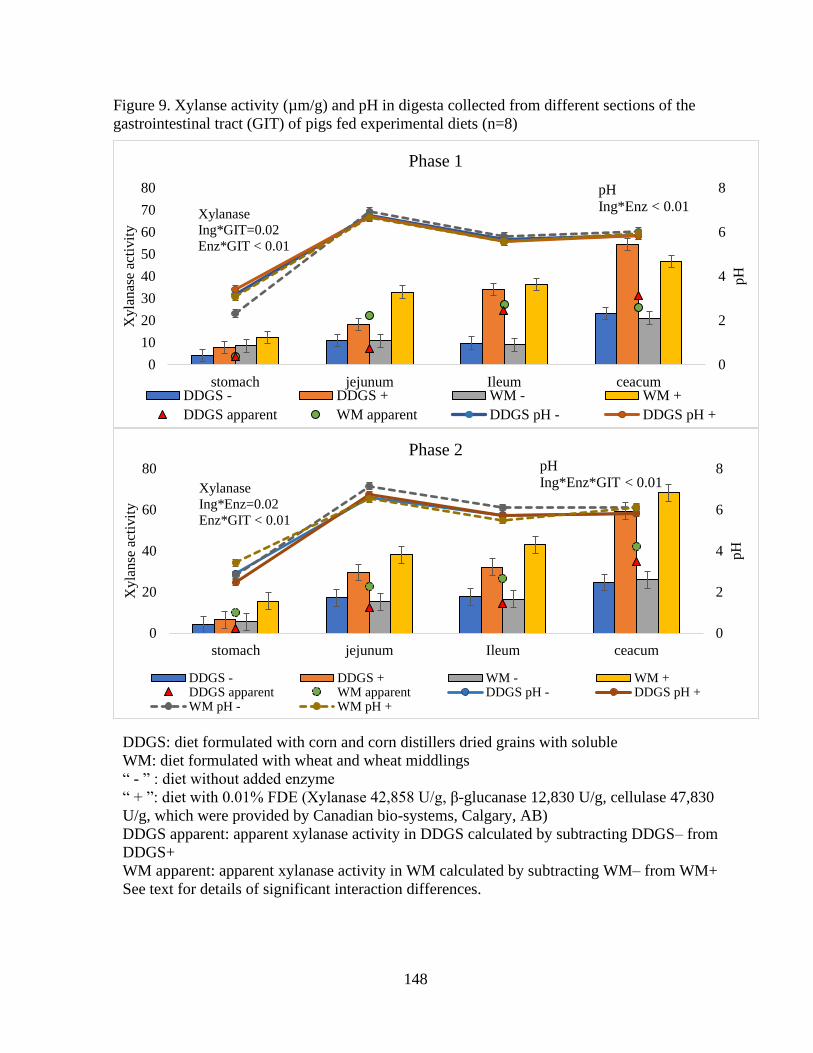
148
Figure 9. Xylanse activity (µm/g) and pH in digesta collected from different sections of the
gastrointestinal tract (GIT) of pigs fed experimental diets (n=8)
DDGS: diet formulated with corn and corn distillers dried grains with soluble
WM: diet formulated with wheat and wheat middlings
“ - ” : diet without added enzyme
“ + ”: diet with 0.01% FDE (Xylanase 42,858 U/g, β-glucanase 12,830 U/g, cellulase 47,830
U/g, which were provided by Canadian bio-systems, Calgary, AB)
DDGS apparent: apparent xylanase activity in DDGS calculated by subtracting DDGS– from
DDGS+
WM apparent: apparent xylanase activity in WM calculated by subtracting WM– from WM+
See text for details of significant interaction differences.
0
2
4
6
8
0
10
20
30
40
50
60
70
80
stomach jejunum Ileum ceacum
pH
Xyla
nas
e ac
tivit
y
Phase 1
DDGS - DDGS + WM - WM +
DDGS apparent WM apparent DDGS pH - DDGS pH +
pH
Ing*Enz < 0.01Xylanase
Ing*GIT=0.02
Enz*GIT < 0.01
0
2
4
6
8
0
20
40
60
80
stomach jejunum Ileum ceacum
pH
Xyla
nse
act
ivit
y
Phase 2
DDGS - DDGS + WM - WM +DDGS apparent WM apparent DDGS pH - DDGS pH +WM pH - WM pH +
Xylanase
Ing*Enz=0.02
Enz*GIT < 0.01
pH
Ing*Enz*GIT < 0.01
149
6 CHAPTER SIX. General discussion
Agriculture has been feeding billions of people across the globe, and demand for
animal food products is likely to increase over the next several decades due to the increasing
population (Clark and Tilman, 2017). With the increasing demand for animal products,
agricultural activities will increase, and environmental degradation will be inevitable.
Therefore, producing quality food/feed in order to meet the demand in a sustainable manner
that can minimize environmental impact is crucial (Clark and Tilman, 2017; Calicioglu et al.,
2019). One of the strategies to improve productivity and sustainability is to expand feed
sources such as using industrial co-products, organic waste, and alternative crops for animal
feed (Perez de Nanclares Fernandez, 2017). Some of the alternative ingredients, such as cereal
grain co-products from the biofuel (e.g. distillers dried grains with solubles, DDGS) and
milling industry (e.g. wheat middlings, WM) are currently being used in pig feed due to their
availability (Stein and Shurson, 2009; Woyengo et al., 2014; Casas et al., 2018). The addition
of DDGS and WM in pig feed can also be cost effective when commonly used ingredients
such as corn and wheat prices are fluctuating (Woyengo et al., 2014). However, co-products
have high fiber content compared to parent grains as described (Chapter 1) and confirmed
(Chapter 3) in this thesis and elsewhere. Although pigs are not efficient at utilizing high fiber
ingredients/diets (Adeola and Cowieson, 2011), interest in using higher fiber co-products in
pig diets has been increasing due to the potential benefit of dietary fiber in improving gut
health (e.g., prebiotic effects and enhancement of gut function)(Agyekum and Nyachoti,
2017). Therefore, nutritional strategies (e.g. adding FDE to/or liquid feeding) to improve
utilization of fibrous co-products are of particular interest as it has the potential to reduce
environmental impact and improve the pork production profitability.
150
As reviewed in Chapter 1, there is an opportunity to improve the feeding value of
DDGS and WM by using fiber degrading enzymes (FDE). By doing so, the benefit of feeding
fibrous ingredients (for example, prebiotic effects, etc.) can be kept while reducing the
negative effects of fibrous ingredients such as reduced nutrient absorption and digestion.
However, results are inconsistent when FDE are added to pig diets and the reason for that has
not been clear. Therefore, the present thesis evaluated the effects of applying FDE to 1) raw
ingredient (DDGS and WM), 2) digesta collected from distal ileum of pigs fed DDGS or WM,
and 3) pig diets formulated with DDGS or WM, focusing on the fiber disappearance and
monosaccharide availability, as well as enzyme activity. The research involved in vitro, in
vivo-in vitro, and in vivo studies to explore different approaches to determine FDE
effectiveness when applied to DDGS and WM.
When FDE was applied to digesta collected from pigs fed a co-product diet in an in
vitro study (Chapter 4), monosaccharide concentrations increased while fiber content
decreased with prolonged incubation time. This indicated the potential to improve fiber
hydrolysis in the upper gut with FDE supplementation. However, when Moran et al. (2016)
added xylanase to pig diet with DDGS or WM, improvement in AID and ATTD of NDF was
only seen in WM diet. This is due to the structural differences, therefore, to efficiently use
DDGS in pig diet, pre-incubation may be necessary as monosaccharide concentrations were
increased with incubation with FDE (Chapter 3).
Despite the improvement in AID of NDF in WM diet with FDE, it was still less than
60 % digestible (Moran et al., 2016) and from chapter 5, AID of NDF was improved with the
addition of FDE but, was only from 32.47 to 42.25 %. Therefore, there is still room to
improve the fiber digestibility in the upper gut of pigs. In order for enzymes to have an effect
151
on fiber digestibility, it has to first survive through the low pH and proteases in the stomach.
The xylanase activity of added xylanase across the GIT was lowest in the stomach, and as the
pH increased to pH 6-7 in jejunum, ileum and caecum, xylanase activity increased (Chapter
5). Although partial xylanase activity seemed to be recovered in the jejunum, it was lower
than the enzyme activity in the diet. Therefore, if the enzyme activity or survival can be
secured, there may be a possibility to further improve fiber digestibility in the upper gut as
FDE was able to breakdown fiber fractions from digesta collected from pigs fed DDGS or
WM diet (Chapter 4).
In Chapter 3, the effects of applying a combination of FDE and protease together or
alone to DDGS and WM in an in vitro study were investigated. The Boisen and Fernández
(1997) 2-step or 3-step in vitro method was not used, and raw ingredients (DDGS and WM)
were mixed with water with or without FDE and steeped for 72 h. This was to determine the
enzyme effectiveness on the raw materials (DDGS and WM), as Boisen and Fernández (1997)
method involve acid and enzymatic digestion to mimic the GIT, which may alter the structure
of DDGS and WM. However, although FDE improved monosaccharide release from fiber
components, the effects may have been also due to the naturally occurring enzymes present in
the co-products. Because the incubation did not involve any acid treatment it is likely that the
naturally occurring enzymes may have been activated when water was added. Therefore, to
determine the sole effect of FDE on fiber components in DDGS and WM, ingredients may need
to be cleaned before.
The information generated from Chapter 3 is applicable for liquid feeding systems. In
liquid feeding, controlling the fermentation is a major challenge as it can have an adverse effect
such as reduce palatability due to high acetic acid and/or mold and pathogenic proliferation
152
(Wiseman, 2016). As seen in DDGS and WM with or without FDE in chapter 3, the lactic and
acetic acid concentration increased while pH decreased over time. This is because as soon as a
feedstuff is soaked with water, naturally occurring enzymes, bacteria and yeasts are activated
and start to produce lactic and acetic acid (which reduces the pH), and ethanol (Brooks et al.,
2001a). Fermentation can be divided into two phases; the first phase has low concentrations of
lactic acid bacteria, yeasts, lactic acid, high pH, and high levels of enterobacteria. The second
phase which is called the “steady state”, has a high lactic acid bacteria, yeasts, lactic acid, low
pH, and low enterobacteria counts (Brooks et al., 2001a; Canibe and Jensen, 2003). It is
important for the liquid feed to reach the steady state as it is considered a good quality fermented
liquid feed. The good quality liquid feed can be characterized by pH below 4.5, lactic acid
concentration approximates to or above 100 mM, and acetic acid concentration below 40 mM.
Steeping DDGS with FDE for 48 and 72 h resulted in steady state liquid feed (Chapter 3).
Contrary to that, for WM, steeping for 24 h or more with FDE seemed to have resulted in steady
state, however, the acetic acid was above the good quality parameter, which when fed to pigs,
may have palatability issue due to the distinct vinegar taste. The different outcomes among the
two ingredients may have been due to the structural differences. Not only that, the naturally
occurring enzymes in the ingredients may have affected the outcomes, but especially in WM,
because DDGS goes through processing which includes fermentation and heat treatments that
may have deactivated most of the naturally occurring enzymes.
Steeping DDGS with FDE for 24 h, and 12 h for WM with FDE resulted in an increased
monosaccharide concentration in the supernatant. The steeping time for maximum
monosaccharide release and good quality criteria (low pH and acetic acid and high lactic acid)
does not match, which raises a question of what parameters are to be considered more. When
153
considering the gut health perspective, steeping DDGS with FDE for 48 or 72 h and steeping
WM with FDE for 12 h seems ideal as the lactic and acetic acid and pH is within or close to the
good quality characteristics. However, when considering the monosaccharide concentrations in
the liquid feed for improved nutrient availability steeping DDGS with FDE for 24 h and 12 h
for WM with FDE seems optimum.
As described in Chapter 1, the FDE is thought to improve utilization of fibrous
ingredient/diet in pigs by reducing viscosity, breaking down fiber components into smaller
monosaccharides and lastly eliminating encapsulation effects of nutrients. Viscosity was not
measured in in vitro incubation samples in Chapters 3 and 4, and digesta collected from pigs
from Chapters 4 and 5. Therefore, it is unclear whether FDE reduced viscosity of the in vitro
content or in the digesta collected from pigs. However, reduced digesta viscosity is seen in
chickens with more consistency than in pigs (Raza et al., 2019). The intestinal digesta is more
watery in pigs than in the chicken (Campbell and Bedford, 1992) which may be the reason
why there are fewer studies that support viscosity effect on nutrient digestibility for swine
compared to poultry (Li, 2000). Increased viscosity is known to reduce feed intake (Wenk,
2001), but in the current study, there was no difference in ADFI when FDE was applied
(Chapter 5). Therefore, it may be true that viscosity has less effect in pigs, however, further
studies are required to confirm this statement. An in vitro study conducted by Jha et al. (2015)
showed that exogenous FDE improved degradation of fiber-starch-protein matrix in DDGS
visually using microscopy. In addition, the fiber disappearance was improved with FDE in all
chapters of this thesis which suggests FDE effects of hydrolyzing fiber fractions to release
monomers and remove encapsulation effect. Therefore, the major antinutritive effect of fiber
in pigs may be more related to nutrient encapsulation rather than viscosity in pigs.
154
Glucose, xylose and arabinose were selected in this thesis because arabinoxylan,
cellulose and β-glucans are the most abundant NSP in co-products. In Chapters 3 and 4, the
monosaccharide concentration showed an increase with FDE. This indicates the effectiveness
of FDE in releasing monosaccharides from DDGS, WM and digesta collected from pigs fed
those co-products, mostly from arabinoxylan and cellulose and to a lesser extent, β-glucans.
The monosaccharide concentration observed in the digesta collected from different parts of
GIT of pigs (Chapter 5) indicates that monosaccharides are being released in jejunum as
enzyme activity was recovered from stomach to jejunum. However, the monosaccharides in
digesta does not represent monosaccharides released by FDE as it may be also due to
microbial hydrolysis. Also, as microbial fermentation is affected by many factors including
enzyme supplementation, substrate type and amount (Brestenský et al., 2017), therefore, it is
hard to conclude whether the result of monosaccharide release is purely from FDE or not.
Also, measuring monosaccharide concentrations in the digesta does not reflect the total
monosaccharides that are being released because absorption occurs throughout the GIT.
Glucose, xylose and arabinose are easily absorbed in the upper gut, but xylose and
arabinose are absorbed at a slower rate compared to glucose ( Agyekum et al., 2018; Huntley
and Patience, 2018). Not only that, glucose has greater efficiency in contributing energy to
pigs, but this may not be the case for pentose sugars such as xylose and arabinose. It has been
suggested that these pentosan sugars are poorly metabolized in the pig and have less
efficiency in contributing energy to pigs when absorbed in the upper gut ( Agyekum et al.,
2018; Huntley and Patience, 2018). Therefore, measuring xylose and arabinose may be a good
indicator for determining the degree of fiber hydrolysis by added enzymes but may not be a
good parameter in predicting what will happen in pigs (e.g. growth performance).
155
The used FDE was a mix of xylanase, β-glucanase and cellulase. However, in DDGS
and WM, the β-glucan contents are low, and in general, β-glucanases are applied to
ingredients that have high soluble β-glucan such as barley and oats to reduced the viscosity
(Kong and Adeola, 2012). Therefore, the β-glucanase that was included in FDE may have
been inappropriate in DDGS and WM. The FDE used in Chapters 3 and 4 had the same
enzyme profile of 62,000 U/g of xylanase, 8,000 U/g of β-glucanase and 37,000 U/g.
However, the FDE used in the in vivo study was xylanase 42,858 U/g of xylanase, 12,830 U/g
of β-glucanase and 47,830 U/g of cellulose, which was lower in xylanase and higher β-
glucanase and cellulase. Therefore, the effect of applying FDE used in Chapters 3 and 4 to the
animal is still unknown. However, it can be speculated that as DDGS and WM have more
arabinoxylans compared to β-glucans, the FDE used in Chapters 3 and 4 may be able to bring
a better response than the FDE used in Chapter 5.
The Van Soest (1963) detergent method was used to measure NDF and ADF for the
studies. The reasons for using this method were: 1) the detergent method is easy to perform
compared to other fiber analyses methods, 2) fiber components in plant cell walls (cellulose,
hemicellulose and lignin) can be determined, and 3) fiber in DDGS and WM are mostly
insoluble and detergent fiber measures insoluble NDF and ADF.
Analyzing fiber with the detergent method seems logical as soluble fiber content
ranges from none to 1.6 % in DDGS (Urriola et al., 2010) and 1.10 to 3.90 % in WM (Casas et
al., 2018), and as soluble fibers are more easily digested than insoluble fibers, the majority of
fiber components in the digesta sample can be expected to be insoluble. However, variation
among WM exists, as WM is a mix of brans and shorts and other parts of wheat. Therefore,
the soluble fiber may have been underestimated with the detergent method.
156
Overall, the results of the studies showed that FDE (xylanase, β-glucanase and
cellulase) was effective in hydrolyzing fiber components compared to 1) protease alone or in
combination with FDE in raw materials, 2) xylanase with higher activity level in digesta
samples, and 3) without FDE in diets made with corn-DDGS or wheat- WM. However, the
compositional and structural difference between DDGS and WM affected the FDE efficacy.
Furthermore, the parameters used to determine the enzyme effects (NDF, ADF, OA,
monosaccharides, xylanase activity) in vitro were indicative of fiber hydrolysis.
6.1 Future studies
The present study demonstrated that fiber degrading enzyme (FDE) was able to improve
fiber hydrolysis and increase monosaccharide availability in DDGS and WM resulting in
improved, fermentability, digestibility and performance when applied to pig feed. However,
there are still unanswered questions. Therefore, further studies are required, as outlined below:
1. In the present thesis, the FDE was a mix of xylanase, β-glucanase and cellulase applied
to DDGS and WM. As these co-products are low in β-glucan, it should be tested whether
enzyme mix without β-glucanase can also provide positive effects when applied to DDGS
and WM.
2. This thesis lacks the information of the effect of enzyme inclusion level, as added doses
of FDE were based on suppliers’ internal evaluations. Although FDE is a mix of enzymes,
adding 3 times more of single xylanase alone did not improve arabinose or xylose
concentration compared with FDE. This was unlikely as other studies saw greater
improvement with the increasing level of added enzymes. Therefore, further research is
157
needed to determine the optimum inclusion levels of each enzyme alone or in combination
with other FDE.
3. The xylanase activity results showed greater xylanase activity in FDE included treatments
in digesta collected from pigs GIT, however, from the current study, it was not possible
to determine whether the xylanase activity was purely from the added FDE or xylanase
produced from microbes . Therefore, the effect of enzyme production from microbes
when FDE is applied should be determined.
4. The fiber disappearance and digestibility were measured with the detergent fiber method,
which only captures insoluble NDF and ADF. Therefore, in order to determine whether it
is appropriate to use this method, other fiber analysis methods should be tested.
5. Research is needed to determine whether measuring these parameters (NDF, ADF,
monosaccharides, OA) in vitro can predict the enzyme effect in animals.
6. Steeping DDGS and WM for 12- 24 h with FDE resulted in greater monosaccharide
availability. Therefore, the tested in vitro method (Chapter 3) should be tested in a liquid
feeding system to determine the effects on pigs.
158
7 References
Abelilla, J. J., and H. H. Stein. 2019. Degradation of dietary fiber in the stomach, small
intestine, and large intestine of growing pigs fed corn- or wheat-based diets without or
with microbial xylanase. Journal of animal science 97(1):338-352. doi:
10.1093/jas/sky403
Adeola, O., and A. J. Cowieson. 2011. BOARD-INVITED REVIEW: Opportunities and
challenges in using exogenous enzymes to improve nonruminant animal production.
Journal of Animal Science 89(10):3189-3218. doi: 10.2527/jas.2010-3715
Agyekum, A., J. Sands, A. Regassa, E. Kiarie, D. Weihrauch, W. Kim, and C. M. Nyachoti.
2015. Effect of supplementing a fibrous diet with a xylanase and beta- glucanase blend
on growth performance, intestinal glucose uptake, and transport- associated gene
expression in growing pigs. Journal Of Animal Science 93(7):3483-3493. doi:
10.2527/jas.2015-9027
Agyekum, A. K., and C. M. Nyachoti. 2017. Nutritional and metabolic consequences of
feeding high-fiber diets to swine: a review. Engineering 3(5):716-725.
Agyekum, A. K., A. Regassa, E. Kiarie, and C. M. Nyachoti. 2016. Nutrient digestibility,
digesta volatile fatty acids, and intestinal bacterial profile in growing pigs fed a
distillers dried grains with solubles containing diet supplemented with a multi-enzyme
cocktail. Animal Feed Science and Technology 212:70-80. doi:
10.1016/j.anifeedsci.2015.12.006
Agyekum, A.K., Walsh, M.C., Kiarie, E., Sands, J.S., and Nyachoti, C.M. (2018). Dietary D-
xylose effects on growth performance, portal nutrient fluxes, and energy expenditure
in growing pigs. J Anim Sci 96, 2310-2319.
Agyekum, A. K., B. A. Slominski, and C. M. Nyachoti. 2012. Organ weight, intestinal
morphology, and fasting whole-body oxygen consumption in growing pigs fed diets
containing distillers dried grains with solubles alone or in combination with a
multienzyme supplement12. Journal of Animal Science 90(9):3032-3040. doi:
10.2527/jas.2011-4380
Agyekum, A. K., T. A. Woyengo, B. A. Slominski, Y. L. Yin, and C. M. Nyachoti. 2014.
Effects of formulating growing pig diet with increasing levels of wheat-corn distillers
dried grains with solubles on digestible nutrient basis on growth performance and
nutrient digestibility. Journal of Animal Physiology and Animal Nutrition 98(4):651-
658. doi: 10.1111/jpn.12112
Alfonzo, A., G. Ventimiglia, O. Corona, R. Di Gerlando, R. Gaglio, N. Francesca, G.
Moschetti, and L. Settanni. 2013. Diversity and technological potential of lactic acid
bacteria of wheat flours. Food Microbiology 36(2):343-354. doi:
doi.org/10.1016/j.fm.2013.07.003
Anguita, M., J. Gasa, M. Nofrarias, S. M. Martín-Orúe, and J. F. Pérez. 2007. Effect of coarse
ground corn, sugar beet pulp and wheat bran on the voluntary intake and
physicochemical characteristics of digesta of growing pigs. Livestock Science
107(2):182-191. doi: doi.org/10.1016/j.livsci.2006.09.016
159
AOAC. 2004. Official methods of analysis AOAC offical methods. Gaithersburg, Md. :
AOAC International., Gaithersburg, Md.
Asmus, M., J. M. DeRouchey, M. D. Tokach, R. D. Goodband, J. L. Nelssen, and S. S. Dritz.
2012. Effects of Xylanase in high-co-product diets on nutrient digestibility in finishing
pigs. Kansas Agricultural Experiment Station Research Reports (10):335-342. doi:
doi.org/10.4148/2378-5977.7089
Aumiller, T., R. Mosenthin, and E. Weiss. 2015. Potential of cereal grains and grain legumes
in modulating pigs׳ intestinal microbiota – A review. Livestock Science 172:16-32.
doi: doi.org/10.1016/j.livsci.2014.11.016
Avelar, E., R. Jha, E. Beltranena, M. Cervantes, A. Morales, and R. T. Zijlstra. 2010. The
effect of feeding wheat distillers dried grain with solubles on growth performance and
nutrient digestibility in weaned pigs. Animal Feed Science and Technology 160(1):73-
77. doi: doi.org/10.1016/j.anifeedsci.2010.06.009
Bach Knudsen, K. 2011. Triennial growth symposium: Effects of polymeric carbohydrates on
growth and development in pigs. J. Anim. Sci. 89(7):1965-1980. doi:
10.2527/jas.2010-3602
Bach Knudsen, K. E. 1997. Carbohydrate and lignin contents of plant materials used in animal
feeding. Animal Feed Science and Technology 67(4):319-338. doi:
doi.org/10.1016/S0377-8401(97)00009-6
Bach Knudsen, K. E. 2014. Fiber and nonstarch polysaccharide content and variation in
common crops used in broiler diets 1. Poult. Sci. 93(9):2380-2393. doi:
doi.org/10.3382/ps.2014-03902
Bach Knudsen, K. E., M. S. Hedemann, and H. N. Lærke. 2012. The role of carbohydrates in
intestinal health of pigs. Animal Feed Science and Technology 173(1-2):41-53.
Bach Knudsen, K. E., Lærke, H.N, Jørgensen, H 2008. The Role of Fibre in Nutrient
Utilization and Animal Health. In: The 29th Western Nutrition Conference, Edmonton,
Alberta. p 93-107.
Bach Knudsen, K. E., N. P. Nørskov, A. K. Bolvig, M. S. Hedemann, and H. N. Laerke. 2017.
Dietary fibers and associated phytochemicals in cereals. Molecular nutrition & food
research 61(7):1600518.
Bader Ul Ain, H., F. Saeed, N. Ahmad, A. Imran, B. Niaz, M. Afzaal, M. Imran, T. Tufail,
and A. Javed. 2018. Functional and health-endorsing properties of wheat and barley
cell wall’s non-starch polysaccharides. Int. J. Food Prop. 21(1):1463-1480. doi:
10.1080/10942912.2018.1489837
Bao, Y. M., L. F. Romero, and A. J. Cowieson. 2013. Functional patterns of exogenous
enzymes in different feed ingredients. World's Poultry Science Journal 69(4):759-774.
doi: 10.1017/S0043933913000792
Barnes, J., J. M. DeRouchey, M. D. Tokach, R. D. Goodband, J. L. Nelssen, and S. S. Dritz.
2011. Effects of xylanase in growing-finishing diets varying in dietary energy and
fiber on growth performance, carcass characteristics, and nutrient digestibility.
Barrera, M., M. Cervantes, W. Sauer, A. Araiza, N. Torrentera, and M. Cervantes. 2004. Ileal
amino acid digestibility and performance of growing pigs fed wheat-based diets
supplemented with xylanase. Journal of Animal Science 82(7):1997-2003.
Bedford, M. R. 2018. The evolution and application of enzymes in the animal feed industry:
the role of data interpretation. British Poultry Science 59(5):486-493. doi:
10.1080/00071668.2018.1484074
160
Bedford, M. R., and H. Schulze. 1998. Exogenous enzymes for pigs and poultry. Nutrition
Research Reviews 11(1):91-114. doi: 10.1079/NRR19980007
Belenguer, A., S. H. Duncan, A. G. Calder, G. Holtrop, P. Louis, G. E. Lobley, and H. J. Flint.
2006. Two Routes of Metabolic Cross-Feeding between <em>Bifidobacterium
adolescentis</em> and Butyrate-Producing Anaerobes from the Human Gut. Applied
and Environmental Microbiology 72(5):3593-3599. doi: 10.1128/aem.72.5.3593-
3599.2006
Belyea, R. L., K. D. Rausch, and M. E. Tumbleson. 2004. Composition of corn and distillers
dried grains with solubles from dry grind ethanol processing. Bioresource Technology
94(3):293-298. doi: 10.1016/j.biortech.2004.01.001
Berglund, J., T. Angles d'Ortoli, F. Vilaplana, G. Widmalm, M. Bergenstråhle‐Wohlert, M.
Lawoko, G. Henriksson, M. Lindström, and J. Wohlert. 2016. A molecular dynamics
study of the effect of glycosidic linkage type in the hemicellulose backbone on the
molecular chain flexibility. Plant. J. 88(1):56-70.
Bhardwaj, N., B. Kumar, and P. Verma. 2019. A detailed overview of xylanases: an emerging
biomolecule for current and future prospective. Bioresources and Bioprocessing
6(1):40. doi: 10.1186/s40643-019-0276-2
Bindelle, J., R. Pieper, C. A. Montoya, A. G. Van Kessel, and P. Leterme. 2011. Nonstarch
polysaccharide-degrading enzymes alter the microbial community and the
fermentation patterns of barley cultivars and wheat products in an in vitro model of the
porcine gastrointestinal tract. FEMS Microbiol Ecol 76(3):553-563. doi:
10.1111/j.1574-6941.2011.01074.x
Blackwood, A. D., J. Salter, P. W. Dettmar, and M. F. Chaplin. 2000. Dietary fibre,
physicochemical properties and their relationship to health. Journal of the Royal
Society for the Promotion of Health 120(4):242-247. doi:
10.1177/146642400012000412
Blandino, A., M. E. Al-Aseeri, S. S. Pandiella, D. Cantero, and C. Webb. 2003. Cereal-based
fermented foods and beverages. Food Research International 36(6):527-543. doi:
doi.org/10.1016/S0963-9969(03)00009-7
Boisen, S., and J. A. Fernández. 1997. Prediction of the total tract digestibility of energy in
feedstuffs and pig diets by in vitro analyses. Animal Feed Science and Technology
68(3):277-286. doi: doi.org/10.1016/S0377-8401(97)00058-8
Braude, R., R. J. Fulford, and A. G. Low. 1976. Studies on digestion and absorption in the
intestines of growing pigs. Measurements of the flow of digesta and pH. The British
journal of nutrition 36(3):497-510 plate I. doi: 10.1079/bjn19760104
Braude, R., and J. Rowell. 1967. Comparison of dry and wet feeding of growing pigs. The
Journal of Agricultural Science 68(3):325-330.
Brestenský, M., S. Nitrayová, A. Bomba, P. Patráš, L. Strojný, V. Szabadošová, B.
Pramuková, and I. Bertková. 2017. The content of short chain fatty acids in the jejunal
digesta, caecal digesta and faeces of growing pigs. Livestock Science 205:106-110.
doi: doi.org/10.1016/j.livsci.2017.09.015
Brooks, P., J. Beal, and S. Niven. 2001a. Liquid feeding of pigs: potential for reducing
environmental impact and for improving productivity and food safety. Recent
advances in animal nutrition in Australia 13:49-63.
161
Brooks, P., J. Beal, S. Niven, and V. Demeckova. 2003. Liquid feeding of pigs 2. Potential for
improving pig health and food safety. In: The IV Conference on effect of genetic and
non-genetic factors on carcass and meat quality of pigs
Brooks, P., C. Moran, J. Beal, V. Demeckova, and A. Campbell. 2001b. Liquid feeding for the
young piglet In: MA Varley AND J. Wiseman, editors, The weaner pig: nutrition and
management. CABI Publishing, Wallingford.
Brooks, S. P. J., J. Green-Johnson, G. D. Inglis, R. R. E. Uwiera, and M. Kalmokoff. 2011.
4.48 - Gut Microbiology – A Relatively Unexplored Domain. In: M. Moo-Young,
editor, Comprehensive Biotechnology (Second Edition). Academic Press, Burlington.
p. 575-590.
Buanafina, M. 2009. Feruloylation in Grasses: Current and Future Perspectives. Mol. Plant.
2:861-872. doi: 10.1093/mp/ssp067
Cabrera, M., P. Bramel-Cox, R. H. Hines, J. D. Hancock, and K. C. Behnke. 1993. Sorghum
genotype and particle size affect growth performance, nutrient digestibility, and
stomach morphology in finishing pigs. Kansas Agricultural Experiment Station
Research Reports (10):134-139.
Cadogan, D. J., and M. Choct. 2015. Pattern of non-starch polysaccharide digestion along the
gut of the pig: contribution to available energy. Animal Nutrition 1(3):160-165.
Calicioglu, O., A. Flammini, S. Bracco, L. Bellù, and R. Sims. 2019. The future challenges of
food and agriculture: An integrated analysis of trends and solutions. Sustainability
11(1):222.
Campbell, G., and M. Bedford. 1992. Enzyme applications for monogastric feeds: A review.
Canadian journal of animal science 72(3):449-466.
Canibe, N., and B. B. Jensen. 2003. Fermented and nonfermented liquid feed to growing pigs:
effect on aspects of gastrointestinal ecology and growth performance. J. Anim. Sci.
81(8):2019-2031.
Canibe, N., and B. B. Jensen. 2012. Fermented liquid feed—Microbial and nutritional aspects
and impact on enteric diseases in pigs. Anim. Feed Sci. Technol. 173(1):17-40. doi:
10.1016/j.anifeedsci.2011.12.021
Carneiro, M. S. C., M. M. Lordelo, L. F. Cunha, and J. P. B. Freire. 2008. Effects of dietary
fibre source and enzyme supplementation on faecal apparent digestibility, short chain
fatty acid production and activity of bacterial enzymes in the gut of piglets. Animal
Feed Science and Technology 146(1):124-136. doi:
doi.org/10.1016/j.anifeedsci.2007.12.001
Casas, G. A., D. A. Rodriguez, and H. H. Stein. 2018. Nutrient composition and digestibility
of energy and nutrients in wheat middlings and red dog fed to growing pigs1. J. Anim.
Sci. 96(1):215-224. doi: 10.1093/jas/skx010
Champ, M., A.-M. Langkilde, F. Brouns, B. Kettlitz, and Y. L. B. Collet. 2003. Advances in
dietary fibre characterisation. 1. Definition of dietary fibre, physiological relevance,
health benefits and analytical aspects. Nutrition research reviews 16(1):71-82. doi:
10.1079/NRR200254
Chen, H., S. Zhang, and S. W. Kim. 2020. Effects of supplemental xylanase on health of the
small intestine in nursery pigs fed diets with corn distillers’ dried grains with solubles.
Journal of Animal Science 98(6)doi: 10.1093/jas/skaa185
162
Chen, Q., M. Li, and X. Wang. 2016. Enzymology properties of two different xylanases and
their impacts on growth performance and intestinal microflora of weaned piglets.
Animal Nutrition 2(1):18-23. doi: doi.org/10.1016/j.aninu.2016.02.003
Choct, M. 1997. Feed non-starch polysaccharides: chemical structures and nutritional
significance. Feed milling international 191(June issue):13-26.
Choct, M., R. J. Hughes, J. Wang, M. R. Bedford, A. J. Morgan, and G. Annison. 1996.
Increased small intestinal fermentation is partly responsible for the anti-nutritive
activity of non-starch polysaccharides in chickens. British Poultry Science 37(3):609-
621. doi: Doi 10.1080/00071669608417891
Choct, M., E. Selby, D. Cadogan, and R. Campbell. 2004. Effect of liquid to feed ratio,
steeping time, and enzyme supplementation on the performance of weaner pigs.
Australian Journal of Agricultural Research 55(2):247-252.
Cipriani, T. R., C. G. Mellinger, M. L. C. Bertolini, C. H. Baggio, C. S. Freitas, M. C. A.
Marques, P. A. J. Gorin, G. L. Sassaki, and M. Iacomini. 2009. Gastroprotective effect
of a type I arabinogalactan from soybean meal. Food Chem. 115(2):687-690. doi:
10.1016/j.foodchem.2008.12.017
Clark, M., and D. Tilman. 2017. Comparative analysis of environmental impacts of
agricultural production systems, agricultural input efficiency, and food choice.
Environmental Research Letters 12(6):064016.
Coles, L. T., P. J. Moughan, and A. J. Darragh. 2005. In vitro digestion and fermentation
methods, including gas production techniques, as applied to nutritive evaluation of
foods in the hindgut of humans and other simple-stomached animals. Animal Feed
Science and Technology 123-124:421-444. doi:
doi.org/10.1016/j.anifeedsci.2005.04.021
Colombo, M., N. P. A. Castilho, S. D. Todorov, and L. A. Nero. 2018. Beneficial properties of
lactic acid bacteria naturally present in dairy production. BMC Microbiology
18(1):219. doi: 10.1186/s12866-018-1356-8
Cromwell, G. L., T. R. Cline, J. D. Crenshaw, T. D. Crenshaw, R. A. Easter, R. C. Ewan, C.
R. Hamilton, G. M. Hill, A. J. Lewis, D. C. Mahan, J. L. Nelssen, J. E. Pettigrew, T. L.
Veum, and J. T. Yen. 2000. Variability among sources and laboratories in analyses of
wheat middlings. J. Anim. Sci. 78(10):2652-2658. doi: 10.2527/2000.78102652x
Cui, S. W., S. Nie, and K. T. Roberts. 2011. 4.42 - Functional Properties of Dietary Fiber. In:
M. Moo-Young, editor, Comprehensive Biotechnology (Second Edition). Academic
Press, Burlington. p. 517-525.
De Jong, J. A., J. M. DeRouchey, M. D. Tokach, S. S. Dritz, and R. D. Goodband. 2014.
Effects of dietary wheat middlings, corn dried distillers grains with solubles, and net
energy formulation on nursery pig performance1. Journal of Animal Science
92(8):3471-3481. doi: 10.2527/jas.2013-7350
de Lange, C., J. Pluske, J. Gong, and C. Nyachoti. 2010. Strategic use of feed ingredients and
feed additives to stimulate gut health and development in young pigs. Livestock
Science 134(1-3):124-134.
de Lange, C. F. M. 2000. Characterisation of the non-starch polysaccharides. In: P. J.
Moughan, Verstegan, M. W. A, Visser-Reyneveld, M. A., editor, Feed evaluation:
principles and practice. Wageningen Pers, Wageningen, Netherlands. p. 77-92.
de Lange, C. F. M., V. M. Gabert, D. Gillis, and J. F. Patience. 1998. Digestible energy
contents and apparent ileal amino acid digestibilities in regular or partial mechanically
163
dehulled canola meal samples fed to growing pigs. Canadian Journal of Animal
Science 78(4):641-648. doi: 10.4141/A97-114
de Vries, S., A. M. Pustjens, M. A. Kabel, S. Salazar-Villanea, W. H. Hendriks, and W. J. J.
Gerrits. 2013. Processing Technologies and Cell Wall Degrading Enzymes To
Improve Nutritional Value of Dried Distillers Grain with Solubles for Animal Feed: an
in Vitro Digestion Study. J. Agric. Food Chem. 61(37):8821-8828. doi:
10.1021/jf4019855
Dhingra, D., M. Michael, H. Rajput, and R. T. Patil. 2012. Dietary fibre in foods: a review. J
Food Sci Technol 49(3):255-266. doi: 10.1007/s13197-011-0365-5
Dobberstein, D., and M. Bunzel. 2010. Separation and Detection of Cell Wall-Bound Ferulic
Acid Dehydrodimers and Dehydrotrimers in Cereals and Other Plant Materials by
Reversed Phase High-Performance Liquid Chromatography With Ultraviolet
Detection. Journal of Agricultural and Food Chemistry 58(16):8927-8935. doi:
10.1021/jf101514j
Dong, M., S. Wang, G. Xiao, F. Xu, W. Hu, Q. Li, J. Chen, and W. Li. 2019. Cellulase
production by Aspergillus fumigatus MS13.1 mutant generated by heavy ion
mutagenesis and its efficient saccharification of pretreated sweet sorghum straw.
Process Biochemistry 84:22-29. doi: doi.org/10.1016/j.procbio.2019.06.006
Dornez, E., K. Gebruers, J. A. Delcour, and C. M. Courtin. 2009. Grain-associated xylanases:
occurrence, variability, and implications for cereal processing. Trends in Food Science
& Technology 20(11):495-510. doi: doi.org/10.1016/j.tifs.2009.05.004
Dornez, E., I. J. Joye, K. Gebruers, J. A. Delcour, and C. M. Courtin. 2006. Wheat-kernel-
associated endoxylanases consist of a majority of microbial and a minority of wheat
endogenous endoxylanases. Journal of Agricultural and Food Chemistry 54(11):4028-
4034.
Drochner, W., A. Kerler, and B. Zacharias. 2004. Pectin in pig nutrition, a comparative
review. J Anim Physiol Anim Nutr (Berl) 88(11-12):367-380. doi: 10.1111/j.1439-
0396.2004.00490.x
Duarte, M. E., F. X. Zhou, W. M. Dutra Jr, and S. W. Kim. 2019. Dietary supplementation of
xylanase and protease on growth performance, digesta viscosity, nutrient digestibility,
immune and oxidative stress status, and gut health of newly weaned pigs. Animal
Nutrition 5(4):351-358.
Dujardin, M., A. Elain, T. Lendormi, M. Le Fellic, Y. Le Treut, and O. Sire. 2014. Keeping
under control a liquid feed fermentation process for pigs: A reality scale pilot based
study. Anim. Feed Sci. Technol. 194:81-88. doi: 10.1016/j.anifeedsci.2014.04.017
Elliott, G., W. McLauchlan, G. Williamson, and P. Kroon. 2003a. A wheat xylanase inhibitor
protein (XIP-I) accumulates in the grain and has homologues in other cereals. Journal
of Cereal Science 37(2):187-194.
Elliott, G. O., W. R. McLauchlan, G. Williamson, and P. A. Kroon. 2003b. A Wheat Xylanase
Inhibitor Protein (XIP-I) Accumulates in the Grain and has Homologues in Other
Cereals. Journal of Cereal Science 37(2):187-194. doi:
https://doi.org/10.1006/jcrs.2002.0493
Emiola, I., F. Opapeju, B. Slominski, and C. Nyachoti. 2009a. Growth performance and
nutrient digestibility in pigs fed wheat distillers dried grains with solubles-based diets
supplemented with a multicarbohydrase enzyme. Journal of Animal Science
87(7):2315-2322.
164
Emiola, I. A., F. O. Opapeju, B. A. Slominski, and C. M. Nyachoti. 2009b. Growth
performance and nutrient digestibility in pigs fed wheat distillers dried grains with
solubles-based diets supplemented with a multicarbohydrase enzyme1. Journal of
Animal Science 87(7):2315-2322. doi: 10.2527/jas.2008-1195
Englyst, H. N., V. Anderson, and J. H. Cummings. 1983. Starch and non‐starch
polysaccharides in some cereal foods. Journal of the Science of Food and Agriculture
34(12):1434-1440.
Erickson, J., E. Miller, P. Ku, G. Collings, and J. Black. 1985a. Wheat Middlings as a Source
of Energy, Amino Acids, Phosphorus and Pellet Binding Quality for Swine Diets 1, 2.
J. Anim. Sci. 60(4):1012-1020.
Erickson, J. P., E. R. Miller, P. K. Ku, G. F. Collings, and J. R. Black. 1985b. Wheat
Middlings as a Source of Energy, Amino Acids, Phosphorus and Pellet Binding
Quality for Swine Diets. J. Anim. Sci. 60(4):1012-1020. doi:
10.2527/jas1985.6041012x
Feng, G., B. M. Flanagan, D. Mikkelsen, B. A. Williams, W. Yu, R. G. Gilbert, and M. J.
Gidley. 2018a. Mechanisms of utilisation of arabinoxylans by a porcine faecal
inoculum: competition and co-operation. Scientific Reports 8(1):4546. doi:
10.1038/s41598-018-22818-4
Feng, W., H. Ao, and C. Peng. 2018b. Gut microbiota, short-chain fatty acids, and herbal
medicines. Frontiers in pharmacology 9:1354.
Feoli, C., C. Monge, C. Jones, C. Starkey, and J. D. Hancock. 2006. Effects of xylanase and
wheat middlings in diets for finishing pigs. J. Anim. Sci. 84:429-430.
Fernández, J., S. Redondo-Blanco, I. Gutiérrez-del-Río, E. M. Miguélez, C. J. Villar, and F.
Lombó. 2016. Colon microbiota fermentation of dietary prebiotics towards short-chain
fatty acids and their roles as anti-inflammatory and antitumour agents: A review.
Journal of Functional Foods 25:511-522. doi: doi.org/10.1016/j.jff.2016.06.032
Fierens, E., S. Rombouts, K. Gebruers, H. Goesaert, K. Brijs, J. Beaugrand, G. Volckaert, S.
Van Campenhout, P. Proost, C. M. Courtin, and J. A. Delcour. 2007. TLXI, a novel
type of xylanase inhibitor from wheat (Triticum aestivum) belonging to the thaumatin
family. Biochem J 403(3):583-591. doi: 10.1042/BJ20061291
Flint, H. J., S. H. Duncan, K. P. Scott, and P. Louis. 2015. Links between diet, gut microbiota
composition and gut metabolism. The Proceedings of the Nutrition Society 74(1):13-
22. doi: 10.1017/s0029665114001463
Freire, J., A. Guerreiro, L. Cunha, and A. Aumaitre. 2000. Effect of dietary fibre source on
total tract digestibility, caecum volatile fatty acids and digestive transit time in the
weaned piglet. Animal Feed Science and Technology 87(1-2):71-83.
Gerritsen, R., P. van Der Aar, and F. Molist. 2012. Insoluble nonstarch polysaccharides in
diets for weaned piglets. Journal of animal science 90(suppl_4):318-320.
Goesaert, H., G. Elliott, P. A. Kroon, K. Gebruers, C. M. Courtin, J. Robben, J. A. Delcour,
and N. Juge. 2004. Occurrence of proteinaceous endoxylanase inhibitors in cereals.
Biochimica et Biophysica Acta (BBA) - Proteins and Proteomics 1696(2):193-202.
doi: doi.org/10.1016/j.bbapap.2003.08.015
Grabber, J. H. 2005. How do lignin composition, structure, and cross‐linking affect
degradability? A review of cell wall model studies. Crop Science 45(3):820-831.
165
Graham, H., W. Löwgren, and P. Åman. 1989. An in vitro method for studying digestion in
the pig: 2. Comparison with in vivo ileal and faecal digestibilities. British Journal of
Nutrition 61(3):689-698. doi: 10.1079/BJN19890155
Greiner, L., C. Neill, G. L. Allee, X. Wang, J. Connor, K. Touchette, and J. L. Usry. 2015.
The feeding of dried distillers' grains with solubles to lactating sows. Journal of
Animal Science 93(12):5718-5724. doi: 10.2527/jas.2015-9545
Gusakov, A. 2010. Proteinaceous inhibitors of microbial xylanases. Biochemistry (Moscow)
75(10):1185-1199.
Hald, S., A. G. Schioldan, M. E. Moore, A. Dige, H. N. Lærke, J. Agnholt, K. E. Bach
Knudsen, K. Hermansen, M. L. Marco, S. Gregersen, and J. F. Dahlerup. 2016. Effects
of Arabinoxylan and Resistant Starch on Intestinal Microbiota and Short-Chain Fatty
Acids in Subjects with Metabolic Syndrome: A Randomised Crossover Study. PLOS
ONE 11(7):e0159223. doi: 10.1371/journal.pone.0159223
Hancock, J., and K. Behnke. 2001. Use of ingredient and diet processing technologies
(grinding, mixing, pelleting, and extruding) to produce quality feeds for pigs.
Harris, A. D., and C. Ramalingam. 2010. Xylanases and its application in food industry: a
review. Journal of Experimental Sciences
Hasjim, J., G. C. Lavau, M. J. Gidley, and R. G. Gilbert. 2010. In vivo and in vitro starch
digestion: are current in vitro techniques adequate? Biomacromolecules 11(12):3600-
3608.
Hastad, C., J. Nelssen, R. Goodband, M. Tokach, S. Dritz, J. DeRouchey, and N. Frantz. 2005.
Effect of dried distillers grains with solubles on feed preference in growing pigs. J.
Anim. Sci 83(Suppl 2):73.
Högberg, A., and J. E. Lindberg. 2006. The effect of level and type of cereal non-starch
polysaccharides on the performance, nutrient utilization and gut environment of pigs
around weaning. Animal Feed Science and Technology 127(3-4):200-219.
Hooda, S., B. U. Metzler-Zebeli, T. Vasanthan, and R. T. Zijlstra. 2011. Effects of viscosity
and fermentability of dietary fibre on nutrient digestibility and digesta characteristics
in ileal-cannulated grower pigs. British Journal of Nutrition 106(5):664-674.
Horn, S. J., G. Vaaje-Kolstad, B. Westereng, and V. Eijsink. 2012. Novel enzymes for the
degradation of cellulose. Biotechnology for Biofuels 5(1):45. doi: 10.1186/1754-6834-
5-45
Hoseney, R. C. 1994. Principles of cereal science and technology. American Association of
Cereal Chemists (AACC).
Hu, C., K. Xiao, Z. Luan, and J. Song. 2013. Early weaning increases intestinal permeability,
alters expression of cytokine and tight junction proteins, and activates mitogen-
activated protein kinases in pigs. Journal of Animal Science 91(3):1094-1101.
Huang, Q., C. Shi, Y. Su, Z. Liu, D. Li, L. Liu, C. Huang, X. Piao, and C. Lai. 2014.
Prediction of the digestible and metabolizable energy content of wheat milling by-
products for growing pigs from chemical composition. Animal Feed Science and
Technology 196:107-116.
Huang, Z., P. E. Urriola, I. J. Salfer, M. D. Stern, and G. C. Shurson. 2017. Differences in in
vitro hydrolysis and fermentation among and within high-fiber ingredients using a
modified three-step procedure in growing pigs. J. Anim. Sci. 95(12):5497-5506. doi:
10.2527/jas2017.1907
166
Huntley, N. F., and J. F. Patience. 2018. Xylose: absorption, fermentation, and post-absorptive
metabolism in the pig. Journal of Animal Science and Biotechnology 9(1):4. doi:
10.1186/s40104-017-0226-9
Hurst, D., L. Clarke, and I. Lean. 2008. Effect of liquid feeding at different water-to-feed
ratios on the growth performance of growing-finishing pigs. Animal 2(9):1297-1302.
doi: 10.1017/S175173110800253X
Inborr, J., J. Puhakka, J. G. M. Bakker, and J. van der Meulen. 1999. β‐glucanase and
xylanase activities in stomach and ileum of growing pigs fed wheat bran based diets
with and without enzyme treatment. Archiv für Tierernaehrung 52(3):263-274. doi:
10.1080/17450399909386166
Isil, S., and A. Nilufer. 2005. Investigation of factors affecting xylanase activity from
Trichoderma harzianum 1073 D3. Brazilian Archives of Biology and Technology
48:187-193.
Izydorczyk, M. S., and C. G. Biliaderis. 1995. Cereal arabinoxylans: advances in structure and
physicochemical properties. Carbohydr. Polym. 28(1):33-48.
Jacela, J., S. Dritz, J. DeRouchey, M. Tokach, R. Goodband, and J. Nelssen. 2010. Effects of
Supplemental Enzymes in Diets Containing Distillers Dried Grains with Solubles on
Finishing Pig Growth Performance1. The Professional Animal Scientist 26(4):412-
424. doi: 10.15232/S1080-7446(15)30623-9
Jaworski, N. W., and H. H. Stein. 2017. Disappearance of nutrients and energy in the stomach
and small intestine, cecum, and colon of pigs fed corn-soybean meal diets containing
distillers dried grains with solubles, wheat middlings, or soybean hulls1. Journal of
Animal Science 95(2):727-739. doi: 10.2527/jas.2016.0752
Jaworski, N. W., H. H. Stein, H. N. Lærke, and K. E. Bach Knudsen. 2015. Carbohydrate
composition and in vitro digestibility of dry matter and nonstarch polysaccharides in
corn, sorghum, and wheat and coproducts from these grains1. J. Anim. Sci.
93(3):1103-1113. doi: 10.2527/jas.2014-8147
Jerez-Bogota, K., C. Sánchez, J. Ibagon, M. Jlali, P. Cozannet, A. Preynat, and T. A.
Woyengo. 2020. Growth performance and nutrient digestibility of growing and
finishing pigs fed multienzyme-supplemented low-energy and -amino acid diets.
Translational Animal Science 4(2):602-615. doi: 10.1093/tas/txaa040
Jha, R., and J. Berrocoso. 2015. Dietary fiber utilization and its effects on physiological
functions and gut health of swine. Animal 9(9):1441-1452. doi:
10.1017/S1751731115000919
Jha, R., T. Woyengo, J. Li, M. Bedford, T. Vasanthan, and R. Zijlstra. 2015. Enzymes
enhance degradation of the fiber–starch–protein matrix of distillers dried grains with
solubles as revealed by a porcine in vitro fermentation model and microscopy. J.
Anim. Sci. 93(3):1039-1051.
Jha, R., and R. T. Zijlstra. 2019. Physico-chemical properties of purified starch affect their in
vitro fermentation characteristics and are linked to in vivo fermentation characteristics
in pigs. Animal Feed Science and Technology 253:74-80. doi:
doi.org/10.1016/j.anifeedsci.2019.05.006
Jones, C., J. Bergstrom, M. Tokach, J. DeRouchey, R. Goodband, J. Nelssen, and S. Dritz.
2010. Efficacy of commercial enzymes in diets containing various concentrations and
sources of dried distillers grains with solubles for nursery pigs. Journal of animal
science 88(6):2084-2091.
167
Jorgensen, H., T. Larsen, X. Q. Zhao, and B. O. Eggum. 1997. The energy value of short-
chain fatty acids infused into the caecum of pigs. Br J Nutr 77(5):745-756.
Jørgensen, H., A. Serena, M. S. Hedemann, and K. E. Bach Knudsen. 2007. The fermentative
capacity of growing pigs and adult sows fed diets with contrasting type and level of
dietary fibre. Livestock Science 109(1):111-114. doi:
doi.org/10.1016/j.livsci.2007.01.102
Just, A., J. A. Fernandez, and H. Jorgensen. 1983. The Net Energy Value of Diets for Growth
in Pigs in Relation to the Fermentative Processes in the Digestive-Tract and the Site of
Absorption of the Nutrients. Livest Prod Sci 10(2):171-186. doi: Doi 10.1016/0301-
6226(83)90033-7
Juturu, V., and J. C. Wu. 2014. Microbial cellulases: Engineering, production and
applications. Renewable and Sustainable Energy Reviews 33:188-203. doi:
doi.org/10.1016/j.rser.2014.01.077
Karppinen, S., K. Liukkonen, A. M. Aura, P. Forssell, and K. Poutanen. 2000. In vitro
fermentation of polysaccharides of rye, wheat and oat brans and inulin by human
faecal bacteria. Journal of the Science of Food and Agriculture 80(10):1469-1476.
Kerr, B., T. Weber, and G. Shurson. 2013. Evaluation of commercially available enzymes,
probiotics, or yeast on apparent total-tract nutrient digestion and growth in nursery and
finishing pigs fed diets containing corn dried distillers grains with solubles. The
Professional Animal Scientist 29(5):508-517.
Khetarpaul, N., and B. M. Chauhan. 1989. Effect of fermentation on protein, fat, minerals and
thiamine content of pearl millet. Plant Foods Human Nutr 39:169-178. doi:
10.1007/BF01091897
Kiarie, E., Y. Liu, M. C. Walsh, H. H. Stein, and L. Payling. 2016a. 245 Xylanase responses
on apparent ileal digestibility of nutrients, fiber and Energy in growing pigs fed corn,
30% corn co-products and soybean meal based diets as influenced by microbial
phytase and ccclimatization period. Journal of Animal Science 94(suppl_2):116-116.
doi: 10.2527/msasas2016-245
Kiarie, E., P. Lopez, C. Furedi, and C. M. Nyachoti. 2013a. Amino acids and energy
utilization in zero-tannin faba bean and co-fermented wheat and corn dried distillers
grains with solubles fed to growing pigs. J Anim Sci 91(4):1728-1735. doi:
10.2527/jas.2012-5485
Kiarie, E., and C. M. Nyachoti. 2009. Alternative feed ingredients in swine diets. In:
Saskatchewan Pork Industry Symposium Saskatoon. p 29-32.
Kiarie, E., C. M. Nyachoti, B. A. Slominski, and G. Blank. 2007. Growth performance,
gastrointestinal microbial activity, and nutrient digestibility in early-weaned pigs fed
diets containing flaxseed and carbohydrase enzyme. J Anim Sci 85(11):2982-2993.
doi: 10.2527/jas.2006-481
Kiarie, E., A. Owusu-Asiedu, A. Péron, P. H. Simmins, and C. M. Nyachoti. 2012. Efficacy of
xylanase and β-glucanase blend in mixed grains and grain co-products-based diets for
fattening pigs. Livestock Science 148(1):129-133. doi:
doi.org/10.1016/j.livsci.2012.05.020
Kiarie, E., L. F. Romero, and C. M. Nyachoti. 2013b. The role of added feed enzymes in
promoting gut health in swine and poultry. Nutrition Research Reviews 26(1):71-88.
doi: 10.1017/S0954422413000048
168
Kiarie, E., L. F. Romero, and V. Ravindran. 2014. Growth performance, nutrient utilization,
and digesta characteristics in broiler chickens fed corn or wheat diets without or with
supplemental xylanase. Poult Sci 93(5):1186-1196. doi: 10.3382/ps.2013-03715
Kiarie, E., M. C. Walsh, and C. M. Nyachoti. 2016b. Performance, digestive function, and
mucosal responses to selected feed additives for pigs. J Anim Sci
94(supplement3):169-180. doi: 10.2527/jas.2015-9835
Kiarie, E., M. C. Walsh, L. F. Romero, and S. K. Baidoo. 2016c. Digestibility responses of
growing pigs fed corn plus corn distiller grains or wheat plus wheat coproduct-based
diets without or with supplemental xylanase. Journal of Animal Science
94(suppl_3):211-214. doi: 10.2527/jas.2015-9736
Kiarie, E. G., and A. Mills. 2019. Role of Feed Processing on Gut Health and Function in Pigs
and Poultry: Conundrum of Optimal Particle Size and Hydrothermal Regimens.
Frontiers in Veterinary Science 6(19)(Review) doi: 10.3389/fvets.2019.00019
Kim, B., D. Kil, Y. Zhang, and H. Stein. 2012a. Concentrations of analyzed or reactive lysine,
but not crude protein, may predict the concentration of digestible lysine in distillers
dried grains with solubles fed to pigs. Journal of animal science 90(11):3798-3808.
Kim, J., C. F. Hansen, B. Mullan, and J. Pluske. 2012b. Nutrition and pathology of weaner
pigs: nutritional strategies to support barrier function in the gastrointestinal tract.
Animal feed science and technology 173(1-2):3-16.
Koh, A., F. De Vadder, P. Kovatcheva-Datchary, and F. Bäckhed. 2016. From dietary fiber to
host physiology: short-chain fatty acids as key bacterial metabolites. Cell 165(6):1332-
1345.
Kong, C., and O. Adeola. 2012. Supplementation of barley-based diets with β-glucanase for
pigs: Energy and amino acid digestibility response. Journal of Animal Science
90(suppl_4):74-76. doi: 10.2527/jas.50543
Kong, C., C. S. Park, and B. G. Kim. 2015. Effects of an enzyme complex on in vitro dry
matter digestibility of feed ingredients for pigs. Springerplus 4:261-261. doi:
10.1186/s40064-015-1060-1
Kornegay, E., and G. Vander Noot. 1968. Performance, digestibility of diet constituents and
N-retention of swine fed diets with added water. Journal of Animal Science
27(5):1307-1312.
Kosik, O., S. J. Powers, A. Chatzifragkou, P. C. Prabhakumari, D. Charalampopoulos, L.
Hess, J. Brosnan, P. R. Shewry, and A. Lovegrove. 2017. Changes in the arabinoxylan
fraction of wheat grain during alcohol production. Food chemistry 221:1754-1762.
doi: 10.1016/j.foodchem.2016.10.109
Kumar, V., A. K. Sinha, H. P. Makkar, G. De Boeck, and K. Becker. 2012. Dietary roles of
non-starch polysachharides in human nutrition: A review. Critical reviews in food
science and nutrition 52(10):899-935.
Lee, J. W., R. Patterson, A. Rogiewicz, and T. A. Woyengo. 2019. Nutrient digestibility of
multi-enzyme supplemented low-energy and AA diets for grower pigs1. Journal of
Animal Science 97(7):2979-2988. doi: 10.1093/jas/skz178
Len, N., T. Hong, B. Ogle, and J. Lindberg. 2009. Comparison of total tract digestibility,
development of visceral organs and digestive tract of Mong cai and Yorkshire×
Landrace piglets fed diets with different fibre sources. Journal of Animal Physiology
and Animal Nutrition 93(2):181-191.
169
Leung, H., A. Arrazola, S. Torrey, and E. Kiarie. 2018. Utilization of soy hulls, oat hulls, and
flax meal fiber in adult broiler breeder hens. Poult. Sci. 97(4):1368-1372.
Li, Q., and J. F. Patience. 2017. Factors involved in the regulation of feed and energy intake of
pigs. Animal Feed Science and Technology 233:22-33.
Li, W., J. Sun, and Z. Xu. 2004. Effects of NSP degrading enzyme on in vitro digestion of
barley. Asian-australasian journal of animal sciences 17(1):122-126.
Li, Y. 2000. Effect of a new multi-enzyme preparation on performance and nutrient
digestibility of early-weaned pigs, University of Manitoba Msc.
Lindberg, J. E. 2014. Fiber effects in nutrition and gut health in pigs. Journal of Animal
Science and Biotechnology 5(1):15.
Loy, D., and E. Lundy. 2019. Nutritional Properties and Feeding Value of Corn and Its
Coproducts, Corn. Elsevier. p. 633-659.
Lu, Z. X., K. Z. Walker, J. G. Muir, T. Mascara, and K. O'Dea. 2000. Arabinoxylan fiber, a
byproduct of wheat flour processing, reduces the postprandial glucose response in
normoglycemic subjects. Am. J. Clin. Nutr. 71(5):1123-1128. doi:
10.1093/ajcn/71.5.1123
Lyberg, K., H. Andersson, J. Sands, and J. Lindberg. 2008. Influence of phytase and xylanase
supplementation of a wheat-based diet on digestibility and performance in growing
pigs. Acta Agriculturae Scand Section A 58(3):146-151.
Lyberg, K., T. Lundh, C. Pedersen, and J. Lindberg. 2006. Influence of soaking, fermentation
and phytase supplementation on nutrient digestibility in pigs offered a grower diet
based on wheat and barley. J. Anim. Sci. 82(6):853-858.
Maron, D. F., T. J. S. Smith, and K. E. Nachman. 2013. Restrictions on antimicrobial use in
food animal production: an international regulatory and economic survey.
Globalization and health 9:48-48. doi: 10.1186/1744-8603-9-48
Masey O'Neill, H. V., J. A. Smith, and M. R. Bedford. 2014. Multicarbohydrase Enzymes for
Non-ruminants. Asian-Australasian journal of animal sciences 27(2):290-301. doi:
10.5713/ajas.2013.13261
Mathlouthi, N., L. Saulnier, B. Quemener, and M. Larbier. 2002. Xylanase, β-Glucanase, and
Other Side Enzymatic Activities Have Greater Effects on the Viscosity of Several
Feedstuffs than Xylanase and β-Glucanase Used Alone or in Combination. Journal of
Agricultural and Food Chemistry 50(18):5121-5127. doi: 10.1021/jf011507b
Mavromichalis, I., J. Hancock, B. Senne, T. Gugle, G. Kennedy, R. Hines, and C. Wyatt.
2000. Enzyme supplementation and particle size of wheat in diets for nursery and
finishing pigs. Journal of Animal Science 78(12):3086-3095.
McAloon, A., F. Taylor, W. Yee, K. Ibsen, and R. Wooley. 2000. Determining the cost of
producing ethanol from corn starch and lignocellulosic feedstocks, National
Renewable Energy Lab., Golden, CO (US).
McCleary, B. V., and P. McGeough. 2015. A comparison of polysaccharide substrates and
reducing sugar methods for the measurement of endo-1, 4-β-xylanase. Applied
biochemistry and biotechnology 177(5):1152-1163.
Mendis, M., and S. Simsek. 2014. Arabinoxylans and human health. Food Hydrocolloids
42:239-243. doi: doi.org/10.1016/j.foodhyd.2013.07.022
Mendoza, O., M. Ellis, A. Gaines, M. Kocher, T. Sauber, and D. Jones. 2010. Effect of
particle size of corn distillers dried grains with soluble (DDGS) on digestible and
metabolizable energy content for growing pigs. J. Anim. Sci. 88(E-Suppl. 3):92.
170
Mertens, D. 2003. Challenges in measuring insoluble dietary fiber. Journal of Animal Science
81(12):3233-3249.
Michel, P., and A. Rérat. 1998. Effect of adding sugar beet fibre and wheat bran to a starch
diet on the absorption kinetics of glucose, amino-nitrogen and volatile fatty acids in
the pig. Reproduction Nutrition Development 38(1):49-68.
Mikkelsen, L., and B. B. Jensen. 2000. Effect of fermented liquid feed on the activity and
composition of the microbiota in the gut of pigs. Pig News and Information 21(2):59-
66.
Mikkelsen, L. L., and B. B. Jensen. 1998. Performance and microbial activity in the
gastrointestinal tract of piglets fed fermented liquid feed at weaning. Journal of Animal
and Feed Sciences 7(Suppl. 1):211-215. (journal article) doi:
10.22358/jafs/69978/1998
Missotten, J. A., J. Michiels, J. Degroote, and S. De Smet. 2015. Fermented liquid feed for
pigs: an ancient technique for the future. Journal of Animal Science and Biotechnology
6(1):4. doi: 10.1186/2049-1891-6-4
Miyamoto-Shinohara, Y., T. Imaizumi, J. Sukenobe, Y. Murakami, S. Kawamura, and Y.
Komatsu. 2000. Survival Rate of Microbes after Freeze-Drying and Long-Term
Storage. Cryobiology 41(3):251-255. doi: doi.org/10.1006/cryo.2000.2282
Molist, F., M. van Oostrum, J. F. Pérez, G. G. Mateos, C. M. Nyachoti, and P. J. van der Aar.
2014. Relevance of functional properties of dietary fibre in diets for weanling pigs.
Animal Feed Science and Technology 189:1-10. doi:
doi.org/10.1016/j.anifeedsci.2013.12.013
Moran, K., C. de Lange, P. Ferket, V. Fellner, P. Wilcock, and E. van Heugten. 2016. Enzyme
supplementation to improve the nutritional value of fibrous feed ingredients in swine
diets fed in dry or liquid form. J. Anim. Sci. 94(3):1031-1040. doi: 10.2527/jas2015-
9855
Morgan, C. A., N. Herman, P. A. White, and G. Vesey. 2006. Preservation of micro-
organisms by drying; A review. Journal of Microbiological Methods 66(2):183-193.
doi: doi.org/10.1016/j.mimet.2006.02.017
Myers, A. J., and J. F. Patience. 2014. The Effects of Cereal Type and Xylanase
Supplementation on Pig Growth Performance and Energy Digestibility.
Myers, W., P. Ludden, V. Nayigihugu, and B. Hess. 2004. A procedure for the preparation
and quantitative analysis of samples for titanium dioxide. Journal of Animal Science
82(1):179-183.
Nanson, N. J., and M. L. Fields. 1984. Influence of Temperature of Fermentation on the
Nutritive Value of Lactic Acid Fermented Cornmeal. Journal of Food Science
49(3):958-959. doi: 10.1111/j.1365-2621.1984.tb13253.x
Ndou, S. P., E. Kiarie, A. K. Agyekum, J. M. Heo, L. F. Romero, S. Arent, R. Lorentsen, and
C. M. Nyachoti. 2015. Comparative efficacy of xylanases on growth performance and
digestibility in growing pigs fed wheat and wheat bran- or corn and corn DDGS-based
diets supplemented with phytase. Animal Feed Science and Technology 209:230-239.
doi: doi.org/10.1016/j.anifeedsci.2015.08.011
Ndou, S. P., E. Kiarie, and C. M. Nyachoti. 2018. Flaxseed meal and oat hulls
supplementation: impact on predicted production and absorption of volatile fatty acids
and energy from hindgut fermentation in growing pigs. J Anim Sci doi:
10.1093/jas/sky399
171
Ndou, S. P., E. Kiarie, S. J. Thandapilly, M. C. Walsh, N. Ames, and C. M. Nyachoti. 2017.
Flaxseed meal and oat hulls supplementation modulates growth performance, blood
lipids, intestinal fermentation, bile acids, and neutral sterols in growing pigs fed corn-
soybean meal-based diets. Journal of Animal Science 95(7):3068-3078.
Nortey, T. N., J. F. Patience, J. S. Sands, N. L. Trottier, and R. T. Zijlstra. 2008. Effects of
xylanase supplementation on the apparent digestibility and digestible content of
energy, amino acids, phosphorus, and calcium in wheat and wheat by-products from
dry milling fed to grower pigs. J Anim Sci 86(12):3450-3464. doi: 10.2527/jas.2007-
0472
NRC. 2012. Nutrient Requirements of Swine. 11th revision ed. National Academy of Sciences
Press, Washington, D.C.
NRC. 2012. Nutrient requirements of swine. 11th revision ed. National Academy of Sciences
Press, Washington D.C.
Nyachoti, C. M., J. D. House, B. A. Slominski, and I. R. Seddon. 2005. Energy and nutrient
digestibilities in wheat dried distillers' grains with solubles fed to growing pigs. J Sci
Food Agr 85(15):2581-2586. doi: 10.1002/jsfa.2305
Nyachoti, C. M., R. T. Zijlstra, C. F. M. de Lange, and J. F. Patience. 2004. Voluntary feed
intake in growing-finishing pigs: A review of the main determining factors and
potential approaches for accurate predictions. Canadian Journal of Animal Science
84(4):549-566. doi: 10.4141/A04-001
Oakenfull, D. 2001. Physical chemistry of dietary fiber. Dietary Fiber in Human Nutrition. 3rd
ed. GA Spiller, CRC Press, Boca Raton, FL:33-47.
Olukosi, O. A., J. S. Sands, and O. Adeola. 2007. Supplementation of carbohydrases or
phytase individually or in combination to diets for weanling and growing-finishing
pigs1. Journal of Animal Science 85(7):1702-1711. doi: 10.2527/jas.2006-709
Owusu-Asiedu, A., J. F. Patience, A. G. Van Kessel, B. Laarveld, P. H. Simmins, and R. T.
Zijlstra. 2006. Effects of guar gum and cellulose on digesta passage rate, ileal
microbial populations, energy and protein digestibility, and performance of grower
pigs1,2. Journal of Animal Science 84(4):843-852. doi: 10.2527/2006.844843x
Paloheimo, M., J. Piironen, and J. Vehmaanperä. 2010. Xylanases and cellulases as feed
additives. In: M. R. Bedford, Partridge, G.G., editor, Enzymes in farm animal
nutrition. p. 12-53.
Park, C. S., I. Park, and B. G. Kim. 2016a. Effects of an enzyme cocktail on digestible and
metabolizable energy concentrations in barley, corn, and wheat fed to growing pigs.
Livestock Science 187:1-5. doi: doi.org/10.1016/j.livsci.2016.02.003
Park, K. R., C. S. Park, and B. G. Kim. 2016b. An enzyme complex increases in vitro dry
matter digestibility of corn and wheat in pigs. Springerplus 5(1):598. doi:
10.1186/s40064-016-2194-5
Park, S., W. Li, B. St-Pierre, Q. Wang, and T. A. Woyengo. 2020. Growth performance,
nutrient digestibility and fecal microbial composition of weaned pigs fed multi-
enzyme supplemented diets. Journal of Animal Science doi: 10.1093/jas/skaa306
Patience, J. F., and A. L. Petry. 2019. Chapter 5 Susceptibility of fibre to exogenous
carbohydrases and impact on performance in swine. p 99-115.
Pedersen, M. B., M. Bunzel, J. Schafer, K. E. B. Knudsen, J. F. Sørensen, S. Yu, and H. N.
Lærke. 2015a. Ferulic acid dehydrodimer and dehydrotrimer profiles of distiller’s
172
dried grains with solubles from different cereal species. Journal of Agricultural and
Food Chemistry 63(7):2006-2012. doi: 10.1021/jf505150g
Pedersen, M. B., S. Dalsgaard, S. Arent, R. Lorentsen, K. E. B. Knudsen, S. Yu, and H. N.
Lærke. 2015b. Xylanase and protease increase solubilization of non-starch
polysaccharides and nutrient release of corn- and wheat distillers dried grains with
solubles. Biochemical Engineering Journal 98:99-106. doi:
doi.org/10.1016/j.bej.2015.02.036
Pedersen, M. B., S. Dalsgaard, K. E. B. Knudsen, S. Yu, and H. N. Lærke. 2014.
Compositional profile and variation of Distillers Dried Grains with Solubles from
various origins with focus on non-starch polysaccharides. Anim. Feed Sci. Technol.
197(Supplement C):130-141. doi: 10.1016/j.anifeedsci.2014.07.011
Percival Zhang, Y. H., M. E. Himmel, and J. R. Mielenz. 2006. Outlook for cellulase
improvement: Screening and selection strategies. Biotechnology Advances 24(5):452-
481. doi: doi.org/10.1016/j.biotechadv.2006.03.003
Perez de Nanclares Fernandez, M. 2017. Rapeseed co-products in pig diets: effects on nutrient
and energy digestibility and metabolism, Norwegian University of Life Sciences,
Norway.
Petry, A. L., N. F. Huntley, M. R. Bedford, and J. F. Patience. 2020. Xylanase increased the
energetic contribution of fiber and improved the oxidative status, gut barrier integrity,
and growth performance of growing pigs fed insoluble corn-based fiber. Journal of
Animal Science 98(7)doi: 10.1093/jas/skaa233
Pettolino, A. F., W. Cherie, B. F. Geoffrey, and B. Antony. 2012. Determining the
polysaccharide composition of plant cell walls. Nat. Protoc. 7(9):1590. doi:
10.1038/nprot.2012.081
Pillai, R., M. Redmond, and J. Röding. 2005. Anti‐Wrinkle Therapy: Significant New
Findings in the Non‐Invasive Cosmetic Treatment of Skin Wrinkles with Beta‐Glucan.
International Journal of Cosmetic Science 27:292-292. doi: 10.1111/j.1463-
1318.2005.00268_3.x
Pluske, J. R., D. J. Hampson, and I. H. Williams. 1997. Factors influencing the structure and
function of the small intestine in the weaned pig: a review. Livestock Production
Science 51(1):215-236. doi: 10.1016/S0301-6226(97)00057-2
Prosky, L., N. G. Asp, I. Furda, J. W. DeVries, T. F. Schweizer, and B. F. Harland. 1985.
Determination of total dietary fiber in foods and food products: collaborative study.
Journal - Association of Official Analytical Chemists 68(4):677-679.
Raffrenato, E., R. Fievisohn, K. Cotanch, R. Grant, L. Chase, and M. Van Amburgh. 2017.
Effect of lignin linkages with other plant cell wall components on in vitro and in vivo
neutral detergent fiber digestibility and rate of digestion of grass forages. Journal of
dairy science 100(10):8119-8131.
Raza, A., S. Bashir, and R. Tabassum. 2019. An update on carbohydrases: growth
performance and intestinal health of poultry. Heliyon 5(4):e01437. doi:
doi.org/10.1016/j.heliyon.2019.e01437
Regmi, P., W. Sauer, and R. Zijlstra. 2008. Prediction of in vivo apparent total tract energy
digestibility of barley in grower pigs using an in vitro digestibility technique. Journal
of animal science 86(10):2619-2626.
173
Regmi, P. R., N. S. Ferguson, and R. T. Zijlstra. 2009. In vitro digestibility techniques to
predict apparent total tract energy digestibility of wheat in grower pigs12. Journal of
Animal Science 87(11):3620-3629. doi: 10.2527/jas.2008-1739
Rho, Y., E. Kiarie, and C. de Lange. 2018a. Nutritive value of corn distiller's dried grains with
solubles steeped without or with exogenous feed enzymes for 24 h and fed to growing
pigs. J. Anim. Sci. 96(6):2352-2360. doi: 10.1093/jas/sky115
Rho, Y., R. Patterson, I. Joye, M. Martinez, J. E. Squires, and E. G. Kiarie. 2020. Fiber
degrading enzymes increased monosaccharides release and fermentation in corn
distillers dried grains with solubles and wheat middlings steeped without or with
protease. Translational Animal Science doi: 10.1093/tas/txaa153
Rho, Y., D. Wey, C. Zhu, E. Kiarie, K. Moran, E. van Heugten, and C. F. M. de Lange.
2018b. Growth performance, gastrointestinal and digestibility responses in growing
pigs when fed corn-soybean meal-based diets with corn DDGS treated with fiber
degrading enzymes with or without liquid fermentation. J. Anim. Sci. 96(12):5188-
5197. doi: 10.1093/jas/sky369
Rho, Y., C. Zhu, E. Kiarie, and C. F. M. de Lange. 2017. Standardized ileal digestible amino
acids and digestible energy contents in high-protein distiller’s dried grains with
solubles fed to growing pigs1. Journal of Animal Science 95(8):3591-3597. doi:
10.2527/jas.2017.1553
Robinson, P. K. 2015. Enzymes: principles and biotechnological applications. Essays in
biochemistry 59:1-41.
Rojas, O., and H. Stein. 2015. Effects of reducing the particle size of corn grain on the
concentration of digestible and metabolizable energy and on the digestibility of energy
and nutrients in corn grain fed to growing pigs. Livestock Science 181:187-193.
Rojas, O. J., and H. H. Stein. 2017. Processing of ingredients and diets and effects on
nutritional value for pigs. Journal of animal science and biotechnology 8(1):48.
Rosenfelder, P., M. Eklund, and R. Mosenthin. 2013. Nutritive value of wheat and wheat by-
products in pig nutrition: A review. Anim. Feed Sci. Technol. 185(3):107-125. doi:
doi.org/10.1016/j.anifeedsci.2013.07.011
Rumpagaporn, P., B. L. Reuhs, A. Kaur, J. A. Patterson, A. Keshavarzian, and B. R. Hamaker.
2015. Structural features of soluble cereal arabinoxylan fibers associated with a slow
rate of in vitro fermentation by human fecal microbiota. Carbohydr. Polym. 130:191-
197. doi: doi.org/10.1016/j.carbpol.2015.04.041
Saeed, F., I. Pasha, F. M. Anjum, and M. T. Sultan. 2011. Arabinoxylans and
arabinogalactans: a comprehensive treatise. Crit. Rev. Food. Sci 51(5):467-476.
Salim, H. M., Z. A. Kruk, and B. D. Lee. 2010. Nutritive value of corn distillers dried grains
with solubles as an ingredient of poultry diets: A review. World. Poultry. Sci. J
66(3):411-432. doi: 10.1017/S0043933910000504
Saqui-Salces, M., Z. Luo, P. Urriola, B. Kerr, and G. Shurson. 2017. Effect of dietary fiber
and diet particle size on nutrient digestibility and gastrointestinal secretory function in
growing pigs. Journal of animal science 95(6):2640-2648.
Schülein, M. 2000. Protein engineering of cellulases. Biochimica et Biophysica Acta (BBA) -
Protein Structure and Molecular Enzymology 1543(2):239-252. doi:
doi.org/10.1016/S0167-4838(00)00247-8
174
Selle, P. H., A. J. Cowieson, and V. Ravindran. 2009. Consequences of calcium interactions
with phytate and phytase for poultry and pigs. Livestock Science 124(1):126-141. doi:
doi.org/10.1016/j.livsci.2009.01.006
Slominski, B., D. Boros, L. Campbell, W. Guenter, and O. Jones. 2004. Wheat by-products in
poultry nutrition. Part I. Chemical and nutritive composition of wheat screenings,
bakery by-products and wheat mill run. Canadian Journal of Animal Science
84(3):421-428.
Snelders, J., H. Olaerts, E. Dornez, T. Van de Wiele, A.-M. Aura, L. Vanhaecke, J. A.
Delcour, and C. M. Courtin. 2014. Structural features and feruloylation modulate the
fermentability and evolution of antioxidant properties of arabinoxylanoligosaccharides
during in vitro fermentation by human gut derived microbiota. J. Funct. food. 10:1-12.
doi: doi.org/10.1016/j.jff.2014.05.011
Somerville, C., S. Bauer, G. Brininstool, M. Facette, T. Hamann, J. Milne, E. Osborne, A.
Paredez, S. Persson, and T. Raab. 2004. Toward a systems approach to understanding
plant cell walls. Science 306(5705):2206-2211.
Souza, L. W. O., P. Liu, G. C. Shurson, and S. K. Baidoo. 2012. Impact of distillers dried
grains with solubles particle size on nutrient digestibility, DE and ME content, and
flowability in diets for growing pigs1. Journal of Animal Science 90(13):4925-4932.
doi: 10.2527/jas.2011-4604
Stein, H. 2006. DDGS: Energy and nutrient content and digestibility. In: World pig
production, opportunity or threat? p 61801.
Stein, H., L. Lagos, and G. Casas. 2016. Nutritional value of feed ingredients of plant origin
fed to pigs. Animal Feed Science and Technology 218:33-69.
Stein, H., and G. Shurson. 2009. Board-invited review: The use and application of distillers
dried grains with solubles in swine diets. J. Anim. Sci. 87(4):1292-1303. doi:
10.2527/jas.2008-1290
Stewart, L., D. Kil, F. Ji, R. Hinson, A. Beaulieu, G. Allee, J. Patience, J. Pettigrew, and H.-H.
Stein. 2013. Effects of dietary soybean hulls and wheat middlings on body
composition, nutrient and energy retention, and the net energy of diets and ingredients
fed to growing and finishing pigs. Journal of animal science 91(6):2756-2765.
Tervilä-Wilo, A., T. Parkkonen, A. Morgan, M. Hopeakoski-Nurminen, K. Poutanen, P.
Heikkinen, and K. Autio. 1996. In VitroDigestion of Wheat Microstructure with
Xylanase and Cellulase fromTrichoderma reesei. Journal of Cereal Science 24(3):215-
225.
Tiwari, U. P., H. Chen, S. W. Kim, and R. Jha. 2018. Supplemental effect of xylanase and
mannanase on nutrient digestibility and gut health of nursery pigs studied using both in
vivo and in vitro models. Animal Feed Science and Technology 245:77-90. doi:
doi.org/10.1016/j.anifeedsci.2018.07.002
Tiwari, U. P., A. K. Singh, and R. Jha. 2019. Fermentation characteristics of resistant starch,
arabinoxylan, and β-glucan and their effects on the gut microbial ecology of pigs: A
review. Animal Nutrition 5(3):217-226.
Urriola, P., G. Shurson, and H. Stein. 2010. Digestibility of dietary fiber in distillers
coproducts fed to growing pigs. J. Anim. Sci. 88(7):2373-2381.
Urriola, P. E. 2010. Digestibility of dietary fiber by growing pigs, University of Illinois at
Urbana-Champaign.
175
Urriola, P. E., S. K. Cervantes‐Pahm, and H. H. Stein. 2013. Fiber in Swine Nutrition. p 255-
276. Blackwell Publishing Ltd, Oxford, UK.
van den Broek, L. A. M., S. W. A. Hinz, G. Beldman, J.-P. Vincken, and A. G. J. Voragen.
2008. Bifidobacterium carbohydrases-their role in breakdown and synthesis of
(potential) prebiotics. Molecular Nutrition & Food Research 52(1):146-163. doi:
10.1002/mnfr.200700121
Van Eylen, D., F. van Dongen, M. Kabel, and J. de Bont. 2011. Corn fiber, cobs and stover:
Enzyme-aided saccharification and co-fermentation after dilute acid pretreatment.
Bioresource Technology 102(10):5995-6004. doi:
doi.org/10.1016/j.biortech.2011.02.049
Van Soest, P. J. 1963. Use of detergents in the analysis of fibrous feeds. 2. A rapid method for
the determination of fiber and lignin. Journal of the Association of Official
Agricultural Chemists 46:829-835.
Van Soest, P. v., J. Robertson, and B. Lewis. 1991. Methods for dietary fiber, neutral
detergent fiber, and nonstarch polysaccharides in relation to animal nutrition. J. Dairy.
Sci 74(10):3583-3597. doi: 10.3168/jds.S0022-0302(91)78551-2
van Winsen, R. L., B. A. Urlings, L. J. Lipman, J. M. Snijders, D. Keuzenkamp, J. H.
Verheijden, and F. van Knapen. 2001. Effect of fermented feed on the microbial
population of the gastrointestinal tracts of pigs. Applied and Environmental
Microbiology 67(7):3071-3076.
Vangsøe, C. T., E. Bonnin, M. Joseph-Aime, L. Saulnier, V. Neugnot-Roux, and K. E. Bach
Knudsen. 2020. Improving the digestibility of cereal fractions of wheat, maize, and
rice by a carbohydrase complex rich in xylanases and arabinofuranosidases: an in vitro
digestion study. Journal of the Science of Food and Agriculture n/a(n/a)doi:
10.1002/jsfa.10806
Vardakou, M., C. N. Palop, P. Christakopoulos, C. B. Faulds, M. A. Gasson, and A. Narbad.
2008. Evaluation of the prebiotic properties of wheat arabinoxylan fractions and
induction of hydrolase activity in gut microflora. International journal of food
microbiology 123(1):166-170. doi: doi.org/10.1016/j.ijfoodmicro.2007.11.007
Varel, V., and J. T. Yen. 1997. Microbial perspective on fiber utilization by swine. Journal of
Animal Science 75(10):2715-2722.
Walsh, M. C., E. Kiarie, L. Romero, and S. Arent. 2016. Xylanase solubilization of corn and
wheat arabinoxylans in mixed growing pig diets subjected to upper gut in-vitro
digestion and in ileal digesta. J. Anim. Sci. 94(suppl_2):111-111. doi:
10.2527/msasas2016-235
Wang, M., S. Wichienchot, X. He, X. Fu, Q. Huang, and B. Zhang. 2019. In vitro colonic
fermentation of dietary fibers: Fermentation rate, short-chain fatty acid production and
changes in microbiota. Trends. Food. Sci. Tech. 88:1-9. doi:
doi.org/10.1016/j.tifs.2019.03.005
Wenk, C. 2001. The role of dietary fibre in the digestive physiology of the pig. Animal Feed
Science and Technology 90(1-2):21-33.
Widyaratne, G., J. Patience, and R. Zijlstra. 2009. Effect of xylanase supplementation of diets
containing wheat distiller's dried grains with solubles on energy, amino acid and
phosphorus digestibility and growth performance of grower-finisher pigs. Canadian
journal of animal science 89(1):91-95. doi: doi.org/10.4141/CJAS08103
176
Widyaratne, G., and R. Zijlstra. 2007. Nutritional value of wheat and corn distiller’s dried
grain with solubles: Digestibility and digestible contents of energy, amino acids and
phosphorus, nutrient excretion and growth performance of grower-finisher pigs. Can.
J. Anim. Sci. 87(1):103-114.
Wilfart, A., L. Montagne, H. Simmins, J. Noblet, and J. v. Milgen. 2007. Digesta transit in
different segments of the gastrointestinal tract of pigs as affected by insoluble fibre
supplied by wheat bran. British Journal of Nutrition 98(1):54-62. doi:
10.1017/S0007114507682981
Williams, B. A., M. W. Bosch, H. Boer, M. W. A. Verstegen, and S. Tamminga. 2005. An in
vitro batch culture method to assess potential fermentability of feed ingredients for
monogastric diets. Animal Feed Science and Technology 123-124:445-462. doi:
doi.org/10.1016/j.anifeedsci.2005.04.031
Williams, B. A., D. Mikkelsen, L. Le Paih, and M. J. Gidley. 2011. In vitro fermentation
kinetics and end-products of cereal arabinoxylans and (1, 3; 1, 4)-β-glucans by porcine
faeces. Journal of cereal science 53(1):53-58.
Wiseman, M. 2016. Use of enzymes and inoculants to manipulate the feeding value of liquid
fed DDGS for young pigs. Doctoral Dissertation, University of Guelph, Guelph, ON.
Wiseman, M., B. McBride, J. Li, D. Wey, J. Zhu, and C. F. M. de Lange. 2017a. Effects of
steeped or fermented distillers dried grains with solubles on growth performance in
weanling pigs. Journal of Animal Science 95(8):3563-3578. (Article) doi:
10.2527/jas2017.1478
Wiseman, M., B. McBride, J. Li, D. Wey, J. Zhu, and C. F. M. de Lange. 2017b. Effects of
steeped or fermented distillers dried grains with solubles on growth performance in
weanling pigs1. Journal of Animal Science 95(8):3563-3578. doi:
10.2527/jas.2017.1478
Wondra, K., J. Hancock, K. Behnke, R. Hines, and C. Stark. 1995. Effects of particle size and
pelleting on growth performance, nutrient digestibility, and stomach morphology in
finishing pigs. Journal of Animal Science 73(3):757-763.
Woyengo, T., E. Beltranena, and R. Zijlstra. 2014. Nonruminant nutrition symposium:
Controlling feed cost by including alternative ingredients into pig diets: A review. J.
Anim. Sci. 92(4):1293-1305.
Woyengo, T. A., D. V. Ige, O. O. Akinremi, and C. M. Nyachoti. 2016. Performance and
nutrient digestibility in growing pigs fed wheat dried distillers’ grain with solubles‐
containing diets supplemented with phytase and multi‐carbohydrase. J. Anim. Sci.
87(4):570-577.
Wu, F., L. J. Johnston, P. E. Urriola, A. M. Hilbrands, and G. C. Shurson. 2016. Effects of
feeding diets containing distillers' dried grains with solubles and wheat middlings with
equal predicted dietary net energy on growth performance and carcass composition of
growing–finishing pigs1. Journal of Animal Science 94(1):144-154. doi:
10.2527/jas.2015-9592
Wyman, C., S. Decker, M. E. Himmel, J. W. Brady, C. E. Skopec, and L. Viikari. 2005.
Hydrolysis of cellulose and hemicellulose. 1:1023-1062.
Yáñez, J., E. Beltranena, M. Cervantes, and R. Zijlstra. 2011. Effect of phytase and xylanase
supplementation or particle size on nutrient digestibility of diets containing distillers
dried grains with solubles cofermented from wheat and corn in ileal-cannulated grower
pigs. Journal of animal science 89(1):113-123.
177
Yang, Y., E. Kiarie, B. A. Slominski, A. Brule-Babel, and C. M. Nyachoti. 2010. Amino acid
and fiber digestibility, intestinal bacterial profile, and enzyme activity in growing pigs
fed dried distillers grains with solubles-based diets. J Anim Sci 88(10):3304-3312. doi:
10.2527/jas.2009-2318
Yin, Y. L., J. D. G. McEvoy, H. Schulze, U. Hennig, W. B. Souffrant, and K. J. McCracken.
2000. Apparent digestibility (ileal and overall) of nutrients and endogenous nitrogen
losses in growing pigs fed wheat (var. Soissons) or its by-products without or with
xylanase supplementation. Livestock Production Science 62(2):119-132. doi:
doi.org/10.1016/S0301-6226(99)00129-3
Yoon, S., Y. Yang, P. Shinde, J. Choi, J. Kim, Y. Kim, K. Yun, J. Jo, J. Lee, and S. Ohh.
2010. Effects of mannanase and distillers dried grain with solubles on growth
performance, nutrient digestibility, and carcass characteristics of grower-finisher pigs.
Journal of Animal Science 88(1):181-191.
Zangaro, C. A. 2018. Enhancing DDGS value for pigs via pre-treatment, pre-digestion.
Master's thesis, South Dakota State University, Minneapolis.
Zangaro, C. A., R. Patterson, W. R. Gibbons, and T. A. Woyengo. 2018. Enhancing the
Nutritive Value of Corn Whole Stillage for Pigs via Pretreatment and Predigestion.
Journal of agricultural and food chemistry 66(36):9409-9417. doi:
10.1021/acs.jafc.8b01943
Zeng, Z. K., Q. Y. Li, Q. Y. Tian, Y. T. Xu, and X. S. Piao. 2018a. The combination of
carbohydrases and phytase to improve nutritional value and non-starch
polysaccharides degradation for growing pigs fed diets with or without wheat bran.
Animal Feed Science and Technology 235:138-146. doi:
doi.org/10.1016/j.anifeedsci.2017.11.009
Zeng, Z. K., J. L. Zhu, G. C. Shurson, C. Chen, and P. E. Urriola. 2018b. Improvement of in
vitro ileal dry matter digestibility by non-starch polysaccharide degrading enzymes
and phytase is associated with decreased hindgut fermentation. Animal Feed Science
and Technology 246:52-61. doi: https://doi.org/10.1016/j.anifeedsci.2018.09.006
Zhang, W., D. Li, L. Liu, J. Zang, Q. Duan, W. Yang, and L. Zhang. 2013. The effects of
dietary fiber level on nutrient digestibility in growing pigs. Journal of Animal Science
and Biotechnology 4(1):17. doi: 10.1186/2049-1891-4-17
Zhang, Y. J., Q. Liu, W. M. Zhang, Z. J. Zhang, W. L. Wang, and S. Zhuang. 2018a.
Gastrointestinal microbial diversity and short-chain fatty acid production in pigs fed
different fibrous diets with or without cell wall-degrading enzyme supplementation.
Livestock Science 207:105-116. doi: https://doi.org/10.1016/j.livsci.2017.11.017
Zhang, Z., C. Smith, and W. Li. 2014. Extraction and modification technology of
arabinoxylans from cereal by-products: A critical review. Food Research International
65:423-436. doi: https://doi.org/10.1016/j.foodres.2014.05.068
Zhang, Z., H. M. Tun, R. Li, B. J. M. Gonzalez, H. C. Keenes, C. M. Nyachoti, E. Kiarie, and
E. Khafipour. 2018b. Impact of xylanases on gut microbiota of growing pigs fed corn-
or wheat-based diets. Animal Nutrition 4(4):339-350. doi:
https://doi.org/10.1016/j.aninu.2018.06.007
Zhao, J., Y. Bai, S. Tao, G. Zhang, J. Wang, L. Liu, and S. Zhang. 2019. Fiber-rich foods
affected gut bacterial community and short-chain fatty acids production in pig model.
Journal of Functional Foods 57:266-274. doi: https://doi.org/10.1016/j.jff.2019.04.009
178
Zhu, Z., R. Hinson, L. Ma, D. Li, and G. Allee. 2010. Growth Performance of Nursery Pigs
Fed 30% Distillers Dried Grain with Solubles (DDGS) and the Effects of Pelleting on
Performance and Nutrient Digestibility. Asian-Australasian Journal of Animal
Sciences 23doi: 10.5713/ajas.2010.90513