Embed Size (px)
Citation preview
Completion Report
Project Numbers: 38272-013 and 38272-033 MFF Number: 0018 Loan Number: 2797 October 2021
India: Uttarakhand Urban Sector Development Investment Program (Tranche 2 and Multitranche Financing Facility) This document is being disclosed to the public in accordance with ADB’s Access to Information Policy.
CURRENCY EQUIVALENTS
Currency unit – Indian rupee/s (₹)
At Appraisal At Project Completion 9 May 2011 9 August 2018
₹1.00 = $0.0223 $0.0146 $1.00 = ₹44.7950 ₹68.4675
ABBREVIATIONS
ADB – Asian Development Bank APFS – audited project financial statements BPL – below poverty line COVID-19 – coronavirus disease DMF – design and monitoring framework DSC – design and supervision consultant EIRR – economic internal rate of return FIRR – financial internal rate of return GAP – gender action plan IPIU – investment program implementation unit IPMC – investment program management consultant IPMU – investment program management unit MFF – multitranche financing facility NGO – nongovernment organization NRW – nonrevenue water O&M – operation and maintenance PCR – project completion report PPP – public–private partnership STP – sewage treatment plant SWM – solid waste management TA – technical assistance UDD – Urban Development Department UFW – unaccounted for water UJS – Uttarakhand Jay Sansthan (Uttarakhand water and sewer
operation and maintenance agency) ULB – urban local body UPJN – Uttarakhand Pey Jal Nigam (Uttarakhand portable water and
sewer infrastructure development and construction corporation) UUSDA – Uttarakhand Urban Sector Development Agency UUSDIP – Uttarakhand Urban Sector Development Investment Program WSS – water supply and sanitation WTP – water treatment plant
WEIGHTS AND MEASURES
km – kilometer lpcd – liters per capita per day m – meter mld – million liters per day
NOTES
(i) The fiscal year (FY) of the Government of India ends on 31 March. “FY” before a calendar year denotes the year in which the fiscal year ends, e.g., FY2021 ends on 31 March 2021.
(ii) In this report, “$” refers to United States dollars.
Vice-President Shixin Chen, Operations 1 Director General Kenichi Yokoyama, South Asia Department (SARD) Director Norio Saito, Urban Development and Water Division (SAUW),
SARD Team leader Na Won Kim, Senior Urban Development Specialist, SAUW, SARD Team members Deepa Ahluwalia, Senior Social Development Officer (Gender),
India Resident Mission (INRM), SARD Kathleen D. Aquino, Operation Assistant, SAUW, SARD Anita Kumari, Associate Project Analyst, INRM, SARD Girish Rameshwar Mahajan, Senior Environment Officer, INRM,
SARD Suhail Mircha, Safeguards Officer, INRM, SARD Santosh Pokharel, Urban Economist, SAUW, SARD Krishnendu Baran Sarkar, Senior Financial Management Officer,
INRM, SARD In preparing any country program or strategy, financing any project, or by making any designation of or reference to a particular territory or geographic area in this document, the Asian Development Bank does not intend to make any judgments as to the legal or other status of any territory or area.
CONTENTS
Page BASIC DATA i I. PROJECT DESCRIPTION 1
A. The Program 1 B. Project 2 1
II. DESIGN AND IMPLEMENTATION 1 A. Project 2 and Facility Design and Formulation 1 B. Project 2 and Facility Outputs 3 C. Project 2 and Facility Costs and Financing 6 D. Project 2 and Facility Disbursements 6 E. Project 2 and Facility Schedule 7 F. Implementation Arrangements 7 G. Technical Assistance 8 H. Consultant Recruitment and Procurement 8 I. Gender Equity 9 J. Safeguards 9 K. Monitoring and Reporting 10
III. EVALUATION OF PERFORMANCE 11 A. Relevance 11 B. Effectiveness 11 C. Efficiency 13 D. Sustainability 14 E. Development Impact 15 F. Performance of the Borrower and the Executing Agency 16 G. Performance of Asian Development Bank 16 H. Overall Assessment 16
IV. ISSUES, LESSONS, AND RECOMMENDATIONS 17 A. Issues and Lessons 17 B. Recommendations 17
APPENDIXES 1A Design and Monitoring Framework – Project 2 19 1B Design and Monitoring Framework – Facility 22 2 Project Cost at Appraisal and Actual 29 3 Project Cost by Financier 30 4 Disbursement of ADB Loan Proceeds 33 5 Contract Awards of ADB Loan Proceeds 34 6 Summary of Contract Details 35 7 Status of Compliance with Loan Covenants 39 8A Economic Analysis – Project 2 48 8B Economic Reevaluation – Facility 54 9A Financial Analysis – Project 2 69 9B Financial Reevaluation – Facility 77 10 Gender Action Plan Implementation and Achievements 90 11 Safeguards 99 12 Contribution to the ADB Strategy 2030 103
BASIC DATA
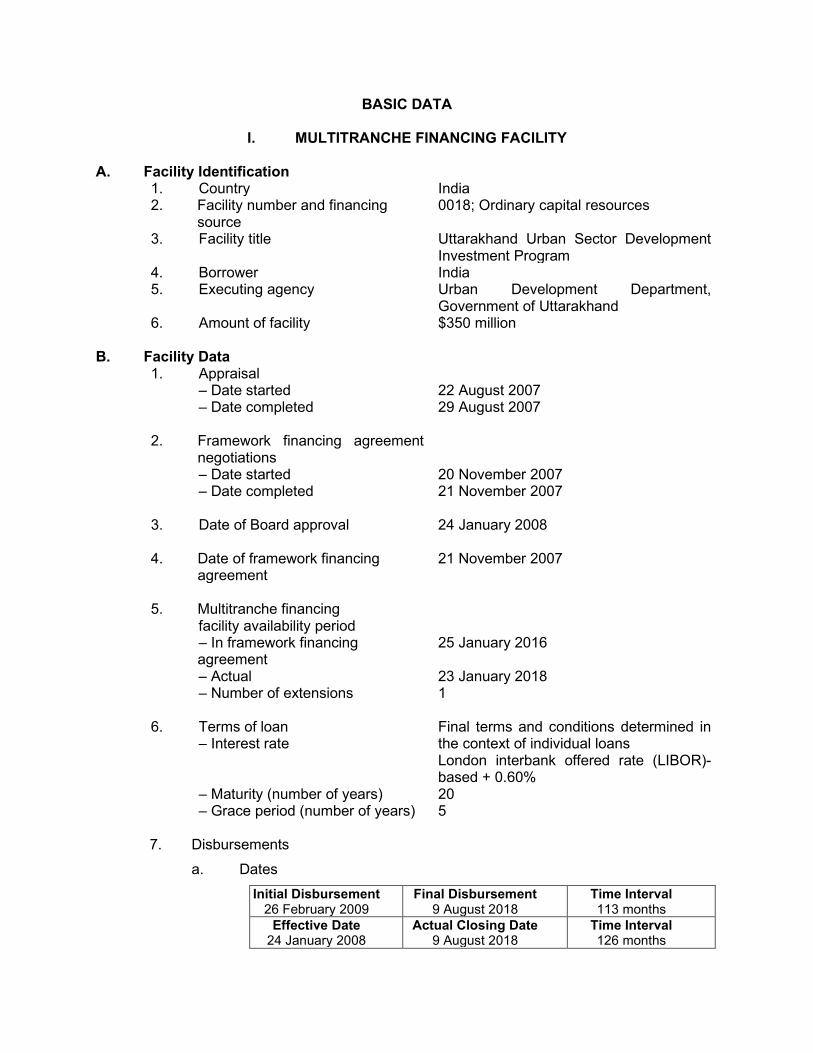
I. MULTITRANCHE FINANCING FACILITY A. Facility Identification 1. Country India
2. Facility number and financing source
0018; Ordinary capital resources
3. Facility title Uttarakhand Urban Sector Development Investment Program
4. Borrower India 5. Executing agency Urban Development Department,
Government of Uttarakhand 6. Amount of facility $350 million
B. Facility Data 1. Appraisal – Date started – Date completed
22 August 2007 29 August 2007
2. Framework financing agreement
negotiations – Date started – Date completed
20 November 2007 21 November 2007
3. Date of Board approval 24 January 2008
4. Date of framework financing agreement
21 November 2007
5. Multitranche financing facility availability period
– In framework financing agreement
– Actual – Number of extensions
25 January 2016 23 January 2018 1
6. Terms of loan – Interest rate – Maturity (number of years) – Grace period (number of years)
Final terms and conditions determined in the context of individual loans London interbank offered rate (LIBOR)-based + 0.60% 20 5
7. Disbursements a. Dates
Initial Disbursement 26 February 2009
Final Disbursement 9 August 2018
Time Interval 113 months
Effective Date 24 January 2008
Actual Closing Date 9 August 2018
Time Interval 126 months
ii
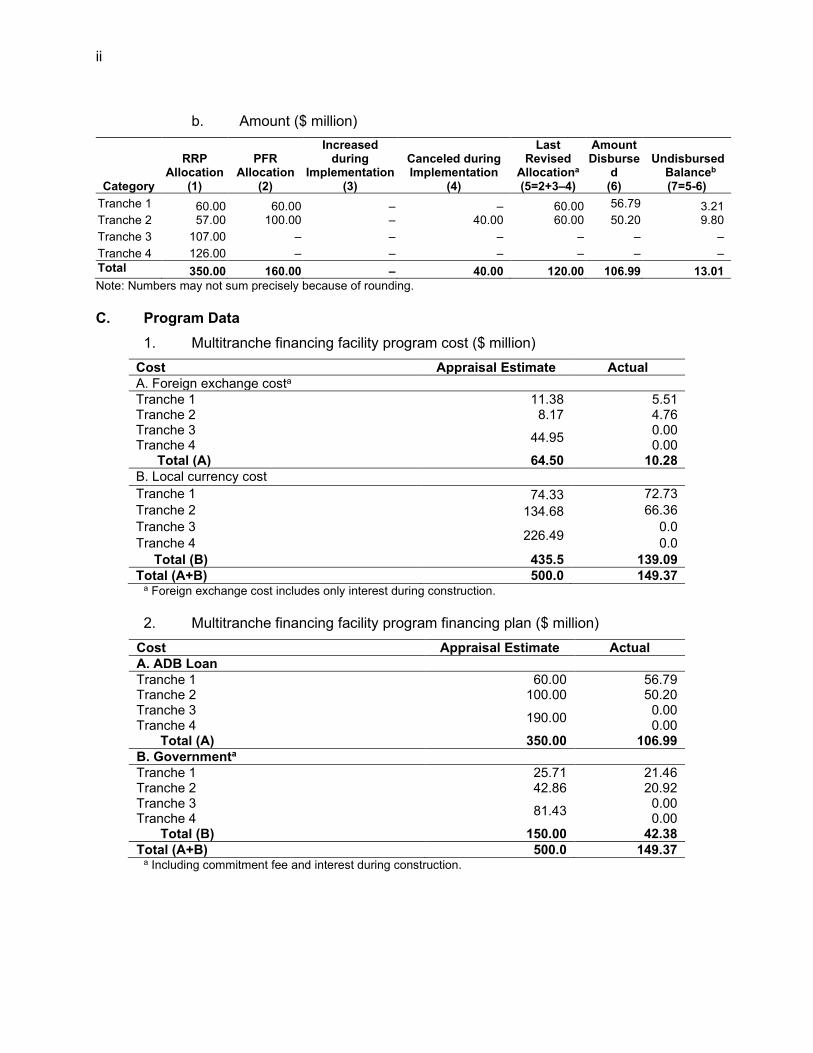
b. Amount ($ million)
Category
RRP Allocation
(1)
PFR Allocation
(2)
Increased during
Implementation (3)
Canceled during Implementation
(4)
Last Revised
Allocationa (5=2+3–4)
Amount Disburse
d (6)
Undisbursed Balanceb (7=5-6)
Tranche 1 60.00 57.00
60.00 100.00
– –
– 40.00
60.00 60.00
56.79 3.21 9.80 Tranche 2 50.20
Tranche 3 107.00 – – – – – – Tranche 4 126.00 – – – – – – Total 350.00 160.00 – 40.00 120.00 106.99 13.01 Note: Numbers may not sum precisely because of rounding. C. Program Data 1. Multitranche financing facility program cost ($ million)
Cost Appraisal Estimate Actual A. Foreign exchange costa Tranche 1 11.38 5.51 Tranche 2 8.17 4.76 Tranche 3 44.95 0.00 Tranche 4 0.00 Total (A) 64.50 10.28 B. Local currency cost Tranche 1 74.33 72.73 Tranche 2 134.68 66.36 Tranche 3 226.49 0.0 Tranche 4 0.0 Total (B) 435.5 139.09 Total (A+B) 500.0 149.37
a Foreign exchange cost includes only interest during construction.
2. Multitranche financing facility program financing plan ($ million) Cost Appraisal Estimate Actual A. ADB Loan Tranche 1 60.00 56.79 Tranche 2 100.00 50.20 Tranche 3 190.00 0.00 Tranche 4 0.00 Total (A) 350.00 106.99 B. Governmenta Tranche 1 25.71 21.46 Tranche 2 42.86 20.92 Tranche 3 81.43 0.00 Tranche 4 0.00 Total (B) 150.00 42.38 Total (A+B) 500.0 149.37
a Including commitment fee and interest during construction.
iii
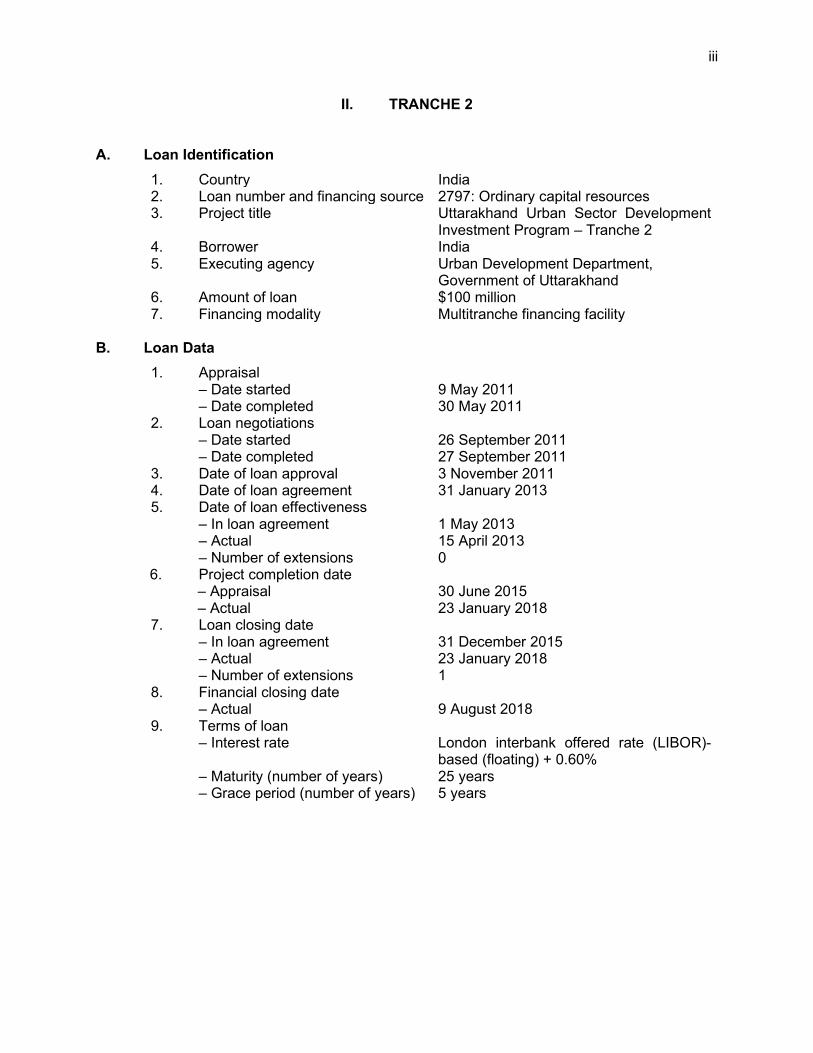
II. TRANCHE 2 A. Loan Identification 1. Country India 2. Loan number and financing source 2797: Ordinary capital resources 3. Project title Uttarakhand Urban Sector Development
Investment Program – Tranche 2 4. Borrower India 5. Executing agency Urban Development Department,
Government of Uttarakhand 6. Amount of loan $100 million 7. Financing modality Multitranche financing facility
B. Loan Data 1. Appraisal – Date started – Date completed
9 May 2011 30 May 2011
2. Loan negotiations – Date started – Date completed
26 September 2011 27 September 2011
3. Date of loan approval 3 November 2011 4. Date of loan agreement 31 January 2013 5. Date of loan effectiveness – In loan agreement – Actual – Number of extensions
1 May 2013 15 April 2013 0
6. Project completion date – Appraisal – Actual
30 June 2015 23 January 2018
7. Loan closing date – In loan agreement – Actual – Number of extensions
31 December 2015 23 January 2018 1
8. Financial closing date – Actual
9 August 2018
9. Terms of loan – Interest rate – Maturity (number of years) – Grace period (number of years)
London interbank offered rate (LIBOR)-based (floating) + 0.60% 25 years 5 years
iv
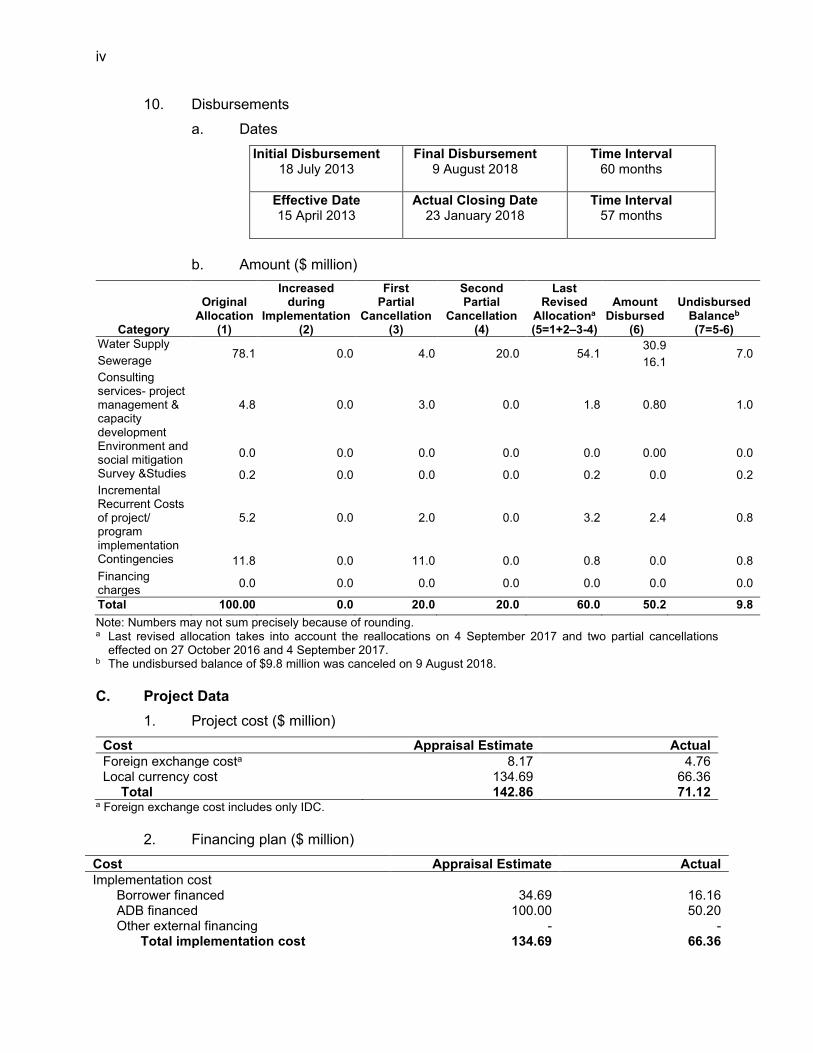
10. Disbursements a. Dates
Initial Disbursement 18 July 2013
Final Disbursement 9 August 2018
Time Interval 60 months
Effective Date
15 April 2013 Actual Closing Date
23 January 2018 Time Interval
57 months
b. Amount ($ million)
Category
Original Allocation
(1)
Increased during
Implementation (2)
First Partial
Cancellation (3)
Second Partial
Cancellation (4)
Last Revised
Allocationa (5=1+2–3-4)
Amount Disbursed
(6)
Undisbursed Balanceb (7=5-6)
Water Supply 78.1 0.0 4.0 20.0 54.1
30.9 7.0 Sewerage 16.1
Consulting services- project management & capacity development
4.8 0.0 3.0 0.0 1.8 0.80 1.0
Environment and social mitigation 0.0 0.0 0.0 0.0 0.0 0.00 0.0
Survey &Studies 0.2 0.0 0.0 0.0 0.2 0.0 0.2 Incremental Recurrent Costs of project/ program implementation
5.2 0.0 2.0 0.0 3.2 2.4 0.8
Contingencies 11.8 0.0 11.0 0.0 0.8 0.0 0.8 Financing charges 0.0 0.0 0.0 0.0 0.0 0.0 0.0
Total 100.00 0.0 20.0 20.0 60.0 50.2 9.8 Note: Numbers may not sum precisely because of rounding. a Last revised allocation takes into account the reallocations on 4 September 2017 and two partial cancellations
effected on 27 October 2016 and 4 September 2017. b The undisbursed balance of $9.8 million was canceled on 9 August 2018. C. Project Data 1. Project cost ($ million) Cost Appraisal Estimate Actual Foreign exchange costa 8.17 4.76 Local currency cost 134.69 66.36 Total 142.86 71.12
a Foreign exchange cost includes only IDC. 2. Financing plan ($ million) Cost Appraisal Estimate Actual Implementation cost Borrower financed 34.69 16.16 ADB financed 100.00 50.20 Other external financing - - Total implementation cost 134.69 66.36
v
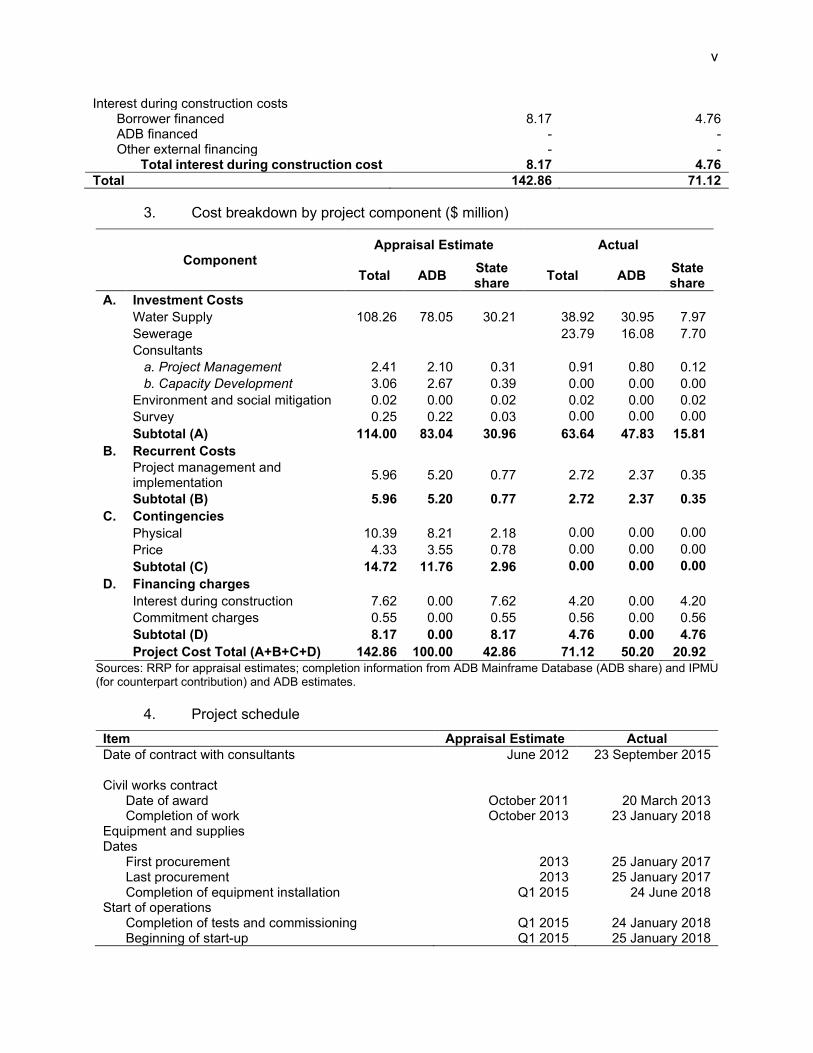
Interest during construction costs Borrower financed 8.17 4.76 ADB financed - - Other external financing - - Total interest during construction cost 8.17 4.76 Total 142.86 71.12 3. Cost breakdown by project component ($ million)
Component Appraisal Estimate Actual
Total ADB State share Total ADB State
share A. Investment Costs Water Supply 108.26 78.05 30.21 38.92 30.95 7.97
Sewerage 23.79 16.08 7.70 Consultants a. Project Management 2.41 2.10 0.31 0.91 0.80 0.12 b. Capacity Development 3.06 2.67 0.39 0.00 0.00 0.00 Environment and social mitigation 0.02 0.00 0.02 0.02 0.00 0.02 Survey 0.25 0.22 0.03 0.00 0.00 0.00
Subtotal (A) 114.00 83.04 30.96 63.64 47.83 15.81 B. Recurrent Costs
Project management and implementation 5.96 5.20 0.77 2.72 2.37 0.35
Subtotal (B) 5.96 5.20 0.77 2.72 2.37 0.35 C. Contingencies Physical 10.39 8.21 2.18 0.00 0.00 0.00 Price 4.33 3.55 0.78 0.00 0.00 0.00 Subtotal (C) 14.72 11.76 2.96 0.00 0.00 0.00 D. Financing charges Interest during construction 7.62 0.00 7.62 4.20 0.00 4.20
Commitment charges 0.55 0.00 0.55 0.56 0.00 0.56 Subtotal (D) 8.17 0.00 8.17 4.76 0.00 4.76
Project Cost Total (A+B+C+D) 142.86 100.00 42.86 71.12 50.20 20.92 Sources: RRP for appraisal estimates; completion information from ADB Mainframe Database (ADB share) and IPMU (for counterpart contribution) and ADB estimates. 4. Project schedule Item Appraisal Estimate Actual Date of contract with consultants June 2012 23 September 2015 Civil works contract Date of award October 2011 20 March 2013 Completion of work October 2013 23 January 2018 Equipment and supplies Dates First procurement 2013 25 January 2017 Last procurement 2013 25 January 2017 Completion of equipment installation Q1 2015 24 June 2018 Start of operations Completion of tests and commissioning Q1 2015 24 January 2018 Beginning of start-up Q1 2015 25 January 2018
vi
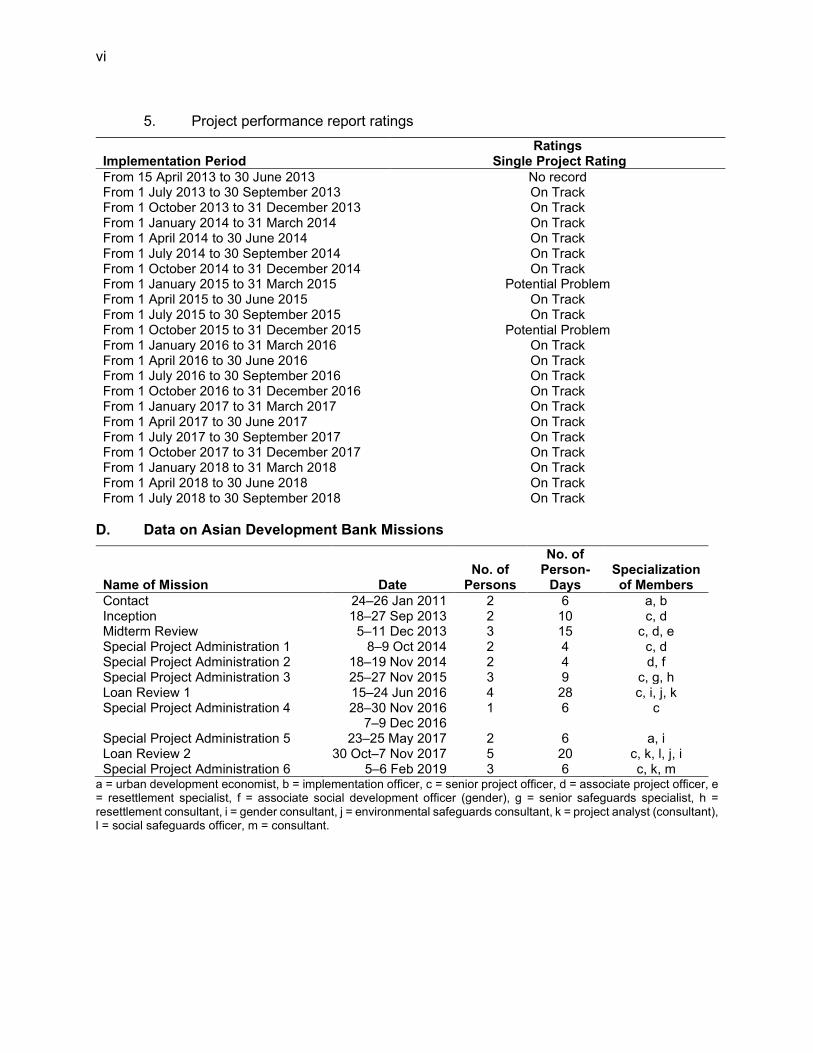
5. Project performance report ratings
Implementation Period Ratings
Single Project Rating From 15 April 2013 to 30 June 2013 No record From 1 July 2013 to 30 September 2013 On Track From 1 October 2013 to 31 December 2013 On Track From 1 January 2014 to 31 March 2014 On Track From 1 April 2014 to 30 June 2014 On Track From 1 July 2014 to 30 September 2014 On Track From 1 October 2014 to 31 December 2014 On Track From 1 January 2015 to 31 March 2015 Potential Problem From 1 April 2015 to 30 June 2015 On Track From 1 July 2015 to 30 September 2015 On Track From 1 October 2015 to 31 December 2015 Potential Problem From 1 January 2016 to 31 March 2016 On Track From 1 April 2016 to 30 June 2016 On Track From 1 July 2016 to 30 September 2016 On Track From 1 October 2016 to 31 December 2016 On Track From 1 January 2017 to 31 March 2017 On Track From 1 April 2017 to 30 June 2017 On Track From 1 July 2017 to 30 September 2017 On Track From 1 October 2017 to 31 December 2017 On Track From 1 January 2018 to 31 March 2018 On Track From 1 April 2018 to 30 June 2018 On Track From 1 July 2018 to 30 September 2018 On Track
D. Data on Asian Development Bank Missions
Name of Mission Date No. of
Persons
No. of Person-
Days Specialization of Members
Contact 24–26 Jan 2011 2 6 a, b Inception 18–27 Sep 2013 2 10 c, d Midterm Review 5–11 Dec 2013 3 15 c, d, e Special Project Administration 1 8–9 Oct 2014 2 4 c, d Special Project Administration 2 18–19 Nov 2014 2 4 d, f Special Project Administration 3 25–27 Nov 2015 3 9 c, g, h Loan Review 1 15–24 Jun 2016 4 28 c, i, j, k Special Project Administration 4 28–30 Nov 2016
7–9 Dec 2016 1 6 c
Special Project Administration 5 23–25 May 2017 2 6 a, i Loan Review 2 30 Oct–7 Nov 2017 5 20 c, k, l, j, i Special Project Administration 6 5–6 Feb 2019 3 6 c, k, m
a = urban development economist, b = implementation officer, c = senior project officer, d = associate project officer, e = resettlement specialist, f = associate social development officer (gender), g = senior safeguards specialist, h = resettlement consultant, i = gender consultant, j = environmental safeguards consultant, k = project analyst (consultant), l = social safeguards officer, m = consultant.
I. PROJECT DESCRIPTION A. The Program 1. The state of Uttarakhand located in the northern part of India is characterized by hilly terrain and high forest coverage. At appraisal, the urban centers of Uttarakhand were growing and playing an increasingly important role in the state’s economic transformation, but infrastructure and services remained inadequate. 2. On 24 January 2008, the Asian Development Bank (ADB) approved the Uttarakhand Urban Sector Development Investment Program (UUSDIP) as a multitranche financing facility (MFF) with an estimated program cost of $500 million, consisting of a loan of $350 million and the Government of India’s contribution of $150 million. 1 The program’s expected impact was improved quality of life for urban residents in Uttarakhand’s selected 31 towns and outcomes of (i) increased access to better quality and sustainable urban infrastructure and services with about 3.8 million people expected to be living in the selected towns by 2016; and (ii) improved governance, management, and finance resulting in sustainable service delivery. 3. The MFF was approved with an initial plan of having four tranches over a period of 8 years (2008‒2016). Tranche 1 targeted water supply and sewerage interventions in three urban local bodies (ULB) and tranche 2 in six ULBs. Tranches 3 and 4 were targeted to cover the remaining 25 ULBs for urban infrastructure and services including water supply, sanitation, solid waste management (SWM), slum upgrading and urban roads and transport. However, the MFF was closed after only two tranches (project 1 and project 2) were approved. Tranches 3 and 4 were not processed because of the slow implementation of projects 1 and 2. With one extension from 25 January 2016 to 23 January 2018, the MFF, together with projects 1 and 2, was closed on 23 January 2018, and their financial closure was done on 9 August 2018. B. Project 2 4. Project 2 was designed to provide improved urban services in five towns, i.e., support to two towns (Dehradun and Nainital) selected under project 1, and finance new investment in three towns (Haldwani, Ramnagar, and Roorkee). Project 2 under the MFF with a project loan of $100 million, was approved on 3 November 2011, legal agreement signed on 31 January 2013, and declared effective on 15 April 2013. The original loan closing date of 31 December 2015 was extended once, and the project was closed on 23 January 2018, with financial closure on 9 August 2018.
II. DESIGN AND IMPLEMENTATION A. Project 2 and Facility Design and Formulation 5. UUSDIP and project 2 were relevant at appraisal because they were aligned with the government sector strategy that emphasized infrastructure development for inclusive and environmentally sustainable growth. This was also in line with the objectives of ADB’s country partnership strategy 2009–2012,2 and the country strategy and program update 2003–2006 which
1 ADB. 2008. Report and Recommendation of the President to the Board of Directors: Proposed Multitranche
Financing Facility to India for the Uttarakhand Urban Sector Development Investment Program. Manila. 2 ADB. 2003. Country Strategy and Program: India. 2003–2006. Manila; and ADB. 2009. Country Strategy and
Program: India. 2009–2012. Manila.
2
addressed poverty reduction primarily through support for infrastructure-led growth.3 The MFF and project 2 design were aligned with the Government of India’s inclusive 11th Five-Year Plan (2007–2012), which (i) highlighted urban infrastructure development as key to economic development; (ii) supported the reform agenda of the Jawaharlal Nehru National Urban Renewal Mission (JNNURM);4 and (iii) encouraged the objective of balanced and sustainable development by reducing spatial and economic disparities.5 6. The lessons from previous ADB urban sector projects in India were incorporated in the project design by (i) providing advance support to build capacities for project management and implementation; (ii) addressing the issue of strong coordination among agencies, which is required for complex urban development projects; (iii) supporting the involvement of stakeholders during project design and ensuring the sustainability and stakeholder ownership of project assets; (iv) phasing urban reforms in line with institutional capacities; and (v) familiarizing with ADB procedures through a bridging technical assistance at the initial design stage to avoid start-up delays in implementation. Project 2 incorporated lessons from project 1 to address contractor concerns about the level of rates and their lack of knowledge about bid preparation using the ADB standard bid documents. This entailed adopting the national level ‘Schedule of Rates’ and organizing pre-bid workshops to increase competitiveness and train contractors in preparing bids. Extensive public consultations were carried out and became critical elements of project design and identification of project interventions as well as implementation under project 2 and the MFF.6 The MFF and project 2 designs remained relevant at completion because they were aligned with pillars 2 and 3 of the country partnership strategy for India, 2018–2022;7 and ADB Strategy 2030, particularly the operational priorities of making cities more livable, and strengthening governance and institutional capacity. They were also aligned with the Government of Uttarakhand’s Uttarakhand Vision 2030.8 7. The choice of MFF modality for UUSDIP was appropriate at appraisal and completion given the long-term and sequenced support that was necessary for the state government to implement its urban development strategy, under the Uttarakhand Urban Sector Development Road Map. Physical investments and the capacity building component complemented the design of the facility. The MFF also allowed flexibility in investment decisions based on the needs and constraints of each city and provided adequate time for the selection and due diligence of the subprojects. The design and monitoring framework (DMF) was adequately prepared for the MFF, although it could have benefited from better administrative procedures for scope changes during implementation. The lack of such procedures has affected the assessment of results at program completion. The tranches were developed based on the geographic locations, which covered similar packages of outputs delivered in different quantities in different target towns. Given the implementation delays in projects 1 and 2, tranches 3 and 4 were not processed (para. 3). The DMF for project 2 was also adequately prepared and results chain was logical. The targets, however, could have benefited from midterm adjustments during implementation (Appendix 1A). A gender action plan (GAP) was prepared for project 2 and gender indicators were aptly included in the DMF.
3 ADB. 2003. Country Strategy and Program Update. India. 2004–2006. Manila. 4 Government of India launched JNNURM in 2005, a reform linked urban infrastructure financing program, and
Government of Uttarakhand signed a memorandum of understanding in May 2007 to participate in the program. 5 Government of India, Planning Commission. 2008. Eleventh Five-Year Plan, 2007–12. New Delhi. 6 Footnote 1, para. 7 7 ADB. 2017. Country Partnership Strategy: India, 2018–2022—Accelerating Inclusive Economic Transformation.
Manila. 8 Government of Uttarakhand. Department of Planning. 2018. Uttarakhand Vision 2030. Delhi: Chauhan Offsets.
3
B. Project 2 and Facility Outputs 8. Out of 12 output targets under project 2, five were achieved, three partially achieved, and four not achieved. As for the MFF, out of the 20 output targets indicated in the DMF, five were achieved, two was substantially achieved, one partially achieved, and 12 were not achieved. The achievements are summarized in paras. 9‒19 and detailed in Appendixes 1A and 1B.
1. Project 2 Outputs 9. Output 1.1: Water supply infrastructure rehabilitated and constructed in Dehradun, Nainital, Haldwani, Ramnagar, and Roorkee. By project completion, the outputs were: (i) 33,462 household connections (6,316 in Nainital, 19,331 in Roorkee, and 7,815 in Ramnagar) and 7,064 household meters in Nainital, not achieving the target of 160,000 metered piped household connections; (ii) construction of three water treatment plants (WTPs) (two in Dehradun and one in Ramnagar). and rehabilitation of one WTP in Dehradun, with a cumulative capacity of 67.5 million liters per day (mld), achieving the target of 4 WTPs with a total treatment capacity of 54 mld; 9 and (iii) installation of 457.41 km of pipes (100.13 km in Dehradun, 70 km in Nainital, 201.97 km in Roorkee, 10.80 km in Haldwani and 74.51 km in Ramnagar), partially achieving the target of laying 780 km of pipes. Although not included in the DMF, project 2 also constructed: (i) 14 new pump houses (6 in Dehradun, and 8 in Roorkee); (ii) 14 tube wells (6 in Dehradun and 8 in Roorkee); (iii) 22 overhead tanks (3 in Ramnagar, 3 in Roorkee, and 16 in Haldwani); (iv) 3 ground/underground level service reservoirs (2 in Ramnagar, and 1 in Haldwani); and (v) procurement and installation of 109 bulk water electromagnetic fields meters (54 in Dehradun and 55 in Nainital). 10. Output 1.2: Sewerage infrastructure rehabilitated and constructed in Roorkee and designed for Ramnagar. The outputs were: (i) construction of a 33 mld sewage treatment plant (STP) in Roorkee, achieving the target of a 28 mld STP; and (ii) installation of 86.2 km of sewer lines, partially achieving the target of 120 km. With 22,535 new sewer household connections in Roorkee, the target of 26,000 was substantially achieved using the resources of the government.10 In addition, project 2 constructed two sewage pumping stations with 32.2 mld and 12.5 mld capacity in Roorkee, which were not indicated in the project 2 DMF. 11. Output 2: Performance of water supply operations improved in Nainital. The outputs achieved by project completion were: (i) 100% of customers were billed for water supply services in Nainital, achieving the target; and (ii) water supply operation and maintenance (O&M) staff increased from 25 to 102, including 7 female staff, substantially achieving the target of increasing O&M staff to 75 (of which 25% are women). However, since a nonrevenue water (NRW) assessment was not carried out, the target of NRW at less than 20% was considered as not achieved. The government is currently conducting an NRW assessment in Dehradun and plans to expand it to other ULBs including Nainital. 12. Output 3: Investment program management unit (IPMU) and investment project implementation unit’s (IPIU) subproject management capacity and transparency strengthened. Actual contract awards were below 80% for 2014, 2015, and 2017, while the disbursement target was achieved only in 2014, partially achieving the target. Project information and audit reports were regularly published on the project website, except for the audited project
9 New water treatment plants (WTPs) are: (i) Dehradun Purkul-15 mld; (ii) Dehradun Dilaram-7.5 mld; (iii) Ramnagar-
11 mld; rehabilitated WTPs are: (i) Dehradun, Shahanshahi-14 mld; and (ii) Dehradun, Dilaram-20 mld. 10 An additional 650 connections are expected by December 2021, and 7,500 connections by June 2022.
4
financial statements (APFS) for FY2019, which were submitted during the preparation of the project completion report (PCR), partially achieving the target. After a long delay, the APFS for FY2018 and FY2019 were submitted to ADB in an acceptable format on 14 July 2021. These APFS are now disclosed on the project website. A total of 919 staff from the IPMU, PIPUs, and ULBs, including 515 women participants (56%) have been trained on ADB policies and procedures, water supply and sanitation operations, and water conservation best practices, exceeding the target of training 10 IPMU and 18 IPIU staff.
2. MFF Outputs
13. At MFF appraisal, the DMF was designed based on the initial project scope, which consisted of four tranches. However, the MFF was closed together with projects 1 and 2 because of significant delays in the two projects. No memo for a scope change was processed to officially drop tranches 3 and 4, and their associated activities and targeted outputs, which led to negative results in the evaluation of output achievements.
a. Part A: Improved Urban Infrastructure and Services 14. Output 1: Implemented investment program for water supply. All output indicators were achieved except for the expansion of the distribution system with overhead tanks in 14 other towns. By the time of MFF closure, water supply optimization outputs of combined projects 1 and 2 were: (i) 62 pump houses rehabilitated and 34 new pump houses constructed; (ii) 3 WTPs constructed and 1 WTP rehabilitated in Dehradun with a total of 67.5 mld treatment capacity, which included water testing labs and facilities in all WTPs; (iii) 651.08 km of water pipe networks constructed; (iv) 58,962 household water connections installed and 7,064 water meters in Nainital; (v) 2 softening plants constructed and 3 chlorinators installed in Dehradun; (vi) 18 tube wells constructed; and (vii) 22 overhead tanks constructed. In addition to the indicated outputs and targets in the MFF DMF, UUSDIP achieved the following: (i) construction of 25 ground level or underground service reservoirs; (ii) construction of a weir in Dehradun; (iii) procurement of 109 bulk water electromagnetic fields meters; and (iv) procurement of 7 silent mobile generator sets. It is worth noting that the government provided 196,664 household water connections11 (169,913 connections using its own resources, and 26,751 connections through the Atal Mission for Rejuvenation and Urban Transformation scheme).12 This shows the government’s commitment to providing the full benefits of the constructed water supply systems to people in the project ULBs. The detailed achievements are provided in Appendix 1B. 15. Output 2: Implemented investment program for sewerage system and sanitation. Out of the three targets, one was substantially achieved, one not achieved, and one partially achieved. By MFF closure, the outputs achieved were: (i) installation of 132.25 km of the sewer network in Dehradun, substantially achieving the target of 150 km; (ii) construction of a 68 mld STP in Dehradun, exceeding the target of a 67 mld STP; and (iii) construction of a 33 mld STP and 86.2 km of sewer pipes in Roorkee, thus, not achieving the target of sewerage systems in 17 other medium and small towns in Uttarakhand. No progress was made towards the targets for the Rudrapur sewerage system as tranches 3 and 4 were not processed.
11 74,240 connections were provided in Dehradun, 344 in Nainital, 18,656 in Roorkee, 42,413 in Haridwar, and 61,011
in Haldwani. 12 Atal Mission for Rejuvenation and Urban Transformation was launched in June 2015 to establish infrastructure that
could ensure adequate robust sewage networks and water supply for urban transformation by implementing urban revival projects.
5
16. Output 3: Implemented investment program in SWM. Out of four targets, one was achieved as a state-wide SWM policy and developed under the MFF. The policy has been approved and implemented. Three targets were not achieved as tranches 3 and 4 were not processed. 17. Output 4: Implemented investment program for roads and transportation. The target was not achieved. No activities were carried out under this output as tranches 3 and 4 were not processed. 18. Output 5: Implemented investment program in slum upgrading. Out of two targets, one was achieved as a state-wide slum development policy was developed under the MFF. The second target, which had two components, was partially achieved. The target for the construction of drains, roads, community toilets, and street lighting in slums was not achieved, but the target for water supply and sewerage systems was achieved. The MFF provided (i) water supply systems to 13 slums in Dehradun, 23 slums in Roorkee, 15 slums in Nainital, 8 slums in Ramnagar, and 22 slums in Haldwani; and (ii) sewerage systems to 21 slums in Dehradun and 18 slums in Roorkee, with 100% of the slums within the water supply and sewerage subprojects in all the ULBs covered.
b. Part B: Capacity Building and Investment Program Management 19. Output 6: Implemented assistance to support the attainment of the state government’s urban governance, finance, and service delivery improvement action plan. Out of nine targets, three targets were achieved, one partially achieved, and five not achieved.
(i) Targets achieved. (a) The Uttarakhand Public–Private Partnership Cell has been established through a memorandum of understanding between the Government of Uttarakhand and the Government of India, under which a private sector participation plan was formulated; (b) the O&M component was included in the STP contract package developed under the MFF; and (c) the STP contract package was a design-build-operate contract, which is a type of public–private partnership (PPP) contract, achieving the target for developing PPP packages for selected subprojects. The MFF carried out significant capacity building activities by providing training on project management, grievance redress, water supply and sanitation (WSS) management and other urban reform areas including revenue enhancement, accrual-based double-entry accounting, and transparent and smart governance to 1,516 personnel of ULBs and line agencies in six program ULBs, meeting the target.
(ii) Target partially achieved. Out of 18 urban functions, 14 were devolved to ULBs. (iii) Targets not achieved. These included (a) a detailed action plan as per Appendix
4 on WSS utility reforms; (b) a detailed action plan in accordance with the financial action plan; (c) a double-entry accrual-based accounting system and its manuals were not developed, even though relevant training was provided under the MFF; (d) detailed reform action plans for ULBs, water utilities, and revenue increase; and (e) geographic information system (GIS) and management information system (MIS). However, progress was made by the government towards achieving these output targets after the MFF closure, using funds from the government’s flagship programs and World Bank projects. Progress includes WSS utility reforms, such as WSS service level benchmarking and revenue and financial management measures; a detailed financial action plan for ULB reforms to improve revenue generation through user charges, property tax, overall financial management systems; a double-entry accrual-based accounting system and its accounting
6
manuals; a GIS and MIS to improve the operations and financial management of water utilities, and other municipal assets and services; and continuous capacity building programs to help personnel acquire new skills and knowledge in various urban reform areas.
C. Project 2 and Facility Costs and Financing 20. The estimated cost of project 2 at appraisal was $142.86 million, with an ADB loan of $100 million and government contribution of $42.86 million. With two partial cancellations of $20 million each, the ADB loan was reduced to $60 million. After considering the possible contract variations, devaluation of the Indian rupee and price escalations, the first $20 million was canceled in September 2016 to reflect project cost readjustments after contract variations.13 The second $20 million was canceled in August 2017 because of unsuccessful bidding for two major subcomponents: (i) the water supply distribution network in Dehradun; and (ii) the procurement and installation of water meters in Dehradun and Roorkee.14 At completion, the total project cost decreased to $71.12 million, with the ADB loan being reduced to $50.2 million and the government’s contribution to $20.92 million. This changed the ratio of the ADB loan to the government’s contribution slightly from 70:30 at appraisal to 71:29 at completion (Appendix 3). Despite the cost reduction, the project was able to achieve almost all its outcome indicators. 21. The estimated cost of the MFF at appraisal was $500 million, with an ADB loan of $350 million and government contribution of $150 million to be distributed in four tranches. Because of the significant delays in projects 1 and 2, the remaining tranches and associated scope and activities were dropped, which had an impact on the overall delivery of outputs under the MFF. The combined costs for projects 1 and 2 at appraisal were $228.6 million, with an ADB loan of $160 million and government contribution of $68.6 million. At completion, the total MFF cost was reduced to $149.3 million, with an ADB loan of $106.99 million and government contribution of $42.38 million. The ratio of the ADB loan to the government’s contribution changed slightly from 70:30 at appraisal to 72:28 at completion (Appendix 3). D. Project 2 and Facility Disbursements 22. At completion, project 2 had disbursed $50.2 million (50.2% of the loan amount at appraisal). Annual and cumulative disbursements of loan proceeds are in Appendix 4. Projected disbursements at the time of project effectiveness were realistic. However, actual disbursements were beset by implementation delays, which led to the extension of the loan closing date. The loan was finally closed in January 2018. During the first 4 years up to 2016, only 47% of disbursements were made because of several implementation issues, while 53% was disbursed during the final 2 years (2017 and 2018). The statement of expenditure procedure allowed up to $100,000 equivalent per individual payment, which was effectively used. The original MFF proposal of a $350 million loan was intended to be distributed in four tranches; however, significant implementation challenges led to delays (para. 23). As a result, only two tranches were implemented. The two partial loan cancellations from project 2 totaling $40 million (para. 20), with actual disbursement amounting to $50.2 million, while disbursement under project 1 was $56.8 million accounting for almost 95% of the loan amount. Thus, a total of $106.99 million (66.9% of the combined loan amount at appraisal) was disbursed under the MFF at completion.
13 ADB (India Resident Mission). 2016. Loan Cancellation Memorandum. 24 October (internal). 14 ADB (India Resident Mission). 2017. Loan Cancellation Memorandum. 4 September (internal). Bidding prices for
water meters were extremely high.
7
E. Project 2 and Facility Schedule 23. Project 2’s original loan closing date of 31 December 2015 was extended to 23 January 2018 to enable completion of delayed contracts. Overall time overrun in project implementation was 38.7% because of various challenges both within and outside the control of the project. Project-related issues included delays in decision-making caused by the frequent changes in leadership at the Urban Development Department (UDD) and the Uttarakhand Urban Sector Development Agency (UUSDA); insufficient resources and capacities of IPMU staff; delays in obtaining right-of-way clearances for laying pipes; long delays in site identification and land acquisition of an STP; various procurement related issues; and poor performance of civil work contractors. These issues all contributed to slow implementation. External factors included (i) the 2013 devastating floods and landslides; (ii) the ‘blanket ban’ issued by the National Green Tribunal to stop all pipe laying works in Uttarakhand; and (iii) another ban on mining that resulted in a severe shortage of building materials and hindered project implementation. Under project 2, all four contracts of the Roorkee sewerage subproject were still ongoing at the loan closing date. These ongoing works were subsequently completed in March 2019 using the government’s own resources. The provision of water supply and sewer house connections in the program ULBs was also still ongoing. 24. At appraisal, the MFF was designed with four tranches. Tentative schedules for the four tranches: (i) tranche 1 (Q3 2008–Q2 2012); (ii) tranche 2 (Q3 2009–Q2 2013); (iii) tranche 3 (Q1 2010–Q2 2014); and (iv) tranche 4 (Q3 2011–Q2 2016). As mentioned above, tranches 3 and 4 were not processed because of implementation delays in projects 1 and 2. The MFF resource availability period of 8 years, which should have ended on 25 January 2016, was extended until 23 January 2018 to complete the remaining works in project 2. F. Implementation Arrangements 25. The implementation arrangements for the MFF covering projects 1 and 2 were fairly consistent with the project design and sufficiently appropriate to achieve the envisaged outputs. To oversee implementation of project 2 and the MFF, two committees were established: (i) a high-level committee chaired by the Chief Secretary of the Government of Uttarakhand to provide policy guidance for overall implementation; and (ii) an executive committee, chaired by the Secretary of the UDD, to provide guidance on critical implementation challenges and undertake periodic reviews of project performance. The UDD was the executing agency. In April 2008, the UUSDA was established after being registered as a society and took the role of IPMU under the supervision of UDD. Under the original design, the IPIUs at Uttarakhand Pey Jal Nigam (UPJN) under the Department of Drinking Water and Sanitation would implement the water supply and sewerage components; and the IPIU at the Public Works Department would implement the transportation components. As the transportation components were planned under tranches 3 and 4, the involvement of the Public Works Department was limited. However, instead of setting up an IPIU at UPJN, UPJN staff were deputed to the project implementation units at the ULBs to ensure better implementation. 26. Town-level committees at the ULBs provided ground level feedback and coordination. They also functioned as a part of the grievance redress committees, which were chaired by ULB mayors and included a representative from a nongovernment organization (NGO). These committees benefited from a complaint receiving system that was put in place at each project ULB. The systems were supported by a community awareness and public participation NGO that was appointed by the government under the MFF. The IPMU and IPIUs were assisted by an investment program management consultant (IPMC), and two design and supervision consultants
8
(DSCs) in preparing the design documents, managing the tendering of contracts, and supervising construction works. The IPMU and DSCs carried out the training and capacity building activities. G. Technical Assistance 27. The government received technical assistance (TA) of $750,000, including $600,000 from the Technical Assistance Special Fund-others to strengthen project management and implementation capacity of state agencies, and to support a high level of project readiness.15 The TA was closed on 30 April 2009. The TA activities included (i) the development and appraisal of representative subprojects; (ii) the preparation of detailed feasibility studies and reports on social, economic, financial, and environmental due diligence of the selected subprojects, including poverty and social analysis to design specific interventions targeting the poor, vulnerable and women; (iii) the development of an urban policy and institutional reform agenda; and (iv) capacity building for sector institutions, ULBs, and WSS utility operators. H. Consultant Recruitment and Procurement 28. As indicated in the PCR for project 1, three consulting firms (one IPMC and two DSCs) were engaged under project 1 and they continued providing support for the implementation of project 2. 16 Under project 2, two third party validation agencies were engaged to carry out technical audits. In addition, after the contract closure of the IPMC and two DSCs, another DSC was recruited to provide support and monitor ongoing works in Dehradun and Roorkee. Thus, a total of three consultancy contracts were awarded under project 2. A total of six consulting firms were engaged under the MFF, in accordance with the ADB’s Guidelines on the Use of Consultants (2007, as amended from time to time), using the quality- and cost-based selection procedure. The planned recruitment of consultants for capacity building, solid waste segregation and management, and slum improvement was canceled at the government’s request. Instead, the government appointed an NGO for community awareness and public participation using its own fund. The NGO helped with grievance redress and other activities on GAP implementation (paras. 30‒31). The overall performance of the consultants under project 2 and the MFF was generally satisfactory. Details of the contract awards are provided in Appendix 5. 29. The procurement of civil works and goods contracts was carried out in accordance with ADB’s Procurement Guidelines (2007, as amended from time to time). International competitive bidding procedures were adopted for procuring goods contracts above $1 million and for civil works contracts above $40 million, and national competitive bidding procedures were used for contracts below the threshold. Out of the 13 major civil works contracts under project 2, seven were procured in 2013, two in 2014, and four in 2016. Out of five goods contract packages, one was procured in 2016 and two contracts each were procured in 2015 and 2018. The procurement processes for four sewerage contracts in Roorkee were delayed because of low bidder participation, and high bid prices, which led to slow implementation. A long termination process for the poor performing contractors for the Dehradun water supply network contributed to slow implementation. Insufficient time was allocated for rebidding resulting in the delay in completing the remaining pipelaying works. Overall, the performance of the contractors under both project 2 and the MFF is rated less than satisfactory. One equipment contract was awarded under project 2 and four goods contracts under MFF. Performance of all the goods suppliers is satisfactory.
15 ADB. 2005. TAR: IND 38272 – Technical Assistance to India for Preparing the Uttaranchal Urban Development
Project. Manila. The technical assistance included an ADB grant component of $600,000. 16 ADB. Forthcoming. Project completion report for India: Uttarakhand Urban Sector Development Investment Program
(Project 1). Manila.
9
I. Gender Equity 30. The project was categorized as effective gender mainstreaming (EGM). The gender mainstreaming approaches included the (i) incorporation of performance indicators and targets for gender equality and women’s empowerment in the DMF of project 2; and (ii) preparation and implementation of a GAP. The key elements of the GAP included (i) identifying the below poverty line (BPL) and female-headed households for targeting in the provision of subsidized water connections and water fee rates; (ii) preparation and implementation of a pro-vulnerability schedule of tariffs for water supply and sewerage; (iii) provision of concessionary individual water connections, water meters, and sewerage connections to BPL and female-headed households in project towns; (iv) training of poor women on the O&M of water supply and sewerage services; and (v) employment of women in the O&M of water supply, and in expert and junior/ or support positions in the management and implementation of the project. 31. UDD established adequate implementation, monitoring, and reporting arrangements for GAP implementation supported by IPMU and IPIU staff, and the IPMC and DSCs. Social and community development officers were mobilized for GAP implementation. A qualified NGO was also engaged to implement community activities under project 2. A gender focal point at the IPMU consistently monitored GAP implementation and submitted progress reports. ADB provided capacity development and technical support to the IPMU and IPIUs throughout the project. Most activities were implemented and systematically reported. Details of the achievements of the gender-related targets and implementation of the GAP are in para. 30 and Appendix 10. J. Safeguards
1. Environmental Safeguards
32. The MFF and project 2 were classified as category B for environment as per the ADB’s Safeguard Policy Statement, 2009. Six initial environmental examination reports and an environmental assessment and review framework were prepared during loan processing and disclosed on the ADB website. The MFF and project 2 both complied with the environmental regulations and implemented environmental management plans and monitoring with support from environmental professionals within the IPMU, consultants, and contractors. They also adhered to the environmental safeguards actions jointly prepared with ADB and UUSDA. All the semiannual environmental monitoring reports were submitted though sometimes delayed, and ADB followed up regularly to achieve compliance. The extent of public consultations and outreach activities for environmental safeguards was generally adequate during implementation. There were no major grievances or public protests on the environmental aspects of the subprojects. The grievances received at the construction sites were resolved through consultations with the complainants, minor design revisions, or work practice improvements. Overall, environmental safeguards compliance management is rated satisfactory. Environmental safeguards related covenants were complied with (Appendix 7). Details of the environmental assessment are in Appendix 11.
2. Social Safeguards 33. The MFF and project 2 were classified as category B for involuntary resettlement and C for indigenous peoples as per ADB’s safeguard policies.17 A resettlement framework and nine
17 For Project 1, the policies applicable are (i) ADB. 1995. Involuntary Resettlement. Manila; and (ii) ADB. 1998. The
Bank’s Policy on Indigenous Peoples. Manila. For Project 2, the policy applicable is ADB. 2009. Safeguards Policy Statement. Manila.
10
resettlement plans were prepared.18 During the implementation of project 2, resettlement impacts were avoided. However, 36 households suffered temporary income loss under the MFF (project 1). In addition to compensation for livelihood losses, the affected households received resettlement assistance. The objectives, as laid out in the resettlement framework and resettlement plans to avoid and mitigate involuntary impacts and compensate those affected, were achieved. Information disclosure, participation, and consultation activities for the implementation of social safeguards were effectively carried out. The IPMU and IPIUs formulated credible and effective grievance redress mechanisms through community mobilization officers, a toll-free number, and a free WhatsApp group.19 No indigenous peoples were impacted during the implementation of project 2 and the MFF. At completion, no grievance regarding social safeguards was pending. The UDD, as executing agency prepared and submitted to ADB ten social safeguards monitoring reports. Details of the social safeguard assessment are in Appendix 11, section B. Overall, involuntary resettlement and indigenous peoples safeguard compliance is assessed as satisfactory. K. Monitoring and Reporting 34. Under project 2, 45 out of 47 covenants were complied with, while two covenants were partly complied with as the APFS for each year from FY2014 to FY2019 was delayed. While the submission of APFS for FY2014 to FY2018 was delayed, they were mostly submitted within the acceptable grace period of 3 months.20 However, the original submission for FY2018 was rejected by ADB because of non-compliance with ADB’s financial reporting requirements. ADB communicated the deficiencies to UUSDA in a letter dated 13 September 2019. The corrections took a long time, and the preparation of the APFS for FY2019 was delayed because accounting staff at UUSDA was not familiar with the ADB requirements. After ADB provided guidance to the accounting team and held discussion with auditors in July 2021, the APFSs for both FYs were submitted on 15 July 2021. An analysis of the APFS submitted in various years revealed that UUSDA struggled to maintain separate project records and accounts. From FY2014 to FY2017, as UUSDA was also required to submit project 2 APFS, ADB continued to accept APFS submissions even though the project accounts and audit reports for projects 1 and 2 were combined. However, upon increased visibility and focus on financial management from both the Department of Economic Affairs and ADB, combined audit reports were no longer accepted. Consequently, FY2018 APFS was revised by UUSDA by strictly following terms of reference that ADB had rolled out country-wide and made applicable to audits of externally aided project for the entire India portfolio.21 35. Project 2 and the MFF had adequate monitoring and reporting arrangements for ensuring delivery of reports on the overall quarterly progress of the project, including those related to safeguards, GAP, and project completion. While the submission of these reports generally complied with the requirements, some were delayed. The counterpart funding for project 2 and the MFF was timely, but the financial management arrangements needed improvement. Issues that arose related to the preparation of separate audit statements and reconciliation of the statements for project 2 and the MFF, and to the issuance of the audit opinion and management
18 Four short resettlement plans were prepared under project 1 and five resettlement plans under project 2. 19 ADB. 2020. Corporate Evaluation: Effectiveness of the 2009 Safeguard Policy Statement. Manila. 20 Submission of the APFS was delayed for all FYs (i) less than 3 months for FY2014 to FY2018 (30.9 months for a
revised acceptable submission for FYE2018); and (ii) 18.5 months for FY2019. 21 Although a TOR, approved by the Comptroller and Auditor General (C&AG) of India in consultation with the
Department of Economic Affairs (DEA), was rolled out for all ADB assisted sovereign projects in August 2013, ADB enforced application of its financial reporting requirements through use of the approved TOR only from FY2018 onwards. DEA uploaded the TOR to its website https://dea.gov.in/sites/default/files/16-Audit-TOR_0.pdf.
11
response, were subsequently resolved. However, the timeliness and quality of the APFS remained an issue. Details of status of compliance with the loan and project covenants are in Appendix 7.
III. EVALUATION OF PERFORMANCE A. Relevance 36. Project 2 and the MFF are rated relevant, given (i) their alignment to the government’s development objectives, (ii) their consistency with ADB’s corporate, country, and sector strategies, (iii) the appropriateness of the modality, (iv) the extensive consultation with various stakeholders, (v) the generally adequate implementation arrangements, and (vi) the nonoverlapping of initiatives with other development partners. Project 2 and the MFF were aligned with the government’s successive five-year plans, the NITI Aayog’s Strategy for New India @7522 and the 12th Five-Year Plan, which prioritized inclusive urban services. 23 They were also consistent with ADB Strategy 2020 by tailoring infrastructure investments to complement the initiatives of both the government and the Government of Uttarakhand’s, and to stimulate market-led growth. At completion, they continue to be aligned with (i) ADB Strategy 2030, specifically, operational priority 4, with its focus on building livable cities and providing sustainable urban services; 24 (ii) ADB country partnership strategy for India’s infrastructure-led inclusive growth and poverty alleviation; and (iii) Government of Uttarakhand’s Uttarakhand Vision 2030 (para. 6). 37. The MFF modality allowed for long-term engagement and sequenced support for the Government of Uttarakhand’s urban development and reforms (para. 7). It also allowed flexibility in investment decisions. The scope of investments under the MFF was based on extensive consultations and reflected the priorities of all stakeholders (para. 6). Implementation arrangements were generally adequate, even though a few adjustments were needed to further enhance project implementation and supervision (paras. 25 and 26). ADB was the sole development partner providing support in the urban sector at the time of appraisal. Other development partners’ support came after the implementation of the MFF. While the DMF results chain for both project 2 and the MFF were logical, these could have benefited from midterm revisions to respond to the changes in the circumstances surrounding project implementation. B. Effectiveness 38. Project 2 is rated less than effective. Three out of four outcome targets were achieved, and one was not achieved. Out of 12 output targets, four targets were achieved, two substantially achieved, four partially achieved, and two not achieved. Project 2 improved (i) water supply infrastructure and operational sustainability in six ULBs exceeding the target of five ULBs; and (ii) sewerage infrastructure in one ULB against the planned two ULBs. Reductions in NRW could not be assessed as the NRW assessment was not undertaken, and so the target is considered as not achieved. The STPs in Dehradun and Roorkee met the effluent quality set by the government
22 Government of India, NITI Aayog. 2018. Strategy for New India @ 75. New Delhi. NITI Aayog is a policy think tank
of the Government of India, established with the aim of achieving sustainable development goals with cooperative federalism by fostering the involvement of state governments of India in the economic policy-making process using a bottom-up approach.
23 Government of India, Planning Commission. 2008. Eleventh Five-Year Plan, 2007–12. New Delhi; Government of India. 2013. Twelfth Five-Year Plan. New Delhi; NITI Aayog. 2017. India: Three-Year Action Agenda 2017-2018 to 2019-2020. New Delhi; NITI Aayog. 2018. Strategy_for_New_India @75. New Delhi.
24 ADB. 2018. Strategy 2030: Achieving a Prosperous, Inclusive, Resilient, and Sustainable Asia and the Pacific. Manila.
12
quality standards for 100% of the samples, achieving the target. Collection efficiency for water supply and sewerage combined for FY2019 by Uttarakhand Jay Sansthan (UJS), which is the nodal agency under DDWS for WSS O&M, was estimated at 80.4%, achieving the targets on both water and sewerage charge collections. Details of output targets are provided in paras. 9-12 and Appendix 1. 39. Under project 2, the achievement of the gender-related targets in the DMF and the implementation of the GAP were monitored and reported. Out of 13 activities, 11 (85%) were completed; and nine (82%) of the 11 quantitative targets in the DMF and GAP were achieved. Project 2 achieved substantial gender benefits for women and girls. Practical gender benefits were related to their improved access to piped water supply and sanitation services, and the technical skills developed by women in WSS O&M, which enhanced their access to better employment opportunities in the sector. The strategic gender benefit was the employment of women in support and management positions, which enabled them to participate in decision-making on the development of urban infrastructure. The project ensured that all eligible female staff participated in capacity building activities which created an enabling environment for gender equality within the sector. Active participation of women in awareness campaigns improved their knowledge on the prevailing WSS issues, benefits of household water connections, and conservation practices. The project also enhanced the capacities of government agencies and elected representatives in designing and managing gender-responsive and socially inclusive urban infrastructure, including O&M of WSS services. GAP implementation was rated successful (Appendix 10). The successes will be documented and shared to promote the replication of the project’s approaches to gender equality and women’s empowerment in the sector. 40. The MFF is also rated ineffective. Two out of four planned tranches were not processed; thus, only six ULBs out of the 31 planned under the MFF were covered. The project components for water supply and sewerage were implemented, but not the urban roads, SWM, and slum upgrading components. At the outcome level, out of eight targets, two were partially achieved, and six were not achieved. As for the 20 output targets, five were achieved, two substantially achieved, one partly achieved, and 12 not achieved. The MFF benefited 0.71 million people (100% of the population) living in the six program towns25 with access to improved water supply services (in terms of quality, quantity, regularity, and accessibility). However, this did not meet the target to supply over 135 liters per capita per day (lpcd) to 3.2 million people (83% of the population) in 31 towns. The average water supply in Dehradun and Haridwar is above 135 lpcd; 124 lpcd in Haldwani; 112 lpcd in Nainital and Ramnagar; and 109 lpcd in Roorkee, partially achieving the target. As there was no unaccounted for water (UFW) or NRW assessment carried out, the target on UFW reduction was not achieved. The MFF benefited 0.84 million people in two ULBs (Dehradun and Roorkee) through sewerage interventions, not achieving the target of 2.3 million people (60% of the population) in 31 ULBs. As the data on wastewater volume that has been discharged into storm drains was not available, the target of 60% reduction is considered as not achieved. 41. With regards to the other components, two targets were partially achieved, while the remainder were not achieved. Partially achieved were: (i) the target of providing 0.3 million people residing in 167 poverty pockets with basic urban services, as slum populations benefited from WSS infrastructure and services; and (ii) 14 out of 18 urban functions were devolved to ULBs. The following targets were not achieved: (i) since SWM and urban transport planned under tranches 3 and 4 were not processed under the MFF, the relevant targets were not achieved; (ii)
25 Government of India, Office of the Registrar General and Census Commissioner. 2011. Census of India, 2011. New
Delhi.
13
revenues from WSS increased but the Government of Uttarakhand’s gap funding is still required. Analysis showed that the 2020 tariff increase would lead to O&M cost recovery after 2021 [not considering the impacts of coronavirus disease (COVID-19)], but the recovery target has yet to be met; (iii) the migration to double-entry accounting systems is currently being tested, and upon successful completion of trial testing, it will be deployed to all ULBs; and (iv) UFW reduction was not assessed and the UJS operating ratio of 1.0 was not achieved, requiring the state government’s gap funding. Details of MFF outputs achievements are provided in paras. 13-19 and Appendix 1, Section B. 42. The MFF built the capacities of staff from the IPMU, IPIUs, ULBs, UPJN and UJS in a structured manner through a series of training programs and on-the-job learning. These complemented the training programs provided by the government to strengthen the implementation of the urban reform measures. The training programs equipped participants with the knowledge and skills related to municipal asset management, efficient WSS O&M and service management, and overall urban governance measures, including grievance redress and safeguard management mechanisms. Environment and social safeguards implementation for project 2 and the MFF was satisfactory including compliance, reporting, and monitoring. C. Efficiency 43. Project 2. Project 2 is rated efficient. The economic analysis has shown that five water supply subprojects in five project towns (Dehradun, Nainital, Haldwani, Ramnagar, and Roorkee) and one sewerage subproject in Roorkee are economically viable, with the calculated economic internal rate of return (EIRR) exceeding the economic opportunity cost of capital. The sensitivity analysis has demonstrated the robustness of these results, with all subprojects economically viable under most of the scenarios. The combined investment under project 2 is found to be economically viable with the EIRR (17.6%) exceeding the economic opportunity cost of capital (Appendix 8, section A). Compared with the economic analysis results for the water supply and sewerage subprojects during loan processing (2011), the EIRRs have increased for all six subprojects. This increase can be attributed mainly to the reduction in construction costs as well as the expedited implementation of the subprojects. The major cost reduction was in the Dehradun water supply subproject (₹488 million is reduced) and the major time reduction (through expedited implementation) was in the Haldwani water supply subproject (11.1% or 4 months ahead of schedule).26
44. MFF. The MFF is rated as efficient. Compared with the economic analysis results for the water supply and sewerage subprojects during loan processing, the EIRRs for project 1 subprojects generally decreased, whereas they increased for five subprojects of project 2, the exception being the Nainital water supply subproject (Appendix 8B). The main reasons for the lower EIRRs for project 1 subprojects were a substantial cost increase (54.8%) and time overrun (85.6%). For project 2 subprojects, the overall cost increase was about 6.7% and the time overrun was less (38.7%). Substantial cost reductions in the water supply subprojects in Dehradun and Haldwani coupled with the early completion of the water supply subprojects in Haldwani and Ramnagar, resulted in higher EIRRs (Appendix 8B).
26 39,500 house connections in the Dehradun water supply were not implemented under the project (of the target
connections of 65,000, only 25,500 connections were provided under the project). These were implemented with funding from other sources. The cost of the additional house connections from other sources (₹199.5 million) is included in the project cost during the period 2016-2018 for analysis.
14
D. Sustainability 45. Project 2. Project 2 is rated as likely sustainable, under the present arrangements that the capital cost of the ADB loan and the government contribution are passed on as a ‘grant’ to the operating entities in the project towns.27 As a result, the burden of loan repayment will be removed. In this context, sustainability can be based on the recovery of O&M costs along with possible partial capital cost recovery to meet the periodic replacement requirements. With this approach, all the subprojects except the Nainital water supply subproject will be sustainable for full O&M cost recovery. The revised tariff in 2020 helps to achieve full recovery for four of the water supply subprojects during 2020 and 2021. The Nainital water supply subproject, however, cannot cover the incremental O&M costs and will require government support. The financial unviability of the Roorkee sewerage subproject with a negative financial internal rate (FIRR) is mainly due to its cost overrun (38.7%) and time overrun (75%). However, this subproject is estimated to recover full O&M costs during operation. 46. During project processing, all the assets created by the project were planned to be transferred to project ULBs for operation. Therefore, the financial capacity of the ULBs to support the O&M of subprojects in the project towns was assessed at appraisal. However, the transfer to ULBs did not happen. Instead, UJS is currently operating the WSS assets created by the project.28 In UJS, under the ongoing system, all the revenues from the periodically revised tariff structure for water supply and sewerage are deposited to the Government of Uttarakhand budget, and in turn, the government provides the required O&M for all projects through budget allocations. Accordingly, the government is absorbing all the O&M deficits through budget provisions to ensure project sustainability. Analysis of UJS’s revenue account for O&M for 3 years (FY2018, FY2019, and FY2020) indicates that the government’s support for O&M ranged between ₹2,197 million in FY2018 and ₹1,146 million in FY2020. This government support for O&M for water supply and sewerage subprojects will further decline with the implementation of the tariff revision in 2020 as this is expected to increase revenue for UJS (Appendix 9A). Fiscal reforms and policies at state government and UJS levels, and innovative user charges at the UJS levels could be leveraged to strengthen urban services delivery and governance, including the subprojects created under project 2 of UUSDIP. 47. MFF. The MFF is rated likely sustainable. The analysis of the subprojects under projects 1 and 2 indicates that the Dehradun water supply is financially viable for full cost recovery of O&M and capital costs, with an FIRR that is more than the weighted average cost of capital. But Nainital water supply subproject is not viable because of its higher O&M costs as Nainital is in hilly terrain and consumes more power to operate, which has resulted in a net deficit during operation. The Roorkee sewerage subproject reflected a negative FIRR, but its O&M cost recovery is 100% with an operating ratio of less than 1.0 except for FY2020. All other subprojects under projects 1 and 2 including Dehradun sewerage, are sustainable with full O&M cost recovery along with partial capital cost recovery between 2020 and 2021 based on two conditions:29 (i) implementation of the required periodic tariff increases (assumed to be every 3 years); and (ii) improved the collection efficiency. Sustainability also assumes that UJS will receive the necessary funds from
27 UJS has been operating all water supply and sewerage projects in Uttarakhand from 2002. 28 "Uttarakhand Jal Sansthan" was constituted under Section 18 of the Principal Act, with jurisdiction throughout the
state of Uttarakhand on 26th August 2002, to plan, promote and execute schemes and operate water supply and sewerage.
29 Under partial capital cost recovery, full O&M recovery with the operating ratio less than one is achieved. However, the project FIRR is estimated at less than the weighted average cost of capital and so could not recover the full capital cost. Thus, only full O&M and partial capital cost recovery under this scenario is termed as ‘partial capital cost recovery’.
15
the government. At present, the government remains committed to providing any O&M gap funding. Such gap funding has been declining during the last 3 years and will continue to decrease with the implementation of tariff revision in 2020. As earlier mentioned, fiscal reforms and policies at both the state government and UJS levels, as well as innovative user charges at UJS, could be leveraged to strengthen urban services delivery and governance, including the subprojects under projects 1 and 2 (Appendix 9B). E. Development Impact 48. The development impact of project 2 is rated less than satisfactory. Out of four impact indicators, two were partially achieved and two were not achieved. Against a target of 31 ULBs, project 2 benefited (i) around 1.1 million people in five ULBs, including 0.15 million slum population, through increased access to better quality and sustainable water supply services, and (ii) 0.13 million people in one ULB through access to sanitation services. Project 2 increased the amount and service regularity of treated water to people in five ULBs; two ULBs received water supply ‘24 hours 7 days a week’ and three received around 12 hours per day, partially achieving the target. The project introduced a centralized sewerage system with an STP in Roorkee, benefiting the residents through an improved urban environment and better health, as wastewater is now being properly treated prior to discharge to surface water bodies. Using the government funds, in Roorkee, 5,600 household sewer connections were provided (40% of households) and another 7,500 connections will be provided by June 2022. As the SWM component was not included in project 2 or the MFF, no impact targets were achieved. O&M cost recovery was not achieved in 2016 as additional state government gap funding was provided, but it is likely to be achieved after 2021 (not considering the impacts of COVID-19). Project 2 has also contributed to reducing the standard of living deprivation indicator of the United Nation’s multidimensional poverty index in the project ULBs, particularly the drinking water deprivation indicator in five ULBs, with over 95% increase in households using an improved water supply in Dehradun and Nainital.30 49. The development impact of the MFF is rated less than satisfactory, as all three impact targets of the MFF were only partially achieved, and only six of the planned 31 program ULBs were covered. However, the MFF addressed the basic municipal services deprivation challenge of the poor and vulnerable groups while benefiting women, as interventions led to reduced time and efforts to collect water, which freed up time for other economic activities. The MFF improved the quality of life of 1.3 million people (100% of the population and including 83% slum population) living in six program ULBs through increased access to better quality and sustainable urban infrastructure and services. Cases of waterborne and sanitation related diseases seemed to be controlled as no drastic increase or decrease was observed in the six ULBs, despite the constant population increase.31 The MFF made a significant contribution towards the achievement of Sustainable Development Goal 6 with around 1.33 million people given access to safe drinking water and 0.71 million to improved sanitation services.32 Sanitation interventions contributed to improved public health; and reduced the burden of diseases, treatment costs, and associated economic losses. The MFF also helped to improve urban governance, including the development and management of urban infrastructure assets, and the training of staff in the IPMU, IPIUs, and
30 United Nations. 2019. Global Multidimensional Poverty Index 2019: Illuminating Inequalities. New York; and
Directorate of Economics and Statistics, Department of Planning, Government of Uttarakhand. 2017. Estimation of District Level Poverty in Uttarakhand. Dehradun.
31 Data on acute diarrheal disease, bacillary dysentery, viral hepatitis, and enteric fever in Dehradun, Nainital and Haridwar during 2015 and 2020 was provided through Integrated Disease Surveillance Program (IDSP), Government of Uttarakhand. All the case data in 2020 shows a drastic decrease in cases, which seems to be a temporary reduction resulting from the COVID-19 lock down and movement control in Uttarakhand.
32 United Nations Organization. Water and Sanitation
16
ULBs to enhance institutional capacities. Contributions of project 2 and the MFF to the ADB results framework are in Appendix 12. F. Performance of the Borrower and the Executing Agency 50. The performance of the borrower is rated satisfactory. The borrower, represented by the government’s Department of Economic Affairs, provided timely guidance and decisions to the Government of Uttarakhand, and held regular tripartite review meetings with ADB, the government, and the IPMU to resolve issues and monitor project progress. The overall performance of the executing and implementing agencies under project 2 and the MFF is rated satisfactory. The government provided support to the IPMU and IPIUs through timely counterpart funding throughout the project. However, implementation progressed slowly because of delays in finalizing implementation arrangements, the frequent transfers of officers in critical positions, and delays in civil works. Financial management performance was less than satisfactory, as audit shortcomings persisted over the years. Yet, the government and the IPMU exhibited good leadership in implementing state level reforms and continued their efforts to achieve urban reforms. The IPIUs’ engagement with communities has improved along with project implementation. Through capacity building and training, best construction management practices were adopted. Learning visits helped the IPMU staff to improve its capacity in project management over time, including safeguard compliance. The government has shown stronger ownership over time, as evidenced by its continuous expansion of the project using its own resources. Although the safeguards monitoring reports were initially submitted late, their submission became regular after the mobilization of the safeguards staff and persistent follow-up by ADB. G. Performance of Asian Development Bank 51. The performance of ADB under project 2 and the MFF is rated satisfactory. ADB undertook regular loan and project review missions, a midterm review mission, and special project administration missions to assess progress and advise on the resolution of outstanding issues. Monitoring, capacity building, and guidance by ADB throughout the project cycle helped define processes, address issues through time-bound actions and targets, and expedite project implementation. ADB supported study visits of the IPMU to other ADB-financed projects in India to learn more about business processes and re-engineering measures for effective project implementation. ADB ensured the project adhered to due processes and transparency in procurement, disbursement, and safeguards, while upholding integrity and ethical standards. Even though ADB did not carry out all the internal approvals for the changes in project scope and implementation arrangements in accordance with PAI. 5.02, ADB fully supported the government and the IPMU in project implementation. H. Overall Assessment 52. Project 2 is rated successful. It is rated relevant to the government’s overall development objectives and ADB’s strategy at appraisal, implementation, and completion; less than effective as three of the four outcome targets and only five of the 12 output targets were achieved; efficient as all subprojects are economically viable; and likely sustainable as O&M cost recovery is expected for all subprojects from FY2021 onwards. The MFF is rated less than successful. The MFF is rated relevant as it was in line with ADB’s and the government’s development objectives at appraisal, implementation, and completion, even though the implementation delay led to tranches 3 and 4 being dropped; ineffective as all the eight outcome targets were not achieved, and seven of the 20 planned outputs were achieved; efficient as all the subprojects are
17
economically viable; and likely sustainable given the expected O&M cost recovery for all subprojects from FY2021 onwards.
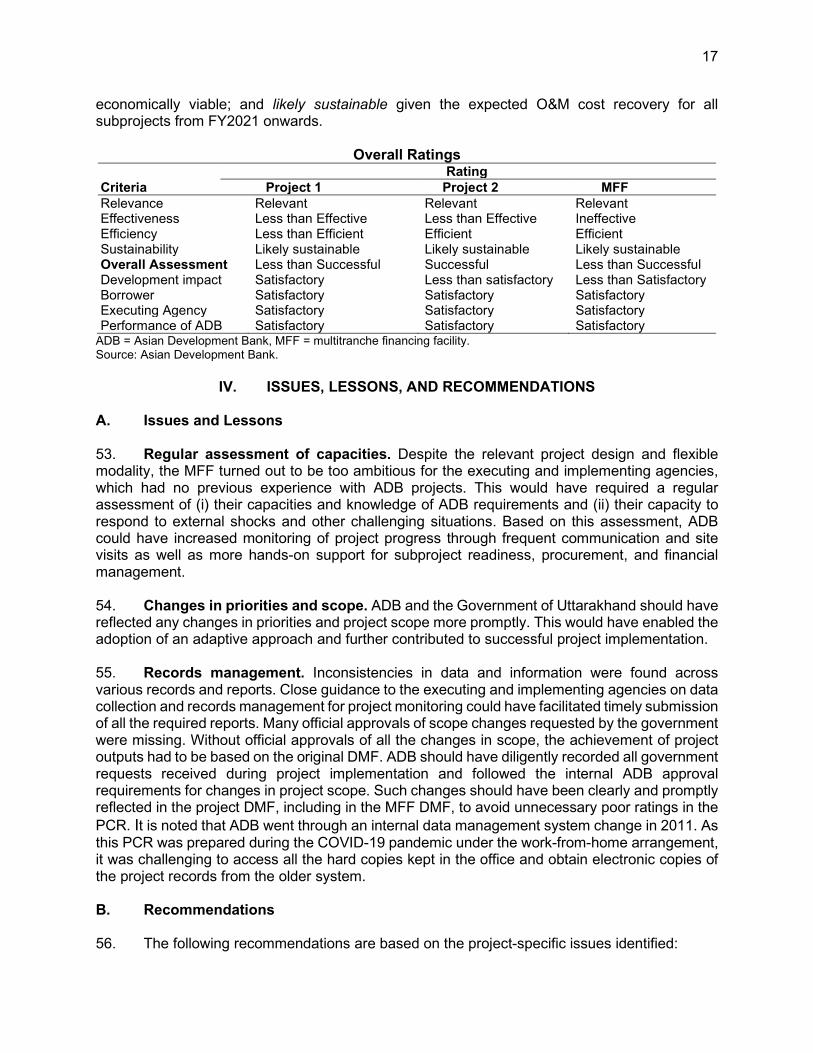
Overall Ratings
Criteria Rating
Project 1 Project 2 MFF Relevance Relevant Relevant Relevant Effectiveness Less than Effective Less than Effective Ineffective Efficiency Less than Efficient Efficient Efficient Sustainability Likely sustainable Likely sustainable Likely sustainable Overall Assessment Less than Successful Successful Less than Successful Development impact Satisfactory Less than satisfactory Less than Satisfactory Borrower Satisfactory Satisfactory Satisfactory Executing Agency Satisfactory Satisfactory Satisfactory Performance of ADB Satisfactory Satisfactory Satisfactory
ADB = Asian Development Bank, MFF = multitranche financing facility. Source: Asian Development Bank.
IV. ISSUES, LESSONS, AND RECOMMENDATIONS A. Issues and Lessons 53. Regular assessment of capacities. Despite the relevant project design and flexible modality, the MFF turned out to be too ambitious for the executing and implementing agencies, which had no previous experience with ADB projects. This would have required a regular assessment of (i) their capacities and knowledge of ADB requirements and (ii) their capacity to respond to external shocks and other challenging situations. Based on this assessment, ADB could have increased monitoring of project progress through frequent communication and site visits as well as more hands-on support for subproject readiness, procurement, and financial management. 54. Changes in priorities and scope. ADB and the Government of Uttarakhand should have reflected any changes in priorities and project scope more promptly. This would have enabled the adoption of an adaptive approach and further contributed to successful project implementation. 55. Records management. Inconsistencies in data and information were found across various records and reports. Close guidance to the executing and implementing agencies on data collection and records management for project monitoring could have facilitated timely submission of all the required reports. Many official approvals of scope changes requested by the government were missing. Without official approvals of all the changes in scope, the achievement of project outputs had to be based on the original DMF. ADB should have diligently recorded all government requests received during project implementation and followed the internal ADB approval requirements for changes in project scope. Such changes should have been clearly and promptly reflected in the project DMF, including in the MFF DMF, to avoid unnecessary poor ratings in the PCR. It is noted that ADB went through an internal data management system change in 2011. As this PCR was prepared during the COVID-19 pandemic under the work-from-home arrangement, it was challenging to access all the hard copies kept in the office and obtain electronic copies of the project records from the older system. B. Recommendations 56. The following recommendations are based on the project-specific issues identified:
18
(i) The project document and DMF should be well designed during loan processing to avoid unrealistic commitments and discrepancies in the processing documents.
(ii) Proper measures and methods should be adopted to assess (a) the technical performance of the WSS systems, such as NRW management; and (b) quality WSS service delivery like 24/7 water supply, response time for repairs, and other consumer complaints.
(iii) If any changes occur during implementation, ADB should strictly follow the internal approval procedure and carry out regular updates to the DMF for accurate measurement and evaluation of project performance.
(iv) Earlier and better preparation of detailed project reports for subprojects would help procurement and improve project readiness.
(v) Adequate trainings on ADB bidding procedures and requirements should be given to the executing and implementing agencies, prospective bidders, and contractors for smooth and timely procurement and project implementation.
(vi) Stakeholder communications should be enhanced, particularly for authorities that are involved in any stage of project implementation. For instance, the authorities that provide necessary clearances for project implementation should be closely consulted in advance to avoid any delay in implementation.
(vii) The project schedule should be regularly updated and closely monitored by the executing and implementing agencies.
(viii) Financial reporting should be carried out in accordance with the terms of reference templates (suitable for executing agencies following cash base accounting). Adequate budget provisioning for accounting and audit functions should be considered, which would help to streamline and strengthen these functions in the long run.
(ix) The ADB’s project implementation team should have a range of skills and expertise, including in technology, procurement, safeguards, and financial management. This would enable the team to provide active support to the executing and implementing agencies in resolving any issues during project implementation. Through close communication with ADB, the executing and implementing agencies should receive timely support and advice to comply with the project schedule and performance monitoring and reporting.
57. General recommendations for future projects are to ensure: (i) early finalization and streamlining of implementation arrangements for timely implementation; (ii) comprehensive risk assessment on procurement and contract management and robust mitigation planning; (iii) provision of adequate and regular hands-on support to ensure timely project implementation and full compliance with all the project covenants; (iv) enhancement of project document management through digital document management and use of ADB SharePoint; (v) project commitments are aligned with the unique local context; and (vi) budget provisioning for accounting and audit to streamline and strengthen these project functions.33 58. Timing of the project performance evaluation report. The project performance evaluation report should be prepared in 2022 to assess the sustainability of the MFF.
33 The engagement of a reputable firm of chartered accountants would strengthen accountability and the recourse
available to ADB in approaching the Institute of Chartered Accountants of India in the event of the poor quality of accounting and auditing functions.
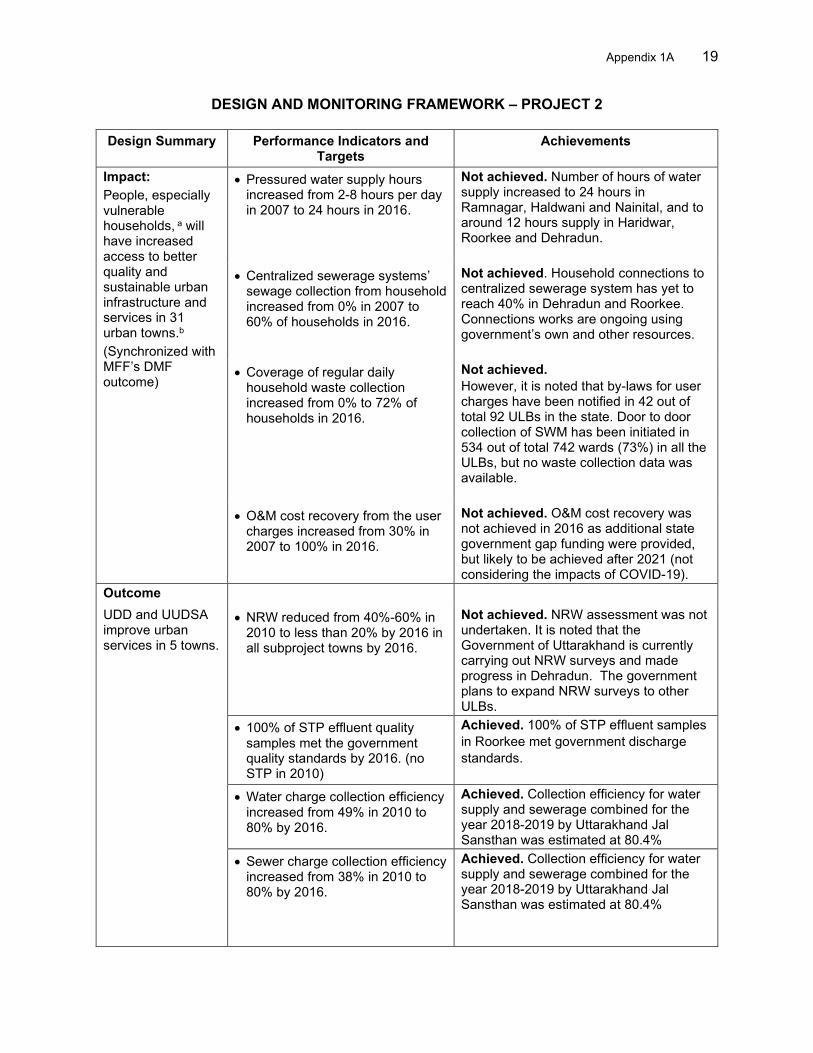
Appendix 1A 19
DESIGN AND MONITORING FRAMEWORK – PROJECT 2
Design Summary Performance Indicators and Targets
Achievements
Impact: People, especially vulnerable households, a will have increased access to better quality and sustainable urban infrastructure and services in 31 urban towns.b
(Synchronized with MFF’s DMF outcome)
• Pressured water supply hours increased from 2-8 hours per day in 2007 to 24 hours in 2016.
Not achieved. Number of hours of water supply increased to 24 hours in Ramnagar, Haldwani and Nainital, and to around 12 hours supply in Haridwar, Roorkee and Dehradun.
• Centralized sewerage systems’ sewage collection from household increased from 0% in 2007 to 60% of households in 2016.
Not achieved. Household connections to centralized sewerage system has yet to reach 40% in Dehradun and Roorkee. Connections works are ongoing using government’s own and other resources.
• Coverage of regular daily household waste collection increased from 0% to 72% of households in 2016.
Not achieved. However, it is noted that by-laws for user charges have been notified in 42 out of total 92 ULBs in the state. Door to door collection of SWM has been initiated in 534 out of total 742 wards (73%) in all the ULBs, but no waste collection data was available.
• O&M cost recovery from the user charges increased from 30% in 2007 to 100% in 2016.
Not achieved. O&M cost recovery was not achieved in 2016 as additional state government gap funding were provided, but likely to be achieved after 2021 (not considering the impacts of COVID-19).
Outcome UDD and UUDSA improve urban services in 5 towns.
• NRW reduced from 40%-60% in 2010 to less than 20% by 2016 in all subproject towns by 2016.
Not achieved. NRW assessment was not undertaken. It is noted that the Government of Uttarakhand is currently carrying out NRW surveys and made progress in Dehradun. The government plans to expand NRW surveys to other ULBs.
• 100% of STP effluent quality samples met the government quality standards by 2016. (no STP in 2010)
Achieved. 100% of STP effluent samples in Roorkee met government discharge standards.
• Water charge collection efficiency increased from 49% in 2010 to 80% by 2016.
Achieved. Collection efficiency for water supply and sewerage combined for the year 2018-2019 by Uttarakhand Jal Sansthan was estimated at 80.4%
• Sewer charge collection efficiency increased from 38% in 2010 to 80% by 2016.
Achieved. Collection efficiency for water supply and sewerage combined for the year 2018-2019 by Uttarakhand Jal Sansthan was estimated at 80.4%
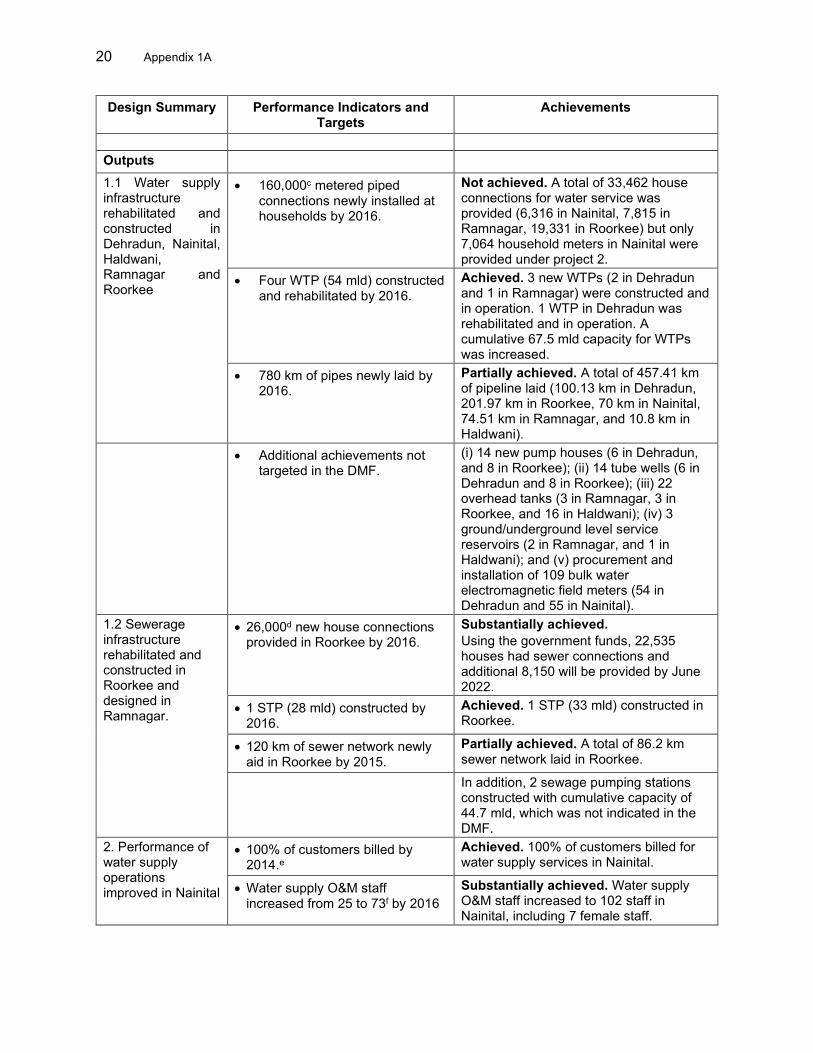
20 Appendix 1A
Design Summary Performance Indicators and Targets
Achievements
Outputs 1.1 Water supply infrastructure rehabilitated and constructed in Dehradun, Nainital, Haldwani, Ramnagar and Roorkee
• 160,000c metered piped connections newly installed at households by 2016.
Not achieved. A total of 33,462 house connections for water service was provided (6,316 in Nainital, 7,815 in Ramnagar, 19,331 in Roorkee) but only 7,064 household meters in Nainital were provided under project 2.
• Four WTP (54 mld) constructed and rehabilitated by 2016.
Achieved. 3 new WTPs (2 in Dehradun and 1 in Ramnagar) were constructed and in operation. 1 WTP in Dehradun was rehabilitated and in operation. A cumulative 67.5 mld capacity for WTPs was increased.
• 780 km of pipes newly laid by 2016.
Partially achieved. A total of 457.41 km of pipeline laid (100.13 km in Dehradun, 201.97 km in Roorkee, 70 km in Nainital, 74.51 km in Ramnagar, and 10.8 km in Haldwani).
• Additional achievements not targeted in the DMF.
(i) 14 new pump houses (6 in Dehradun, and 8 in Roorkee); (ii) 14 tube wells (6 in Dehradun and 8 in Roorkee); (iii) 22 overhead tanks (3 in Ramnagar, 3 in Roorkee, and 16 in Haldwani); (iv) 3 ground/underground level service reservoirs (2 in Ramnagar, and 1 in Haldwani); and (v) procurement and installation of 109 bulk water electromagnetic field meters (54 in Dehradun and 55 in Nainital).
1.2 Sewerage infrastructure rehabilitated and constructed in Roorkee and designed in Ramnagar.
• 26,000d new house connections provided in Roorkee by 2016.
Substantially achieved. Using the government funds, 22,535 houses had sewer connections and additional 8,150 will be provided by June 2022.
• 1 STP (28 mld) constructed by 2016.
Achieved. 1 STP (33 mld) constructed in Roorkee.
• 120 km of sewer network newly aid in Roorkee by 2015.
Partially achieved. A total of 86.2 km sewer network laid in Roorkee.
In addition, 2 sewage pumping stations constructed with cumulative capacity of 44.7 mld, which was not indicated in the DMF.
2. Performance of water supply operations improved in Nainital
• 100% of customers billed by 2014.e
Achieved. 100% of customers billed for water supply services in Nainital.
• Water supply O&M staff increased from 25 to 73f by 2016
Substantially achieved. Water supply O&M staff increased to 102 staff in Nainital, including 7 female staff.
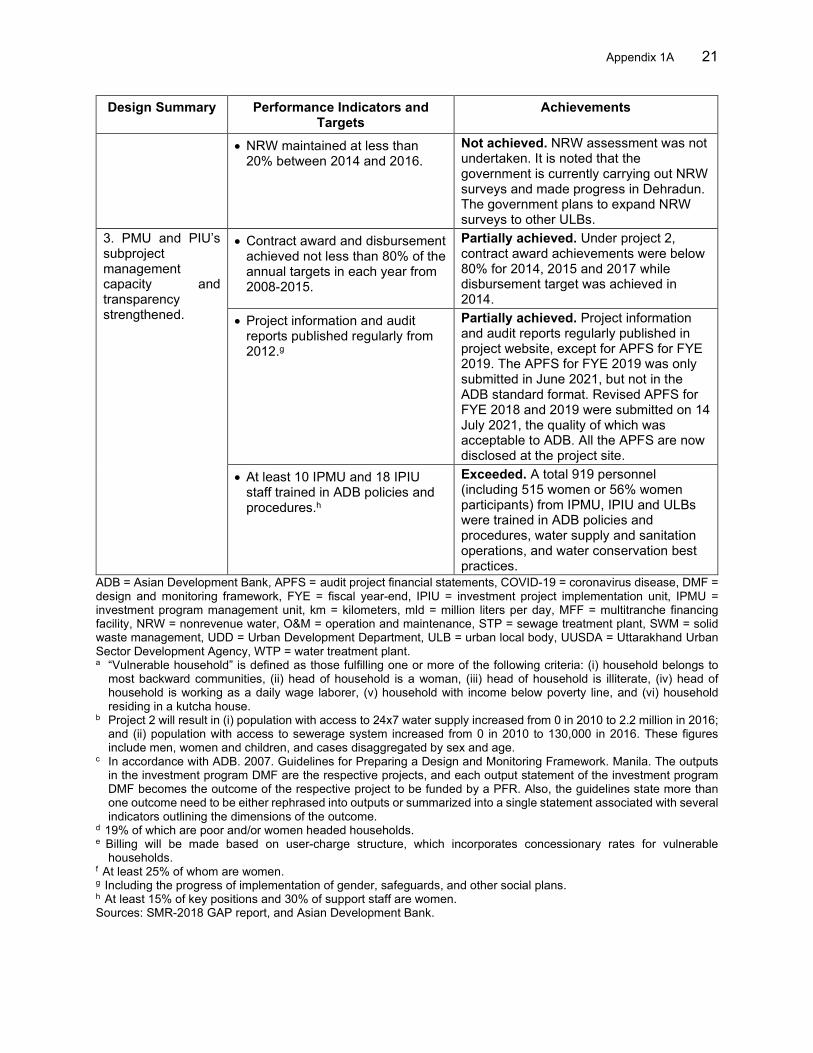
Appendix 1A 21
Design Summary Performance Indicators and Targets
Achievements
• NRW maintained at less than 20% between 2014 and 2016.
Not achieved. NRW assessment was not undertaken. It is noted that the government is currently carrying out NRW surveys and made progress in Dehradun. The government plans to expand NRW surveys to other ULBs.
3. PMU and PIU’s subproject management capacity and transparency strengthened.
• Contract award and disbursement achieved not less than 80% of the annual targets in each year from 2008-2015.
Partially achieved. Under project 2, contract award achievements were below 80% for 2014, 2015 and 2017 while disbursement target was achieved in 2014.
• Project information and audit reports published regularly from 2012.g
Partially achieved. Project information and audit reports regularly published in project website, except for APFS for FYE 2019. The APFS for FYE 2019 was only submitted in June 2021, but not in the ADB standard format. Revised APFS for FYE 2018 and 2019 were submitted on 14 July 2021, the quality of which was acceptable to ADB. All the APFS are now disclosed at the project site.
• At least 10 IPMU and 18 IPIU staff trained in ADB policies and procedures.h
Exceeded. A total 919 personnel (including 515 women or 56% women participants) from IPMU, IPIU and ULBs were trained in ADB policies and procedures, water supply and sanitation operations, and water conservation best practices.
ADB = Asian Development Bank, APFS = audit project financial statements, COVID-19 = coronavirus disease, DMF = design and monitoring framework, FYE = fiscal year-end, IPIU = investment project implementation unit, IPMU = investment program management unit, km = kilometers, mld = million liters per day, MFF = multitranche financing facility, NRW = nonrevenue water, O&M = operation and maintenance, STP = sewage treatment plant, SWM = solid waste management, UDD = Urban Development Department, ULB = urban local body, UUSDA = Uttarakhand Urban Sector Development Agency, WTP = water treatment plant. a “Vulnerable household” is defined as those fulfilling one or more of the following criteria: (i) household belongs to
most backward communities, (ii) head of household is a woman, (iii) head of household is illiterate, (iv) head of household is working as a daily wage laborer, (v) household with income below poverty line, and (vi) household residing in a kutcha house.
b Project 2 will result in (i) population with access to 24x7 water supply increased from 0 in 2010 to 2.2 million in 2016; and (ii) population with access to sewerage system increased from 0 in 2010 to 130,000 in 2016. These figures include men, women and children, and cases disaggregated by sex and age.
c In accordance with ADB. 2007. Guidelines for Preparing a Design and Monitoring Framework. Manila. The outputs in the investment program DMF are the respective projects, and each output statement of the investment program DMF becomes the outcome of the respective project to be funded by a PFR. Also, the guidelines state more than one outcome need to be either rephrased into outputs or summarized into a single statement associated with several indicators outlining the dimensions of the outcome.
d 19% of which are poor and/or women headed households. e Billing will be made based on user-charge structure, which incorporates concessionary rates for vulnerable
households. f At least 25% of whom are women. g Including the progress of implementation of gender, safeguards, and other social plans. h At least 15% of key positions and 30% of support staff are women. Sources: SMR-2018 GAP report, and Asian Development Bank.
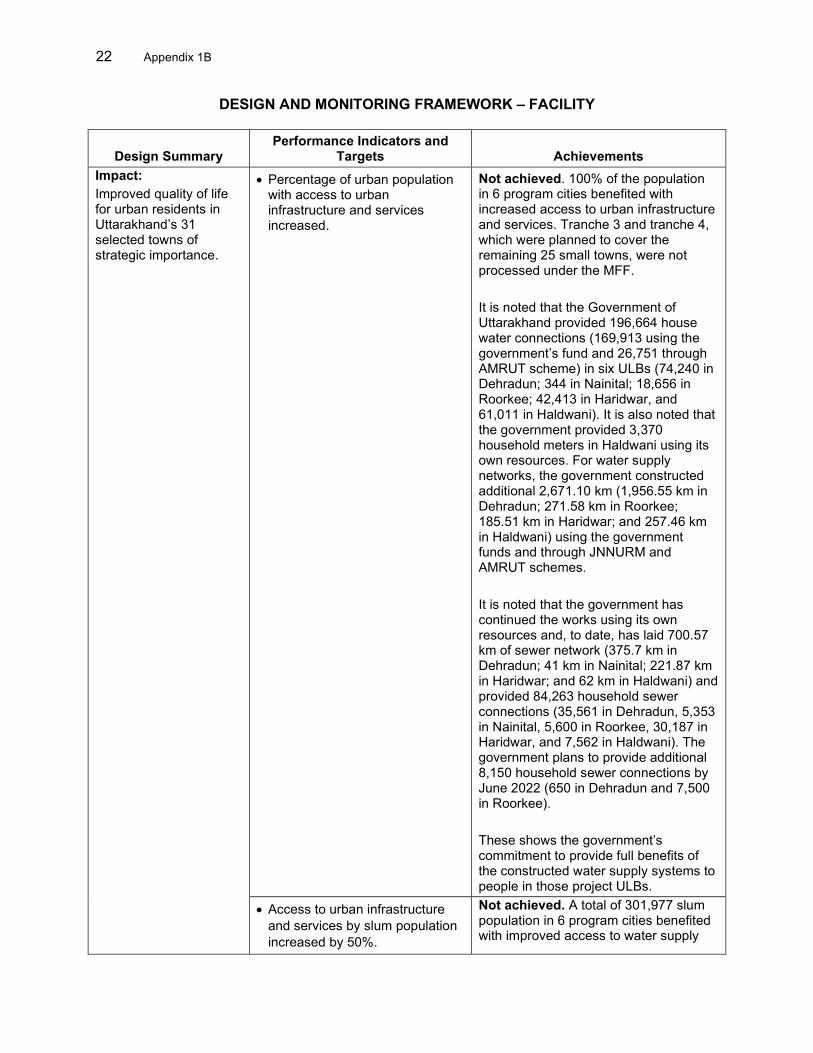
22 Appendix 1B
DESIGN AND MONITORING FRAMEWORK – FACILITY
Design Summary Performance Indicators and
Targets Achievements Impact: Improved quality of life for urban residents in Uttarakhand’s 31 selected towns of strategic importance.
• Percentage of urban population with access to urban infrastructure and services increased.
Not achieved. 100% of the population in 6 program cities benefited with increased access to urban infrastructure and services. Tranche 3 and tranche 4, which were planned to cover the remaining 25 small towns, were not processed under the MFF. It is noted that the Government of Uttarakhand provided 196,664 house water connections (169,913 using the government’s fund and 26,751 through AMRUT scheme) in six ULBs (74,240 in Dehradun; 344 in Nainital; 18,656 in Roorkee; 42,413 in Haridwar, and 61,011 in Haldwani). It is also noted that the government provided 3,370 household meters in Haldwani using its own resources. For water supply networks, the government constructed additional 2,671.10 km (1,956.55 km in Dehradun; 271.58 km in Roorkee; 185.51 km in Haridwar; and 257.46 km in Haldwani) using the government funds and through JNNURM and AMRUT schemes. It is noted that the government has continued the works using its own resources and, to date, has laid 700.57 km of sewer network (375.7 km in Dehradun; 41 km in Nainital; 221.87 km in Haridwar; and 62 km in Haldwani) and provided 84,263 household sewer connections (35,561 in Dehradun, 5,353 in Nainital, 5,600 in Roorkee, 30,187 in Haridwar, and 7,562 in Haldwani). The government plans to provide additional 8,150 household sewer connections by June 2022 (650 in Dehradun and 7,500 in Roorkee). These shows the government’s commitment to provide full benefits of the constructed water supply systems to people in those project ULBs.
• Access to urban infrastructure and services by slum population increased by 50%.
Not achieved. A total of 301,977 slum population in 6 program cities benefited with improved access to water supply
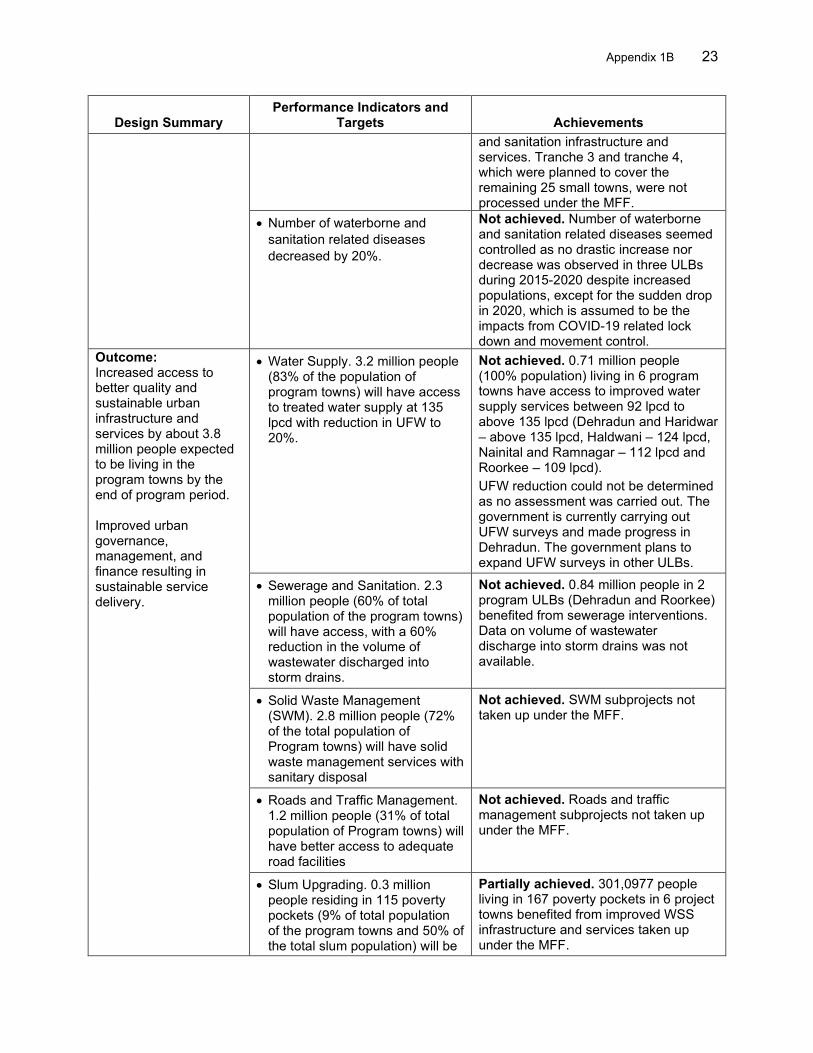
Appendix 1B 23
Design Summary Performance Indicators and
Targets Achievements and sanitation infrastructure and services. Tranche 3 and tranche 4, which were planned to cover the remaining 25 small towns, were not processed under the MFF.
• Number of waterborne and sanitation related diseases decreased by 20%.
Not achieved. Number of waterborne and sanitation related diseases seemed controlled as no drastic increase nor decrease was observed in three ULBs during 2015-2020 despite increased populations, except for the sudden drop in 2020, which is assumed to be the impacts from COVID-19 related lock down and movement control.
Outcome: Increased access to better quality and sustainable urban infrastructure and services by about 3.8 million people expected to be living in the program towns by the end of program period. Improved urban governance, management, and finance resulting in sustainable service delivery.
• Water Supply. 3.2 million people (83% of the population of program towns) will have access to treated water supply at 135 lpcd with reduction in UFW to 20%.
Not achieved. 0.71 million people (100% population) living in 6 program towns have access to improved water supply services between 92 lpcd to above 135 lpcd (Dehradun and Haridwar – above 135 lpcd, Haldwani – 124 lpcd, Nainital and Ramnagar – 112 lpcd and Roorkee – 109 lpcd). UFW reduction could not be determined as no assessment was carried out. The government is currently carrying out UFW surveys and made progress in Dehradun. The government plans to expand UFW surveys in other ULBs.
• Sewerage and Sanitation. 2.3 million people (60% of total population of the program towns) will have access, with a 60% reduction in the volume of wastewater discharged into storm drains.
Not achieved. 0.84 million people in 2 program ULBs (Dehradun and Roorkee) benefited from sewerage interventions. Data on volume of wastewater discharge into storm drains was not available.
• Solid Waste Management (SWM). 2.8 million people (72% of the total population of Program towns) will have solid waste management services with sanitary disposal
Not achieved. SWM subprojects not taken up under the MFF.
• Roads and Traffic Management. 1.2 million people (31% of total population of Program towns) will have better access to adequate road facilities
Not achieved. Roads and traffic management subprojects not taken up under the MFF.
• Slum Upgrading. 0.3 million people residing in 115 poverty pockets (9% of total population of the program towns and 50% of the total slum population) will be
Partially achieved. 301,0977 people living in 167 poverty pockets in 6 project towns benefited from improved WSS infrastructure and services taken up under the MFF.
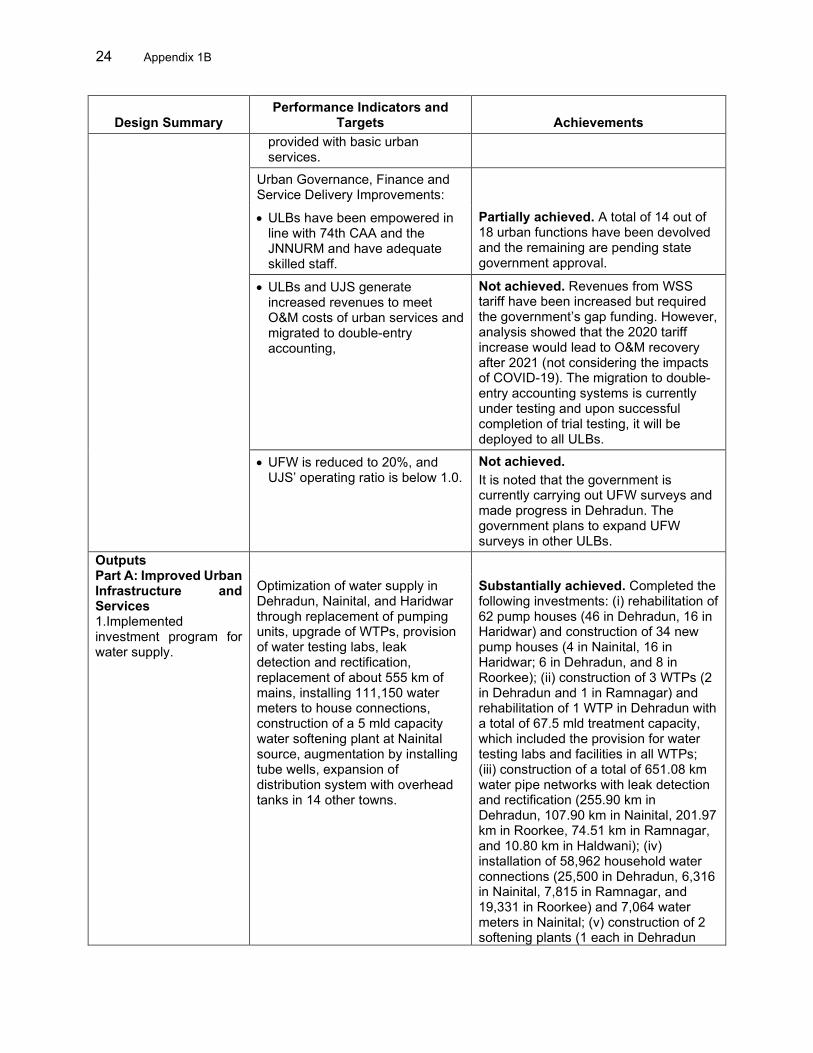
24 Appendix 1B
Design Summary Performance Indicators and
Targets Achievements provided with basic urban services.
Urban Governance, Finance and Service Delivery Improvements:
• ULBs have been empowered in line with 74th CAA and the JNNURM and have adequate skilled staff.
Partially achieved. A total of 14 out of 18 urban functions have been devolved and the remaining are pending state government approval.
• ULBs and UJS generate increased revenues to meet O&M costs of urban services and migrated to double-entry accounting,
Not achieved. Revenues from WSS tariff have been increased but required the government’s gap funding. However, analysis showed that the 2020 tariff increase would lead to O&M recovery after 2021 (not considering the impacts of COVID-19). The migration to double-entry accounting systems is currently under testing and upon successful completion of trial testing, it will be deployed to all ULBs.
• UFW is reduced to 20%, and UJS’ operating ratio is below 1.0.
Not achieved. It is noted that the government is currently carrying out UFW surveys and made progress in Dehradun. The government plans to expand UFW surveys in other ULBs.
Outputs Part A: Improved Urban Infrastructure and Services 1.Implemented investment program for water supply.
Optimization of water supply in Dehradun, Nainital, and Haridwar through replacement of pumping units, upgrade of WTPs, provision of water testing labs, leak detection and rectification, replacement of about 555 km of mains, installing 111,150 water meters to house connections, construction of a 5 mld capacity water softening plant at Nainital source, augmentation by installing tube wells, expansion of distribution system with overhead tanks in 14 other towns.
Substantially achieved. Completed the following investments: (i) rehabilitation of 62 pump houses (46 in Dehradun, 16 in Haridwar) and construction of 34 new pump houses (4 in Nainital, 16 in Haridwar; 6 in Dehradun, and 8 in Roorkee); (ii) construction of 3 WTPs (2 in Dehradun and 1 in Ramnagar) and rehabilitation of 1 WTP in Dehradun with a total of 67.5 mld treatment capacity, which included the provision for water testing labs and facilities in all WTPs; (iii) construction of a total of 651.08 km water pipe networks with leak detection and rectification (255.90 km in Dehradun, 107.90 km in Nainital, 201.97 km in Roorkee, 74.51 km in Ramnagar, and 10.80 km in Haldwani); (iv) installation of 58,962 household water connections (25,500 in Dehradun, 6,316 in Nainital, 7,815 in Ramnagar, and 19,331 in Roorkee) and 7,064 water meters in Nainital; (v) construction of 2 softening plants (1 each in Dehradun
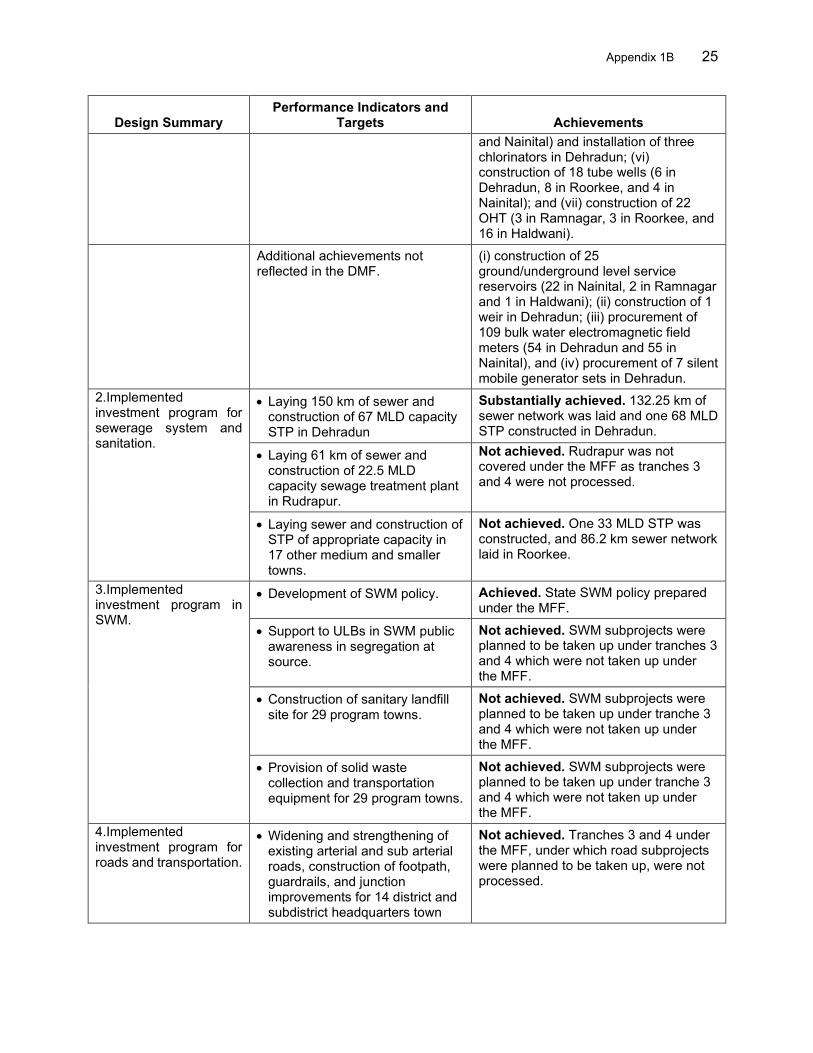
Appendix 1B 25
Design Summary Performance Indicators and
Targets Achievements and Nainital) and installation of three chlorinators in Dehradun; (vi) construction of 18 tube wells (6 in Dehradun, 8 in Roorkee, and 4 in Nainital); and (vii) construction of 22 OHT (3 in Ramnagar, 3 in Roorkee, and 16 in Haldwani).
Additional achievements not reflected in the DMF.
(i) construction of 25 ground/underground level service reservoirs (22 in Nainital, 2 in Ramnagar and 1 in Haldwani); (ii) construction of 1 weir in Dehradun; (iii) procurement of 109 bulk water electromagnetic field meters (54 in Dehradun and 55 in Nainital), and (iv) procurement of 7 silent mobile generator sets in Dehradun.
2.Implemented investment program for sewerage system and sanitation.
• Laying 150 km of sewer and construction of 67 MLD capacity STP in Dehradun
Substantially achieved. 132.25 km of sewer network was laid and one 68 MLD STP constructed in Dehradun.
• Laying 61 km of sewer and construction of 22.5 MLD capacity sewage treatment plant in Rudrapur.
Not achieved. Rudrapur was not covered under the MFF as tranches 3 and 4 were not processed.
• Laying sewer and construction of STP of appropriate capacity in 17 other medium and smaller towns.
Not achieved. One 33 MLD STP was constructed, and 86.2 km sewer network laid in Roorkee.
3.Implemented investment program in SWM.
• Development of SWM policy. Achieved. State SWM policy prepared under the MFF.
• Support to ULBs in SWM public awareness in segregation at source.
Not achieved. SWM subprojects were planned to be taken up under tranches 3 and 4 which were not taken up under the MFF.
• Construction of sanitary landfill site for 29 program towns.
Not achieved. SWM subprojects were planned to be taken up under tranche 3 and 4 which were not taken up under the MFF.
• Provision of solid waste collection and transportation equipment for 29 program towns.
Not achieved. SWM subprojects were planned to be taken up under tranche 3 and 4 which were not taken up under the MFF.
4.Implemented investment program for roads and transportation.
• Widening and strengthening of existing arterial and sub arterial roads, construction of footpath, guardrails, and junction improvements for 14 district and subdistrict headquarters town
Not achieved. Tranches 3 and 4 under the MFF, under which road subprojects were planned to be taken up, were not processed.
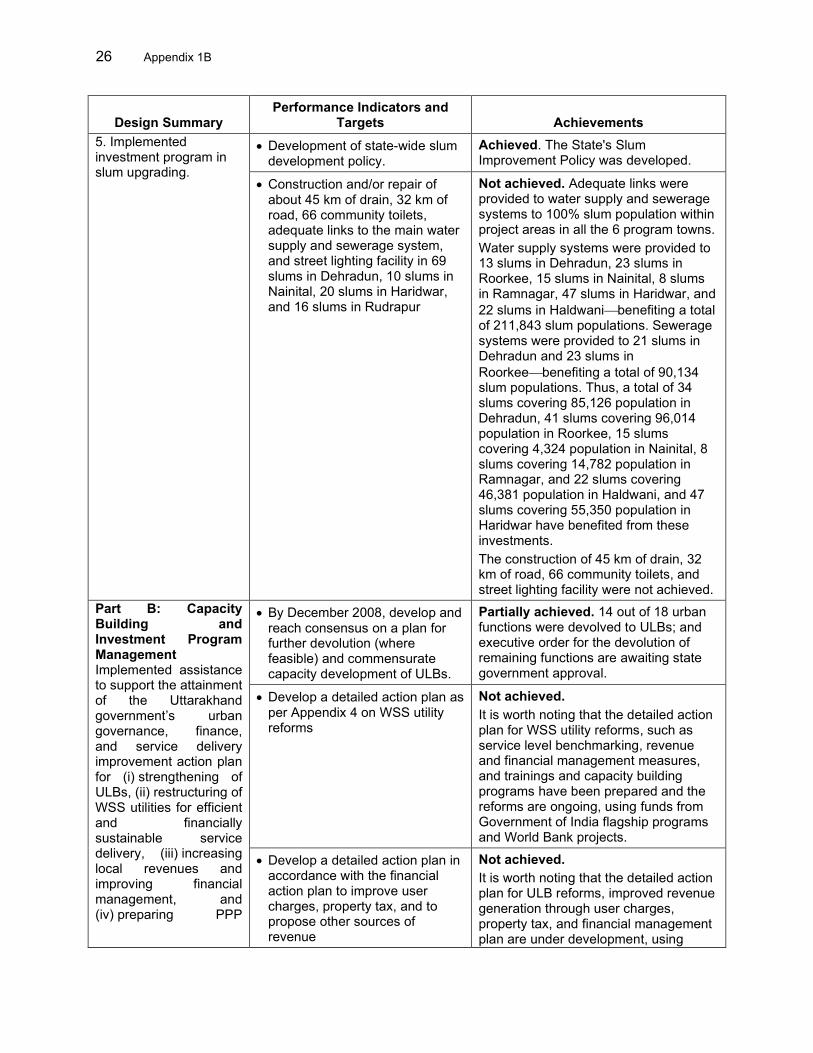
26 Appendix 1B
Design Summary Performance Indicators and
Targets Achievements 5. Implemented investment program in slum upgrading.
• Development of state-wide slum development policy.
Achieved. The State's Slum Improvement Policy was developed.
• Construction and/or repair of about 45 km of drain, 32 km of road, 66 community toilets, adequate links to the main water supply and sewerage system, and street lighting facility in 69 slums in Dehradun, 10 slums in Nainital, 20 slums in Haridwar, and 16 slums in Rudrapur
Not achieved. Adequate links were provided to water supply and sewerage systems to 100% slum population within project areas in all the 6 program towns. Water supply systems were provided to 13 slums in Dehradun, 23 slums in Roorkee, 15 slums in Nainital, 8 slums in Ramnagar, 47 slums in Haridwar, and 22 slums in Haldwanibenefiting a total of 211,843 slum populations. Sewerage systems were provided to 21 slums in Dehradun and 23 slums in Roorkeebenefiting a total of 90,134 slum populations. Thus, a total of 34 slums covering 85,126 population in Dehradun, 41 slums covering 96,014 population in Roorkee, 15 slums covering 4,324 population in Nainital, 8 slums covering 14,782 population in Ramnagar, and 22 slums covering 46,381 population in Haldwani, and 47 slums covering 55,350 population in Haridwar have benefited from these investments. The construction of 45 km of drain, 32 km of road, 66 community toilets, and street lighting facility were not achieved.
Part B: Capacity Building and Investment Program Management Implemented assistance to support the attainment of the Uttarakhand government’s urban governance, finance, and service delivery improvement action plan for (i) strengthening of ULBs, (ii) restructuring of WSS utilities for efficient and financially sustainable service delivery, (iii) increasing local revenues and improving financial management, and (iv) preparing PPP
• By December 2008, develop and reach consensus on a plan for further devolution (where feasible) and commensurate capacity development of ULBs.
Partially achieved. 14 out of 18 urban functions were devolved to ULBs; and executive order for the devolution of remaining functions are awaiting state government approval.
• Develop a detailed action plan as per Appendix 4 on WSS utility reforms
Not achieved. It is worth noting that the detailed action plan for WSS utility reforms, such as service level benchmarking, revenue and financial management measures, and trainings and capacity building programs have been prepared and the reforms are ongoing, using funds from Government of India flagship programs and World Bank projects.
• Develop a detailed action plan in accordance with the financial action plan to improve user charges, property tax, and to propose other sources of revenue
Not achieved. It is worth noting that the detailed action plan for ULB reforms, improved revenue generation through user charges, property tax, and financial management plan are under development, using
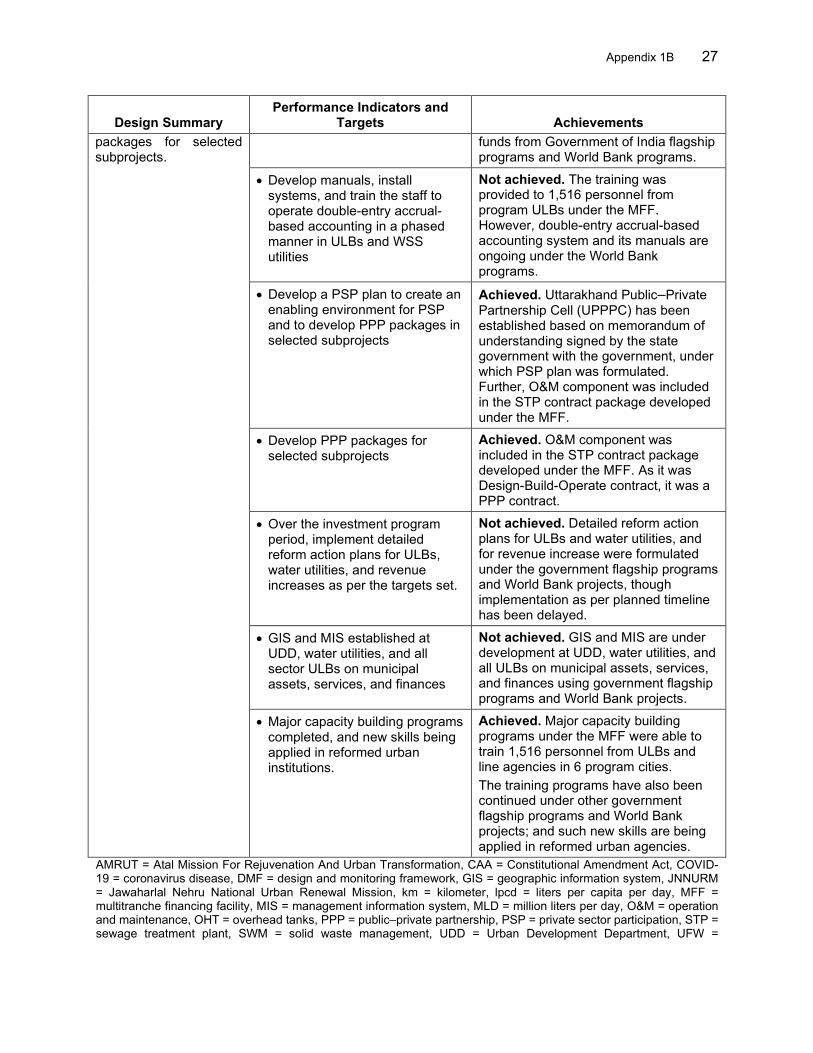
Appendix 1B 27
Design Summary Performance Indicators and
Targets Achievements packages for selected subprojects.
funds from Government of India flagship programs and World Bank programs.
• Develop manuals, install systems, and train the staff to operate double-entry accrual-based accounting in a phased manner in ULBs and WSS utilities
Not achieved. The training was provided to 1,516 personnel from program ULBs under the MFF. However, double-entry accrual-based accounting system and its manuals are ongoing under the World Bank programs.
• Develop a PSP plan to create an enabling environment for PSP and to develop PPP packages in selected subprojects
Achieved. Uttarakhand Public–Private Partnership Cell (UPPPC) has been established based on memorandum of understanding signed by the state government with the government, under which PSP plan was formulated. Further, O&M component was included in the STP contract package developed under the MFF.
• Develop PPP packages for selected subprojects
Achieved. O&M component was included in the STP contract package developed under the MFF. As it was Design-Build-Operate contract, it was a PPP contract.
• Over the investment program period, implement detailed reform action plans for ULBs, water utilities, and revenue increases as per the targets set.
Not achieved. Detailed reform action plans for ULBs and water utilities, and for revenue increase were formulated under the government flagship programs and World Bank projects, though implementation as per planned timeline has been delayed.
• GIS and MIS established at UDD, water utilities, and all sector ULBs on municipal assets, services, and finances
Not achieved. GIS and MIS are under development at UDD, water utilities, and all ULBs on municipal assets, services, and finances using government flagship programs and World Bank projects.
• Major capacity building programs completed, and new skills being applied in reformed urban institutions.
Achieved. Major capacity building programs under the MFF were able to train 1,516 personnel from ULBs and line agencies in 6 program cities. The training programs have also been continued under other government flagship programs and World Bank projects; and such new skills are being applied in reformed urban agencies.
AMRUT = Atal Mission For Rejuvenation And Urban Transformation, CAA = Constitutional Amendment Act, COVID-19 = coronavirus disease, DMF = design and monitoring framework, GIS = geographic information system, JNNURM = Jawaharlal Nehru National Urban Renewal Mission, km = kilometer, lpcd = liters per capita per day, MFF = multitranche financing facility, MIS = management information system, MLD = million liters per day, O&M = operation and maintenance, OHT = overhead tanks, PPP = public–private partnership, PSP = private sector participation, STP = sewage treatment plant, SWM = solid waste management, UDD = Urban Development Department, UFW =

28 Appendix 1B
unaccounted for water, UJS = Uttarakhand Jal Sansthan, ULB = urban local body, UPPC = Uttarakhand Public–Private Partnership Cell, WSS = water supply and sanitation, WTP = water treatment plant. Source: Asian Development Bank.
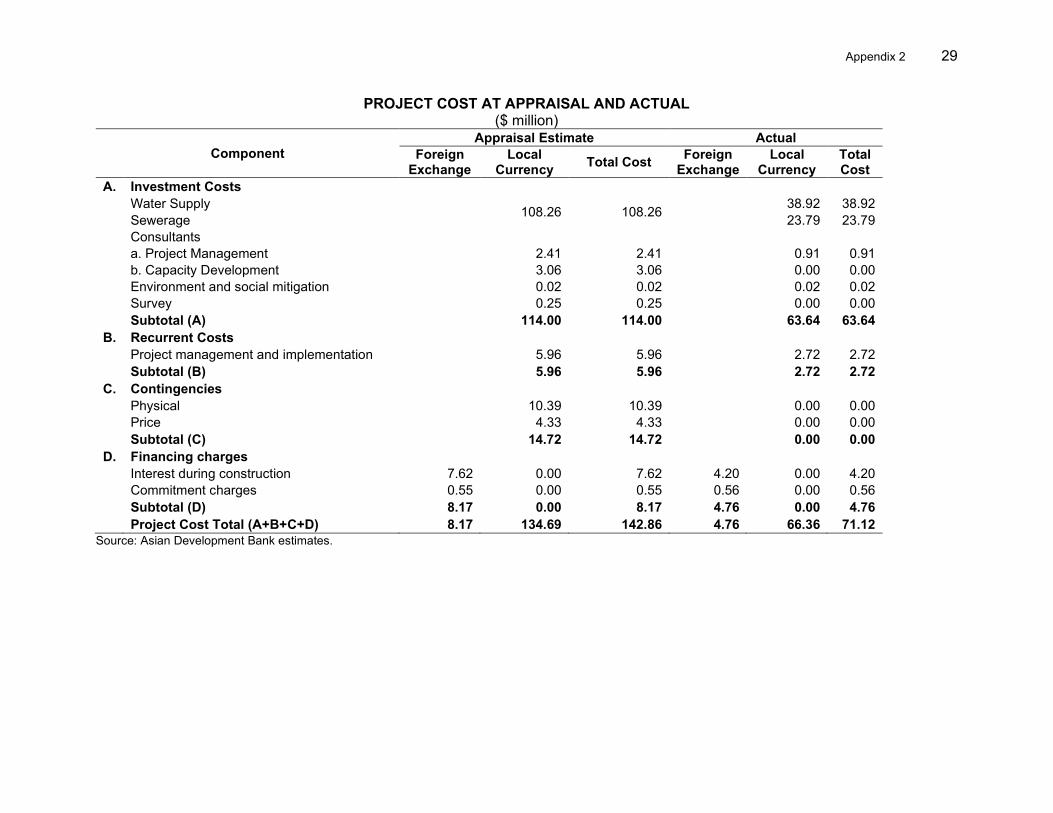
Appendix 2 29
PROJECT COST AT APPRAISAL AND ACTUAL ($ million)
Component Appraisal Estimate Actual
Foreign Exchange
Local Currency Total Cost Foreign
Exchange Local
Currency Total Cost
A. Investment Costs Water Supply 108.26 108.26 38.92 38.92
Sewerage 23.79 23.79 Consultants a. Project Management 2.41 2.41 0.91 0.91 b. Capacity Development 3.06 3.06 0.00 0.00 Environment and social mitigation 0.02 0.02 0.02 0.02 Survey 0.25 0.25 0.00 0.00 Subtotal (A) 114.00 114.00 63.64 63.64
B. Recurrent Costs Project management and implementation 5.96 5.96 2.72 2.72
Subtotal (B) 5.96 5.96 2.72 2.72 C. Contingencies Physical 10.39 10.39 0.00 0.00
Price 4.33 4.33 0.00 0.00 Subtotal (C) 14.72 14.72 0.00 0.00
D. Financing charges Interest during construction 7.62 0.00 7.62 4.20 0.00 4.20
Commitment charges 0.55 0.00 0.55 0.56 0.00 0.56 Subtotal (D) 8.17 0.00 8.17 4.76 0.00 4.76
Project Cost Total (A+B+C+D) 8.17 134.69 142.86 4.76 66.36 71.12 Source: Asian Development Bank estimates.
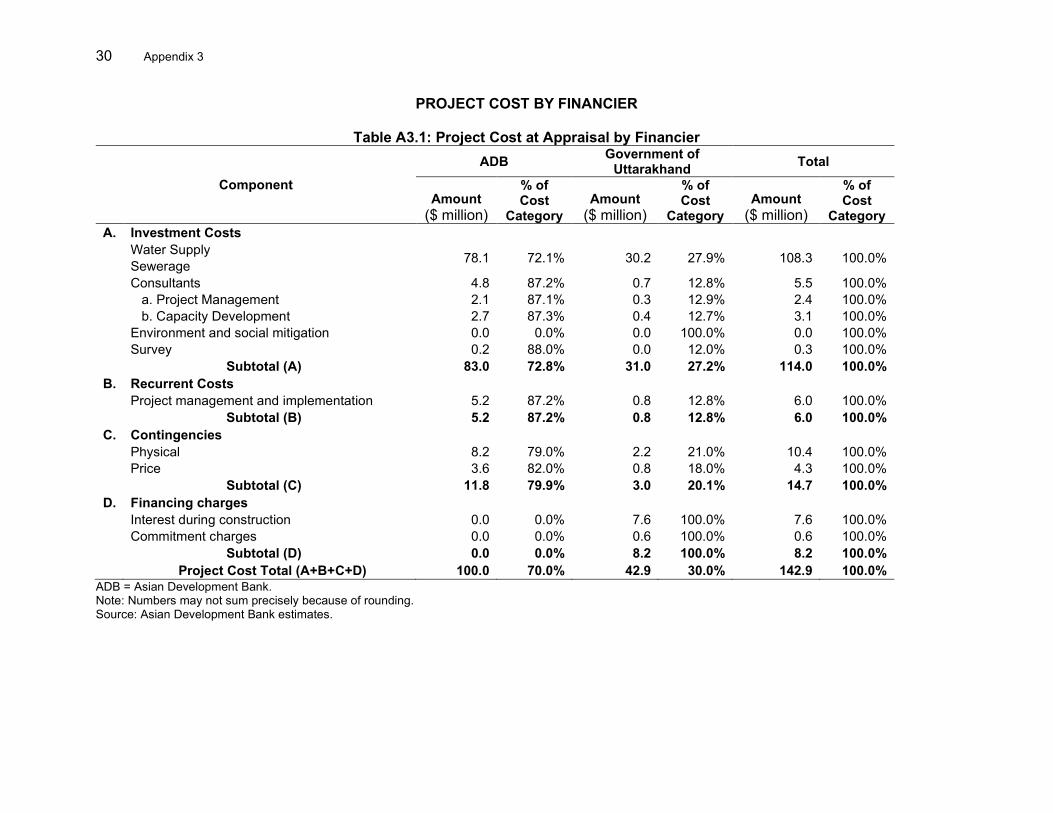
30 Appendix 3
PROJECT COST BY FINANCIER
Table A3.1: Project Cost at Appraisal by Financier
Component ADB Government of
Uttarakhand Total
Amount ($ million)
% of Cost
Category Amount
($ million)
% of Cost
Category Amount
($ million)
% of Cost
Category A. Investment Costs Water Supply 78.1 72.1% 30.2 27.9% 108.3 100.0% Sewerage Consultants 4.8 87.2% 0.7 12.8% 5.5 100.0%
a. Project Management 2.1 87.1% 0.3 12.9% 2.4 100.0% b. Capacity Development 2.7 87.3% 0.4 12.7% 3.1 100.0% Environment and social mitigation 0.0 0.0% 0.0 100.0% 0.0 100.0% Survey 0.2 88.0% 0.0 12.0% 0.3 100.0% Subtotal (A) 83.0 72.8% 31.0 27.2% 114.0 100.0%
B. Recurrent Costs Project management and implementation 5.2 87.2% 0.8 12.8% 6.0 100.0%
Subtotal (B) 5.2 87.2% 0.8 12.8% 6.0 100.0% C. Contingencies Physical 8.2 79.0% 2.2 21.0% 10.4 100.0%
Price 3.6 82.0% 0.8 18.0% 4.3 100.0% Subtotal (C) 11.8 79.9% 3.0 20.1% 14.7 100.0%
D. Financing charges Interest during construction 0.0 0.0% 7.6 100.0% 7.6 100.0%
Commitment charges 0.0 0.0% 0.6 100.0% 0.6 100.0% Subtotal (D) 0.0 0.0% 8.2 100.0% 8.2 100.0%
Project Cost Total (A+B+C+D) 100.0 70.0% 42.9 30.0% 142.9 100.0% ADB = Asian Development Bank. Note: Numbers may not sum precisely because of rounding. Source: Asian Development Bank estimates.
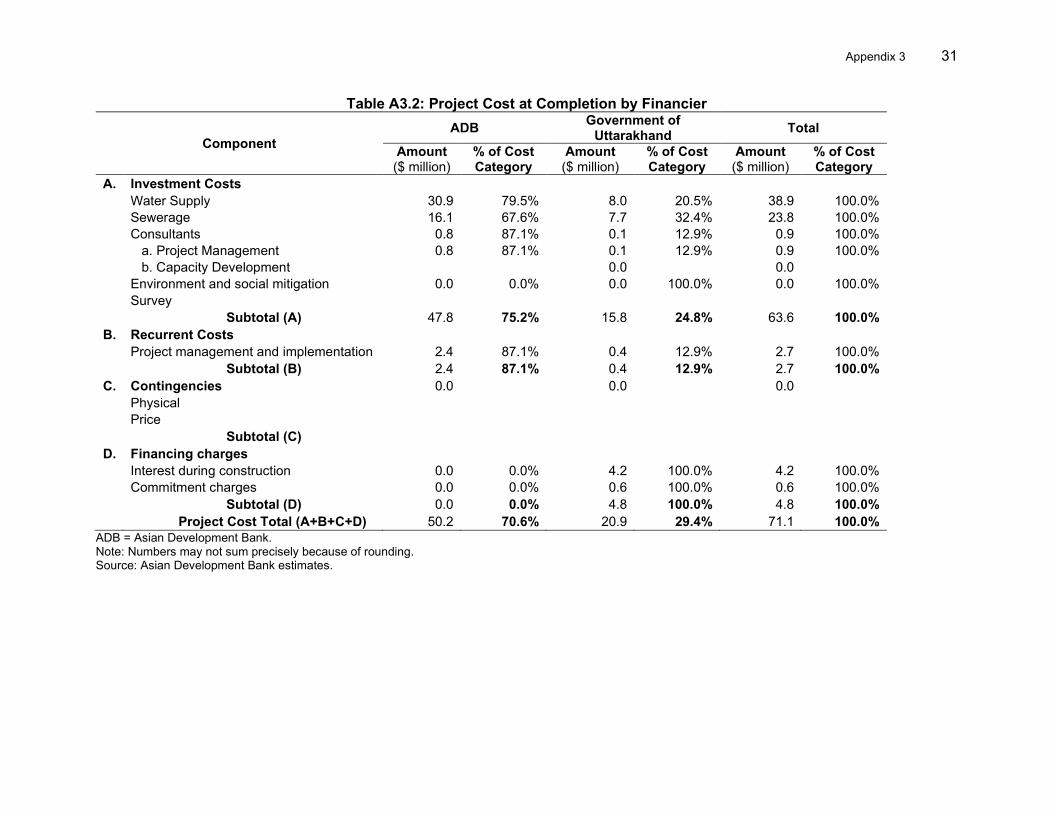
Appendix 3 31
Table A3.2: Project Cost at Completion by Financier
Component ADB Government of
Uttarakhand Total Amount ($ million)
% of Cost Category
Amount ($ million)
% of Cost Category
Amount ($ million)
% of Cost Category
A. Investment Costs Water Supply 30.9 79.5% 8.0 20.5% 38.9 100.0%
Sewerage 16.1 67.6% 7.7 32.4% 23.8 100.0% Consultants 0.8 87.1% 0.1 12.9% 0.9 100.0% a. Project Management 0.8 87.1% 0.1 12.9% 0.9 100.0% b. Capacity Development 0.0 0.0
Environment and social mitigation 0.0 0.0% 0.0 100.0% 0.0 100.0% Survey
Subtotal (A) 47.8 75.2% 15.8 24.8% 63.6 100.0% B. Recurrent Costs Project management and implementation 2.4 87.1% 0.4 12.9% 2.7 100.0%
Subtotal (B) 2.4 87.1% 0.4 12.9% 2.7 100.0% C. Contingencies 0.0 0.0 0.0 Physical Price Subtotal (C) D. Financing charges Interest during construction 0.0 0.0% 4.2 100.0% 4.2 100.0%
Commitment charges 0.0 0.0% 0.6 100.0% 0.6 100.0% Subtotal (D) 0.0 0.0% 4.8 100.0% 4.8 100.0%
Project Cost Total (A+B+C+D) 50.2 70.6% 20.9 29.4% 71.1 100.0% ADB = Asian Development Bank. Note: Numbers may not sum precisely because of rounding. Source: Asian Development Bank estimates.
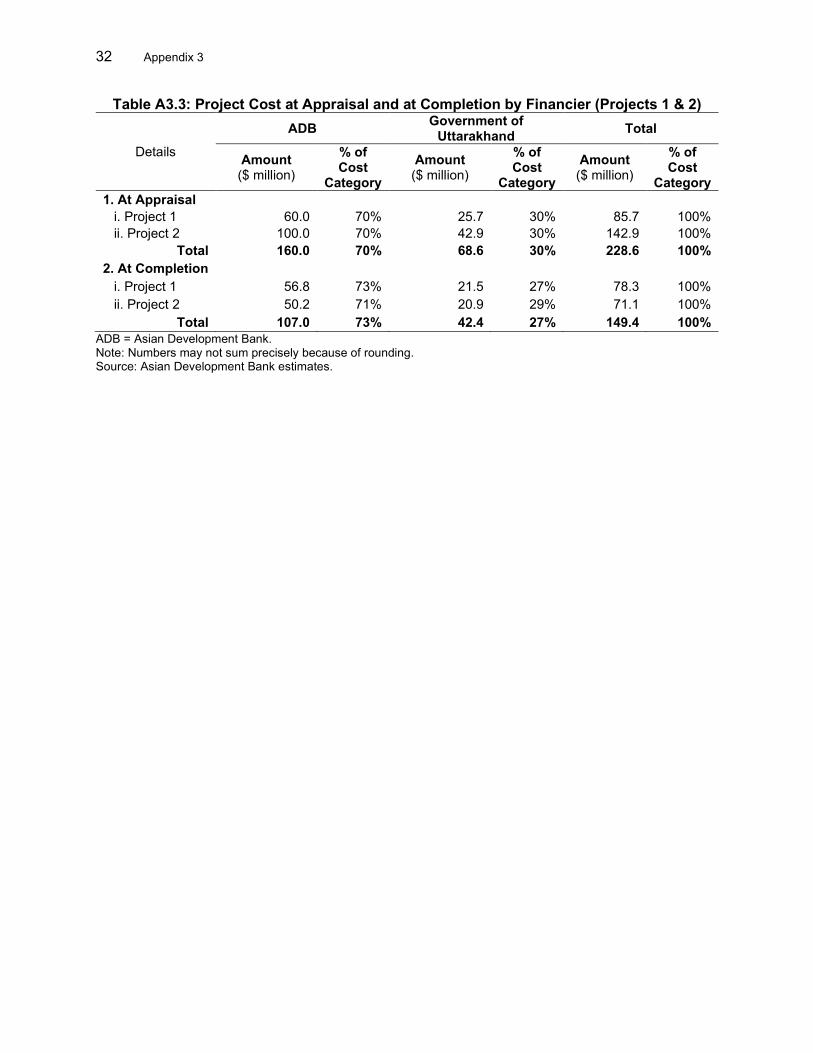
32 Appendix 3
Table A3.3: Project Cost at Appraisal and at Completion by Financier (Projects 1 & 2)
Details
ADB Government of Uttarakhand Total
Amount ($ million)
% of Cost
Category Amount ($ million)
% of Cost
Category Amount ($ million)
% of Cost
Category 1. At Appraisal i. Project 1 60.0 70% 25.7 30% 85.7 100% ii. Project 2 100.0 70% 42.9 30% 142.9 100%
Total 160.0 70% 68.6 30% 228.6 100% 2. At Completion
i. Project 1 56.8 73% 21.5 27% 78.3 100% ii. Project 2 50.2 71% 20.9 29% 71.1 100%
Total 107.0 73% 42.4 27% 149.4 100% ADB = Asian Development Bank. Note: Numbers may not sum precisely because of rounding. Source: Asian Development Bank estimates.
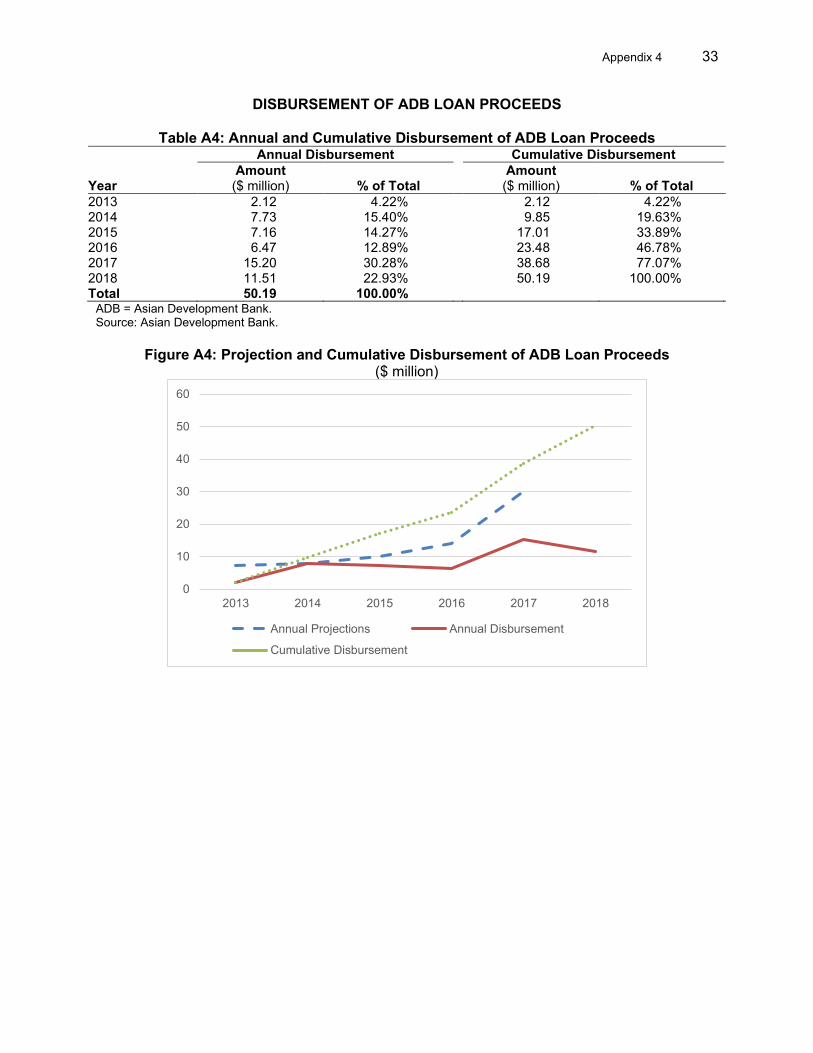
Appendix 4 33
DISBURSEMENT OF ADB LOAN PROCEEDS
Table A4: Annual and Cumulative Disbursement of ADB Loan Proceeds Annual Disbursement Cumulative Disbursement
Year Amount ($ million) % of Total
Amount ($ million) % of Total
2013 2.12 4.22% 2.12 4.22% 2014 7.73 15.40% 9.85 19.63% 2015 7.16 14.27% 17.01 33.89% 2016 6.47 12.89% 23.48 46.78% 2017 15.20 30.28% 38.68 77.07% 2018 11.51 22.93% 50.19 100.00% Total 50.19 100.00%
ADB = Asian Development Bank. Source: Asian Development Bank.
Figure A4: Projection and Cumulative Disbursement of ADB Loan Proceeds ($ million)
0
10
20
30
40
50
60
2013 2014 2015 2016 2017 2018
Annual Projections Annual Disbursement
Cumulative Disbursement
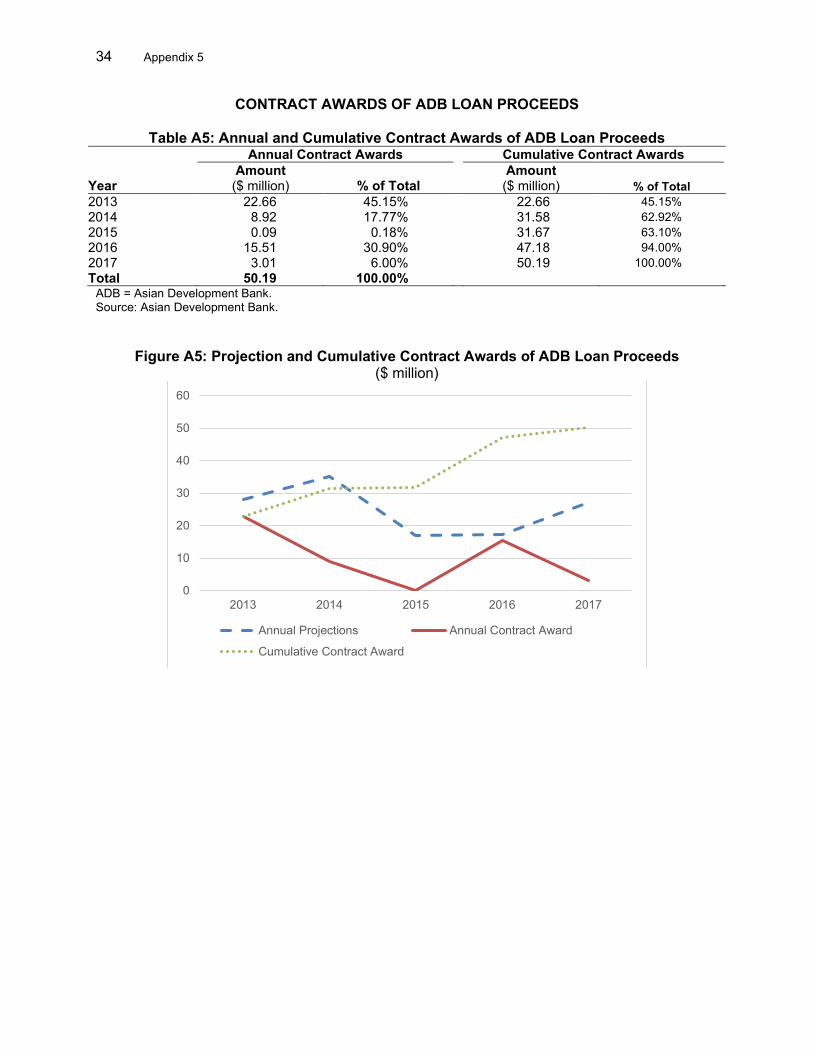
34 Appendix 5
CONTRACT AWARDS OF ADB LOAN PROCEEDS
Table A5: Annual and Cumulative Contract Awards of ADB Loan Proceeds Annual Contract Awards Cumulative Contract Awards
Year Amount ($ million) % of Total
Amount ($ million) % of Total
2013 22.66 45.15% 22.66 45.15% 2014 8.92 17.77% 31.58 62.92% 2015 0.09 0.18% 31.67 63.10% 2016 15.51 30.90% 47.18 94.00% 2017 3.01 6.00% 50.19 100.00% Total 50.19 100.00%
ADB = Asian Development Bank. Source: Asian Development Bank.
Figure A5: Projection and Cumulative Contract Awards of ADB Loan Proceeds ($ million)
0
10
20
30
40
50
60
2013 2014 2015 2016 2017
Annual Projections Annual Contract Award
Cumulative Contract Award
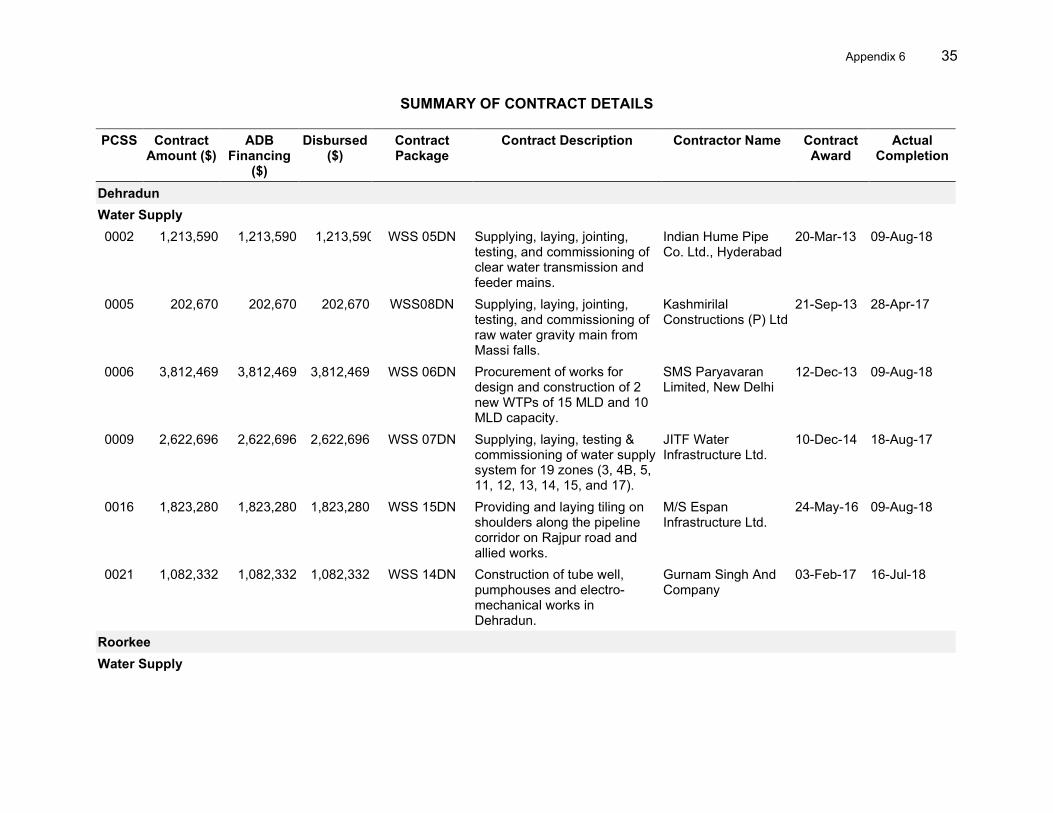
Appendix 6 35
SUMMARY OF CONTRACT DETAILS PCSS Contract
Amount ($) ADB
Financing ($)
Disbursed ($)
Contract Package
Contract Description Contractor Name Contract Award
Actual Completion
Dehradun Water Supply 0002 1,213,590 1,213,590 1,213,590 WSS 05DN Supplying, laying, jointing,
testing, and commissioning of clear water transmission and feeder mains.
Indian Hume Pipe Co. Ltd., Hyderabad
20-Mar-13 09-Aug-18
0005 202,670 202,670 202,670 WSS08DN Supplying, laying, jointing, testing, and commissioning of raw water gravity main from Massi falls.
Kashmirilal Constructions (P) Ltd
21-Sep-13 28-Apr-17
0006 3,812,469 3,812,469 3,812,469 WSS 06DN Procurement of works for design and construction of 2 new WTPs of 15 MLD and 10 MLD capacity.
SMS Paryavaran Limited, New Delhi
12-Dec-13 09-Aug-18
0009 2,622,696 2,622,696 2,622,696 WSS 07DN Supplying, laying, testing & commissioning of water supply system for 19 zones (3, 4B, 5, 11, 12, 13, 14, 15, and 17).
JITF Water Infrastructure Ltd.
10-Dec-14 18-Aug-17
0016 1,823,280 1,823,280 1,823,280 WSS 15DN Providing and laying tiling on shoulders along the pipeline corridor on Rajpur road and allied works.
M/S Espan Infrastructure Ltd.
24-May-16 09-Aug-18
0021 1,082,332 1,082,332 1,082,332 WSS 14DN Construction of tube well, pumphouses and electro- mechanical works in Dehradun.
Gurnam Singh And Company
03-Feb-17 16-Jul-18
Roorkee Water Supply
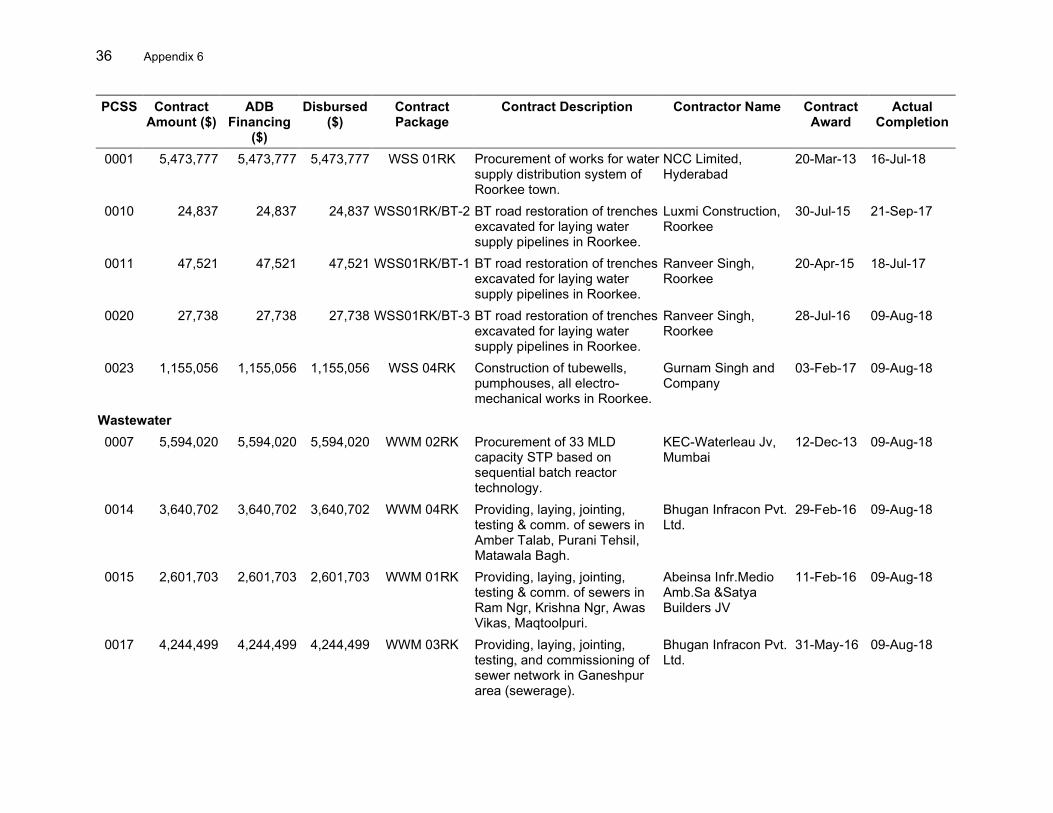
36 Appendix 6
PCSS Contract Amount ($)
ADB Financing
($)
Disbursed ($)
Contract Package
Contract Description Contractor Name Contract Award
Actual Completion
0001 5,473,777 5,473,777 5,473,777 WSS 01RK Procurement of works for water supply distribution system of Roorkee town.
NCC Limited, Hyderabad
20-Mar-13 16-Jul-18
0010 24,837 24,837 24,837 WSS01RK/BT-2 BT road restoration of trenches excavated for laying water supply pipelines in Roorkee.
Luxmi Construction, Roorkee
30-Jul-15 21-Sep-17
0011 47,521 47,521 47,521 WSS01RK/BT-1 BT road restoration of trenches excavated for laying water supply pipelines in Roorkee.
Ranveer Singh, Roorkee
20-Apr-15 18-Jul-17
0020 27,738 27,738 27,738 WSS01RK/BT-3 BT road restoration of trenches excavated for laying water supply pipelines in Roorkee.
Ranveer Singh, Roorkee
28-Jul-16 09-Aug-18
0023 1,155,056 1,155,056 1,155,056 WSS 04RK Construction of tubewells, pumphouses, all electro-mechanical works in Roorkee.
Gurnam Singh and Company
03-Feb-17 09-Aug-18
Wastewater 0007 5,594,020 5,594,020 5,594,020 WWM 02RK Procurement of 33 MLD
capacity STP based on sequential batch reactor technology.
KEC-Waterleau Jv, Mumbai
12-Dec-13 09-Aug-18
0014 3,640,702 3,640,702 3,640,702 WWM 04RK Providing, laying, jointing, testing & comm. of sewers in Amber Talab, Purani Tehsil, Matawala Bagh.
Bhugan Infracon Pvt. Ltd.
29-Feb-16 09-Aug-18
0015 2,601,703 2,601,703 2,601,703 WWM 01RK Providing, laying, jointing, testing & comm. of sewers in Ram Ngr, Krishna Ngr, Awas Vikas, Maqtoolpuri.
Abeinsa Infr.Medio Amb.Sa &Satya Builders JV
11-Feb-16 09-Aug-18
0017 4,244,499 4,244,499 4,244,499 WWM 03RK Providing, laying, jointing, testing, and commissioning of sewer network in Ganeshpur area (sewerage).
Bhugan Infracon Pvt. Ltd.
31-May-16 09-Aug-18
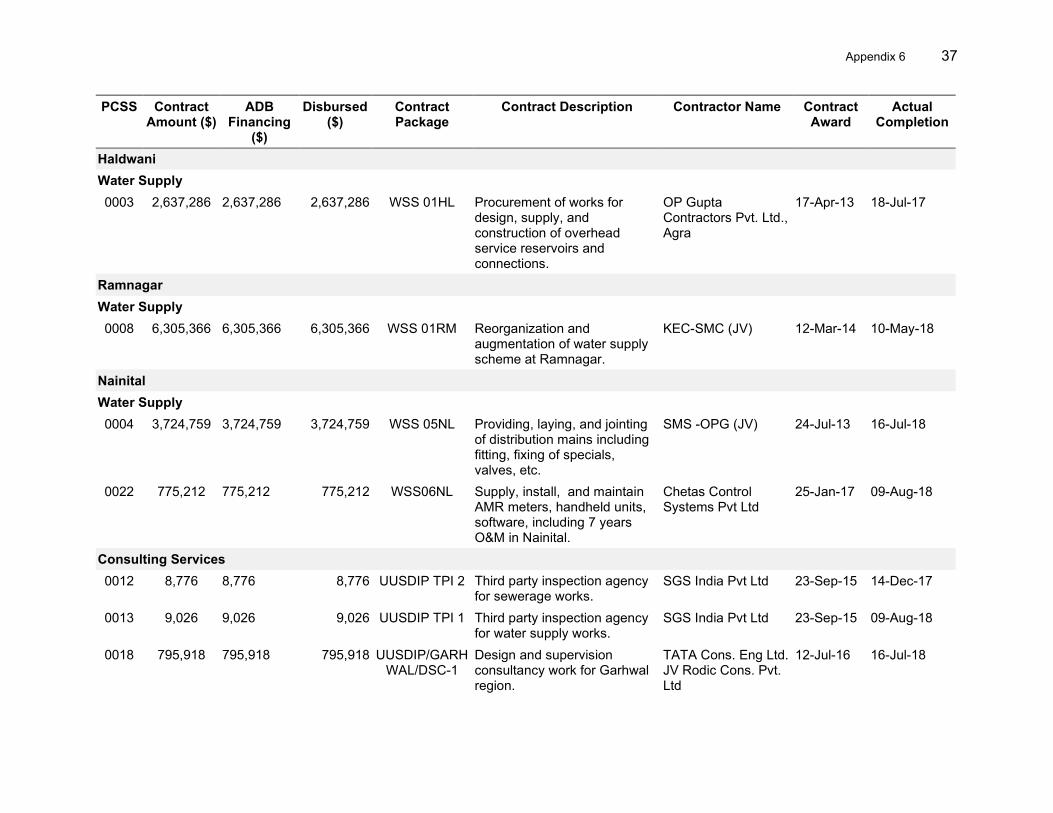
Appendix 6 37
PCSS Contract Amount ($)
ADB Financing
($)
Disbursed ($)
Contract Package
Contract Description Contractor Name Contract Award
Actual Completion
Haldwani Water Supply 0003 2,637,286 2,637,286 2,637,286 WSS 01HL Procurement of works for
design, supply, and construction of overhead service reservoirs and connections.
OP Gupta Contractors Pvt. Ltd., Agra
17-Apr-13 18-Jul-17
Ramnagar Water Supply 0008 6,305,366 6,305,366 6,305,366 WSS 01RM Reorganization and
augmentation of water supply scheme at Ramnagar.
KEC-SMC (JV) 12-Mar-14 10-May-18
Nainital Water Supply 0004 3,724,759 3,724,759 3,724,759 WSS 05NL Providing, laying, and jointing
of distribution mains including fitting, fixing of specials, valves, etc.
SMS -OPG (JV) 24-Jul-13 16-Jul-18
0022 775,212 775,212 775,212 WSS06NL Supply, install, and maintain AMR meters, handheld units, software, including 7 years O&M in Nainital.
Chetas Control Systems Pvt Ltd
25-Jan-17 09-Aug-18
Consulting Services 0012 8,776 8,776 8,776 UUSDIP TPI 2 Third party inspection agency
for sewerage works. SGS India Pvt Ltd 23-Sep-15 14-Dec-17
0013 9,026 9,026 9,026 UUSDIP TPI 1 Third party inspection agency for water supply works.
SGS India Pvt Ltd 23-Sep-15 09-Aug-18
0018 795,918 795,918 795,918 UUSDIP/GARHWAL/DSC-1
Design and supervision consultancy work for Garhwal region.
TATA Cons. Eng Ltd. JV Rodic Cons. Pvt. Ltd
12-Jul-16 16-Jul-18
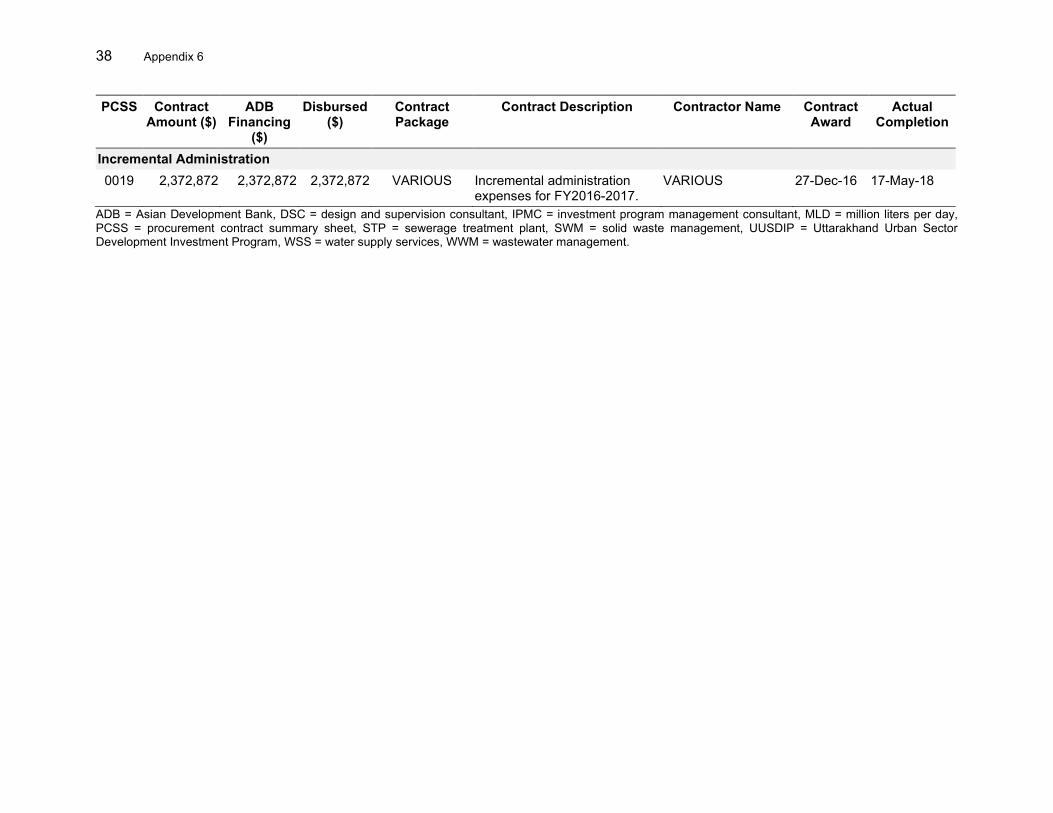
38 Appendix 6
PCSS Contract Amount ($)
ADB Financing
($)
Disbursed ($)
Contract Package
Contract Description Contractor Name Contract Award
Actual Completion
Incremental Administration 0019 2,372,872 2,372,872 2,372,872 VARIOUS Incremental administration
expenses for FY2016-2017. VARIOUS 27-Dec-16 17-May-18
ADB = Asian Development Bank, DSC = design and supervision consultant, IPMC = investment program management consultant, MLD = million liters per day, PCSS = procurement contract summary sheet, STP = sewerage treatment plant, SWM = solid waste management, UUSDIP = Uttarakhand Urban Sector Development Investment Program, WSS = water supply services, WWM = wastewater management.
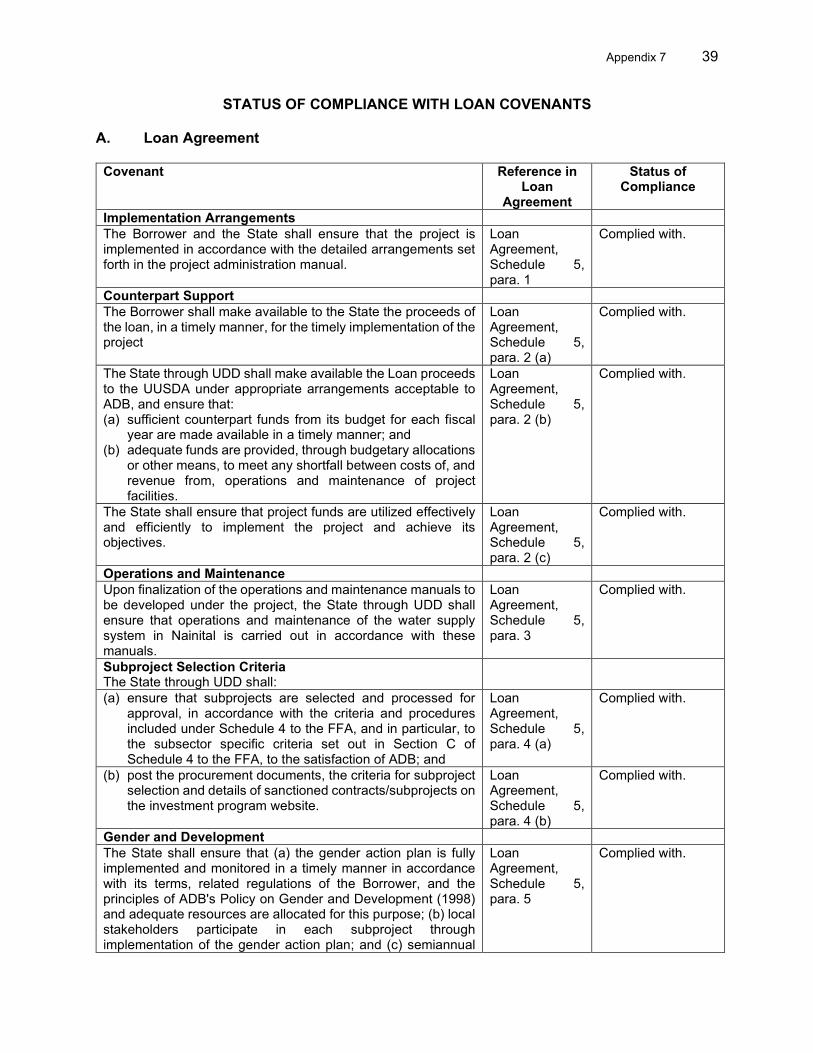
Appendix 7 39
STATUS OF COMPLIANCE WITH LOAN COVENANTS A. Loan Agreement
Covenant Reference in Loan
Agreement
Status of Compliance
Implementation Arrangements The Borrower and the State shall ensure that the project is implemented in accordance with the detailed arrangements set forth in the project administration manual.
Loan Agreement, Schedule 5, para. 1
Complied with.
Counterpart Support The Borrower shall make available to the State the proceeds of the loan, in a timely manner, for the timely implementation of the project
Loan Agreement, Schedule 5, para. 2 (a)
Complied with.
The State through UDD shall make available the Loan proceeds to the UUSDA under appropriate arrangements acceptable to ADB, and ensure that: (a) sufficient counterpart funds from its budget for each fiscal
year are made available in a timely manner; and (b) adequate funds are provided, through budgetary allocations
or other means, to meet any shortfall between costs of, and revenue from, operations and maintenance of project facilities.
Loan Agreement, Schedule 5, para. 2 (b)
Complied with.
The State shall ensure that project funds are utilized effectively and efficiently to implement the project and achieve its objectives.
Loan Agreement, Schedule 5, para. 2 (c)
Complied with.
Operations and Maintenance Upon finalization of the operations and maintenance manuals to be developed under the project, the State through UDD shall ensure that operations and maintenance of the water supply system in Nainital is carried out in accordance with these manuals.
Loan Agreement, Schedule 5, para. 3
Complied with.
Subproject Selection Criteria The State through UDD shall:
(a) ensure that subprojects are selected and processed for approval, in accordance with the criteria and procedures included under Schedule 4 to the FFA, and in particular, to the subsector specific criteria set out in Section C of Schedule 4 to the FFA, to the satisfaction of ADB; and
Loan Agreement, Schedule 5, para. 4 (a)
Complied with.
(b) post the procurement documents, the criteria for subproject selection and details of sanctioned contracts/subprojects on the investment program website.
Loan Agreement, Schedule 5, para. 4 (b)
Complied with.
Gender and Development The State shall ensure that (a) the gender action plan is fully implemented and monitored in a timely manner in accordance with its terms, related regulations of the Borrower, and the principles of ADB's Policy on Gender and Development (1998) and adequate resources are allocated for this purpose; (b) local stakeholders participate in each subproject through implementation of the gender action plan; and (c) semiannual
Loan Agreement, Schedule 5, para. 5
Complied with.
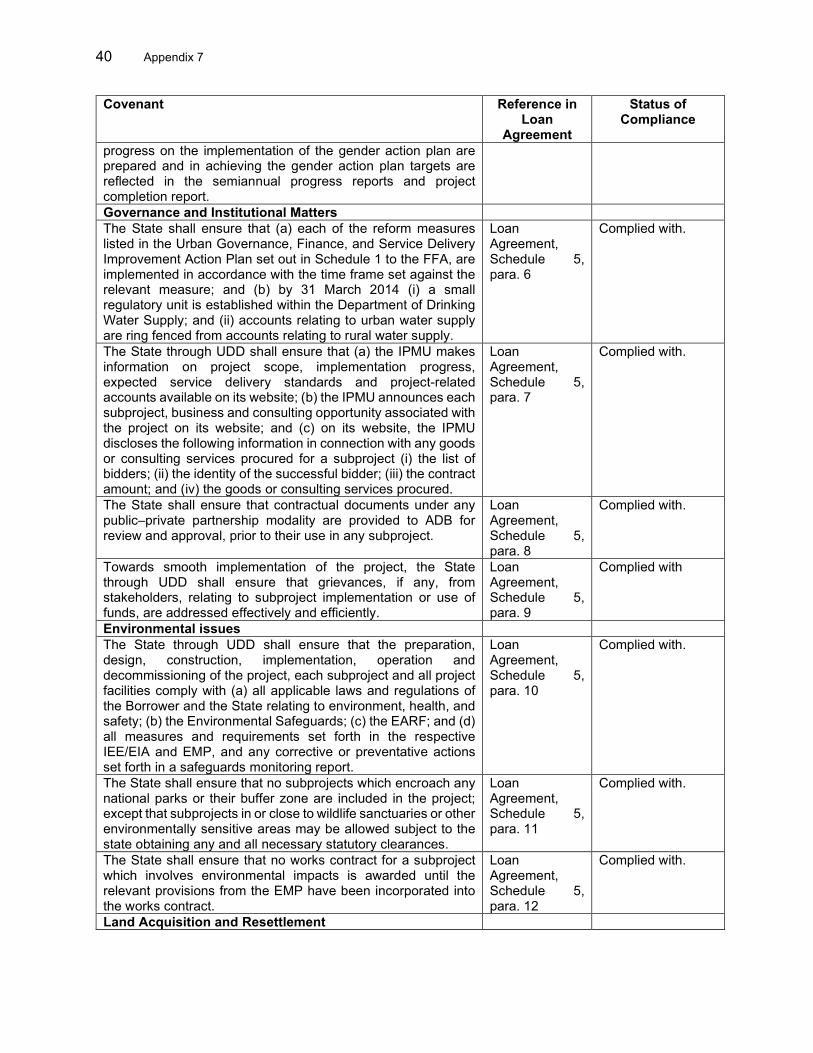
40 Appendix 7
Covenant Reference in Loan
Agreement
Status of Compliance
progress on the implementation of the gender action plan are prepared and in achieving the gender action plan targets are reflected in the semiannual progress reports and project completion report. Governance and Institutional Matters The State shall ensure that (a) each of the reform measures listed in the Urban Governance, Finance, and Service Delivery Improvement Action Plan set out in Schedule 1 to the FFA, are implemented in accordance with the time frame set against the relevant measure; and (b) by 31 March 2014 (i) a small regulatory unit is established within the Department of Drinking Water Supply; and (ii) accounts relating to urban water supply are ring fenced from accounts relating to rural water supply.
Loan Agreement, Schedule 5, para. 6
Complied with.
The State through UDD shall ensure that (a) the IPMU makes information on project scope, implementation progress, expected service delivery standards and project-related accounts available on its website; (b) the IPMU announces each subproject, business and consulting opportunity associated with the project on its website; and (c) on its website, the IPMU discloses the following information in connection with any goods or consulting services procured for a subproject (i) the list of bidders; (ii) the identity of the successful bidder; (iii) the contract amount; and (iv) the goods or consulting services procured.
Loan Agreement, Schedule 5, para. 7
Complied with.
The State shall ensure that contractual documents under any public–private partnership modality are provided to ADB for review and approval, prior to their use in any subproject.
Loan Agreement, Schedule 5, para. 8
Complied with.
Towards smooth implementation of the project, the State through UDD shall ensure that grievances, if any, from stakeholders, relating to subproject implementation or use of funds, are addressed effectively and efficiently.
Loan Agreement, Schedule 5, para. 9
Complied with
Environmental issues The State through UDD shall ensure that the preparation, design, construction, implementation, operation and decommissioning of the project, each subproject and all project facilities comply with (a) all applicable laws and regulations of the Borrower and the State relating to environment, health, and safety; (b) the Environmental Safeguards; (c) the EARF; and (d) all measures and requirements set forth in the respective IEE/EIA and EMP, and any corrective or preventative actions set forth in a safeguards monitoring report.
Loan Agreement, Schedule 5, para. 10
Complied with.
The State shall ensure that no subprojects which encroach any national parks or their buffer zone are included in the project; except that subprojects in or close to wildlife sanctuaries or other environmentally sensitive areas may be allowed subject to the state obtaining any and all necessary statutory clearances.
Loan Agreement, Schedule 5, para. 11
Complied with.
The State shall ensure that no works contract for a subproject which involves environmental impacts is awarded until the relevant provisions from the EMP have been incorporated into the works contract.
Loan Agreement, Schedule 5, para. 12
Complied with.
Land Acquisition and Resettlement
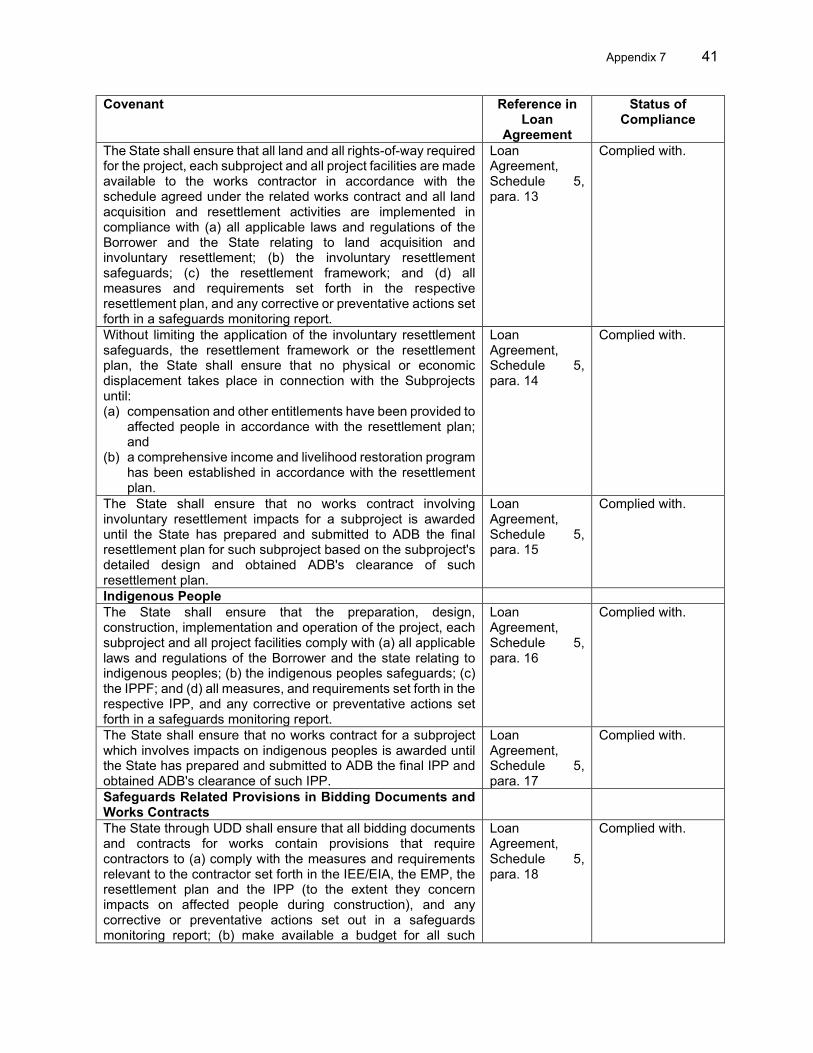
Appendix 7 41
Covenant Reference in Loan
Agreement
Status of Compliance
The State shall ensure that all land and all rights-of-way required for the project, each subproject and all project facilities are made available to the works contractor in accordance with the schedule agreed under the related works contract and all land acquisition and resettlement activities are implemented in compliance with (a) all applicable laws and regulations of the Borrower and the State relating to land acquisition and involuntary resettlement; (b) the involuntary resettlement safeguards; (c) the resettlement framework; and (d) all measures and requirements set forth in the respective resettlement plan, and any corrective or preventative actions set forth in a safeguards monitoring report.
Loan Agreement, Schedule 5, para. 13
Complied with.
Without limiting the application of the involuntary resettlement safeguards, the resettlement framework or the resettlement plan, the State shall ensure that no physical or economic displacement takes place in connection with the Subprojects until: (a) compensation and other entitlements have been provided to
affected people in accordance with the resettlement plan; and
(b) a comprehensive income and livelihood restoration program has been established in accordance with the resettlement plan.
Loan Agreement, Schedule 5, para. 14
Complied with.
The State shall ensure that no works contract involving involuntary resettlement impacts for a subproject is awarded until the State has prepared and submitted to ADB the final resettlement plan for such subproject based on the subproject's detailed design and obtained ADB's clearance of such resettlement plan.
Loan Agreement, Schedule 5, para. 15
Complied with.
Indigenous People The State shall ensure that the preparation, design, construction, implementation and operation of the project, each subproject and all project facilities comply with (a) all applicable laws and regulations of the Borrower and the state relating to indigenous peoples; (b) the indigenous peoples safeguards; (c) the IPPF; and (d) all measures, and requirements set forth in the respective IPP, and any corrective or preventative actions set forth in a safeguards monitoring report.
Loan Agreement, Schedule 5, para. 16
Complied with.
The State shall ensure that no works contract for a subproject which involves impacts on indigenous peoples is awarded until the State has prepared and submitted to ADB the final IPP and obtained ADB's clearance of such IPP.
Loan Agreement, Schedule 5, para. 17
Complied with.
Safeguards Related Provisions in Bidding Documents and Works Contracts
The State through UDD shall ensure that all bidding documents and contracts for works contain provisions that require contractors to (a) comply with the measures and requirements relevant to the contractor set forth in the IEE/EIA, the EMP, the resettlement plan and the IPP (to the extent they concern impacts on affected people during construction), and any corrective or preventative actions set out in a safeguards monitoring report; (b) make available a budget for all such
Loan Agreement, Schedule 5, para. 18
Complied with.
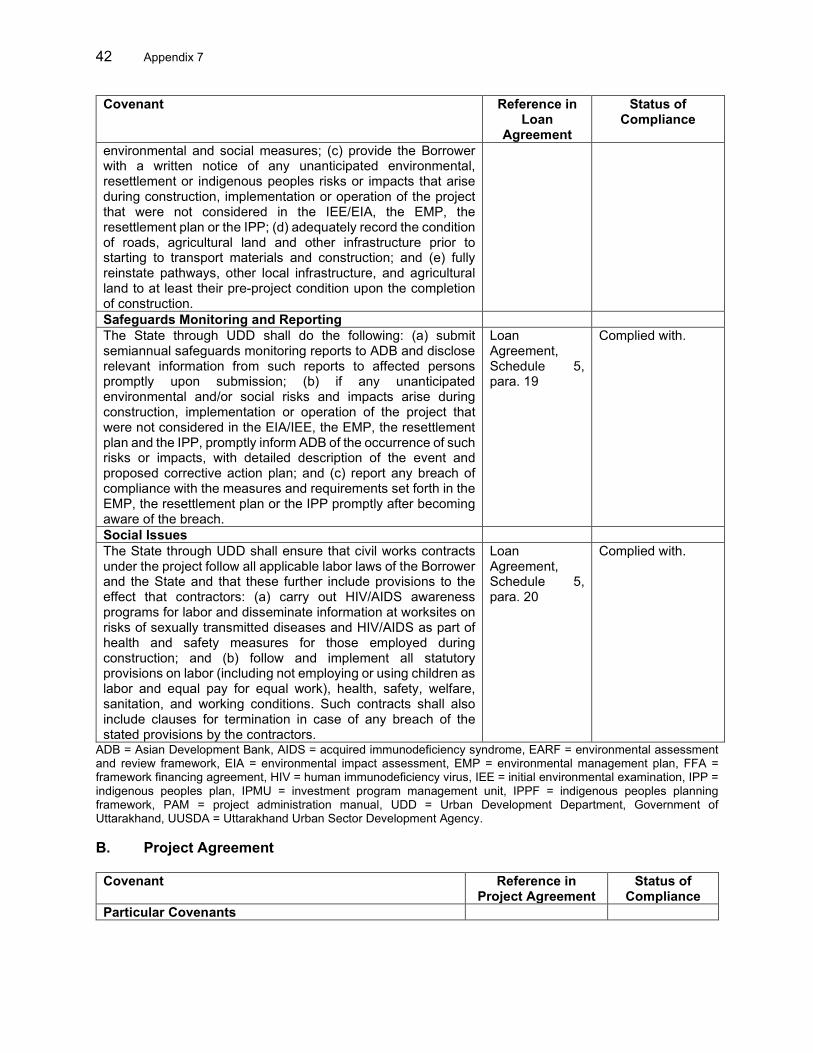
42 Appendix 7
Covenant Reference in Loan
Agreement
Status of Compliance
environmental and social measures; (c) provide the Borrower with a written notice of any unanticipated environmental, resettlement or indigenous peoples risks or impacts that arise during construction, implementation or operation of the project that were not considered in the IEE/EIA, the EMP, the resettlement plan or the IPP; (d) adequately record the condition of roads, agricultural land and other infrastructure prior to starting to transport materials and construction; and (e) fully reinstate pathways, other local infrastructure, and agricultural land to at least their pre-project condition upon the completion of construction. Safeguards Monitoring and Reporting The State through UDD shall do the following: (a) submit semiannual safeguards monitoring reports to ADB and disclose relevant information from such reports to affected persons promptly upon submission; (b) if any unanticipated environmental and/or social risks and impacts arise during construction, implementation or operation of the project that were not considered in the EIA/IEE, the EMP, the resettlement plan and the IPP, promptly inform ADB of the occurrence of such risks or impacts, with detailed description of the event and proposed corrective action plan; and (c) report any breach of compliance with the measures and requirements set forth in the EMP, the resettlement plan or the IPP promptly after becoming aware of the breach.
Loan Agreement, Schedule 5, para. 19
Complied with.
Social Issues The State through UDD shall ensure that civil works contracts under the project follow all applicable labor laws of the Borrower and the State and that these further include provisions to the effect that contractors: (a) carry out HIV/AIDS awareness programs for labor and disseminate information at worksites on risks of sexually transmitted diseases and HIV/AIDS as part of health and safety measures for those employed during construction; and (b) follow and implement all statutory provisions on labor (including not employing or using children as labor and equal pay for equal work), health, safety, welfare, sanitation, and working conditions. Such contracts shall also include clauses for termination in case of any breach of the stated provisions by the contractors.
Loan Agreement, Schedule 5, para. 20
Complied with.
ADB = Asian Development Bank, AIDS = acquired immunodeficiency syndrome, EARF = environmental assessment and review framework, EIA = environmental impact assessment, EMP = environmental management plan, FFA = framework financing agreement, HIV = human immunodeficiency virus, IEE = initial environmental examination, IPP = indigenous peoples plan, IPMU = investment program management unit, IPPF = indigenous peoples planning framework, PAM = project administration manual, UDD = Urban Development Department, Government of Uttarakhand, UUSDA = Uttarakhand Urban Sector Development Agency. B. Project Agreement
Covenant Reference in Project Agreement
Status of Compliance
Particular Covenants
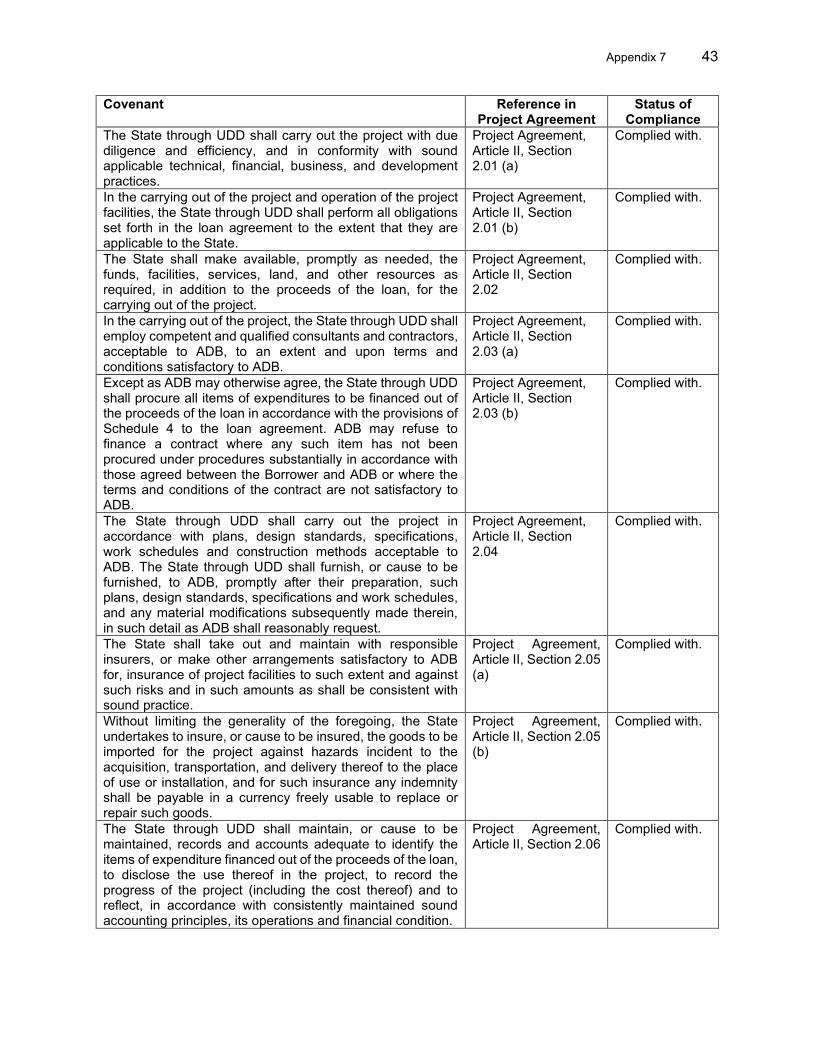
Appendix 7 43
Covenant Reference in Project Agreement
Status of Compliance
The State through UDD shall carry out the project with due diligence and efficiency, and in conformity with sound applicable technical, financial, business, and development practices.
Project Agreement, Article II, Section 2.01 (a)
Complied with.
In the carrying out of the project and operation of the project facilities, the State through UDD shall perform all obligations set forth in the loan agreement to the extent that they are applicable to the State.
Project Agreement, Article II, Section 2.01 (b)
Complied with.
The State shall make available, promptly as needed, the funds, facilities, services, land, and other resources as required, in addition to the proceeds of the loan, for the carrying out of the project.
Project Agreement, Article II, Section 2.02
Complied with.
In the carrying out of the project, the State through UDD shall employ competent and qualified consultants and contractors, acceptable to ADB, to an extent and upon terms and conditions satisfactory to ADB.
Project Agreement, Article II, Section 2.03 (a)
Complied with.
Except as ADB may otherwise agree, the State through UDD shall procure all items of expenditures to be financed out of the proceeds of the loan in accordance with the provisions of Schedule 4 to the loan agreement. ADB may refuse to finance a contract where any such item has not been procured under procedures substantially in accordance with those agreed between the Borrower and ADB or where the terms and conditions of the contract are not satisfactory to ADB.
Project Agreement, Article II, Section 2.03 (b)
Complied with.
The State through UDD shall carry out the project in accordance with plans, design standards, specifications, work schedules and construction methods acceptable to ADB. The State through UDD shall furnish, or cause to be furnished, to ADB, promptly after their preparation, such plans, design standards, specifications and work schedules, and any material modifications subsequently made therein, in such detail as ADB shall reasonably request.
Project Agreement, Article II, Section 2.04
Complied with.
The State shall take out and maintain with responsible insurers, or make other arrangements satisfactory to ADB for, insurance of project facilities to such extent and against such risks and in such amounts as shall be consistent with sound practice.
Project Agreement, Article II, Section 2.05 (a)
Complied with.
Without limiting the generality of the foregoing, the State undertakes to insure, or cause to be insured, the goods to be imported for the project against hazards incident to the acquisition, transportation, and delivery thereof to the place of use or installation, and for such insurance any indemnity shall be payable in a currency freely usable to replace or repair such goods.
Project Agreement, Article II, Section 2.05 (b)
Complied with.
The State through UDD shall maintain, or cause to be maintained, records and accounts adequate to identify the items of expenditure financed out of the proceeds of the loan, to disclose the use thereof in the project, to record the progress of the project (including the cost thereof) and to reflect, in accordance with consistently maintained sound accounting principles, its operations and financial condition.
Project Agreement, Article II, Section 2.06
Complied with.
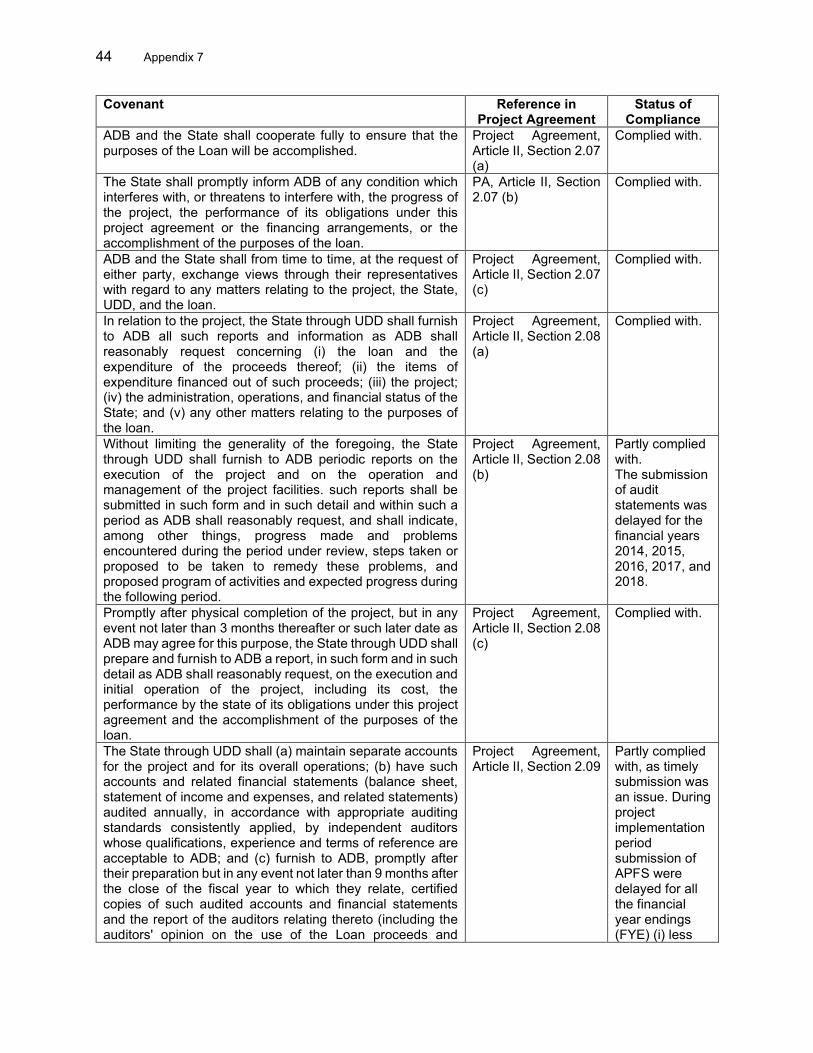
44 Appendix 7
Covenant Reference in Project Agreement
Status of Compliance
ADB and the State shall cooperate fully to ensure that the purposes of the Loan will be accomplished.
Project Agreement, Article II, Section 2.07 (a)
Complied with.
The State shall promptly inform ADB of any condition which interferes with, or threatens to interfere with, the progress of the project, the performance of its obligations under this project agreement or the financing arrangements, or the accomplishment of the purposes of the loan.
PA, Article II, Section 2.07 (b)
Complied with.
ADB and the State shall from time to time, at the request of either party, exchange views through their representatives with regard to any matters relating to the project, the State, UDD, and the loan.
Project Agreement, Article II, Section 2.07 (c)
Complied with.
In relation to the project, the State through UDD shall furnish to ADB all such reports and information as ADB shall reasonably request concerning (i) the loan and the expenditure of the proceeds thereof; (ii) the items of expenditure financed out of such proceeds; (iii) the project; (iv) the administration, operations, and financial status of the State; and (v) any other matters relating to the purposes of the loan.
Project Agreement, Article II, Section 2.08 (a)
Complied with.
Without limiting the generality of the foregoing, the State through UDD shall furnish to ADB periodic reports on the execution of the project and on the operation and management of the project facilities. such reports shall be submitted in such form and in such detail and within such a period as ADB shall reasonably request, and shall indicate, among other things, progress made and problems encountered during the period under review, steps taken or proposed to be taken to remedy these problems, and proposed program of activities and expected progress during the following period.
Project Agreement, Article II, Section 2.08 (b)
Partly complied with. The submission of audit statements was delayed for the financial years 2014, 2015, 2016, 2017, and 2018.
Promptly after physical completion of the project, but in any event not later than 3 months thereafter or such later date as ADB may agree for this purpose, the State through UDD shall prepare and furnish to ADB a report, in such form and in such detail as ADB shall reasonably request, on the execution and initial operation of the project, including its cost, the performance by the state of its obligations under this project agreement and the accomplishment of the purposes of the loan.
Project Agreement, Article II, Section 2.08 (c)
Complied with.
The State through UDD shall (a) maintain separate accounts for the project and for its overall operations; (b) have such accounts and related financial statements (balance sheet, statement of income and expenses, and related statements) audited annually, in accordance with appropriate auditing standards consistently applied, by independent auditors whose qualifications, experience and terms of reference are acceptable to ADB; and (c) furnish to ADB, promptly after their preparation but in any event not later than 9 months after the close of the fiscal year to which they relate, certified copies of such audited accounts and financial statements and the report of the auditors relating thereto (including the auditors' opinion on the use of the Loan proceeds and
Project Agreement, Article II, Section 2.09
Partly complied with, as timely submission was an issue. During project implementation period submission of APFS were delayed for all the financial year endings (FYE) (i) less
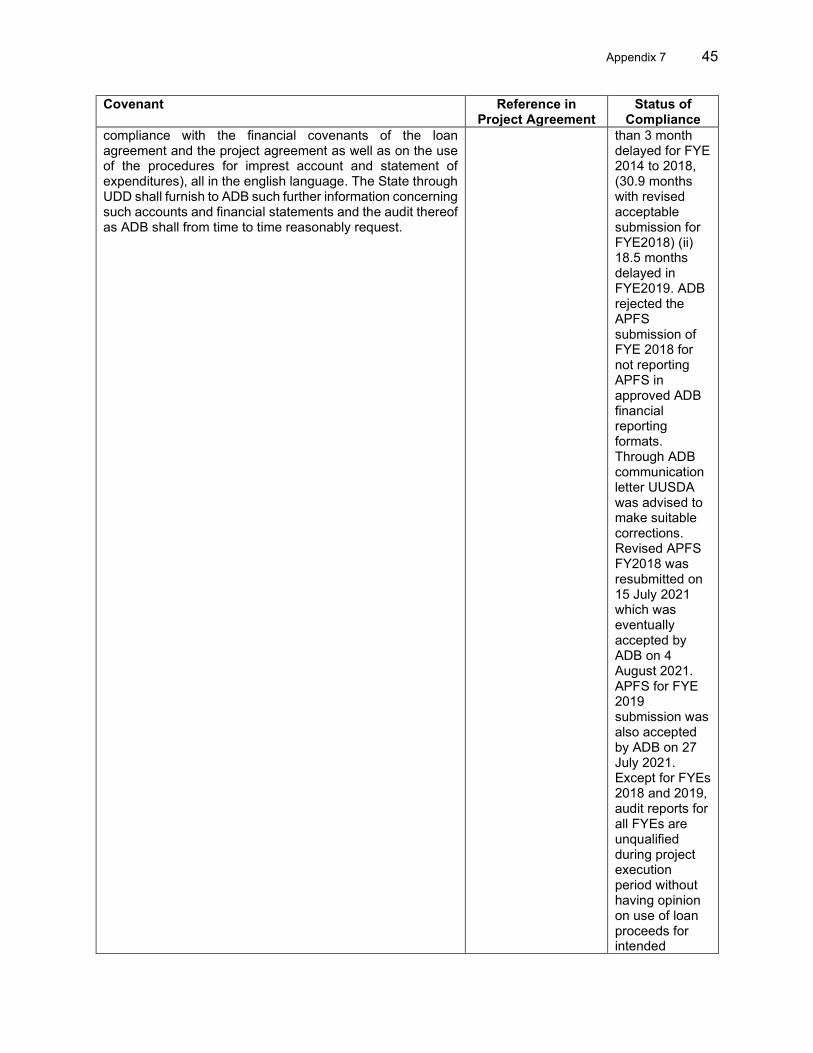
Appendix 7 45
Covenant Reference in Project Agreement
Status of Compliance
compliance with the financial covenants of the loan agreement and the project agreement as well as on the use of the procedures for imprest account and statement of expenditures), all in the english language. The State through UDD shall furnish to ADB such further information concerning such accounts and financial statements and the audit thereof as ADB shall from time to time reasonably request.
than 3 month delayed for FYE 2014 to 2018, (30.9 months with revised acceptable submission for FYE2018) (ii) 18.5 months delayed in FYE2019. ADB rejected the APFS submission of FYE 2018 for not reporting APFS in approved ADB financial reporting formats. Through ADB communication letter UUSDA was advised to make suitable corrections. Revised APFS FY2018 was resubmitted on 15 July 2021 which was eventually accepted by ADB on 4 August 2021. APFS for FYE 2019 submission was also accepted by ADB on 27 July 2021. Except for FYEs 2018 and 2019, audit reports for all FYEs are unqualified during project execution period without having opinion on use of loan proceeds for intended
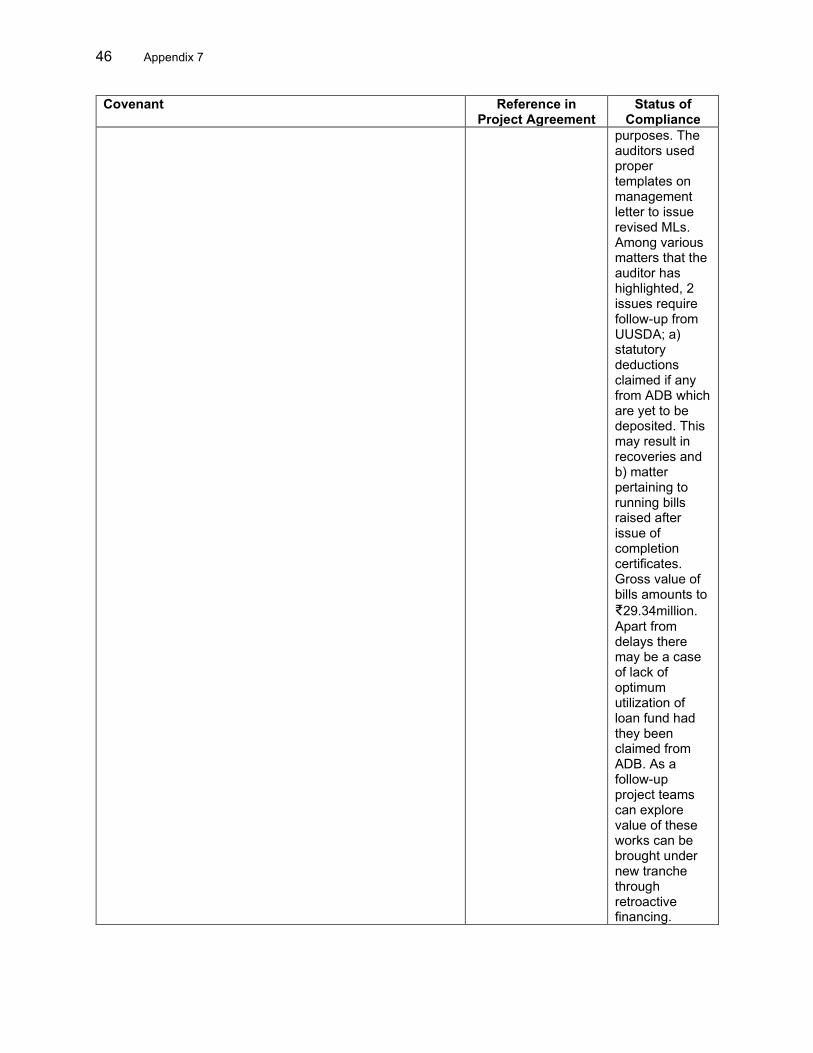
46 Appendix 7
Covenant Reference in Project Agreement
Status of Compliance
purposes. The auditors used proper templates on management letter to issue revised MLs. Among various matters that the auditor has highlighted, 2 issues require follow-up from UUSDA; a) statutory deductions claimed if any from ADB which are yet to be deposited. This may result in recoveries and b) matter pertaining to running bills raised after issue of completion certificates. Gross value of bills amounts to ₹29.34million. Apart from delays there may be a case of lack of optimum utilization of loan fund had they been claimed from ADB. As a follow-up project teams can explore value of these works can be brought under new tranche through retroactive financing.
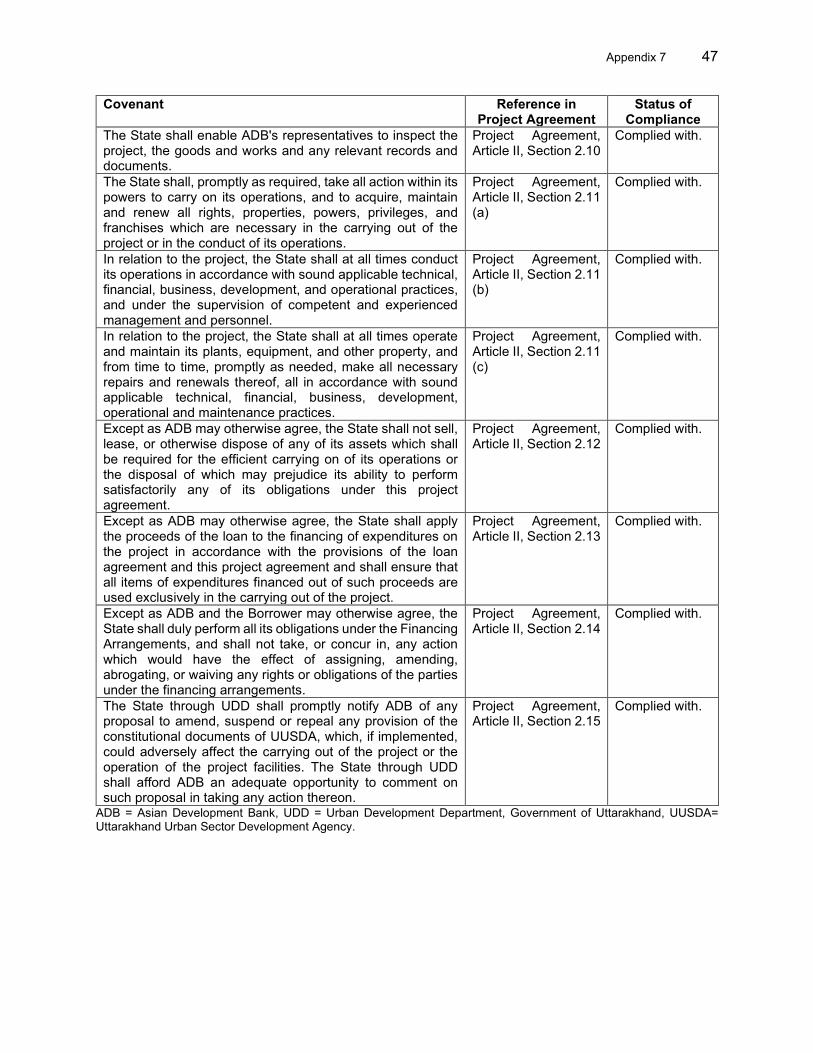
Appendix 7 47
Covenant Reference in Project Agreement
Status of Compliance
The State shall enable ADB's representatives to inspect the project, the goods and works and any relevant records and documents.
Project Agreement, Article II, Section 2.10
Complied with.
The State shall, promptly as required, take all action within its powers to carry on its operations, and to acquire, maintain and renew all rights, properties, powers, privileges, and franchises which are necessary in the carrying out of the project or in the conduct of its operations.
Project Agreement, Article II, Section 2.11 (a)
Complied with.
In relation to the project, the State shall at all times conduct its operations in accordance with sound applicable technical, financial, business, development, and operational practices, and under the supervision of competent and experienced management and personnel.
Project Agreement, Article II, Section 2.11 (b)
Complied with.
In relation to the project, the State shall at all times operate and maintain its plants, equipment, and other property, and from time to time, promptly as needed, make all necessary repairs and renewals thereof, all in accordance with sound applicable technical, financial, business, development, operational and maintenance practices.
Project Agreement, Article II, Section 2.11 (c)
Complied with.
Except as ADB may otherwise agree, the State shall not sell, lease, or otherwise dispose of any of its assets which shall be required for the efficient carrying on of its operations or the disposal of which may prejudice its ability to perform satisfactorily any of its obligations under this project agreement.
Project Agreement, Article II, Section 2.12
Complied with.
Except as ADB may otherwise agree, the State shall apply the proceeds of the loan to the financing of expenditures on the project in accordance with the provisions of the loan agreement and this project agreement and shall ensure that all items of expenditures financed out of such proceeds are used exclusively in the carrying out of the project.
Project Agreement, Article II, Section 2.13
Complied with.
Except as ADB and the Borrower may otherwise agree, the State shall duly perform all its obligations under the Financing Arrangements, and shall not take, or concur in, any action which would have the effect of assigning, amending, abrogating, or waiving any rights or obligations of the parties under the financing arrangements.
Project Agreement, Article II, Section 2.14
Complied with.
The State through UDD shall promptly notify ADB of any proposal to amend, suspend or repeal any provision of the constitutional documents of UUSDA, which, if implemented, could adversely affect the carrying out of the project or the operation of the project facilities. The State through UDD shall afford ADB an adequate opportunity to comment on such proposal in taking any action thereon.
Project Agreement, Article II, Section 2.15
Complied with.
ADB = Asian Development Bank, UDD = Urban Development Department, Government of Uttarakhand, UUSDA= Uttarakhand Urban Sector Development Agency.
48 Appendix 8A
ECONOMIC ANALYSIS – PROJECT 2 A. Introduction
1. Project 2 of Uttarakhand Urban Sector Development Investment Program (UUSDIP) included the development of (i) water supply in Dehradun, Haldwani, Nainital, Ramnagar, and Roorkee and (ii) sewerage in Roorkee. In this Project Completion Report (PCR), all the water supply and sewerage subprojects completed under project 2, and the works that were unfinished under project 2 but completed by the Government of Uttarakhand using the JUNNURM finance were considered. The economic evaluation for the entire project 2 subprojects were undertaken to determine the cumulative economic significance. Two water supply subprojects in Dehradun and Nainital had investments in project 1 and project 2 which together will provide the target service delivery to the project beneficiaries. Hence, economic evaluation of these two subprojects had considered the investments under both project 1 and project 2. Economic reevaluation at this PCR also includes sensitivity analysis, at a 20% reduction of future benefits, 20% increase in future O&M costs and 1 year delay in benefits realization. In this context, the economic analysis for the present PCR was conducted for water supply and sewer subprojects in the five project towns under project 2 in accordance with the ADB’s Guidelines, including Guidelines for the Economic Analysis of Projects (2019), Handbook for the Economic Analysis of Water Supply Projects (1999) and Guidelines for the Evaluation of Public Sector Operations (2016). B. Economic Evaluation Methodology 2. Main approach of this economic analysis is to update the earlier analysis carried out during the project completion report (2021) through appropriate changes in the areas of project cost, implementation phasing, project coverage, and beneficiaries that happened during the implementation period up to this completion stage. This is to facilitate the reevaluation of analysis incorporating the changes happened during the implementation. Project analysis period followed during the processing stage is retained for the present analysis also with base year 2021. 3. For the purpose of economic analysis, the actual financial cost first reevaluated at the base year 2021 prices to make it comparable with the appraisal analysis and then converted into economic costs by applying prescribed conversion rates, adjusting for contingencies, taxes and duties but excluding the financing costs (interest during construction and commitment charges). As the project coverage and projected beneficiaries (population covered) including the service level (per capita water supply consumption, and quality supplied water) did not change during the implementation, the projected project benefits for the subprojects during the processing stage were escalated to the base year of 2021 for PCR economic analysis.
1. At Appraisal
4. The cost and benefit analysis at appraisal covered 33-year period with 3 years construction using the 2011 domestic prices. Economic costs identified for the subprojects were project investment and operation and maintenance costs. Financial costs were converted to economic costs by the shadow exchange rate factor (SERF) estimated at 1.041
1 Estimated based on the actual import and export figures from 2005 to 2009. Source: Reserve Bank of India.
Appendix 8A 49
and the shadow wage rate factor (SWRF) estimated at 0.72 based on the minimum wage of unskilled labor and the rural labor wage of casual labor. Taxes and duties were excluded. 5. Economic benefits, on the other hand, assumed increase in the coverage of the respective services indicated in financial improvement action plan. Benefit of the water supply subprojects consist of (i) resource cost savings3 on the non-incremental water consumption by switching from alternative sources to piped water; (ii) saved labor costs4 to fetch water from other sources; saved wage loss5 due to water supply related diseases; and saved medical expenses6 due to water related diseases. For the sewerage project, the economic benefits included (i) resource cost savings7 to install and maintain septic tanks and low-cost sanitary toilets; (ii) saved wage loss due to sanitation related diseases; and (iii) saved medical expenses due to sanitation related diseases. 6. The selection criteria for the subprojects set for project 2 required an EIRR exceeding economic opportunity cost of capital (EOCC) of 12%. Results of the economic evaluation and the resultant EIRR (base case)8 were: (i) Dehradun water supply (19.9%), (ii) Nainital water supply (15.3%), Haldwani water supply (19.0%), Ramnagar water supply (14.6%), Roorkee water supply (17.8%), and Roorkee sewerage (13.5%).
2. At Completion 7. The approach used during appraisal was applied for the recalculation of the EIRR and compared with EOCC of 12%. EIRR for the entire project 2 was also calculated considering the entire project cost and assessed appraisal total benefits. 8. Two water supply subprojects in Dehradun and Nainital had investments in project 1 and project 2 which together will provide the target service delivery to the project beneficiaries. Hence, for economic evaluation of these two subprojects had considered the investments under both projects 1 and 2. 9. During implementation, in Nainital water supply the bulk water provision was improved against the rehabilitation of the distribution network; and provision of household water meter connections in Dehradun was dropped. However, the major water supply and sewerage infrastructure components including distribution network, augmentation of treatment plant capacities were substantially achieved without changing the coverage and beneficiary population in project towns. Also, due to the coronavirus disease (COVID-19) related issues, beneficiary confirmation details could not be collected at project towns. Accordingly, the benefits estimated at processing stage were retained for analysis. 10. The economic viability of the sectors is evaluated over a period as was considered at appraisal. Cost benefit analyses were undertaken from completion of each subproject considering the actual cost of interventions. Financial costs actually incurred were first
2 Estimated based on the actual minimum wage for unskilled workers in Uttarakhand during the processing stage
(2007). Paycheck India. Minimum Wages in Uttarakhand. 3 Estimated at ₹51.4 per capita. 4 Estimated at ₹421.9 per capita. 5 Combined wage loss and medical expenses estimated at ₹692.4 per capita. 6 Combined wage loss and medical expenses estimated at ₹692.4 per capita. 7 Including initial capital costs and present value of annual maintenance costs, estimated at ₹6,499 per capita. 8 Results of two water supply subprojects (Dehradun and Nainital) had considered the total project cost incurred under Tranches 1 and 2. Other subprojects are standalone and implemented under Tranche 2 only.
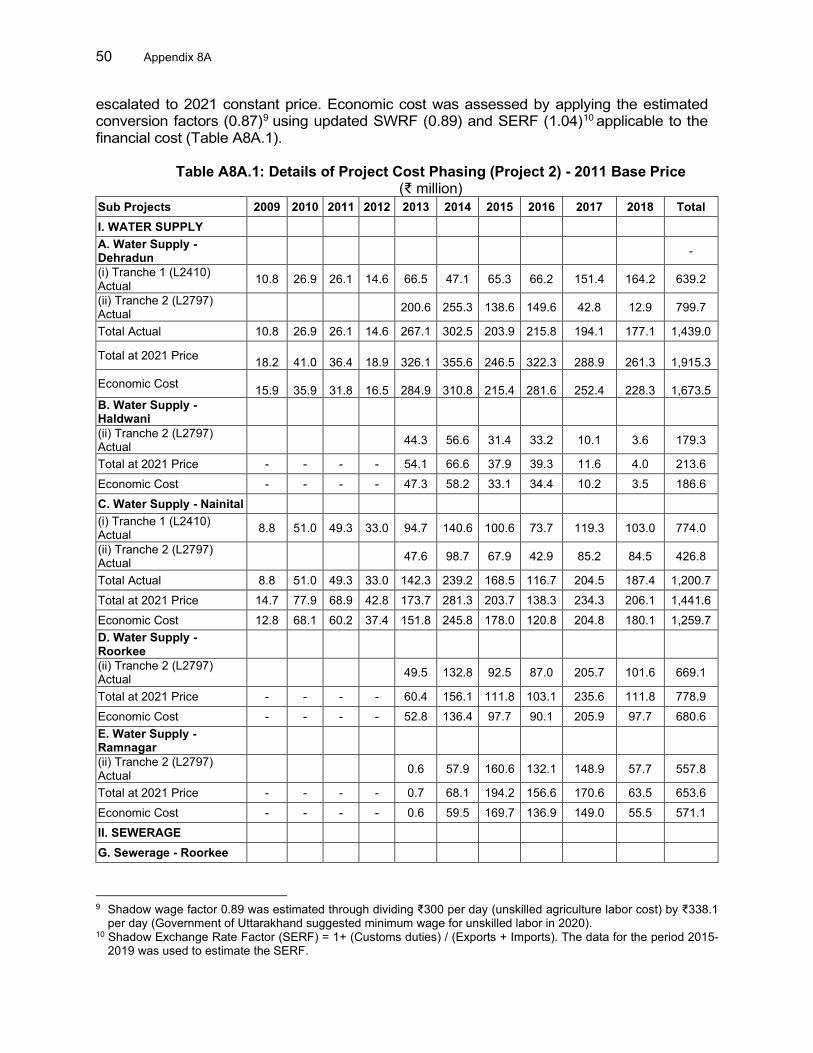
50 Appendix 8A
escalated to 2021 constant price. Economic cost was assessed by applying the estimated conversion factors (0.87)9 using updated SWRF (0.89) and SERF (1.04)10 applicable to the financial cost (Table A8A.1).
Table A8A.1: Details of Project Cost Phasing (Project 2) - 2011 Base Price (₹ million)
Sub Projects 2009 2010 2011 2012 2013 2014 2015 2016 2017 2018 Total I. WATER SUPPLY
A. Water Supply - Dehradun -
(i) Tranche 1 (L2410) Actual 10.8 26.9 26.1 14.6 66.5 47.1 65.3 66.2 151.4 164.2 639.2
(ii) Tranche 2 (L2797) Actual 200.6 255.3 138.6 149.6 42.8 12.9 799.7
Total Actual 10.8 26.9 26.1 14.6 267.1 302.5 203.9 215.8 194.1 177.1 1,439.0
Total at 2021 Price 18.2
41.0
36.4
18.9
326.1
355.6
246.5
322.3
288.9
261.3
1,915.3
Economic Cost 15.9
35.9
31.8
16.5
284.9
310.8
215.4
281.6
252.4
228.3
1,673.5
B. Water Supply - Haldwani
(ii) Tranche 2 (L2797) Actual 44.3 56.6 31.4 33.2 10.1 3.6 179.3
Total at 2021 Price - - - - 54.1 66.6 37.9 39.3 11.6 4.0 213.6 Economic Cost - - - - 47.3 58.2 33.1 34.4 10.2 3.5 186.6 C. Water Supply - Nainital
(i) Tranche 1 (L2410) Actual 8.8 51.0 49.3 33.0 94.7 140.6 100.6 73.7 119.3 103.0 774.0
(ii) Tranche 2 (L2797) Actual 47.6 98.7 67.9 42.9 85.2 84.5 426.8
Total Actual 8.8 51.0 49.3 33.0 142.3 239.2 168.5 116.7 204.5 187.4 1,200.7 Total at 2021 Price 14.7 77.9 68.9 42.8 173.7 281.3 203.7 138.3 234.3 206.1 1,441.6 Economic Cost 12.8 68.1 60.2 37.4 151.8 245.8 178.0 120.8 204.8 180.1 1,259.7 D. Water Supply - Roorkee
(ii) Tranche 2 (L2797) Actual 49.5 132.8 92.5 87.0 205.7 101.6 669.1
Total at 2021 Price - - - - 60.4 156.1 111.8 103.1 235.6 111.8 778.9 Economic Cost - - - - 52.8 136.4 97.7 90.1 205.9 97.7 680.6 E. Water Supply - Ramnagar
(ii) Tranche 2 (L2797) Actual 0.6 57.9 160.6 132.1 148.9 57.7 557.8
Total at 2021 Price - - - - 0.7 68.1 194.2 156.6 170.6 63.5 653.6 Economic Cost - - - - 0.6 59.5 169.7 136.9 149.0 55.5 571.1 II. SEWERAGE
G. Sewerage - Roorkee
9 Shadow wage factor 0.89 was estimated through dividing ₹300 per day (unskilled agriculture labor cost) by ₹338.1
per day (Government of Uttarakhand suggested minimum wage for unskilled labor in 2020). 10 Shadow Exchange Rate Factor (SERF) = 1+ (Customs duties) / (Exports + Imports). The data for the period 2015-
2019 was used to estimate the SERF.
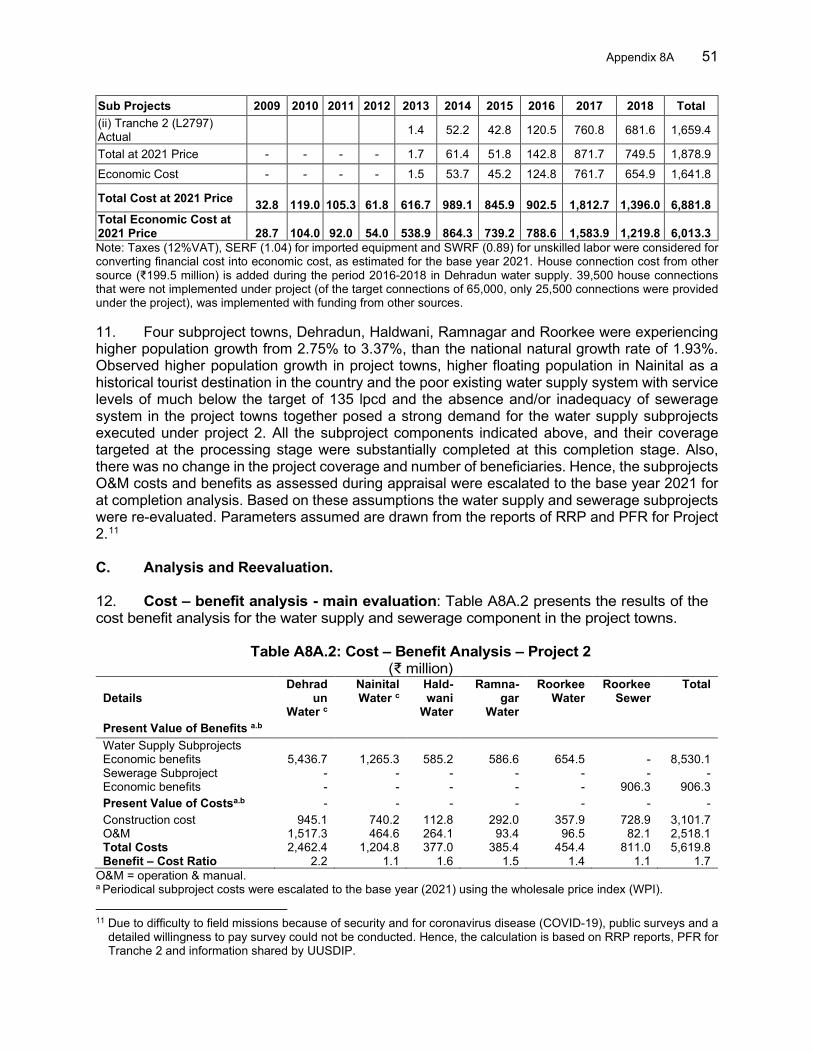
Appendix 8A 51
Sub Projects 2009 2010 2011 2012 2013 2014 2015 2016 2017 2018 Total (ii) Tranche 2 (L2797) Actual 1.4 52.2 42.8 120.5 760.8 681.6 1,659.4
Total at 2021 Price - - - - 1.7 61.4 51.8 142.8 871.7 749.5 1,878.9 Economic Cost - - - - 1.5 53.7 45.2 124.8 761.7 654.9 1,641.8
Total Cost at 2021 Price 32.8
119.0
105.3
61.8
616.7
989.1
845.9
902.5
1,812.7
1,396.0
6,881.8
Total Economic Cost at 2021 Price
28.7
104.0
92.0
54.0
538.9
864.3
739.2
788.6
1,583.9
1,219.8
6,013.3
Note: Taxes (12%VAT), SERF (1.04) for imported equipment and SWRF (0.89) for unskilled labor were considered for converting financial cost into economic cost, as estimated for the base year 2021. House connection cost from other source (₹199.5 million) is added during the period 2016-2018 in Dehradun water supply. 39,500 house connections that were not implemented under project (of the target connections of 65,000, only 25,500 connections were provided under the project), was implemented with funding from other sources.
11. Four subproject towns, Dehradun, Haldwani, Ramnagar and Roorkee were experiencing higher population growth from 2.75% to 3.37%, than the national natural growth rate of 1.93%. Observed higher population growth in project towns, higher floating population in Nainital as a historical tourist destination in the country and the poor existing water supply system with service levels of much below the target of 135 lpcd and the absence and/or inadequacy of sewerage system in the project towns together posed a strong demand for the water supply subprojects executed under project 2. All the subproject components indicated above, and their coverage targeted at the processing stage were substantially completed at this completion stage. Also, there was no change in the project coverage and number of beneficiaries. Hence, the subprojects O&M costs and benefits as assessed during appraisal were escalated to the base year 2021 for at completion analysis. Based on these assumptions the water supply and sewerage subprojects were re-evaluated. Parameters assumed are drawn from the reports of RRP and PFR for Project 2.11 C. Analysis and Reevaluation. 12. Cost – benefit analysis - main evaluation: Table A8A.2 presents the results of the cost benefit analysis for the water supply and sewerage component in the project towns.
Table A8A.2: Cost – Benefit Analysis – Project 2 (₹ million)
Details Dehrad
un Water c
Nainital Water c
Hald-wani
Water
Ramna-gar
Water
Roorkee Water
Roorkee Sewer
Total
Present Value of Benefits a.b
Water Supply Subprojects Economic benefits 5,436.7 1,265.3 585.2 586.6 654.5 - 8,530.1 Sewerage Subproject - - - - - - - Economic benefits - - - - - 906.3 906.3 Present Value of Costsa.b - - - - - - - Construction cost 945.1 740.2 112.8 292.0 357.9 728.9 3,101.7 O&M 1,517.3 464.6 264.1 93.4 96.5 82.1 2,518.1 Total Costs 2,462.4 1,204.8 377.0 385.4 454.4 811.0 5,619.8 Benefit – Cost Ratio 2.2 1.1 1.6 1.5 1.4 1.1 1.7
O&M = operation & manual. a Periodical subproject costs were escalated to the base year (2021) using the wholesale price index (WPI).
11 Due to difficulty to field missions because of security and for coronavirus disease (COVID-19), public surveys and a
detailed willingness to pay survey could not be conducted. Hence, the calculation is based on RRP reports, PFR for Tranche 2 and information shared by UUSDIP.
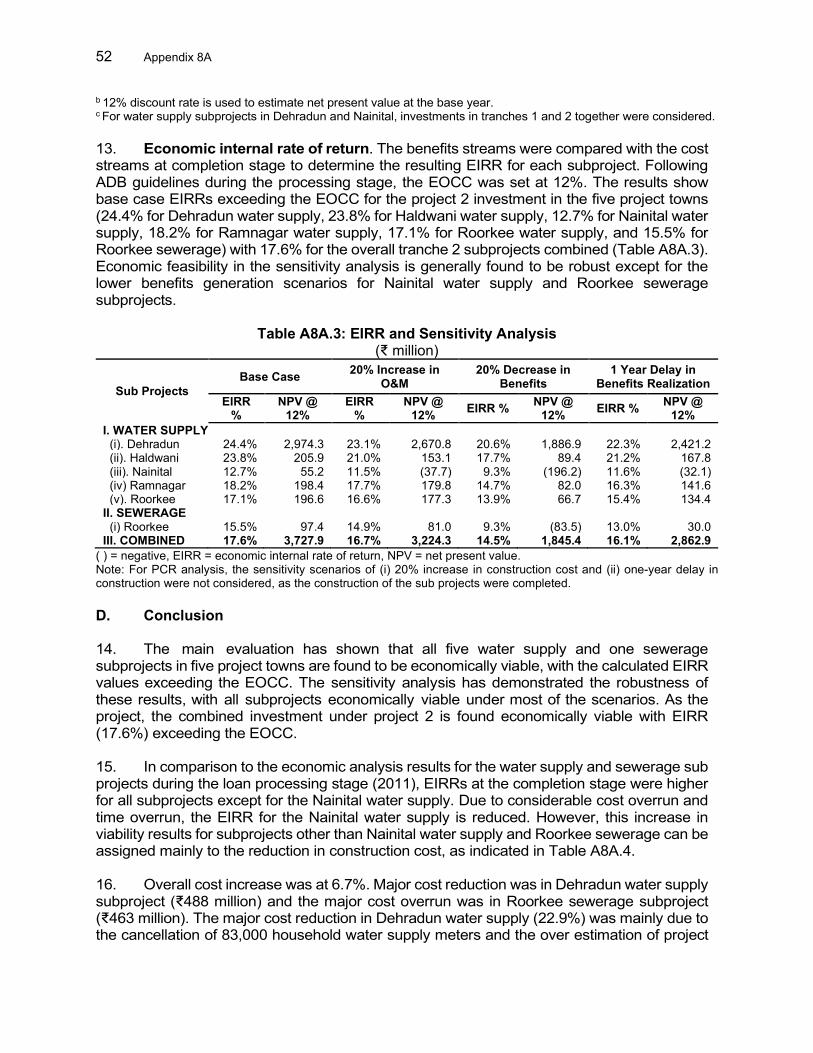
52 Appendix 8A
b 12% discount rate is used to estimate net present value at the base year. c For water supply subprojects in Dehradun and Nainital, investments in tranches 1 and 2 together were considered. 13. Economic internal rate of return. The benefits streams were compared with the cost streams at completion stage to determine the resulting EIRR for each subproject. Following ADB guidelines during the processing stage, the EOCC was set at 12%. The results show base case EIRRs exceeding the EOCC for the project 2 investment in the five project towns (24.4% for Dehradun water supply, 23.8% for Haldwani water supply, 12.7% for Nainital water supply, 18.2% for Ramnagar water supply, 17.1% for Roorkee water supply, and 15.5% for Roorkee sewerage) with 17.6% for the overall tranche 2 subprojects combined (Table A8A.3). Economic feasibility in the sensitivity analysis is generally found to be robust except for the lower benefits generation scenarios for Nainital water supply and Roorkee sewerage subprojects.
Table A8A.3: EIRR and Sensitivity Analysis (₹ million)
Sub Projects Base Case 20% Increase in
O&M 20% Decrease in
Benefits 1 Year Delay in
Benefits Realization EIRR
% NPV @
12% EIRR
% NPV @
12% EIRR % NPV @ 12% EIRR % NPV @
12% I. WATER SUPPLY (i). Dehradun 24.4% 2,974.3 23.1% 2,670.8 20.6% 1,886.9 22.3% 2,421.2 (ii). Haldwani 23.8% 205.9 21.0% 153.1 17.7% 89.4 21.2% 167.8 (iii). Nainital 12.7% 55.2 11.5% (37.7) 9.3% (196.2) 11.6% (32.1) (iv) Ramnagar 18.2% 198.4 17.7% 179.8 14.7% 82.0 16.3% 141.6 (v). Roorkee 17.1% 196.6 16.6% 177.3 13.9% 66.7 15.4% 134.4 II. SEWERAGE (i) Roorkee 15.5% 97.4 14.9% 81.0 9.3% (83.5) 13.0% 30.0 III. COMBINED 17.6% 3,727.9 16.7% 3,224.3 14.5% 1,845.4 16.1% 2,862.9
( ) = negative, EIRR = economic internal rate of return, NPV = net present value. Note: For PCR analysis, the sensitivity scenarios of (i) 20% increase in construction cost and (ii) one-year delay in construction were not considered, as the construction of the sub projects were completed. D. Conclusion
14. The main evaluation has shown that all five water supply and one sewerage subprojects in five project towns are found to be economically viable, with the calculated EIRR values exceeding the EOCC. The sensitivity analysis has demonstrated the robustness of these results, with all subprojects economically viable under most of the scenarios. As the project, the combined investment under project 2 is found economically viable with EIRR (17.6%) exceeding the EOCC. 15. In comparison to the economic analysis results for the water supply and sewerage sub projects during the loan processing stage (2011), EIRRs at the completion stage were higher for all subprojects except for the Nainital water supply. Due to considerable cost overrun and time overrun, the EIRR for the Nainital water supply is reduced. However, this increase in viability results for subprojects other than Nainital water supply and Roorkee sewerage can be assigned mainly to the reduction in construction cost, as indicated in Table A8A.4. 16. Overall cost increase was at 6.7%. Major cost reduction was in Dehradun water supply subproject (₹488 million) and the major cost overrun was in Roorkee sewerage subproject (₹463 million). The major cost reduction in Dehradun water supply (22.9%) was mainly due to the cancellation of 83,000 household water supply meters and the over estimation of project
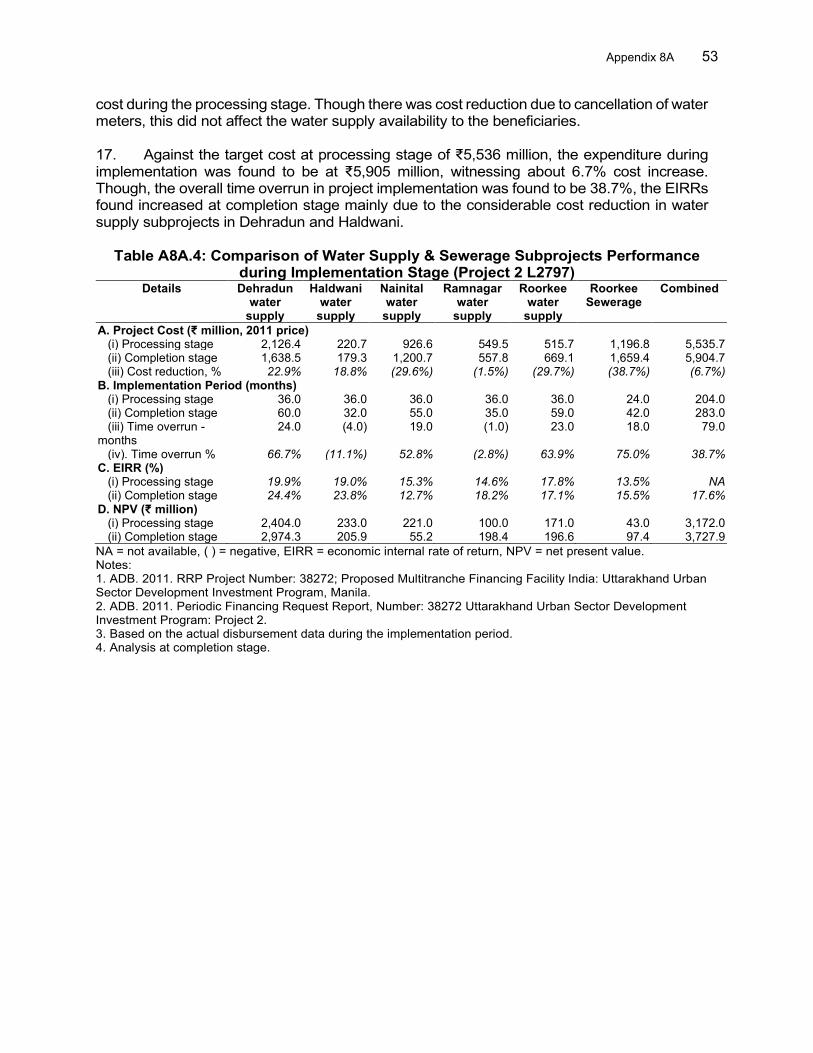
Appendix 8A 53
cost during the processing stage. Though there was cost reduction due to cancellation of water meters, this did not affect the water supply availability to the beneficiaries. 17. Against the target cost at processing stage of ₹5,536 million, the expenditure during implementation was found to be at ₹5,905 million, witnessing about 6.7% cost increase. Though, the overall time overrun in project implementation was found to be 38.7%, the EIRRs found increased at completion stage mainly due to the considerable cost reduction in water supply subprojects in Dehradun and Haldwani.
Table A8A.4: Comparison of Water Supply & Sewerage Subprojects Performance during Implementation Stage (Project 2 L2797)
Details Dehradun water
supply
Haldwani water
supply
Nainital water
supply
Ramnagar water
supply
Roorkee water
supply
Roorkee Sewerage
Combined
A. Project Cost (₹ million, 2011 price) (i) Processing stage 2,126.4 220.7 926.6 549.5 515.7 1,196.8 5,535.7 (ii) Completion stage 1,638.5 179.3 1,200.7 557.8 669.1 1,659.4 5,904.7 (iii) Cost reduction, % 22.9% 18.8% (29.6%) (1.5%) (29.7%) (38.7%) (6.7%) B. Implementation Period (months) (i) Processing stage 36.0 36.0 36.0 36.0 36.0 24.0 204.0 (ii) Completion stage 60.0 32.0 55.0 35.0 59.0 42.0 283.0 (iii) Time overrun - months
24.0 (4.0) 19.0 (1.0) 23.0 18.0 79.0
(iv). Time overrun % 66.7% (11.1%) 52.8% (2.8%) 63.9% 75.0% 38.7% C. EIRR (%)
(i) Processing stage 19.9% 19.0% 15.3% 14.6% 17.8% 13.5% NA (ii) Completion stage 24.4% 23.8% 12.7% 18.2% 17.1% 15.5% 17.6% D. NPV (₹ million) (i) Processing stage 2,404.0 233.0 221.0 100.0 171.0 43.0 3,172.0 (ii) Completion stage 2,974.3 205.9 55.2 198.4 196.6 97.4 3,727.9 NA = not available, ( ) = negative, EIRR = economic internal rate of return, NPV = net present value. Notes: 1. ADB. 2011. RRP Project Number: 38272; Proposed Multitranche Financing Facility India: Uttarakhand Urban Sector Development Investment Program, Manila. 2. ADB. 2011. Periodic Financing Request Report, Number: 38272 Uttarakhand Urban Sector Development Investment Program: Project 2. 3. Based on the actual disbursement data during the implementation period. 4. Analysis at completion stage.
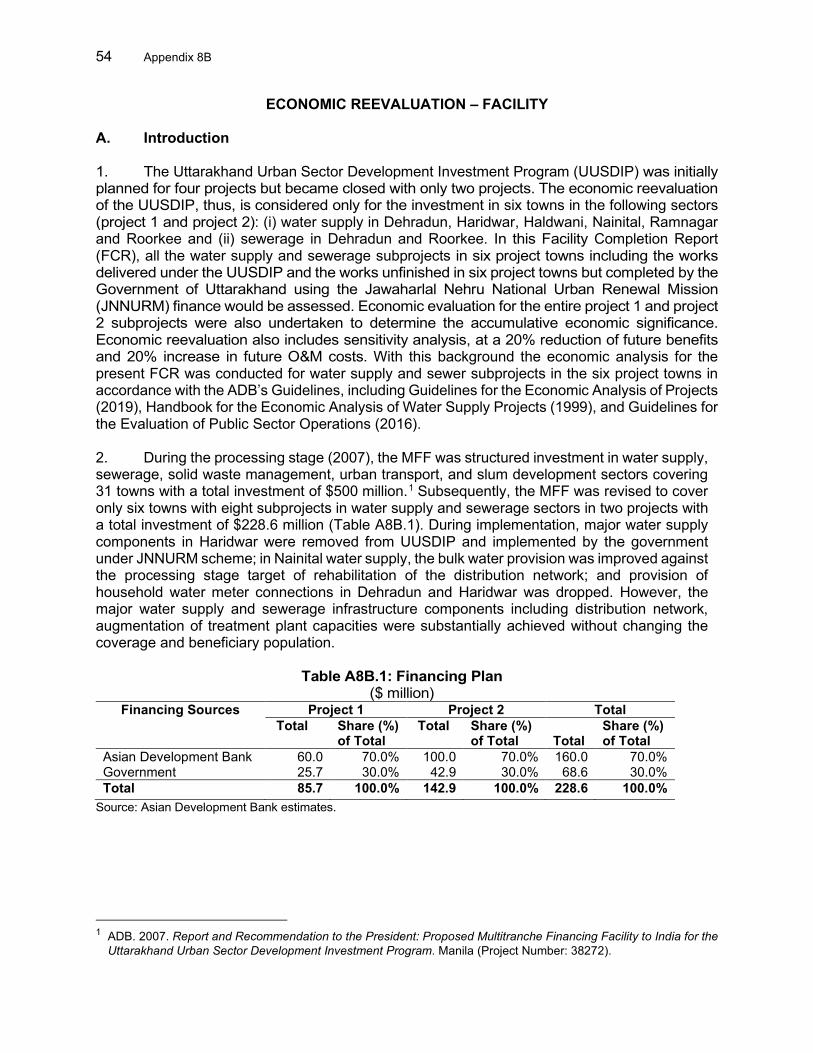
54 Appendix 8B
ECONOMIC REEVALUATION – FACILITY A. Introduction
1. The Uttarakhand Urban Sector Development Investment Program (UUSDIP) was initially planned for four projects but became closed with only two projects. The economic reevaluation of the UUSDIP, thus, is considered only for the investment in six towns in the following sectors (project 1 and project 2): (i) water supply in Dehradun, Haridwar, Haldwani, Nainital, Ramnagar and Roorkee and (ii) sewerage in Dehradun and Roorkee. In this Facility Completion Report (FCR), all the water supply and sewerage subprojects in six project towns including the works delivered under the UUSDIP and the works unfinished in six project towns but completed by the Government of Uttarakhand using the Jawaharlal Nehru National Urban Renewal Mission (JNNURM) finance would be assessed. Economic evaluation for the entire project 1 and project 2 subprojects were also undertaken to determine the accumulative economic significance. Economic reevaluation also includes sensitivity analysis, at a 20% reduction of future benefits and 20% increase in future O&M costs. With this background the economic analysis for the present FCR was conducted for water supply and sewer subprojects in the six project towns in accordance with the ADB’s Guidelines, including Guidelines for the Economic Analysis of Projects (2019), Handbook for the Economic Analysis of Water Supply Projects (1999), and Guidelines for the Evaluation of Public Sector Operations (2016). 2. During the processing stage (2007), the MFF was structured investment in water supply, sewerage, solid waste management, urban transport, and slum development sectors covering 31 towns with a total investment of $500 million.1 Subsequently, the MFF was revised to cover only six towns with eight subprojects in water supply and sewerage sectors in two projects with a total investment of $228.6 million (Table A8B.1). During implementation, major water supply components in Haridwar were removed from UUSDIP and implemented by the government under JNNURM scheme; in Nainital water supply, the bulk water provision was improved against the processing stage target of rehabilitation of the distribution network; and provision of household water meter connections in Dehradun and Haridwar was dropped. However, the major water supply and sewerage infrastructure components including distribution network, augmentation of treatment plant capacities were substantially achieved without changing the coverage and beneficiary population.
Table A8B.1: Financing Plan
($ million) Financing Sources Project 1 Project 2 Total
Total Share (%) of Total
Total Share (%) of Total
Total
Share (%) of Total
Asian Development Bank 60.0 70.0% 100.0 70.0% 160.0 70.0% Government 25.7 30.0% 42.9 30.0% 68.6 30.0% Total 85.7 100.0% 142.9 100.0% 228.6 100.0%
Source: Asian Development Bank estimates.
1 ADB. 2007. Report and Recommendation to the President: Proposed Multitranche Financing Facility to India for the
Uttarakhand Urban Sector Development Investment Program. Manila (Project Number: 38272).
Appendix 8B 55
B. At Appraisal 1. Project 1
3. Cost and benefit analysis cover a 20-year period and used 2007 domestic prices. Economic costs identified for the subprojects are project investment and operation and maintenance costs. Financial costs are converted to economic costs by the shadow exchange rate factor (SERF) estimated at 1.06 and the shadow wage rate factor (SWRF) estimated at 0.70 based on the minimum wage of unskilled labor and the rural labor wage of casual labor. Taxes and duties are excluded. 4. Economic benefits, on the other hand, assumed increase in the coverage of the respective services indicated in financial improvement action plan. Benefit of the water supply subprojects consist of (i) labor cost saved among the new house connection users who used to fetch water from stand posts2 and other sources, (ii) water tank cost saved 3 amongst the new house connection users, and (iii) non-incremental benefit4 of stand post users. For the sewerage project, the economic benefits include (i) disabilities days5 reduced due to improved sanitation, (ii) medical costs6 saved due to improved sanitation, (iii) septic tank and soak pit costs saved among new users, 7 (iv) septic tank and soak pit maintenance costs saved amongst existing users,8 and (v) reduced extent of damages from floods9 due to better drain. 5. The selection criteria for the subprojects require an EIRR exceeding economic opportunity cost of capital (EOCC) of 12% for investments under the project 1. Results of the economic evaluation and the resultant EIRR (base case)10 were: (i) Dehradun water supply (36.6%), (ii) Nainital water supply (16.1%), (iii) Haridwar water supply (18.1%), and (iv) Dehradun sewerage (18.7%).
2. Project 2 6. Cost and benefit analysis cover 33-year period with three years construction and used 2011 domestic prices. Economic costs identified for the subprojects are project investment and
2 The socioeconomic survey under TA4611-IND Uttarakhand Urban Development Program shows that stand post
users spend 0.55 hours in Dehradun, 0.60 hours in Haridwar, and 0.57 hours in Nainital per day. 3 In 2007, a household with a house connection had access to water for 24 hours by storing water in a water tank
during limited supply hours. Once 24-hour water supply is achieved, a new consumer will not purchase a water tank, which was used to store water during a few hours of supply time.
4 Stand post users were not required to pay any fee for water. Once they get their house connection, they will have to pay about less than $1 per month for usage, and therefore, this is a negative benefit
5 The World Health Organization’s disability-adjusted life years (DALY) data of South Asia indicates that approximately, 5.2% of total DALY is derived from diarrheal diseases and schistosomiasis. These are considered to be typical water-borne diseases. The socioeconomic survey under TA4611-IND Uttarakhand Urban Sector Development Program showed that respondents lost 0.4 day per person per year on average. Using the same proportion, it is assumed that 0.02 day is derived from water-borne disease due to bad sanitation.
6 The socioeconomic survey under TA4611-IND Uttarakhand Urban Sector Development Program indicates that respondents spent ₹110 per person per year. Using the same proportion in DALY, it was assumed that 5.2% of the annual average medical cost is spent on curing water-borne disease.
7 The new customers without a sanitation facility will not have to purchase a septic tank and a soak pit where underground sewerage system is available. The equipment cost was estimated at ₹25,000.
8 The new customers with a sanitation facility will not have to pay the maintenance costs of a septic tank and a soak pit once connected to the underground sewerage system. This will save ₹750 per year.
9 The socioeconomic survey under TA4611-IND Uttarakhand Urban Sector Development Program showed 27.7% of the respondents suffered from flood and spent ₹2,500 per year for recovery.
10 Results of three water supply subprojects (Dehradun, Nainital and Haridwar) had considered the total project cost incurred under Tranches 1 and 2.
56 Appendix 8B
operation and maintenance costs. Financial costs are converted to economic costs by the shadow exchange rate factor (SERF) estimated at 1.0411 and the shadow wage rate factor (SWRF) estimated at 0.712 based on the minimum wage of unskilled labor and the rural labor wage of casual labor. Taxes and duties are excluded. 7. The selection criteria for the subprojects require an EIRR exceeding EOCC of 12% for investments under the project 2. Results of the economic evaluation and the resultant EIRR (base case)13 were: (i) Dehradun water supply (19.9%) (ii) Nainital water supply (15.3%), (iii) Haldwani water supply (19.0%), (iv) Ramnagara water supply (14.6%), (v) Roorkee water supply (17.8%), and (vi) Roorkee sewerage (13.5%). C. Performance 8. Project 1. Under project 1 of UUSIDP, the investment was made in the following sectors: (i) water supply in Dehradun, and Nainital, and (ii) sewerage in Dehradun. At this PCR stage, all the water supply and sewerage subprojects are completed. Key civil works completed include: By the project completion, the outputs under the Dehradun water supply subproject include (i) laying 155.77 km of water supply pipeline; providing 25,500 house service connections (HSCs); construction of weir; construction of one softening plant; installation of three chlorinators; renovation of 46 pump houses and replacement of pumping machinery; and procurement of seven silent mobile for Dehradun water supply subproject; (ii) laying 37.9 km pipeline; the construction of four tube wells with a total of 14 MLD cumulative water supply capacity, 22 ground/underground level service reservoirs; and four pumping stations; in Nainital water supply subproject; (iii) construction and renovation of 32 pump houses, including the replacement of pumping machinery through additional scope in Haridwar water supply subproject; and (iv) laying of 132.25 km of sewer network; construction of 68 MLD sewage treatment plant (STP); and provision of 8,284 sewer house service connections in Dehradun sewerage subproject. As indicated earlier, the major water supply subproject in Haridwar was removed from UUSIDP and implemented by the state under JNNURM scheme, except for a total of 32 pumphouses were constructed and renovated and pumping machinery were replaced under project 1 in Haridwar water supply. 9. Project 2. Project 2 aimed to complement the water supply works carried out under project 1 in Dehradun and Nainital, as well as for three additional towns—water supply in Haldwani, Ramnagar and Roorkee and sewerage in Roorkee. Key civil works include (i) construction and rehabilitation of 3 WTPs in Dehradun; and one WTP in Ramnagar with a cumulative increase of 68 MLD WTP capacity; (ii) laying of 457.41 km of pipeline (100.13 km in Dehradun, 201.97 km in Roorkee, 70 km in Nainital, 74.51 km in Ramnagar and 10.8 km in Haldwani); (iii) construction of 14 pump houses (6 in Dehradun and eight in Roorkee); (iv) construction of 14 tube wells (6 in Dehradun and eight in Roorkee); (v) construction of 22 overhead tanks (three in Roorkee, three in Ramnagar, and 16 in Haldwani); (vi) construction of three ground/underground level service reservoirs (two in Ramnagar and one in Haldwani); (vii) installation of 109 bulk water meters (54 in Dehradun and 55 in Nainital);(viii) one STP with 33 MLD treatment capacity in Roorkee; and (ix) installation of 86.2 km sewer pipes.
11 Estimated based on the actual import and export figures from 2005 to 2009. Source: Reserve Bank of India. 12 Estimated based on the current actual minimum wage for unskilled workers in Uttarakhand. Paycheck India. Minimum
Wages in Uttarakhand. 13 Results of two water supply subprojects (Dehradun and Nainital) had considered the total project cost incurred under
Tranches 1 and 2. Other subprojects are standalone and implemented under tranche 2 only.
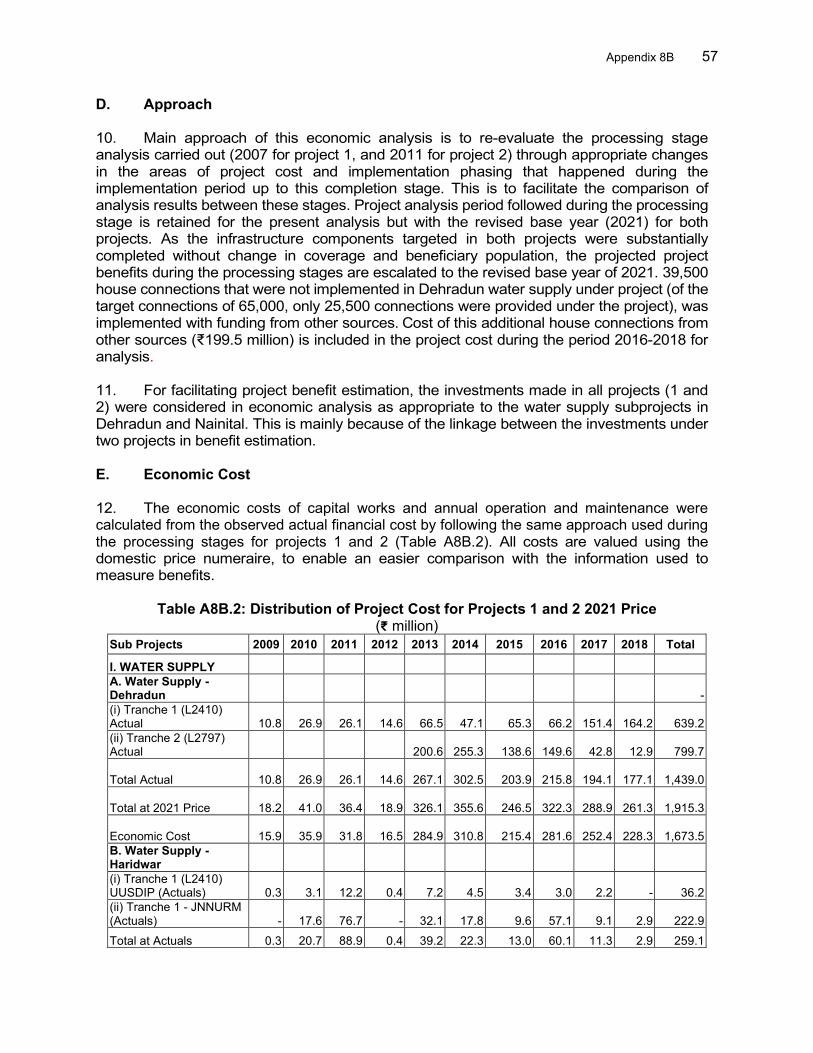
Appendix 8B 57
D. Approach
10. Main approach of this economic analysis is to re-evaluate the processing stage analysis carried out (2007 for project 1, and 2011 for project 2) through appropriate changes in the areas of project cost and implementation phasing that happened during the implementation period up to this completion stage. This is to facilitate the comparison of analysis results between these stages. Project analysis period followed during the processing stage is retained for the present analysis but with the revised base year (2021) for both projects. As the infrastructure components targeted in both projects were substantially completed without change in coverage and beneficiary population, the projected project benefits during the processing stages are escalated to the revised base year of 2021. 39,500 house connections that were not implemented in Dehradun water supply under project (of the target connections of 65,000, only 25,500 connections were provided under the project), was implemented with funding from other sources. Cost of this additional house connections from other sources (₹199.5 million) is included in the project cost during the period 2016-2018 for analysis. 11. For facilitating project benefit estimation, the investments made in all projects (1 and 2) were considered in economic analysis as appropriate to the water supply subprojects in Dehradun and Nainital. This is mainly because of the linkage between the investments under two projects in benefit estimation. E. Economic Cost
12. The economic costs of capital works and annual operation and maintenance were calculated from the observed actual financial cost by following the same approach used during the processing stages for projects 1 and 2 (Table A8B.2). All costs are valued using the domestic price numeraire, to enable an easier comparison with the information used to measure benefits.
Table A8B.2: Distribution of Project Cost for Projects 1 and 2 2021 Price (₹ million)
Sub Projects 2009 2010 2011 2012 2013 2014 2015 2016 2017 2018 Total
I. WATER SUPPLY A. Water Supply - Dehradun - (i) Tranche 1 (L2410) Actual
10.8
26.9
26.1
14.6
66.5
47.1
65.3
66.2
151.4
164.2
639.2
(ii) Tranche 2 (L2797) Actual
200.6
255.3
138.6
149.6
42.8
12.9
799.7
Total Actual
10.8
26.9
26.1
14.6
267.1
302.5
203.9
215.8
194.1
177.1
1,439.0
Total at 2021 Price
18.2
41.0
36.4
18.9
326.1
355.6
246.5
322.3
288.9
261.3
1,915.3
Economic Cost
15.9
35.9
31.8
16.5
284.9
310.8
215.4
281.6
252.4
228.3
1,673.5 B. Water Supply - Haridwar (i) Tranche 1 (L2410) UUSDIP (Actuals) 0.3 3.1 12.2 0.4 7.2 4.5 3.4 3.0 2.2 - 36.2 (ii) Tranche 1 - JNNURM (Actuals) - 17.6 76.7 - 32.1 17.8 9.6 57.1 9.1 2.9 222.9 Total at Actuals 0.3 20.7 88.9 0.4 39.2 22.3 13.0 60.1 11.3 2.9 259.1
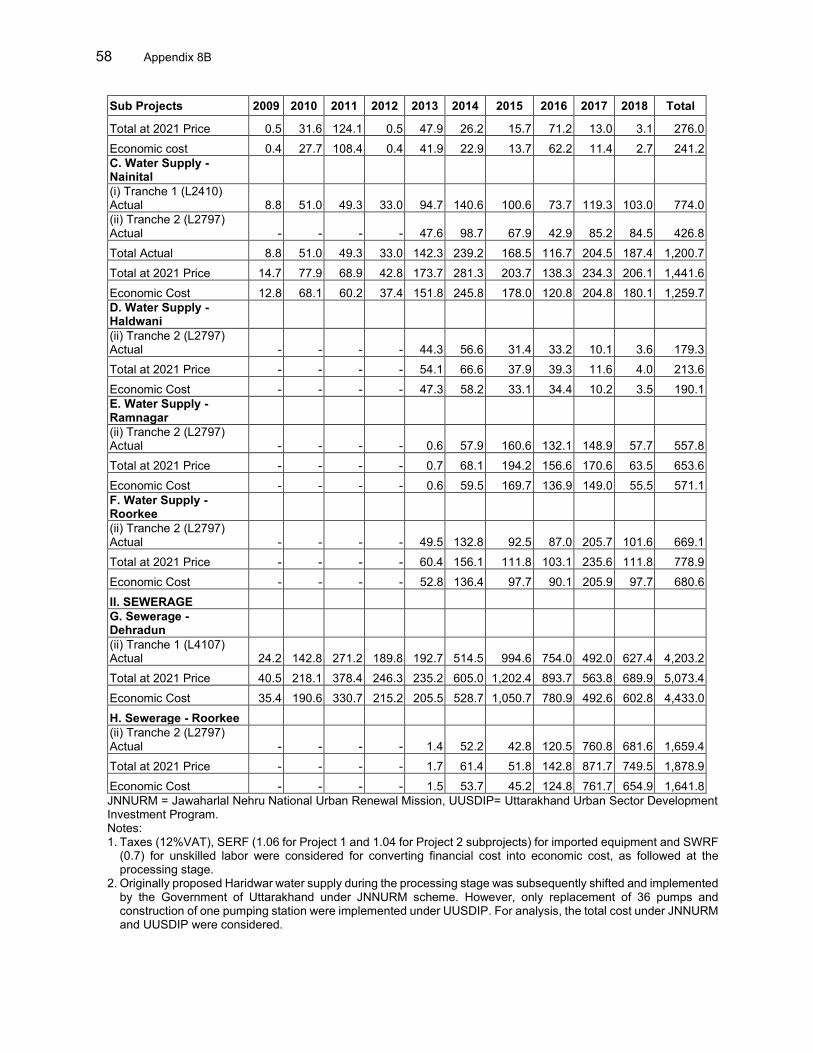
58 Appendix 8B
Sub Projects 2009 2010 2011 2012 2013 2014 2015 2016 2017 2018 Total
Total at 2021 Price 0.5 31.6 124.1 0.5 47.9 26.2 15.7 71.2 13.0 3.1 276.0 Economic cost 0.4 27.7 108.4 0.4 41.9 22.9 13.7 62.2 11.4 2.7 241.2 C. Water Supply - Nainital (i) Tranche 1 (L2410) Actual 8.8 51.0 49.3 33.0 94.7 140.6 100.6 73.7 119.3 103.0 774.0 (ii) Tranche 2 (L2797) Actual - - - - 47.6 98.7 67.9 42.9 85.2 84.5 426.8 Total Actual 8.8 51.0 49.3 33.0 142.3 239.2 168.5 116.7 204.5 187.4 1,200.7 Total at 2021 Price 14.7 77.9 68.9 42.8 173.7 281.3 203.7 138.3 234.3 206.1 1,441.6 Economic Cost 12.8 68.1 60.2 37.4 151.8 245.8 178.0 120.8 204.8 180.1 1,259.7 D. Water Supply - Haldwani (ii) Tranche 2 (L2797) Actual - - - - 44.3 56.6 31.4 33.2 10.1 3.6 179.3 Total at 2021 Price - - - - 54.1 66.6 37.9 39.3 11.6 4.0 213.6 Economic Cost - - - - 47.3 58.2 33.1 34.4 10.2 3.5 190.1 E. Water Supply - Ramnagar (ii) Tranche 2 (L2797) Actual - - - - 0.6 57.9 160.6 132.1 148.9 57.7 557.8 Total at 2021 Price - - - - 0.7 68.1 194.2 156.6 170.6 63.5 653.6 Economic Cost - - - - 0.6 59.5 169.7 136.9 149.0 55.5 571.1 F. Water Supply - Roorkee (ii) Tranche 2 (L2797) Actual - - - - 49.5 132.8 92.5 87.0 205.7 101.6 669.1 Total at 2021 Price - - - - 60.4 156.1 111.8 103.1 235.6 111.8 778.9 Economic Cost - - - - 52.8 136.4 97.7 90.1 205.9 97.7 680.6 II. SEWERAGE G. Sewerage - Dehradun (ii) Tranche 1 (L4107) Actual 24.2 142.8 271.2 189.8 192.7 514.5 994.6 754.0 492.0 627.4 4,203.2 Total at 2021 Price 40.5 218.1 378.4 246.3 235.2 605.0 1,202.4 893.7 563.8 689.9 5,073.4 Economic Cost 35.4 190.6 330.7 215.2 205.5 528.7 1,050.7 780.9 492.6 602.8 4,433.0 H. Sewerage - Roorkee (ii) Tranche 2 (L2797) Actual - - - - 1.4 52.2 42.8 120.5 760.8 681.6 1,659.4 Total at 2021 Price - - - - 1.7 61.4 51.8 142.8 871.7 749.5 1,878.9 Economic Cost - - - - 1.5 53.7 45.2 124.8 761.7 654.9 1,641.8 JNNURM = Jawaharlal Nehru National Urban Renewal Mission, UUSDIP= Uttarakhand Urban Sector Development Investment Program. Notes: 1. Taxes (12%VAT), SERF (1.06 for Project 1 and 1.04 for Project 2 subprojects) for imported equipment and SWRF
(0.7) for unskilled labor were considered for converting financial cost into economic cost, as followed at the processing stage.
2. Originally proposed Haridwar water supply during the processing stage was subsequently shifted and implemented by the Government of Uttarakhand under JNNURM scheme. However, only replacement of 36 pumps and construction of one pumping station were implemented under UUSDIP. For analysis, the total cost under JNNURM and UUSDIP were considered.
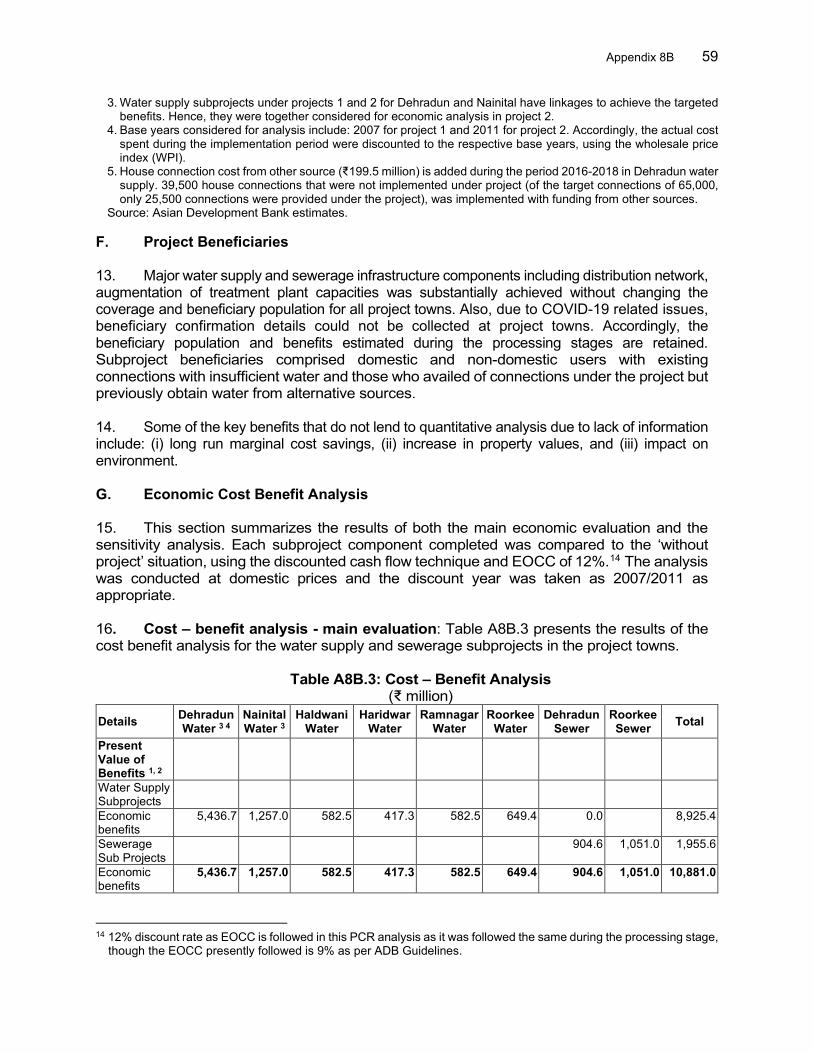
Appendix 8B 59
3. Water supply subprojects under projects 1 and 2 for Dehradun and Nainital have linkages to achieve the targeted benefits. Hence, they were together considered for economic analysis in project 2.
4. Base years considered for analysis include: 2007 for project 1 and 2011 for project 2. Accordingly, the actual cost spent during the implementation period were discounted to the respective base years, using the wholesale price index (WPI).
5. House connection cost from other source (₹199.5 million) is added during the period 2016-2018 in Dehradun water supply. 39,500 house connections that were not implemented under project (of the target connections of 65,000, only 25,500 connections were provided under the project), was implemented with funding from other sources.
Source: Asian Development Bank estimates. F. Project Beneficiaries
13. Major water supply and sewerage infrastructure components including distribution network, augmentation of treatment plant capacities was substantially achieved without changing the coverage and beneficiary population for all project towns. Also, due to COVID-19 related issues, beneficiary confirmation details could not be collected at project towns. Accordingly, the beneficiary population and benefits estimated during the processing stages are retained. Subproject beneficiaries comprised domestic and non-domestic users with existing connections with insufficient water and those who availed of connections under the project but previously obtain water from alternative sources. 14. Some of the key benefits that do not lend to quantitative analysis due to lack of information include: (i) long run marginal cost savings, (ii) increase in property values, and (iii) impact on environment. G. Economic Cost Benefit Analysis
15. This section summarizes the results of both the main economic evaluation and the sensitivity analysis. Each subproject component completed was compared to the ‘without project’ situation, using the discounted cash flow technique and EOCC of 12%.14 The analysis was conducted at domestic prices and the discount year was taken as 2007/2011 as appropriate. 16. Cost – benefit analysis - main evaluation: Table A8B.3 presents the results of the cost benefit analysis for the water supply and sewerage subprojects in the project towns.
Table A8B.3: Cost – Benefit Analysis (₹ million)
Details Dehradun Water 3 4
Nainital Water 3
Haldwani Water
Haridwar Water
Ramnagar Water
Roorkee Water
Dehradun Sewer
Roorkee Sewer Total
Present Value of Benefits 1, 2
Water Supply Subprojects
Economic benefits
5,436.7 1,257.0 582.5 417.3 582.5 649.4 0.0
8,925.4
Sewerage Sub Projects
904.6 1,051.0 1,955.6
Economic benefits
5,436.7 1,257.0 582.5 417.3 582.5 649.4 904.6 1,051.0 10,881.0
14 12% discount rate as EOCC is followed in this PCR analysis as it was followed the same during the processing stage,
though the EOCC presently followed is 9% as per ADB Guidelines.
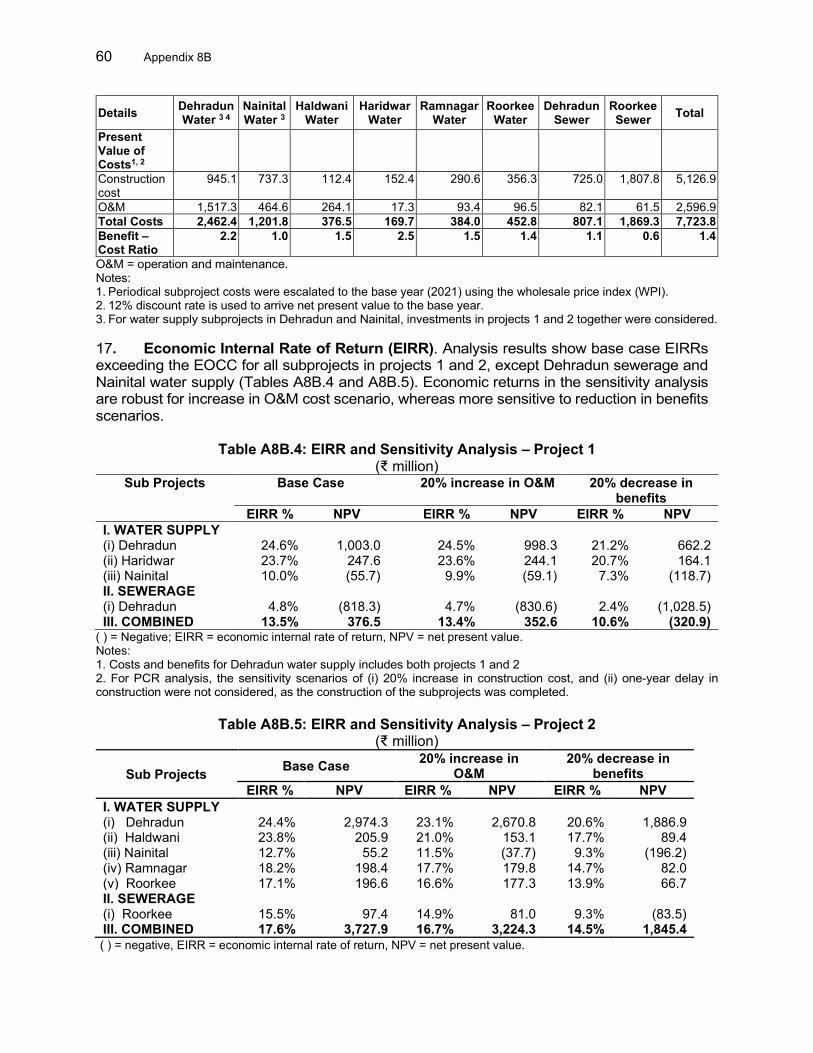
60 Appendix 8B
Details Dehradun Water 3 4
Nainital Water 3
Haldwani Water
Haridwar Water
Ramnagar Water
Roorkee Water
Dehradun Sewer
Roorkee Sewer Total
Present Value of Costs1, 2
Construction cost
945.1 737.3 112.4 152.4 290.6 356.3 725.0 1,807.8 5,126.9
O&M 1,517.3 464.6 264.1 17.3 93.4 96.5 82.1 61.5 2,596.9 Total Costs 2,462.4 1,201.8 376.5 169.7 384.0 452.8 807.1 1,869.3 7,723.8 Benefit – Cost Ratio
2.2 1.0 1.5 2.5 1.5 1.4 1.1 0.6 1.4
O&M = operation and maintenance. Notes: 1. Periodical subproject costs were escalated to the base year (2021) using the wholesale price index (WPI). 2. 12% discount rate is used to arrive net present value to the base year. 3. For water supply subprojects in Dehradun and Nainital, investments in projects 1 and 2 together were considered.
17. Economic Internal Rate of Return (EIRR). Analysis results show base case EIRRs exceeding the EOCC for all subprojects in projects 1 and 2, except Dehradun sewerage and Nainital water supply (Tables A8B.4 and A8B.5). Economic returns in the sensitivity analysis are robust for increase in O&M cost scenario, whereas more sensitive to reduction in benefits scenarios.
Table A8B.4: EIRR and Sensitivity Analysis – Project 1 (₹ million)
Sub Projects Base Case 20% increase in O&M 20% decrease in benefits
EIRR % NPV EIRR % NPV EIRR % NPV I. WATER SUPPLY (i) Dehradun 24.6% 1,003.0 24.5% 998.3 21.2% 662.2 (ii) Haridwar 23.7% 247.6 23.6% 244.1 20.7% 164.1 (iii) Nainital 10.0% (55.7) 9.9% (59.1) 7.3% (118.7) II. SEWERAGE (i) Dehradun 4.8% (818.3) 4.7% (830.6) 2.4% (1,028.5) III. COMBINED 13.5% 376.5 13.4% 352.6 10.6% (320.9)
( ) = Negative; EIRR = economic internal rate of return, NPV = net present value. Notes: 1. Costs and benefits for Dehradun water supply includes both projects 1 and 2 2. For PCR analysis, the sensitivity scenarios of (i) 20% increase in construction cost, and (ii) one-year delay in construction were not considered, as the construction of the subprojects was completed.
Table A8B.5: EIRR and Sensitivity Analysis – Project 2
(₹ million)
Sub Projects Base Case 20% increase in O&M
20% decrease in benefits
EIRR % NPV EIRR % NPV EIRR % NPV I. WATER SUPPLY (i) Dehradun 24.4% 2,974.3 23.1% 2,670.8 20.6% 1,886.9 (ii) Haldwani 23.8% 205.9 21.0% 153.1 17.7% 89.4 (iii) Nainital 12.7% 55.2 11.5% (37.7) 9.3% (196.2) (iv) Ramnagar 18.2% 198.4 17.7% 179.8 14.7% 82.0 (v) Roorkee 17.1% 196.6 16.6% 177.3 13.9% 66.7 II. SEWERAGE (i) Roorkee 15.5% 97.4 14.9% 81.0 9.3% (83.5) III. COMBINED 17.6% 3,727.9 16.7% 3,224.3 14.5% 1,845.4
( ) = negative, EIRR = economic internal rate of return, NPV = net present value.
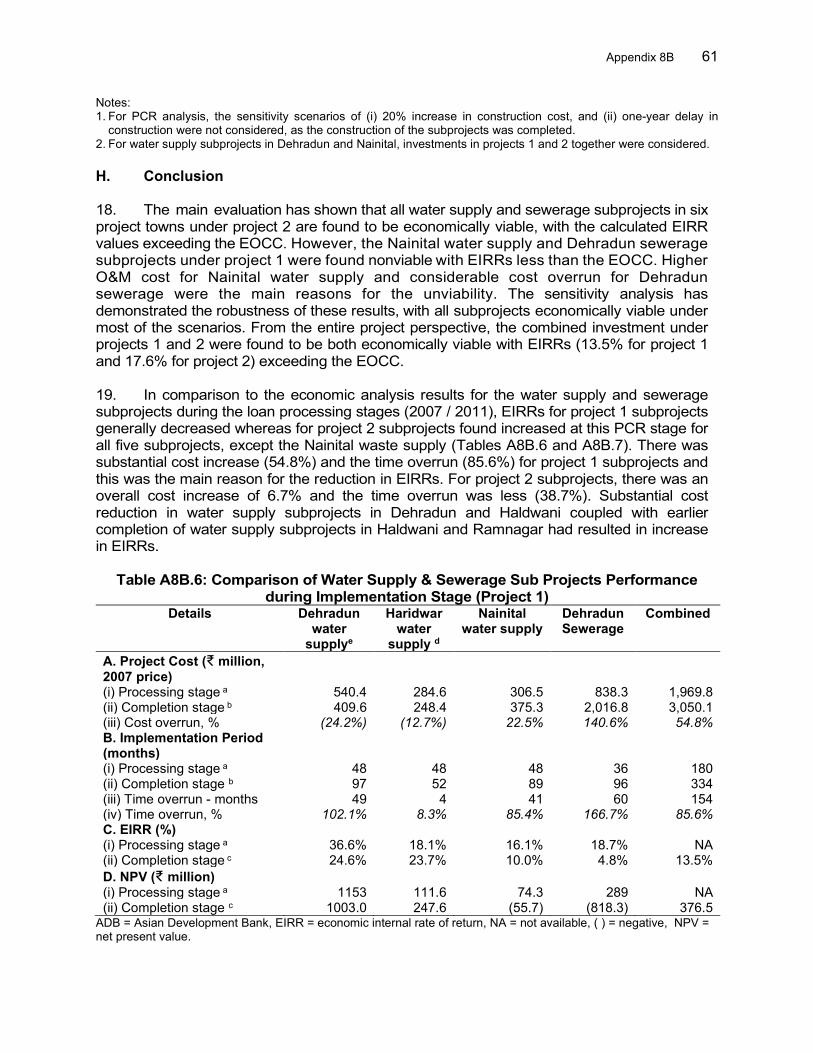
Appendix 8B 61
Notes: 1. For PCR analysis, the sensitivity scenarios of (i) 20% increase in construction cost, and (ii) one-year delay in
construction were not considered, as the construction of the subprojects was completed. 2. For water supply subprojects in Dehradun and Nainital, investments in projects 1 and 2 together were considered. H. Conclusion 18. The main evaluation has shown that all water supply and sewerage subprojects in six project towns under project 2 are found to be economically viable, with the calculated EIRR values exceeding the EOCC. However, the Nainital water supply and Dehradun sewerage subprojects under project 1 were found nonviable with EIRRs less than the EOCC. Higher O&M cost for Nainital water supply and considerable cost overrun for Dehradun sewerage were the main reasons for the unviability. The sensitivity analysis has demonstrated the robustness of these results, with all subprojects economically viable under most of the scenarios. From the entire project perspective, the combined investment under projects 1 and 2 were found to be both economically viable with EIRRs (13.5% for project 1 and 17.6% for project 2) exceeding the EOCC. 19. In comparison to the economic analysis results for the water supply and sewerage subprojects during the loan processing stages (2007 / 2011), EIRRs for project 1 subprojects generally decreased whereas for project 2 subprojects found increased at this PCR stage for all five subprojects, except the Nainital waste supply (Tables A8B.6 and A8B.7). There was substantial cost increase (54.8%) and the time overrun (85.6%) for project 1 subprojects and this was the main reason for the reduction in EIRRs. For project 2 subprojects, there was an overall cost increase of 6.7% and the time overrun was less (38.7%). Substantial cost reduction in water supply subprojects in Dehradun and Haldwani coupled with earlier completion of water supply subprojects in Haldwani and Ramnagar had resulted in increase in EIRRs.
Table A8B.6: Comparison of Water Supply & Sewerage Sub Projects Performance during Implementation Stage (Project 1)
Details Dehradun water
supplye
Haridwar water
supply d
Nainital water supply
Dehradun Sewerage
Combined
A. Project Cost (₹ million, 2007 price)
(i) Processing stage a 540.4 284.6 306.5 838.3 1,969.8 (ii) Completion stage b 409.6 248.4 375.3 2,016.8 3,050.1 (iii) Cost overrun, % (24.2%) (12.7%) 22.5% 140.6% 54.8% B. Implementation Period (months)
(i) Processing stage a 48 48 48 36 180 (ii) Completion stage b 97 52 89 96 334 (iii) Time overrun - months 49 4 41 60 154 (iv) Time overrun, % 102.1% 8.3% 85.4% 166.7% 85.6% C. EIRR (%) (i) Processing stage a 36.6% 18.1% 16.1% 18.7% NA (ii) Completion stage c 24.6% 23.7% 10.0% 4.8% 13.5% D. NPV (₹ million) (i) Processing stage a 1153 111.6 74.3 289 NA (ii) Completion stage c 1003.0 247.6 (55.7) (818.3) 376.5
ADB = Asian Development Bank, EIRR = economic internal rate of return, NA = not available, ( ) = negative, NPV = net present value.
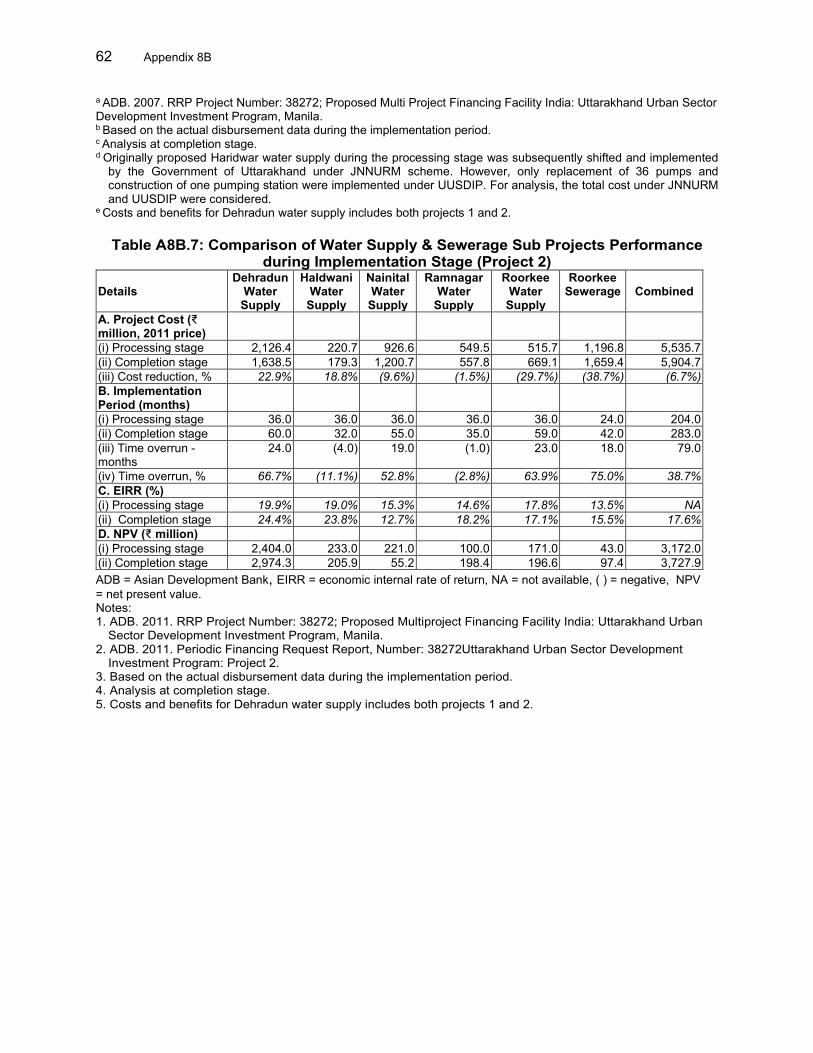
62 Appendix 8B
a ADB. 2007. RRP Project Number: 38272; Proposed Multi Project Financing Facility India: Uttarakhand Urban Sector Development Investment Program, Manila. b Based on the actual disbursement data during the implementation period. c Analysis at completion stage. d Originally proposed Haridwar water supply during the processing stage was subsequently shifted and implemented
by the Government of Uttarakhand under JNNURM scheme. However, only replacement of 36 pumps and construction of one pumping station were implemented under UUSDIP. For analysis, the total cost under JNNURM and UUSDIP were considered.
e Costs and benefits for Dehradun water supply includes both projects 1 and 2.
Table A8B.7: Comparison of Water Supply & Sewerage Sub Projects Performance during Implementation Stage (Project 2)
Details Dehradun
Water Supply
Haldwani Water
Supply
Nainital Water
Supply
Ramnagar Water
Supply
Roorkee Water Supply
Roorkee Sewerage Combined
A. Project Cost (₹ million, 2011 price)
(i) Processing stage 2,126.4 220.7 926.6 549.5 515.7 1,196.8 5,535.7 (ii) Completion stage 1,638.5 179.3 1,200.7 557.8 669.1 1,659.4 5,904.7 (iii) Cost reduction, % 22.9% 18.8% (9.6%) (1.5%) (29.7%) (38.7%) (6.7%) B. Implementation Period (months)
(i) Processing stage 36.0 36.0 36.0 36.0 36.0 24.0 204.0 (ii) Completion stage 60.0 32.0 55.0 35.0 59.0 42.0 283.0 (iii) Time overrun - months
24.0 (4.0) 19.0 (1.0) 23.0 18.0 79.0
(iv) Time overrun, % 66.7% (11.1%) 52.8% (2.8%) 63.9% 75.0% 38.7% C. EIRR (%)
(i) Processing stage 19.9% 19.0% 15.3% 14.6% 17.8% 13.5% NA (ii) Completion stage 24.4% 23.8% 12.7% 18.2% 17.1% 15.5% 17.6% D. NPV (₹ million)
(i) Processing stage 2,404.0 233.0 221.0 100.0 171.0 43.0 3,172.0 (ii) Completion stage 2,974.3 205.9 55.2 198.4 196.6 97.4 3,727.9 ADB = Asian Development Bank, EIRR = economic internal rate of return, NA = not available, ( ) = negative, NPV = net present value. Notes: 1. ADB. 2011. RRP Project Number: 38272; Proposed Multiproject Financing Facility India: Uttarakhand Urban
Sector Development Investment Program, Manila. 2. ADB. 2011. Periodic Financing Request Report, Number: 38272Uttarakhand Urban Sector Development
Investment Program: Project 2. 3. Based on the actual disbursement data during the implementation period. 4. Analysis at completion stage. 5. Costs and benefits for Dehradun water supply includes both projects 1 and 2.
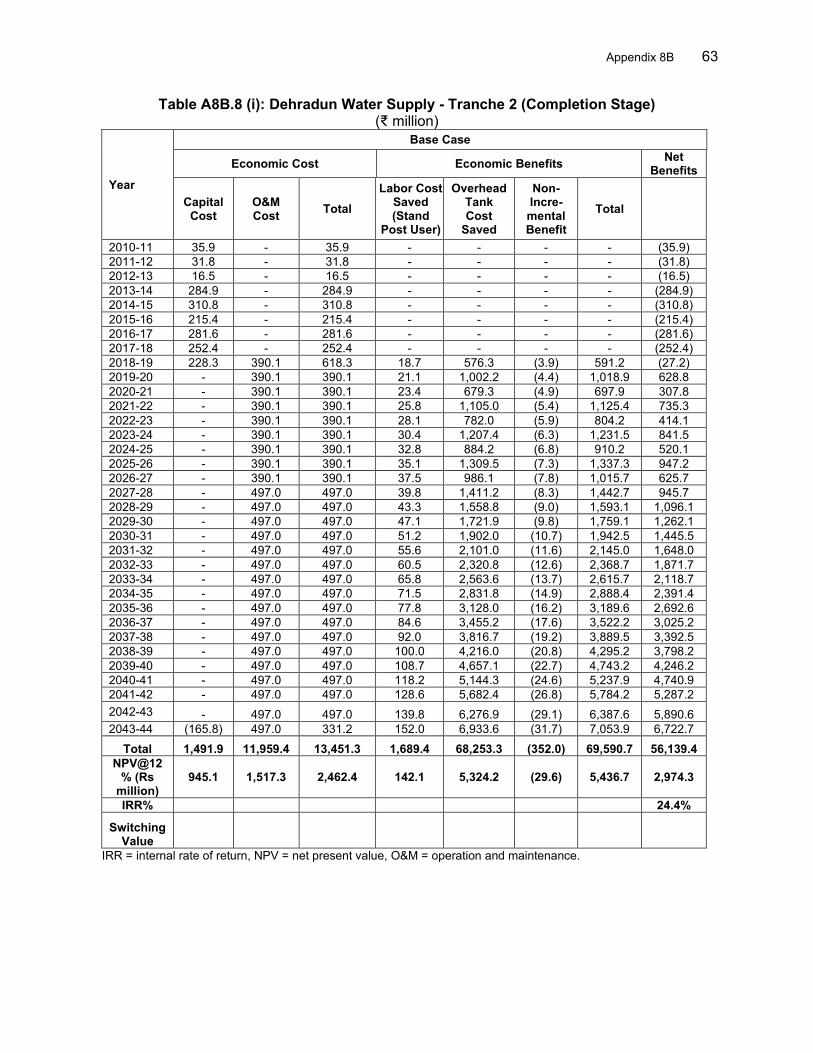
Appendix 8B 63
Table A8B.8 (i): Dehradun Water Supply - Tranche 2 (Completion Stage) (₹ million)
Year
Base Case
Economic Cost Economic Benefits Net Benefits
Capital Cost
O&M Cost Total
Labor Cost Saved (Stand
Post User)
Overhead Tank Cost
Saved
Non-Incre-mental Benefit
Total
2010-11 35.9 - 35.9 - - - - (35.9) 2011-12 31.8 - 31.8 - - - - (31.8) 2012-13 16.5 - 16.5 - - - - (16.5) 2013-14 284.9 - 284.9 - - - - (284.9) 2014-15 310.8 - 310.8 - - - - (310.8) 2015-16 215.4 - 215.4 - - - - (215.4) 2016-17 281.6 - 281.6 - - - - (281.6) 2017-18 252.4 - 252.4 - - - - (252.4) 2018-19 228.3 390.1 618.3 18.7 576.3 (3.9) 591.2 (27.2) 2019-20 - 390.1 390.1 21.1 1,002.2 (4.4) 1,018.9 628.8 2020-21 - 390.1 390.1 23.4 679.3 (4.9) 697.9 307.8 2021-22 - 390.1 390.1 25.8 1,105.0 (5.4) 1,125.4 735.3 2022-23 - 390.1 390.1 28.1 782.0 (5.9) 804.2 414.1 2023-24 - 390.1 390.1 30.4 1,207.4 (6.3) 1,231.5 841.5 2024-25 - 390.1 390.1 32.8 884.2 (6.8) 910.2 520.1 2025-26 - 390.1 390.1 35.1 1,309.5 (7.3) 1,337.3 947.2 2026-27 - 390.1 390.1 37.5 986.1 (7.8) 1,015.7 625.7 2027-28 - 497.0 497.0 39.8 1,411.2 (8.3) 1,442.7 945.7 2028-29 - 497.0 497.0 43.3 1,558.8 (9.0) 1,593.1 1,096.1 2029-30 - 497.0 497.0 47.1 1,721.9 (9.8) 1,759.1 1,262.1 2030-31 - 497.0 497.0 51.2 1,902.0 (10.7) 1,942.5 1,445.5 2031-32 - 497.0 497.0 55.6 2,101.0 (11.6) 2,145.0 1,648.0 2032-33 - 497.0 497.0 60.5 2,320.8 (12.6) 2,368.7 1,871.7 2033-34 - 497.0 497.0 65.8 2,563.6 (13.7) 2,615.7 2,118.7 2034-35 - 497.0 497.0 71.5 2,831.8 (14.9) 2,888.4 2,391.4 2035-36 - 497.0 497.0 77.8 3,128.0 (16.2) 3,189.6 2,692.6 2036-37 - 497.0 497.0 84.6 3,455.2 (17.6) 3,522.2 3,025.2 2037-38 - 497.0 497.0 92.0 3,816.7 (19.2) 3,889.5 3,392.5 2038-39 - 497.0 497.0 100.0 4,216.0 (20.8) 4,295.2 3,798.2 2039-40 - 497.0 497.0 108.7 4,657.1 (22.7) 4,743.2 4,246.2 2040-41 - 497.0 497.0 118.2 5,144.3 (24.6) 5,237.9 4,740.9 2041-42 - 497.0 497.0 128.6 5,682.4 (26.8) 5,784.2 5,287.2 2042-43 - 497.0 497.0 139.8 6,276.9 (29.1) 6,387.6 5,890.6 2043-44 (165.8) 497.0 331.2 152.0 6,933.6 (31.7) 7,053.9 6,722.7
Total 1,491.9 11,959.4 13,451.3 1,689.4 68,253.3 (352.0) 69,590.7 56,139.4 NPV@12
% (Rs million)
945.1 1,517.3 2,462.4 142.1 5,324.2 (29.6) 5,436.7 2,974.3
IRR% 24.4%
Switching Value
IRR = internal rate of return, NPV = net present value, O&M = operation and maintenance.
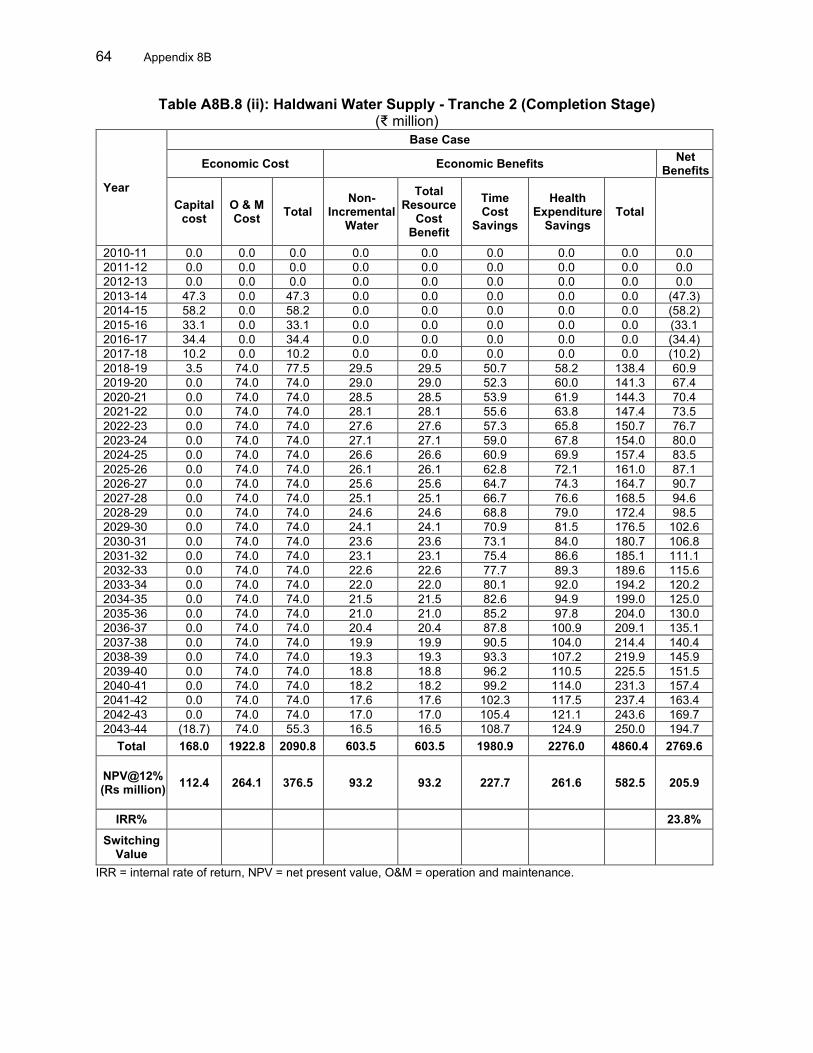
64 Appendix 8B
Table A8B.8 (ii): Haldwani Water Supply - Tranche 2 (Completion Stage) (₹ million)
Year
Base Case
Economic Cost Economic Benefits Net Benefits
Capital cost
O & M Cost Total
Non- Incremental
Water
Total Resource
Cost Benefit
Time Cost
Savings
Health Expenditure
Savings Total
2010-11 0.0 0.0 0.0 0.0 0.0 0.0 0.0 0.0 0.0 2011-12 0.0 0.0 0.0 0.0 0.0 0.0 0.0 0.0 0.0 2012-13 0.0 0.0 0.0 0.0 0.0 0.0 0.0 0.0 0.0 2013-14 47.3 0.0 47.3 0.0 0.0 0.0 0.0 0.0 (47.3) 2014-15 58.2 0.0 58.2 0.0 0.0 0.0 0.0 0.0 (58.2) 2015-16 33.1 0.0 33.1 0.0 0.0 0.0 0.0 0.0 (33.1 2016-17 34.4 0.0 34.4 0.0 0.0 0.0 0.0 0.0 (34.4) 2017-18 10.2 0.0 10.2 0.0 0.0 0.0 0.0 0.0 (10.2) 2018-19 3.5 74.0 77.5 29.5 29.5 50.7 58.2 138.4 60.9 2019-20 0.0 74.0 74.0 29.0 29.0 52.3 60.0 141.3 67.4 2020-21 0.0 74.0 74.0 28.5 28.5 53.9 61.9 144.3 70.4 2021-22 0.0 74.0 74.0 28.1 28.1 55.6 63.8 147.4 73.5 2022-23 0.0 74.0 74.0 27.6 27.6 57.3 65.8 150.7 76.7 2023-24 0.0 74.0 74.0 27.1 27.1 59.0 67.8 154.0 80.0 2024-25 0.0 74.0 74.0 26.6 26.6 60.9 69.9 157.4 83.5 2025-26 0.0 74.0 74.0 26.1 26.1 62.8 72.1 161.0 87.1 2026-27 0.0 74.0 74.0 25.6 25.6 64.7 74.3 164.7 90.7 2027-28 0.0 74.0 74.0 25.1 25.1 66.7 76.6 168.5 94.6 2028-29 0.0 74.0 74.0 24.6 24.6 68.8 79.0 172.4 98.5 2029-30 0.0 74.0 74.0 24.1 24.1 70.9 81.5 176.5 102.6 2030-31 0.0 74.0 74.0 23.6 23.6 73.1 84.0 180.7 106.8 2031-32 0.0 74.0 74.0 23.1 23.1 75.4 86.6 185.1 111.1 2032-33 0.0 74.0 74.0 22.6 22.6 77.7 89.3 189.6 115.6 2033-34 0.0 74.0 74.0 22.0 22.0 80.1 92.0 194.2 120.2 2034-35 0.0 74.0 74.0 21.5 21.5 82.6 94.9 199.0 125.0 2035-36 0.0 74.0 74.0 21.0 21.0 85.2 97.8 204.0 130.0 2036-37 0.0 74.0 74.0 20.4 20.4 87.8 100.9 209.1 135.1 2037-38 0.0 74.0 74.0 19.9 19.9 90.5 104.0 214.4 140.4 2038-39 0.0 74.0 74.0 19.3 19.3 93.3 107.2 219.9 145.9 2039-40 0.0 74.0 74.0 18.8 18.8 96.2 110.5 225.5 151.5 2040-41 0.0 74.0 74.0 18.2 18.2 99.2 114.0 231.3 157.4 2041-42 0.0 74.0 74.0 17.6 17.6 102.3 117.5 237.4 163.4 2042-43 0.0 74.0 74.0 17.0 17.0 105.4 121.1 243.6 169.7 2043-44 (18.7) 74.0 55.3 16.5 16.5 108.7 124.9 250.0 194.7
Total 168.0 1922.8 2090.8 603.5 603.5 1980.9 2276.0 4860.4 2769.6
NPV@12% (Rs million) 112.4 264.1 376.5 93.2 93.2 227.7 261.6 582.5 205.9
IRR% 23.8% Switching
Value
IRR = internal rate of return, NPV = net present value, O&M = operation and maintenance.
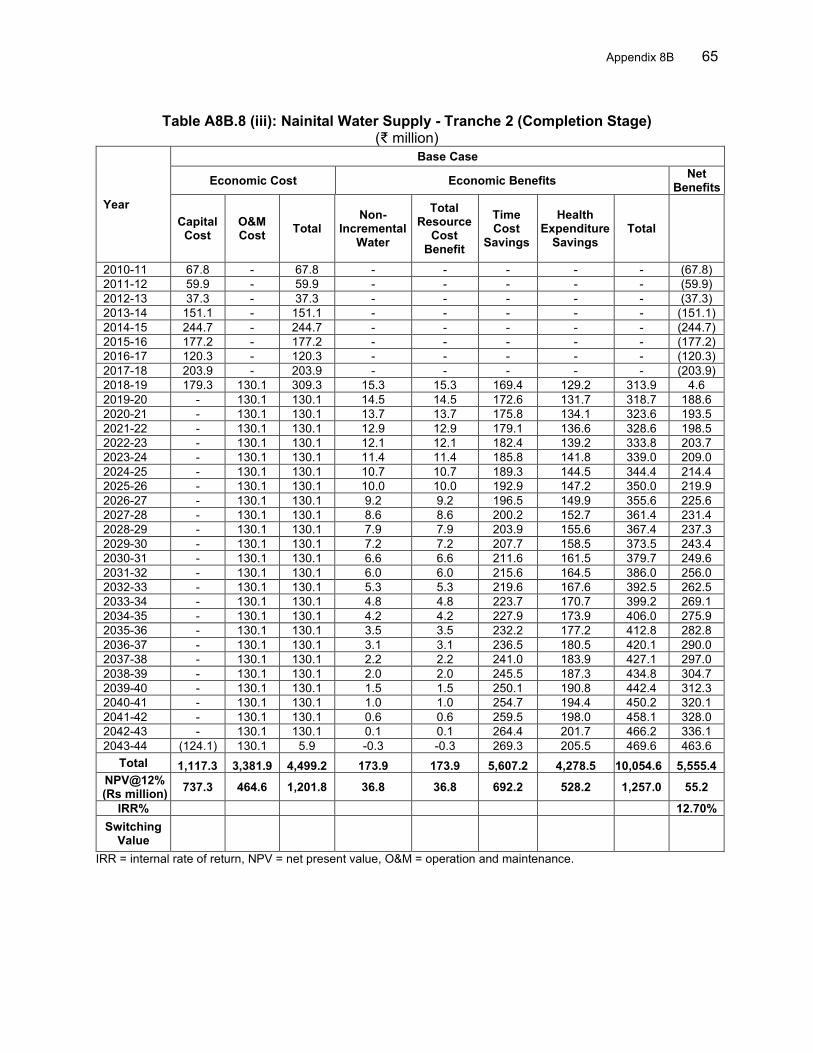
Appendix 8B 65
Table A8B.8 (iii): Nainital Water Supply - Tranche 2 (Completion Stage)
(₹ million)
Year
Base Case
Economic Cost Economic Benefits Net Benefits
Capital Cost
O&M Cost Total
Non- Incremental
Water
Total Resource
Cost Benefit
Time Cost
Savings
Health Expenditure
Savings Total
2010-11 67.8 - 67.8 - - - - - (67.8) 2011-12 59.9 - 59.9 - - - - - (59.9) 2012-13 37.3 - 37.3 - - - - - (37.3) 2013-14 151.1 - 151.1 - - - - - (151.1) 2014-15 244.7 - 244.7 - - - - - (244.7) 2015-16 177.2 - 177.2 - - - - - (177.2) 2016-17 120.3 - 120.3 - - - - - (120.3) 2017-18 203.9 - 203.9 - - - - - (203.9) 2018-19 179.3 130.1 309.3 15.3 15.3 169.4 129.2 313.9 4.6 2019-20 - 130.1 130.1 14.5 14.5 172.6 131.7 318.7 188.6 2020-21 - 130.1 130.1 13.7 13.7 175.8 134.1 323.6 193.5 2021-22 - 130.1 130.1 12.9 12.9 179.1 136.6 328.6 198.5 2022-23 - 130.1 130.1 12.1 12.1 182.4 139.2 333.8 203.7 2023-24 - 130.1 130.1 11.4 11.4 185.8 141.8 339.0 209.0 2024-25 - 130.1 130.1 10.7 10.7 189.3 144.5 344.4 214.4 2025-26 - 130.1 130.1 10.0 10.0 192.9 147.2 350.0 219.9 2026-27 - 130.1 130.1 9.2 9.2 196.5 149.9 355.6 225.6 2027-28 - 130.1 130.1 8.6 8.6 200.2 152.7 361.4 231.4 2028-29 - 130.1 130.1 7.9 7.9 203.9 155.6 367.4 237.3 2029-30 - 130.1 130.1 7.2 7.2 207.7 158.5 373.5 243.4 2030-31 - 130.1 130.1 6.6 6.6 211.6 161.5 379.7 249.6 2031-32 - 130.1 130.1 6.0 6.0 215.6 164.5 386.0 256.0 2032-33 - 130.1 130.1 5.3 5.3 219.6 167.6 392.5 262.5 2033-34 - 130.1 130.1 4.8 4.8 223.7 170.7 399.2 269.1 2034-35 - 130.1 130.1 4.2 4.2 227.9 173.9 406.0 275.9 2035-36 - 130.1 130.1 3.5 3.5 232.2 177.2 412.8 282.8 2036-37 - 130.1 130.1 3.1 3.1 236.5 180.5 420.1 290.0 2037-38 - 130.1 130.1 2.2 2.2 241.0 183.9 427.1 297.0 2038-39 - 130.1 130.1 2.0 2.0 245.5 187.3 434.8 304.7 2039-40 - 130.1 130.1 1.5 1.5 250.1 190.8 442.4 312.3 2040-41 - 130.1 130.1 1.0 1.0 254.7 194.4 450.2 320.1 2041-42 - 130.1 130.1 0.6 0.6 259.5 198.0 458.1 328.0 2042-43 - 130.1 130.1 0.1 0.1 264.4 201.7 466.2 336.1 2043-44 (124.1) 130.1 5.9 -0.3 -0.3 269.3 205.5 469.6 463.6
Total 1,117.3 3,381.9 4,499.2 173.9 173.9 5,607.2 4,278.5 10,054.6 5,555.4 NPV@12% (Rs million) 737.3 464.6 1,201.8 36.8 36.8 692.2 528.2 1,257.0 55.2
IRR% 12.70% Switching
Value IRR = internal rate of return, NPV = net present value, O&M = operation and maintenance.
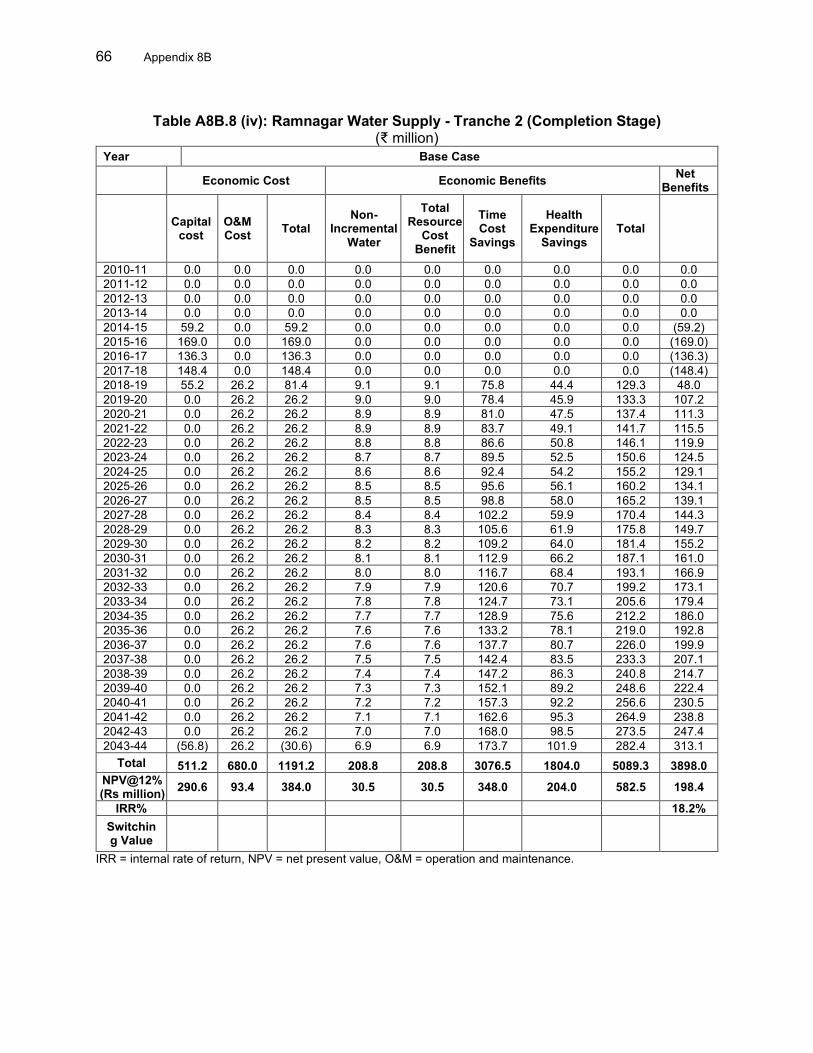
66 Appendix 8B
Table A8B.8 (iv): Ramnagar Water Supply - Tranche 2 (Completion Stage)
(₹ million) Year Base Case Economic Cost Economic Benefits Net
Benefits
Capital cost
O&M Cost Total
Non- Incremental
Water
Total Resource
Cost Benefit
Time Cost
Savings
Health Expenditure
Savings Total
2010-11 0.0 0.0 0.0 0.0 0.0 0.0 0.0 0.0 0.0 2011-12 0.0 0.0 0.0 0.0 0.0 0.0 0.0 0.0 0.0 2012-13 0.0 0.0 0.0 0.0 0.0 0.0 0.0 0.0 0.0 2013-14 0.0 0.0 0.0 0.0 0.0 0.0 0.0 0.0 0.0 2014-15 59.2 0.0 59.2 0.0 0.0 0.0 0.0 0.0 (59.2) 2015-16 169.0 0.0 169.0 0.0 0.0 0.0 0.0 0.0 (169.0) 2016-17 136.3 0.0 136.3 0.0 0.0 0.0 0.0 0.0 (136.3) 2017-18 148.4 0.0 148.4 0.0 0.0 0.0 0.0 0.0 (148.4) 2018-19 55.2 26.2 81.4 9.1 9.1 75.8 44.4 129.3 48.0 2019-20 0.0 26.2 26.2 9.0 9.0 78.4 45.9 133.3 107.2 2020-21 0.0 26.2 26.2 8.9 8.9 81.0 47.5 137.4 111.3 2021-22 0.0 26.2 26.2 8.9 8.9 83.7 49.1 141.7 115.5 2022-23 0.0 26.2 26.2 8.8 8.8 86.6 50.8 146.1 119.9 2023-24 0.0 26.2 26.2 8.7 8.7 89.5 52.5 150.6 124.5 2024-25 0.0 26.2 26.2 8.6 8.6 92.4 54.2 155.2 129.1 2025-26 0.0 26.2 26.2 8.5 8.5 95.6 56.1 160.2 134.1 2026-27 0.0 26.2 26.2 8.5 8.5 98.8 58.0 165.2 139.1 2027-28 0.0 26.2 26.2 8.4 8.4 102.2 59.9 170.4 144.3 2028-29 0.0 26.2 26.2 8.3 8.3 105.6 61.9 175.8 149.7 2029-30 0.0 26.2 26.2 8.2 8.2 109.2 64.0 181.4 155.2 2030-31 0.0 26.2 26.2 8.1 8.1 112.9 66.2 187.1 161.0 2031-32 0.0 26.2 26.2 8.0 8.0 116.7 68.4 193.1 166.9 2032-33 0.0 26.2 26.2 7.9 7.9 120.6 70.7 199.2 173.1 2033-34 0.0 26.2 26.2 7.8 7.8 124.7 73.1 205.6 179.4 2034-35 0.0 26.2 26.2 7.7 7.7 128.9 75.6 212.2 186.0 2035-36 0.0 26.2 26.2 7.6 7.6 133.2 78.1 219.0 192.8 2036-37 0.0 26.2 26.2 7.6 7.6 137.7 80.7 226.0 199.9 2037-38 0.0 26.2 26.2 7.5 7.5 142.4 83.5 233.3 207.1 2038-39 0.0 26.2 26.2 7.4 7.4 147.2 86.3 240.8 214.7 2039-40 0.0 26.2 26.2 7.3 7.3 152.1 89.2 248.6 222.4 2040-41 0.0 26.2 26.2 7.2 7.2 157.3 92.2 256.6 230.5 2041-42 0.0 26.2 26.2 7.1 7.1 162.6 95.3 264.9 238.8 2042-43 0.0 26.2 26.2 7.0 7.0 168.0 98.5 273.5 247.4 2043-44 (56.8) 26.2 (30.6) 6.9 6.9 173.7 101.9 282.4 313.1
Total 511.2 680.0 1191.2 208.8 208.8 3076.5 1804.0 5089.3 3898.0 NPV@12% (Rs million) 290.6 93.4 384.0 30.5 30.5 348.0 204.0 582.5 198.4
IRR% 18.2% Switching Value
IRR = internal rate of return, NPV = net present value, O&M = operation and maintenance.
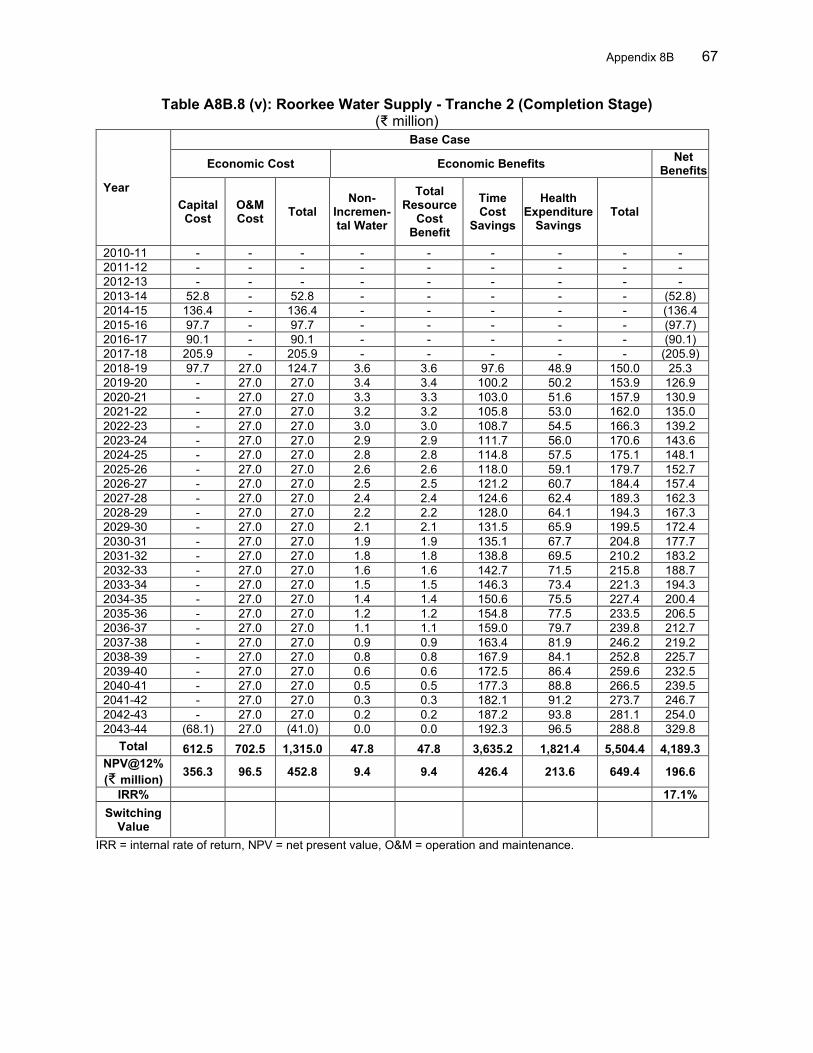
Appendix 8B 67
Table A8B.8 (v): Roorkee Water Supply - Tranche 2 (Completion Stage) (₹ million)
Year
Base Case
Economic Cost Economic Benefits Net Benefits
Capital Cost
O&M Cost Total
Non- Incremen-tal Water
Total Resource
Cost Benefit
Time Cost
Savings
Health Expenditure
Savings Total
2010-11 - - - - - - - - - 2011-12 - - - - - - - - - 2012-13 - - - - - - - - - 2013-14 52.8 - 52.8 - - - - - (52.8) 2014-15 136.4 - 136.4 - - - - - (136.4 2015-16 97.7 - 97.7 - - - - - (97.7) 2016-17 90.1 - 90.1 - - - - - (90.1) 2017-18 205.9 - 205.9 - - - - - (205.9) 2018-19 97.7 27.0 124.7 3.6 3.6 97.6 48.9 150.0 25.3 2019-20 - 27.0 27.0 3.4 3.4 100.2 50.2 153.9 126.9 2020-21 - 27.0 27.0 3.3 3.3 103.0 51.6 157.9 130.9 2021-22 - 27.0 27.0 3.2 3.2 105.8 53.0 162.0 135.0 2022-23 - 27.0 27.0 3.0 3.0 108.7 54.5 166.3 139.2 2023-24 - 27.0 27.0 2.9 2.9 111.7 56.0 170.6 143.6 2024-25 - 27.0 27.0 2.8 2.8 114.8 57.5 175.1 148.1 2025-26 - 27.0 27.0 2.6 2.6 118.0 59.1 179.7 152.7 2026-27 - 27.0 27.0 2.5 2.5 121.2 60.7 184.4 157.4 2027-28 - 27.0 27.0 2.4 2.4 124.6 62.4 189.3 162.3 2028-29 - 27.0 27.0 2.2 2.2 128.0 64.1 194.3 167.3 2029-30 - 27.0 27.0 2.1 2.1 131.5 65.9 199.5 172.4 2030-31 - 27.0 27.0 1.9 1.9 135.1 67.7 204.8 177.7 2031-32 - 27.0 27.0 1.8 1.8 138.8 69.5 210.2 183.2 2032-33 - 27.0 27.0 1.6 1.6 142.7 71.5 215.8 188.7 2033-34 - 27.0 27.0 1.5 1.5 146.3 73.4 221.3 194.3 2034-35 - 27.0 27.0 1.4 1.4 150.6 75.5 227.4 200.4 2035-36 - 27.0 27.0 1.2 1.2 154.8 77.5 233.5 206.5 2036-37 - 27.0 27.0 1.1 1.1 159.0 79.7 239.8 212.7 2037-38 - 27.0 27.0 0.9 0.9 163.4 81.9 246.2 219.2 2038-39 - 27.0 27.0 0.8 0.8 167.9 84.1 252.8 225.7 2039-40 - 27.0 27.0 0.6 0.6 172.5 86.4 259.6 232.5 2040-41 - 27.0 27.0 0.5 0.5 177.3 88.8 266.5 239.5 2041-42 - 27.0 27.0 0.3 0.3 182.1 91.2 273.7 246.7 2042-43 - 27.0 27.0 0.2 0.2 187.2 93.8 281.1 254.0 2043-44 (68.1) 27.0 (41.0) 0.0 0.0 192.3 96.5 288.8 329.8
Total 612.5 702.5 1,315.0 47.8 47.8 3,635.2 1,821.4 5,504.4 4,189.3 NPV@12% (₹ million) 356.3 96.5 452.8 9.4 9.4 426.4 213.6 649.4 196.6
IRR% 17.1% Switching
Value IRR = internal rate of return, NPV = net present value, O&M = operation and maintenance.
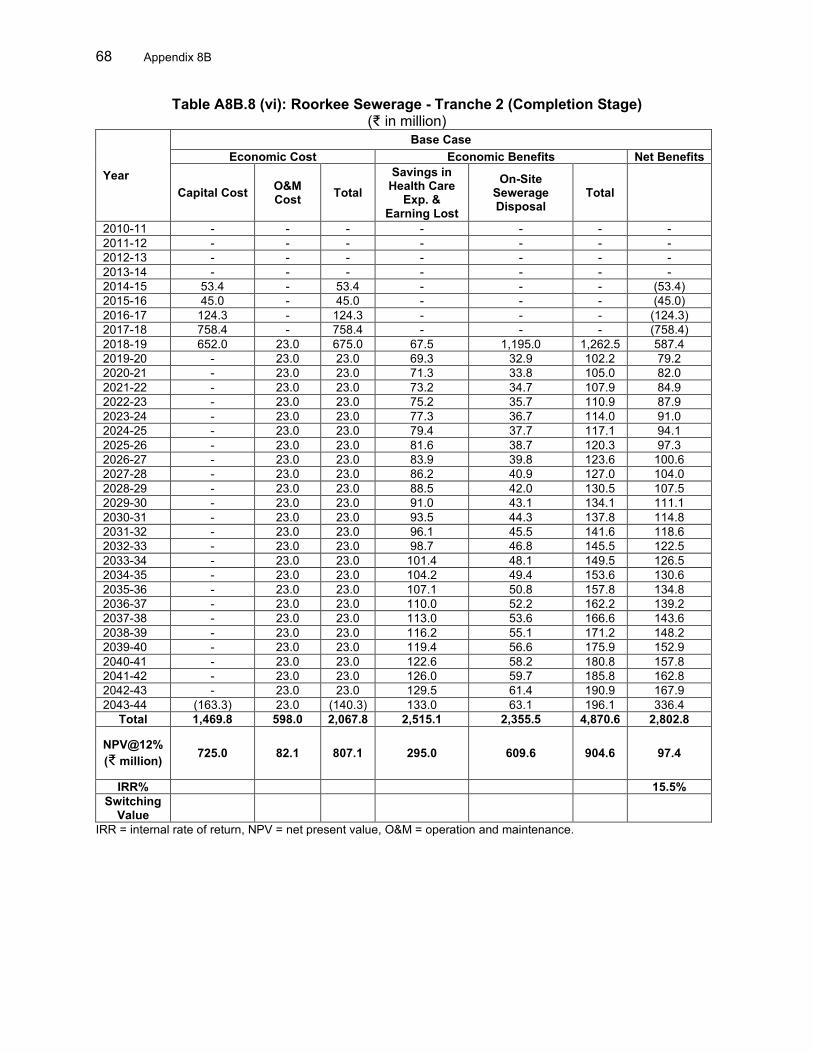
68 Appendix 8B
Table A8B.8 (vi): Roorkee Sewerage - Tranche 2 (Completion Stage) (₹ in million)
Year
Base Case Economic Cost Economic Benefits Net Benefits
Capital Cost O&M Cost Total
Savings in Health Care
Exp. & Earning Lost
On-Site Sewerage Disposal
Total
2010-11 - - - - - - - 2011-12 - - - - - - - 2012-13 - - - - - - - 2013-14 - - - - - - - 2014-15 53.4 - 53.4 - - - (53.4) 2015-16 45.0 - 45.0 - - - (45.0) 2016-17 124.3 - 124.3 - - - (124.3) 2017-18 758.4 - 758.4 - - - (758.4) 2018-19 652.0 23.0 675.0 67.5 1,195.0 1,262.5 587.4 2019-20 - 23.0 23.0 69.3 32.9 102.2 79.2 2020-21 - 23.0 23.0 71.3 33.8 105.0 82.0 2021-22 - 23.0 23.0 73.2 34.7 107.9 84.9 2022-23 - 23.0 23.0 75.2 35.7 110.9 87.9 2023-24 - 23.0 23.0 77.3 36.7 114.0 91.0 2024-25 - 23.0 23.0 79.4 37.7 117.1 94.1 2025-26 - 23.0 23.0 81.6 38.7 120.3 97.3 2026-27 - 23.0 23.0 83.9 39.8 123.6 100.6 2027-28 - 23.0 23.0 86.2 40.9 127.0 104.0 2028-29 - 23.0 23.0 88.5 42.0 130.5 107.5 2029-30 - 23.0 23.0 91.0 43.1 134.1 111.1 2030-31 - 23.0 23.0 93.5 44.3 137.8 114.8 2031-32 - 23.0 23.0 96.1 45.5 141.6 118.6 2032-33 - 23.0 23.0 98.7 46.8 145.5 122.5 2033-34 - 23.0 23.0 101.4 48.1 149.5 126.5 2034-35 - 23.0 23.0 104.2 49.4 153.6 130.6 2035-36 - 23.0 23.0 107.1 50.8 157.8 134.8 2036-37 - 23.0 23.0 110.0 52.2 162.2 139.2 2037-38 - 23.0 23.0 113.0 53.6 166.6 143.6 2038-39 - 23.0 23.0 116.2 55.1 171.2 148.2 2039-40 - 23.0 23.0 119.4 56.6 175.9 152.9 2040-41 - 23.0 23.0 122.6 58.2 180.8 157.8 2041-42 - 23.0 23.0 126.0 59.7 185.8 162.8 2042-43 - 23.0 23.0 129.5 61.4 190.9 167.9 2043-44 (163.3) 23.0 (140.3) 133.0 63.1 196.1 336.4
Total 1,469.8 598.0 2,067.8 2,515.1 2,355.5 4,870.6 2,802.8
NPV@12% (₹ million) 725.0 82.1 807.1 295.0 609.6 904.6 97.4
IRR% 15.5% Switching
Value
IRR = internal rate of return, NPV = net present value, O&M = operation and maintenance.
Appendix 9A 69
FINANCIAL ANALYSIS – PROJECT 2 A. Introduction 1. Under project 2 of Uttarakhand Urban Sector Development Investment Program (UUSDIP) the investment was made in the following sectors: i.e., (i) water supply in Dehradun, Haldwani, Nainital, Ramnagar and Roorkee, and (ii) sewerage in Roorkee. At this Project Completion Report (PCR) stage, all the water supply and sewerage subprojects are substantially completed without changes in coverage and beneficiaries. Under this arrangement, the financial analysis for the present PCR was conducted for the revenue earning water supply and sewer sub projects in the five project towns in accordance with ADB’s Guidelines ‘Financial Management and Analysis of Projects (2005)’ and ‘Financial Analysis and Evaluation – Technical Guidance Note (2019)’. B. Analysis at Appraisal
2. Financial evaluation of all six subprojects and financial sustainability analysis of the agencies responsible for O&M for all subprojects were carried out during the MFF appraisal. The financial analysis prepared at the appraisal stage (2011) assessed the ability of the subprojects to meet future costs including capital expenditure, operation and maintenance (O&M) cost, and if appropriate, debt servicing and depreciation or re-investment margins. The weighted average cost of capital (WACC) was considered at 4.3%.1 3. The financial evaluation at MFF appraisal for water supply subprojects considered water tariffs (based on a financial improvement action plan) FIAP, water demand assessment, the number of connections, and the gradual reduction of nonrevenue water. The base financial internal rate of return (FIRR) was assessed to be (i) 7.9% for water supply in Dehradun, (ii) 6.0% for water supply in Haldwani, (iii) negative for water supply in Nainital and Ramnagar, 7.5% for water supply in Roorkee and (iv) 4.0% for sewerage in Roorkee. The evaluation also considered sensitivity analysis under situations of (i) capital cost + 10%, (ii) O&M Cost + 10%, (iii) incremental revenue -10% and one-year delay in implementation.
4. The O&M recovery analysis at appraisal concluded that O&M costs for all water supply and sewerage subprojects would be fully covered by the proposed tariff in the FIAP, except for Nainital and Ramnagar water supply subprojects because of its high energy cost of operation to pump in hilly locations. The analysis further concluded that for the subprojects the FIRRs are the most sensitive to decrease in incremental revenues, hence, the FIAP further proposed for improvement in revenue collection, increase in coverage, and tariff revisions to make the subprojects financially sustainable.
C. Analysis at Completion 5. Financial reevaluation has been conducted at project completion for the water supply and sewer subprojects under project 2. The main approach of this financial analysis was to re-evaluate the earlier analysis carried out during the appraisal stage through appropriate changes in the areas of project cost, project coverage, revenues, implementation period, and other relevant parameters. that had happened during the implementation up to the project completion stage. This was done to facilitate the establishment of the financial viability and sustainability at
1 ADB. 2011. Periodic Financing Request Report: Uttarakhand Urban Sector Development Investment Program:
Tranche 2. Manila.
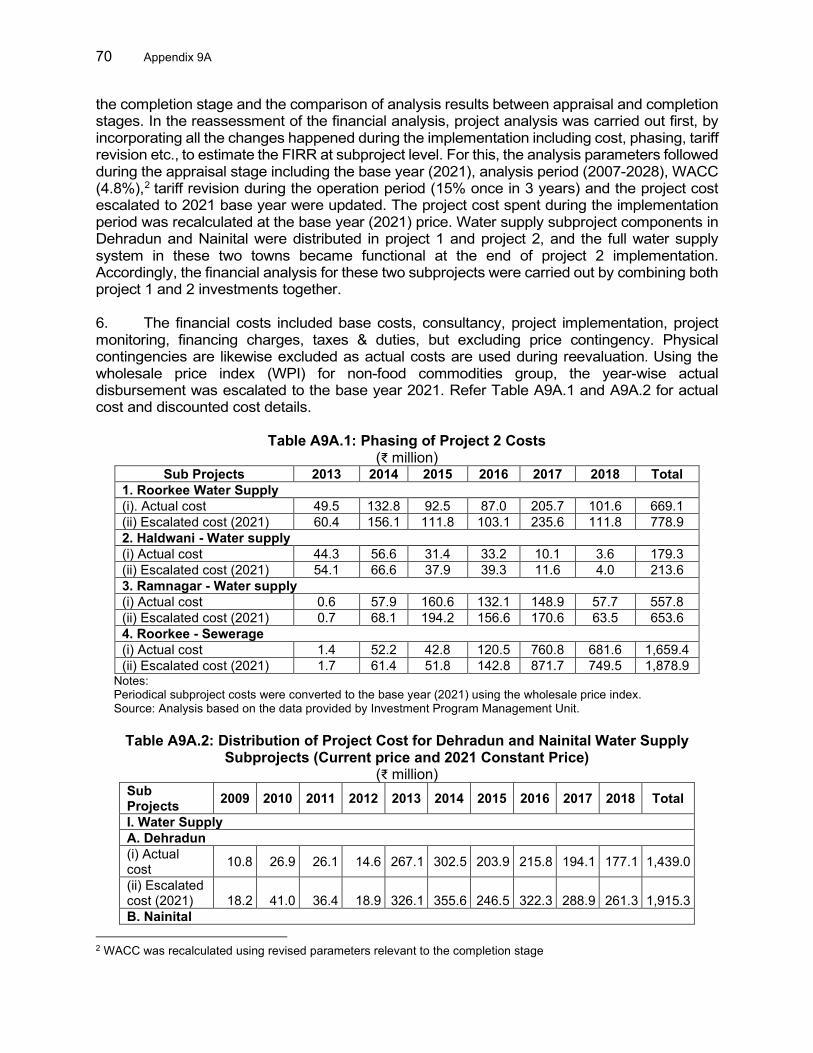
70 Appendix 9A
the completion stage and the comparison of analysis results between appraisal and completion stages. In the reassessment of the financial analysis, project analysis was carried out first, by incorporating all the changes happened during the implementation including cost, phasing, tariff revision etc., to estimate the FIRR at subproject level. For this, the analysis parameters followed during the appraisal stage including the base year (2021), analysis period (2007-2028), WACC (4.8%),2 tariff revision during the operation period (15% once in 3 years) and the project cost escalated to 2021 base year were updated. The project cost spent during the implementation period was recalculated at the base year (2021) price. Water supply subproject components in Dehradun and Nainital were distributed in project 1 and project 2, and the full water supply system in these two towns became functional at the end of project 2 implementation. Accordingly, the financial analysis for these two subprojects were carried out by combining both project 1 and 2 investments together. 6. The financial costs included base costs, consultancy, project implementation, project monitoring, financing charges, taxes & duties, but excluding price contingency. Physical contingencies are likewise excluded as actual costs are used during reevaluation. Using the wholesale price index (WPI) for non-food commodities group, the year-wise actual disbursement was escalated to the base year 2021. Refer Table A9A.1 and A9A.2 for actual cost and discounted cost details.
Table A9A.1: Phasing of Project 2 Costs (₹ million)
Sub Projects 2013 2014 2015 2016 2017 2018 Total 1. Roorkee Water Supply (i). Actual cost 49.5 132.8 92.5 87.0 205.7 101.6 669.1 (ii) Escalated cost (2021) 60.4 156.1 111.8 103.1 235.6 111.8 778.9 2. Haldwani - Water supply (i) Actual cost 44.3 56.6 31.4 33.2 10.1 3.6 179.3 (ii) Escalated cost (2021) 54.1 66.6 37.9 39.3 11.6 4.0 213.6 3. Ramnagar - Water supply (i) Actual cost 0.6 57.9 160.6 132.1 148.9 57.7 557.8 (ii) Escalated cost (2021) 0.7 68.1 194.2 156.6 170.6 63.5 653.6 4. Roorkee - Sewerage (i) Actual cost 1.4 52.2 42.8 120.5 760.8 681.6 1,659.4 (ii) Escalated cost (2021) 1.7 61.4 51.8 142.8 871.7 749.5 1,878.9
Notes: Periodical subproject costs were converted to the base year (2021) using the wholesale price index. Source: Analysis based on the data provided by Investment Program Management Unit.
Table A9A.2: Distribution of Project Cost for Dehradun and Nainital Water Supply
Subprojects (Current price and 2021 Constant Price) (₹ million)
Sub Projects 2009 2010 2011 2012 2013 2014 2015 2016 2017 2018 Total I. Water Supply A. Dehradun (i) Actual cost 10.8 26.9 26.1 14.6 267.1 302.5 203.9 215.8 194.1 177.1 1,439.0
(ii) Escalated cost (2021)
18.2
41.0
36.4
18.9
326.1
355.6
246.5
322.3
288.9
261.3
1,915.3
B. Nainital
2 WACC was recalculated using revised parameters relevant to the completion stage
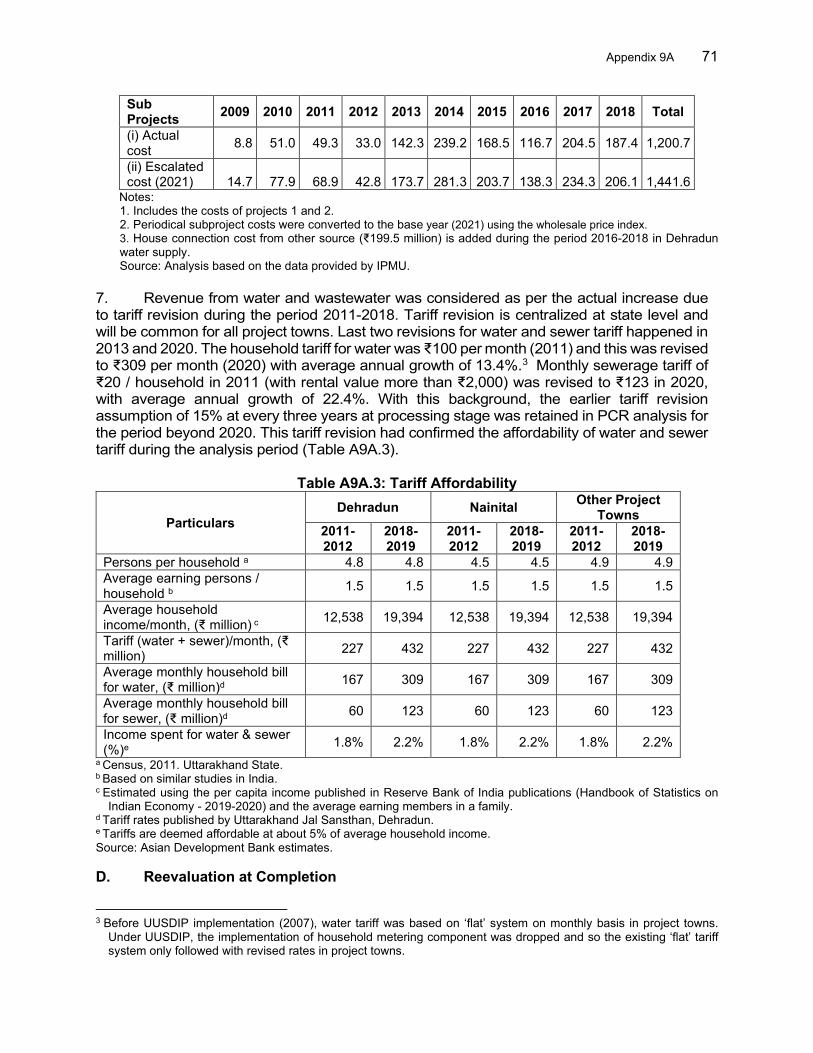
Appendix 9A 71
Sub Projects 2009 2010 2011 2012 2013 2014 2015 2016 2017 2018 Total (i) Actual cost 8.8 51.0 49.3 33.0 142.3 239.2 168.5 116.7 204.5 187.4 1,200.7
(ii) Escalated cost (2021)
14.7
77.9
68.9
42.8
173.7
281.3
203.7
138.3
234.3
206.1
1,441.6
Notes: 1. Includes the costs of projects 1 and 2. 2. Periodical subproject costs were converted to the base year (2021) using the wholesale price index. 3. House connection cost from other source (₹199.5 million) is added during the period 2016-2018 in Dehradun water supply. Source: Analysis based on the data provided by IPMU.
7. Revenue from water and wastewater was considered as per the actual increase due to tariff revision during the period 2011-2018. Tariff revision is centralized at state level and will be common for all project towns. Last two revisions for water and sewer tariff happened in 2013 and 2020. The household tariff for water was ₹100 per month (2011) and this was revised to ₹309 per month (2020) with average annual growth of 13.4%.3 Monthly sewerage tariff of ₹20 / household in 2011 (with rental value more than ₹2,000) was revised to ₹123 in 2020, with average annual growth of 22.4%. With this background, the earlier tariff revision assumption of 15% at every three years at processing stage was retained in PCR analysis for the period beyond 2020. This tariff revision had confirmed the affordability of water and sewer tariff during the analysis period (Table A9A.3).
Table A9A.3: Tariff Affordability
Particulars Dehradun Nainital Other Project
Towns 2011-2012
2018-2019
2011-2012
2018-2019
2011-2012
2018-2019
Persons per household a 4.8 4.8 4.5 4.5 4.9 4.9 Average earning persons / household b 1.5 1.5 1.5 1.5 1.5 1.5
Average household income/month, (₹ million) c 12,538 19,394 12,538 19,394 12,538 19,394
Tariff (water + sewer)/month, (₹ million) 227 432 227 432 227 432
Average monthly household bill for water, (₹ million)d 167 309 167 309 167 309
Average monthly household bill for sewer, (₹ million)d 60 123 60 123 60 123
Income spent for water & sewer (%)e 1.8% 2.2% 1.8% 2.2% 1.8% 2.2%
a Census, 2011. Uttarakhand State. b Based on similar studies in India. c Estimated using the per capita income published in Reserve Bank of India publications (Handbook of Statistics on
Indian Economy - 2019-2020) and the average earning members in a family. d Tariff rates published by Uttarakhand Jal Sansthan, Dehradun. e Tariffs are deemed affordable at about 5% of average household income. Source: Asian Development Bank estimates. D. Reevaluation at Completion
3 Before UUSDIP implementation (2007), water tariff was based on ‘flat’ system on monthly basis in project towns.
Under UUSDIP, the implementation of household metering component was dropped and so the existing ‘flat’ tariff system only followed with revised rates in project towns.
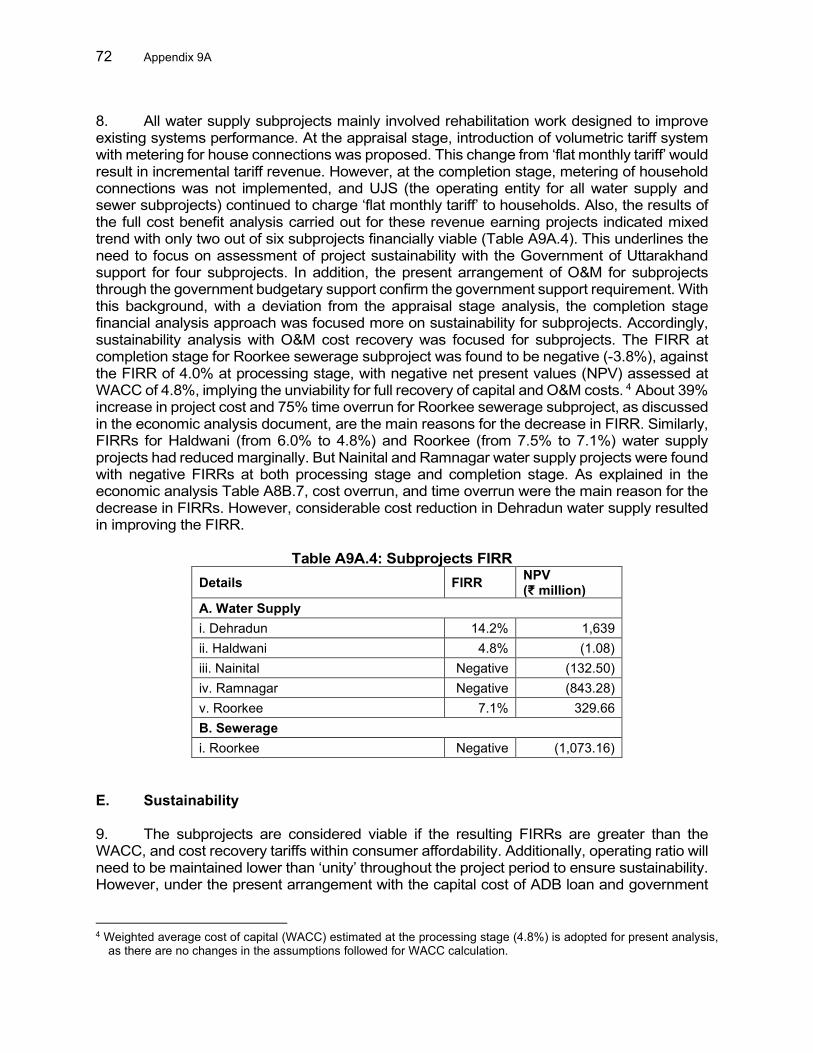
72 Appendix 9A
8. All water supply subprojects mainly involved rehabilitation work designed to improve existing systems performance. At the appraisal stage, introduction of volumetric tariff system with metering for house connections was proposed. This change from ‘flat monthly tariff’ would result in incremental tariff revenue. However, at the completion stage, metering of household connections was not implemented, and UJS (the operating entity for all water supply and sewer subprojects) continued to charge ‘flat monthly tariff’ to households. Also, the results of the full cost benefit analysis carried out for these revenue earning projects indicated mixed trend with only two out of six subprojects financially viable (Table A9A.4). This underlines the need to focus on assessment of project sustainability with the Government of Uttarakhand support for four subprojects. In addition, the present arrangement of O&M for subprojects through the government budgetary support confirm the government support requirement. With this background, with a deviation from the appraisal stage analysis, the completion stage financial analysis approach was focused more on sustainability for subprojects. Accordingly, sustainability analysis with O&M cost recovery was focused for subprojects. The FIRR at completion stage for Roorkee sewerage subproject was found to be negative (-3.8%), against the FIRR of 4.0% at processing stage, with negative net present values (NPV) assessed at WACC of 4.8%, implying the unviability for full recovery of capital and O&M costs. 4 About 39% increase in project cost and 75% time overrun for Roorkee sewerage subproject, as discussed in the economic analysis document, are the main reasons for the decrease in FIRR. Similarly, FIRRs for Haldwani (from 6.0% to 4.8%) and Roorkee (from 7.5% to 7.1%) water supply projects had reduced marginally. But Nainital and Ramnagar water supply projects were found with negative FIRRs at both processing stage and completion stage. As explained in the economic analysis Table A8B.7, cost overrun, and time overrun were the main reason for the decrease in FIRRs. However, considerable cost reduction in Dehradun water supply resulted in improving the FIRR.
Table A9A.4: Subprojects FIRR Details FIRR NPV
(₹ million) A. Water Supply i. Dehradun 14.2% 1,639 ii. Haldwani 4.8% (1.08) iii. Nainital Negative (132.50) iv. Ramnagar Negative (843.28) v. Roorkee 7.1% 329.66 B. Sewerage i. Roorkee Negative (1,073.16)
E. Sustainability 9. The subprojects are considered viable if the resulting FIRRs are greater than the WACC, and cost recovery tariffs within consumer affordability. Additionally, operating ratio will need to be maintained lower than ‘unity’ throughout the project period to ensure sustainability. However, under the present arrangement with the capital cost of ADB loan and government
4 Weighted average cost of capital (WACC) estimated at the processing stage (4.8%) is adopted for present analysis,
as there are no changes in the assumptions followed for WACC calculation.
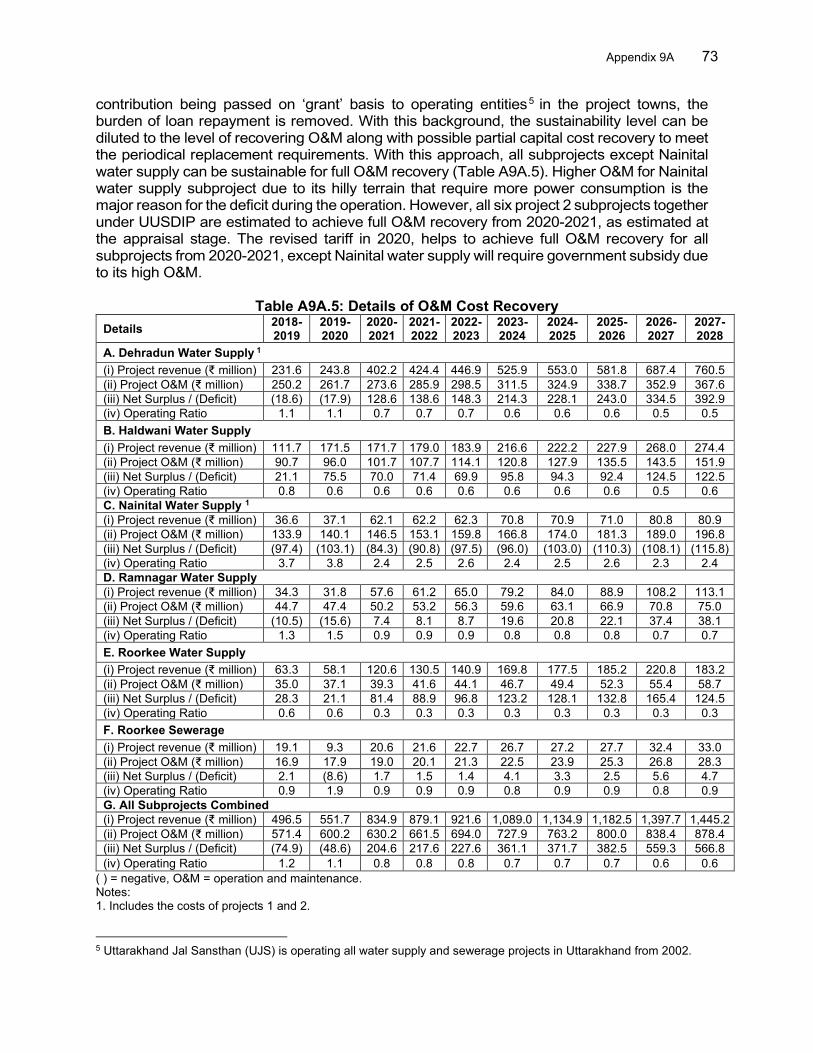
Appendix 9A 73
contribution being passed on ‘grant’ basis to operating entities5 in the project towns, the burden of loan repayment is removed. With this background, the sustainability level can be diluted to the level of recovering O&M along with possible partial capital cost recovery to meet the periodical replacement requirements. With this approach, all subprojects except Nainital water supply can be sustainable for full O&M recovery (Table A9A.5). Higher O&M for Nainital water supply subproject due to its hilly terrain that require more power consumption is the major reason for the deficit during the operation. However, all six project 2 subprojects together under UUSDIP are estimated to achieve full O&M recovery from 2020-2021, as estimated at the appraisal stage. The revised tariff in 2020, helps to achieve full O&M recovery for all subprojects from 2020-2021, except Nainital water supply will require government subsidy due to its high O&M.
Table A9A.5: Details of O&M Cost Recovery Details 2018-
2019 2019-2020
2020-2021
2021-2022
2022-2023
2023-2024
2024-2025
2025-2026
2026-2027
2027-2028
A. Dehradun Water Supply 1 (i) Project revenue (₹ million) 231.6 243.8 402.2 424.4 446.9 525.9 553.0 581.8 687.4 760.5 (ii) Project O&M (₹ million) 250.2 261.7 273.6 285.9 298.5 311.5 324.9 338.7 352.9 367.6 (iii) Net Surplus / (Deficit) (18.6) (17.9) 128.6 138.6 148.3 214.3 228.1 243.0 334.5 392.9 (iv) Operating Ratio 1.1 1.1 0.7 0.7 0.7 0.6 0.6 0.6 0.5 0.5 B. Haldwani Water Supply (i) Project revenue (₹ million) 111.7 171.5 171.7 179.0 183.9 216.6 222.2 227.9 268.0 274.4 (ii) Project O&M (₹ million) 90.7 96.0 101.7 107.7 114.1 120.8 127.9 135.5 143.5 151.9 (iii) Net Surplus / (Deficit) 21.1 75.5 70.0 71.4 69.9 95.8 94.3 92.4 124.5 122.5 (iv) Operating Ratio 0.8 0.6 0.6 0.6 0.6 0.6 0.6 0.6 0.5 0.6 C. Nainital Water Supply 1 (i) Project revenue (₹ million) 36.6 37.1 62.1 62.2 62.3 70.8 70.9 71.0 80.8 80.9 (ii) Project O&M (₹ million) 133.9 140.1 146.5 153.1 159.8 166.8 174.0 181.3 189.0 196.8 (iii) Net Surplus / (Deficit) (97.4) (103.1) (84.3) (90.8) (97.5) (96.0) (103.0) (110.3) (108.1) (115.8) (iv) Operating Ratio 3.7 3.8 2.4 2.5 2.6 2.4 2.5 2.6 2.3 2.4 D. Ramnagar Water Supply (i) Project revenue (₹ million) 34.3 31.8 57.6 61.2 65.0 79.2 84.0 88.9 108.2 113.1 (ii) Project O&M (₹ million) 44.7 47.4 50.2 53.2 56.3 59.6 63.1 66.9 70.8 75.0 (iii) Net Surplus / (Deficit) (10.5) (15.6) 7.4 8.1 8.7 19.6 20.8 22.1 37.4 38.1 (iv) Operating Ratio 1.3 1.5 0.9 0.9 0.9 0.8 0.8 0.8 0.7 0.7 E. Roorkee Water Supply (i) Project revenue (₹ million) 63.3 58.1 120.6 130.5 140.9 169.8 177.5 185.2 220.8 183.2 (ii) Project O&M (₹ million) 35.0 37.1 39.3 41.6 44.1 46.7 49.4 52.3 55.4 58.7 (iii) Net Surplus / (Deficit) 28.3 21.1 81.4 88.9 96.8 123.2 128.1 132.8 165.4 124.5 (iv) Operating Ratio 0.6 0.6 0.3 0.3 0.3 0.3 0.3 0.3 0.3 0.3 F. Roorkee Sewerage (i) Project revenue (₹ million) 19.1 9.3 20.6 21.6 22.7 26.7 27.2 27.7 32.4 33.0 (ii) Project O&M (₹ million) 16.9 17.9 19.0 20.1 21.3 22.5 23.9 25.3 26.8 28.3 (iii) Net Surplus / (Deficit) 2.1 (8.6) 1.7 1.5 1.4 4.1 3.3 2.5 5.6 4.7 (iv) Operating Ratio 0.9 1.9 0.9 0.9 0.9 0.8 0.9 0.9 0.8 0.9 G. All Subprojects Combined (i) Project revenue (₹ million) 496.5 551.7 834.9 879.1 921.6 1,089.0 1,134.9 1,182.5 1,397.7 1,445.2 (ii) Project O&M (₹ million) 571.4 600.2 630.2 661.5 694.0 727.9 763.2 800.0 838.4 878.4 (iii) Net Surplus / (Deficit) (74.9) (48.6) 204.6 217.6 227.6 361.1 371.7 382.5 559.3 566.8 (iv) Operating Ratio 1.2 1.1 0.8 0.8 0.8 0.7 0.7 0.7 0.6 0.6
( ) = negative, O&M = operation and maintenance. Notes: 1. Includes the costs of projects 1 and 2.
5 Uttarakhand Jal Sansthan (UJS) is operating all water supply and sewerage projects in Uttarakhand from 2002.
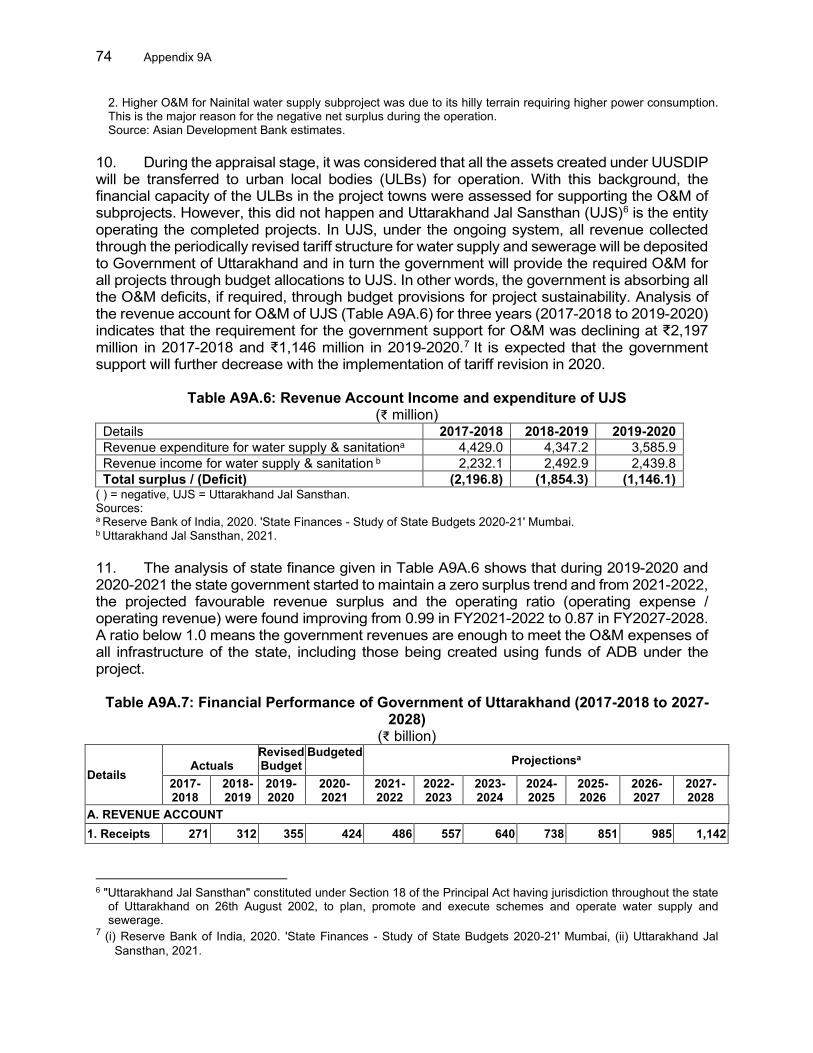
74 Appendix 9A
2. Higher O&M for Nainital water supply subproject was due to its hilly terrain requiring higher power consumption. This is the major reason for the negative net surplus during the operation. Source: Asian Development Bank estimates.
10. During the appraisal stage, it was considered that all the assets created under UUSDIP will be transferred to urban local bodies (ULBs) for operation. With this background, the financial capacity of the ULBs in the project towns were assessed for supporting the O&M of subprojects. However, this did not happen and Uttarakhand Jal Sansthan (UJS)6 is the entity operating the completed projects. In UJS, under the ongoing system, all revenue collected through the periodically revised tariff structure for water supply and sewerage will be deposited to Government of Uttarakhand and in turn the government will provide the required O&M for all projects through budget allocations to UJS. In other words, the government is absorbing all the O&M deficits, if required, through budget provisions for project sustainability. Analysis of the revenue account for O&M of UJS (Table A9A.6) for three years (2017-2018 to 2019-2020) indicates that the requirement for the government support for O&M was declining at ₹2,197 million in 2017-2018 and ₹1,146 million in 2019-2020.7 It is expected that the government support will further decrease with the implementation of tariff revision in 2020.
Table A9A.6: Revenue Account Income and expenditure of UJS
(₹ million) Details 2017-2018 2018-2019 2019-2020 Revenue expenditure for water supply & sanitationa 4,429.0 4,347.2 3,585.9 Revenue income for water supply & sanitation b 2,232.1 2,492.9 2,439.8 Total surplus / (Deficit) (2,196.8) (1,854.3) (1,146.1)
( ) = negative, UJS = Uttarakhand Jal Sansthan. Sources: a Reserve Bank of India, 2020. 'State Finances - Study of State Budgets 2020-21' Mumbai. b Uttarakhand Jal Sansthan, 2021.
11. The analysis of state finance given in Table A9A.6 shows that during 2019-2020 and 2020-2021 the state government started to maintain a zero surplus trend and from 2021-2022, the projected favourable revenue surplus and the operating ratio (operating expense / operating revenue) were found improving from 0.99 in FY2021-2022 to 0.87 in FY2027-2028. A ratio below 1.0 means the government revenues are enough to meet the O&M expenses of all infrastructure of the state, including those being created using funds of ADB under the project.
Table A9A.7: Financial Performance of Government of Uttarakhand (2017-2018 to 2027-2028)
(₹ billion)
Details
Actuals
Revised Budget
Budgeted Projectionsa
2017-2018
2018-2019
2019-2020
2020-2021
2021-2022
2022-2023
2023-2024
2024-2025
2025-2026
2026-2027
2027-2028
A. REVENUE ACCOUNT 1. Receipts 271 312 355 424 486 557 640 738 851 985 1,142
6 "Uttarakhand Jal Sansthan" constituted under Section 18 of the Principal Act having jurisdiction throughout the state
of Uttarakhand on 26th August 2002, to plan, promote and execute schemes and operate water supply and sewerage.
7 (i) Reserve Bank of India, 2020. 'State Finances - Study of State Budgets 2020-21' Mumbai, (ii) Uttarakhand Jal Sansthan, 2021.
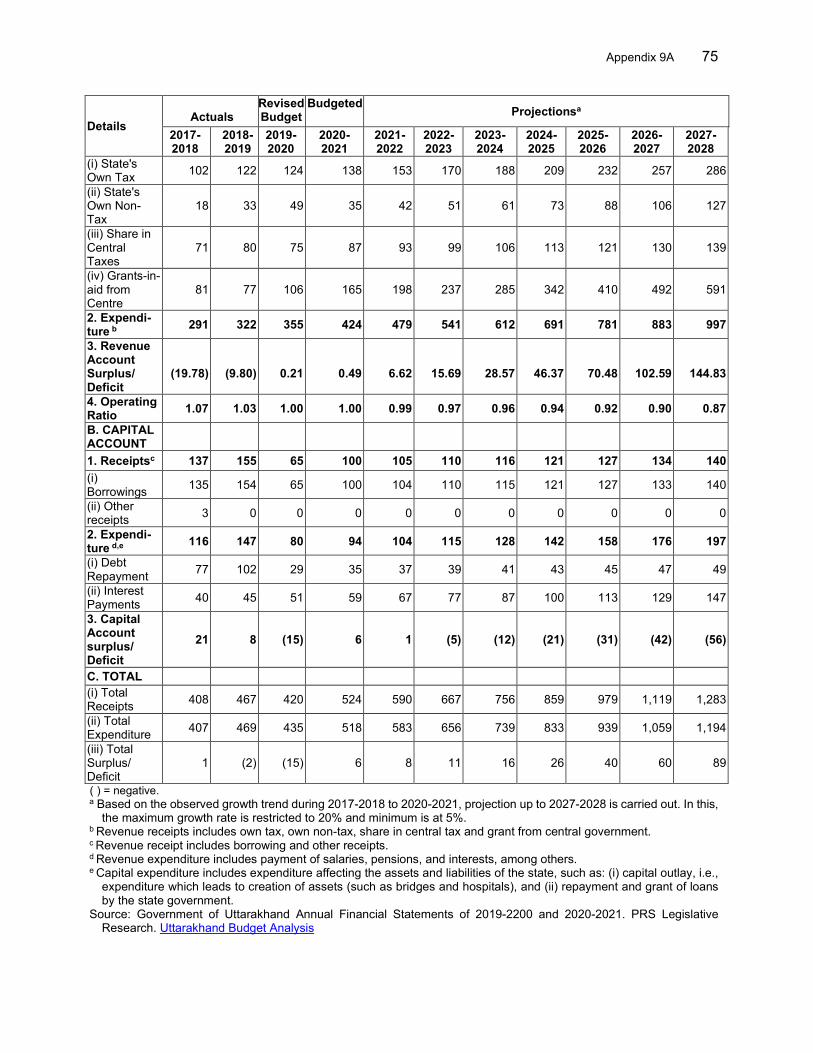
Appendix 9A 75
Details
Actuals
Revised Budget
Budgeted Projectionsa
2017-2018
2018-2019
2019-2020
2020-2021
2021-2022
2022-2023
2023-2024
2024-2025
2025-2026
2026-2027
2027-2028
(i) State's Own Tax 102 122 124 138 153 170 188 209 232 257 286
(ii) State's Own Non-Tax
18 33 49 35 42 51 61 73 88 106 127
(iii) Share in Central Taxes
71 80 75 87 93 99 106 113 121 130 139
(iv) Grants-in-aid from Centre
81 77 106 165 198 237 285 342 410 492 591
2. Expendi-ture b 291 322 355 424 479 541 612 691 781 883 997 3. Revenue Account Surplus/ Deficit
(19.78)
(9.80)
0.21
0.49
6.62
15.69
28.57
46.37
70.48
102.59
144.83
4. Operating Ratio 1.07 1.03 1.00 1.00 0.99 0.97 0.96 0.94 0.92 0.90 0.87 B. CAPITAL ACCOUNT
1. Receiptsc 137 155 65 100 105 110 116 121 127 134 140 (i) Borrowings 135 154 65 100 104 110 115 121 127 133 140
(ii) Other receipts 3 0 0 0 0 0 0 0 0 0 0
2. Expendi-ture d,e 116 147 80 94 104 115 128 142 158 176 197 (i) Debt Repayment 77 102 29 35 37 39 41 43 45 47 49
(ii) Interest Payments 40 45 51 59 67 77 87 100 113 129 147
3. Capital Account surplus/ Deficit
21 8 (15) 6 1 (5) (12) (21) (31) (42) (56)
C. TOTAL (i) Total Receipts 408 467 420 524 590 667 756 859 979 1,119 1,283
(ii) Total Expenditure 407 469 435 518 583 656 739 833 939 1,059 1,194
(iii) Total Surplus/ Deficit
1 (2) (15) 6 8 11 16 26 40 60 89
( ) = negative. a Based on the observed growth trend during 2017-2018 to 2020-2021, projection up to 2027-2028 is carried out. In this,
the maximum growth rate is restricted to 20% and minimum is at 5%. b Revenue receipts includes own tax, own non-tax, share in central tax and grant from central government. c Revenue receipt includes borrowing and other receipts. d Revenue expenditure includes payment of salaries, pensions, and interests, among others. e Capital expenditure includes expenditure affecting the assets and liabilities of the state, such as: (i) capital outlay, i.e.,
expenditure which leads to creation of assets (such as bridges and hospitals), and (ii) repayment and grant of loans by the state government.
Source: Government of Uttarakhand Annual Financial Statements of 2019-2200 and 2020-2021. PRS Legislative Research. Uttarakhand Budget Analysis
76 Appendix 9A
F. Conclusion 12. Analysis findings indicate that all subprojects, except Nainital water supply, are financially viable. Full O&M cost recovery, and partial capital cost recovery from 2020-2021 are attainable with (i) the required periodic tariff increases (herein, assumed every three years), and (ii) improved collection efficiency. Viability gap funding requirement for the operating entity (UJS) will be provided by the Government of Uttarakhand. The government support for O&M gap was found to be declining during the past two years as the revenue account of the government improved. Fiscal reforms and policies at state government and UJS levels, and innovative user charges at the UJS levels could be leveraged to strengthen urban services delivery and governance, including for the subprojects created under project 2 of UUSDIP.
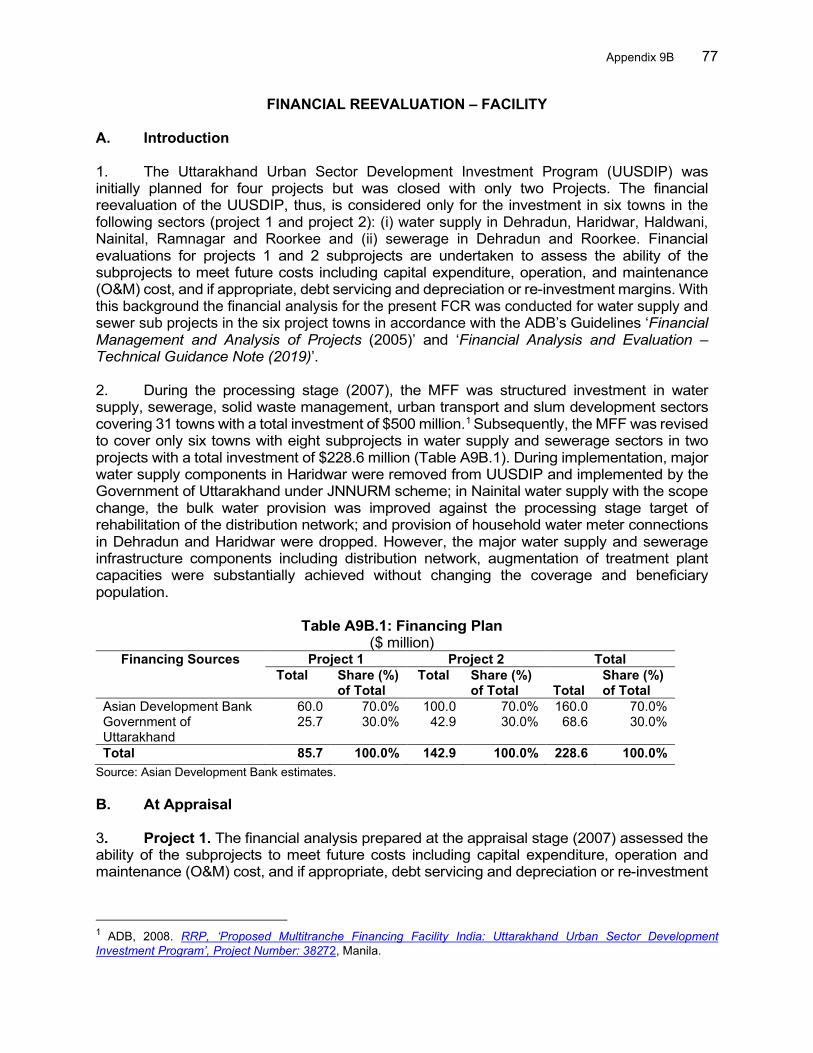
Appendix 9B 77
FINANCIAL REEVALUATION – FACILITY
A. Introduction
1. The Uttarakhand Urban Sector Development Investment Program (UUSDIP) was initially planned for four projects but was closed with only two Projects. The financial reevaluation of the UUSDIP, thus, is considered only for the investment in six towns in the following sectors (project 1 and project 2): (i) water supply in Dehradun, Haridwar, Haldwani, Nainital, Ramnagar and Roorkee and (ii) sewerage in Dehradun and Roorkee. Financial evaluations for projects 1 and 2 subprojects are undertaken to assess the ability of the subprojects to meet future costs including capital expenditure, operation, and maintenance (O&M) cost, and if appropriate, debt servicing and depreciation or re-investment margins. With this background the financial analysis for the present FCR was conducted for water supply and sewer sub projects in the six project towns in accordance with the ADB’s Guidelines ‘Financial Management and Analysis of Projects (2005)’ and ‘Financial Analysis and Evaluation – Technical Guidance Note (2019)’. 2. During the processing stage (2007), the MFF was structured investment in water supply, sewerage, solid waste management, urban transport and slum development sectors covering 31 towns with a total investment of $500 million.1 Subsequently, the MFF was revised to cover only six towns with eight subprojects in water supply and sewerage sectors in two projects with a total investment of $228.6 million (Table A9B.1). During implementation, major water supply components in Haridwar were removed from UUSDIP and implemented by the Government of Uttarakhand under JNNURM scheme; in Nainital water supply with the scope change, the bulk water provision was improved against the processing stage target of rehabilitation of the distribution network; and provision of household water meter connections in Dehradun and Haridwar were dropped. However, the major water supply and sewerage infrastructure components including distribution network, augmentation of treatment plant capacities were substantially achieved without changing the coverage and beneficiary population.
Table A9B.1: Financing Plan ($ million)
Financing Sources Project 1 Project 2 Total Total Share (%)
of Total Total Share (%)
of Total Total
Share (%) of Total
Asian Development Bank 60.0 70.0% 100.0 70.0% 160.0 70.0% Government of Uttarakhand
25.7 30.0% 42.9 30.0% 68.6 30.0%
Total 85.7 100.0% 142.9 100.0% 228.6 100.0% Source: Asian Development Bank estimates. B. At Appraisal
3. Project 1. The financial analysis prepared at the appraisal stage (2007) assessed the ability of the subprojects to meet future costs including capital expenditure, operation and maintenance (O&M) cost, and if appropriate, debt servicing and depreciation or re-investment
1 ADB, 2008. RRP, ‘Proposed Multitranche Financing Facility India: Uttarakhand Urban Sector Development Investment Program’, Project Number: 38272, Manila.
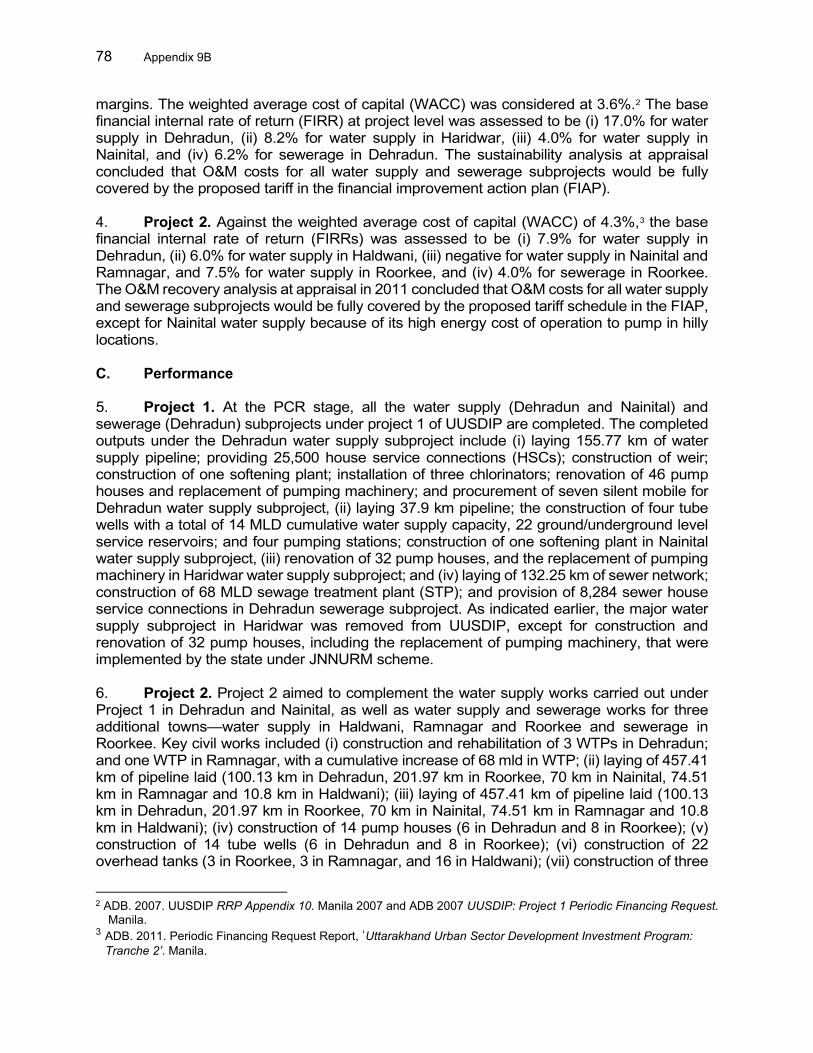
78 Appendix 9B
margins. The weighted average cost of capital (WACC) was considered at 3.6%.2 The base financial internal rate of return (FIRR) at project level was assessed to be (i) 17.0% for water supply in Dehradun, (ii) 8.2% for water supply in Haridwar, (iii) 4.0% for water supply in Nainital, and (iv) 6.2% for sewerage in Dehradun. The sustainability analysis at appraisal concluded that O&M costs for all water supply and sewerage subprojects would be fully covered by the proposed tariff in the financial improvement action plan (FIAP). 4. Project 2. Against the weighted average cost of capital (WACC) of 4.3%,3 the base financial internal rate of return (FIRRs) was assessed to be (i) 7.9% for water supply in Dehradun, (ii) 6.0% for water supply in Haldwani, (iii) negative for water supply in Nainital and Ramnagar, and 7.5% for water supply in Roorkee, and (iv) 4.0% for sewerage in Roorkee. The O&M recovery analysis at appraisal in 2011 concluded that O&M costs for all water supply and sewerage subprojects would be fully covered by the proposed tariff schedule in the FIAP, except for Nainital water supply because of its high energy cost of operation to pump in hilly locations. C. Performance
5. Project 1. At the PCR stage, all the water supply (Dehradun and Nainital) and sewerage (Dehradun) subprojects under project 1 of UUSDIP are completed. The completed outputs under the Dehradun water supply subproject include (i) laying 155.77 km of water supply pipeline; providing 25,500 house service connections (HSCs); construction of weir; construction of one softening plant; installation of three chlorinators; renovation of 46 pump houses and replacement of pumping machinery; and procurement of seven silent mobile for Dehradun water supply subproject, (ii) laying 37.9 km pipeline; the construction of four tube wells with a total of 14 MLD cumulative water supply capacity, 22 ground/underground level service reservoirs; and four pumping stations; construction of one softening plant in Nainital water supply subproject, (iii) renovation of 32 pump houses, and the replacement of pumping machinery in Haridwar water supply subproject; and (iv) laying of 132.25 km of sewer network; construction of 68 MLD sewage treatment plant (STP); and provision of 8,284 sewer house service connections in Dehradun sewerage subproject. As indicated earlier, the major water supply subproject in Haridwar was removed from UUSDIP, except for construction and renovation of 32 pump houses, including the replacement of pumping machinery, that were implemented by the state under JNNURM scheme. 6. Project 2. Project 2 aimed to complement the water supply works carried out under Project 1 in Dehradun and Nainital, as well as water supply and sewerage works for three additional towns—water supply in Haldwani, Ramnagar and Roorkee and sewerage in Roorkee. Key civil works included (i) construction and rehabilitation of 3 WTPs in Dehradun; and one WTP in Ramnagar, with a cumulative increase of 68 mld in WTP; (ii) laying of 457.41 km of pipeline laid (100.13 km in Dehradun, 201.97 km in Roorkee, 70 km in Nainital, 74.51 km in Ramnagar and 10.8 km in Haldwani); (iii) laying of 457.41 km of pipeline laid (100.13 km in Dehradun, 201.97 km in Roorkee, 70 km in Nainital, 74.51 km in Ramnagar and 10.8 km in Haldwani); (iv) construction of 14 pump houses (6 in Dehradun and 8 in Roorkee); (v) construction of 14 tube wells (6 in Dehradun and 8 in Roorkee); (vi) construction of 22 overhead tanks (3 in Roorkee, 3 in Ramnagar, and 16 in Haldwani); (vii) construction of three
2 ADB. 2007. UUSDIP RRP Appendix 10. Manila 2007 and ADB 2007 UUSDIP: Project 1 Periodic Financing Request.
Manila. 3 ADB. 2011. Periodic Financing Request Report, ‘Uttarakhand Urban Sector Development Investment Program:
Tranche 2’. Manila.
Appendix 9B 79
ground/underground level service reservoirs (2 in Ramnagar and 1 in Haldwani); (viii) installation of 109 bulk water meters (54 in Dehradun and 55 in Nainital); (ix) one STP with 33 mld treatment capacity in Roorkee; and (x) installation of 86.2 km sewer pipes. D. Approach
7. Main approach of this financial analysis is to re-evaluate the processing stage analysis carried out (2007 for project 1, and 2011 for project 2) through appropriate changes in the areas of project cost and implementation phasing that happened during the implementation period up to this completion stage. This is to facilitate the establishment of the financial viability and sustainability at the completion stage and also the comparison of the analysis results between processing and completion stages. Project analysis at appraisal stage is retained for the present analysis. As the infrastructure components targeted in both projects were substantially completed with coverage, the projected project benefits during the processing stages are retained. Also, the results of the full cost benefit analysis carried out for these revenue earning projects found with mixed trend with only two out of six subprojects financially viable. This underlines the need for project sustainability with the government support for four subprojects. In addition, the present arrangement of O&M for subprojects through the government budgetary support confirm the government support requirement. With this background, with a deviation to the processing stage analysis, the completion stage financial analysis discussion approach was focused more on sustainability for subprojects. Accordingly, sustainability analysis with O&M cost recovery was focused for subprojects. For facilitating project benefit estimation, the investments made in projects 1 and 2 were considered together in financial analysis as appropriate to the water supply subprojects in Dehradun and Nainital. This is mainly because of the linkage between the investments under two projects in benefit estimation. 8. Project Cost. The financial costs included base costs, consultancy, project implementation, project monitoring, financing charges, taxes & duties, but excluding price contingency. Physical contingency is not considered as actual costs are used in the reevaluation. Using the wholesale price index (WPI) for non-food commodities group, the year-wise actual disbursement was discounted to the base years (Tables A9B.2 to A9B.4).
Table A9B.2: Distribution of Project Cost – Project 1 (₹ million)a
Subprojects 2009 2010 2011 2012 2013 2014 2015 2016 2017 2018 Total I. Water Supply (i) Dehradunb 18.2 41.0 36.4 18.9 326.1 355.6 246.5 322.3 288.9 261.3 1,915.3 (ii) Haridwarc 0.5 4.8 17.0 0.5 8.7 5.3 4.1 3.6 2.5 - 47.0 (iii) Nainital 14.7 77.9 68.9 42.8 173.7 281.3 203.7 138.3 234.3 206.1 1,441.7 II. Sewerage (i) Dehradun 40.5 218.1 378.4 246.3 235.2 605.0 1,202.4 893.7 563.8 689.9 5,073.3 Total 73.9 341.8 500.7 308.5 743.7 1247.2 1656.7 1357.9 1089.5 1157.3 8477.3 ADB = Asian Development Bank, IPMU = investment program management unit, JNNURM = Jawaharlal Nehru National Urban Renewal Mission, UUSDIP = Uttarakhand Urban Sector Development Investment Program. a Periodical subproject costs were converted to the base year (2021) using the wholesale price index. b Includes the costs of project 1 and 2. c Originally proposed Haridwar water supply during the processing stage was subsequently shifted and implemented
by the Government of Uttarakhand under JNNURM scheme. However, only replacement of 36 pumps and construction of one pumping station were implemented under UUSDIP. For analysis, the total cost under JNNURM and UUSDIP were considered.
Source: Analysis based on the data provided by the Investment Program Management Unit.
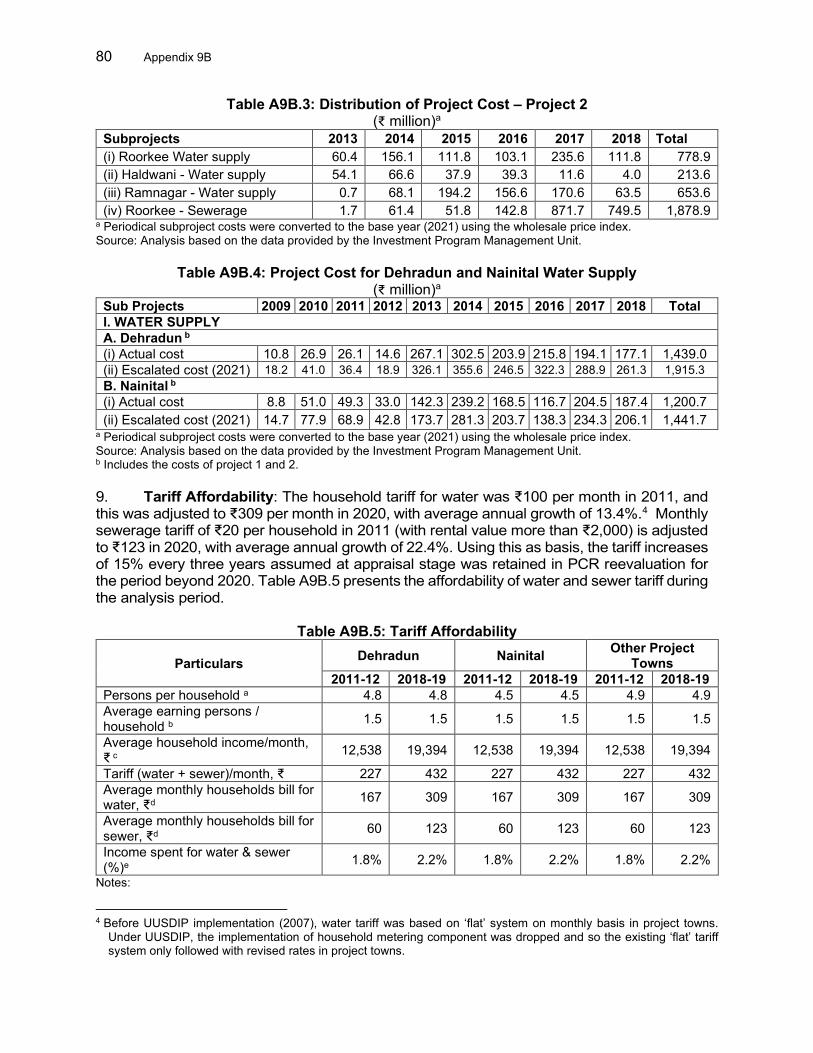
80 Appendix 9B
Table A9B.3: Distribution of Project Cost – Project 2 (₹ million)a
Subprojects 2013 2014 2015 2016 2017 2018 Total (i) Roorkee Water supply 60.4 156.1 111.8 103.1 235.6 111.8 778.9 (ii) Haldwani - Water supply 54.1 66.6 37.9 39.3 11.6 4.0 213.6 (iii) Ramnagar - Water supply 0.7 68.1 194.2 156.6 170.6 63.5 653.6 (iv) Roorkee - Sewerage 1.7 61.4 51.8 142.8 871.7 749.5 1,878.9
a Periodical subproject costs were converted to the base year (2021) using the wholesale price index. Source: Analysis based on the data provided by the Investment Program Management Unit.
Table A9B.4: Project Cost for Dehradun and Nainital Water Supply
(₹ million)a
Sub Projects 2009 2010 2011 2012 2013 2014 2015 2016 2017 2018 Total I. WATER SUPPLY A. Dehradun b (i) Actual cost 10.8 26.9 26.1 14.6 267.1 302.5 203.9 215.8 194.1 177.1 1,439.0 (ii) Escalated cost (2021) 18.2 41.0 36.4 18.9 326.1 355.6 246.5 322.3 288.9 261.3 1,915.3 B. Nainital b (i) Actual cost 8.8 51.0 49.3 33.0 142.3 239.2 168.5 116.7 204.5 187.4 1,200.7 (ii) Escalated cost (2021) 14.7 77.9 68.9 42.8 173.7 281.3 203.7 138.3 234.3 206.1 1,441.7
a Periodical subproject costs were converted to the base year (2021) using the wholesale price index. Source: Analysis based on the data provided by the Investment Program Management Unit. b Includes the costs of project 1 and 2. 9. Tariff Affordability: The household tariff for water was ₹100 per month in 2011, and this was adjusted to ₹309 per month in 2020, with average annual growth of 13.4%.4 Monthly sewerage tariff of ₹20 per household in 2011 (with rental value more than ₹2,000) is adjusted to ₹123 in 2020, with average annual growth of 22.4%. Using this as basis, the tariff increases of 15% every three years assumed at appraisal stage was retained in PCR reevaluation for the period beyond 2020. Table A9B.5 presents the affordability of water and sewer tariff during the analysis period.
Table A9B.5: Tariff Affordability
Particulars Dehradun Nainital Other Project Towns
2011-12 2018-19 2011-12 2018-19 2011-12 2018-19 Persons per household a 4.8 4.8 4.5 4.5 4.9 4.9 Average earning persons / household b 1.5 1.5 1.5 1.5 1.5 1.5
Average household income/month, ₹ c 12,538 19,394 12,538 19,394 12,538 19,394
Tariff (water + sewer)/month, ₹ 227 432 227 432 227 432 Average monthly households bill for water, ₹d 167 309 167 309 167 309
Average monthly households bill for sewer, ₹d 60 123 60 123 60 123
Income spent for water & sewer (%)e 1.8% 2.2% 1.8% 2.2% 1.8% 2.2%
Notes:
4 Before UUSDIP implementation (2007), water tariff was based on ‘flat’ system on monthly basis in project towns.
Under UUSDIP, the implementation of household metering component was dropped and so the existing ‘flat’ tariff system only followed with revised rates in project towns.
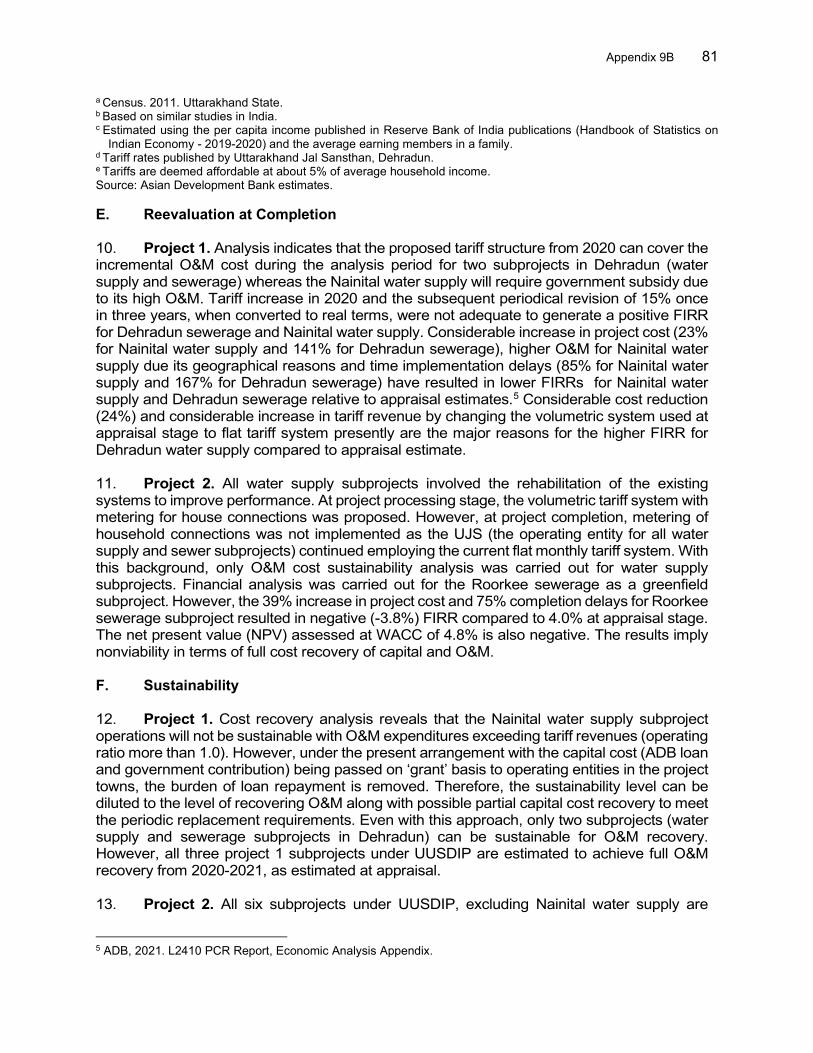
Appendix 9B 81
a Census. 2011. Uttarakhand State. b Based on similar studies in India. c Estimated using the per capita income published in Reserve Bank of India publications (Handbook of Statistics on
Indian Economy - 2019-2020) and the average earning members in a family. d Tariff rates published by Uttarakhand Jal Sansthan, Dehradun. e Tariffs are deemed affordable at about 5% of average household income. Source: Asian Development Bank estimates. E. Reevaluation at Completion
10. Project 1. Analysis indicates that the proposed tariff structure from 2020 can cover the incremental O&M cost during the analysis period for two subprojects in Dehradun (water supply and sewerage) whereas the Nainital water supply will require government subsidy due to its high O&M. Tariff increase in 2020 and the subsequent periodical revision of 15% once in three years, when converted to real terms, were not adequate to generate a positive FIRR for Dehradun sewerage and Nainital water supply. Considerable increase in project cost (23% for Nainital water supply and 141% for Dehradun sewerage), higher O&M for Nainital water supply due its geographical reasons and time implementation delays (85% for Nainital water supply and 167% for Dehradun sewerage) have resulted in lower FIRRs for Nainital water supply and Dehradun sewerage relative to appraisal estimates.5 Considerable cost reduction (24%) and considerable increase in tariff revenue by changing the volumetric system used at appraisal stage to flat tariff system presently are the major reasons for the higher FIRR for Dehradun water supply compared to appraisal estimate. 11. Project 2. All water supply subprojects involved the rehabilitation of the existing systems to improve performance. At project processing stage, the volumetric tariff system with metering for house connections was proposed. However, at project completion, metering of household connections was not implemented as the UJS (the operating entity for all water supply and sewer subprojects) continued employing the current flat monthly tariff system. With this background, only O&M cost sustainability analysis was carried out for water supply subprojects. Financial analysis was carried out for the Roorkee sewerage as a greenfield subproject. However, the 39% increase in project cost and 75% completion delays for Roorkee sewerage subproject resulted in negative (-3.8%) FIRR compared to 4.0% at appraisal stage. The net present value (NPV) assessed at WACC of 4.8% is also negative. The results imply nonviability in terms of full cost recovery of capital and O&M. F. Sustainability 12. Project 1. Cost recovery analysis reveals that the Nainital water supply subproject operations will not be sustainable with O&M expenditures exceeding tariff revenues (operating ratio more than 1.0). However, under the present arrangement with the capital cost (ADB loan and government contribution) being passed on ‘grant’ basis to operating entities in the project towns, the burden of loan repayment is removed. Therefore, the sustainability level can be diluted to the level of recovering O&M along with possible partial capital cost recovery to meet the periodic replacement requirements. Even with this approach, only two subprojects (water supply and sewerage subprojects in Dehradun) can be sustainable for O&M recovery. However, all three project 1 subprojects under UUSDIP are estimated to achieve full O&M recovery from 2020-2021, as estimated at appraisal. 13. Project 2. All six subprojects under UUSDIP, excluding Nainital water supply are
5 ADB, 2021. L2410 PCR Report, Economic Analysis Appendix.
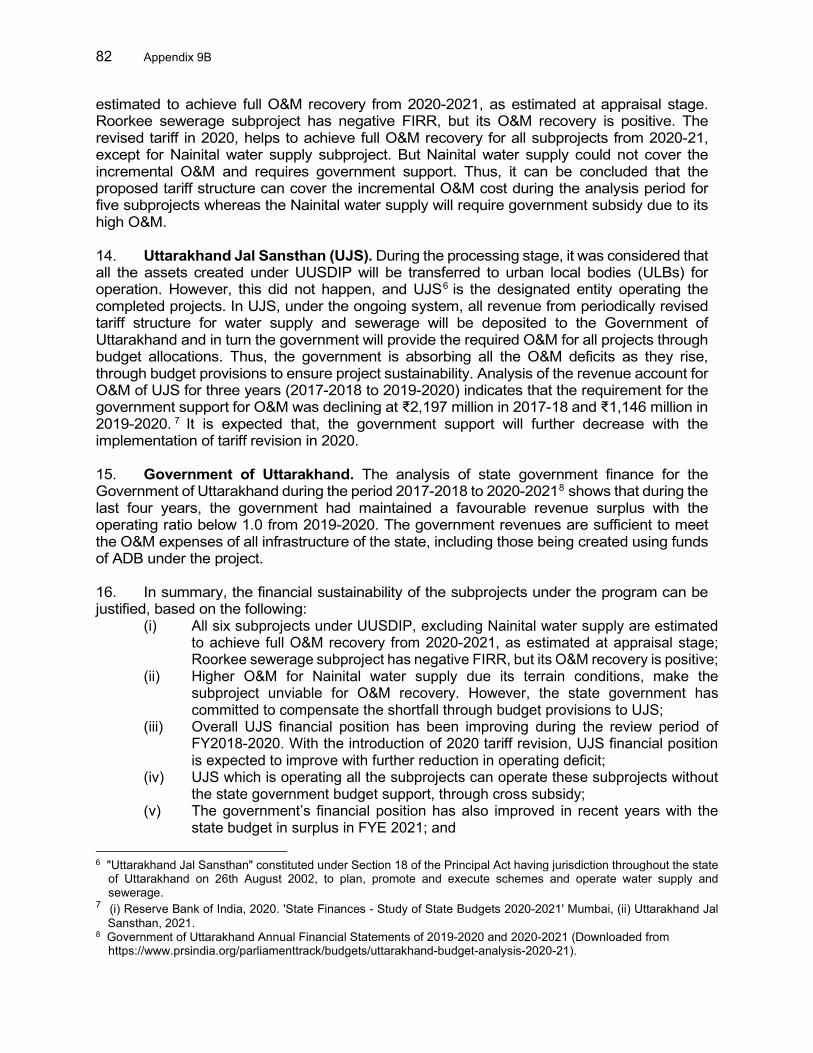
82 Appendix 9B
estimated to achieve full O&M recovery from 2020-2021, as estimated at appraisal stage. Roorkee sewerage subproject has negative FIRR, but its O&M recovery is positive. The revised tariff in 2020, helps to achieve full O&M recovery for all subprojects from 2020-21, except for Nainital water supply subproject. But Nainital water supply could not cover the incremental O&M and requires government support. Thus, it can be concluded that the proposed tariff structure can cover the incremental O&M cost during the analysis period for five subprojects whereas the Nainital water supply will require government subsidy due to its high O&M. 14. Uttarakhand Jal Sansthan (UJS). During the processing stage, it was considered that all the assets created under UUSDIP will be transferred to urban local bodies (ULBs) for operation. However, this did not happen, and UJS6 is the designated entity operating the completed projects. In UJS, under the ongoing system, all revenue from periodically revised tariff structure for water supply and sewerage will be deposited to the Government of Uttarakhand and in turn the government will provide the required O&M for all projects through budget allocations. Thus, the government is absorbing all the O&M deficits as they rise, through budget provisions to ensure project sustainability. Analysis of the revenue account for O&M of UJS for three years (2017-2018 to 2019-2020) indicates that the requirement for the government support for O&M was declining at ₹2,197 million in 2017-18 and ₹1,146 million in 2019-2020. 7 It is expected that, the government support will further decrease with the implementation of tariff revision in 2020.
15. Government of Uttarakhand. The analysis of state government finance for the Government of Uttarakhand during the period 2017-2018 to 2020-20218 shows that during the last four years, the government had maintained a favourable revenue surplus with the operating ratio below 1.0 from 2019-2020. The government revenues are sufficient to meet the O&M expenses of all infrastructure of the state, including those being created using funds of ADB under the project. 16. In summary, the financial sustainability of the subprojects under the program can be justified, based on the following:
(i) All six subprojects under UUSDIP, excluding Nainital water supply are estimated to achieve full O&M recovery from 2020-2021, as estimated at appraisal stage; Roorkee sewerage subproject has negative FIRR, but its O&M recovery is positive;
(ii) Higher O&M for Nainital water supply due its terrain conditions, make the subproject unviable for O&M recovery. However, the state government has committed to compensate the shortfall through budget provisions to UJS;
(iii) Overall UJS financial position has been improving during the review period of FY2018-2020. With the introduction of 2020 tariff revision, UJS financial position is expected to improve with further reduction in operating deficit;
(iv) UJS which is operating all the subprojects can operate these subprojects without the state government budget support, through cross subsidy;
(v) The government’s financial position has also improved in recent years with the state budget in surplus in FYE 2021; and
6 "Uttarakhand Jal Sansthan" constituted under Section 18 of the Principal Act having jurisdiction throughout the state
of Uttarakhand on 26th August 2002, to plan, promote and execute schemes and operate water supply and sewerage.
7 (i) Reserve Bank of India, 2020. 'State Finances - Study of State Budgets 2020-2021' Mumbai, (ii) Uttarakhand Jal Sansthan, 2021.
8 Government of Uttarakhand Annual Financial Statements of 2019-2020 and 2020-2021 (Downloaded from https://www.prsindia.org/parliamenttrack/budgets/uttarakhand-budget-analysis-2020-21).
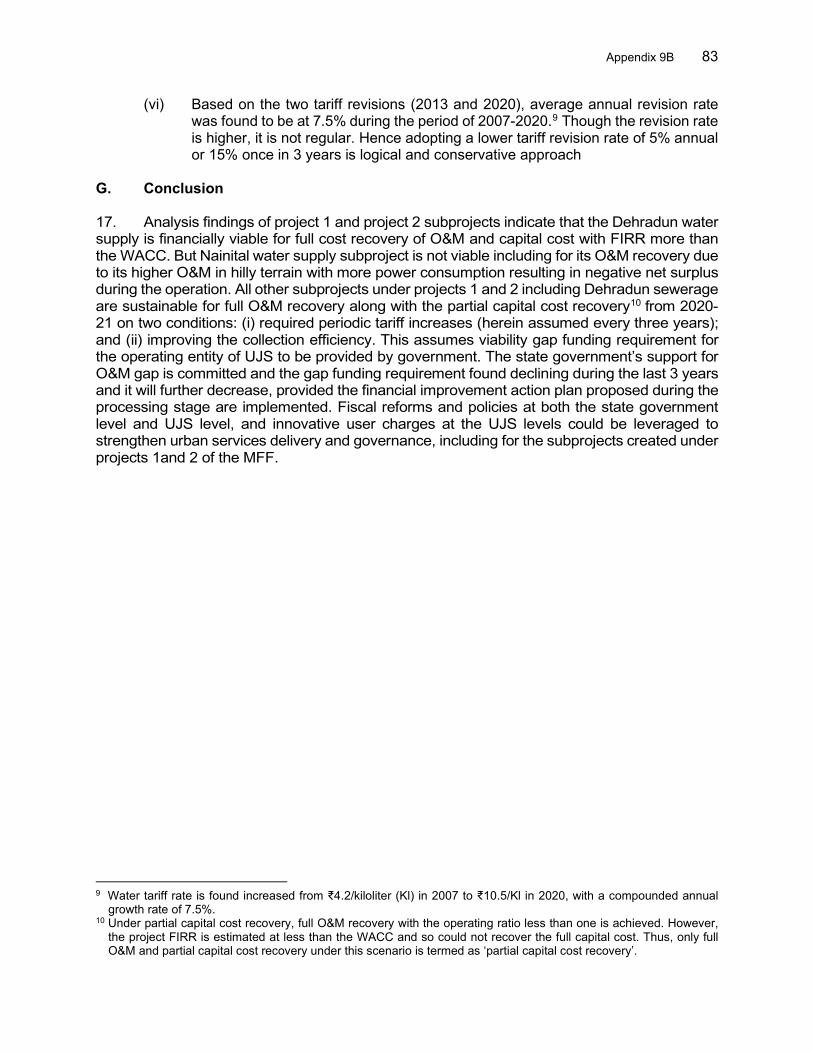
Appendix 9B 83
(vi) Based on the two tariff revisions (2013 and 2020), average annual revision rate was found to be at 7.5% during the period of 2007-2020.9 Though the revision rate is higher, it is not regular. Hence adopting a lower tariff revision rate of 5% annual or 15% once in 3 years is logical and conservative approach
G. Conclusion 17. Analysis findings of project 1 and project 2 subprojects indicate that the Dehradun water supply is financially viable for full cost recovery of O&M and capital cost with FIRR more than the WACC. But Nainital water supply subproject is not viable including for its O&M recovery due to its higher O&M in hilly terrain with more power consumption resulting in negative net surplus during the operation. All other subprojects under projects 1 and 2 including Dehradun sewerage are sustainable for full O&M recovery along with the partial capital cost recovery10 from 2020-21 on two conditions: (i) required periodic tariff increases (herein assumed every three years); and (ii) improving the collection efficiency. This assumes viability gap funding requirement for the operating entity of UJS to be provided by government. The state government’s support for O&M gap is committed and the gap funding requirement found declining during the last 3 years and it will further decrease, provided the financial improvement action plan proposed during the processing stage are implemented. Fiscal reforms and policies at both the state government level and UJS level, and innovative user charges at the UJS levels could be leveraged to strengthen urban services delivery and governance, including for the subprojects created under projects 1and 2 of the MFF.
9 Water tariff rate is found increased from ₹4.2/kiloliter (Kl) in 2007 to ₹10.5/Kl in 2020, with a compounded annual
growth rate of 7.5%. 10 Under partial capital cost recovery, full O&M recovery with the operating ratio less than one is achieved. However,
the project FIRR is estimated at less than the WACC and so could not recover the full capital cost. Thus, only full O&M and partial capital cost recovery under this scenario is termed as ‘partial capital cost recovery’.
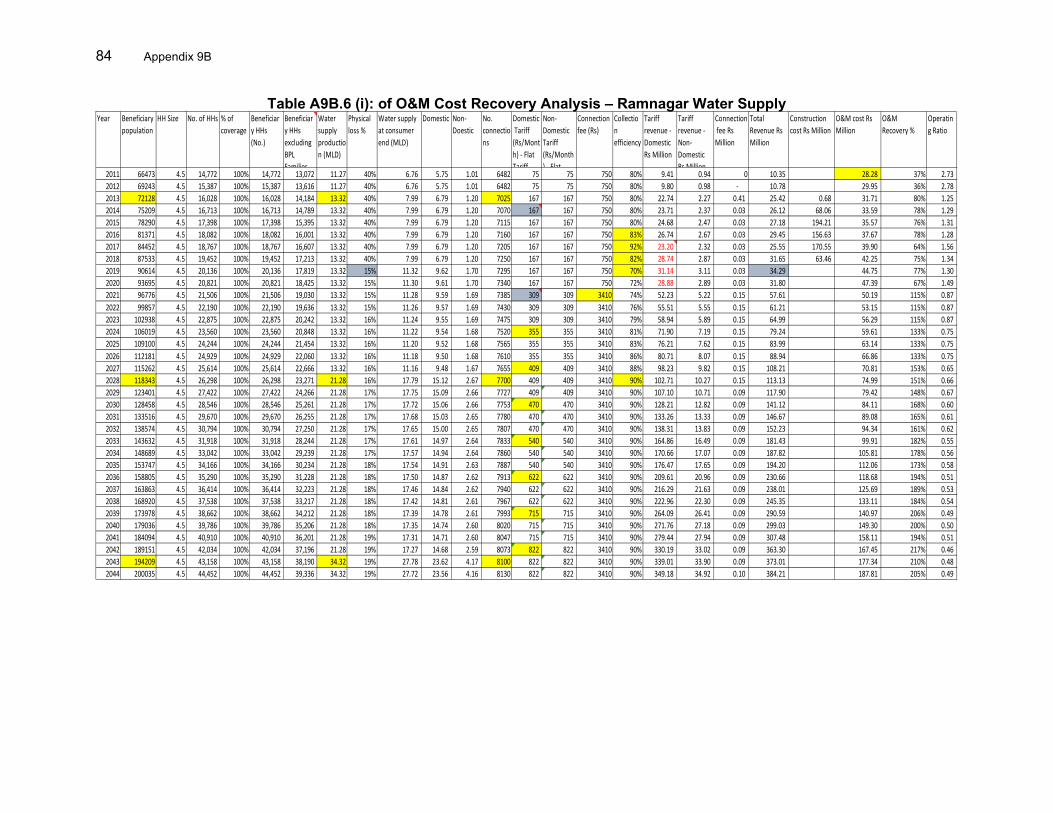
84 Appendix 9B
Table A9B.6 (i): of O&M Cost Recovery Analysis – Ramnagar Water Supply
Year Beneficiary population
HH Size No. of HHs % of coverage
Beneficiary HHs (No.)
Beneficiary HHs excluding BPL Families
Water supply production (MLD)
Physical loss %
Water supply at consumer end (MLD)
Domestic Non-Doestic
No. connections
Domestic Tariff (Rs/Month) - Flat Tariff
Non-Domestic Tariff (Rs/Month) - Flat
Connection fee (Rs)
Collection efficiency
Tariff revenue - Domestic Rs Million
Tariff revenue - Non-Domestic Rs Million
Connection fee Rs Million
Total Revenue Rs Million
Construction cost Rs Million
O&M cost Rs Million
O&M Recovery %
Operating Ratio
2011 66473 4.5 14,772 100% 14,772 13,072 11.27 40% 6.76 5.75 1.01 6482 75 75 750 80% 9.41 0.94 0 10.35 28.28 37% 2.73 2012 69243 4.5 15,387 100% 15,387 13,616 11.27 40% 6.76 5.75 1.01 6482 75 75 750 80% 9.80 0.98 - 10.78 29.95 36% 2.78 2013 72128 4.5 16,028 100% 16,028 14,184 13.32 40% 7.99 6.79 1.20 7025 167 167 750 80% 22.74 2.27 0.41 25.42 0.68 31.71 80% 1.25 2014 75209 4.5 16,713 100% 16,713 14,789 13.32 40% 7.99 6.79 1.20 7070 167 167 750 80% 23.71 2.37 0.03 26.12 68.06 33.59 78% 1.29 2015 78290 4.5 17,398 100% 17,398 15,395 13.32 40% 7.99 6.79 1.20 7115 167 167 750 80% 24.68 2.47 0.03 27.18 194.21 35.57 76% 1.31 2016 81371 4.5 18,082 100% 18,082 16,001 13.32 40% 7.99 6.79 1.20 7160 167 167 750 83% 26.74 2.67 0.03 29.45 156.63 37.67 78% 1.28 2017 84452 4.5 18,767 100% 18,767 16,607 13.32 40% 7.99 6.79 1.20 7205 167 167 750 92% 23.20 2.32 0.03 25.55 170.55 39.90 64% 1.56 2018 87533 4.5 19,452 100% 19,452 17,213 13.32 40% 7.99 6.79 1.20 7250 167 167 750 82% 28.74 2.87 0.03 31.65 63.46 42.25 75% 1.34 2019 90614 4.5 20,136 100% 20,136 17,819 13.32 15% 11.32 9.62 1.70 7295 167 167 750 70% 31.14 3.11 0.03 34.29 44.75 77% 1.30 2020 93695 4.5 20,821 100% 20,821 18,425 13.32 15% 11.30 9.61 1.70 7340 167 167 750 72% 28.88 2.89 0.03 31.80 47.39 67% 1.49 2021 96776 4.5 21,506 100% 21,506 19,030 13.32 15% 11.28 9.59 1.69 7385 309 309 3410 74% 52.23 5.22 0.15 57.61 50.19 115% 0.87 2022 99857 4.5 22,190 100% 22,190 19,636 13.32 15% 11.26 9.57 1.69 7430 309 309 3410 76% 55.51 5.55 0.15 61.21 53.15 115% 0.87 2023 102938 4.5 22,875 100% 22,875 20,242 13.32 16% 11.24 9.55 1.69 7475 309 309 3410 79% 58.94 5.89 0.15 64.99 56.29 115% 0.87 2024 106019 4.5 23,560 100% 23,560 20,848 13.32 16% 11.22 9.54 1.68 7520 355 355 3410 81% 71.90 7.19 0.15 79.24 59.61 133% 0.75 2025 109100 4.5 24,244 100% 24,244 21,454 13.32 16% 11.20 9.52 1.68 7565 355 355 3410 83% 76.21 7.62 0.15 83.99 63.14 133% 0.75 2026 112181 4.5 24,929 100% 24,929 22,060 13.32 16% 11.18 9.50 1.68 7610 355 355 3410 86% 80.71 8.07 0.15 88.94 66.86 133% 0.75 2027 115262 4.5 25,614 100% 25,614 22,666 13.32 16% 11.16 9.48 1.67 7655 409 409 3410 88% 98.23 9.82 0.15 108.21 70.81 153% 0.65 2028 118343 4.5 26,298 100% 26,298 23,271 21.28 16% 17.79 15.12 2.67 7700 409 409 3410 90% 102.71 10.27 0.15 113.13 74.99 151% 0.66 2029 123401 4.5 27,422 100% 27,422 24,266 21.28 17% 17.75 15.09 2.66 7727 409 409 3410 90% 107.10 10.71 0.09 117.90 79.42 148% 0.67 2030 128458 4.5 28,546 100% 28,546 25,261 21.28 17% 17.72 15.06 2.66 7753 470 470 3410 90% 128.21 12.82 0.09 141.12 84.11 168% 0.60 2031 133516 4.5 29,670 100% 29,670 26,255 21.28 17% 17.68 15.03 2.65 7780 470 470 3410 90% 133.26 13.33 0.09 146.67 89.08 165% 0.61 2032 138574 4.5 30,794 100% 30,794 27,250 21.28 17% 17.65 15.00 2.65 7807 470 470 3410 90% 138.31 13.83 0.09 152.23 94.34 161% 0.62 2033 143632 4.5 31,918 100% 31,918 28,244 21.28 17% 17.61 14.97 2.64 7833 540 540 3410 90% 164.86 16.49 0.09 181.43 99.91 182% 0.55 2034 148689 4.5 33,042 100% 33,042 29,239 21.28 17% 17.57 14.94 2.64 7860 540 540 3410 90% 170.66 17.07 0.09 187.82 105.81 178% 0.56 2035 153747 4.5 34,166 100% 34,166 30,234 21.28 18% 17.54 14.91 2.63 7887 540 540 3410 90% 176.47 17.65 0.09 194.20 112.06 173% 0.58 2036 158805 4.5 35,290 100% 35,290 31,228 21.28 18% 17.50 14.87 2.62 7913 622 622 3410 90% 209.61 20.96 0.09 230.66 118.68 194% 0.51 2037 163863 4.5 36,414 100% 36,414 32,223 21.28 18% 17.46 14.84 2.62 7940 622 622 3410 90% 216.29 21.63 0.09 238.01 125.69 189% 0.53 2038 168920 4.5 37,538 100% 37,538 33,217 21.28 18% 17.42 14.81 2.61 7967 622 622 3410 90% 222.96 22.30 0.09 245.35 133.11 184% 0.54 2039 173978 4.5 38,662 100% 38,662 34,212 21.28 18% 17.39 14.78 2.61 7993 715 715 3410 90% 264.09 26.41 0.09 290.59 140.97 206% 0.49 2040 179036 4.5 39,786 100% 39,786 35,206 21.28 18% 17.35 14.74 2.60 8020 715 715 3410 90% 271.76 27.18 0.09 299.03 149.30 200% 0.50 2041 184094 4.5 40,910 100% 40,910 36,201 21.28 19% 17.31 14.71 2.60 8047 715 715 3410 90% 279.44 27.94 0.09 307.48 158.11 194% 0.51 2042 189151 4.5 42,034 100% 42,034 37,196 21.28 19% 17.27 14.68 2.59 8073 822 822 3410 90% 330.19 33.02 0.09 363.30 167.45 217% 0.46 2043 194209 4.5 43,158 100% 43,158 38,190 34.32 19% 27.78 23.62 4.17 8100 822 822 3410 90% 339.01 33.90 0.09 373.01 177.34 210% 0.48 2044 200035 4.5 44,452 100% 44,452 39,336 34.32 19% 27.72 23.56 4.16 8130 822 822 3410 90% 349.18 34.92 0.10 384.21 187.81 205% 0.49
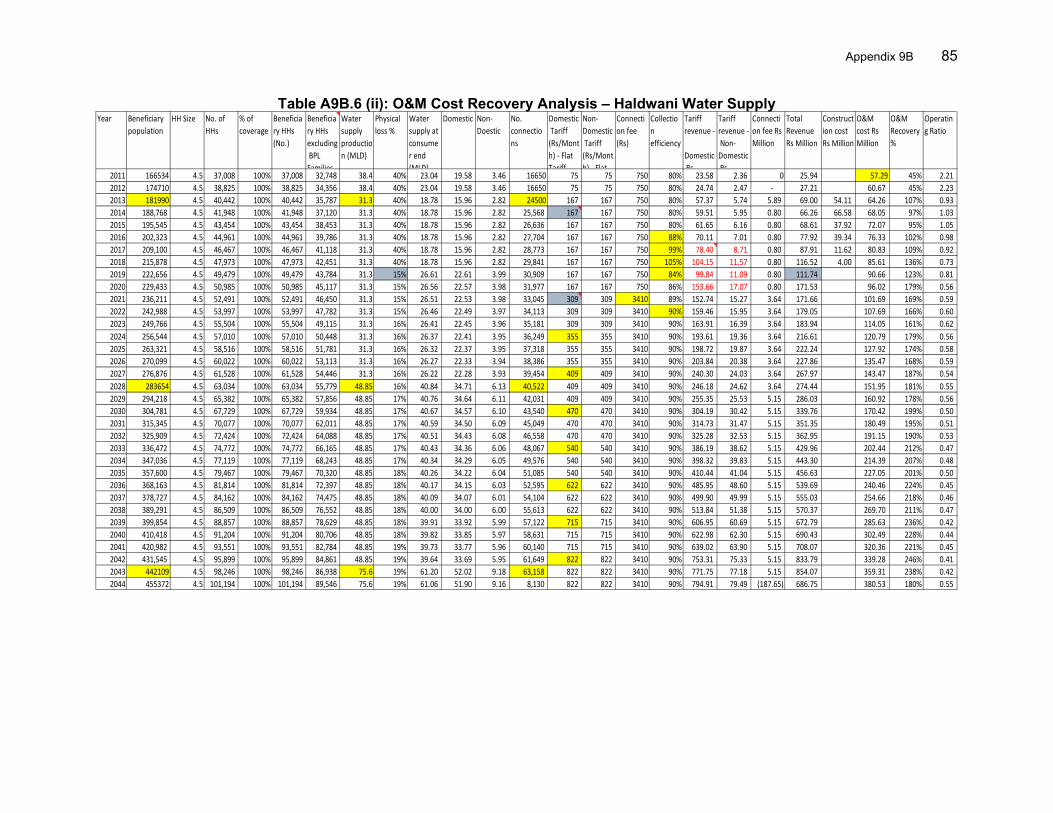
Appendix 9B 85
Table A9B.6 (ii): O&M Cost Recovery Analysis – Haldwani Water Supply
Year Beneficiary population
HH Size No. of HHs
% of coverage
Beneficiary HHs (No.)
Beneficiary HHs excluding BPL Families
Water supply production (MLD)
Physical loss %
Water supply at consumer end (MLD)
Domestic Non-Doestic
No. connections
Domestic Tariff (Rs/Month) - Flat Tariff
Non-Domestic Tariff (Rs/Month) - Flat
Connection fee (Rs)
Collection efficiency
Tariff revenue - Domestic Rs
Tariff revenue - Non-Domestic Rs
Connection fee Rs Million
Total Revenue Rs Million
Construction cost Rs Million
O&M cost Rs Million
O&M Recovery %
Operating Ratio
2011 166534 4.5 37,008 100% 37,008 32,748 38.4 40% 23.04 19.58 3.46 16650 75 75 750 80% 23.58 2.36 0 25.94 57.29 45% 2.21 2012 174710 4.5 38,825 100% 38,825 34,356 38.4 40% 23.04 19.58 3.46 16650 75 75 750 80% 24.74 2.47 - 27.21 60.67 45% 2.23 2013 181990 4.5 40,442 100% 40,442 35,787 31.3 40% 18.78 15.96 2.82 24500 167 167 750 80% 57.37 5.74 5.89 69.00 54.11 64.26 107% 0.93 2014 188,768 4.5 41,948 100% 41,948 37,120 31.3 40% 18.78 15.96 2.82 25,568 167 167 750 80% 59.51 5.95 0.80 66.26 66.58 68.05 97% 1.03 2015 195,545 4.5 43,454 100% 43,454 38,453 31.3 40% 18.78 15.96 2.82 26,636 167 167 750 80% 61.65 6.16 0.80 68.61 37.92 72.07 95% 1.05 2016 202,323 4.5 44,961 100% 44,961 39,786 31.3 40% 18.78 15.96 2.82 27,704 167 167 750 88% 70.11 7.01 0.80 77.92 39.34 76.33 102% 0.98 2017 209,100 4.5 46,467 100% 46,467 41,118 31.3 40% 18.78 15.96 2.82 28,773 167 167 750 99% 78.40 8.71 0.80 87.91 11.62 80.83 109% 0.92 2018 215,878 4.5 47,973 100% 47,973 42,451 31.3 40% 18.78 15.96 2.82 29,841 167 167 750 105% 104.15 11.57 0.80 116.52 4.00 85.61 136% 0.73 2019 222,656 4.5 49,479 100% 49,479 43,784 31.3 15% 26.61 22.61 3.99 30,909 167 167 750 84% 99.84 11.09 0.80 111.74 90.66 123% 0.81 2020 229,433 4.5 50,985 100% 50,985 45,117 31.3 15% 26.56 22.57 3.98 31,977 167 167 750 86% 153.66 17.07 0.80 171.53 96.02 179% 0.56 2021 236,211 4.5 52,491 100% 52,491 46,450 31.3 15% 26.51 22.53 3.98 33,045 309 309 3410 89% 152.74 15.27 3.64 171.66 101.69 169% 0.59 2022 242,988 4.5 53,997 100% 53,997 47,782 31.3 15% 26.46 22.49 3.97 34,113 309 309 3410 90% 159.46 15.95 3.64 179.05 107.69 166% 0.60 2023 249,766 4.5 55,504 100% 55,504 49,115 31.3 16% 26.41 22.45 3.96 35,181 309 309 3410 90% 163.91 16.39 3.64 183.94 114.05 161% 0.62 2024 256,544 4.5 57,010 100% 57,010 50,448 31.3 16% 26.37 22.41 3.95 36,249 355 355 3410 90% 193.61 19.36 3.64 216.61 120.79 179% 0.56 2025 263,321 4.5 58,516 100% 58,516 51,781 31.3 16% 26.32 22.37 3.95 37,318 355 355 3410 90% 198.72 19.87 3.64 222.24 127.92 174% 0.58 2026 270,099 4.5 60,022 100% 60,022 53,113 31.3 16% 26.27 22.33 3.94 38,386 355 355 3410 90% 203.84 20.38 3.64 227.86 135.47 168% 0.59 2027 276,876 4.5 61,528 100% 61,528 54,446 31.3 16% 26.22 22.28 3.93 39,454 409 409 3410 90% 240.30 24.03 3.64 267.97 143.47 187% 0.54 2028 283654 4.5 63,034 100% 63,034 55,779 48.85 16% 40.84 34.71 6.13 40,522 409 409 3410 90% 246.18 24.62 3.64 274.44 151.95 181% 0.55 2029 294,218 4.5 65,382 100% 65,382 57,856 48.85 17% 40.76 34.64 6.11 42,031 409 409 3410 90% 255.35 25.53 5.15 286.03 160.92 178% 0.56 2030 304,781 4.5 67,729 100% 67,729 59,934 48.85 17% 40.67 34.57 6.10 43,540 470 470 3410 90% 304.19 30.42 5.15 339.76 170.42 199% 0.50 2031 315,345 4.5 70,077 100% 70,077 62,011 48.85 17% 40.59 34.50 6.09 45,049 470 470 3410 90% 314.73 31.47 5.15 351.35 180.49 195% 0.51 2032 325,909 4.5 72,424 100% 72,424 64,088 48.85 17% 40.51 34.43 6.08 46,558 470 470 3410 90% 325.28 32.53 5.15 362.95 191.15 190% 0.53 2033 336,472 4.5 74,772 100% 74,772 66,165 48.85 17% 40.43 34.36 6.06 48,067 540 540 3410 90% 386.19 38.62 5.15 429.96 202.44 212% 0.47 2034 347,036 4.5 77,119 100% 77,119 68,243 48.85 17% 40.34 34.29 6.05 49,576 540 540 3410 90% 398.32 39.83 5.15 443.30 214.39 207% 0.48 2035 357,600 4.5 79,467 100% 79,467 70,320 48.85 18% 40.26 34.22 6.04 51,085 540 540 3410 90% 410.44 41.04 5.15 456.63 227.05 201% 0.50 2036 368,163 4.5 81,814 100% 81,814 72,397 48.85 18% 40.17 34.15 6.03 52,595 622 622 3410 90% 485.95 48.60 5.15 539.69 240.46 224% 0.45 2037 378,727 4.5 84,162 100% 84,162 74,475 48.85 18% 40.09 34.07 6.01 54,104 622 622 3410 90% 499.90 49.99 5.15 555.03 254.66 218% 0.46 2038 389,291 4.5 86,509 100% 86,509 76,552 48.85 18% 40.00 34.00 6.00 55,613 622 622 3410 90% 513.84 51.38 5.15 570.37 269.70 211% 0.47 2039 399,854 4.5 88,857 100% 88,857 78,629 48.85 18% 39.91 33.92 5.99 57,122 715 715 3410 90% 606.95 60.69 5.15 672.79 285.63 236% 0.42 2040 410,418 4.5 91,204 100% 91,204 80,706 48.85 18% 39.82 33.85 5.97 58,631 715 715 3410 90% 622.98 62.30 5.15 690.43 302.49 228% 0.44 2041 420,982 4.5 93,551 100% 93,551 82,784 48.85 19% 39.73 33.77 5.96 60,140 715 715 3410 90% 639.02 63.90 5.15 708.07 320.36 221% 0.45 2042 431,545 4.5 95,899 100% 95,899 84,861 48.85 19% 39.64 33.69 5.95 61,649 822 822 3410 90% 753.31 75.33 5.15 833.79 339.28 246% 0.41 2043 442109 4.5 98,246 100% 98,246 86,938 75.6 19% 61.20 52.02 9.18 63,158 822 822 3410 90% 771.75 77.18 5.15 854.07 359.31 238% 0.42 2044 455372 4.5 101,194 100% 101,194 89,546 75.6 19% 61.06 51.90 9.16 8,130 822 822 3410 90% 794.91 79.49 (187.65) 686.75 380.53 180% 0.55
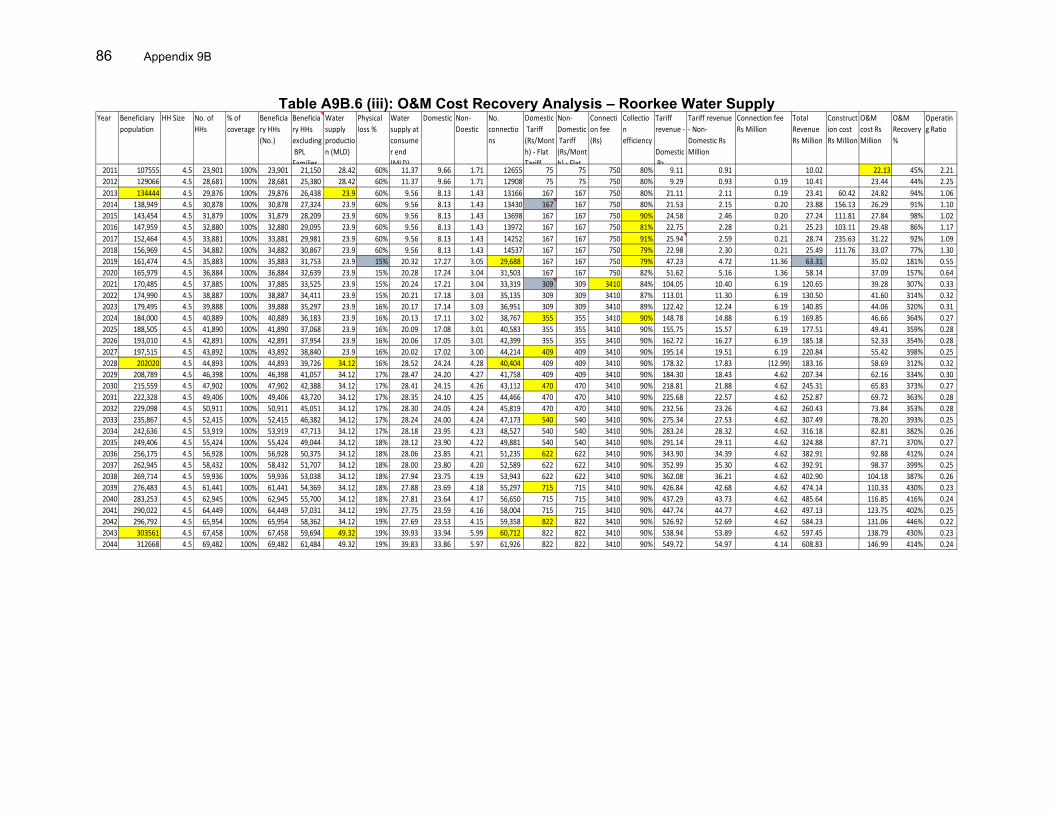
86 Appendix 9B
Table A9B.6 (iii): O&M Cost Recovery Analysis – Roorkee Water Supply
Year Beneficiary population
HH Size No. of HHs
% of coverage
Beneficiary HHs (No.)
Beneficiary HHs excluding BPL Families
Water supply production (MLD)
Physical loss %
Water supply at consumer end (MLD)
Domestic Non-Doestic
No. connections
Domestic Tariff (Rs/Month) - Flat Tariff
Non-Domestic Tariff (Rs/Month) - Flat
Connection fee (Rs)
Collection efficiency
Tariff revenue - Domestic Rs
Tariff revenue - Non-Domestic Rs Million
Connection fee Rs Million
Total Revenue Rs Million
Construction cost Rs Million
O&M cost Rs Million
O&M Recovery %
Operating Ratio
2011 107555 4.5 23,901 100% 23,901 21,150 28.42 60% 11.37 9.66 1.71 12655 75 75 750 80% 9.11 0.91 10.02 22.13 45% 2.21 2012 129066 4.5 28,681 100% 28,681 25,380 28.42 60% 11.37 9.66 1.71 12908 75 75 750 80% 9.29 0.93 0.19 10.41 23.44 44% 2.25 2013 134444 4.5 29,876 100% 29,876 26,438 23.9 60% 9.56 8.13 1.43 13166 167 167 750 80% 21.11 2.11 0.19 23.41 60.42 24.82 94% 1.06 2014 138,949 4.5 30,878 100% 30,878 27,324 23.9 60% 9.56 8.13 1.43 13430 167 167 750 80% 21.53 2.15 0.20 23.88 156.13 26.29 91% 1.10 2015 143,454 4.5 31,879 100% 31,879 28,209 23.9 60% 9.56 8.13 1.43 13698 167 167 750 90% 24.58 2.46 0.20 27.24 111.81 27.84 98% 1.02 2016 147,959 4.5 32,880 100% 32,880 29,095 23.9 60% 9.56 8.13 1.43 13972 167 167 750 81% 22.75 2.28 0.21 25.23 103.11 29.48 86% 1.17 2017 152,464 4.5 33,881 100% 33,881 29,981 23.9 60% 9.56 8.13 1.43 14252 167 167 750 91% 25.94 2.59 0.21 28.74 235.63 31.22 92% 1.09 2018 156,969 4.5 34,882 100% 34,882 30,867 23.9 60% 9.56 8.13 1.43 14537 167 167 750 79% 22.98 2.30 0.21 25.49 111.76 33.07 77% 1.30 2019 161,474 4.5 35,883 100% 35,883 31,753 23.9 15% 20.32 17.27 3.05 29,688 167 167 750 79% 47.23 4.72 11.36 63.31 35.02 181% 0.55 2020 165,979 4.5 36,884 100% 36,884 32,639 23.9 15% 20.28 17.24 3.04 31,503 167 167 750 82% 51.62 5.16 1.36 58.14 37.09 157% 0.64 2021 170,485 4.5 37,885 100% 37,885 33,525 23.9 15% 20.24 17.21 3.04 33,319 309 309 3410 84% 104.05 10.40 6.19 120.65 39.28 307% 0.33 2022 174,990 4.5 38,887 100% 38,887 34,411 23.9 15% 20.21 17.18 3.03 35,135 309 309 3410 87% 113.01 11.30 6.19 130.50 41.60 314% 0.32 2023 179,495 4.5 39,888 100% 39,888 35,297 23.9 16% 20.17 17.14 3.03 36,951 309 309 3410 89% 122.42 12.24 6.19 140.85 44.06 320% 0.31 2024 184,000 4.5 40,889 100% 40,889 36,183 23.9 16% 20.13 17.11 3.02 38,767 355 355 3410 90% 148.78 14.88 6.19 169.85 46.66 364% 0.27 2025 188,505 4.5 41,890 100% 41,890 37,068 23.9 16% 20.09 17.08 3.01 40,583 355 355 3410 90% 155.75 15.57 6.19 177.51 49.41 359% 0.28 2026 193,010 4.5 42,891 100% 42,891 37,954 23.9 16% 20.06 17.05 3.01 42,399 355 355 3410 90% 162.72 16.27 6.19 185.18 52.33 354% 0.28 2027 197,515 4.5 43,892 100% 43,892 38,840 23.9 16% 20.02 17.02 3.00 44,214 409 409 3410 90% 195.14 19.51 6.19 220.84 55.42 398% 0.25 2028 202020 4.5 44,893 100% 44,893 39,726 34.12 16% 28.52 24.24 4.28 40,404 409 409 3410 90% 178.32 17.83 (12.99) 183.16 58.69 312% 0.32 2029 208,789 4.5 46,398 100% 46,398 41,057 34.12 17% 28.47 24.20 4.27 41,758 409 409 3410 90% 184.30 18.43 4.62 207.34 62.16 334% 0.30 2030 215,559 4.5 47,902 100% 47,902 42,388 34.12 17% 28.41 24.15 4.26 43,112 470 470 3410 90% 218.81 21.88 4.62 245.31 65.83 373% 0.27 2031 222,328 4.5 49,406 100% 49,406 43,720 34.12 17% 28.35 24.10 4.25 44,466 470 470 3410 90% 225.68 22.57 4.62 252.87 69.72 363% 0.28 2032 229,098 4.5 50,911 100% 50,911 45,051 34.12 17% 28.30 24.05 4.24 45,819 470 470 3410 90% 232.56 23.26 4.62 260.43 73.84 353% 0.28 2033 235,867 4.5 52,415 100% 52,415 46,382 34.12 17% 28.24 24.00 4.24 47,173 540 540 3410 90% 275.34 27.53 4.62 307.49 78.20 393% 0.25 2034 242,636 4.5 53,919 100% 53,919 47,713 34.12 17% 28.18 23.95 4.23 48,527 540 540 3410 90% 283.24 28.32 4.62 316.18 82.81 382% 0.26 2035 249,406 4.5 55,424 100% 55,424 49,044 34.12 18% 28.12 23.90 4.22 49,881 540 540 3410 90% 291.14 29.11 4.62 324.88 87.71 370% 0.27 2036 256,175 4.5 56,928 100% 56,928 50,375 34.12 18% 28.06 23.85 4.21 51,235 622 622 3410 90% 343.90 34.39 4.62 382.91 92.88 412% 0.24 2037 262,945 4.5 58,432 100% 58,432 51,707 34.12 18% 28.00 23.80 4.20 52,589 622 622 3410 90% 352.99 35.30 4.62 392.91 98.37 399% 0.25 2038 269,714 4.5 59,936 100% 59,936 53,038 34.12 18% 27.94 23.75 4.19 53,943 622 622 3410 90% 362.08 36.21 4.62 402.90 104.18 387% 0.26 2039 276,483 4.5 61,441 100% 61,441 54,369 34.12 18% 27.88 23.69 4.18 55,297 715 715 3410 90% 426.84 42.68 4.62 474.14 110.33 430% 0.23 2040 283,253 4.5 62,945 100% 62,945 55,700 34.12 18% 27.81 23.64 4.17 56,650 715 715 3410 90% 437.29 43.73 4.62 485.64 116.85 416% 0.24 2041 290,022 4.5 64,449 100% 64,449 57,031 34.12 19% 27.75 23.59 4.16 58,004 715 715 3410 90% 447.74 44.77 4.62 497.13 123.75 402% 0.25 2042 296,792 4.5 65,954 100% 65,954 58,362 34.12 19% 27.69 23.53 4.15 59,358 822 822 3410 90% 526.92 52.69 4.62 584.23 131.06 446% 0.22 2043 303561 4.5 67,458 100% 67,458 59,694 49.32 19% 39.93 33.94 5.99 60,712 822 822 3410 90% 538.94 53.89 4.62 597.45 138.79 430% 0.23 2044 312668 4.5 69,482 100% 69,482 61,484 49.32 19% 39.83 33.86 5.97 61,926 822 822 3410 90% 549.72 54.97 4.14 608.83 146.99 414% 0.24
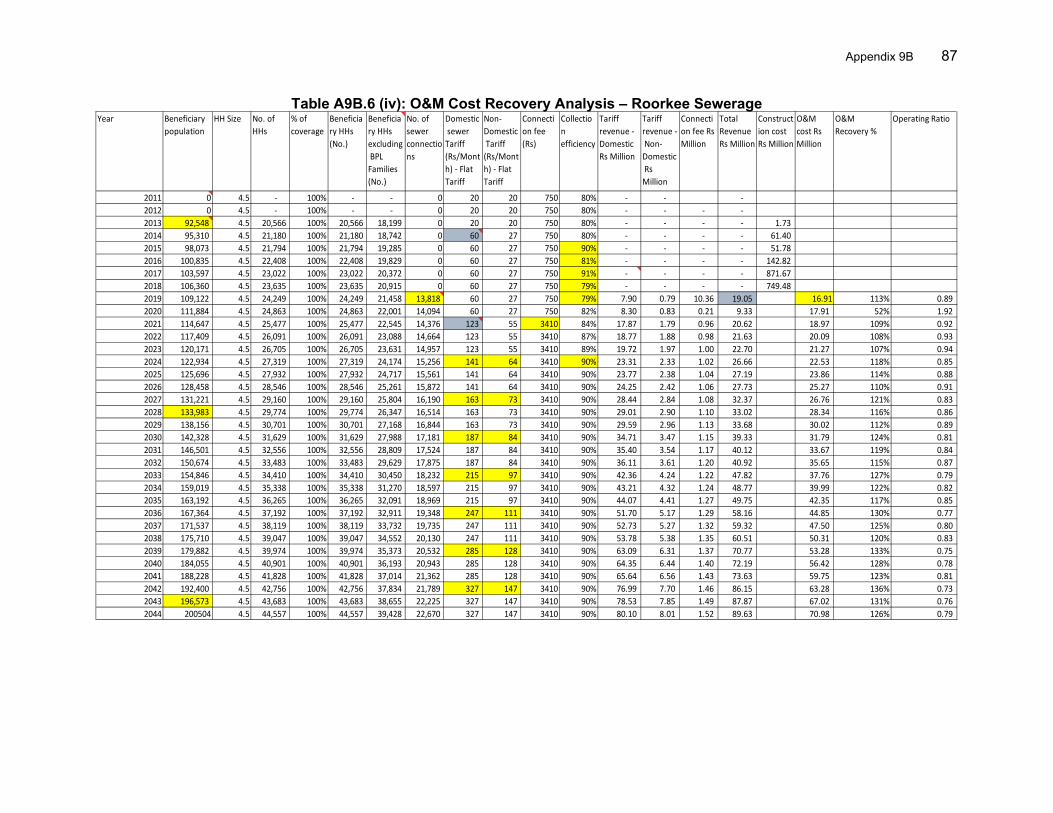
Appendix 9B 87
Table A9B.6 (iv): O&M Cost Recovery Analysis – Roorkee Sewerage
Year Beneficiary population
HH Size No. of HHs
% of coverage
Beneficiary HHs (No.)
Beneficiary HHs excluding BPL Families (No.)
No. of sewer connections
Domestic sewer Tariff (Rs/Month) - Flat Tariff
Non-Domestic Tariff (Rs/Month) - Flat Tariff
Connection fee (Rs)
Collection efficiency
Tariff revenue - Domestic Rs Million
Tariff revenue - Non-Domestic Rs Million
Connection fee Rs Million
Total Revenue Rs Million
Construction cost Rs Million
O&M cost Rs Million
O&M Recovery %
Operating Ratio
2011 0 4.5 - 100% - - 0 20 20 750 80% - - - 2012 0 4.5 - 100% - - 0 20 20 750 80% - - - - 2013 92,548 4.5 20,566 100% 20,566 18,199 0 20 20 750 80% - - - - 1.73 2014 95,310 4.5 21,180 100% 21,180 18,742 0 60 27 750 80% - - - - 61.40 2015 98,073 4.5 21,794 100% 21,794 19,285 0 60 27 750 90% - - - - 51.78 2016 100,835 4.5 22,408 100% 22,408 19,829 0 60 27 750 81% - - - - 142.82 2017 103,597 4.5 23,022 100% 23,022 20,372 0 60 27 750 91% - - - - 871.67 2018 106,360 4.5 23,635 100% 23,635 20,915 0 60 27 750 79% - - - - 749.48 2019 109,122 4.5 24,249 100% 24,249 21,458 13,818 60 27 750 79% 7.90 0.79 10.36 19.05 16.91 113% 0.89 2020 111,884 4.5 24,863 100% 24,863 22,001 14,094 60 27 750 82% 8.30 0.83 0.21 9.33 17.91 52% 1.92 2021 114,647 4.5 25,477 100% 25,477 22,545 14,376 123 55 3410 84% 17.87 1.79 0.96 20.62 18.97 109% 0.92 2022 117,409 4.5 26,091 100% 26,091 23,088 14,664 123 55 3410 87% 18.77 1.88 0.98 21.63 20.09 108% 0.93 2023 120,171 4.5 26,705 100% 26,705 23,631 14,957 123 55 3410 89% 19.72 1.97 1.00 22.70 21.27 107% 0.94 2024 122,934 4.5 27,319 100% 27,319 24,174 15,256 141 64 3410 90% 23.31 2.33 1.02 26.66 22.53 118% 0.85 2025 125,696 4.5 27,932 100% 27,932 24,717 15,561 141 64 3410 90% 23.77 2.38 1.04 27.19 23.86 114% 0.88 2026 128,458 4.5 28,546 100% 28,546 25,261 15,872 141 64 3410 90% 24.25 2.42 1.06 27.73 25.27 110% 0.91 2027 131,221 4.5 29,160 100% 29,160 25,804 16,190 163 73 3410 90% 28.44 2.84 1.08 32.37 26.76 121% 0.83 2028 133,983 4.5 29,774 100% 29,774 26,347 16,514 163 73 3410 90% 29.01 2.90 1.10 33.02 28.34 116% 0.86 2029 138,156 4.5 30,701 100% 30,701 27,168 16,844 163 73 3410 90% 29.59 2.96 1.13 33.68 30.02 112% 0.89 2030 142,328 4.5 31,629 100% 31,629 27,988 17,181 187 84 3410 90% 34.71 3.47 1.15 39.33 31.79 124% 0.81 2031 146,501 4.5 32,556 100% 32,556 28,809 17,524 187 84 3410 90% 35.40 3.54 1.17 40.12 33.67 119% 0.84 2032 150,674 4.5 33,483 100% 33,483 29,629 17,875 187 84 3410 90% 36.11 3.61 1.20 40.92 35.65 115% 0.87 2033 154,846 4.5 34,410 100% 34,410 30,450 18,232 215 97 3410 90% 42.36 4.24 1.22 47.82 37.76 127% 0.79 2034 159,019 4.5 35,338 100% 35,338 31,270 18,597 215 97 3410 90% 43.21 4.32 1.24 48.77 39.99 122% 0.82 2035 163,192 4.5 36,265 100% 36,265 32,091 18,969 215 97 3410 90% 44.07 4.41 1.27 49.75 42.35 117% 0.85 2036 167,364 4.5 37,192 100% 37,192 32,911 19,348 247 111 3410 90% 51.70 5.17 1.29 58.16 44.85 130% 0.77 2037 171,537 4.5 38,119 100% 38,119 33,732 19,735 247 111 3410 90% 52.73 5.27 1.32 59.32 47.50 125% 0.80 2038 175,710 4.5 39,047 100% 39,047 34,552 20,130 247 111 3410 90% 53.78 5.38 1.35 60.51 50.31 120% 0.83 2039 179,882 4.5 39,974 100% 39,974 35,373 20,532 285 128 3410 90% 63.09 6.31 1.37 70.77 53.28 133% 0.75 2040 184,055 4.5 40,901 100% 40,901 36,193 20,943 285 128 3410 90% 64.35 6.44 1.40 72.19 56.42 128% 0.78 2041 188,228 4.5 41,828 100% 41,828 37,014 21,362 285 128 3410 90% 65.64 6.56 1.43 73.63 59.75 123% 0.81 2042 192,400 4.5 42,756 100% 42,756 37,834 21,789 327 147 3410 90% 76.99 7.70 1.46 86.15 63.28 136% 0.73 2043 196,573 4.5 43,683 100% 43,683 38,655 22,225 327 147 3410 90% 78.53 7.85 1.49 87.87 67.02 131% 0.76 2044 200504 4.5 44,557 100% 44,557 39,428 22,670 327 147 3410 90% 80.10 8.01 1.52 89.63 70.98 126% 0.79
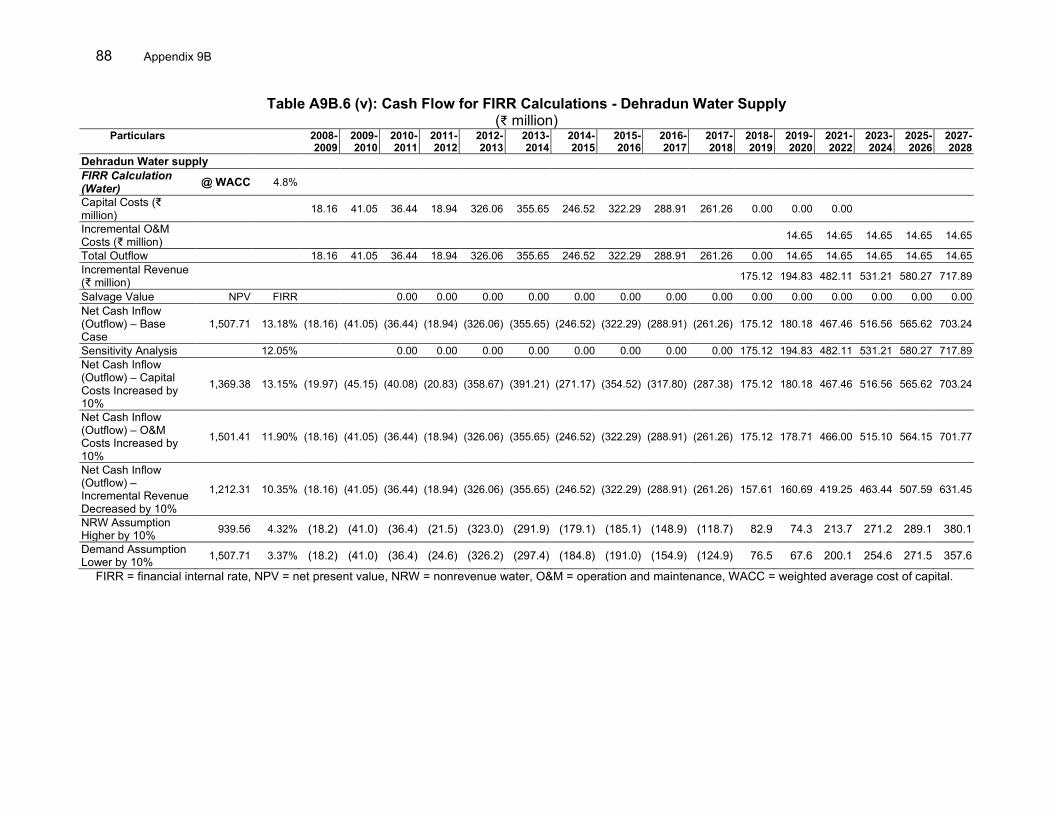
88 Appendix 9B
Table A9B.6 (v): Cash Flow for FIRR Calculations - Dehradun Water Supply (₹ million)
Particulars
2008-
2009 2009-2010
2010-2011
2011-2012
2012-2013
2013-2014
2014-2015
2015-2016
2016-2017
2017-2018
2018-2019
2019-2020
2021-2022
2023-2024
2025-2026
2027-2028
Dehradun Water supply FIRR Calculation (Water) @ WACC 4.8%
Capital Costs (₹ million)
18.16 41.05 36.44 18.94 326.06 355.65 246.52 322.29 288.91 261.26 0.00 0.00 0.00
Incremental O&M Costs (₹ million)
14.65 14.65 14.65 14.65 14.65
Total Outflow 18.16 41.05 36.44 18.94 326.06 355.65 246.52 322.29 288.91 261.26 0.00 14.65 14.65 14.65 14.65 14.65 Incremental Revenue (₹ million)
175.12 194.83 482.11 531.21 580.27 717.89
Salvage Value NPV FIRR 0.00 0.00 0.00 0.00 0.00 0.00 0.00 0.00 0.00 0.00 0.00 0.00 0.00 0.00 Net Cash Inflow (Outflow) – Base Case
1,507.71 13.18% (18.16) (41.05) (36.44) (18.94) (326.06) (355.65) (246.52) (322.29) (288.91) (261.26) 175.12 180.18 467.46 516.56 565.62 703.24
Sensitivity Analysis 12.05% 0.00 0.00 0.00 0.00 0.00 0.00 0.00 0.00 175.12 194.83 482.11 531.21 580.27 717.89 Net Cash Inflow (Outflow) – Capital Costs Increased by 10%
1,369.38 13.15% (19.97) (45.15) (40.08) (20.83) (358.67) (391.21) (271.17) (354.52) (317.80) (287.38) 175.12 180.18 467.46 516.56 565.62 703.24
Net Cash Inflow (Outflow) – O&M Costs Increased by 10%
1,501.41 11.90% (18.16) (41.05) (36.44) (18.94) (326.06) (355.65) (246.52) (322.29) (288.91) (261.26) 175.12 178.71 466.00 515.10 564.15 701.77
Net Cash Inflow (Outflow) – Incremental Revenue Decreased by 10%
1,212.31 10.35% (18.16) (41.05) (36.44) (18.94) (326.06) (355.65) (246.52) (322.29) (288.91) (261.26) 157.61 160.69 419.25 463.44 507.59 631.45
NRW Assumption Higher by 10% 939.56 4.32% (18.2) (41.0) (36.4) (21.5) (323.0) (291.9) (179.1) (185.1) (148.9) (118.7) 82.9 74.3 213.7 271.2 289.1 380.1
Demand Assumption Lower by 10% 1,507.71 3.37% (18.2) (41.0) (36.4) (24.6) (326.2) (297.4) (184.8) (191.0) (154.9) (124.9) 76.5 67.6 200.1 254.6 271.5 357.6
FIRR = financial internal rate, NPV = net present value, NRW = nonrevenue water, O&M = operation and maintenance, WACC = weighted average cost of capital.
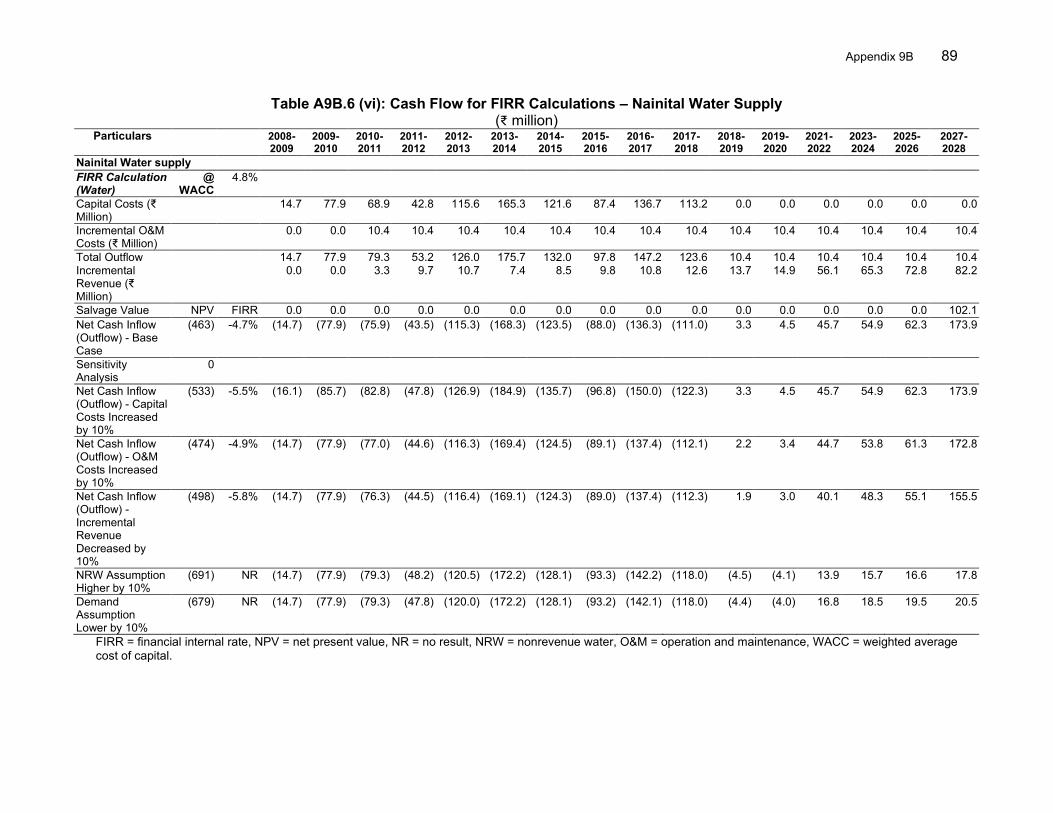
Appendix 9B 89
Table A9B.6 (vi): Cash Flow for FIRR Calculations – Nainital Water Supply (₹ million)
Particulars
2008-2009
2009-2010
2010-2011
2011-2012
2012-2013
2013-2014
2014-2015
2015-2016
2016-2017
2017-2018
2018-2019
2019-2020
2021-2022
2023-2024
2025-2026
2027-2028
Nainital Water supply FIRR Calculation (Water)
@ WACC
4.8%
Capital Costs (₹ Million)
14.7 77.9 68.9 42.8 115.6 165.3 121.6 87.4 136.7 113.2 0.0 0.0 0.0 0.0 0.0 0.0
Incremental O&M Costs (₹ Million)
0.0 0.0 10.4 10.4 10.4 10.4 10.4 10.4 10.4 10.4 10.4 10.4 10.4 10.4 10.4 10.4
Total Outflow
14.7 77.9 79.3 53.2 126.0 175.7 132.0 97.8 147.2 123.6 10.4 10.4 10.4 10.4 10.4 10.4 Incremental Revenue (₹ Million)
0.0 0.0 3.3 9.7 10.7 7.4 8.5 9.8 10.8 12.6 13.7 14.9 56.1 65.3 72.8 82.2
Salvage Value NPV FIRR 0.0 0.0 0.0 0.0 0.0 0.0 0.0 0.0 0.0 0.0 0.0 0.0 0.0 0.0 0.0 102.1 Net Cash Inflow (Outflow) - Base Case
(463) -4.7% (14.7) (77.9) (75.9) (43.5) (115.3) (168.3) (123.5) (88.0) (136.3) (111.0) 3.3 4.5 45.7 54.9 62.3 173.9
Sensitivity Analysis
0
Net Cash Inflow (Outflow) - Capital Costs Increased by 10%
(533) -5.5% (16.1) (85.7) (82.8) (47.8) (126.9) (184.9) (135.7) (96.8) (150.0) (122.3) 3.3 4.5 45.7 54.9 62.3 173.9
Net Cash Inflow (Outflow) - O&M Costs Increased by 10%
(474) -4.9% (14.7) (77.9) (77.0) (44.6) (116.3) (169.4) (124.5) (89.1) (137.4) (112.1) 2.2 3.4 44.7 53.8 61.3 172.8
Net Cash Inflow (Outflow) - Incremental Revenue Decreased by 10%
(498) -5.8% (14.7) (77.9) (76.3) (44.5) (116.4) (169.1) (124.3) (89.0) (137.4) (112.3) 1.9 3.0 40.1 48.3 55.1 155.5
NRW Assumption Higher by 10%
(691) NR (14.7) (77.9) (79.3) (48.2) (120.5) (172.2) (128.1) (93.3) (142.2) (118.0) (4.5) (4.1) 13.9 15.7 16.6 17.8
Demand Assumption Lower by 10%
(679) NR (14.7) (77.9) (79.3) (47.8) (120.0) (172.2) (128.1) (93.2) (142.1) (118.0) (4.4) (4.0) 16.8 18.5 19.5 20.5
FIRR = financial internal rate, NPV = net present value, NR = no result, NRW = nonrevenue water, O&M = operation and maintenance, WACC = weighted average cost of capital.
90 Appendix 10
GENDER ACTION PLAN IMPLEMENTATION AND ACHIEVEMENTS
A. Introduction 1. Project 2 of the UUSDIP MFF approved in 2011, aimed to improve the (i) water supply infrastructure and services to government’s service standards in five project towns (Dehradun, Haldwani, Nainital, Ramnagar and Roorkee); (ii) sewerage infrastructure in Roorkee and sewerage design in Ramnagar; (iii) performance of water supply operations and maintenance in Nainital; and (iv) subproject management capacity and transparency of investment project management unit (IPMU) and the investment project implementation units (IPIUs). 2. The project was categorized effective gender mainstreaming (EGM). 1 Mainstreamed across all project components were community and gender specific elements, including identifying below poverty line (BPL) and female-headed households (FHHs) for targeting in the provision of subsidized connections and water fee rates;2 preparing and implementing a pro-vulnerability schedule of tariffs for water supply and sewerage; provision of subsidized or concessionary individual water connections, water meters, and sewerage connections to BPL and FHHs in project towns; training of poor women on operations and maintenance (O&M) of water supply and sewerage services; and employment of women in O&M of water supply and in expert and junior/support positions in project management and implementation. B. Gender Issues 3. The key social and gender issues, identified through the socioeconomic survey during the project preparatory phase, were the following:3
(i) Exacerbation of women’s work burdens and insecurity due to deficiencies in basic water and sanitation services. Only 80% of those living in the five urban towns of Uttarakhand had access to piped water supply and that too was limited to only 2-4 hours per day with an average per capita rate of 70 liters per day. Similarly, only 50% of households had sewerage connections. A total of 32% of BPL households used unsanitary pit toilets or open areas for their sanitation requirements. These deficiencies in basic urban services increased women’s time and burdens in fetching water, disposing wastes, and looking after the family’s hygiene needs, thus severely limiting their time and ability to engage in income-generating activities. These also resulted in poor health conditions of family members, adding more burden to women who are the primary caregivers.
(ii) Safety risks associated with absence of sanitation facilities within household premises. Inadequate toilet facilities forced household members to resort to open defecation, which exposed them to indignity and increased the risk of sexual harassment and assault, especially of women and girls.
(iii) Low female labor force participation rate and high wage gap. Only 10% of urban women in Uttarakhand were part of the labor force, compared to 55% of men. Urban women’s share of non-agricultural wage employment was only 15%, lower than the all-India figure of 18%. Women were constrained from wage employment due to their household burdens and low literacy rate, registering at
1 ADB. 2009. Project Classification System. Manila; ADB. 2012. Guidelines for Gender Mainstreaming categories of
ADB Projects. Manila. 2 DMF mentions women headed households. 3 ADB. 2011. Periodic Financing Request Report for the Proposed Loan to the Government of India for the Uttarakhand
Urban Sector Development Project, Summary of Poverty Reduction and Social Strategy (accessible from the list of linked documents in Appendix 6). Manila.
Appendix 10 91
65% for the State. Gender bias was also significant in the wage gaps between men and women. Casual women workers in the urban areas earned only 72% of what casual men workers earned. Similarly, women regular wage employees in the urban areas earned only 61% of the earning of their men counterparts. This wage bias stems from the cultural perception that women were mere secondary earners. In addition, many women were unaware of minimum wage standards and laws against discrimination in employment and wages.4
(iv) Low participation in decision-making on household and community matters. The National Family Health Survey III found that only 36% of married women in Uttarakhand were involved in decision-making at the household level, comparable to the equally low national figure of 37%. Women had limited control or say on issues relating to major household purchases and even their own health care.5
C. Project Gender Features 4. The project gender inclusive design features aimed to maximize project benefits for women. The gender action plan (GAP), which supported the achievement of the gender-related targets in the project DMF, was designed to ensure that women had equal opportunity to participate in and benefit from the project activities. More specifically, the key elements of the GAP were the following:
(i) providing households in the five project towns, including vulnerable households, with access to water supply and sanitation services – vulnerable households;
(ii) given concessionary rates for water supply and sewerage connections and services with concessionary rates;6
(iii) providing women in particular, and the communities in general with information and knowledge about the project and on gender issues in water supply, health, and sanitation through awareness-raising seminars;
(iv) training poor women in livelihood activities, e.g., training in the O&M of water supply and sewerage;
(v) providing employment opportunities for women in the construction and O&M of water supply and sanitation facilities;
(vi) employing women in expert positions and in junior or support positions in project management and implementation;
(vii) developing training modules and conducting training on gender sensitive project management and implementation (including gender-responsive and social-inclusive governance and O&M management) for project staff and elected representatives;
(viii) enhancing the capacity of project staff including women staff in ADB policies and procedures; and
(ix) ensuring the participation of all (eligible) women project staff in all other capacity building events organized under the project.
4 Government of India, Labor force participation rate: NSS Report No. 531: Employment and Unemployment Situation
in India: July 2007-June2008, Delhi. Access through: http://mospi.nic.in/mospi_new/admin/Login.aspx. 5 Government of India, Ministry of Health and Family Welfare. 2005-2006. National Family Health Survey (NFHS-3).
Delhi. 6 For this project, the term vulnerable households (HH) is defined as those fulfilling one or more of the following criteria:
(i) HH belongs to most backward communities; (ii) head of HH is a woman; (iii) head of HH is illiterate; (iv) head of HH is working as a daily wage laborer; (v) HH with income below poverty line; and (vi) HH residing in a kutcha house.
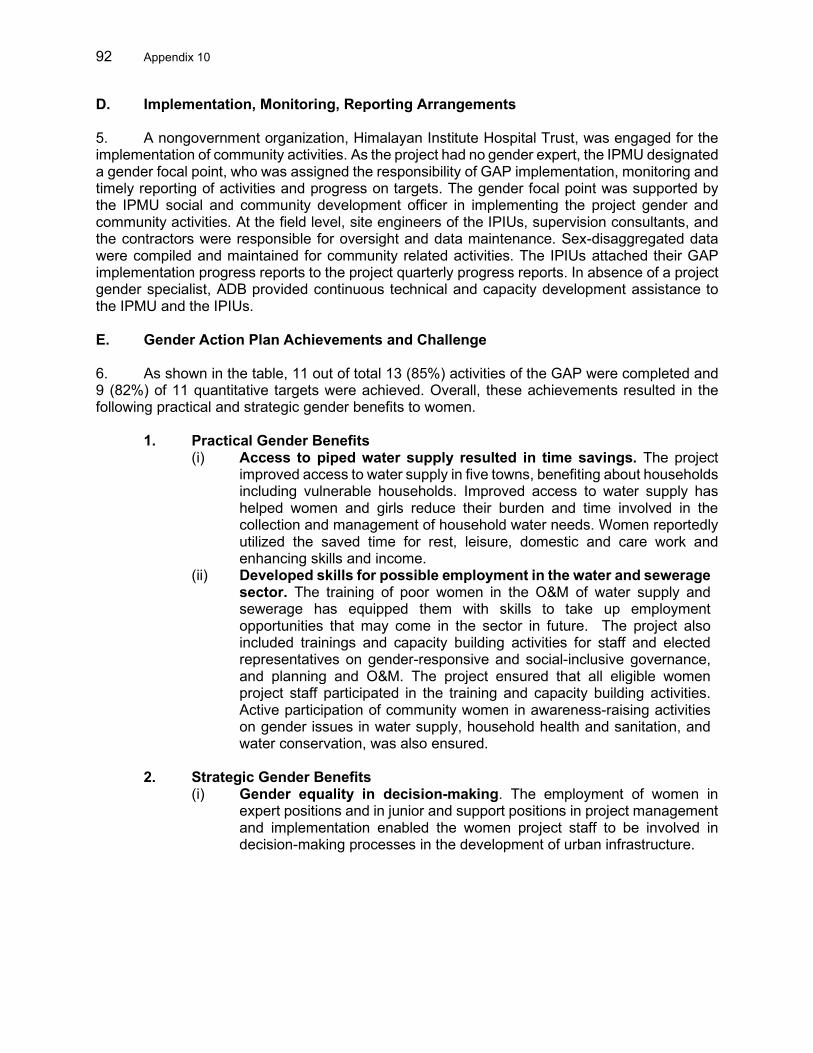
92 Appendix 10
D. Implementation, Monitoring, Reporting Arrangements 5. A nongovernment organization, Himalayan Institute Hospital Trust, was engaged for the implementation of community activities. As the project had no gender expert, the IPMU designated a gender focal point, who was assigned the responsibility of GAP implementation, monitoring and timely reporting of activities and progress on targets. The gender focal point was supported by the IPMU social and community development officer in implementing the project gender and community activities. At the field level, site engineers of the IPIUs, supervision consultants, and the contractors were responsible for oversight and data maintenance. Sex-disaggregated data were compiled and maintained for community related activities. The IPIUs attached their GAP implementation progress reports to the project quarterly progress reports. In absence of a project gender specialist, ADB provided continuous technical and capacity development assistance to the IPMU and the IPIUs. E. Gender Action Plan Achievements and Challenge 6. As shown in the table, 11 out of total 13 (85%) activities of the GAP were completed and 9 (82%) of 11 quantitative targets were achieved. Overall, these achievements resulted in the following practical and strategic gender benefits to women.
1. Practical Gender Benefits (i) Access to piped water supply resulted in time savings. The project
improved access to water supply in five towns, benefiting about households including vulnerable households. Improved access to water supply has helped women and girls reduce their burden and time involved in the collection and management of household water needs. Women reportedly utilized the saved time for rest, leisure, domestic and care work and enhancing skills and income.
(ii) Developed skills for possible employment in the water and sewerage sector. The training of poor women in the O&M of water supply and sewerage has equipped them with skills to take up employment opportunities that may come in the sector in future. The project also included trainings and capacity building activities for staff and elected representatives on gender-responsive and social-inclusive governance, and planning and O&M. The project ensured that all eligible women project staff participated in the training and capacity building activities. Active participation of community women in awareness-raising activities on gender issues in water supply, household health and sanitation, and water conservation, was also ensured.
2. Strategic Gender Benefits
(i) Gender equality in decision-making. The employment of women in expert positions and in junior and support positions in project management and implementation enabled the women project staff to be involved in decision-making processes in the development of urban infrastructure.
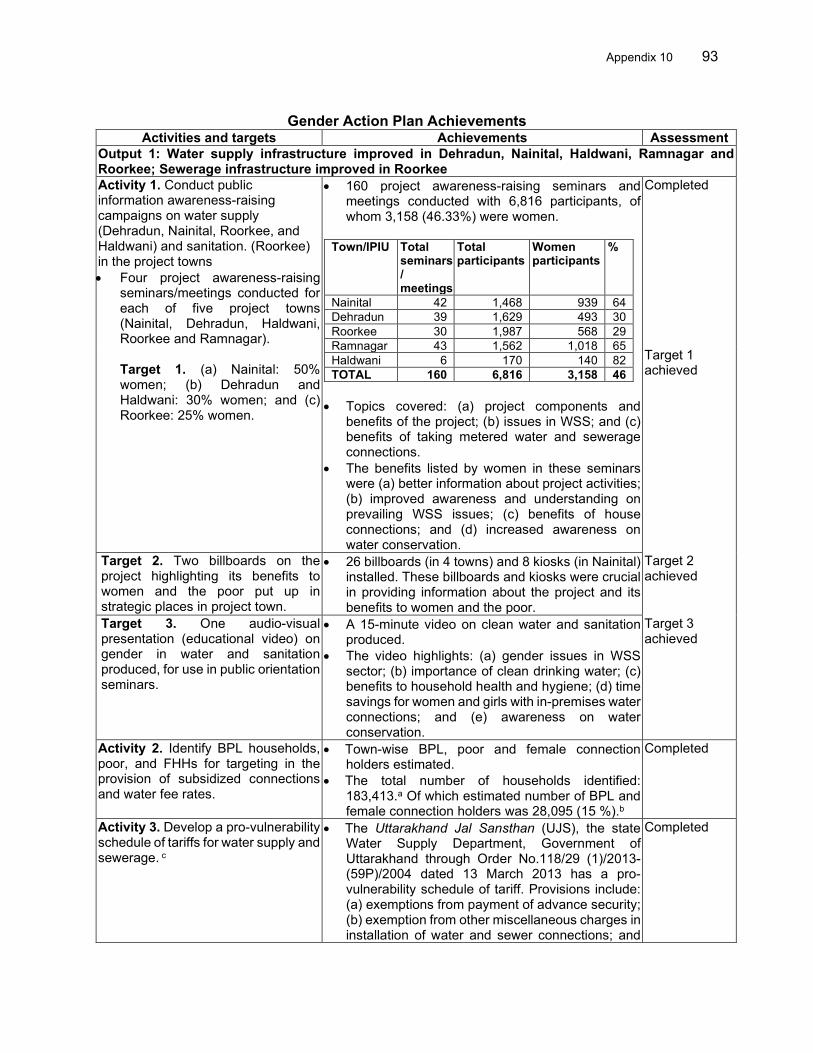
Appendix 10 93
Gender Action Plan Achievements
Activities and targets Achievements Assessment Output 1: Water supply infrastructure improved in Dehradun, Nainital, Haldwani, Ramnagar and Roorkee; Sewerage infrastructure improved in Roorkee Activity 1. Conduct public information awareness-raising campaigns on water supply (Dehradun, Nainital, Roorkee, and Haldwani) and sanitation. (Roorkee) in the project towns • Four project awareness-raising
seminars/meetings conducted for each of five project towns (Nainital, Dehradun, Haldwani, Roorkee and Ramnagar). Target 1. (a) Nainital: 50% women; (b) Dehradun and Haldwani: 30% women; and (c) Roorkee: 25% women.
• 160 project awareness-raising seminars and meetings conducted with 6,816 participants, of whom 3,158 (46.33%) were women.
Town/IPIU Total seminars/ meetings
Total participants
Women participants
%
Nainital 42 1,468 939 64 Dehradun 39 1,629 493 30 Roorkee 30 1,987 568 29 Ramnagar 43 1,562 1,018 65 Haldwani 6 170 140 82 TOTAL 160 6,816 3,158 46
• Topics covered: (a) project components and
benefits of the project; (b) issues in WSS; and (c) benefits of taking metered water and sewerage connections.
• The benefits listed by women in these seminars were (a) better information about project activities; (b) improved awareness and understanding on prevailing WSS issues; (c) benefits of house connections; and (d) increased awareness on water conservation.
Completed
Target 1 achieved
Target 2. Two billboards on the project highlighting its benefits to women and the poor put up in strategic places in project town.
• 26 billboards (in 4 towns) and 8 kiosks (in Nainital) installed. These billboards and kiosks were crucial in providing information about the project and its benefits to women and the poor.
Target 2 achieved
Target 3. One audio-visual presentation (educational video) on gender in water and sanitation produced, for use in public orientation seminars.
• A 15-minute video on clean water and sanitation produced.
• The video highlights: (a) gender issues in WSS sector; (b) importance of clean drinking water; (c) benefits to household health and hygiene; (d) time savings for women and girls with in-premises water connections; and (e) awareness on water conservation.
Target 3 achieved
Activity 2. Identify BPL households, poor, and FHHs for targeting in the provision of subsidized connections and water fee rates.
• Town-wise BPL, poor and female connection holders estimated.
• The total number of households identified: 183,413.a Of which estimated number of BPL and female connection holders was 28,095 (15 %).b
Completed
Activity 3. Develop a pro-vulnerability schedule of tariffs for water supply and sewerage. c
• The Uttarakhand Jal Sansthan (UJS), the state Water Supply Department, Government of Uttarakhand through Order No.118/29 (1)/2013-(59P)/2004 dated 13 March 2013 has a pro-vulnerability schedule of tariff. Provisions include: (a) exemptions from payment of advance security; (b) exemption from other miscellaneous charges in installation of water and sewer connections; and
Completed
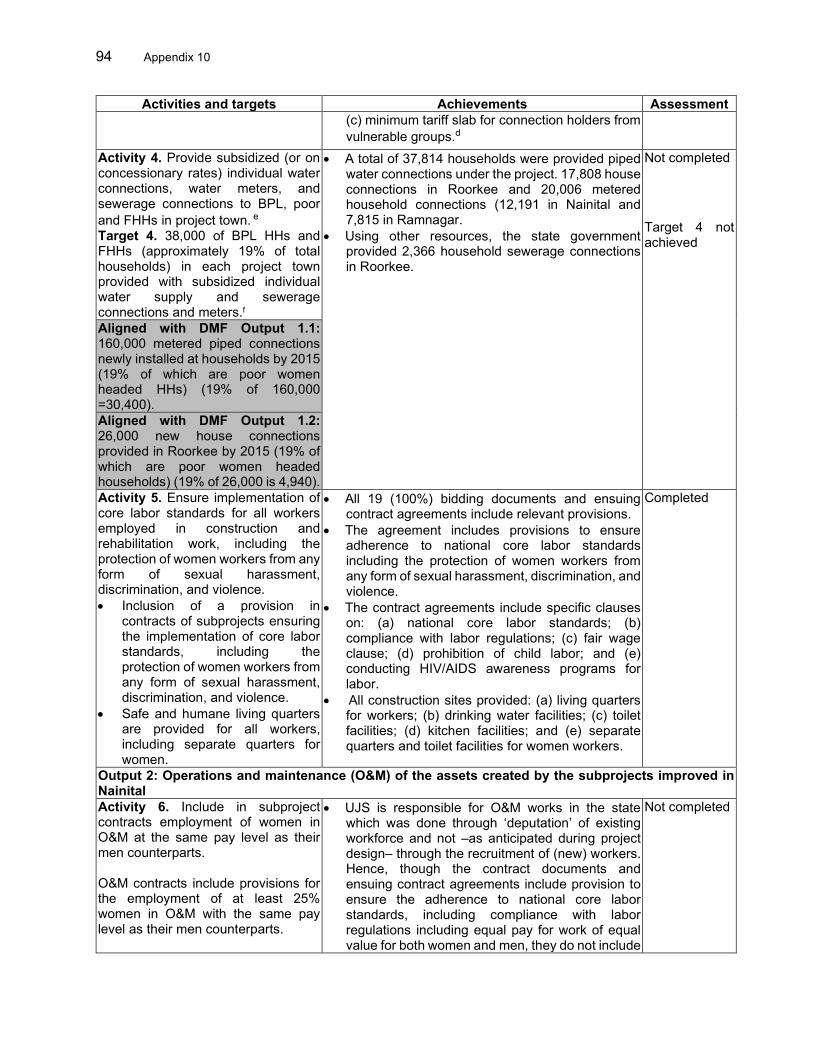
94 Appendix 10
Activities and targets Achievements Assessment (c) minimum tariff slab for connection holders from vulnerable groups.d
Activity 4. Provide subsidized (or on concessionary rates) individual water connections, water meters, and sewerage connections to BPL, poor and FHHs in project town. e Target 4. 38,000 of BPL HHs and FHHs (approximately 19% of total households) in each project town provided with subsidized individual water supply and sewerage connections and meters.f
• A total of 37,814 households were provided piped water connections under the project. 17,808 house connections in Roorkee and 20,006 metered household connections (12,191 in Nainital and 7,815 in Ramnagar.
• Using other resources, the state government provided 2,366 household sewerage connections in Roorkee.
Not completed
Target 4 not achieved
Aligned with DMF Output 1.1: 160,000 metered piped connections newly installed at households by 2015 (19% of which are poor women headed HHs) (19% of 160,000 =30,400). Aligned with DMF Output 1.2: 26,000 new house connections provided in Roorkee by 2015 (19% of which are poor women headed households) (19% of 26,000 is 4,940). Activity 5. Ensure implementation of core labor standards for all workers employed in construction and rehabilitation work, including the protection of women workers from any form of sexual harassment, discrimination, and violence. • Inclusion of a provision in
contracts of subprojects ensuring the implementation of core labor standards, including the protection of women workers from any form of sexual harassment, discrimination, and violence.
• Safe and humane living quarters are provided for all workers, including separate quarters for women.
• All 19 (100%) bidding documents and ensuing contract agreements include relevant provisions.
• The agreement includes provisions to ensure adherence to national core labor standards including the protection of women workers from any form of sexual harassment, discrimination, and violence.
• The contract agreements include specific clauses on: (a) national core labor standards; (b) compliance with labor regulations; (c) fair wage clause; (d) prohibition of child labor; and (e) conducting HIV/AIDS awareness programs for labor.
• All construction sites provided: (a) living quarters for workers; (b) drinking water facilities; (c) toilet facilities; (d) kitchen facilities; and (e) separate quarters and toilet facilities for women workers.
Completed
Output 2: Operations and maintenance (O&M) of the assets created by the subprojects improved in Nainital Activity 6. Include in subproject contracts employment of women in O&M at the same pay level as their men counterparts. O&M contracts include provisions for the employment of at least 25% women in O&M with the same pay level as their men counterparts.
• UJS is responsible for O&M works in the state which was done through ‘deputation’ of existing workforce and not –as anticipated during project design– through the recruitment of (new) workers. Hence, though the contract documents and ensuing contract agreements include provision to ensure the adherence to national core labor standards, including compliance with labor regulations including equal pay for work of equal value for both women and men, they do not include
Not completed
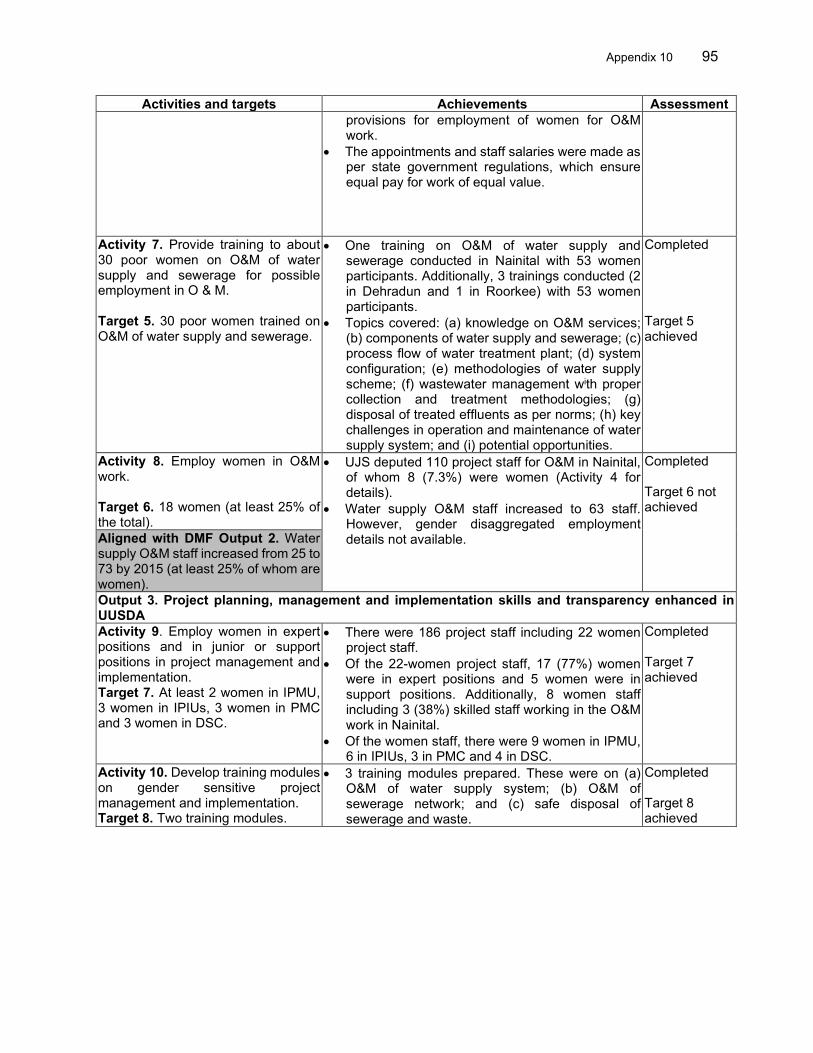
Appendix 10 95
Activities and targets Achievements Assessment provisions for employment of women for O&M work.
• The appointments and staff salaries were made as per state government regulations, which ensure equal pay for work of equal value.
Activity 7. Provide training to about 30 poor women on O&M of water supply and sewerage for possible employment in O & M.
Target 5. 30 poor women trained on O&M of water supply and sewerage.
• One training on O&M of water supply and sewerage conducted in Nainital with 53 women participants. Additionally, 3 trainings conducted (2 in Dehradun and 1 in Roorkee) with 53 women participants.
• Topics covered: (a) knowledge on O&M services; (b) components of water supply and sewerage; (c) process flow of water treatment plant; (d) system configuration; (e) methodologies of water supply scheme; (f) wastewater management with proper collection and treatment methodologies; (g) disposal of treated effluents as per norms; (h) key challenges in operation and maintenance of water supply system; and (i) potential opportunities.
Completed Target 5 achieved
Activity 8. Employ women in O&M work. Target 6. 18 women (at least 25% of the total).
• UJS deputed 110 project staff for O&M in Nainital, of whom 8 (7.3%) were women (Activity 4 for details).
• Water supply O&M staff increased to 63 staff. However, gender disaggregated employment details not available.
Completed Target 6 not achieved
Aligned with DMF Output 2. Water supply O&M staff increased from 25 to 73 by 2015 (at least 25% of whom are women). Output 3. Project planning, management and implementation skills and transparency enhanced in UUSDA Activity 9. Employ women in expert positions and in junior or support positions in project management and implementation. Target 7. At least 2 women in IPMU, 3 women in IPIUs, 3 women in PMC and 3 women in DSC.
• There were 186 project staff including 22 women project staff.
• Of the 22-women project staff, 17 (77%) women were in expert positions and 5 women were in support positions. Additionally, 8 women staff including 3 (38%) skilled staff working in the O&M work in Nainital.
• Of the women staff, there were 9 women in IPMU, 6 in IPIUs, 3 in PMC and 4 in DSC.
Completed Target 7 achieved
Activity 10. Develop training modules on gender sensitive project management and implementation. Target 8. Two training modules.
• 3 training modules prepared. These were on (a) O&M of water supply system; (b) O&M of sewerage network; and (c) safe disposal of sewerage and waste.
Completed Target 8 achieved
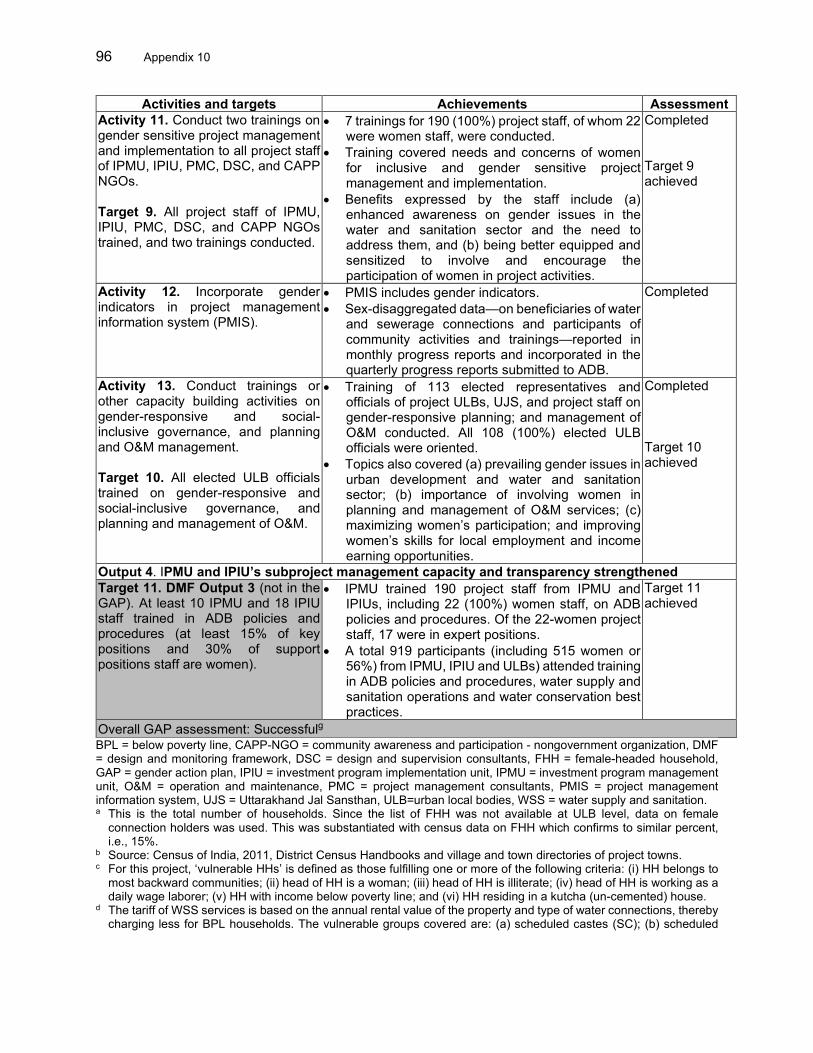
96 Appendix 10
Activities and targets Achievements Assessment Activity 11. Conduct two trainings on gender sensitive project management and implementation to all project staff of IPMU, IPIU, PMC, DSC, and CAPP NGOs. Target 9. All project staff of IPMU, IPIU, PMC, DSC, and CAPP NGOs trained, and two trainings conducted.
• 7 trainings for 190 (100%) project staff, of whom 22 were women staff, were conducted.
• Training covered needs and concerns of women for inclusive and gender sensitive project management and implementation.
• Benefits expressed by the staff include (a) enhanced awareness on gender issues in the water and sanitation sector and the need to address them, and (b) being better equipped and sensitized to involve and encourage the participation of women in project activities.
Completed Target 9 achieved
Activity 12. Incorporate gender indicators in project management information system (PMIS).
• PMIS includes gender indicators. • Sex-disaggregated data—on beneficiaries of water
and sewerage connections and participants of community activities and trainings—reported in monthly progress reports and incorporated in the quarterly progress reports submitted to ADB.
Completed
Activity 13. Conduct trainings or other capacity building activities on gender-responsive and social-inclusive governance, and planning and O&M management. Target 10. All elected ULB officials trained on gender-responsive and social-inclusive governance, and planning and management of O&M.
• Training of 113 elected representatives and officials of project ULBs, UJS, and project staff on gender-responsive planning; and management of O&M conducted. All 108 (100%) elected ULB officials were oriented.
• Topics also covered (a) prevailing gender issues in urban development and water and sanitation sector; (b) importance of involving women in planning and management of O&M services; (c) maximizing women’s participation; and improving women’s skills for local employment and income earning opportunities.
Completed Target 10 achieved
Output 4. IPMU and IPIU’s subproject management capacity and transparency strengthened Target 11. DMF Output 3 (not in the GAP). At least 10 IPMU and 18 IPIU staff trained in ADB policies and procedures (at least 15% of key positions and 30% of support positions staff are women).
• IPMU trained 190 project staff from IPMU and IPIUs, including 22 (100%) women staff, on ADB policies and procedures. Of the 22-women project staff, 17 were in expert positions.
• A total 919 participants (including 515 women or 56%) from IPMU, IPIU and ULBs) attended training in ADB policies and procedures, water supply and sanitation operations and water conservation best practices.
Target 11 achieved
Overall GAP assessment: Successfulg BPL = below poverty line, CAPP-NGO = community awareness and participation - nongovernment organization, DMF = design and monitoring framework, DSC = design and supervision consultants, FHH = female-headed household, GAP = gender action plan, IPIU = investment program implementation unit, IPMU = investment program management unit, O&M = operation and maintenance, PMC = project management consultants, PMIS = project management information system, UJS = Uttarakhand Jal Sansthan, ULB=urban local bodies, WSS = water supply and sanitation. a This is the total number of households. Since the list of FHH was not available at ULB level, data on female
connection holders was used. This was substantiated with census data on FHH which confirms to similar percent, i.e., 15%.
b Source: Census of India, 2011, District Census Handbooks and village and town directories of project towns. c For this project, ‘vulnerable HHs’ is defined as those fulfilling one or more of the following criteria: (i) HH belongs to
most backward communities; (ii) head of HH is a woman; (iii) head of HH is illiterate; (iv) head of HH is working as a daily wage laborer; (v) HH with income below poverty line; and (vi) HH residing in a kutcha (un-cemented) house.
d The tariff of WSS services is based on the annual rental value of the property and type of water connections, thereby charging less for BPL households. The vulnerable groups covered are: (a) scheduled castes (SC); (b) scheduled
Appendix 10 97
tribes (ST); (c) Nirashrit (destitute); (d) landless labors; (e) widow of army personnel; (f) BPL households; and (g) employees/staff of UJS. War widow also avail concessions under the tariff.
e DMF indicators Output 1.1 and Output 1.2 are merged and counted as one quantitative indicator or target in the GAP. f This assessment follows the DMF target and considers the GAP target of 38,000 in each project as a typographical. g 11/13 (85 %) activities were completed, and 9/11 (82%) quantitative targets achieved. F. Lessons Learned 7. The following factors contributed to the effective delivery of GAP activities and the achievement of gender equality results.
(i) Capacity development. The IPMU took steps to ensure that: (a) female participation in training programs was encouraged; (b) training data were sex-disaggregated; (c) gender-responsive elements were included in training modules; and (d) specific trainings were planned and conducted for all elected representatives and officials of project ULBs and project staff of IPMU and IPIUs on gender-responsive planning and management of O&M.
(ii) Gender sensitive training and learning material. The project developed gender sensitive learning and training material for project management and implementation. These approaches helped in strengthening the gender concerns and strategies for mainstreaming in the WSS sector; and will be beneficial beyond completion of the project.
G. Conclusion and Recommendations 8. Overall, the implementation of GAP activities benefited the communities in project towns, especially the vulnerable households. Participation of community women in awareness campaigns on water and sanitation issues has improved knowledge and understanding of prevailing issues in the sector, benefits of household water connections, and water conservation. The enhanced capacities of government agencies and elected representatives in designing and managing gender-responsive and socially inclusive urban infrastructure, including operations and maintenance of water supply and sanitation services, can serve to expand and sustain an inclusive urban infrastructure in the state. The employment of women in expert and junior or support positions was ensured during project implementation and facilitated the inclusion of gender concerns in project activities. This good practice can be encouraged and replicated to motivate inclusion of gender considerations in project management and implementation. The successes must be documented and shared for purposes of replication and promotion of gender equality and women’s empowerment approaches in the development and maintenance of urban infrastructure including water and sanitation services. 9. Recommendations for future projects based on the lessons learnt include:
(i) Establishing a realistic target and baseline. The infrastructure utilities do not collect and maintain sex-disaggregated data on their customers. Hence the data on number of beneficiary female-headed and vulnerable households is difficult to calculate. Such targets (if included) should be based on a realistic baseline and can be assessed if the project conducts a base line followed by an end line survey to document results.
(ii) Promoting employment of women in project utilities. The project made efforts to engage women consultants in the IPMU, IPIUs, PMC, and DSC for project duration. Similar efforts are required to promote employment of women as staff in the state government departments. Participation of women as regular staff would
98 Appendix 10
ensure that the needs and concerns of women are included while planning and implementing the water and sanitation projects in the State.
(iii) Identifying the slums and poor settlements for priority targeting. It is recommended that the slums and poor settlements are identified at project outset and the poor households are prioritized to apply for water supply and sanitation (WSS) connections. This would improve access of basic WSS services to poor and vulnerable households and promote social inclusion.
(iv) Institutionalizing the gender sensitive training modules. Training modules were prepared on (a) O&M of water supply system; (b) O&M of sewerage network; and (c) safe disposal of sewerage and waste. For optimum use and sustainability, it is apt to institutionalize these gender sensitive training modules for effective and efficient project management and implementation for other projects in the WSS sector.
Appendix 11 99
SAFEGUARDS A. Assessment of Environmental Safeguards Implementation 1. Environmental safeguards implementation arrangements. The IPMU and IPIUs with the support of project management and construction supervision consultants were responsible for overall environmental safeguards management and implemented the environmental safeguard measures. An environmental expert was engaged as a part of the environment and social management cell within IPMU. The IPMU was assisted by the environmental safeguard specialists engaged through the project management and construction supervision consultants and by the environment officers deployed by the civil works contractors. The environment staff of ADB adequately provided guidance and hand-holding support to the environment experts associated with project 2 and the MFF through field-based environmental due diligence during review missions and review meetings, followed up persistently with staff from different departments, regulatory agencies, and other stakeholders to achieve compliance with ADB’s requirements. The environment experts from consultants and environment staff of ADB conducted capacity building programs on safeguards for the project staff working with the IPMU, IPIUs, other associated departments, urban local bodies, consultants, and contractors. In addition to training on safeguards related considerations, the project staff also attended training programs organized by ADB’s Capacity Development Resource Center at India Resident Mission on different topics related to construction and operation and maintenance aspects of the urban sector. This enabled improved institutional capacities of the staff from all departments to manage technical aspects including environmental safeguards. 2. Environmental safeguards. The MFF and project 2 were classified category B for environment as per ADB’s Safeguard Policy Statement, 2009. The environmental assessments were undertaken for identified subprojects in each project town. Six initial environmental examination (IEE) reports, including environmental management plans (EMP) and environmental monitoring plans, were prepared, and disclosed on ADB website. An environmental assessment and review framework was specifically developed for project 2. The concepts such as rainwater harvesting, reuse of treated domestic wastewater for irrigation, energy efficient treatment systems were considered to the extent possible during design stage based on the then prevailing regulatory framework. The IEE reports, including EMPs, were updated during implementation to reflect revised pipeline alignments. The EMPs and associated budget were included in contractors’ agreements. The compliances with environmental and labor regulations of India by the facility owners and the civil works contractors improved over the period with environment staff of ADB facilitating increased interactions with regulatory agencies, follow-up with the facility owners and contractors to complete the requisite documentation and tracking adherence with terms and conditions stipulated with regulatory permissions and timely renewals. Initially, the implementation of EMP and associated monitoring plans was observed to be limited with shortcomings in the areas such as adopting safety features for workers and at work fronts, dust emissions management, excavated debris stored along the edges of trenches, facilities at accommodation provided to workers, restricted access to residents/shopkeepers and movement of pedestrians. With deployment of environment professionals at the IPMU, consultants, and civil works contractors, and with continuous hand-holding support from ADB, the implementation of actions within agreed timelines for improved environmental performance was ensured that yielded better adherence with the SPS 2009. The testing of environmental parameters for ambient air, surface water and ground water qualities, and ambient noise levels as per ADB-cleared monitoring plans was carried out by accredited agencies and the test results indicated that the parameters were within the baseline values. Most of the contractors carried out baseline monitoring prior to commencing with works. The extent of public consultations and outreach
100 Appendix 11
activities was initially limited. This improved after the institutional arrangements were strengthened resulting in increased field-based due diligence and formal/informal consultations by the environment practitioners. Further, focused capacity building efforts were undertaken for the project staff on management of environmental aspects highlighting the benefits of consultations with locals in the project’s impact corridor. The remaining construction works for some of the subprojects implemented under project 1 were carried forward to project 2. The ADB-cleared IEE reports for such project 1 subprojects did not require any update considering the overall scope of these project 1 subprojects continued to remain the same. The IEE reports (including environmental management and monitoring plans) had already reflected assessment of areas such as biodiversity protection, pollution abatement and prevention, occupational and community health and safety and physical cultural resources required under SPS 2009. 3. The submission of semiannual environmental monitoring reports was sometimes irregular during implementation due to delayed receipt of monthly environmental management progress reports from some of the contractors and delayed site mobilization of environment experts from the consultants to undertake field-based environmental due diligence and consultations. It required a persistent follow-up from ADB to improve the quality of reporting and achieve compliance. The continuation of environment expert engaged at IPMU within the same department facilitated submission of environmental monitoring report during the operation phase. The IPMU established elaborated and functional grievance redress mechanism to record and address complaints received on environmental safeguards related aspects. A complaint receiving system comprising of complaint register was put in place at each site with the help of the environment expert from the ESMC and the nongovernment organization deployed for community awareness and public participation. The project information notice boards displayed the contact details of the officials responsible for receiving and resolving the grievances. The complaints could also be registered through a dedicated toll-free number and online through a portal developed for the project. The grievances received were tracked by the IPIUs and IPMU on regular basis for resolution and outstanding grievances were escalated to the Project Director and city specific grievance redress committees. The city level committees were established in project towns for addressing complaints on environmental safeguards with the mayor of the urban local body as the Chair and members of the civil society, elected representatives, and government officials as members. Although no major complaints or public protests on the environmental safeguards related matters were raised for any of the activities implemented under the project, the subprojects did receive minor grievances from the residents in the surrounding areas. These grievances received at the worksites (recorded in site-based complaint registers) were resolved through a structured consultative process with the complainants by the environment experts of the IPMU, consultants, and contractors. The concerns raised by the complainants were addressed through minor site-specific design revisions and/or work practice improvements such as advance intimation of upcoming works that could cause restricted access, appropriately located signages, regular measures for dust suppression and noise attenuation, sturdy barricading of excavated trenches, early leveling of roads and pathways for making the roads travel worthy and safe for pedestrians, attending to situations such as breakage of water supply lines or other utilities as quickly as possible, etc. The project has no outstanding environmental safeguard related issues. The overall environmental safeguard management has been assessed to be effective and environmental safeguards related covenants were fully complied. 4. Conclusion and lessons learnt. Based on the challenges faced during implementation, it would be helpful to have (i) an early deployment of environmental experts at the IPMU, consultants and contractors; (ii) coordination with regulatory agencies and other government departments should be improved by the IPMU in consultation with the facility owners and the contractors to start early for obtaining regulatory approvals and avoid procedural delays; (iii) well-
Appendix 11 101
planned public awareness campaigns and outreach events about proposed interventions, its benefits and anticipated environmental impacts keeping in mind the usual resistance to sanitation and water supply interventions in urban areas, with feedback mechanisms for the actions taken on concerns raised; and (iv) robust, easily accessible, functional and responsive grievance redress systems from the design stage itself to facilitate public support for the proposed interventions. B. Assessment of Social Safeguards Implementation 5. Social safeguards implementation arrangements. An environment and social management cell was established to implement safeguards requirements within the IPMU. A Social and Community Development Officer, with the support of the community mobilizers were responsible for the implementation of the social safeguards. 1 Adequate support for effective implementation and monitoring of social safeguards requirements was provided by safeguard experts of design and supervision consultants. The overall institutional arrangements for the management of social safeguards are assessed as adequate. 6. Social safeguards. Project 2 and the MFF were classified as category B involuntary resettlement and category C for indigenous peoples, as per ADB’s safeguard policies.2 ADB approved the resettlement framework and nine resettlement plans.3 No subproject under the MFF involved land acquisition (works were implemented on government land and/or existing right-of-way); however, 36 households suffered temporary income loss due to implementation of project 1, while the temporary impacts envisaged under project 2 were avoided. MFF did not caused any significant temporary loss of income and those impacted were compensated as per the agreed entitlement matrix. According to the Uttarakhand Urban Sector Development Investment Program’s (UUSDIP) records, ₹0.168 million were paid as compensation for temporary income loss and resettlement assistance. The objectives laid out in the resettlement framework and resettlement plans prepared under MFF to avoid and mitigate involuntary impacts and compensated as per the provision of the entitlement matrix to those affected were achieved. Social safeguard requirements were effectively complied with and compensation of 36 households was paid as the agreed entitlement matrix. At appraisal, project 2 and the MFF were classified as category C, as no impact on indigenous peoples were envisaged. MFF continued to be category C during implementation. The ADB project team and experts provided regular training to the IPMU, IPIUs, and consultants on involuntary resettlement safeguards under various programs, which enhanced their capacity to deal with social safeguard issues. 7. Information disclosure and grievance redress. Information disclosure, participation, and consultation activities to implement social safeguards were effectively carried out. Such
1 The social and community development officer was available on the project up to 2016, and upon her resignation, the
environment officer at IPMU was given additional charge of social safeguards. Two nongovernmental organizations (NGO) were also engaged in February 2011 to implement RPs, and Community Awareness and Participation Program (CAPP) and were mobilized till June 2013 and February 2014, respectively. Upon the NGOs' demobilization, the individual experts as Community Mobilizers, were hired to implement social safeguards related activities after the demobilization of the NGOs. The valuation committee constituted under the project included representative of the affected persons as member besides other government officials. Initially NGOs and later the community mobilisers supported in providing the feedback about the project activities, grievance redress, public disclosure, consultations, and verification of affected persons which provided basis for preparing monitoring reports.
2 For project 1, the policies applicable were (i) ADB. 1995. Involuntary Resettlement. Manila; and (ii) ADB. 1998. The Bank’s Policy on indigenous peoples. Manila. For project 2, the policy applicable was ADB. 2009. Safeguards Policy Statement. Manila.
3 Four short resettlement plans (SRPs) were prepared under Project 1, and five resettlement plans were prepared under project 2.
102 Appendix 11
activities included: (i) distribution and dissemination of resettlement information among affected households in the local language (Hindi); (ii) regular consultative meetings with affected households and other stakeholders; (iii) publicizing actual resettlement impacts and compensation to affected households; (iv) carrying out monitoring activities; and (v) disclosure of social safeguards documents. 8. A credible and effective grievance redress mechanism was set up in accordance with the agreed resettlement framework under the MFF to address any project-related grievances of affected persons. Stakeholders, through a toll-free number, WhatsApp group, were able to file their grievances. The billboards were used to inform communities about the filing process, and community mobilizers supported creating a continuous consultation process. Pamphlets were distributed, and community consent was obtained before the commencement of work.4 One grievance related to social safeguards was received during the implementation the project 1. The complainant requested to provide the passage so that he can have access to his land. The grievance was resolved by providing the easement to access his land. At the completion of the MFF, no grievances related to social safeguards are pending. The executing agency prepared and submitted to ADB 10 social safeguards monitoring reports. The submission of safeguards monitoring reports were delayed, however after the mobilization of the safeguards staff and consistent follow-up the submission of reports became regular. However, towards the end of the project with expert at IPMU being given the additional responsibilities the submission again became irregular. 9. Conclusion and lessons learnt. The resettlement impacts were reduced during implementation, based on the key ADB principle to avoid and minimize land acquisition and resettlement impacts through detailed technical design like revised alignments and providing access to continue affected persons’ business activities. Extensive consultations with affected persons and support by the local governments enabled the successful implementation of the MFF. The affected households were appropriately compensated. The suggestions and guidance provided by the ADB missions to resolve the grievance were implemented by the project authorities, which ensured the proper implementation. The project authorities confirmed that there are no outstanding issues and/or any court case related to social safeguards at completion. Overall, involuntary resettlement and indigenous peoples safeguard compliance was assessed to be satisfactory.
4 ADB. 2020. Corporate Evaluation: Effectiveness of the 2009 Safeguard Policy Statement. Manila.
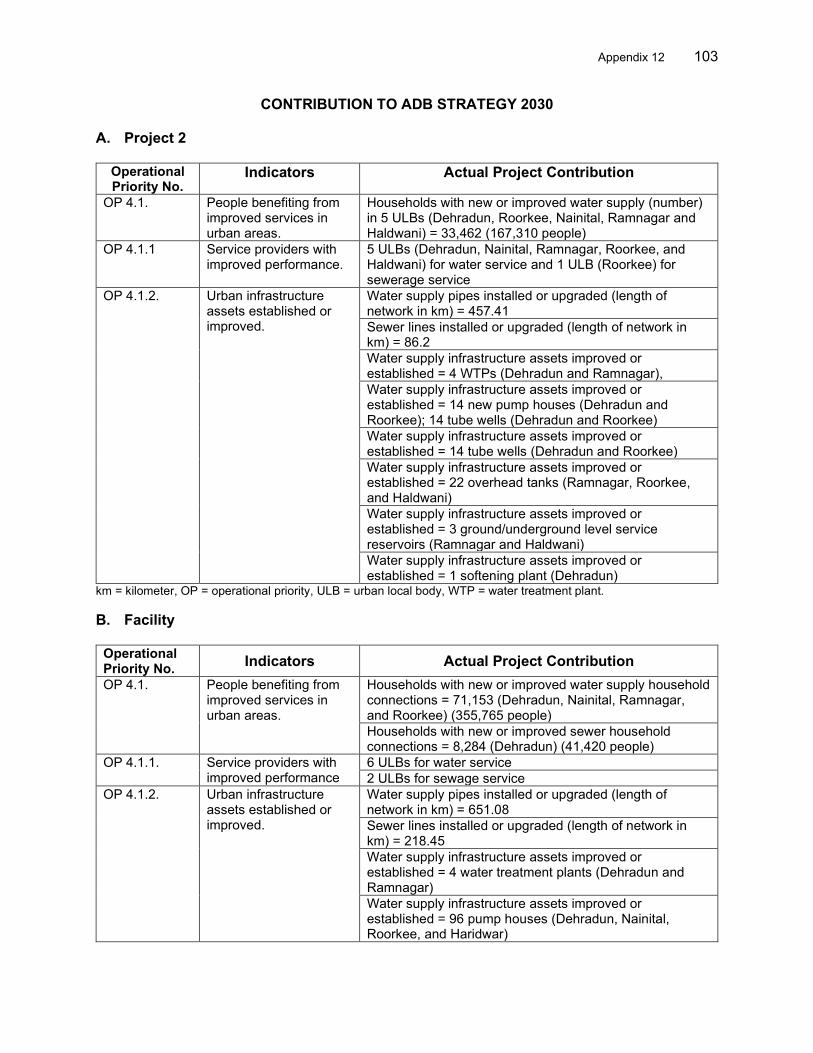
Appendix 12 103
CONTRIBUTION TO ADB STRATEGY 2030 A. Project 2
Operational Priority No.
Indicators Actual Project Contribution
OP 4.1. People benefiting from improved services in urban areas.
Households with new or improved water supply (number) in 5 ULBs (Dehradun, Roorkee, Nainital, Ramnagar and Haldwani) = 33,462 (167,310 people)
OP 4.1.1 Service providers with improved performance.
5 ULBs (Dehradun, Nainital, Ramnagar, Roorkee, and Haldwani) for water service and 1 ULB (Roorkee) for sewerage service
OP 4.1.2. Urban infrastructure assets established or improved.
Water supply pipes installed or upgraded (length of network in km) = 457.41 Sewer lines installed or upgraded (length of network in km) = 86.2 Water supply infrastructure assets improved or established = 4 WTPs (Dehradun and Ramnagar), Water supply infrastructure assets improved or established = 14 new pump houses (Dehradun and Roorkee); 14 tube wells (Dehradun and Roorkee) Water supply infrastructure assets improved or established = 14 tube wells (Dehradun and Roorkee) Water supply infrastructure assets improved or established = 22 overhead tanks (Ramnagar, Roorkee, and Haldwani) Water supply infrastructure assets improved or established = 3 ground/underground level service reservoirs (Ramnagar and Haldwani) Water supply infrastructure assets improved or established = 1 softening plant (Dehradun)
km = kilometer, OP = operational priority, ULB = urban local body, WTP = water treatment plant. B. Facility
Operational Priority No. Indicators Actual Project Contribution OP 4.1. People benefiting from
improved services in urban areas.
Households with new or improved water supply household connections = 71,153 (Dehradun, Nainital, Ramnagar, and Roorkee) (355,765 people) Households with new or improved sewer household connections = 8,284 (Dehradun) (41,420 people)
OP 4.1.1. Service providers with improved performance
6 ULBs for water service 2 ULBs for sewage service
OP 4.1.2. Urban infrastructure assets established or improved.
Water supply pipes installed or upgraded (length of network in km) = 651.08 Sewer lines installed or upgraded (length of network in km) = 218.45 Water supply infrastructure assets improved or established = 4 water treatment plants (Dehradun and Ramnagar) Water supply infrastructure assets improved or established = 96 pump houses (Dehradun, Nainital, Roorkee, and Haridwar)
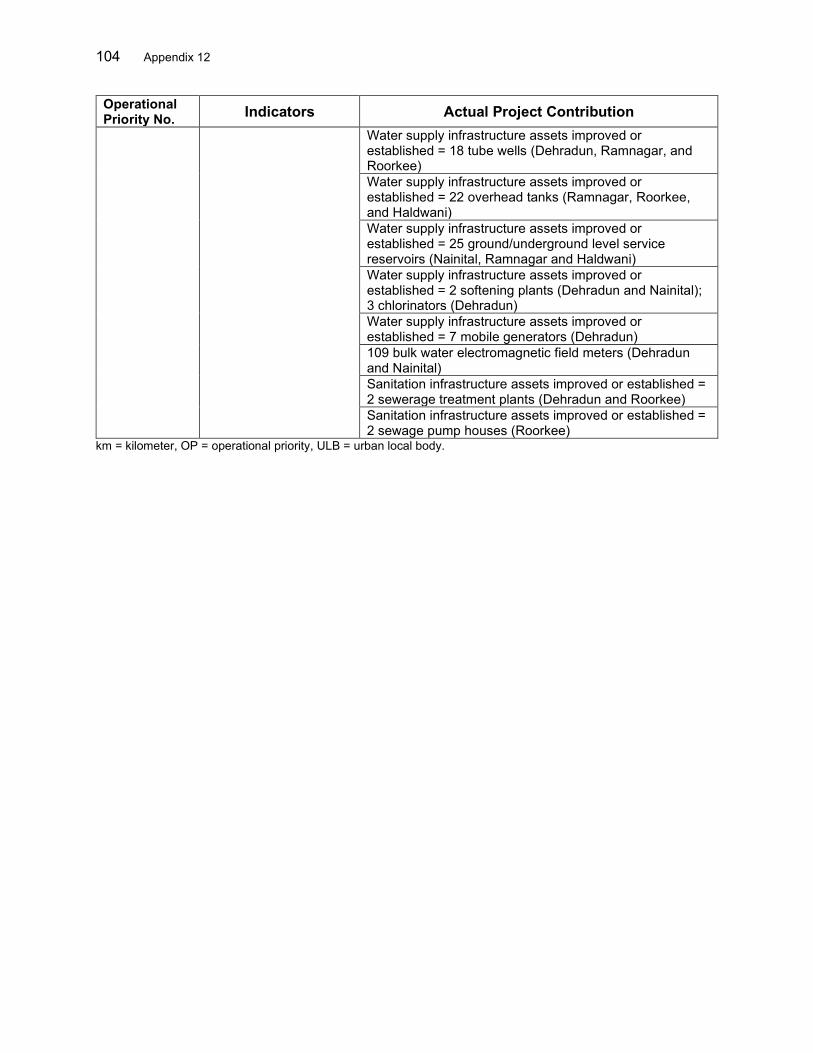
104 Appendix 12
Operational Priority No. Indicators Actual Project Contribution
Water supply infrastructure assets improved or established = 18 tube wells (Dehradun, Ramnagar, and Roorkee) Water supply infrastructure assets improved or established = 22 overhead tanks (Ramnagar, Roorkee, and Haldwani) Water supply infrastructure assets improved or established = 25 ground/underground level service reservoirs (Nainital, Ramnagar and Haldwani) Water supply infrastructure assets improved or established = 2 softening plants (Dehradun and Nainital); 3 chlorinators (Dehradun) Water supply infrastructure assets improved or established = 7 mobile generators (Dehradun) 109 bulk water electromagnetic field meters (Dehradun and Nainital) Sanitation infrastructure assets improved or established = 2 sewerage treatment plants (Dehradun and Roorkee) Sanitation infrastructure assets improved or established = 2 sewage pump houses (Roorkee)
km = kilometer, OP = operational priority, ULB = urban local body.