Embed Size (px)
Citation preview
Vacuum Systems Cookbook
Chapter 1: Basic Skills
Chapter 2: Safety
Chapter 3: Review of Basic Vacuum Calculations
Chapter 4: Vacuum System Components
Chapter 5: Sub-atmospheric Total Pressure Gauges
Chapter 6: Mechanical Vacuum Pumps
Chapter 7: Oil Vapor Diffusion Pumps
Chapter 8: Cryo-sorption pumps
Chapter 9: Sputter ion pumps
Chapter 10: Turbomolecular Pumps
Chapter 11: Cryogenic Vacuum Pumps
Chapter 12: Leak Detection
Chapter 13: Partial Pressure Analysis
Chapter 14: Thin Film Deposition Processes
Las Positas College Vacuum Technology 60A & 60B
Page 6 Rights Reserved, Biltoft, Benapfl, and Swain Fall 2002
Chapter 1: Basic Skills In this chapter we hope to present a review of basic skills in the areas of mathematics, unit conversions, use of the metric system, an introduction to the physical nature of matter, measurement techniques, and techniques for the presentation of data. At the end of each section we will include a bibliography for those of you wishing to explore any of these areas more fully.
REVIEW of MATHEMATICS Physical measurements you will perform will require accurate recording, calculation, and reporting of numbers. Numbers that we will use may be broken down into three categories: integers, real numbers, and rational numbers. We will use the symbols x, / or ÷, +, and - to denote the mathematical functions multiply, divide, add, and subtract. Integers: whole numbers, either positive or negative
Example: 3, -7, 1,000,000 Real Numbers: also called decimal numbers
Example: 5.4, 0.001, -12.34 Rational Numbers: numbers expressed as a ratio of two numbers
Example: 2/3, 1/10 and -1/2. Mathematical Operators: addition (+), subtraction (-), multiplication (x), division(÷ ) Equations: Just as the name suggests, equations are mathematical statements in which the equality of two statements is expressed: Example: π x 5 = 15.7 is a mathematical equation which reads Pi multiplied by five is equal to fifteen point seven (or fifteen and seven tenths). Variables: Often we do not know the values for all of the expressions in an equation, so we substitute letters or symbols in place of the numbers. Variables are also used in the writing of generic equations (formulas) into which numbers are substituted later.
Example: the circumference of a circle C having diameter D is given by the equation:
circumference = π x D or
C Dπ=
In this example, D is a variable and can have any positive value. When variable are not separated by an operator, it is assumed to be multiplication.
Las Positas College Vacuum Technology 60A & 60B
Page 7 Rights Reserved, Biltoft, Benapfl, and Swain Fall 2002
Formulas: Formulas are mathematical equations that have been worked out for you; all that is required to solve a formula is to substitute appropriate numerical values in place of the variables.
Example: the mass flow rate of a vacuum system is given by the formula:
Q = S x P Where Q= mass flow in Torr- liters per second, S= volumetric flow rate (or pumping speed) in liters per second, and P = pressure, expressed in Torr. Formulas used in simple vacuum calculations are given in appendix X, and formulas for areas and volumes of simple geometric shapes are given in the appendix Y. Exponential Notation: Often in the process of performing calculations, we are interested in multiplying a number by itself several times.
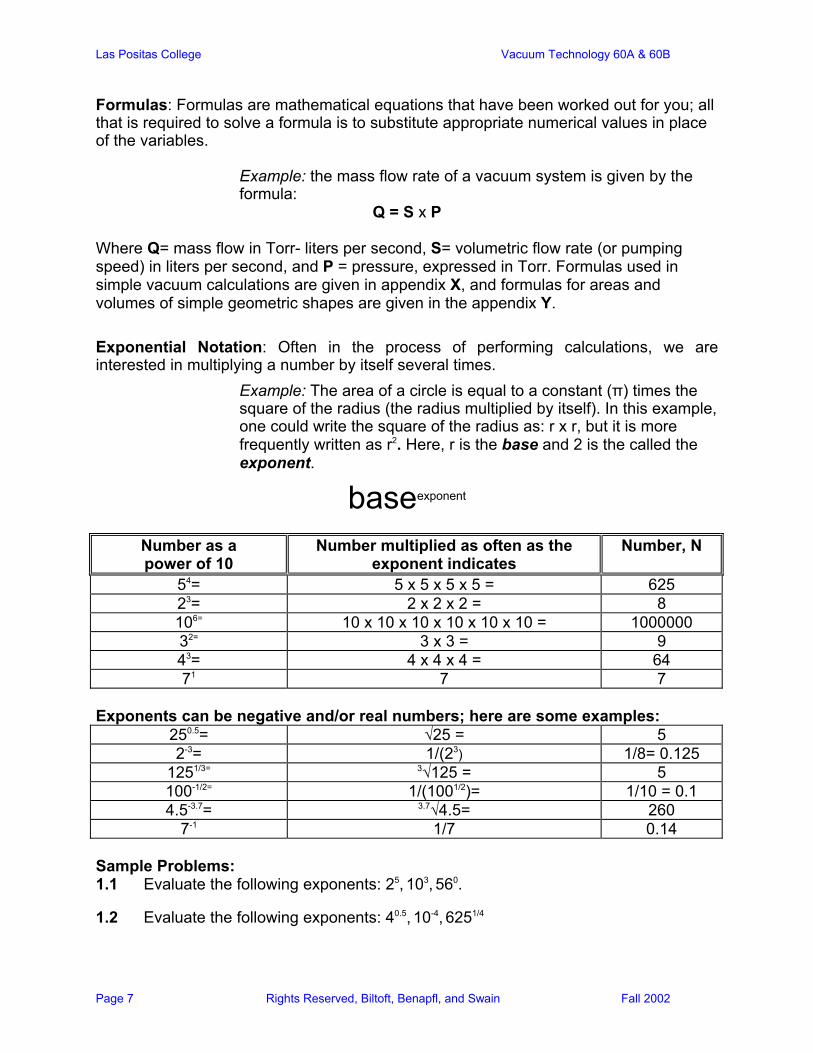
Example: The area of a circle is equal to a constant (π) times the square of the radius (the radius multiplied by itself). In this example, one could write the square of the radius as: r x r, but it is more frequently written as r2. Here, r is the base and 2 is the called the exponent.
baseexponent
Number as a power of 10
Number multiplied as often as the exponent indicates
Number, N
54= 5 x 5 x 5 x 5 = 625 23= 2 x 2 x 2 = 8 106= 10 x 10 x 10 x 10 x 10 x 10 = 1000000 32= 3 x 3 = 9 43= 4 x 4 x 4 = 64 71 7 7
Exponents can be negative and/or real numbers; here are some examples:
250.5= √25 = 5 2-3= 1/(23) 1/8= 0.125
1251/3= 3√125 = 5 100-1/2= 1/(1001/2)= 1/10 = 0.1 4.5-3.7= 3.7√4.5= 260
7-1 1/7 0.14 Sample Problems: 1.1 Evaluate the following exponents: 25, 103, 560.
1.2 Evaluate the following exponents: 40.5, 10-4, 6251/4
Las Positas College Vacuum Technology 60A & 60B
Page 8 Rights Reserved, Biltoft, Benapfl, and Swain Fall 2002
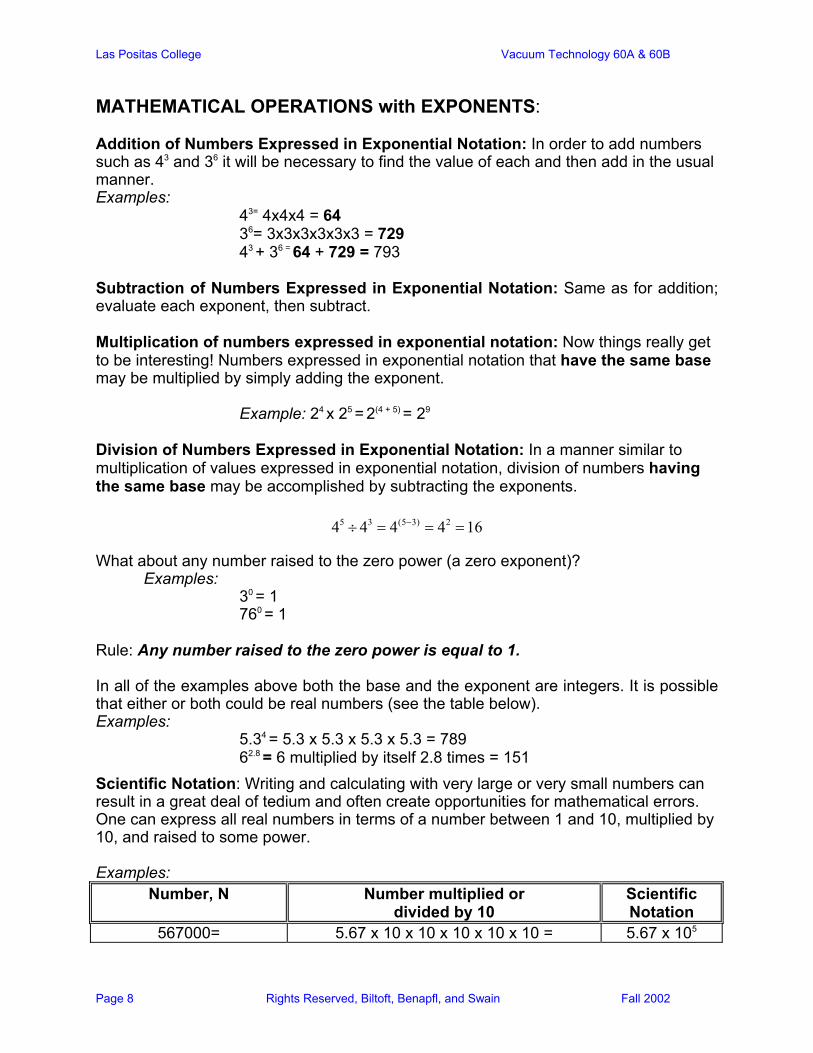
MATHEMATICAL OPERATIONS with EXPONENTS: Addition of Numbers Expressed in Exponential Notation: In order to add numbers such as 43 and 36 it will be necessary to find the value of each and then add in the usual manner. Examples:
43= 4x4x4 = 64 36= 3x3x3x3x3x3 = 729 43 + 36 = 64 + 729 = 793
Subtraction of Numbers Expressed in Exponential Notation: Same as for addition; evaluate each exponent, then subtract. Multiplication of numbers expressed in exponential notation: Now things really get to be interesting! Numbers expressed in exponential notation that have the same base may be multiplied by simply adding the exponent.
Example: 24 x 25 = 2(4 + 5) = 29 Division of Numbers Expressed in Exponential Notation: In a manner similar to multiplication of values expressed in exponential notation, division of numbers having the same base may be accomplished by subtracting the exponents.
5 3 (5 3) 24 4 4 4 16−÷ = = = What about any number raised to the zero power (a zero exponent)? Examples:
30 = 1 760 = 1
Rule: Any number raised to the zero power is equal to 1. In all of the examples above both the base and the exponent are integers. It is possible that either or both could be real numbers (see the table below). Examples:
5.34 = 5.3 x 5.3 x 5.3 x 5.3 = 789 62.8 = 6 multiplied by itself 2.8 times = 151
Scientific Notation: Writing and calculating with very large or very small numbers can result in a great deal of tedium and often create opportunities for mathematical errors. One can express all real numbers in terms of a number between 1 and 10, multiplied by 10, and raised to some power. Examples:
Number, N Number multiplied or divided by 10
Scientific Notation
567000= 5.67 x 10 x 10 x 10 x 10 x 10 = 5.67 x 10⁵
Las Positas College Vacuum Technology 60A & 60B
Page 9 Rights Reserved, Biltoft, Benapfl, and Swain Fall 2002
0.00034= 3.4 ÷ 10 ÷ 10 ÷ 10 ÷ 10 = 3.4 x 10⁻⁴ 1090000 1.09 x 10 x 10 x 10 x 10 x 10 x 10 = 1.09 x 10⁶
354 3.54 x 10 x 10 = 3.54 x 10² 0.067 6.7 ÷ 10 ÷ 10 = 6.7 x 10⁻² 7690 7.69 x 10 x 10 x 10 7.69 x 10³
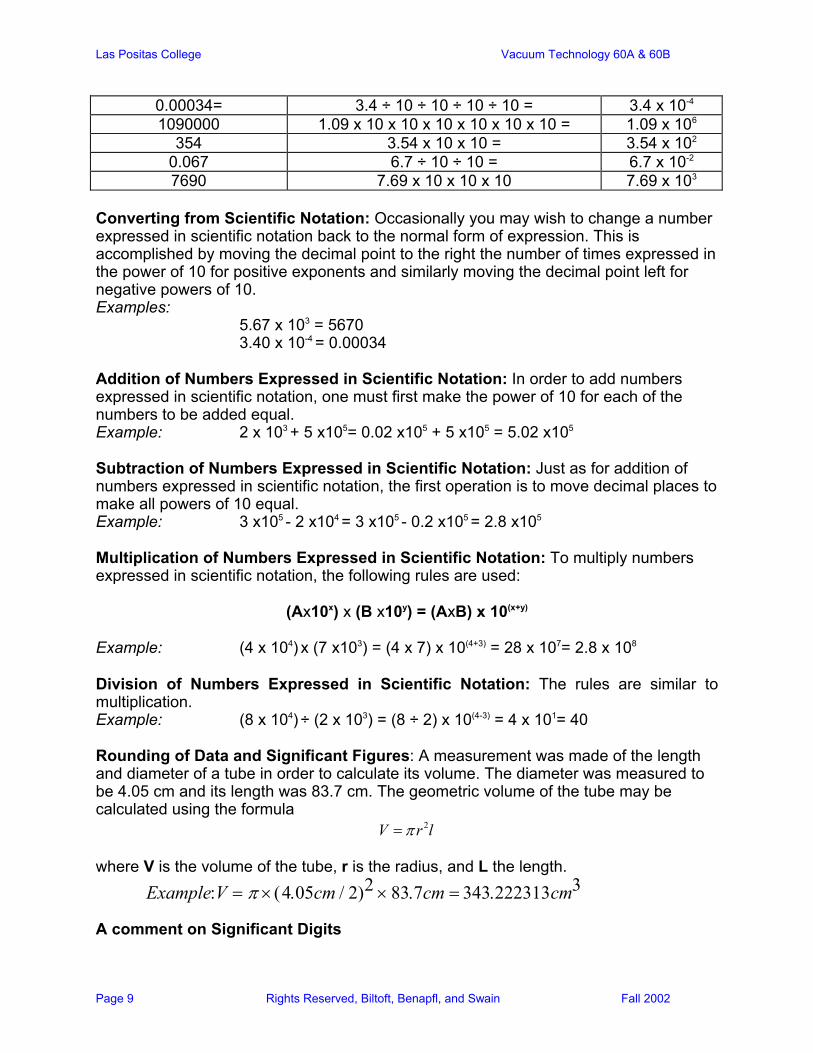
Converting from Scientific Notation: Occasionally you may wish to change a number expressed in scientific notation back to the normal form of expression. This is accomplished by moving the decimal point to the right the number of times expressed in the power of 10 for positive exponents and similarly moving the decimal point left for negative powers of 10. Examples:
5.67 x 103 = 5670 3.40 x 10-4 = 0.00034
Addition of Numbers Expressed in Scientific Notation: In order to add numbers expressed in scientific notation, one must first make the power of 10 for each of the numbers to be added equal. Example: 2 x 10³ + 5 x105= 0.02 x10⁵ + 5 x105 = 5.02 x10⁵ Subtraction of Numbers Expressed in Scientific Notation: Just as for addition of numbers expressed in scientific notation, the first operation is to move decimal places to make all powers of 10 equal. Example: 3 x10⁵ - 2 x104 = 3 x10⁵ - 0.2 x105 = 2.8 x10⁵ Multiplication of Numbers Expressed in Scientific Notation: To multiply numbers expressed in scientific notation, the following rules are used:
(Ax10x) x (B x10y) = (AxB) x 10(x+y)
Example: (4 x 104) x (7 x103) = (4 x 7) x 10(4+3) = 28 x 107= 2.8 x 10⁸
Division of Numbers Expressed in Scientific Notation: The rules are similar to multiplication. Example: (8 x 10⁴) ÷ (2 x 10³) = (8 ÷ 2) x 10(4-3) = 4 x 101= 40 Rounding of Data and Significant Figures: A measurement was made of the length and diameter of a tube in order to calculate its volume. The diameter was measured to be 4.05 cm and its length was 83.7 cm. The geometric volume of the tube may be calculated using the formula
2V r lπ= where V is the volume of the tube, r is the radius, and L the length.
Example:V = π ×(4.05cm / 2)2 × 83.7cm = 343.222313cm3 A comment on Significant Digits
Las Positas College Vacuum Technology 60A & 60B
Page 10 Rights Reserved, Biltoft, Benapfl, and Swain Fall 2002
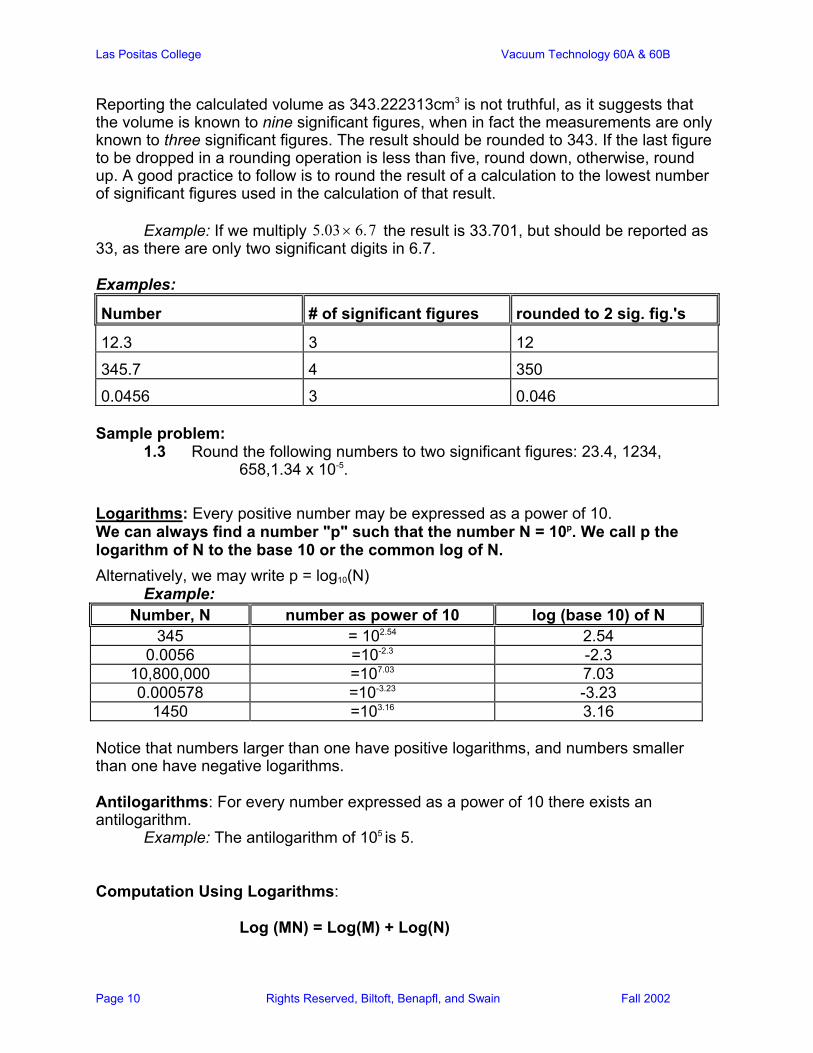
Reporting the calculated volume as 343.222313cm3 is not truthful, as it suggests that the volume is known to nine significant figures, when in fact the measurements are only known to three significant figures. The result should be rounded to 343. If the last figure to be dropped in a rounding operation is less than five, round down, otherwise, round up. A good practice to follow is to round the result of a calculation to the lowest number of significant figures used in the calculation of that result. Example: If we multiply 5.03 × 6.7 the result is 33.701, but should be reported as 33, as there are only two significant digits in 6.7. Examples:
Number # of significant figures rounded to 2 sig. fig.'s
12.3 3 12
345.7 4 350
0.0456 3 0.046 Sample problem:
1.3 Round the following numbers to two significant figures: 23.4, 1234, 658,1.34 x 10-5.
Logarithms: Every positive number may be expressed as a power of 10. We can always find a number "p" such that the number N = 10p. We call p the logarithm of N to the base 10 or the common log of N. Alternatively, we may write p = log10(N) Example:
Number, N number as power of 10 log (base 10) of N 345 = 102.54 2.54
0.0056 =10-2.3 -2.3 10,800,000 =107.03 7.03 0.000578 =10-3.23 -3.23
1450 =103.16 3.16 Notice that numbers larger than one have positive logarithms, and numbers smaller than one have negative logarithms. Antilogarithms: For every number expressed as a power of 10 there exists an antilogarithm. Example: The antilogarithm of 105 is 5. Computation Using Logarithms:
Log (MN) = Log(M) + Log(N)
Las Positas College Vacuum Technology 60A & 60B
Page 11 Rights Reserved, Biltoft, Benapfl, and Swain Fall 2002
Log(M/N) = Log(M) - Log(N) Log(MY) = Y x Log(M)
Fairly complex mathematical expressions may be evaluated simply using logarithms.
Log( AZ x BW ÷ CY) = Z x Log(A) + W x Log(B) - Y x Log(C) Sample Problems: 1.4 Log(25
× 32 ÷43 ) 1.5 Log(43) 1.6 Log(56 ×12 )
SYSTEM of UNITS
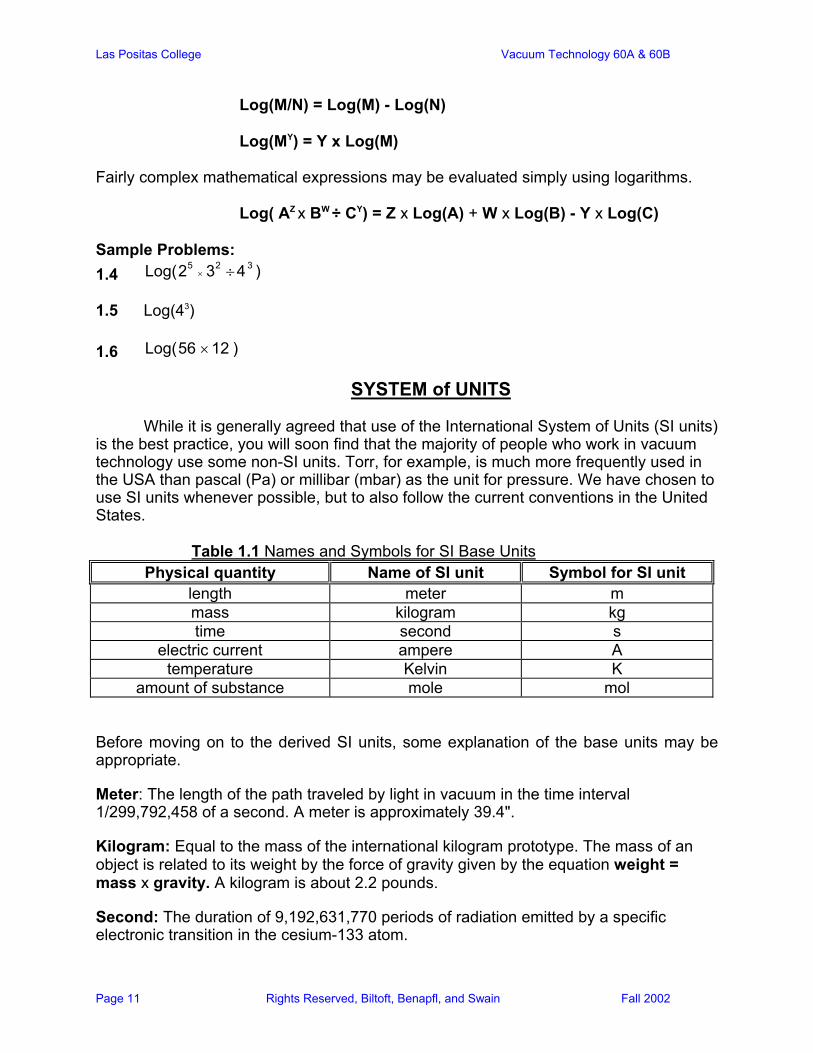
While it is generally agreed that use of the International System of Units (SI units) is the best practice, you will soon find that the majority of people who work in vacuum technology use some non-SI units. Torr, for example, is much more frequently used in the USA than pascal (Pa) or millibar (mbar) as the unit for pressure. We have chosen to use SI units whenever possible, but to also follow the current conventions in the United States. Table 1.1 Names and Symbols for SI Base Units
Physical quantity Name of SI unit Symbol for SI unit length meter m mass kilogram kg time second s
electric current ampere A temperature Kelvin K
amount of substance mole mol
Before moving on to the derived SI units, some explanation of the base units may be appropriate.
Meter: The length of the path traveled by light in vacuum in the time interval 1/299,792,458 of a second. A meter is approximately 39.4".
Kilogram: Equal to the mass of the international kilogram prototype. The mass of an object is related to its weight by the force of gravity given by the equation weight = mass x gravity. A kilogram is about 2.2 pounds.
Second: The duration of 9,192,631,770 periods of radiation emitted by a specific electronic transition in the cesium-133 atom.
Las Positas College Vacuum Technology 60A & 60B
Page 12 Rights Reserved, Biltoft, Benapfl, and Swain Fall 2002
Ampere: The constant current which if maintained in two straight parallel conductors of infinite length and 1 meter apart in vacuum, would produce a force between these conductors of 2 x 10⁻⁷ newtons per meter of conductor length. If one applies 10 volts across a 10Ω resistor, 1 ampere of current will flow through the circuit. Ω is the capital greek symbol usually denoting ohms, the standard measure of electrical resistance. Voltage E, Current I, and Resistance R are related by:
E IR=
Kelvin: The kelvin is the unit of thermodynamic temperature and is equal to 1/276.13 of the temperature of the triple point of water (temperature at which water can exist as a solid, liquid, or vapor depending upon the pressure). The melting point of ice is 273K, room temperature is 298K, and water boils at 373K. To convert from degrees Centigrade to Kelvin, add 273.15. Example: 100 °C + 273.15= 373.15K (the boiling point of water expressed in kelvin).
Mole: A mole of material contains 6.023 x 10²³ particles. A mole of carbon atoms weighs 12.011g (the atomic weight of carbon). One can think of a mole as a number of objects. Just as one can have 5 pencils, one can have a mole (6.023 x 10²³) of pencils.
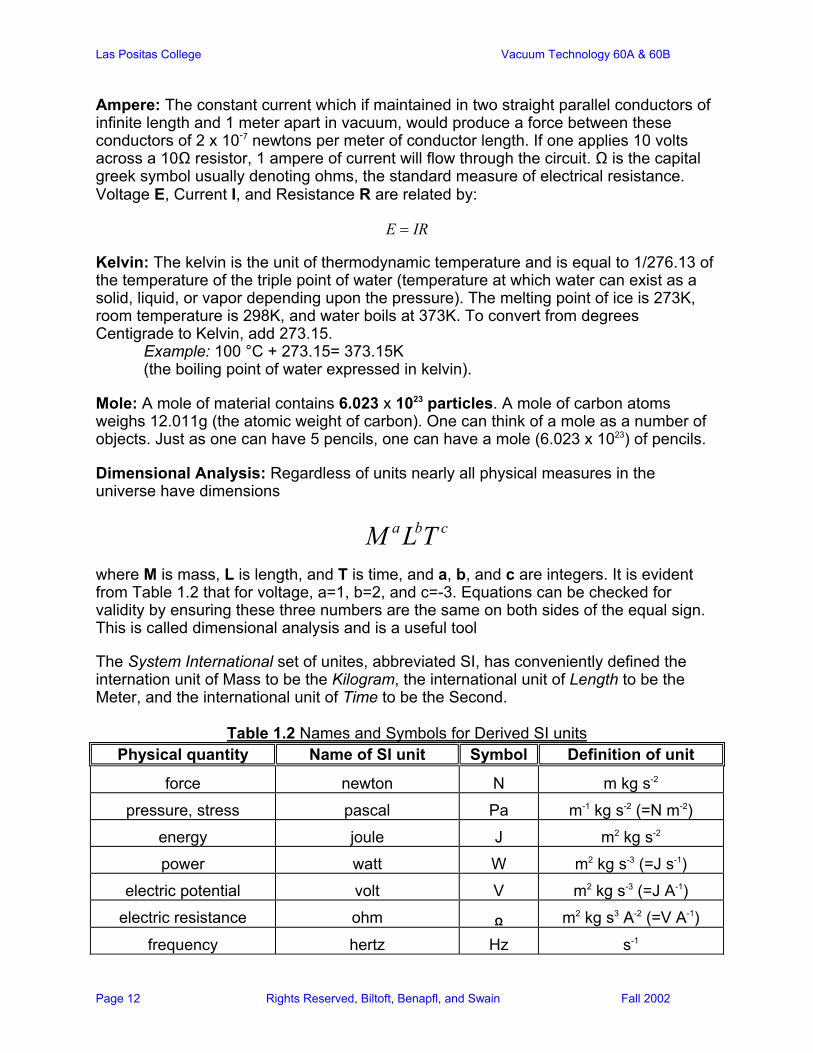
Dimensional Analysis: Regardless of units nearly all physical measures in the universe have dimensions
a b cM L T
where M is mass, L is length, and T is time, and a, b, and c are integers. It is evident from Table 1.2 that for voltage, a=1, b=2, and c=-3. Equations can be checked for validity by ensuring these three numbers are the same on both sides of the equal sign. This is called dimensional analysis and is a useful tool
The System International set of unites, abbreviated SI, has conveniently defined the internation unit of Mass to be the Kilogram, the international unit of Length to be the Meter, and the international unit of Time to be the Second.
Table 1.2 Names and Symbols for Derived SI units Physical quantity Name of SI unit Symbol Definition of unit
force newton N m kg s-2
pressure, stress pascal Pa m-1 kg s-2 (=N m-2)
energy joule J m2 kg s-2
power watt W m2 kg s-3 (=J s-1)
electric potential volt V m2 kg s-3 (=J A-1)
electric resistance ohm Ω m2 kg s3 A-2 (=V A-1)
frequency hertz Hz s-1

Las Positas College Vacuum Technology 60A & 60B
Page 13 Rights Reserved, Biltoft, Benapfl, and Swain Fall 2002
Force: That which changes the state of rest (or motion) of matter. The rate of change of momentum is a measure of force.
Force = mass x acceleration In SI units, one newton is the force that will accelerate a one kilogram mass one meter per second, per second.
Pressure (force per unit area). Popular units include pounds per square inch and (PSI), Torr, Bar,, atmospheres, and Pascals (Newtons per square meter). Pressure is a force distributed over an area. Absolute pressure is measured with respect to zero pressure (denoted PSIA), and gauge pressure is measured with respect to atmospheric pressure (denoted PSIG). If your car tire has about 30 PSIG, then it has about 45 PSIA (atmospheric pressure is about 15 PSI).
Energy: The capacity for doing work. Potential energy is stored energy due to the relative position of a body. Kinetic energy is the energy of a moving body;
Potential energy = mass x gravity x height.
Kinetic energy = 1/2 x mass x (velocity)2
Power: The rate at which work is done. Power in watts will be obtained if work in joules is divided by time in seconds.
Power = work / time
Electrical Potential: The work expended moving a charged body from point A to point B in an electric field.
Electrical Resistance: For a conductor of electricity, resistance is the relationship of applied electric potential to voltage. Ohm's Law states that:
electric potential = current x resistance
Frequency: The rate of oscillation of a particle, wave or body. SI units are cycles per second (cps) commonly also called Hertz (Hz).
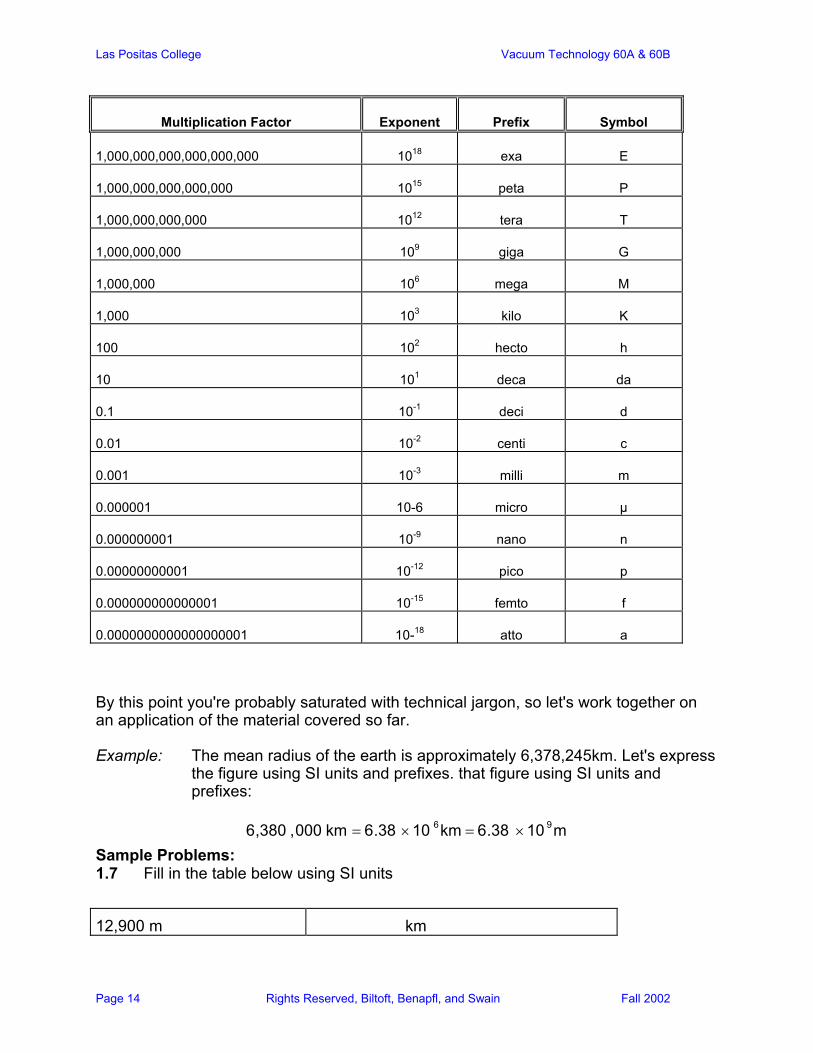
All of the metric (and some English) units use prefixes to make the expression of very large or very small numbers more clear. The kilo prefix in kilometer is probably the most familiar unit prefix. Below, in Table 1.3, the prefixes used in conjunction with metric units are listed along with their symbols and values.
Table 1.3 Names and Symbols for Derived SI units
Las Positas College Vacuum Technology 60A & 60B
Page 14 Rights Reserved, Biltoft, Benapfl, and Swain Fall 2002
Multiplication Factor Exponent Prefix Symbol
1,000,000,000,000,000,000 1018 exa E
1,000,000,000,000,000 1015 peta P
1,000,000,000,000 1012 tera T
1,000,000,000 109 giga G
1,000,000 106 mega M
1,000 103 kilo K
100 102 hecto h
10 101 deca da
0.1 10-1 deci d
0.01 10-2 centi c
0.001 10-3 milli m
0.000001 10-6 micro µ
0.000000001 10-9 nano n
0.00000000001 10-12 pico p
0.000000000000001 10-15 femto f
0.0000000000000000001 10-18 atto a
By this point you're probably saturated with technical jargon, so let's work together on an application of the material covered so far. Example: The mean radius of the earth is approximately 6,378,245km. Let's express
the figure using SI units and prefixes. that figure using SI units and prefixes:
6,380 ,000 km = 6.38 ×10 6km = 6.38 ×10 9m
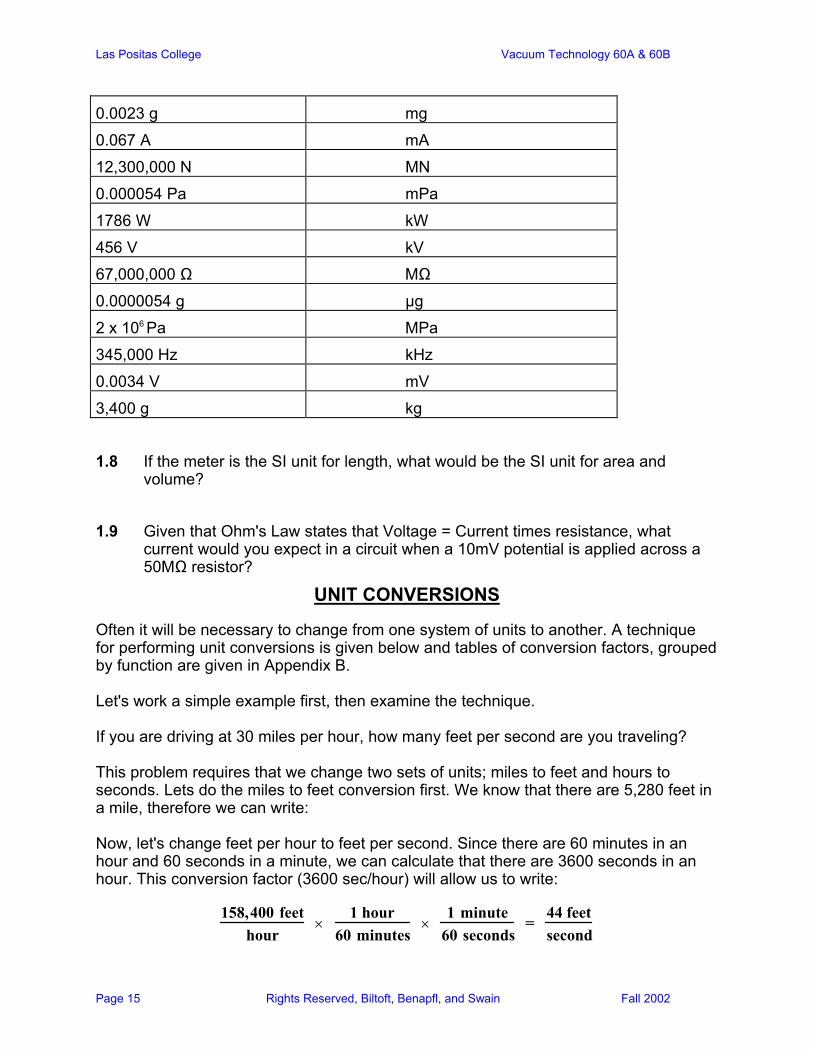
Sample Problems: 1.7 Fill in the table below using SI units
12,900 m km
Las Positas College Vacuum Technology 60A & 60B
Page 15 Rights Reserved, Biltoft, Benapfl, and Swain Fall 2002
0.0023 g mg
0.067 A mA
12,300,000 N MN
0.000054 Pa mPa
1786 W kW
456 V kV
67,000,000 Ω MΩ
0.0000054 g µg
2 x 10⁶ Pa MPa
345,000 Hz kHz
0.0034 V mV
3,400 g kg
1.8 If the meter is the SI unit for length, what would be the SI unit for area and
volume? 1.9 Given that Ohm's Law states that Voltage = Current times resistance, what
current would you expect in a circuit when a 10mV potential is applied across a 50MΩ resistor?
UNIT CONVERSIONS
Often it will be necessary to change from one system of units to another. A technique for performing unit conversions is given below and tables of conversion factors, grouped by function are given in Appendix B. Let's work a simple example first, then examine the technique. If you are driving at 30 miles per hour, how many feet per second are you traveling? This problem requires that we change two sets of units; miles to feet and hours to seconds. Lets do the miles to feet conversion first. We know that there are 5,280 feet in a mile, therefore we can write: Now, let's change feet per hour to feet per second. Since there are 60 minutes in an hour and 60 seconds in a minute, we can calculate that there are 3600 seconds in an hour. This conversion factor (3600 sec/hour) will allow us to write:
158,400 feethour
× 1 hour
60 minutes ×
1 minute60 seconds
= 44 feetsecond
Las Positas College Vacuum Technology 60A & 60B
Page 16 Rights Reserved, Biltoft, Benapfl, and Swain Fall 2002
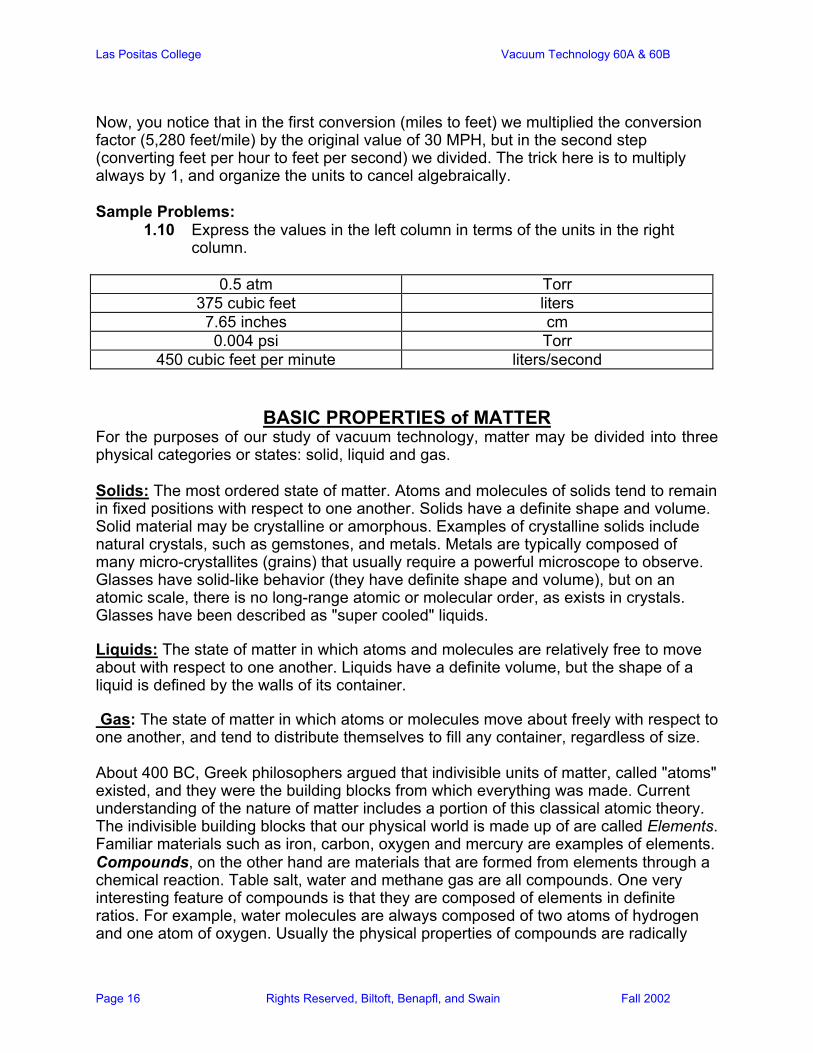
Now, you notice that in the first conversion (miles to feet) we multiplied the conversion factor (5,280 feet/mile) by the original value of 30 MPH, but in the second step (converting feet per hour to feet per second) we divided. The trick here is to multiply always by 1, and organize the units to cancel algebraically. Sample Problems:
1.10 Express the values in the left column in terms of the units in the right column.
0.5 atm Torr
375 cubic feet liters 7.65 inches cm 0.004 psi Torr
450 cubic feet per minute liters/second
BASIC PROPERTIES of MATTER
For the purposes of our study of vacuum technology, matter may be divided into three physical categories or states: solid, liquid and gas. Solids: The most ordered state of matter. Atoms and molecules of solids tend to remain in fixed positions with respect to one another. Solids have a definite shape and volume. Solid material may be crystalline or amorphous. Examples of crystalline solids include natural crystals, such as gemstones, and metals. Metals are typically composed of many micro-crystallites (grains) that usually require a powerful microscope to observe. Glasses have solid-like behavior (they have definite shape and volume), but on an atomic scale, there is no long-range atomic or molecular order, as exists in crystals. Glasses have been described as "super cooled" liquids.
Liquids: The state of matter in which atoms and molecules are relatively free to move about with respect to one another. Liquids have a definite volume, but the shape of a liquid is defined by the walls of its container.
Gas: The state of matter in which atoms or molecules move about freely with respect to one another, and tend to distribute themselves to fill any container, regardless of size. About 400 BC, Greek philosophers argued that indivisible units of matter, called "atoms" existed, and they were the building blocks from which everything was made. Current understanding of the nature of matter includes a portion of this classical atomic theory. The indivisible building blocks that our physical world is made up of are called Elements. Familiar materials such as iron, carbon, oxygen and mercury are examples of elements. Compounds, on the other hand are materials that are formed from elements through a chemical reaction. Table salt, water and methane gas are all compounds. One very interesting feature of compounds is that they are composed of elements in definite ratios. For example, water molecules are always composed of two atoms of hydrogen and one atom of oxygen. Usually the physical properties of compounds are radically
Las Positas College Vacuum Technology 60A & 60B
Page 17 Rights Reserved, Biltoft, Benapfl, and Swain Fall 2002
different than those of their constituent elements. Water, for example, is a liquid at room temperature, and yet both of its elements, oxygen and hydrogen are gases at room temperature. Not all material we are exposed to is in the form of compounds. Mixtures are simply physical combinations of materials (no chemical reaction involved). The air that we breathe is a mixture of approximately 79% nitrogen (a gaseous element at room temperature and atmospheric pressure) and 19% oxygen (another gas under the same conditions).
INTRODUCTION to MEASUREMENT TECHNIQUES
There is little point in setting up an experiment, and observing some physical (or chemical) phenomena unless one is prepared to record and later report meaningful information (data). In this section we hope to provide guidelines for use in this endeavor. First of all, one must think through the entire experiment before it is started to ensure that the procedure to be followed will result in a meaningful observation. Let me give you an example. I was working on a project, the goal of which was to use the characteristic emission lines of iron to determine when a sputter-etching process had gone to completion. I was using an existing vacuum chamber with a pyrex window view port for my spectrometer. Several days of data collection and analysis provided inconclusive results, so I began to wonder what I was doing wrong. As it turned out, the pyrex window was strongly absorbing the light I was hoping to observe in the vacuum chamber. After replacing the pyrex window with one made of sapphire, the results were in good agreement with what I had expected. Before beginning an experiment, you should at least have a guess (scientists call these theories) as to what will happen. In many of the vacuum pump experiments you will perform you will be measuring the pumping speed as a function of pressure. How do you expect the pump speed to change with pressure? Will the rate of change be constant? These are the kind of questions you would do well to consider before the experimental measurement. Another aspect of good data collection technique is to repeat the measurement enough times so that you are confident in the results. Statistics: The science of the meaningful interpretation of data. Let's assume you're performing a set of experiments to determine the length of time required to pump a vacuum vessel from atmospheric pressure to 50 microns. You make four runs and the values recorded are: 124, 136, 118 and 144 seconds respectively. Average: The sum divided by the number of measurements.
Average = (124+136+118+144)/4 = 522/4 = 130.5, which rounded to the correct number of significant digits is 131 seconds.
Range = 144 - 118 = 26 seconds.
For this very limited data set one could say that the time required to achieve a pressure of 50 microns is the average value plus or minus half the range. An acceptable way to present this data would be:
Las Positas College Vacuum Technology 60A & 60B
Page 18 Rights Reserved, Biltoft, Benapfl, and Swain Fall 2002
Average time to achieve a pressure of 50 microns starting at atmospheric pressure in a series of four measurements was observed to be 131 seconds ± 13 seconds. Notice that the measurement conditions (beginning and ending pressure), number of measurements (four), and the units (seconds) are all clearly stated. Sample Problem:
1.11 Find the average and range for the following set of pressure measurements: 1.2 x 10⁻⁵ Torr, 1.8 x 10⁻⁵ Torr, 2.1 x 10⁻⁵ Torr, 3.1 x 10⁻⁵ Torr and 2.6 x 10⁻⁵ Torr.
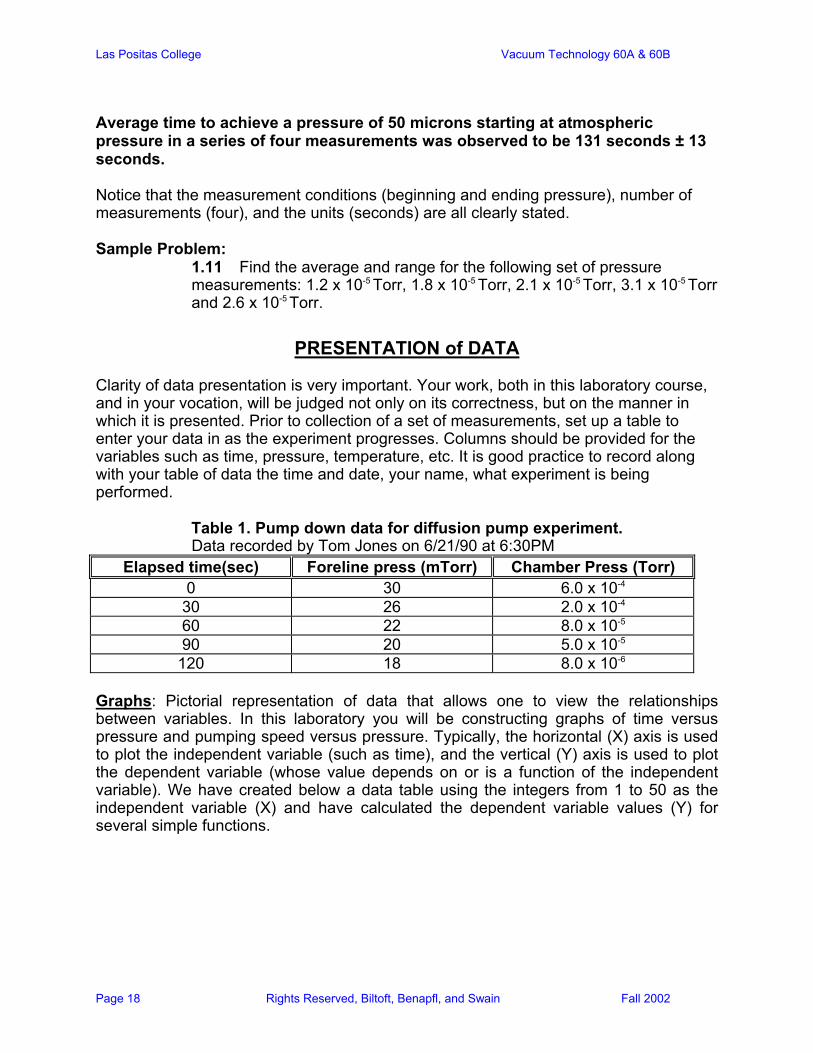
PRESENTATION of DATA Clarity of data presentation is very important. Your work, both in this laboratory course, and in your vocation, will be judged not only on its correctness, but on the manner in which it is presented. Prior to collection of a set of measurements, set up a table to enter your data in as the experiment progresses. Columns should be provided for the variables such as time, pressure, temperature, etc. It is good practice to record along with your table of data the time and date, your name, what experiment is being performed.
Table 1. Pump down data for diffusion pump experiment. Data recorded by Tom Jones on 6/21/90 at 6:30PM
Elapsed time(sec) Foreline press (mTorr) Chamber Press (Torr) 0 30 6.0 x 10⁻⁴
30 26 2.0 x 10⁻⁴ 60 22 8.0 x 10⁻⁵ 90 20 5.0 x 10⁻⁵ 120 18 8.0 x 10⁻⁶
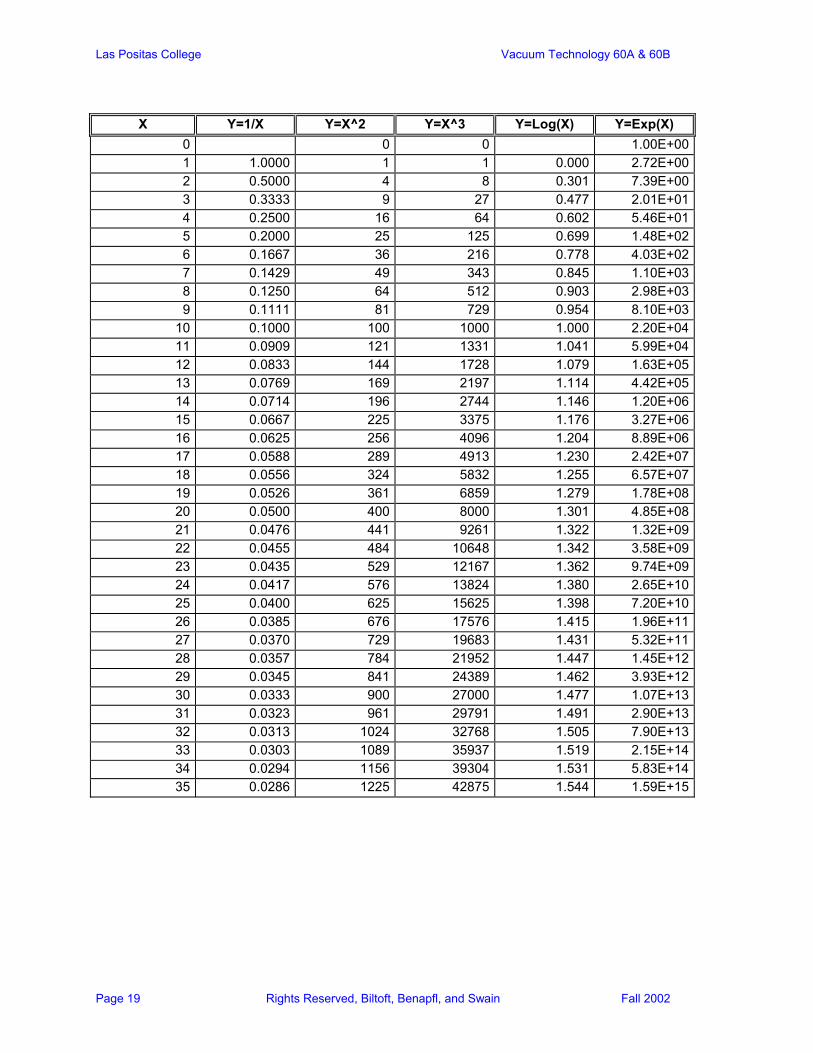
Graphs: Pictorial representation of data that allows one to view the relationships between variables. In this laboratory you will be constructing graphs of time versus pressure and pumping speed versus pressure. Typically, the horizontal (X) axis is used to plot the independent variable (such as time), and the vertical (Y) axis is used to plot the dependent variable (whose value depends on or is a function of the independent variable). We have created below a data table using the integers from 1 to 50 as the independent variable (X) and have calculated the dependent variable values (Y) for several simple functions.
Las Positas College Vacuum Technology 60A & 60B
Page 19 Rights Reserved, Biltoft, Benapfl, and Swain Fall 2002
X Y=1/X Y=X^2 Y=X^3 Y=Log(X) Y=Exp(X)
0 0 0 1.00E+001 1.0000 1 1 0.000 2.72E+002 0.5000 4 8 0.301 7.39E+003 0.3333 9 27 0.477 2.01E+014 0.2500 16 64 0.602 5.46E+015 0.2000 25 125 0.699 1.48E+026 0.1667 36 216 0.778 4.03E+027 0.1429 49 343 0.845 1.10E+038 0.1250 64 512 0.903 2.98E+039 0.1111 81 729 0.954 8.10E+03
10 0.1000 100 1000 1.000 2.20E+0411 0.0909 121 1331 1.041 5.99E+0412 0.0833 144 1728 1.079 1.63E+0513 0.0769 169 2197 1.114 4.42E+0514 0.0714 196 2744 1.146 1.20E+0615 0.0667 225 3375 1.176 3.27E+0616 0.0625 256 4096 1.204 8.89E+0617 0.0588 289 4913 1.230 2.42E+0718 0.0556 324 5832 1.255 6.57E+0719 0.0526 361 6859 1.279 1.78E+0820 0.0500 400 8000 1.301 4.85E+0821 0.0476 441 9261 1.322 1.32E+0922 0.0455 484 10648 1.342 3.58E+0923 0.0435 529 12167 1.362 9.74E+0924 0.0417 576 13824 1.380 2.65E+1025 0.0400 625 15625 1.398 7.20E+1026 0.0385 676 17576 1.415 1.96E+1127 0.0370 729 19683 1.431 5.32E+1128 0.0357 784 21952 1.447 1.45E+1229 0.0345 841 24389 1.462 3.93E+1230 0.0333 900 27000 1.477 1.07E+1331 0.0323 961 29791 1.491 2.90E+1332 0.0313 1024 32768 1.505 7.90E+1333 0.0303 1089 35937 1.519 2.15E+1434 0.0294 1156 39304 1.531 5.83E+1435 0.0286 1225 42875 1.544 1.59E+15

Las Positas College Vacuum Technology 60A & 60B
Page 20 Rights Reserved, Biltoft, Benapfl, and Swain Fall 2002
504030201000
10
20
30
40
50
Y = X
X
Y
Figure 1.1 The plot of Y=X
504030201000
500
1000
1500
2000
2500
Y = X^2
X
Y=X^
2
Figure1.2 The plot of Y=X2
Las Positas College Vacuum Technology 60A & 60B
Page 21 Rights Reserved, Biltoft, Benapfl, and Swain Fall 2002
504030201000
20000
40000
60000
80000
100000
120000
Y = X^3
X
Y =
X^3
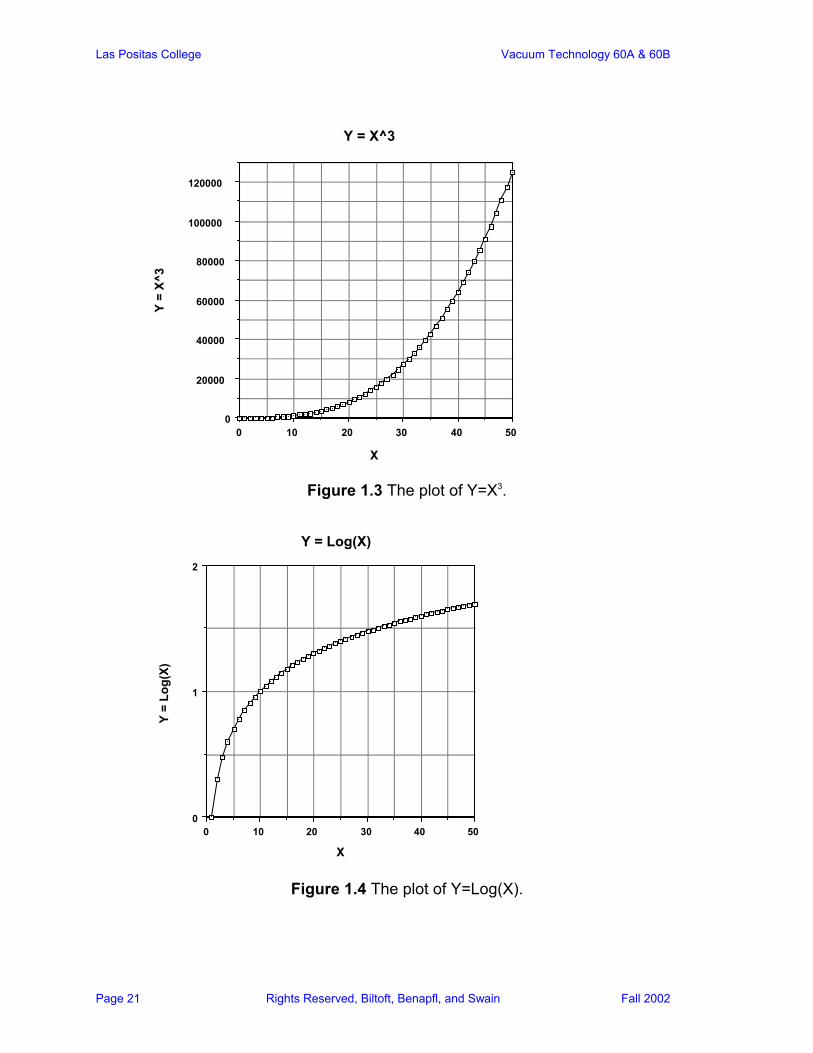
Figure 1.3 The plot of Y=X3.
504030201000
1
2
Y = Log(X)
X
Y =
Log(
X)
Figure 1.4 The plot of Y=Log(X).
Las Positas College Vacuum Technology 60A & 60B
Page 22 Rights Reserved, Biltoft, Benapfl, and Swain Fall 2002
15105010 0
10 1
10 2
10 3
10 4
10 5
10 6
10 7
Y = Exp(X)
X
Exp(
X)
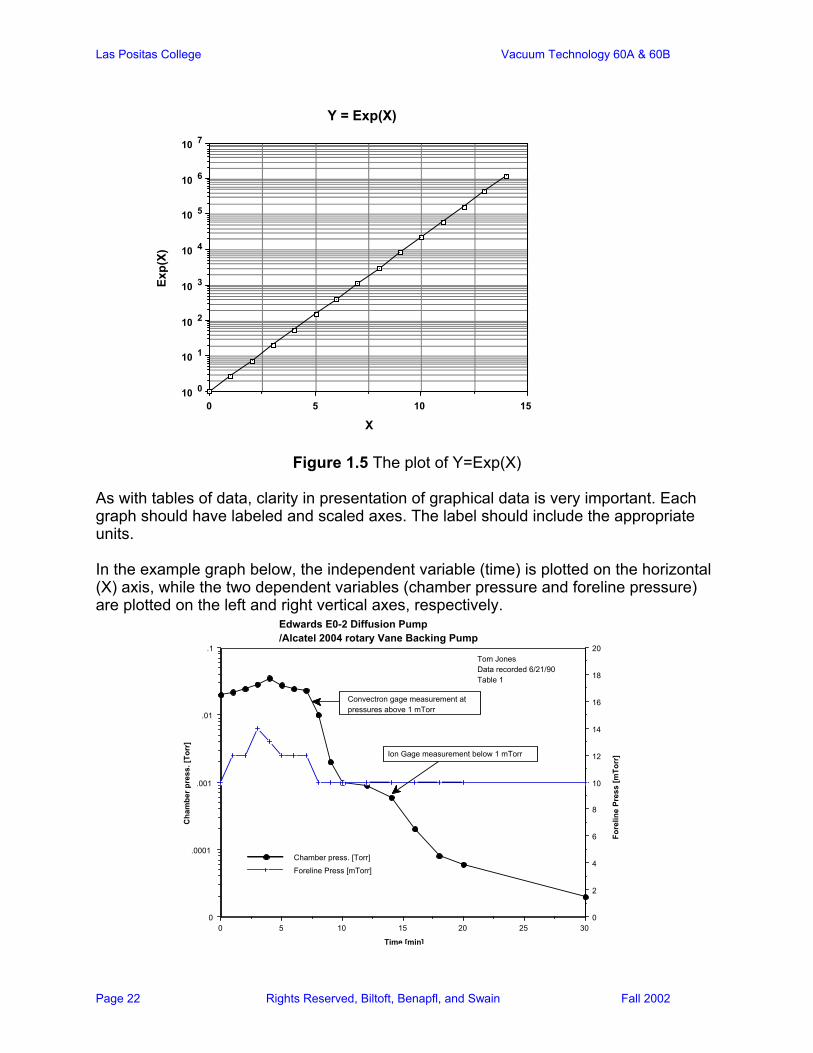
Figure 1.5 The plot of Y=Exp(X)
As with tables of data, clarity in presentation of graphical data is very important. Each graph should have labeled and scaled axes. The label should include the appropriate units. In the example graph below, the independent variable (time) is plotted on the horizontal (X) axis, while the two dependent variables (chamber pressure and foreline pressure) are plotted on the left and right vertical axes, respectively.
3025201510500
.0001
.001
.01
.1
0
2
4
6
8
10
12
14
16
18
20
Chamber press. [Torr]
Foreline Press [mTorr]
Edwards E0-2 Diffusion Pump /Alcatel 2004 rotary Vane Backing Pump
Time [min]
Cha
mbe
r pre
ss. [
Torr
]
Fore
line
Pres
s [m
Torr
]Ion Gage measurement below 1 mTorr
Convectron gage measurement at pressures above 1 mTorr
Tom JonesData recorded 6/21/90Table 1
Las Positas College Vacuum Technology 60A & 60B
Page 23 Rights Reserved, Biltoft, Benapfl, and Swain Fall 2002
For Further Reading: Mathematics- Technical Mathematics with Calculus, 2nd ed., Calter, Paul, Prentice Hall, Unglued Cliffs,
NJ, 1990. Statistics- Understanding Statistics, Mendenhall, and Ott, L., Duxbury Press, Div of Wadsworth
Publishing, Belmont, CA, 1972. Elementary Statistics, 3rd ed., Johnson, R.R., Duxbury Press, Div. of Wadsworth
Publishing, Belmont, CA, 1980. Physical Properties of Matter- CRC Handbook of Chemistry and Physics, Weast, R.C.,ed., CRC Press, Inc., Boca
Raton, FL, 70th edition, 1990. SI Units- ASTM Metric Practice Guide, (ASTM E 380-76), American Society for Testing Materials,
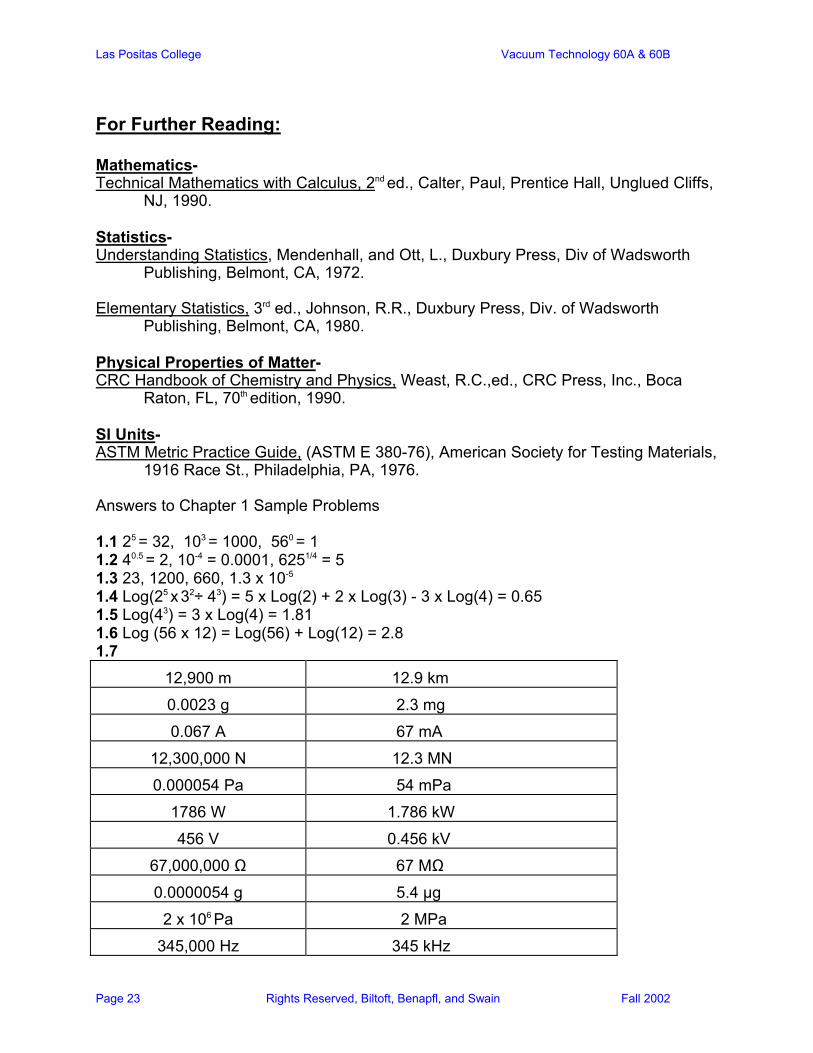
1916 Race St., Philadelphia, PA, 1976. Answers to Chapter 1 Sample Problems 1.1 25 = 32, 103 = 1000, 560 = 1 1.2 40.5 = 2, 10-4 = 0.0001, 6251/4 = 5 1.3 23, 1200, 660, 1.3 x 10⁻⁵ 1.4 Log(25 x 32÷ 43) = 5 x Log(2) + 2 x Log(3) - 3 x Log(4) = 0.65 1.5 Log(43) = 3 x Log(4) = 1.81 1.6 Log (56 x 12) = Log(56) + Log(12) = 2.8 1.7
12,900 m 12.9 km
0.0023 g 2.3 mg
0.067 A 67 mA
12,300,000 N 12.3 MN
0.000054 Pa 54 mPa
1786 W 1.786 kW
456 V 0.456 kV
67,000,000 Ω 67 MΩ
0.0000054 g 5.4 µg
2 x 10⁶ Pa 2 MPa
345,000 Hz 345 kHz
Las Positas College Vacuum Technology 60A & 60B
Page 24 Rights Reserved, Biltoft, Benapfl, and Swain Fall 2002
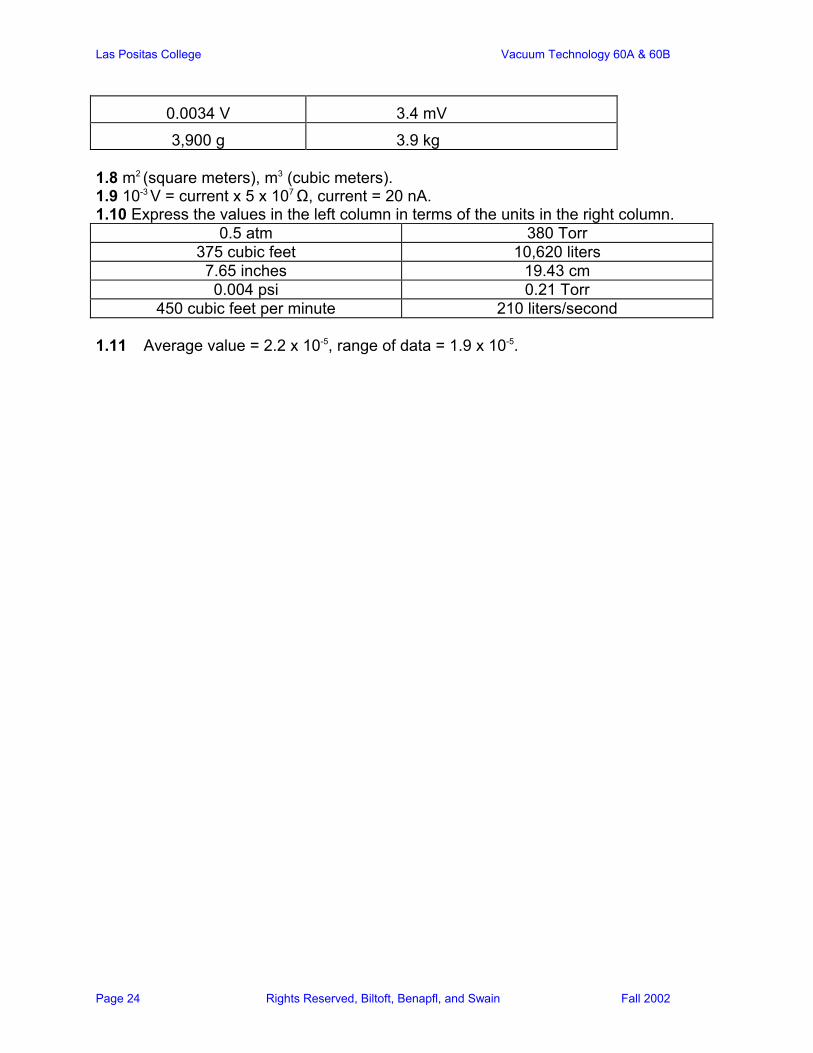
0.0034 V 3.4 mV
3,900 g 3.9 kg 1.8 m2 (square meters), m3 (cubic meters). 1.9 10-3 V = current x 5 x 10⁷ Ω, current = 20 nA. 1.10 Express the values in the left column in terms of the units in the right column.
0.5 atm 380 Torr 375 cubic feet 10,620 liters
7.65 inches 19.43 cm 0.004 psi 0.21 Torr
450 cubic feet per minute 210 liters/second 1.11 Average value = 2.2 x 10⁻⁵, range of data = 1.9 x 10⁻⁵.
Las Positas College Vacuum Technology 60A & 60B
Page 25 Rights Reserved, Biltoft, Benapfl, and Swain Fall 2002
Chapter 2: Safety Our concern for the safety of everyone participating in this laboratory course is paramount. To achieve this goal, the Vacuum Technology Laboratory has been equipped with such safety features as smoke detectors, automatic sprinklers, fire extinguishers, and a first aid kit. Exposure to liquid chemicals has been minimized by the use of OSHA approved containers and exhaust gases are removed through a special ventilation system. Please use these physical safety measures that have been provided as they were intended; if you do not understand their function or proper use, please ask an instructor. The information presented in this chapter is only a summary of the material we felt was most important to provide for student safety awareness. In the final assessment, each individual is responsible for the safety of everyone in the laboratory.
Physical Safety Eyes: Approved laboratory safety glasses (available at the bookstore) are required to be worn whenever any experimental work is being conducted in the laboratory. If you would like to use some of the laboratory time to perform calculations or plot data, we suggest moving to the campus library (it will be quieter there anyway). Clothing: Many of the experiments involve the use of motor driven mechanical pumps. It is strongly encouraged that no excessively loose fitting clothing (ie: neckties, scarves, very loose shirt sleeves) be worn while working on this equipment. Long hair that may be caught in the pulley of a mechanical pump is also a possible hazard; please tie back or otherwise prevent long hair from being entangled in any motorized device. Skin Rupture: Sharp objects, including tools and vacuum system components may, if used or handled incorrectly result in tearing the skin. Beyond the physical discomfort of such an occurrence, there exists a real danger of injection of chemicals and infection. If a skin rupture occurs, immediately flush the area with clean water and apply pressure using a clean cloth or towel, if bleeding is profuse, notify the instructor and if necessary, go to the school infirmary. An injured person should be accompanied to the infirmary either by another student or an instructor. Sample Problem: 2.1 List three possible ways in which equipment (vacuum vessels, pressure vessels, etc.) could fail causing projectiles to be scattered in the laboratory.
Electrical Safety
Electric shock is a major cause of fatalities at R&D and production facilities. Surprisingly, the most likely victim of an electrical accident is an experienced person with the equipment being used. Electricity is used to power some portion of every experiment that will be performed in this laboratory course. Generally, this electrical energy is well contained, so we are protected from its effects, and may become
Las Positas College Vacuum Technology 60A & 60B
Page 26 Rights Reserved, Biltoft, Benapfl, and Swain Fall 2002
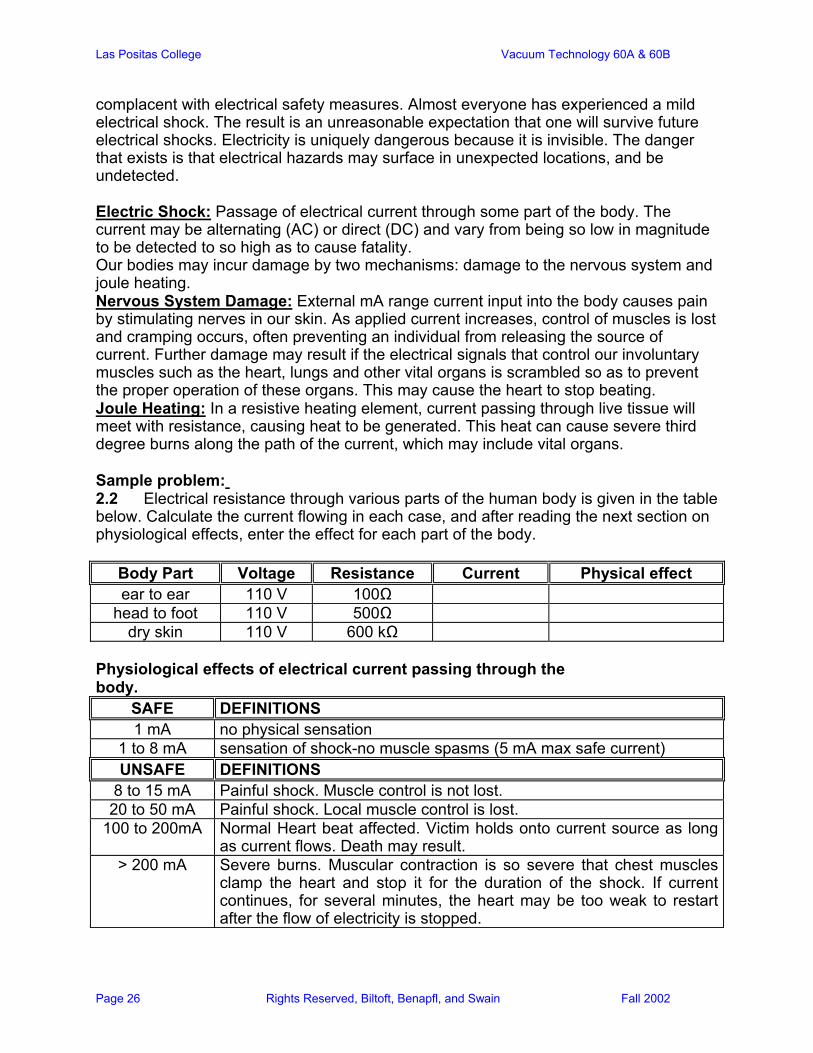
complacent with electrical safety measures. Almost everyone has experienced a mild electrical shock. The result is an unreasonable expectation that one will survive future electrical shocks. Electricity is uniquely dangerous because it is invisible. The danger that exists is that electrical hazards may surface in unexpected locations, and be undetected. Electric Shock: Passage of electrical current through some part of the body. The current may be alternating (AC) or direct (DC) and vary from being so low in magnitude to be detected to so high as to cause fatality. Our bodies may incur damage by two mechanisms: damage to the nervous system and joule heating. Nervous System Damage: External mA range current input into the body causes pain by stimulating nerves in our skin. As applied current increases, control of muscles is lost and cramping occurs, often preventing an individual from releasing the source of current. Further damage may result if the electrical signals that control our involuntary muscles such as the heart, lungs and other vital organs is scrambled so as to prevent the proper operation of these organs. This may cause the heart to stop beating. Joule Heating: In a resistive heating element, current passing through live tissue will meet with resistance, causing heat to be generated. This heat can cause severe third degree burns along the path of the current, which may include vital organs. Sample problem: 2.2 Electrical resistance through various parts of the human body is given in the table below. Calculate the current flowing in each case, and after reading the next section on physiological effects, enter the effect for each part of the body.
Body Part Voltage Resistance Current Physical effect ear to ear 110 V 100Ω
head to foot 110 V 500Ω dry skin 110 V 600 kΩ
Physiological effects of electrical current passing through the body.
SAFE DEFINITIONS 1 mA no physical sensation
1 to 8 mA sensation of shock-no muscle spasms (5 mA max safe current) UNSAFE DEFINITIONS
8 to 15 mA Painful shock. Muscle control is not lost. 20 to 50 mA Painful shock. Local muscle control is lost.
100 to 200mA Normal Heart beat affected. Victim holds onto current source as long as current flows. Death may result.
> 200 mA Severe burns. Muscular contraction is so severe that chest muscles clamp the heart and stop it for the duration of the shock. If current continues, for several minutes, the heart may be too weak to restart after the flow of electricity is stopped.
Las Positas College Vacuum Technology 60A & 60B
Page 27 Rights Reserved, Biltoft, Benapfl, and Swain Fall 2002
What to do in the case of a severe electrical shock: 1) Call for help immediately. Call loudly to other people in the immediate area. Have a person telephone for emergency medical services, specifying the incident and location. 2) Rescue the victim. Locate and safely de-energize the source of electrical power. Take extreme caution not to expose yourself to the electrical hazard. If necessary, use an insulated implement (dry broom handle) to remove the victim from the current source. 3) Apply CPR. Apply CPR as soon as possible if the victim is not breathing. 4) Continue to give aid. Continue CPR Until a medical rescue team arrives. Electrical shock victims have been revived from up to an hour after the electrical shock occurred. 5) Get the victim medical attention. Even if the victim appears to have recovered, a professional medical examination is required to check for invisible internal injuries.
Basics of Electricity
Electrical energy: The flow of electrons in a conductor.
Potential: The ability of an electric field to do work; the ability to cause motion of a charge. Electrical potential is expressed in volts (V).
Current: The flow of electrons; expressed in amperes (A).
Resistance: The degree to which a material allows the flow of electrons; units: ohms (Ω).
Power: The time rate of energy transport or transformation; watts (W).
Frequency: Number of periods of a wave form per unit time; hertz (Hz).
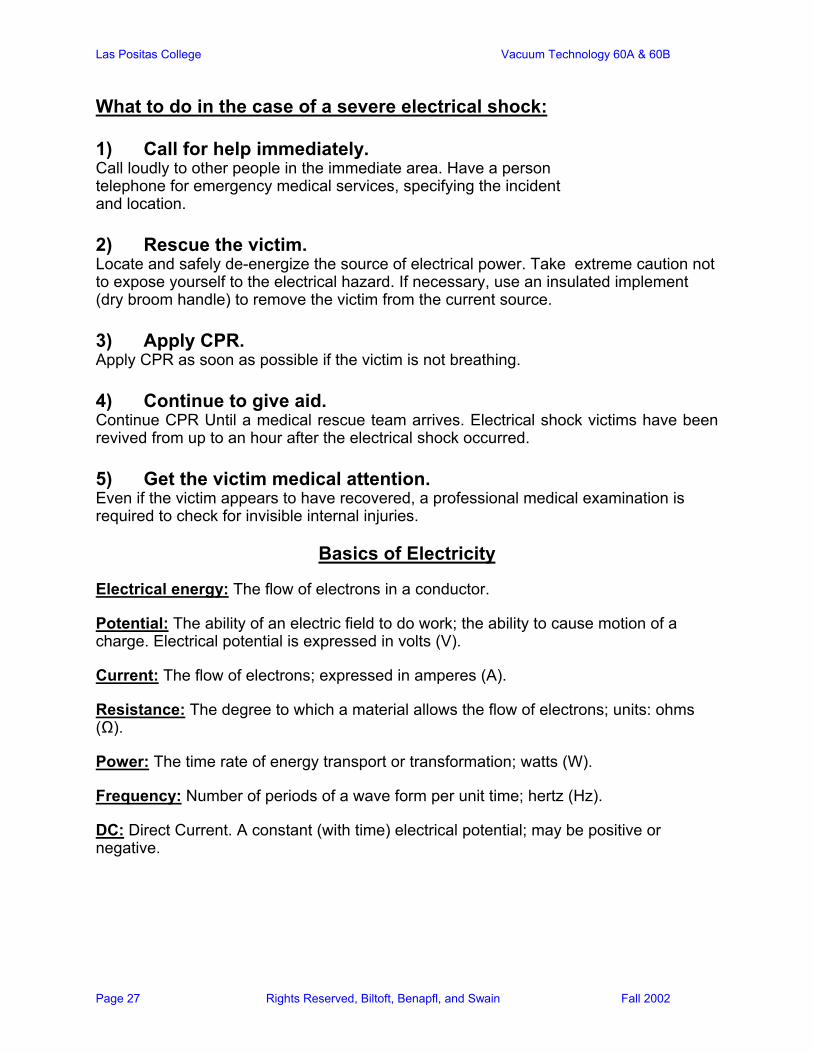
DC: Direct Current. A constant (with time) electrical potential; may be positive or negative.
Las Positas College Vacuum Technology 60A & 60B
Page 28 Rights Reserved, Biltoft, Benapfl, and Swain Fall 2002
0
Time
DC
Volta
ge
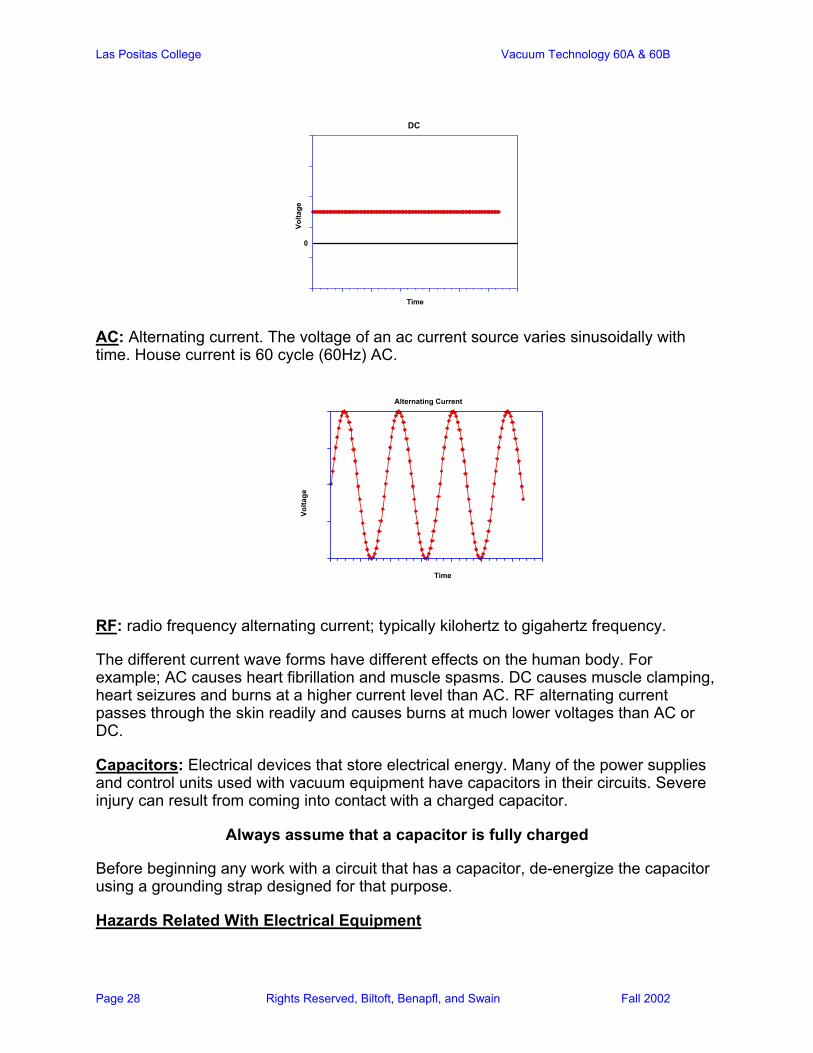
AC: Alternating current. The voltage of an ac current source varies sinusoidally with time. House current is 60 cycle (60Hz) AC.
Time
Alternating Current
Volta
ge
RF: radio frequency alternating current; typically kilohertz to gigahertz frequency.
The different current wave forms have different effects on the human body. For example; AC causes heart fibrillation and muscle spasms. DC causes muscle clamping, heart seizures and burns at a higher current level than AC. RF alternating current passes through the skin readily and causes burns at much lower voltages than AC or DC.
Capacitors: Electrical devices that store electrical energy. Many of the power supplies and control units used with vacuum equipment have capacitors in their circuits. Severe injury can result from coming into contact with a charged capacitor.
Always assume that a capacitor is fully charged
Before beginning any work with a circuit that has a capacitor, de-energize the capacitor using a grounding strap designed for that purpose.
Hazards Related With Electrical Equipment
Las Positas College Vacuum Technology 60A & 60B
Page 29 Rights Reserved, Biltoft, Benapfl, and Swain Fall 2002
Fire: Many fires are initiated by electrical causes. Be familiar with appropriate electrical fire extinguishing techniques. Fire extinguishers have information on their labels regarding their proper use, read the label before the emergency.
Toxic gas evolution: Electrical energy may cause the chemical breakdown of insulating materials and the decomposition of gases (creating ozone for example). In addition, older capacitors may contain toxic PCB's.
X-rays: High voltage applied under vacuum will almost always result in the generation of X-rays. Appropriate shielding is necessary to reduce radiation exposure to an acceptable level.
Bright light: Sparks and arcs can cause severe eye damage.
Radiation: Microwave and RF radiation from electronic devices can be a health hazard, especially over a long periods of exposure.
General Safety Criteria for Design and Construction of Electrically Powered Laboratory Equipment:
1) Buy good equipment (UL listed); use equipment suited for the application (rated for service).
2) Provide physical barriers to prevent personnel from contacting energized conductors; enclose equipment operating above 50 volts.
3) Enclose and install interlocks to prevent serious electrical hazards from access while energized.
4) Identify hazardous areas with warning signs and flashing lights.
5) Design systems to fail in a safe mode.
6) Design equipment to allow adequate access for maintenance; allow for emergency exits; maintain access to labeled breaker boxes.
7) Provide sufficient lighting and ventilation.
8) Prevent exposure of personnel or electrical components to water and provide proper drainage to prevent water accumulation.
9) Provide adequate grounding to all metal enclosures, equipment, cabinets, and structural components; use low impedance (resistance) conductors rated for the maximum possible current.
10) Provide safety ground hooks in the vicinity of all high voltage equipment that is accessed frequently.
Las Positas College Vacuum Technology 60A & 60B
Page 30 Rights Reserved, Biltoft, Benapfl, and Swain Fall 2002
11) Install emergency shut-down switches in the location of system operation.
12) For energy storage devices, provide convenient discharge points for contact with a ground hook.
13) Provide power disconnection's for all electrical equipment; label disconnects.
14) Have electrical designs reviewed, document designs and reviews.
Characteristics of Electrical Equipment Used in Vacuum Technology
Sample Problem: 2.3 Use any resources available (manuals, equipment tags, etc. to complete the following table. Equipment Name AC/DC Max. current Max. voltage Max. powerMechanical pump Diffusion pump Sputter-ion pump Resistance evap. power sup. Sputter power supply Ion gage controller
Chemical Safety
Some of the materials (solids, liquids, and gases) you may encounter are chemical health hazards. Examples are chlorinated and fluorinated solvents, and mercury. Care must be taken to store, use and dispose of chemicals in a safe and environmentally sound manner. Specific details for the proper handling of chemicals must be researched using materials safety data sheets (MSDS). All chemical producers are required by federal law to supply an MSDS for their products upon request. Organic solvents: In this laboratory organic solvents are stored in OSHA approved fire safe red metal cabinets. Transfer the minimum amount of the appropriate solvent to a suitable container (ie: glass beaker) for use near the experiment. Do not expose flammable solvents to sparks, hot surfaces or open flames. Use these solvents only in a well ventilated area. Prevent exposure or contact of solvents to the skin. After use, return the unused (clean) solvent to the red metal storage can. Allow any rags saturated with solvent to dry thoroughly then dispose of in a fire safe container. Mercury: The use of mercury in vacuum technology has greatly diminished, but one should still be aware of the hazards involved with the use of this element. Mercury has an appreciable equilibrium vapor pressure under laboratory room conditions (2x10⁻³ Torr). The toxic effects of mercury are cumulative, and cause irreversible damage to the brain and kidneys. Mercury should be stored in a tightly sealed non- breakable
Las Positas College Vacuum Technology 60A & 60B
Page 31 Rights Reserved, Biltoft, Benapfl, and Swain Fall 2002
container (polypropylene) and handled so as to minimize contact with skin, ingestion and inhalation of its odorless vapor.
Mechanical Safety
Pneumatic Lines: Compressed air often provides a robust and compact energy source for the actuation of vacuum valves and other pneumatic devices. This is often provided at a pressure between 70 and 120 PSIG. Always wear safety glasses when working around live pneumatic lines, as plastic tubes carrying this pressure can whip through the air wildly if they become disconnected. Never attempt to cover the end of a line with your finger tip, as air can be directly injected through the skin into the body with painful or even fatal results.
Vacuum Gate valves: These often generate high actuation forces and one should never reach through a gate valve without first disconnecting the pneumatics. Gate valves are often actuated with a small electropneumatic pilot valve (frequently referred to as a solenoid) that frequently require continuous power to remain open. A PG&E power failure at eactly the wrong moment could crush bone or even cause dismemberment.
Thermal Safety
Some of the equipment involved in vacuum technology operates at extremely high or extremely low temperatures and requires some attention to safety.
Equipment operating at high temperature: Diffusion pumps and evaporation processes. Second and third degree burns may occur if skin comes into contact with this equipment.
Equipment operating at moderately high temperature: Mechanical pumps, power supplies and electronic components.
Equipment operating at low temperature: Cold traps(LN2), cryosorption pumps, cryogenic pumps, liquid helium lines, and helium compressors.
Las Positas College Vacuum Technology 60A & 60B
Page 32 Rights Reserved, Biltoft, Benapfl, and Swain Fall 2002
Answers to Sample Problems:
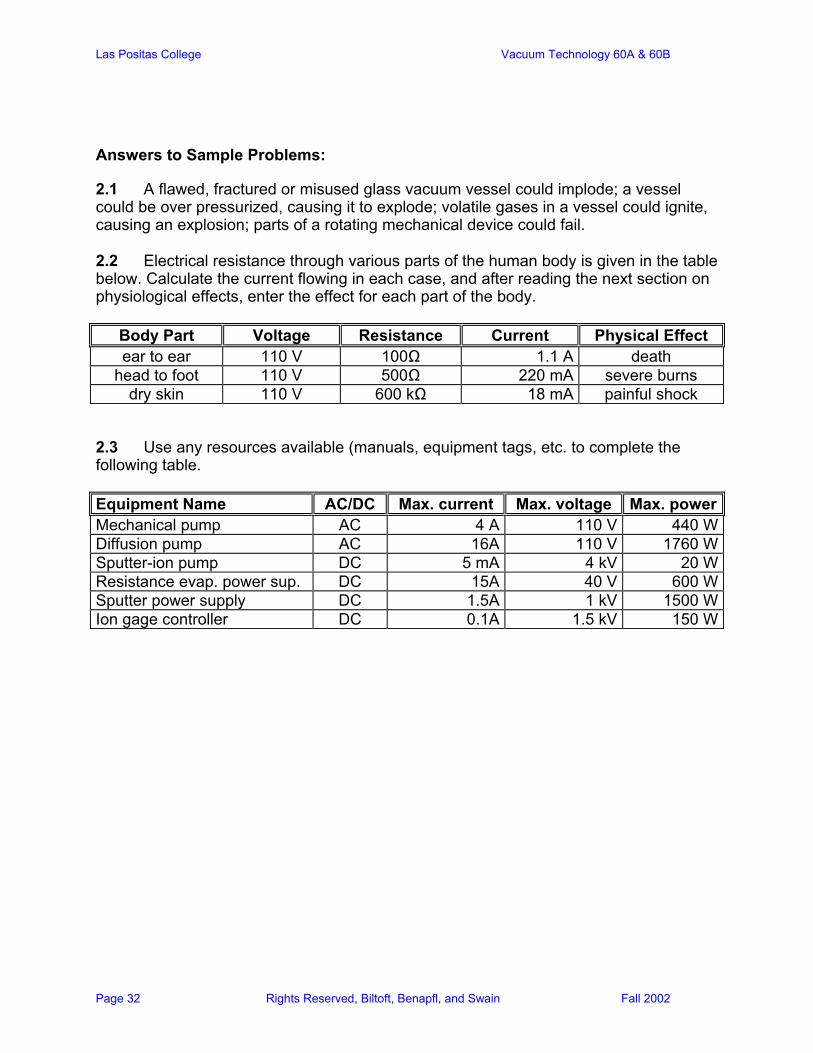
2.1 A flawed, fractured or misused glass vacuum vessel could implode; a vessel could be over pressurized, causing it to explode; volatile gases in a vessel could ignite, causing an explosion; parts of a rotating mechanical device could fail. 2.2 Electrical resistance through various parts of the human body is given in the table below. Calculate the current flowing in each case, and after reading the next section on physiological effects, enter the effect for each part of the body.
Body Part Voltage Resistance Current Physical Effect ear to ear 110 V 100Ω 1.1 A death
head to foot 110 V 500Ω 220 mA severe burns dry skin 110 V 600 kΩ 18 mA painful shock
2.3 Use any resources available (manuals, equipment tags, etc. to complete the following table. Equipment Name AC/DC Max. current Max. voltage Max. powerMechanical pump AC 4 A 110 V 440 WDiffusion pump AC 16A 110 V 1760 WSputter-ion pump DC 5 mA 4 kV 20 WResistance evap. power sup. DC 15A 40 V 600 WSputter power supply DC 1.5A 1 kV 1500 WIon gage controller DC 0.1A 1.5 kV 150 W
Las Positas College Vacuum Technology 60A & 60B
Page 33 Rights Reserved, Biltoft, Benapfl, and Swain Fall 2002
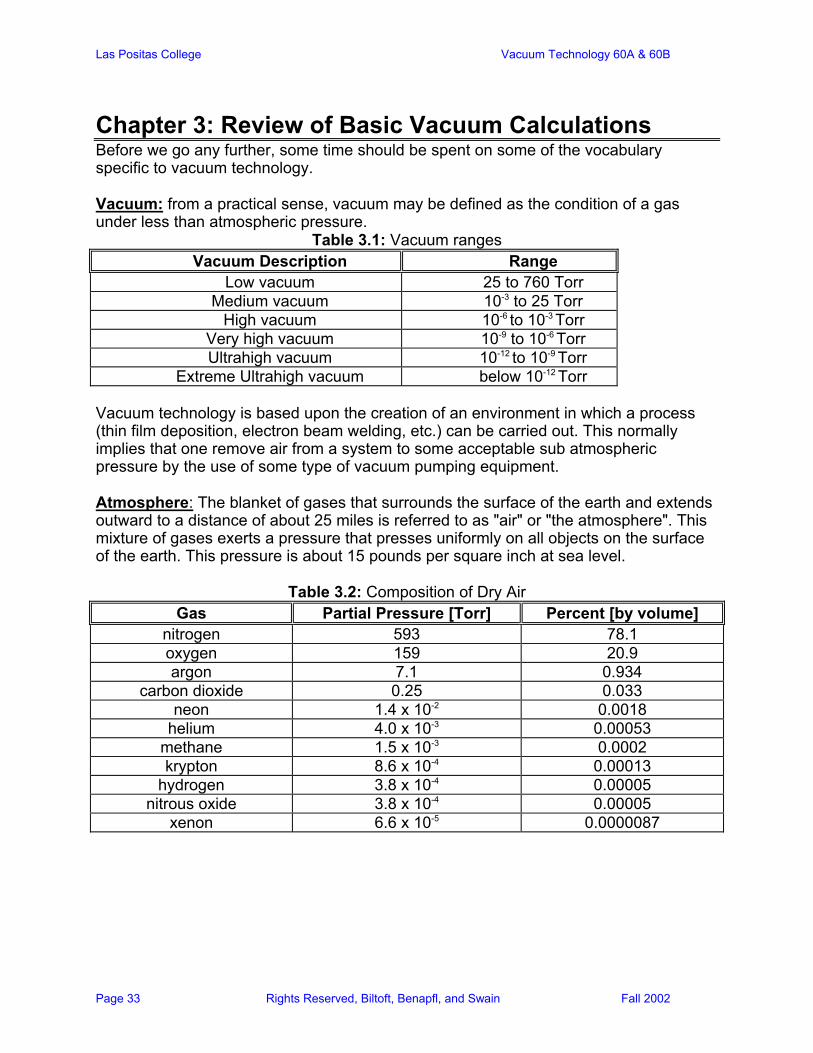
Chapter 3: Review of Basic Vacuum Calculations Before we go any further, some time should be spent on some of the vocabulary specific to vacuum technology. Vacuum: from a practical sense, vacuum may be defined as the condition of a gas under less than atmospheric pressure.
Table 3.1: Vacuum ranges Vacuum Description Range
Low vacuum 25 to 760 Torr Medium vacuum 10-3 to 25 Torr
High vacuum 10-6 to 10-3 Torr Very high vacuum 10-9 to 10-6 Torr Ultrahigh vacuum 10-12 to 10-9 Torr
Extreme Ultrahigh vacuum below 10-12 Torr Vacuum technology is based upon the creation of an environment in which a process (thin film deposition, electron beam welding, etc.) can be carried out. This normally implies that one remove air from a system to some acceptable sub atmospheric pressure by the use of some type of vacuum pumping equipment. Atmosphere: The blanket of gases that surrounds the surface of the earth and extends outward to a distance of about 25 miles is referred to as "air" or "the atmosphere". This mixture of gases exerts a pressure that presses uniformly on all objects on the surface of the earth. This pressure is about 15 pounds per square inch at sea level.
Table 3.2: Composition of Dry Air Gas Partial Pressure [Torr] Percent [by volume]
nitrogen 593 78.1 oxygen 159 20.9 argon 7.1 0.934
carbon dioxide 0.25 0.033 neon 1.4 x 10⁻² 0.0018
helium 4.0 x 10⁻³ 0.00053 methane 1.5 x 10⁻³ 0.0002 krypton 8.6 x 10⁻⁴ 0.00013
hydrogen 3.8 x 10⁻⁴ 0.00005 nitrous oxide 3.8 x 10⁻⁴ 0.00005
xenon 6.6 x 10⁻⁵ 0.0000087
Las Positas College Vacuum Technology 60A & 60B
Page 34 Rights Reserved, Biltoft, Benapfl, and Swain Fall 2002
Properties of Systems Under Vacuum
If we remove some amount of atmospheric gas from a leak-free vessel we will have created an environment that is drastically different in many respects: mechanically, chemically and physically. Mechanical Effects of Vacuum: Have you ever placed a half full 2 liter plastic soft drink container that is at room temperature into a refrigerator, and noticed later after it has cooled that its sides are distorted and pulled inwards? What you have inadvertently done is create a condition in which the internal pressure of the plastic container was reduced, causing its surface to buckle. Vacuum engineers are acutely aware of this phenomenon, and design vacuum vessels to be sturdy enough to withstand the external atmospheric pressure of 14.7 pounds per square inch (at sea level) in the absence of compensating internal pressure. Structures and components that are particularly susceptible to distortion under vacuum conditions include flat, unsupported surfaces, thin sections, and flexible lines or bellows. Sample Problem: 3.1 Calculate the approximate total force that will be exerted on a 4" diameter glass view port used in a vessel under high vacuum conditions. Chemical Effects of Vacuum: The removal of gases from a container will reduce the number of gas atoms that are available to interact with materials in the container. For this reason many materials that are hydroscopic (have a tendency to absorb water from the atmosphere) are stored under vacuum. Materials that readily oxidize are also often stored either under high vacuum, or in an inert atmosphere (nitrogen or argon gas) after the air has been removed from the storage vessel. Sample Problem: 3.2 List as many reactive elements or compounds that you know of which you would consider storing under vacuum or inert gas conditions. Physical Effects of Vacuum: Many of the physical properties of gases are strongly affected by the pressure of the gas. Thermal conductivity, electrical conductivity, propagation of sound, optical transmission, optical absorption are just a few. In addition to the effect of reduced pressure on the physical properties of gases, under vacuum solids and liquids also show markedly different behavior. Liquids, such as water, can be made to boil in a vacuum vessel without the application of heat. This occurs as soon as the vapor pressure of the water exceeds that of the vacuum environment.. Similarly, atoms of solid material under vacuum conditions will spontaneously leave the surface of the solid. The rate at which materials vaporize under vacuum is a function of the pressure in the system and the vapor pressure of the material. A more in-depth discussion of vapor pressure will be presented later. Sample Problem: 3.3 We have suggested that physical changes in the thermal and electrical conduction of gases are brought about by a decrease in pressure. What are the trends
Las Positas College Vacuum Technology 60A & 60B
Page 35 Rights Reserved, Biltoft, Benapfl, and Swain Fall 2002
you would expect in these two physical characteristics as pressure is decreased from atmospheric? (Increase or decrease?)
Gas Laws Gases are composed of independent, randomly moving atoms or molecules that spontaneously expand to fill any container. The collective behavior of these atoms or molecules in a contained volume can be described when one knows any three of the four following quantities: 1. Pressure: The force per unit area a gas exerts on its surroundings. (in our
calculations we will use primarily Torr or atmospheres). 2. Volume: The internal capacity of a container, or vessel. (Liters) 3. Temperature: The temperature of a gas is a function of its kinetic energy, that
is, how vigorously the gas atoms are vibrating. Temperature must be specified in terms of an absolute temperature scale. We will use the kelvin scale (K=°C + 273).
4. Amount: The number of gas atoms in a volume (can be in terms of atoms
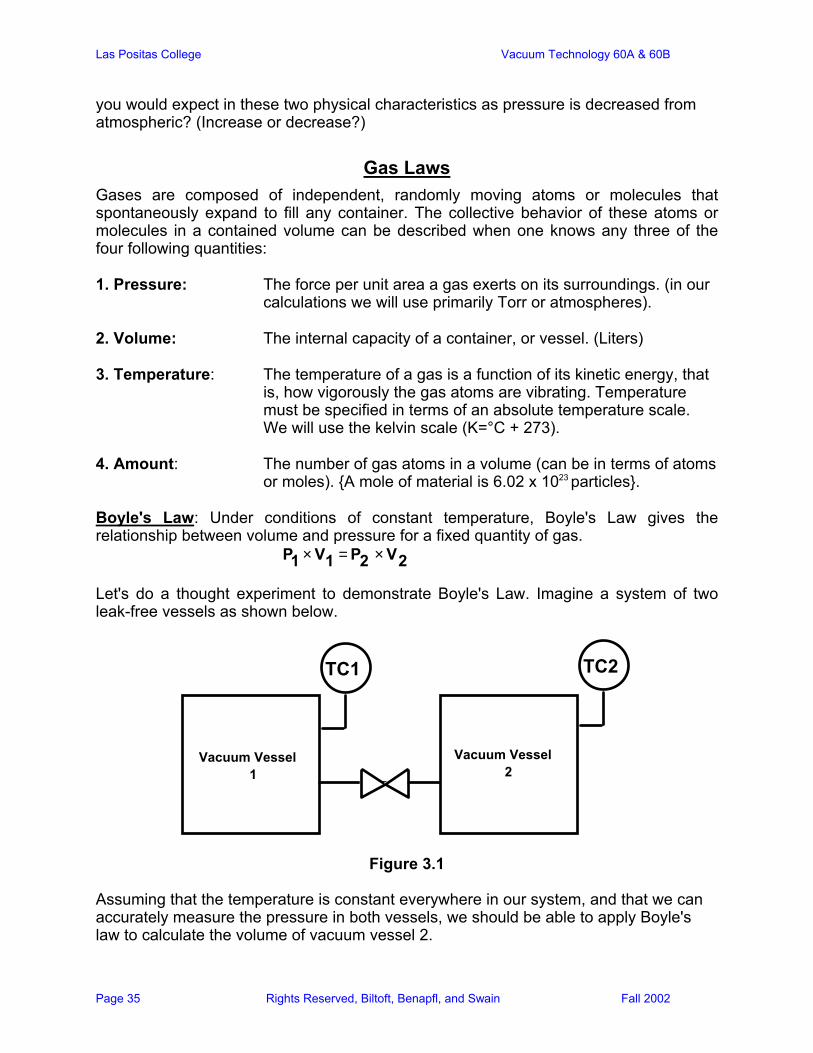
or moles). A mole of material is 6.02 x 10²³ particles. Boyle's Law: Under conditions of constant temperature, Boyle's Law gives the relationship between volume and pressure for a fixed quantity of gas.
P1 × V1 = P2 × V2 Let's do a thought experiment to demonstrate Boyle's Law. Imagine a system of two leak-free vessels as shown below.
Vacuum Vessel
2
TC2
Vacuum Vessel
1
TC1
Figure 3.1
Assuming that the temperature is constant everywhere in our system, and that we can accurately measure the pressure in both vessels, we should be able to apply Boyle's law to calculate the volume of vacuum vessel 2.
Las Positas College Vacuum Technology 60A & 60B
Page 36 Rights Reserved, Biltoft, Benapfl, and Swain Fall 2002
If we know that at the beginning of our experiment the volume of vessel 1 is 120 liters, and the pressure of gas inside vessel 1 is 760 Torr, and that vacuum vessel 2 has been rough pumped to about 10 mTorr we can write:
P1= 760 Torr V1= 120 Liters
Now, if we open the valve between vessels 1 and 2, and allow sufficient time for the system to equilibrate, we read pressures at TC1 and TC2 to be 500 Torr.
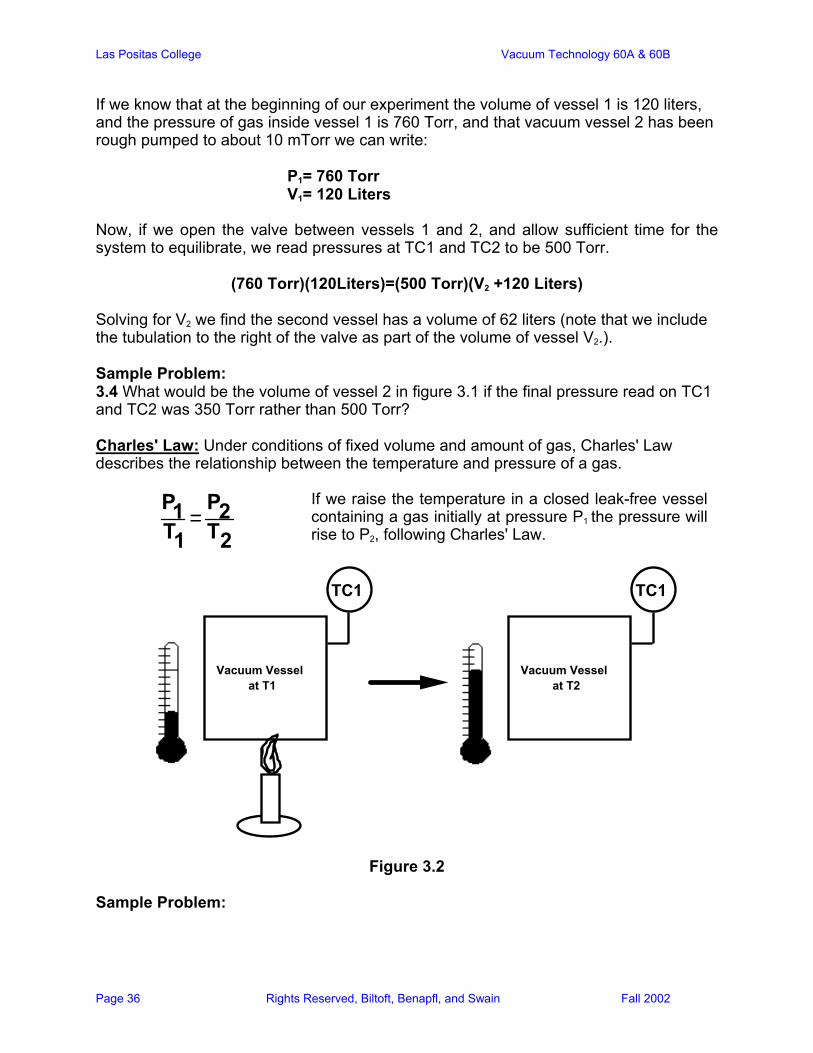
(760 Torr)(120Liters)=(500 Torr)(V2 +120 Liters) Solving for V2 we find the second vessel has a volume of 62 liters (note that we include the tubulation to the right of the valve as part of the volume of vessel V2.). Sample Problem: 3.4 What would be the volume of vessel 2 in figure 3.1 if the final pressure read on TC1 and TC2 was 350 Torr rather than 500 Torr? Charles' Law: Under conditions of fixed volume and amount of gas, Charles' Law describes the relationship between the temperature and pressure of a gas.
P1T1
=P2T2
If we raise the temperature in a closed leak-free vessel containing a gas initially at pressure P1 the pressure will rise to P2, following Charles' Law.
Vacuum Vessel
at T1
TC1
Vacuum Vessel
at T2
TC1
Figure 3.2
Sample Problem:

Las Positas College Vacuum Technology 60A & 60B
Page 37 Rights Reserved, Biltoft, Benapfl, and Swain Fall 2002
3.5 If the initial pressure and temperature of the leak-free vessel in figure 3.2 were 50 mTorr and 25 °C respectively, and the vessel was heated uniformly to 100 °C what would be the new pressure reading?
The Ideal Gas Law: The relationship between pressure, volume, amount of gas and temperature of gas for "ideal" gases is given by the Ideal gas law. Fortunately, most gases behave "ideally" under subatmospheric conditions.
PV nRT=
P= pressure [Atmospheres] V=volume [Liters] n=moles of gas [moles] R=Ideal gas Law constant (0.08206 L-atm/K-mole) T=absolute temperature [Kelvin]
Sample Problem: 3.6 If a 100 liter vessel at room temperature is evacuated to a pressure of 50 mTorr,
how many moles of gas are in the vessel? How many molecules is this? How many molecules per cubic centimeter is this?
Table 3.3: Quantities, Symbols and Units Quantity Symbol Unit
length L cm, m area A cm2, m2 volume V cm3, m3 diameter d cm, m mass m g time t sec,minute,hour amount of substance n mole thermodynamic temperature T k speed of particles in flow c cm/s,m/s dynamic viscosity η kg/m-s thermal conductivity λ W/m-k pressure (gas) P Torr, mTorr molar heat capacity (const press) Cp J/k-n molar heat capacity (const volume) Cv J/k-n Reynolds number RE Knudsen number Kn Avogadro constant NA 6.02 x 10²³ particles Gas Law constant R 0.059 L-atm/k-n velocity v cm/s, m/s mass flow rate qm g/s, kg/s impingement rate ZA cm-2-s-1 volume impingement rate ZV cm-3-s-1
Las Positas College Vacuum Technology 60A & 60B
Page 38 Rights Reserved, Biltoft, Benapfl, and Swain Fall 2002
volumetric flow rate qV cm3/s, m3/s quantity of gas (PV value) G Torr-L pumping speed (Volumetric flow) S L/s mass flow rate Q Torr-L/s conductance C L/s leak rate ql Torr-L/s molecular weight M g/n mean free path L cm number density of particles N cm-2
Kinetic Description of the Behavior of Gases As the name may suggest, the kinetic theory of gases has to do with describing how gases behave under the influence of external forces that induce motion. There are four basic assumptions that provide the foundation of the kinetic theory of gases:
1) Gases are comprised of a large number of extremely small particles (atoms or molecules).
2) These gas molecules are in constant, rapid motion in a chaotic manner. 3) The distances between individual gas molecules are large compared with
the diameter of the molecules. 4) The molecules exert no force on one another, or on the walls of a
container except during collisions.
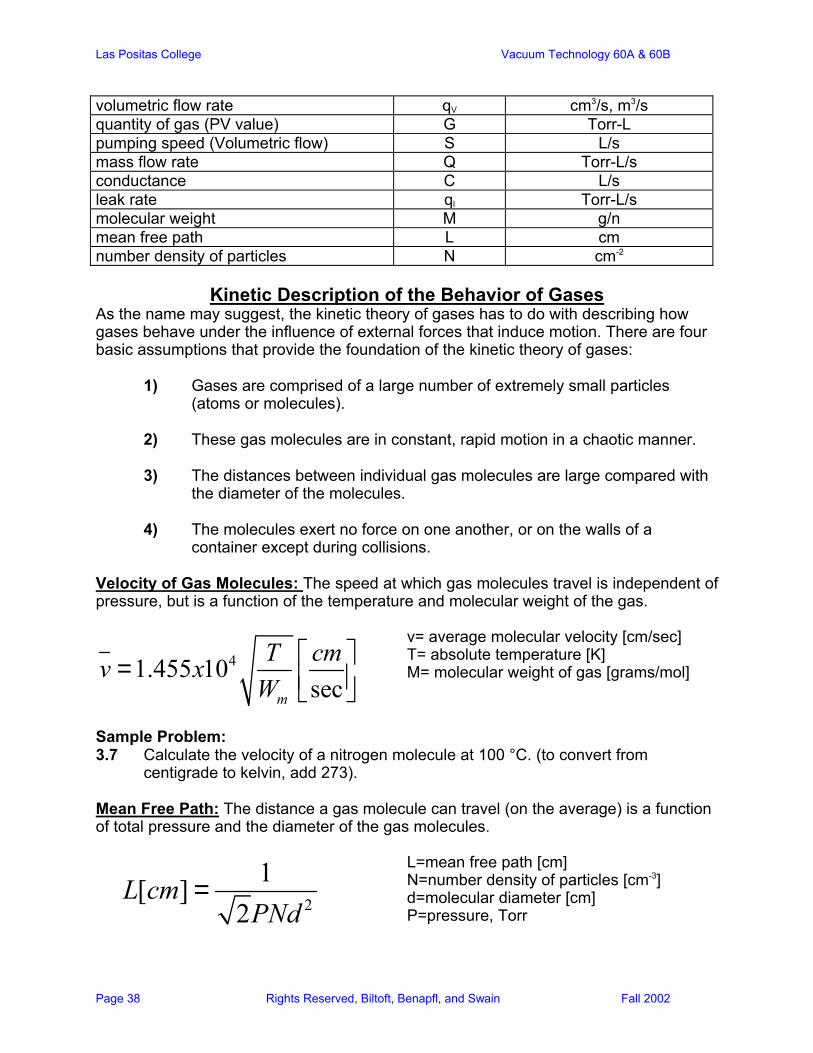
Velocity of Gas Molecules: The speed at which gas molecules travel is independent of pressure, but is a function of the temperature and molecular weight of the gas.
41.455 10secm
T cmv xW
=
v= average molecular velocity [cm/sec] T= absolute temperature [K] M= molecular weight of gas [grams/mol]
Sample Problem: 3.7 Calculate the velocity of a nitrogen molecule at 100 °C. (to convert from
centigrade to kelvin, add 273). Mean Free Path: The distance a gas molecule can travel (on the average) is a function of total pressure and the diameter of the gas molecules.
2
1[ ]2
L cmPNd
=
L=mean free path [cm] N=number density of particles [cm-3] d=molecular diameter [cm] P=pressure, Torr
Las Positas College Vacuum Technology 60A & 60B
Page 39 Rights Reserved, Biltoft, Benapfl, and Swain Fall 2002
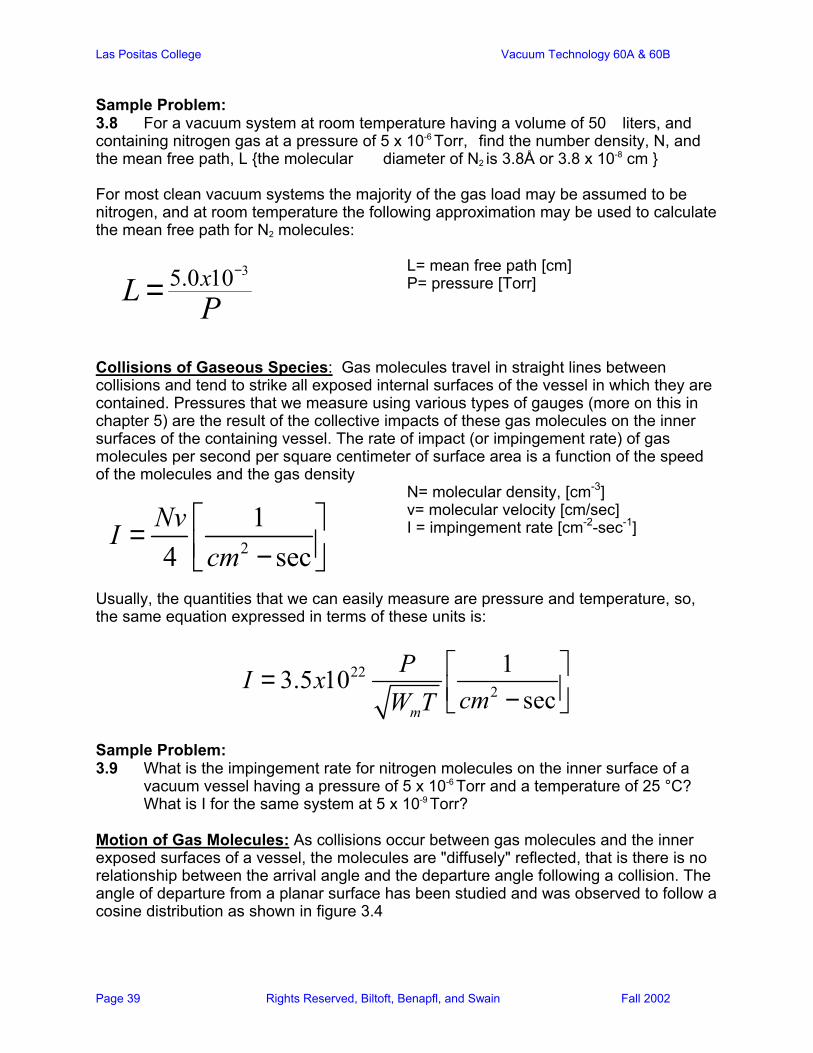
Sample Problem: 3.8 For a vacuum system at room temperature having a volume of 50 liters, and containing nitrogen gas at a pressure of 5 x 10⁻⁶ Torr, find the number density, N, and the mean free path, L the molecular diameter of N2 is 3.8Å or 3.8 x 10⁻⁸ cm For most clean vacuum systems the majority of the gas load may be assumed to be nitrogen, and at room temperature the following approximation may be used to calculate the mean free path for N2 molecules:
35.0 10xL P−
=
L= mean free path [cm] P= pressure [Torr]
Collisions of Gaseous Species: Gas molecules travel in straight lines between collisions and tend to strike all exposed internal surfaces of the vessel in which they are contained. Pressures that we measure using various types of gauges (more on this in chapter 5) are the result of the collective impacts of these gas molecules on the inner surfaces of the containing vessel. The rate of impact (or impingement rate) of gas molecules per second per square centimeter of surface area is a function of the speed of the molecules and the gas density
N= molecular density, [cm-3] v= molecular velocity [cm/sec] I = impingement rate [cm-2-sec-1]
Usually, the quantities that we can easily measure are pressure and temperature, so, the same equation expressed in terms of these units is:
222
13.5 10secm
PI xcmW T = −
Sample Problem: 3.9 What is the impingement rate for nitrogen molecules on the inner surface of a
vacuum vessel having a pressure of 5 x 10⁻⁶ Torr and a temperature of 25 °C? What is I for the same system at 5 x 10⁻⁹ Torr?
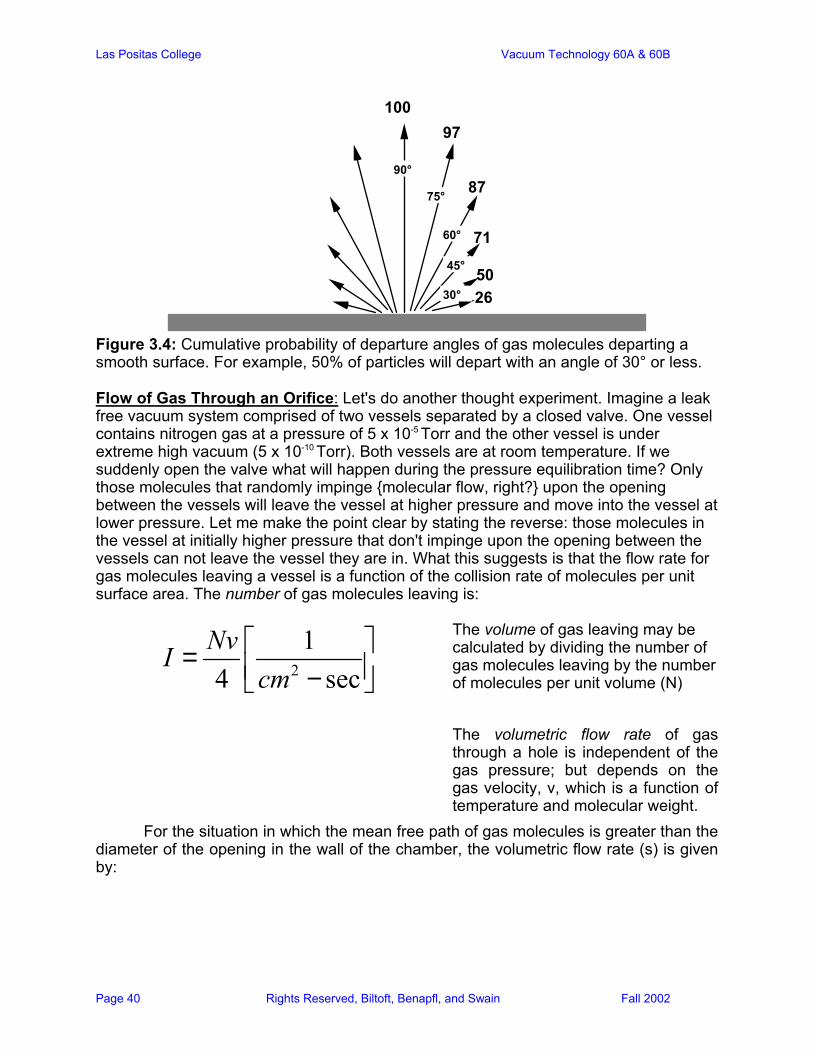
Motion of Gas Molecules: As collisions occur between gas molecules and the inner exposed surfaces of a vessel, the molecules are "diffusely" reflected, that is there is no relationship between the arrival angle and the departure angle following a collision. The angle of departure from a planar surface has been studied and was observed to follow a cosine distribution as shown in figure 3.4
2
14 secNvI
cm = −
Las Positas College Vacuum Technology 60A & 60B
Page 40 Rights Reserved, Biltoft, Benapfl, and Swain Fall 2002
10097
87
71
5026
90°
75°
60°
45°
30°
Figure 3.4: Cumulative probability of departure angles of gas molecules departing a smooth surface. For example, 50% of particles will depart with an angle of 30° or less.
Flow of Gas Through an Orifice: Let's do another thought experiment. Imagine a leak free vacuum system comprised of two vessels separated by a closed valve. One vessel contains nitrogen gas at a pressure of 5 x 10⁻⁵ Torr and the other vessel is under extreme high vacuum (5 x 10⁻¹⁰ Torr). Both vessels are at room temperature. If we suddenly open the valve what will happen during the pressure equilibration time? Only those molecules that randomly impinge molecular flow, right? upon the opening between the vessels will leave the vessel at higher pressure and move into the vessel at lower pressure. Let me make the point clear by stating the reverse: those molecules in the vessel at initially higher pressure that don't impinge upon the opening between the vessels can not leave the vessel they are in. What this suggests is that the flow rate for gas molecules leaving a vessel is a function of the collision rate of molecules per unit surface area. The number of gas molecules leaving is:
2
14 secNvI
cm = −
The volume of gas leaving may be calculated by dividing the number of gas molecules leaving by the number of molecules per unit volume (N)
The volumetric flow rate of gas through a hole is independent of the gas pressure; but depends on the gas velocity, v, which is a function of temperature and molecular weight.
For the situation in which the mean free path of gas molecules is greater than the diameter of the opening in the wall of the chamber, the volumetric flow rate (s) is given by:
Las Positas College Vacuum Technology 60A & 60B
Page 41 Rights Reserved, Biltoft, Benapfl, and Swain Fall 2002
41.455 104 m
v TS xW
= =
S= volumetric flow rate [L/s] T= absolute temperature [K] WM= molecular weight [g/mole]
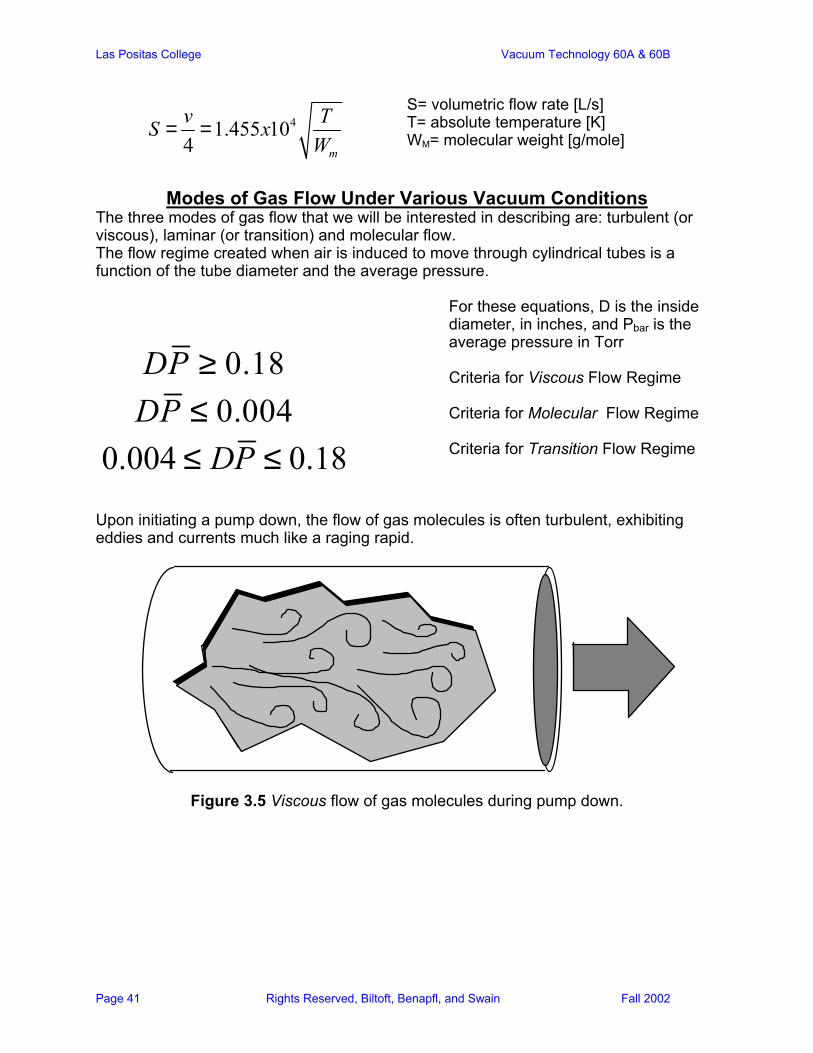
Modes of Gas Flow Under Various Vacuum Conditions The three modes of gas flow that we will be interested in describing are: turbulent (or viscous), laminar (or transition) and molecular flow. The flow regime created when air is induced to move through cylindrical tubes is a function of the tube diameter and the average pressure.
For these equations, D is the inside diameter, in inches, and Pbar is the average pressure in Torr Criteria for Viscous Flow Regime Criteria for Molecular Flow Regime Criteria for Transition Flow Regime
Upon initiating a pump down, the flow of gas molecules is often turbulent, exhibiting eddies and currents much like a raging rapid.
Figure 3.5 Viscous flow of gas molecules during pump down.
0.18DP ≥
0.004 0.18DP≤ ≤0.004DP ≤
Las Positas College Vacuum Technology 60A & 60B
Page 42 Rights Reserved, Biltoft, Benapfl, and Swain Fall 2002
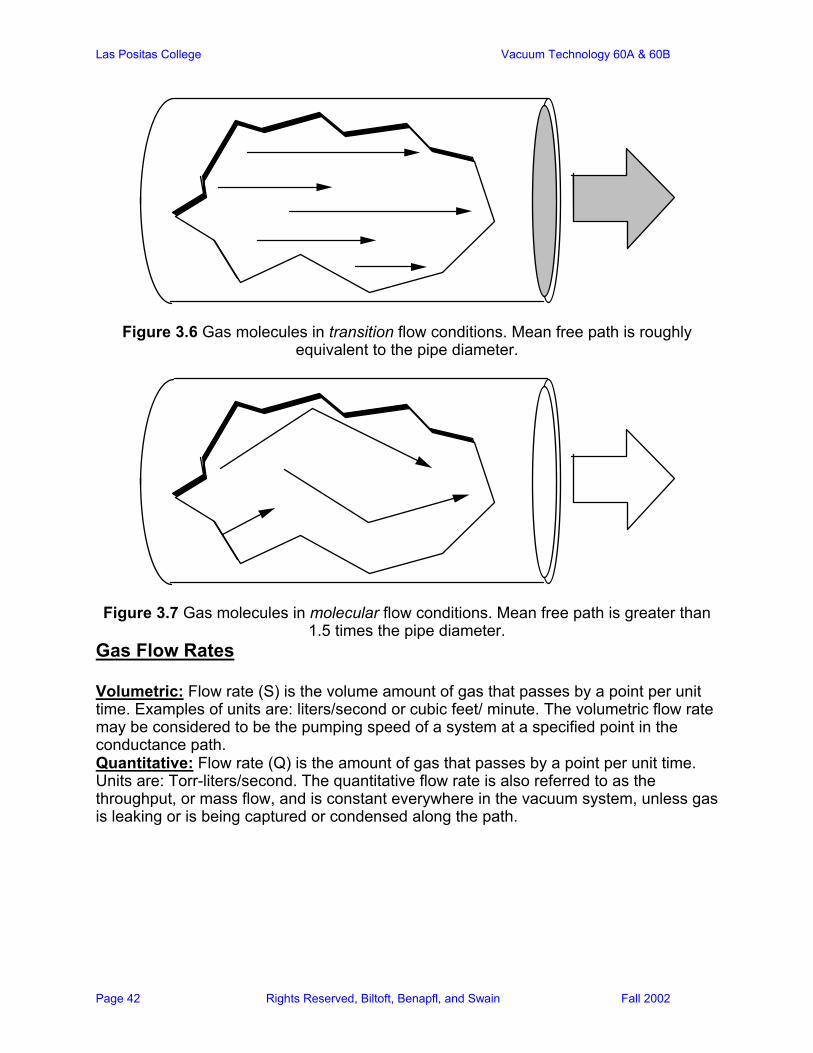
Figure 3.6 Gas molecules in transition flow conditions. Mean free path is roughly equivalent to the pipe diameter.
Figure 3.7 Gas molecules in molecular flow conditions. Mean free path is greater than 1.5 times the pipe diameter.
Gas Flow Rates Volumetric: Flow rate (S) is the volume amount of gas that passes by a point per unit time. Examples of units are: liters/second or cubic feet/ minute. The volumetric flow rate may be considered to be the pumping speed of a system at a specified point in the conductance path. Quantitative: Flow rate (Q) is the amount of gas that passes by a point per unit time. Units are: Torr-liters/second. The quantitative flow rate is also referred to as the throughput, or mass flow, and is constant everywhere in the vacuum system, unless gas is leaking or is being captured or condensed along the path.
Las Positas College Vacuum Technology 60A & 60B
Page 43 Rights Reserved, Biltoft, Benapfl, and Swain Fall 2002
foreline valve
Q
Q
Vacuum Chamber TC1
TC2
IG1 vent valvechamber rough valve
head gate valve
chamber vent
DP vent
IG2
TC3
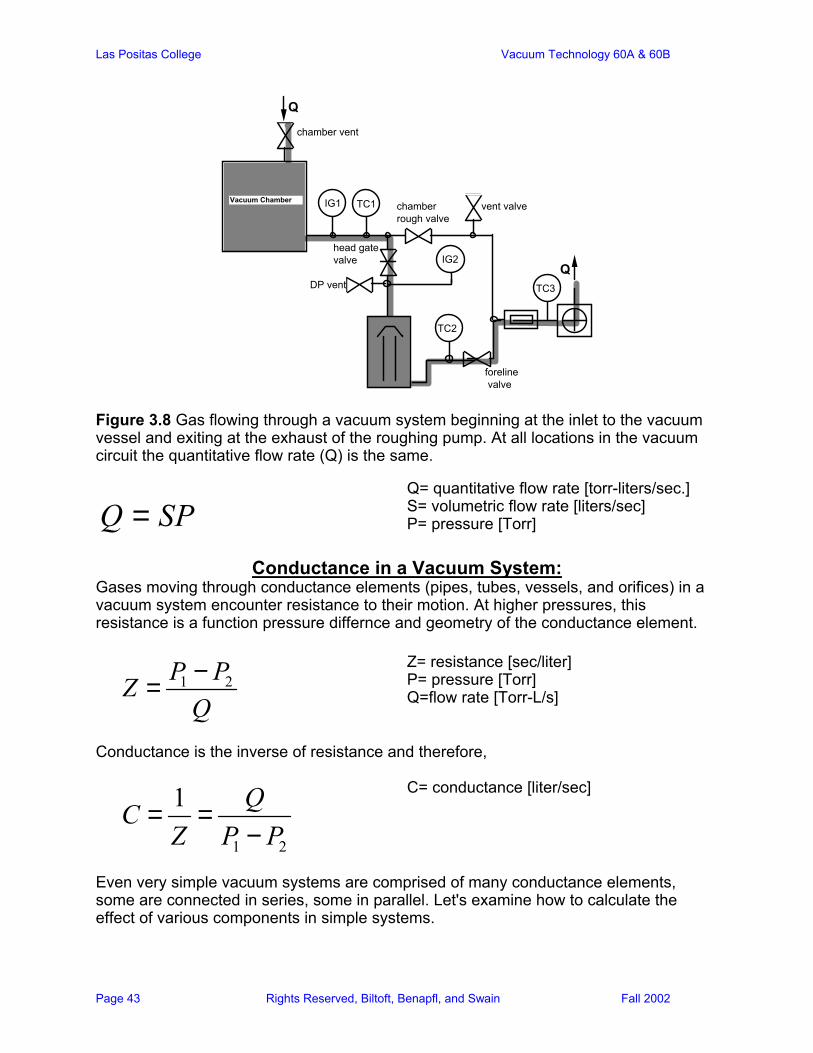
Figure 3.8 Gas flowing through a vacuum system beginning at the inlet to the vacuum vessel and exiting at the exhaust of the roughing pump. At all locations in the vacuum circuit the quantitative flow rate (Q) is the same.
Q SP=
Q= quantitative flow rate [torr-liters/sec.] S= volumetric flow rate [liters/sec] P= pressure [Torr]
Conductance in a Vacuum System: Gases moving through conductance elements (pipes, tubes, vessels, and orifices) in a vacuum system encounter resistance to their motion. At higher pressures, this resistance is a function pressure differnce and geometry of the conductance element.
1 2P PZQ−=
Z= resistance [sec/liter] P= pressure [Torr] Q=flow rate [Torr-L/s]
Conductance is the inverse of resistance and therefore,
1 2
1 QCZ P P
= =−
C= conductance [liter/sec]
Even very simple vacuum systems are comprised of many conductance elements, some are connected in series, some in parallel. Let's examine how to calculate the effect of various components in simple systems.
Las Positas College Vacuum Technology 60A & 60B
Page 44 Rights Reserved, Biltoft, Benapfl, and Swain Fall 2002
Vacuum chamber
valve trap
pump
90° elbow
C1 C2 C3
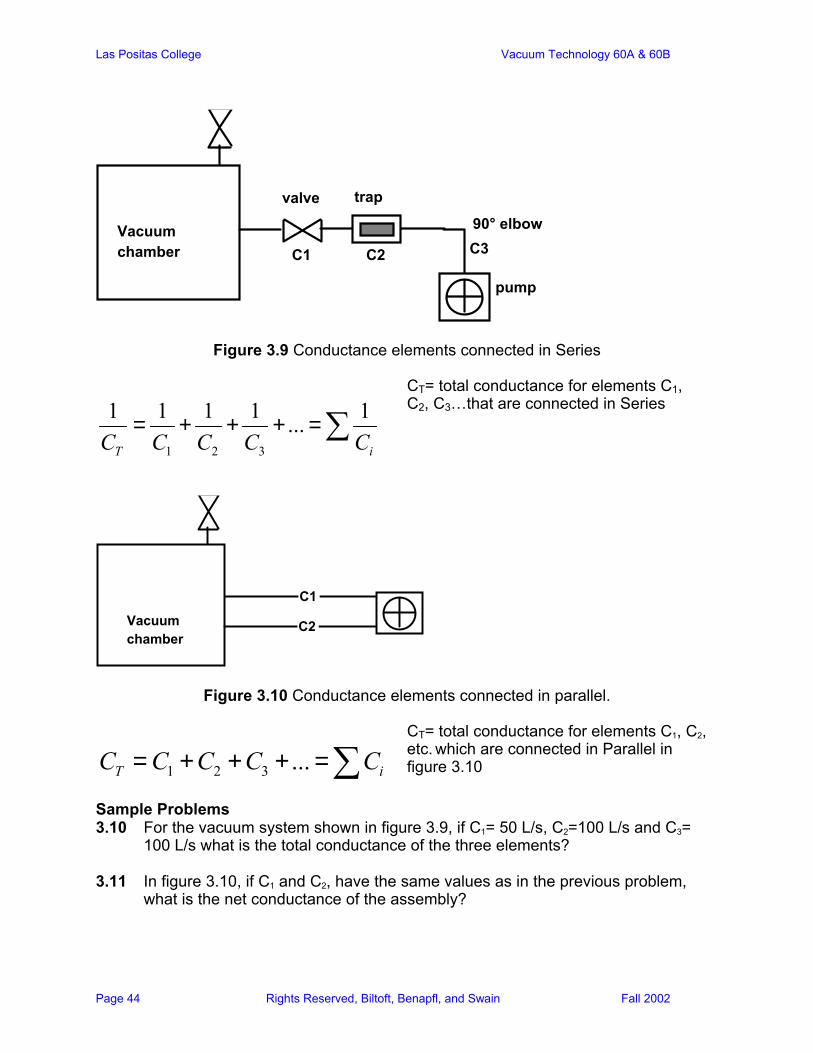
Figure 3.9 Conductance elements connected in Series
1 2 3
1 1 1 1 1...T iC C C C C
= + + + =∑
CT= total conductance for elements C1, C2, C3…that are connected in Series
C1
Vacuum chamber
C2
Figure 3.10 Conductance elements connected in parallel.
1 2 3 ...T iC C C C C= + + + =∑
CT= total conductance for elements C1, C2, etc. which are connected in Parallel in figure 3.10
Sample Problems 3.10 For the vacuum system shown in figure 3.9, if C1= 50 L/s, C2=100 L/s and C3=
100 L/s what is the total conductance of the three elements? 3.11 In figure 3.10, if C1 and C2, have the same values as in the previous problem,
what is the net conductance of the assembly?
Las Positas College Vacuum Technology 60A & 60B
Page 45 Rights Reserved, Biltoft, Benapfl, and Swain Fall 2002
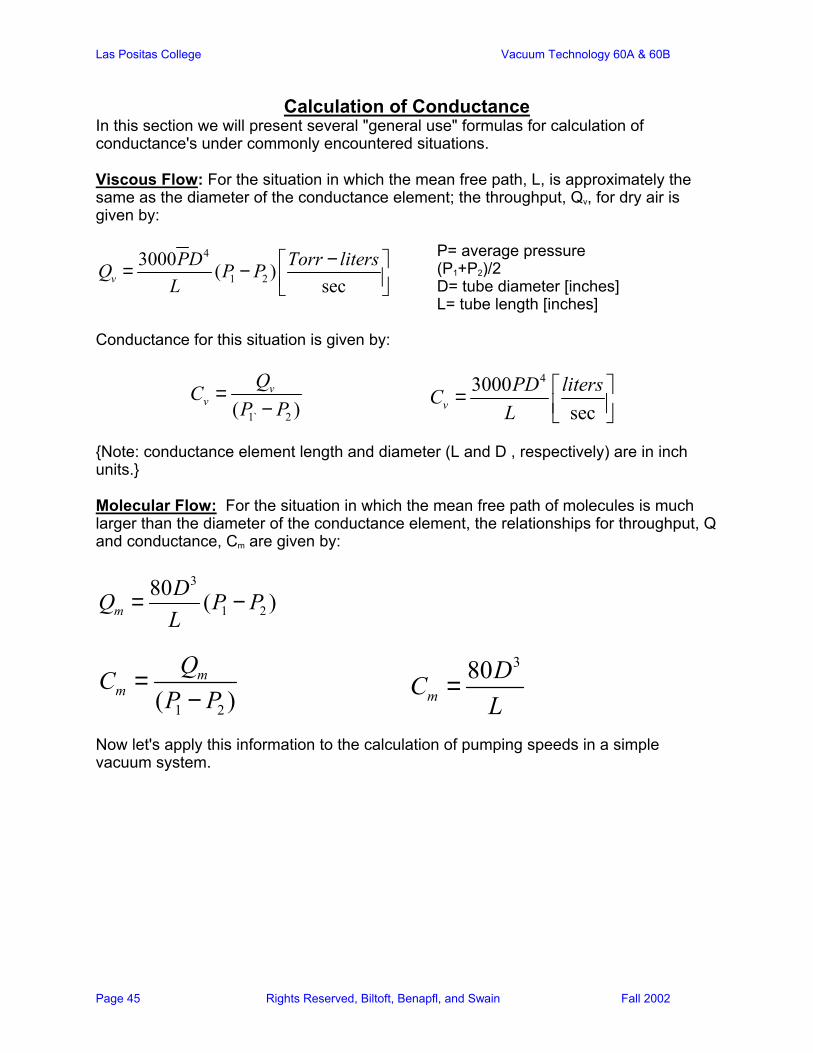
Calculation of Conductance In this section we will present several "general use" formulas for calculation of conductance's under commonly encountered situations. Viscous Flow: For the situation in which the mean free path, L, is approximately the same as the diameter of the conductance element; the throughput, Qv, for dry air is given by:
4
1 23000 ( )
secvPD Torr litersQ P PL
− = −
P= average pressure (P1+P2)/2 D= tube diameter [inches] L= tube length [inches]
Conductance for this situation is given by:
1` 2( )v
vQCP P
=−
43000secv
PD litersCL
= Note: conductance element length and diameter (L and D , respectively) are in inch units. Molecular Flow: For the situation in which the mean free path of molecules is much larger than the diameter of the conductance element, the relationships for throughput, Q and conductance, Cm are given by:
3
1 280 ( )mDQ P PL
= −
1 2( )m
mQCP P
=−
380m
DCL
=
Now let's apply this information to the calculation of pumping speeds in a simple vacuum system.

Las Positas College Vacuum Technology 60A & 60B
Page 46 Rights Reserved, Biltoft, Benapfl, and Swain Fall 2002
Q
P1 P2
S S
C
t p
Figure 3.11: A simple vacuum system.
At any location in the vacuum circuit the volumetric flow rate or pumping speed at that point can be found if we know the pressure at that point, the pressure at the pump, and the conductance of the path connecting these two. At the chamber side of the system P1= Q/St, and similarly at the pump side, P2=Q/Sp. We will make use of the relationship between mass flow (Q), pressure drop (P1-P2), and conductance (C):
1 2( )Q P P C= −
Substituting Q/St for P1 and Q/Sp for P2 we get:
t p
Q QQ CS S
= −
Dividing both sides of the equation by QC we get:
1 1 1
t pC S S= −
Now we can solve for St, the pumping speed at the chamber orifice. Sample Problem: 3.12 For the simple vacuum system pictured in figure 3.11, calculate the pumping speed
at the chamber if the pump has a speed of 200 L/s, the pressure at the vacuum pump is 5 x 10⁻⁶, and the conductance element is a tube 30" long by 2" in diameter.
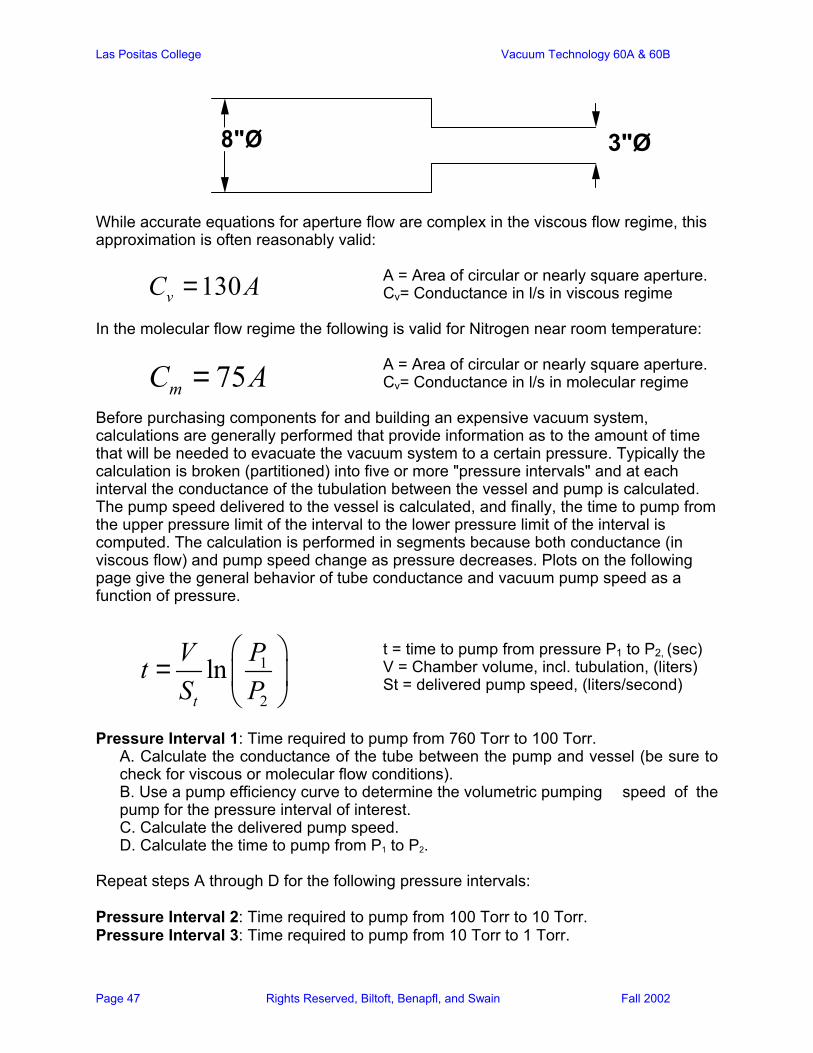
Conductance of apertures will become important when performing vacuum system calculations when tube diameters abruptly change diameter by a factor of two or more (see picture below).
Las Positas College Vacuum Technology 60A & 60B
Page 47 Rights Reserved, Biltoft, Benapfl, and Swain Fall 2002
8"Ø
While accurate equations for aperture flow are complex in the viscous flow regime, this approximation is often reasonably valid:
A = Area of circular or nearly square aperture. Cv= Conductance in l/s in viscous regime
In the molecular flow regime the following is valid for Nitrogen near room temperature:
A = Area of circular or nearly square aperture. Cv= Conductance in l/s in molecular regime
Before purchasing components for and building an expensive vacuum system, calculations are generally performed that provide information as to the amount of time that will be needed to evacuate the vacuum system to a certain pressure. Typically the calculation is broken (partitioned) into five or more "pressure intervals" and at each interval the conductance of the tubulation between the vessel and pump is calculated. The pump speed delivered to the vessel is calculated, and finally, the time to pump from the upper pressure limit of the interval to the lower pressure limit of the interval is computed. The calculation is performed in segments because both conductance (in viscous flow) and pump speed change as pressure decreases. Plots on the following page give the general behavior of tube conductance and vacuum pump speed as a function of pressure.
t = time to pump from pressure P1 to P2, (sec) V = Chamber volume, incl. tubulation, (liters) St = delivered pump speed, (liters/second)
Pressure Interval 1: Time required to pump from 760 Torr to 100 Torr.
A. Calculate the conductance of the tube between the pump and vessel (be sure to check for viscous or molecular flow conditions). B. Use a pump efficiency curve to determine the volumetric pumping speed of the pump for the pressure interval of interest. C. Calculate the delivered pump speed. D. Calculate the time to pump from P1 to P2.
Repeat steps A through D for the following pressure intervals: Pressure Interval 2: Time required to pump from 100 Torr to 10 Torr. Pressure Interval 3: Time required to pump from 10 Torr to 1 Torr.
130vC A=
75mC A=
1
2
lnt
PVtS P
=
3"Ø
Las Positas College Vacuum Technology 60A & 60B
Page 48 Rights Reserved, Biltoft, Benapfl, and Swain Fall 2002
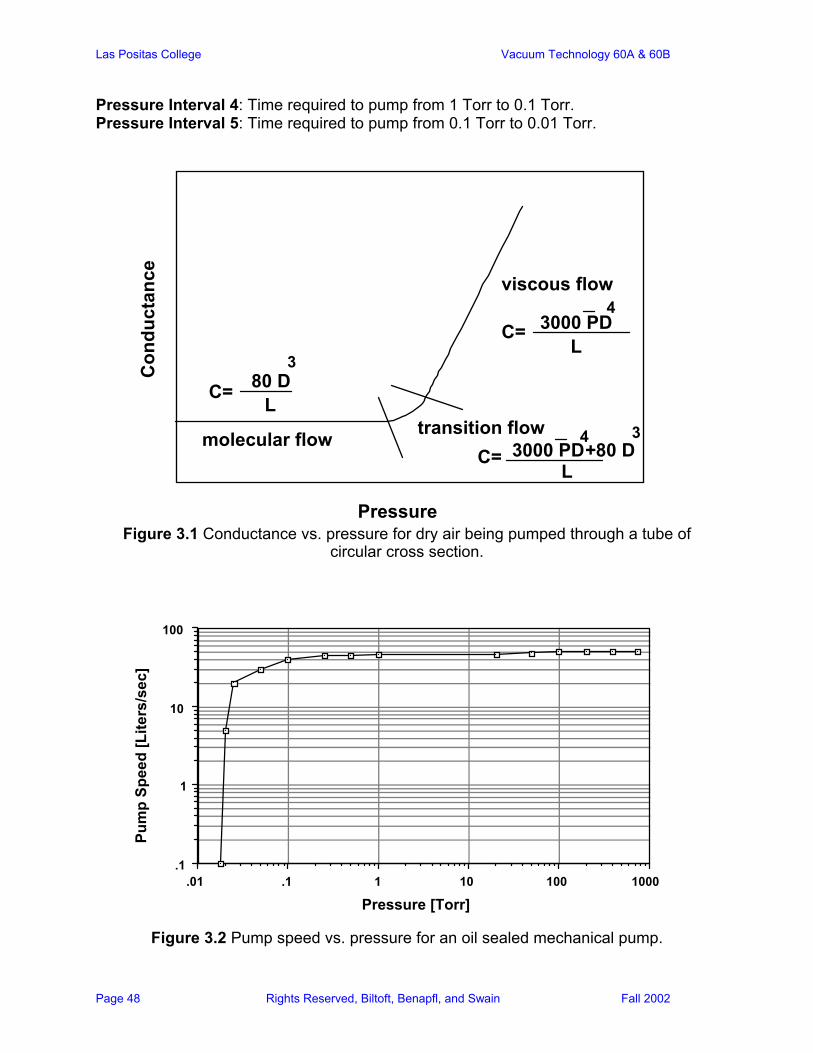
Pressure Interval 4: Time required to pump from 1 Torr to 0.1 Torr. Pressure Interval 5: Time required to pump from 0.1 Torr to 0.01 Torr.
Con
duct
ance
Pressure
molecular flow
viscous flow
transition flow
C= 3000 PDL
4
C= 80 DL
3
C= 3000 PD4
L80 D
3+
Figure 3.1 Conductance vs. pressure for dry air being pumped through a tube of
circular cross section.
1000100101.1.01.1
1
10
100
Pressure [Torr]
Pum
p Sp
eed
[Lite
rs/s
ec]
Figure 3.2 Pump speed vs. pressure for an oil sealed mechanical pump.
Las Positas College Vacuum Technology 60A & 60B
Page 49 Rights Reserved, Biltoft, Benapfl, and Swain Fall 2002
For Further Reading:
Kinetic theory of gases- High Vacuum Technology, Hablanian, Marsbed, M., Marcel Dekker, INC., New York,
New York. 1990. Vacuum system calculations- High Vacuum Technique, Yarwood, J., Chapman and Hall, Ltd., 11 New Fetter lane,
London, 1967. High Vacuum Technology, Hablanian, Marsbed, M., Marcel Dekker, INC., New York,
New York. 1990. A User's Guide to Vacuum Technology, O'Hanlon, John F. John Wiley & Sons New
York, New York. 1980. Practical Vacuum Systems, LaPelle, Roland R. , McGraw-Hill Book Co. New York, New
York. 1972. Answers to Chapter 3 Sample Problems 3.1 4" Ø view port has a surface area = π x r2=3.14 x 4 = 12.6 sq. in. 12.6 sq. in x 14.7 lbs/sq. in = 185 lbs. 3.2 Sodium (reactive metal), pure iron (oxidizes rapidly in moist air), and lithium (reactive metal). 3.3 As pressure decreases, thermal conductivity and electrical conductivity of air should both decrease. 3.4 140 liters. 3.5 63 mTorr. 3.6
A. Solve for the number of moles, n in the vessel. step 1: convert pressure 50 mTorr/760 Torr = 6.58 x 10⁻⁵atm step 2: convert temperature 25 °C + 273= 298k step 3: PV=nRT (6.58 x 10⁻⁵atm)(100 L)=n(0.08206L-atm/k-mol)(298k) n= 2.69 x 10⁻⁴ moles of gas molecules. B. Solve for the number of molecules in the vessel. there are 6.02 x 10²³ molecules per mole (2.69 x 10⁻⁴ moles)(6.02 x 10²³ molecules per mole)=1.62 x 10²⁰ molecules. C. Solve for the number of molecules per cubic centimeter. (1.62 x 10²⁰ molecules/100 liters)/100= 1.62 x 10¹⁸molecules/liter. (1.62 x 10¹⁸molecules/liter)/1000 cubic centimeters/liter= 1.62 x 10¹⁵molecules/cubic centimeter
3.7 T=373k, M=28g/mole. V=53,100 cm/sec.
Las Positas College Vacuum Technology 60A & 60B
Page 50 Rights Reserved, Biltoft, Benapfl, and Swain Fall 2002
3.8 Given: T=25 °C, V=50 liters, P=5 x 10⁻⁶ Torr. A. Solve for the number of moles of gas, using the ideal gas law.
step 1: convert pressure (5 x 10⁻⁶ Torr)/760 Torr = 6.7 x 10⁻⁹ atm. step 2: convert temperature 25 °C + 273= 298k step 3: PV=nRT (6.7 x 10⁻⁹atm)(50 L)=n(0.08206L-atm/k-mol)(298k) n= 1.36 x 10⁻⁸ moles of gas molecules in 50 liter volume.
B. Calculate the number of molecules in the 50 liter volume. (1.36 x 10⁻⁸ moles)(6.02 x 10²³ molecules per mole)= 8.2 x 10¹⁵ molecules.
C. Calculate the number of molecules in one cubic centimeter. (8.2 x 10¹⁵ molecules/50 L)/50 L=1.64 x 10¹⁴ molecules/L (1.64 x 10¹⁴ molecules/L)/1000 cubic centimeters/L= N=1.64 x 10¹¹ molecules/cubic centimeter.
D. The mean free path, L = 3.9 I=1.92 x 10¹⁵ molecules/sec-cm2. 3.10 C=25 L/s. 3.11 C=150 L/s 3.12 First calculate the conductance of the conductance element.given: tube is 30" long,
2" in diameter, assume molecular flow. C= 80 x (4")3/30"=21.33 L/s = 171 L/s. Then use 1/S1=1/C + 1/S2 to solve for S1. S1= 92 L/s.
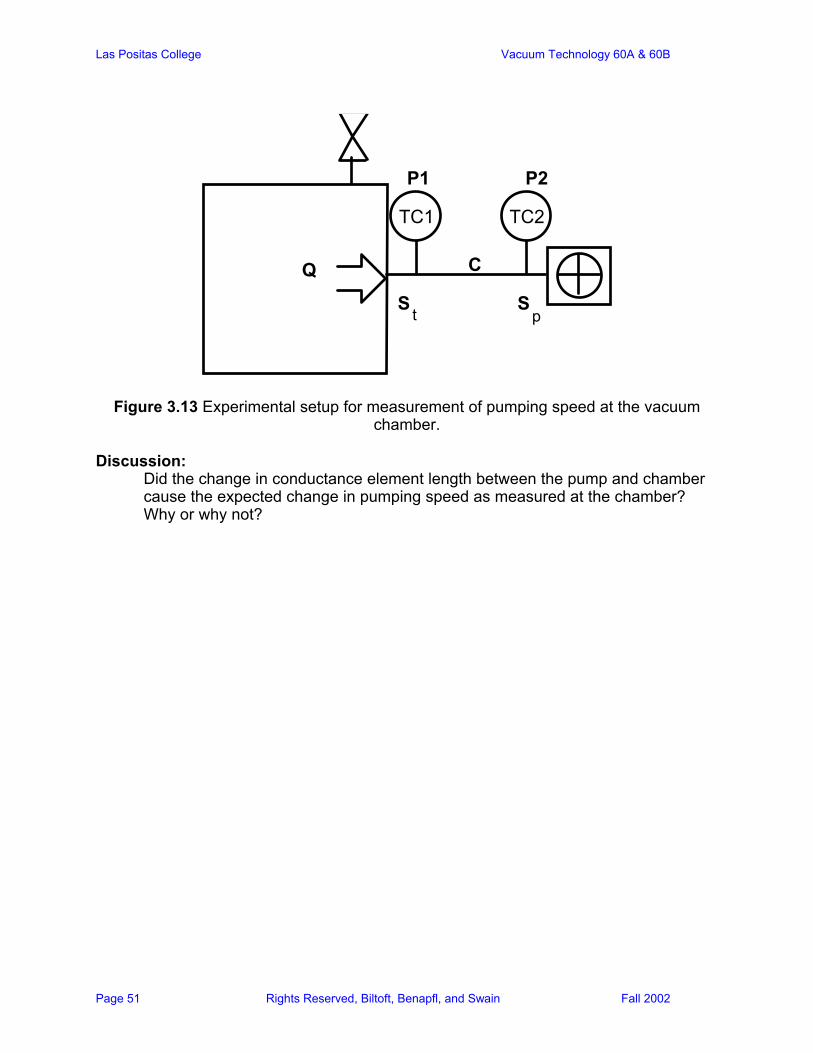
Laboratory Exercise 3.1: Measurement of pumping speed at the vacuum chamber Experimental set-up: Select a working rotary vane mechanical pump and the appropriate gages, tubulation, and fittings to assemble a vacuum system as shown in figure 3.13 First, assemble the system with a short conductance element between the chamber and pump. Calculate the conductance of the element using formulas discussed in this chapter. Evacuate the chamber, allowing the mechanical pump to achieve its base pressure. Record P1 and P2, and using the calculated value of C, and the manufacturer's value of pump speed, solve for the pumping speed at the chamber. Repeat the experiment for a much longer conductance element of the same diameter.
Las Positas College Vacuum Technology 60A & 60B
Page 51 Rights Reserved, Biltoft, Benapfl, and Swain Fall 2002
Q
P1 P2
S S
C
TC2TC1
t p
Figure 3.13 Experimental setup for measurement of pumping speed at the vacuum chamber.
Discussion:
Did the change in conductance element length between the pump and chamber cause the expected change in pumping speed as measured at the chamber? Why or why not?
Las Positas College Vacuum Technology 60A & 60B
Page 52 Rights Reserved, Biltoft, Benapfl, and Swain Fall 2002
Chapter 4: Vacuum System Components One area of vacuum technology that has evolved rapidly in the last 20 years is the development of system hardware. Those of us that had been exposed to 1960's vintage vacuum systems can remember how crude and clumsy they were! Today, vacuum hardware is generally streamlined, attractive, and functional. We usually attribute the pleasant appearance of modern vacuum systems to 1) manufacturers who compete for the business of the user, and 2) users who desire clean, attractive systems to keep their facilities modern and up-to-date. There are other contributors, of course. And one point that needs to be mentioned is that as vacuum systems progress, their price tags also soar! In this chapter we hope to present information that will allow you to become familiar with some of the hardware that is currently in use in the field of vacuum technology. We have included by way of introduction, a set of the symbols used by the American Vacuum Society (AVS) to schematically diagram vacuum systems. This set of symbols functions much like the symbols used in the electronics field to represent electric circuits. It should be noted here, that there exists a European set of symbols that is completely different from the AVS set. The European symbols are presented in the technical reference section of the Leybold Hereaus catalog. Also covered here is material that will introduce the subject of materials selection for vacuum applications. In particular, the section on valves provides some insight into the selection of materials based upon their outgassing behavior, permeability to various gases, and mechanical strength. Since no single component stands alone, some mention of techniques used to join various components is also given. There is one laboratory exercise included in this chapter, and there are several discussion questions provided to provoke your curiosity. As you explore vacuum technology we encourage you to pay close attention to the way in which hardware is assembled and maintained. We believe that as your experience in this field increases, so will your curiosity.
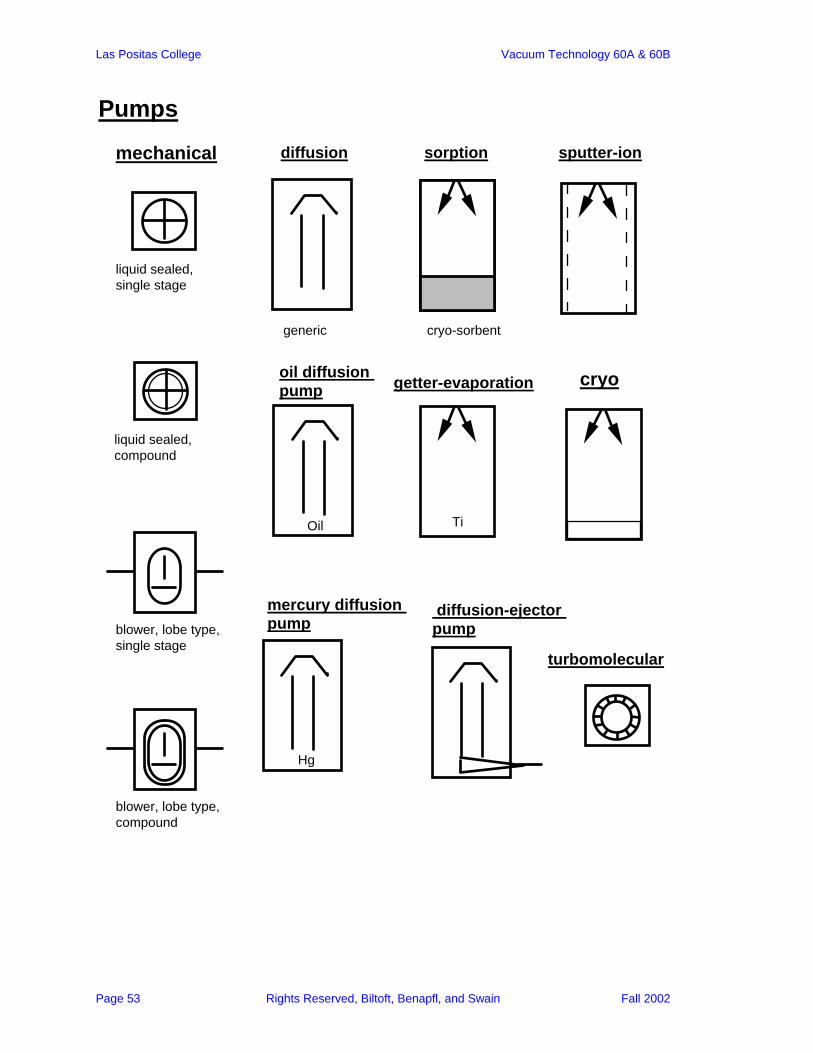
Las Positas College Vacuum Technology 60A & 60B
Page 53 Rights Reserved, Biltoft, Benapfl, and Swain Fall 2002
Pumps
mechanical diffusion sorption
cryo
sputter-ion
Oil
Hg
Ti
liquid sealed, single stage
liquid sealed, compound
blower, lobe type, single stage
blower, lobe type, compound
turbomolecular
generic
oil diffusion pump
mercury diffusion pump
diffusion-ejector pump
getter-evaporation
cryo-sorbent
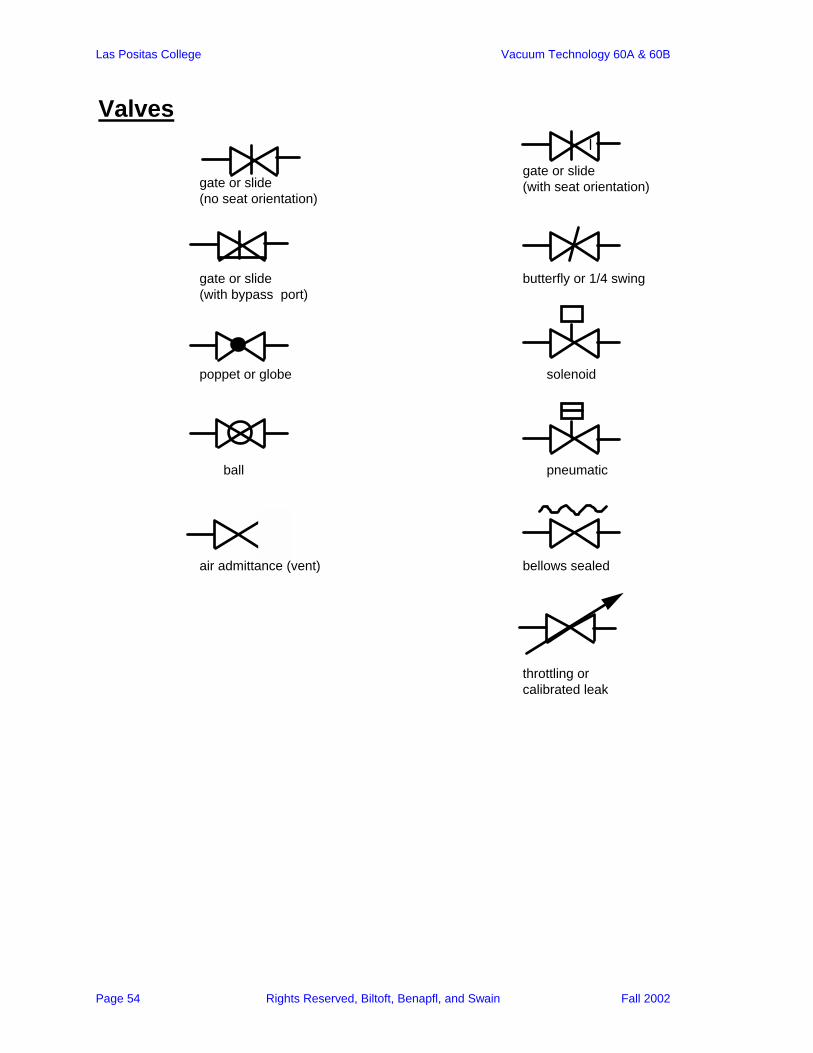
Las Positas College Vacuum Technology 60A & 60B
Page 54 Rights Reserved, Biltoft, Benapfl, and Swain Fall 2002
Valves
gate or slide (no seat orientation)
gate or slide (with seat orientation)
gate or slide (with bypass port)
poppet or globe
ball
air admittance (vent)
butterfly or 1/4 swing
solenoid
pneumatic
bellows sealed
throttling or calibrated leak
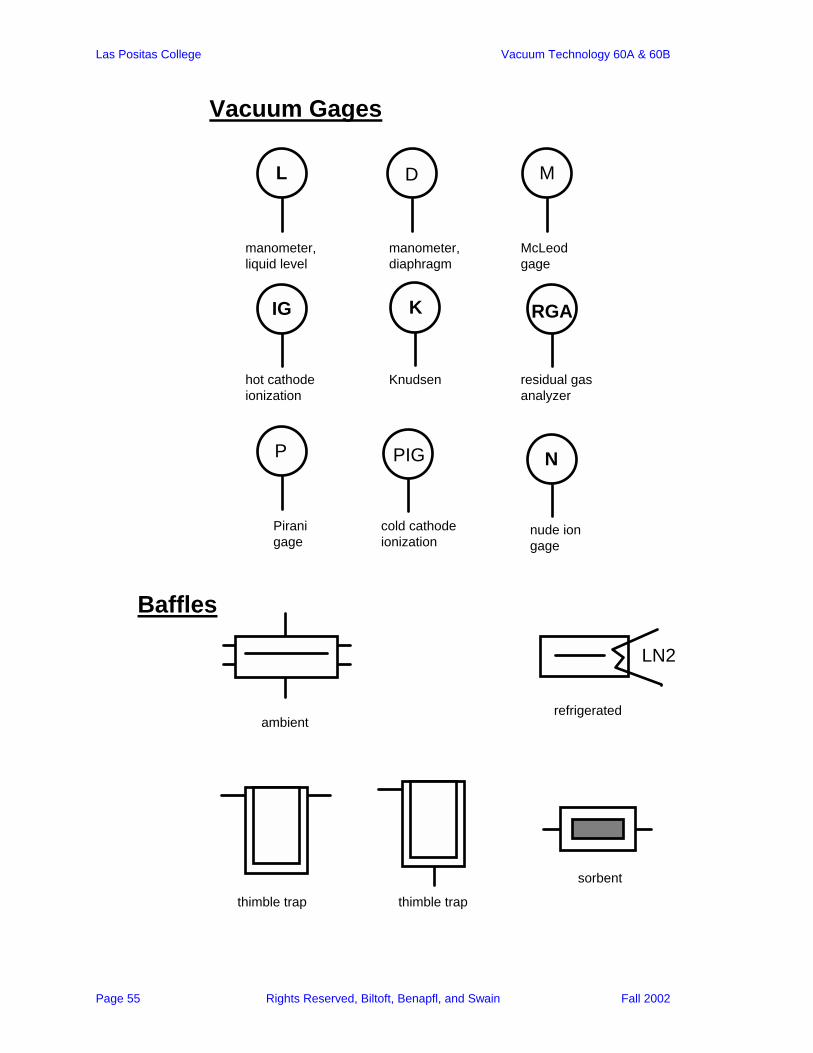
Las Positas College Vacuum Technology 60A & 60B
Page 55 Rights Reserved, Biltoft, Benapfl, and Swain Fall 2002
Vacuum Gages
L D M
P PIG
IG K RGA
N
manometer, liquid level
manometer, diaphragm
McLeod gage
Pirani gage
cold cathode ionization
hot cathode ionization
Knudsen residual gas analyzer
nude ion gage
Baffles
ambient
LN2
refrigerated
sorbent
thimble trapthimble trap
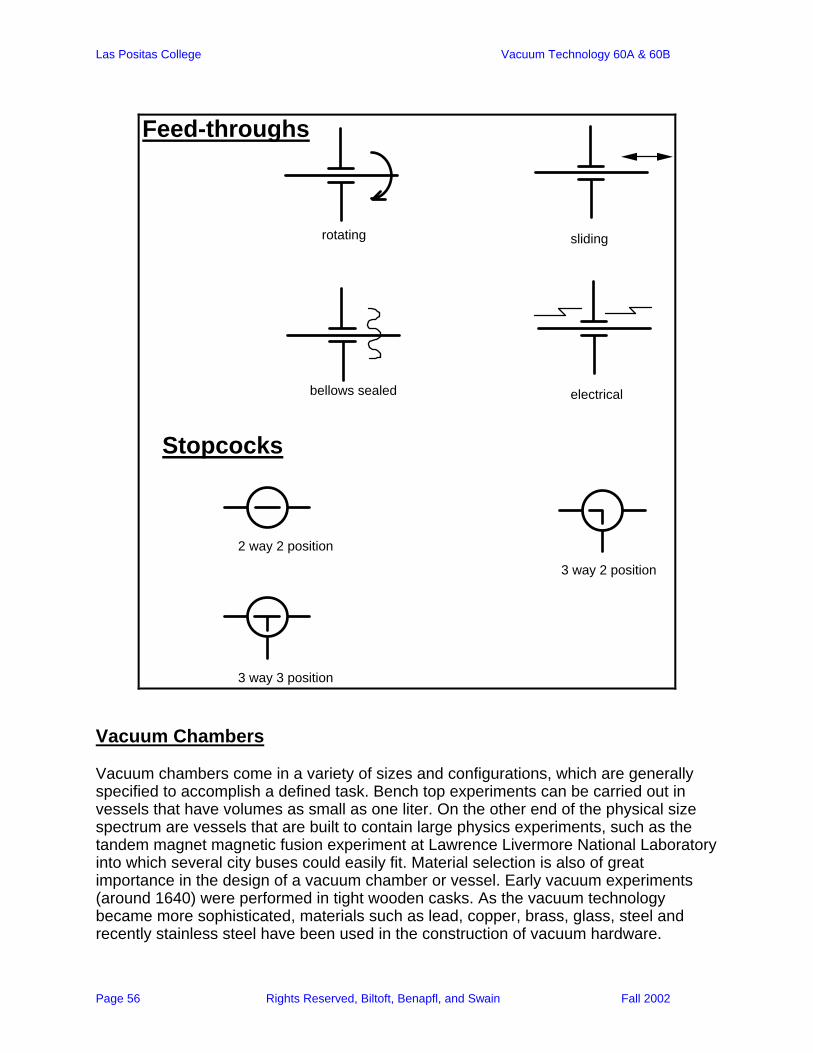
Las Positas College Vacuum Technology 60A & 60B
Page 56 Rights Reserved, Biltoft, Benapfl, and Swain Fall 2002
Stopcocks
Feed-throughs
rotating sliding
bellows sealed electrical
2 way 2 position
3 way 3 position
3 way 2 position
Vacuum Chambers Vacuum chambers come in a variety of sizes and configurations, which are generally specified to accomplish a defined task. Bench top experiments can be carried out in vessels that have volumes as small as one liter. On the other end of the physical size spectrum are vessels that are built to contain large physics experiments, such as the tandem magnet magnetic fusion experiment at Lawrence Livermore National Laboratory into which several city buses could easily fit. Material selection is also of great importance in the design of a vacuum chamber or vessel. Early vacuum experiments (around 1640) were performed in tight wooden casks. As the vacuum technology became more sophisticated, materials such as lead, copper, brass, glass, steel and recently stainless steel have been used in the construction of vacuum hardware.
Las Positas College Vacuum Technology 60A & 60B
Page 57 Rights Reserved, Biltoft, Benapfl, and Swain Fall 2002
Size: In general, there is a strong advantage in designing a vacuum vessel as small as possible without hampering the process to be run in the vessel. There are several obvious reasons for this choice. Cost of vacuum hardware generally increases rapidly as size increases. For example, a simple flange that is to be welded onto a vessel costs $20 for the 2 3/4" diameter size, and $250 for the 10" diameter size flange of the exact same design! In addition to the issue of initial cost, operating costs for unnecessarily large vacuum vessels will be high due to the longer time required to achieve working pressures (dead time for operators), and increased frequency of repairs on pumping equipment. Geometry: Commercial vendors of vacuum vessels offer a wide variety of vessel shapes which are typically cylindrical, spherical or rectangular. These vacuum vessels can be grouped into the following categories: bell jars, cylinders, box coaters, "tees" and "crosses" and custom made vessels. Bell Jars: May be made from pyrex glass which is selected to resist damage from thermal shock, mechanical stress, and chemical attack. Bell jars are quite inexpensive compared to their stainless steel counterparts., and are often selected for experimental or prototype work. Pyrex glass bell jars have one clear advantage: they can allow direct observation of the vacuum environment as long as the interior of the bell jar in kept clean. Glass bell jars range in price from $350 (10" diameter, 12" tall) to $1,000 (18" diameter, 30" tall). Rubber gaskets are fitted to the base of the bell jar to provide a vacuum seal with a metal flange. Synthetic rubber materials used for bell jar gaskets include: Neoprene, Viton, and Buna. The choice of gasket material should be made according to the expected operating conditions (temperature, pressure, chemical environment, mechanical wear, etc.). Viton gaskets are the most expensive and cost approximately $200 for a 24" diameter bell jar. Glass bell jars require a safety guard, made from expanded sheet metal. The function of the guard is two-fold: to protect the glass vessel from damage, and to contain the glass in the event the vessel ruptures. Stainless steel bell jars are also commercially available, and typically come with an exterior water cooling circuit, and at least one viewport flange. Metal bell jars typically cost from $2000 (18" diameter, 30 tall) to $4000 (24' diameter, 30" tall). Some 18" diameter and smaller metal bell jars can be obtained with a metal seal "Wheeler flange" which would allow attainment of lower base pressures than polymeric seals. The most common grade of stainless steel chosen for vacuum application is 304. This material has low gas permeability, can be outgassed by heating, and resists chemical attack. Cylinders: Most cylindrical vacuum vessels are larger in diameter than they are tall, are made of 304 stainless steel, and have all-metal Wheeler flanges on their top and bottom. Quite often many ports are built into cylinders for viewports and feed throughs.
Las Positas College Vacuum Technology 60A & 60B
Page 58 Rights Reserved, Biltoft, Benapfl, and Swain Fall 2002
Box Coaters: Increasingly popular in the optics and micro-electronics industries, box coaters are often chosen for the ease in which batches of parts can be loaded and unloaded. Another advantage of box coaters is that with many standard flanges welded to the chamber's walls, reconfiguration of deposition sources, substrate holders, and process diagnostics is a simple matter. Box coaters are often made from 304 stainless steel, and have trace cooling on their exterior surface. Typically, an o-ring sealed hinged door is provided for interior access. To avoid costly down time for cleaning, inexpensive sheet metal shields are installed inside the chamber, and are removed and replaced periodically. External reinforcements are often required to supply sufficient mechanical strength to the walls of the chamber while evacuated. "Tees" and "Crosses": Many of the vacuum components vendors carry a variety of "vacuum plumbing" hardware in the form of tubes, "tees" and "crosses" with standard flanges welded on that can be easily assembled with valves, pumps and gauges to build superb vacuum vessels. Most of this hardware is made of 304 stainless steel, and is available in sizes ranging from 3/4" diameter O.D. to 10" diameter O.D. Traps, Baffles and Filters Traps: Broadly defined, a trap is any device placed in a vacuum circuit that serves to reduce the partial pressure of gas in the circuit. Traps are auxiliary capture pumps that are generally used to prevent flow of gas in an undesirable direction (as in an oil diffusion pump, see chapter 7). Traps are often placed in vacuum conductance paths between vacuum pumps and the vacuum vessel to reduce to a minimum the chance of oil back streaming from the pump to the vessel. The various mechanisms for trapping gas vapors include: adsorption, cryo-sorption, and cryo-condensation. Traps that rely upon adsorption typically are filled with material having a very large surface area to volume ratio, such as fiberglass, copper wool and micro porous material such as zeolite. Cryo-sorption traps take advantage of the fact that vapors, upon striking cold surfaces (below the boiling point of the gas at the operating pressure) will condense and effectively be pumped from the system. Liquid nitrogen (LN) is generally chosen as the coolant for these type traps. The boiling point of liquid nitrogen is -195 °C; gases having boiling points above this temperature will generally condense upon striking a liquid nitrogen cooled surface. A point of caution should be made: if the LN cooled trap is inadvertently allowed to run dry and warm up, those vapors that have been condensed will evaporate and move about the system. Many modern vacuum systems have LN traps that are automatically filled through the use of a device having a thermally actuated solenoid valve to control LN level in the trap. Be aware that these automatic systems can fail! Cryo-condensation traps make use of both cryogenically cooled surfaces, as described above, and the gas trapping effects of micro porous surfaces. Zeolite is a molecular sieve material that contains pores that are approximately 7 +/- 3 Angstroms in diameter. This pore size is optimal for trapping gases through the use of Van der Waals' attraction.
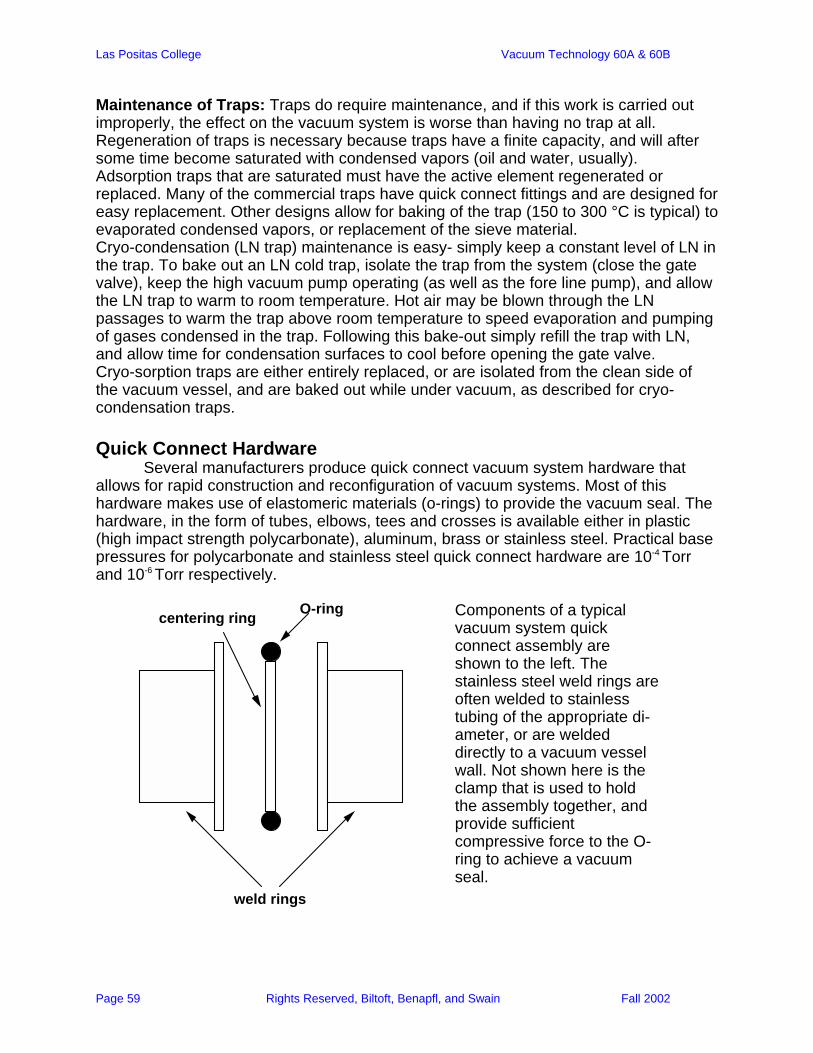
Las Positas College Vacuum Technology 60A & 60B
Page 59 Rights Reserved, Biltoft, Benapfl, and Swain Fall 2002
Maintenance of Traps: Traps do require maintenance, and if this work is carried out improperly, the effect on the vacuum system is worse than having no trap at all. Regeneration of traps is necessary because traps have a finite capacity, and will after some time become saturated with condensed vapors (oil and water, usually). Adsorption traps that are saturated must have the active element regenerated or replaced. Many of the commercial traps have quick connect fittings and are designed for easy replacement. Other designs allow for baking of the trap (150 to 300 °C is typical) to evaporated condensed vapors, or replacement of the sieve material. Cryo-condensation (LN trap) maintenance is easy- simply keep a constant level of LN in the trap. To bake out an LN cold trap, isolate the trap from the system (close the gate valve), keep the high vacuum pump operating (as well as the fore line pump), and allow the LN trap to warm to room temperature. Hot air may be blown through the LN passages to warm the trap above room temperature to speed evaporation and pumping of gases condensed in the trap. Following this bake-out simply refill the trap with LN, and allow time for condensation surfaces to cool before opening the gate valve. Cryo-sorption traps are either entirely replaced, or are isolated from the clean side of the vacuum vessel, and are baked out while under vacuum, as described for cryo-condensation traps. Quick Connect Hardware Several manufacturers produce quick connect vacuum system hardware that allows for rapid construction and reconfiguration of vacuum systems. Most of this hardware makes use of elastomeric materials (o-rings) to provide the vacuum seal. The hardware, in the form of tubes, elbows, tees and crosses is available either in plastic (high impact strength polycarbonate), aluminum, brass or stainless steel. Practical base pressures for polycarbonate and stainless steel quick connect hardware are 10-4 Torr and 10-6 Torr respectively.
weld rings
O-ringcentering ring
Components of a typical vacuum system quick connect assembly are shown to the left. The stainless steel weld rings are often welded to stainless tubing of the appropriate di-ameter, or are welded directly to a vacuum vessel wall. Not shown here is the clamp that is used to hold the assembly together, and provide sufficient compressive force to the O-ring to achieve a vacuum seal.
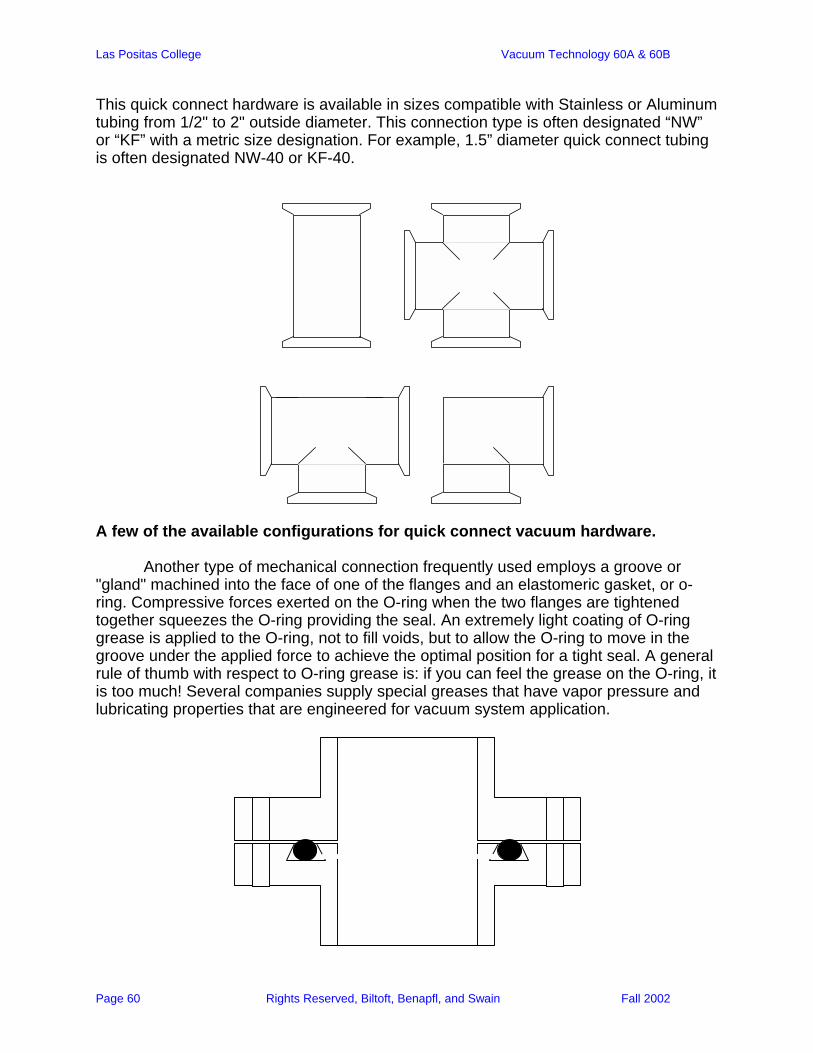
Las Positas College Vacuum Technology 60A & 60B
Page 60 Rights Reserved, Biltoft, Benapfl, and Swain Fall 2002
This quick connect hardware is available in sizes compatible with Stainless or Aluminum tubing from 1/2" to 2" outside diameter. This connection type is often designated “NW” or “KF” with a metric size designation. For example, 1.5” diameter quick connect tubing is often designated NW-40 or KF-40.
A few of the available configurations for quick connect vacuum hardware. Another type of mechanical connection frequently used employs a groove or "gland" machined into the face of one of the flanges and an elastomeric gasket, or o-ring. Compressive forces exerted on the O-ring when the two flanges are tightened together squeezes the O-ring providing the seal. An extremely light coating of O-ring grease is applied to the O-ring, not to fill voids, but to allow the O-ring to move in the groove under the applied force to achieve the optimal position for a tight seal. A general rule of thumb with respect to O-ring grease is: if you can feel the grease on the O-ring, it is too much! Several companies supply special greases that have vapor pressure and lubricating properties that are engineered for vacuum system application.
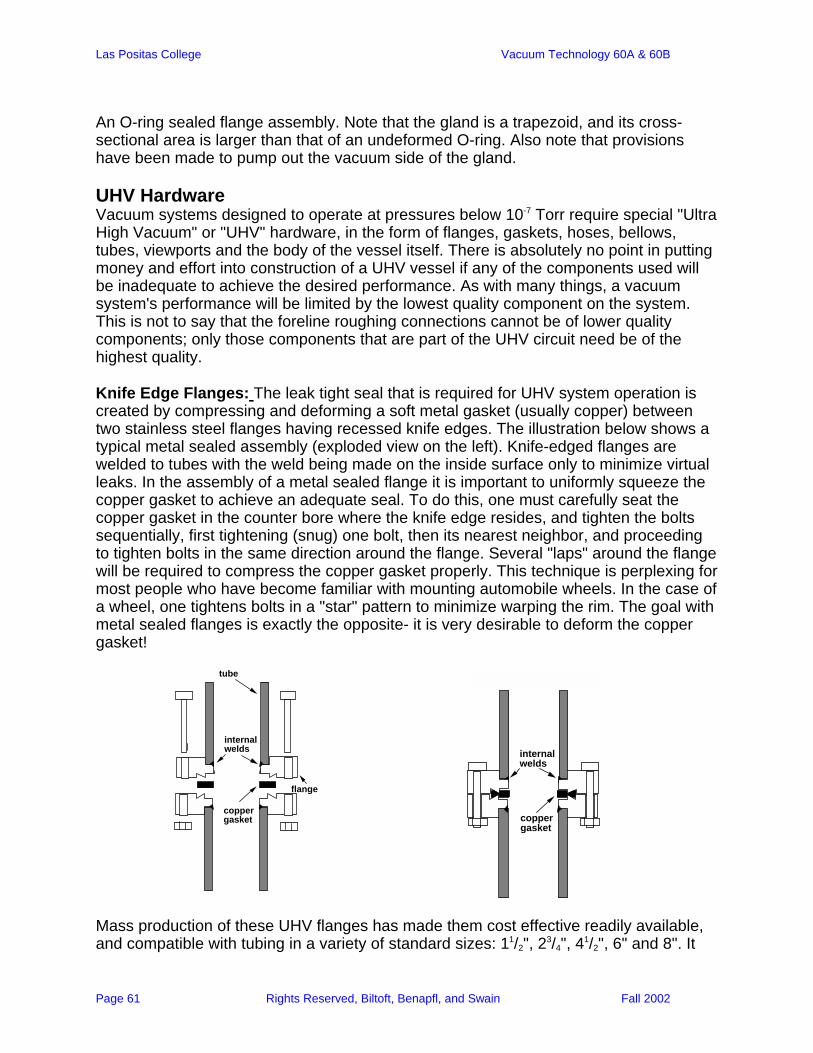
Las Positas College Vacuum Technology 60A & 60B
Page 61 Rights Reserved, Biltoft, Benapfl, and Swain Fall 2002
An O-ring sealed flange assembly. Note that the gland is a trapezoid, and its cross-sectional area is larger than that of an undeformed O-ring. Also note that provisions have been made to pump out the vacuum side of the gland. UHV Hardware Vacuum systems designed to operate at pressures below 10-7 Torr require special "Ultra High Vacuum" or "UHV" hardware, in the form of flanges, gaskets, hoses, bellows, tubes, viewports and the body of the vessel itself. There is absolutely no point in putting money and effort into construction of a UHV vessel if any of the components used will be inadequate to achieve the desired performance. As with many things, a vacuum system's performance will be limited by the lowest quality component on the system. This is not to say that the foreline roughing connections cannot be of lower quality components; only those components that are part of the UHV circuit need be of the highest quality. Knife Edge Flanges: The leak tight seal that is required for UHV system operation is created by compressing and deforming a soft metal gasket (usually copper) between two stainless steel flanges having recessed knife edges. The illustration below shows a typical metal sealed assembly (exploded view on the left). Knife-edged flanges are welded to tubes with the weld being made on the inside surface only to minimize virtual leaks. In the assembly of a metal sealed flange it is important to uniformly squeeze the copper gasket to achieve an adequate seal. To do this, one must carefully seat the copper gasket in the counter bore where the knife edge resides, and tighten the bolts sequentially, first tightening (snug) one bolt, then its nearest neighbor, and proceeding to tighten bolts in the same direction around the flange. Several "laps" around the flange will be required to compress the copper gasket properly. This technique is perplexing for most people who have become familiar with mounting automobile wheels. In the case of a wheel, one tightens bolts in a "star" pattern to minimize warping the rim. The goal with metal sealed flanges is exactly the opposite- it is very desirable to deform the copper gasket!
internal welds
copper gasket
tube
flange
internal welds
copper gasket
Mass production of these UHV flanges has made them cost effective readily available, and compatible with tubing in a variety of standard sizes: 11/2", 23/4", 41/2", 6" and 8". It
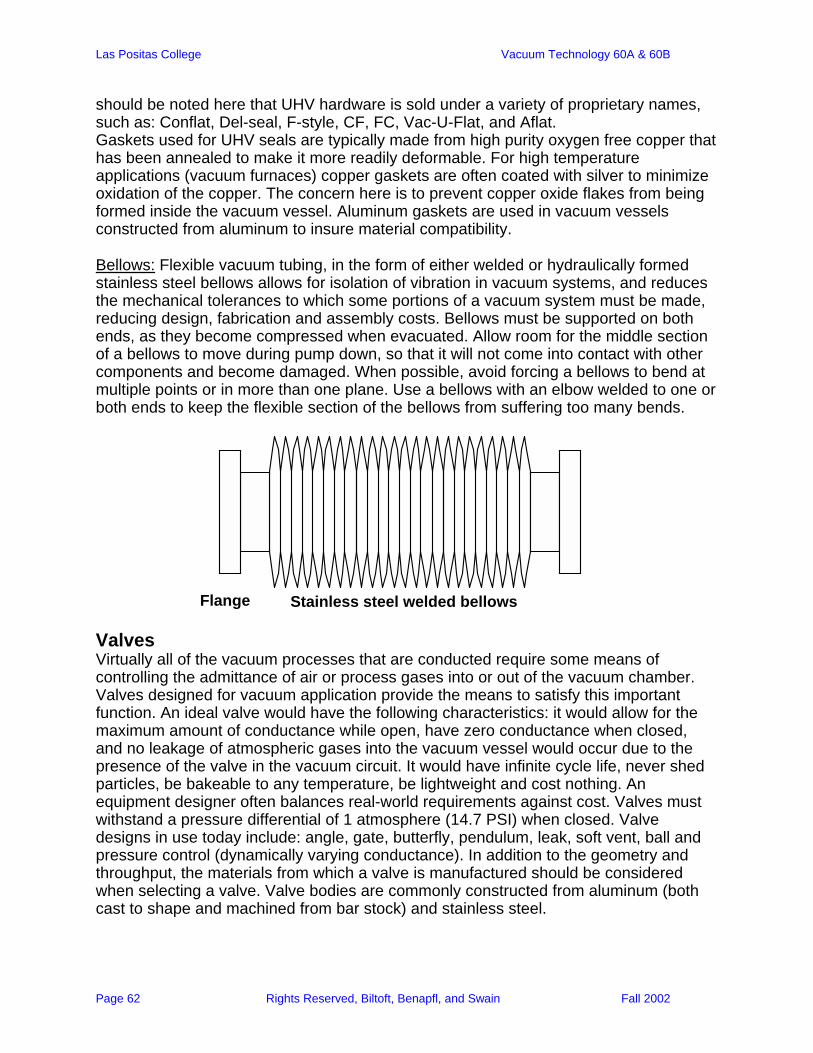
Las Positas College Vacuum Technology 60A & 60B
Page 62 Rights Reserved, Biltoft, Benapfl, and Swain Fall 2002
should be noted here that UHV hardware is sold under a variety of proprietary names, such as: Conflat, Del-seal, F-style, CF, FC, Vac-U-Flat, and Aflat. Gaskets used for UHV seals are typically made from high purity oxygen free copper that has been annealed to make it more readily deformable. For high temperature applications (vacuum furnaces) copper gaskets are often coated with silver to minimize oxidation of the copper. The concern here is to prevent copper oxide flakes from being formed inside the vacuum vessel. Aluminum gaskets are used in vacuum vessels constructed from aluminum to insure material compatibility. Bellows: Flexible vacuum tubing, in the form of either welded or hydraulically formed stainless steel bellows allows for isolation of vibration in vacuum systems, and reduces the mechanical tolerances to which some portions of a vacuum system must be made, reducing design, fabrication and assembly costs. Bellows must be supported on both ends, as they become compressed when evacuated. Allow room for the middle section of a bellows to move during pump down, so that it will not come into contact with other components and become damaged. When possible, avoid forcing a bellows to bend at multiple points or in more than one plane. Use a bellows with an elbow welded to one or both ends to keep the flexible section of the bellows from suffering too many bends.
Flange Stainless steel welded bellows Valves Virtually all of the vacuum processes that are conducted require some means of controlling the admittance of air or process gases into or out of the vacuum chamber. Valves designed for vacuum application provide the means to satisfy this important function. An ideal valve would have the following characteristics: it would allow for the maximum amount of conductance while open, have zero conductance when closed, and no leakage of atmospheric gases into the vacuum vessel would occur due to the presence of the valve in the vacuum circuit. It would have infinite cycle life, never shed particles, be bakeable to any temperature, be lightweight and cost nothing. An equipment designer often balances real-world requirements against cost. Valves must withstand a pressure differential of 1 atmosphere (14.7 PSI) when closed. Valve designs in use today include: angle, gate, butterfly, pendulum, leak, soft vent, ball and pressure control (dynamically varying conductance). In addition to the geometry and throughput, the materials from which a valve is manufactured should be considered when selecting a valve. Valve bodies are commonly constructed from aluminum (both cast to shape and machined from bar stock) and stainless steel.

Las Positas College Vacuum Technology 60A & 60B
Page 63 Rights Reserved, Biltoft, Benapfl, and Swain Fall 2002
Aluminum: Cast aluminum valve bodies may be used in high vacuum application, but for attainment of UHV, aluminum valve bodies must be machined from solid bar stock. Aluminum valves are common on modern semiconductor process tools. Aluminum valves are generally always elastomer sealed. Aluminum offers outstanding thermal conductivity. This is a benefit when operating heated valves in the presence of condensible by-products where cleaning is periodically required. Hard-Anodized Aluminum: A popular and economical alternative to Stainless “wetted surfaces”, this coating offers elevated resistance to acids and aggressive by-products. Deployment will result in a higher leak rate across the seal surface in comparison to uncoated valves. Surfaces will also outgas more, and so these surfaces are not recommended for UHV systems. Stainless Steel: The most popular, though most expensive material, stainless steel valves provide the means to achieve UHV and also resist most corrosive gases. They offer higher temperature service (usually to 200°C with elastomer seals, 300°C with metal seals) and Valves typically contain the following seals:
• Two flange seals, for the vacuum connections • A bonnet seal, for service, inspection, and assembly. • A seal at the actuator mechanism, to allow motion to be passed through to
vacuum • The main gate seal
All these seals see static service except the gate seal which see dynamic service. All of these seals can be from Viton, metal, or perfluorelastomers (a class of chemically resistant, high temperature specialty materials). Generally, modern commercial Gate and Angle valves can reliably maintain vacuum on either side of the gate (with atmosphere on the opposite side). It is wise to check with the manufacturer if it is an older gate valve. Angle Valves: Commonly used in foreline connections, these valves may have either O-ring or metal seals. Right angle valves have low conductance for the bore size due to the 90 degree turn. Below is shown a pneumatically actuated version with spring return (normally closed)
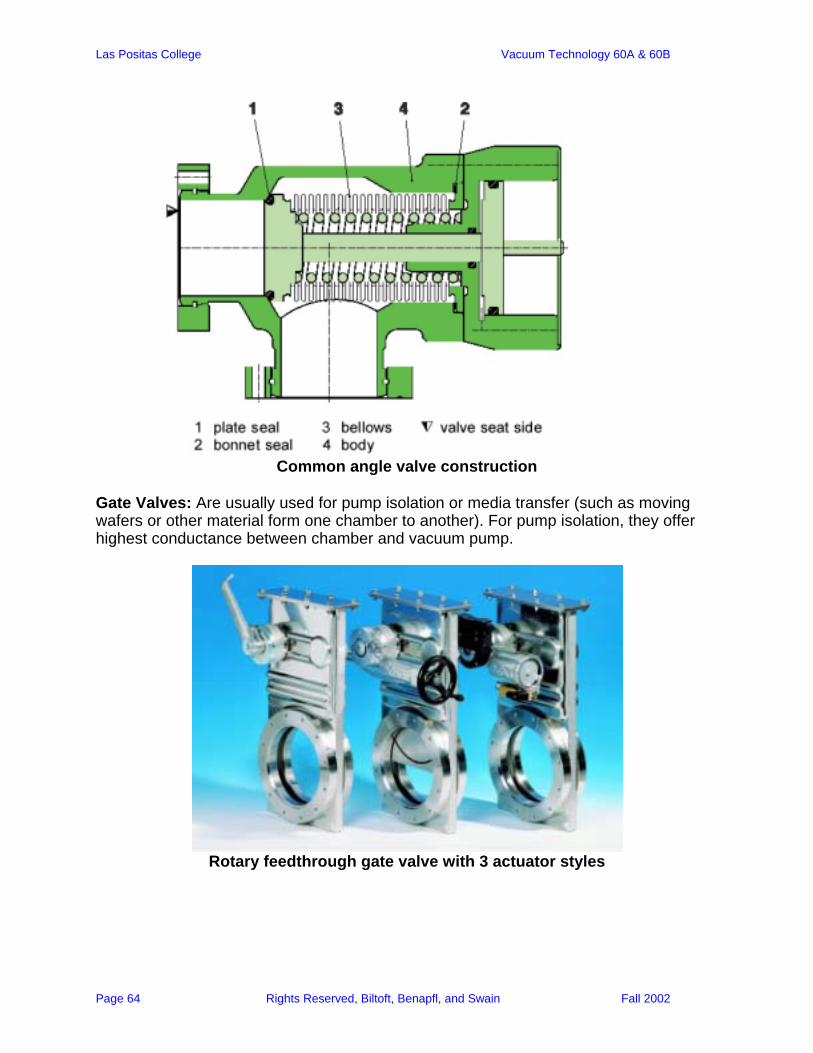
Las Positas College Vacuum Technology 60A & 60B
Page 64 Rights Reserved, Biltoft, Benapfl, and Swain Fall 2002
Common angle valve construction
Gate Valves: Are usually used for pump isolation or media transfer (such as moving wafers or other material form one chamber to another). For pump isolation, they offer highest conductance between chamber and vacuum pump.
Rotary feedthrough gate valve with 3 actuator styles

Las Positas College Vacuum Technology 60A & 60B
Page 65 Rights Reserved, Biltoft, Benapfl, and Swain Fall 2002
How the mechanism in a gate valve might work
Gate valves may be of cast or machined aluminum or stainless steel. They usually incorporate elastomeric seals, while those designed for UHV applications will have metal seals. Gate valves may be manually, electrically or pneumatically actuated. Great care must be taken with these valves when connected to a source of power for operation. Several people have lost hands working on vacuum systems when a gate valve was accidentally closed with the individual's hand in the valve.
Feedthroughs
Vacuum processes would be severely limited without the means to bring electrical power, motion, and cooling water into vacuum systems. Similarly, the ability to move objects inside an evacuated vessel greatly enhances the capabilities of a vacuum system (depositing thin films onto all surfaces of a complex shaped part for example). Feedthroughs provide the mechanism for accomplishing these goals without compromising the vacuum environment one works so hard to achieve. Electrical Power Feed Throughs: Electrical power is introduced into a vacuum vessel from some external source by means of a well designed feed through. These devices are used when some process, such as electron beam evaporation, sputtering or vacuum brazing is being conducted. Additionally, most vacuum instrumentation, including pressure gauges rely upon electrical vacuum Feed throughs. Ceramic insulators built into the feed through prevent the dissipation of electrical energy through the walls of the vacuum vessel, and the commensurate danger of electrical shock
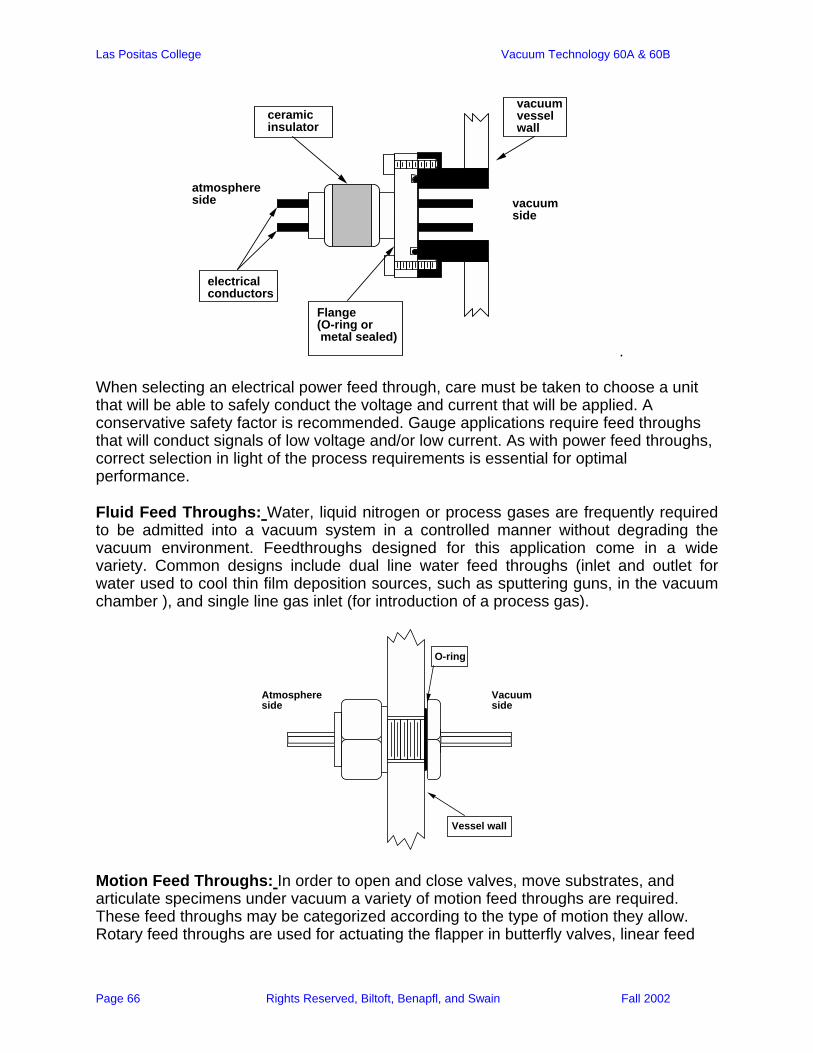
Las Positas College Vacuum Technology 60A & 60B
Page 66 Rights Reserved, Biltoft, Benapfl, and Swain Fall 2002
Flange (O-ring or metal sealed)
ceramic insulator
electrical conductors
vacuum vessel wall
vacuum side
atmosphere side
. When selecting an electrical power feed through, care must be taken to choose a unit that will be able to safely conduct the voltage and current that will be applied. A conservative safety factor is recommended. Gauge applications require feed throughs that will conduct signals of low voltage and/or low current. As with power feed throughs, correct selection in light of the process requirements is essential for optimal performance. Fluid Feed Throughs: Water, liquid nitrogen or process gases are frequently required to be admitted into a vacuum system in a controlled manner without degrading the vacuum environment. Feedthroughs designed for this application come in a wide variety. Common designs include dual line water feed throughs (inlet and outlet for water used to cool thin film deposition sources, such as sputtering guns, in the vacuum chamber ), and single line gas inlet (for introduction of a process gas).
Vacuum side
Atmosphere side
Vessel wall
O-ring
Motion Feed Throughs: In order to open and close valves, move substrates, and articulate specimens under vacuum a variety of motion feed throughs are required. These feed throughs may be categorized according to the type of motion they allow. Rotary feed throughs are used for actuating the flapper in butterfly valves, linear feed
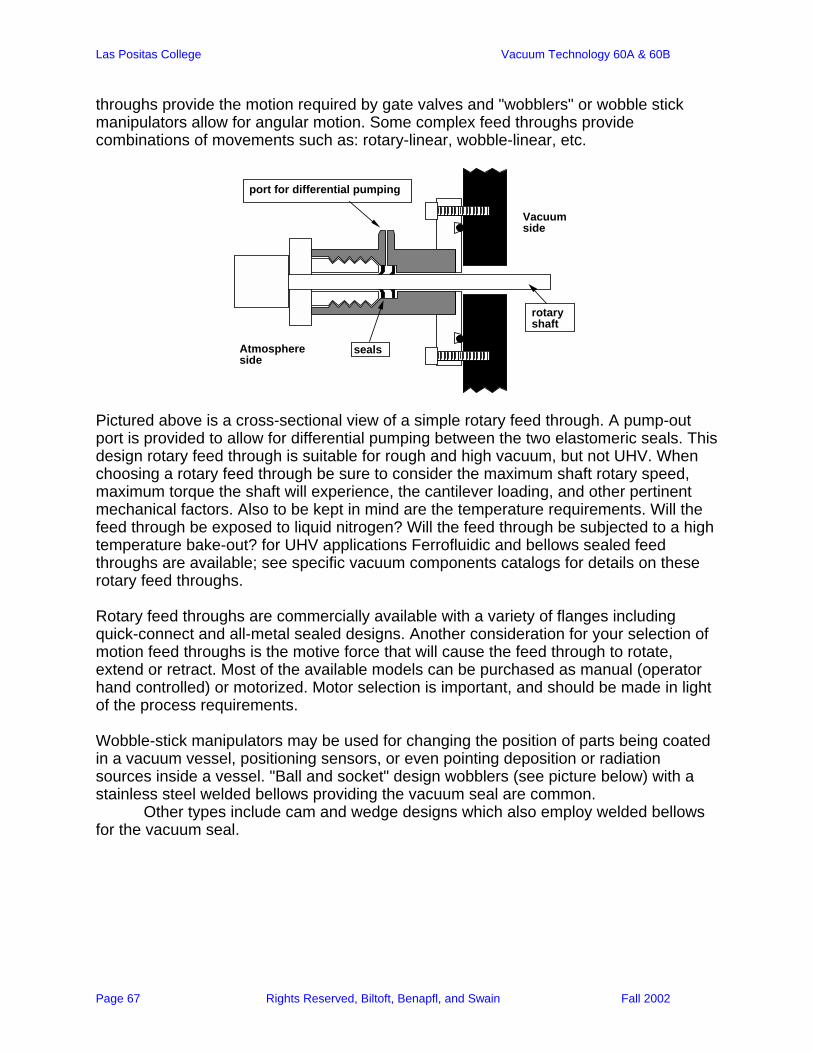
Las Positas College Vacuum Technology 60A & 60B
Page 67 Rights Reserved, Biltoft, Benapfl, and Swain Fall 2002
throughs provide the motion required by gate valves and "wobblers" or wobble stick manipulators allow for angular motion. Some complex feed throughs provide combinations of movements such as: rotary-linear, wobble-linear, etc.
port for differential pumping
seals
Vacuum side
Atmosphere side
rotary shaft
Pictured above is a cross-sectional view of a simple rotary feed through. A pump-out port is provided to allow for differential pumping between the two elastomeric seals. This design rotary feed through is suitable for rough and high vacuum, but not UHV. When choosing a rotary feed through be sure to consider the maximum shaft rotary speed, maximum torque the shaft will experience, the cantilever loading, and other pertinent mechanical factors. Also to be kept in mind are the temperature requirements. Will the feed through be exposed to liquid nitrogen? Will the feed through be subjected to a high temperature bake-out? for UHV applications Ferrofluidic and bellows sealed feed throughs are available; see specific vacuum components catalogs for details on these rotary feed throughs. Rotary feed throughs are commercially available with a variety of flanges including quick-connect and all-metal sealed designs. Another consideration for your selection of motion feed throughs is the motive force that will cause the feed through to rotate, extend or retract. Most of the available models can be purchased as manual (operator hand controlled) or motorized. Motor selection is important, and should be made in light of the process requirements. Wobble-stick manipulators may be used for changing the position of parts being coated in a vacuum vessel, positioning sensors, or even pointing deposition or radiation sources inside a vessel. "Ball and socket" design wobblers (see picture below) with a stainless steel welded bellows providing the vacuum seal are common. Other types include cam and wedge designs which also employ welded bellows for the vacuum seal.
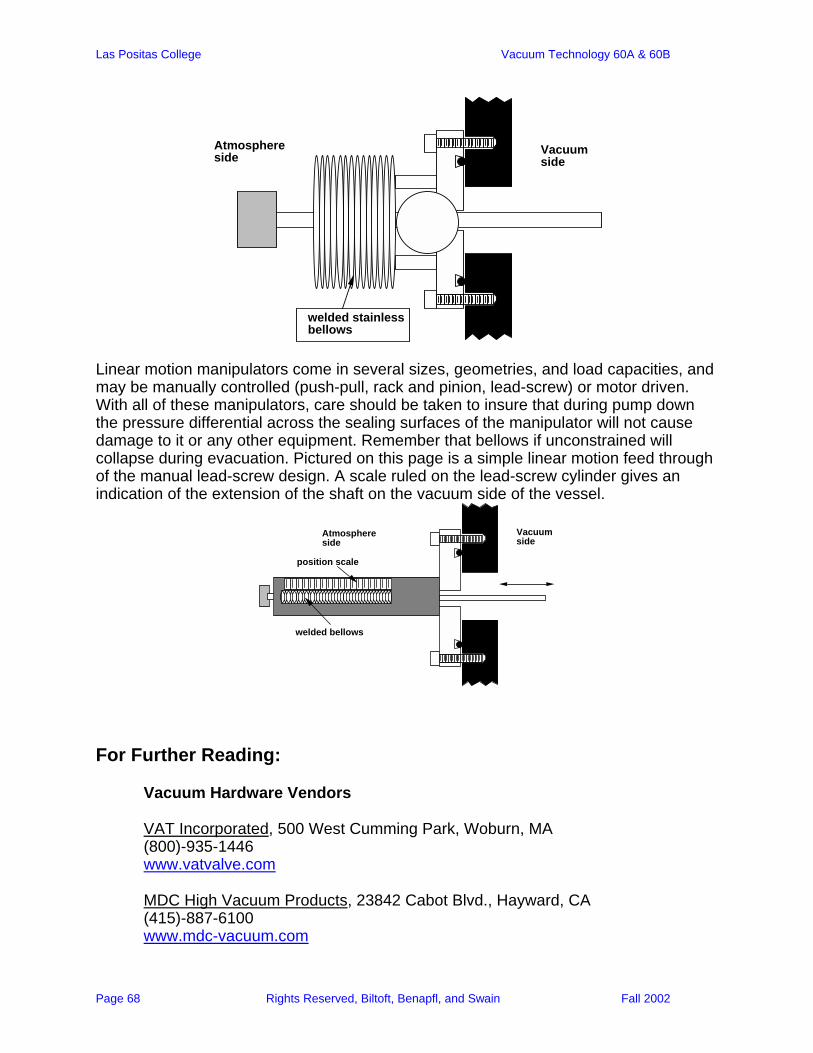
Las Positas College Vacuum Technology 60A & 60B
Page 68 Rights Reserved, Biltoft, Benapfl, and Swain Fall 2002
Vacuum side
Atmosphere side
welded stainless bellows
Linear motion manipulators come in several sizes, geometries, and load capacities, and may be manually controlled (push-pull, rack and pinion, lead-screw) or motor driven. With all of these manipulators, care should be taken to insure that during pump down the pressure differential across the sealing surfaces of the manipulator will not cause damage to it or any other equipment. Remember that bellows if unconstrained will collapse during evacuation. Pictured on this page is a simple linear motion feed through of the manual lead-screw design. A scale ruled on the lead-screw cylinder gives an indication of the extension of the shaft on the vacuum side of the vessel.
Vacuum side
Atmosphere side
position scale
welded bellows
For Further Reading:
Vacuum Hardware Vendors VAT Incorporated, 500 West Cumming Park, Woburn, MA (800)-935-1446
www.vatvalve.com MDC High Vacuum Products, 23842 Cabot Blvd., Hayward, CA (415)-887-6100
www.mdc-vacuum.com
Las Positas College Vacuum Technology 60A & 60B
Page 69 Rights Reserved, Biltoft, Benapfl, and Swain Fall 2002
Laboratory Exercise 4.1: Valve Identification and Inspection. Identify the vacuum valve you have selected. A. Valve Identification: Who is the manufacturer? What is the valve model number? Locate the manufacturer's literature from the bookcase, and find the appropriate reference information. What is the advertised conductance in viscous flow? In molecular flow? What pressure range is the valve designed for? B. Physical Inspection of the vacuum valve: Inspect the valve for signs of wear or misuse. Check the sealing surfaces, are they worn? Is the flapper actuator in good condition? Record your observations. Discussion:
What are the primary drivers for the cost of a vacuum valve besides price? Where would an Angle valve be preferred over a Gate valve? A Gate valve over an Angle valve?
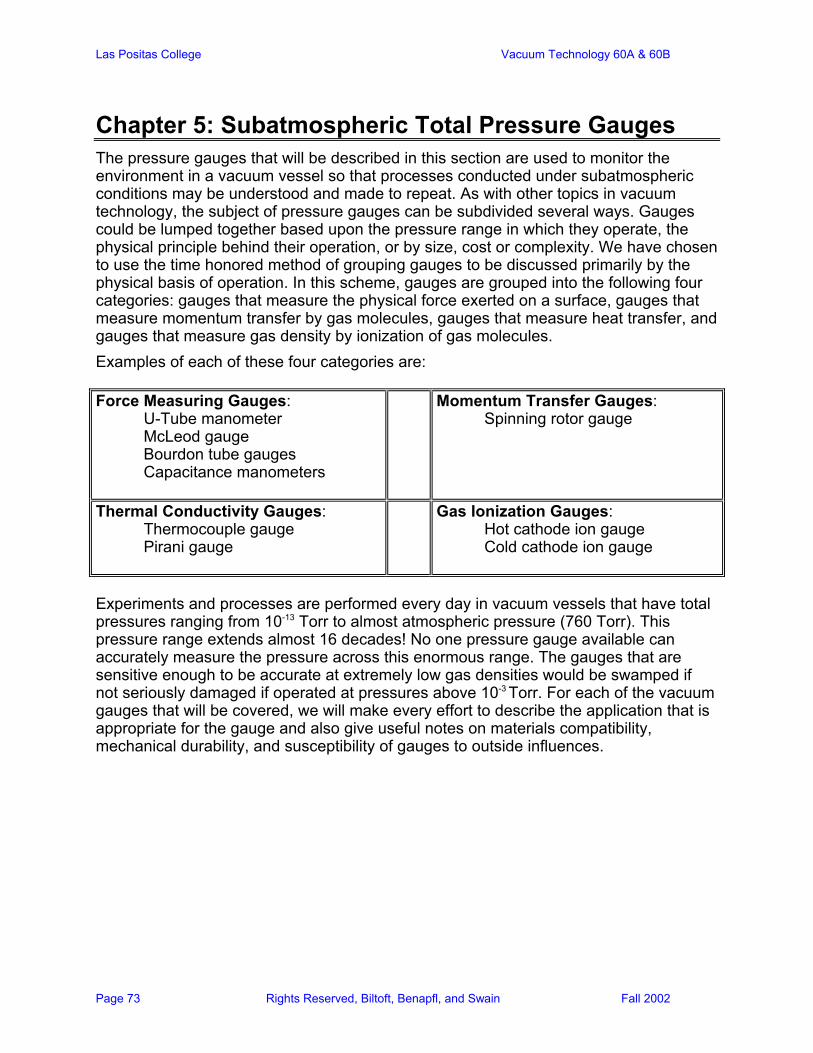
Las Positas College Vacuum Technology 60A & 60B
Page 73 Rights Reserved, Biltoft, Benapfl, and Swain Fall 2002
Chapter 5: Subatmospheric Total Pressure Gauges
The pressure gauges that will be described in this section are used to monitor the environment in a vacuum vessel so that processes conducted under subatmospheric conditions may be understood and made to repeat. As with other topics in vacuum technology, the subject of pressure gauges can be subdivided several ways. Gauges could be lumped together based upon the pressure range in which they operate, the physical principle behind their operation, or by size, cost or complexity. We have chosen to use the time honored method of grouping gauges to be discussed primarily by the physical basis of operation. In this scheme, gauges are grouped into the following four categories: gauges that measure the physical force exerted on a surface, gauges that measure momentum transfer by gas molecules, gauges that measure heat transfer, and gauges that measure gas density by ionization of gas molecules. Examples of each of these four categories are: Force Measuring Gauges: U-Tube manometer McLeod gauge Bourdon tube gauges Capacitance manometers
Momentum Transfer Gauges: Spinning rotor gauge
Thermal Conductivity Gauges: Thermocouple gauge Pirani gauge
Gas Ionization Gauges: Hot cathode ion gauge Cold cathode ion gauge
Experiments and processes are performed every day in vacuum vessels that have total pressures ranging from 10-13 Torr to almost atmospheric pressure (760 Torr). This pressure range extends almost 16 decades! No one pressure gauge available can accurately measure the pressure across this enormous range. The gauges that are sensitive enough to be accurate at extremely low gas densities would be swamped if not seriously damaged if operated at pressures above 10-3 Torr. For each of the vacuum gauges that will be covered, we will make every effort to describe the application that is appropriate for the gauge and also give useful notes on materials compatibility, mechanical durability, and susceptibility of gauges to outside influences.
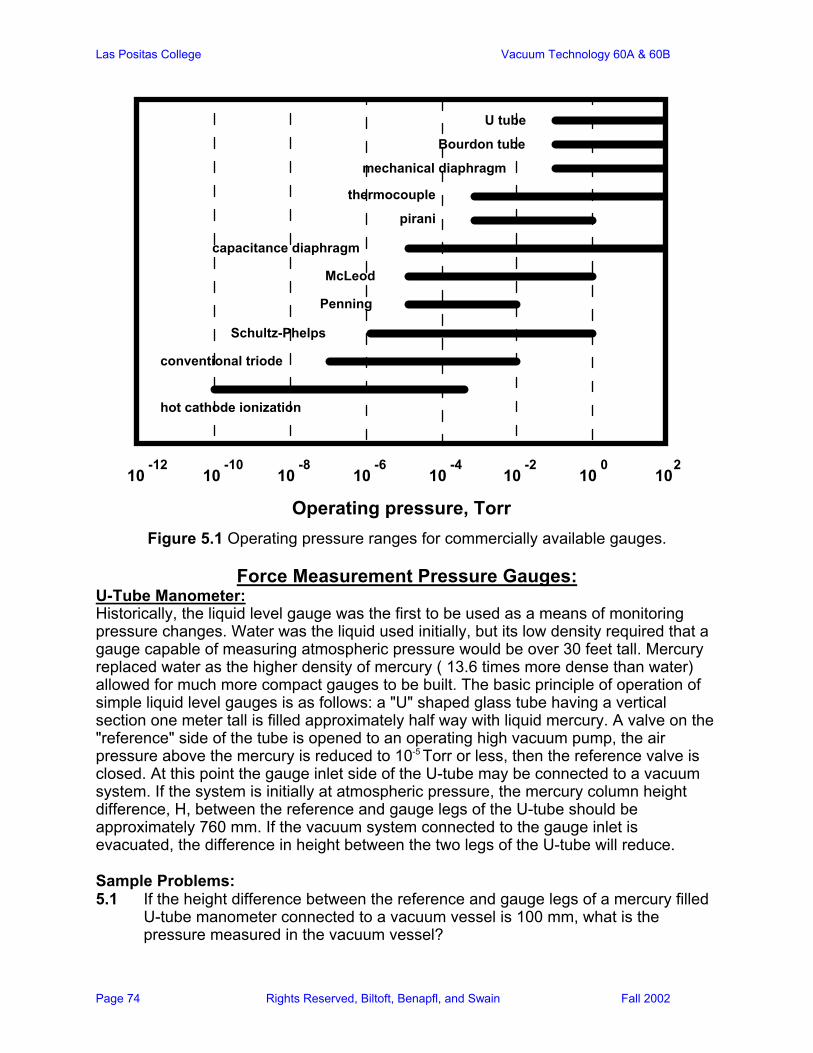
Las Positas College Vacuum Technology 60A & 60B
Page 74 Rights Reserved, Biltoft, Benapfl, and Swain Fall 2002
10 10 10 10 10 10 10 1020-2-4-6-8-10-12
U tube
Bourdon tube
mechanical diaphragm
thermocouple
pirani
capacitance diaphragm
McLeod
Penning
Schultz-Phelps
conventional triode
hot cathode ionization
Operating pressure, Torr Figure 5.1 Operating pressure ranges for commercially available gauges.
Force Measurement Pressure Gauges:
U-Tube Manometer: Historically, the liquid level gauge was the first to be used as a means of monitoring pressure changes. Water was the liquid used initially, but its low density required that a gauge capable of measuring atmospheric pressure would be over 30 feet tall. Mercury replaced water as the higher density of mercury ( 13.6 times more dense than water) allowed for much more compact gauges to be built. The basic principle of operation of simple liquid level gauges is as follows: a "U" shaped glass tube having a vertical section one meter tall is filled approximately half way with liquid mercury. A valve on the "reference" side of the tube is opened to an operating high vacuum pump, the air pressure above the mercury is reduced to 10-5 Torr or less, then the reference valve is closed. At this point the gauge inlet side of the U-tube may be connected to a vacuum system. If the system is initially at atmospheric pressure, the mercury column height difference, H, between the reference and gauge legs of the U-tube should be approximately 760 mm. If the vacuum system connected to the gauge inlet is evacuated, the difference in height between the two legs of the U-tube will reduce. Sample Problems: 5.1 If the height difference between the reference and gauge legs of a mercury filled
U-tube manometer connected to a vacuum vessel is 100 mm, what is the pressure measured in the vacuum vessel?
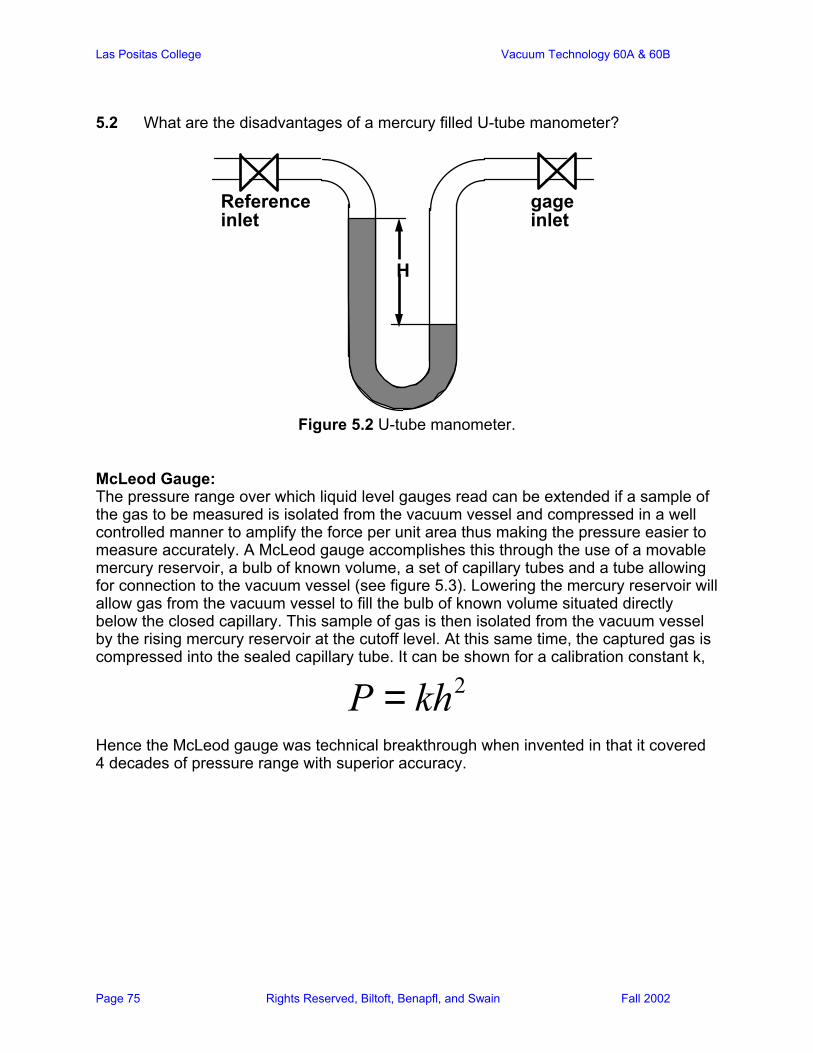
Las Positas College Vacuum Technology 60A & 60B
Page 75 Rights Reserved, Biltoft, Benapfl, and Swain Fall 2002
5.2 What are the disadvantages of a mercury filled U-tube manometer?
H
Reference inlet
gage inlet
Figure 5.2 U-tube manometer.
McLeod Gauge: The pressure range over which liquid level gauges read can be extended if a sample of the gas to be measured is isolated from the vacuum vessel and compressed in a well controlled manner to amplify the force per unit area thus making the pressure easier to measure accurately. A McLeod gauge accomplishes this through the use of a movable mercury reservoir, a bulb of known volume, a set of capillary tubes and a tube allowing for connection to the vacuum vessel (see figure 5.3). Lowering the mercury reservoir will allow gas from the vacuum vessel to fill the bulb of known volume situated directly below the closed capillary. This sample of gas is then isolated from the vacuum vessel by the rising mercury reservoir at the cutoff level. At this same time, the captured gas is compressed into the sealed capillary tube. It can be shown for a calibration constant k,
2P kh=
Hence the McLeod gauge was technical breakthrough when invented in that it covered 4 decades of pressure range with superior accuracy.
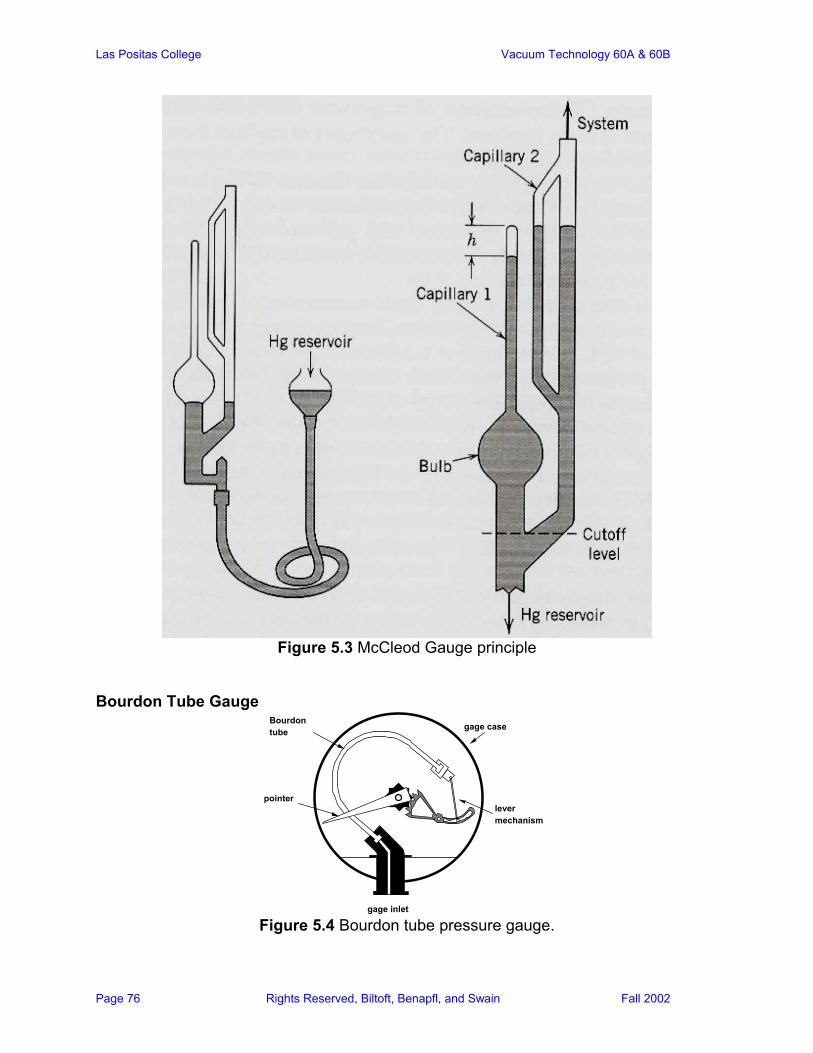
Las Positas College Vacuum Technology 60A & 60B
Page 76 Rights Reserved, Biltoft, Benapfl, and Swain Fall 2002
Figure 5.3 McCleod Gauge principle
Bourdon Tube Gauge
gage inlet
lever mechanism
Bourdon tube
pointer
gage case
Figure 5.4 Bourdon tube pressure gauge.
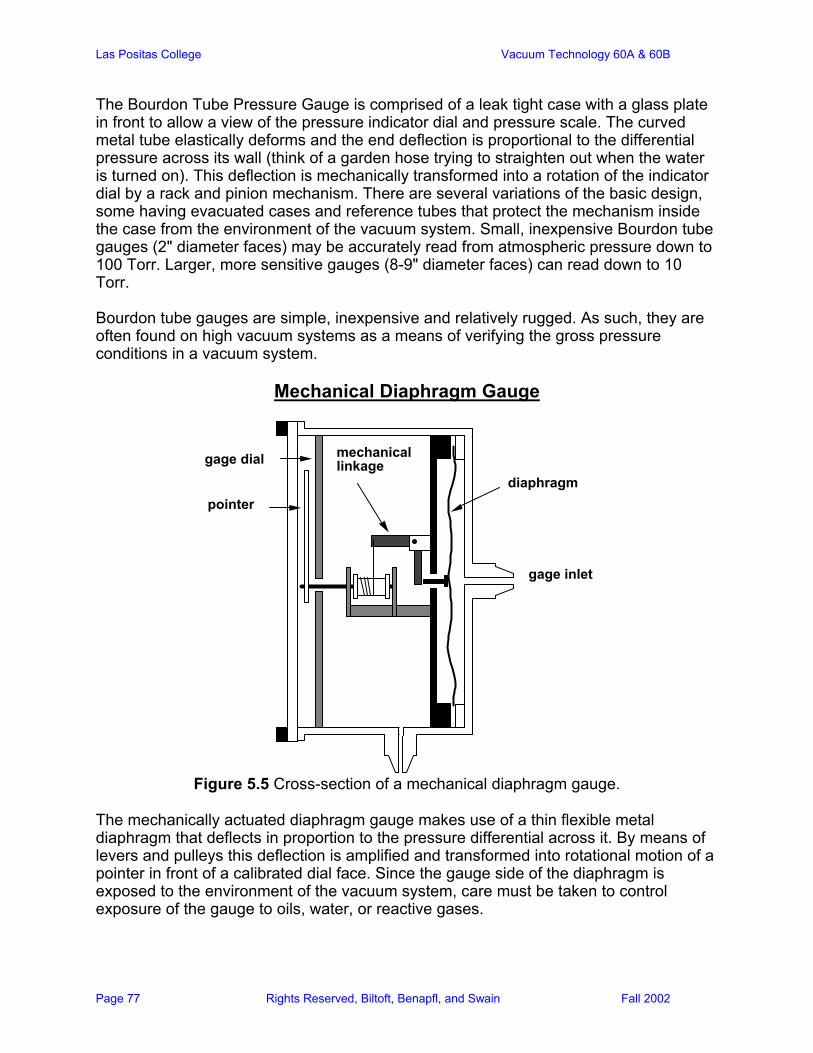
Las Positas College Vacuum Technology 60A & 60B
Page 77 Rights Reserved, Biltoft, Benapfl, and Swain Fall 2002
The Bourdon Tube Pressure Gauge is comprised of a leak tight case with a glass plate in front to allow a view of the pressure indicator dial and pressure scale. The curved metal tube elastically deforms and the end deflection is proportional to the differential pressure across its wall (think of a garden hose trying to straighten out when the water is turned on). This deflection is mechanically transformed into a rotation of the indicator dial by a rack and pinion mechanism. There are several variations of the basic design, some having evacuated cases and reference tubes that protect the mechanism inside the case from the environment of the vacuum system. Small, inexpensive Bourdon tube gauges (2" diameter faces) may be accurately read from atmospheric pressure down to 100 Torr. Larger, more sensitive gauges (8-9" diameter faces) can read down to 10 Torr. Bourdon tube gauges are simple, inexpensive and relatively rugged. As such, they are often found on high vacuum systems as a means of verifying the gross pressure conditions in a vacuum system.
Mechanical Diaphragm Gauge
gage inlet
diaphragm
mechanical linkage
pointer
gage dial
Figure 5.5 Cross-section of a mechanical diaphragm gauge.
The mechanically actuated diaphragm gauge makes use of a thin flexible metal diaphragm that deflects in proportion to the pressure differential across it. By means of levers and pulleys this deflection is amplified and transformed into rotational motion of a pointer in front of a calibrated dial face. Since the gauge side of the diaphragm is exposed to the environment of the vacuum system, care must be taken to control exposure of the gauge to oils, water, or reactive gases.
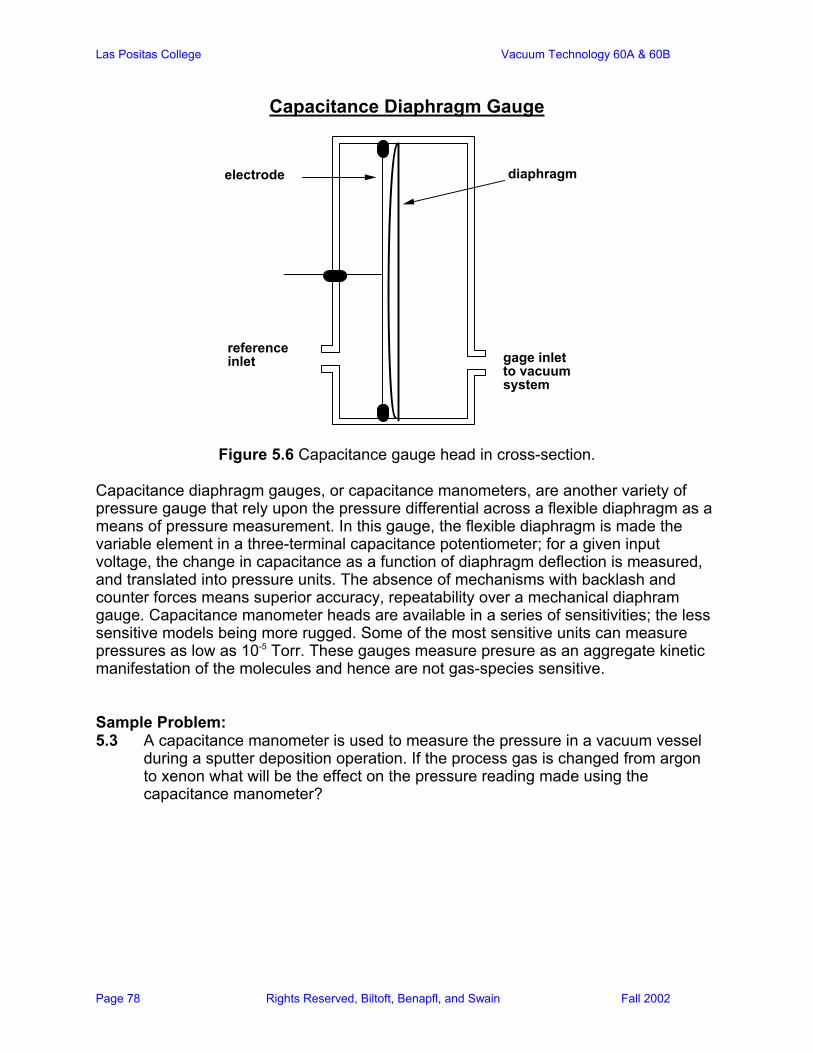
Las Positas College Vacuum Technology 60A & 60B
Page 78 Rights Reserved, Biltoft, Benapfl, and Swain Fall 2002
Capacitance Diaphragm Gauge
gage inlet to vacuum system
reference inlet
electrode diaphragm
Figure 5.6 Capacitance gauge head in cross-section. Capacitance diaphragm gauges, or capacitance manometers, are another variety of pressure gauge that rely upon the pressure differential across a flexible diaphragm as a means of pressure measurement. In this gauge, the flexible diaphragm is made the variable element in a three-terminal capacitance potentiometer; for a given input voltage, the change in capacitance as a function of diaphragm deflection is measured, and translated into pressure units. The absence of mechanisms with backlash and counter forces means superior accuracy, repeatability over a mechanical diaphram gauge. Capacitance manometer heads are available in a series of sensitivities; the less sensitive models being more rugged. Some of the most sensitive units can measure pressures as low as 10-5 Torr. These gauges measure presure as an aggregate kinetic manifestation of the molecules and hence are not gas-species sensitive. Sample Problem: 5.3 A capacitance manometer is used to measure the pressure in a vacuum vessel
during a sputter deposition operation. If the process gas is changed from argon to xenon what will be the effect on the pressure reading made using the capacitance manometer?
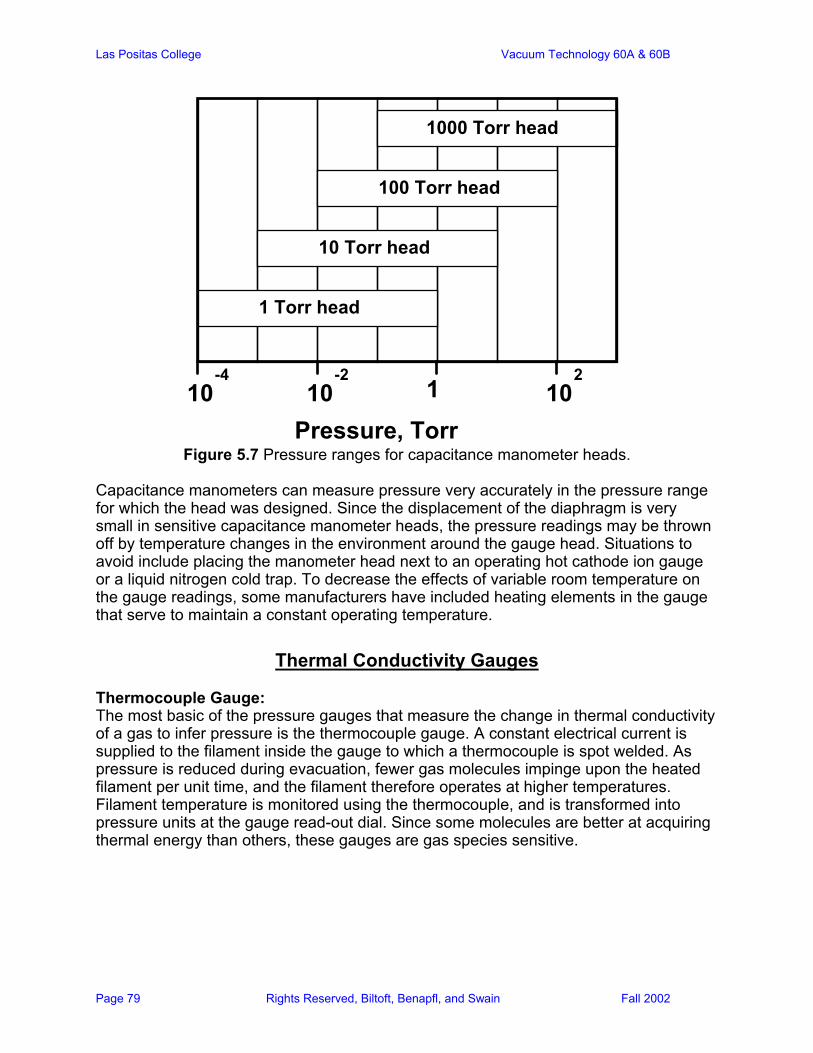
Las Positas College Vacuum Technology 60A & 60B
Page 79 Rights Reserved, Biltoft, Benapfl, and Swain Fall 2002
1,000 Torr head
1 Torr head
10 Torr head
100 Torr head
1000 Torr head
10 10 101-4 -2 2
Pressure, Torr Figure 5.7 Pressure ranges for capacitance manometer heads.
Capacitance manometers can measure pressure very accurately in the pressure range for which the head was designed. Since the displacement of the diaphragm is very small in sensitive capacitance manometer heads, the pressure readings may be thrown off by temperature changes in the environment around the gauge head. Situations to avoid include placing the manometer head next to an operating hot cathode ion gauge or a liquid nitrogen cold trap. To decrease the effects of variable room temperature on the gauge readings, some manufacturers have included heating elements in the gauge that serve to maintain a constant operating temperature.
Thermal Conductivity Gauges Thermocouple Gauge: The most basic of the pressure gauges that measure the change in thermal conductivity of a gas to infer pressure is the thermocouple gauge. A constant electrical current is supplied to the filament inside the gauge to which a thermocouple is spot welded. As pressure is reduced during evacuation, fewer gas molecules impinge upon the heated filament per unit time, and the filament therefore operates at higher temperatures. Filament temperature is monitored using the thermocouple, and is transformed into pressure units at the gauge read-out dial. Since some molecules are better at acquiring thermal energy than others, these gauges are gas species sensitive.
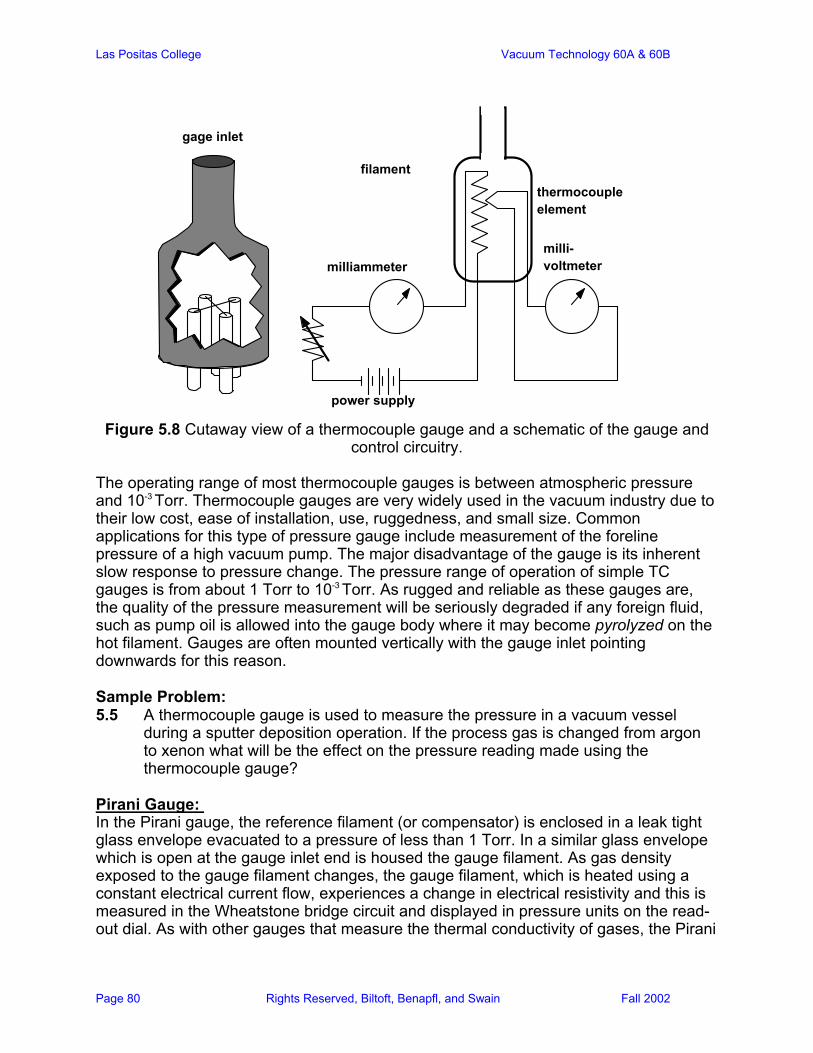
Las Positas College Vacuum Technology 60A & 60B
Page 80 Rights Reserved, Biltoft, Benapfl, and Swain Fall 2002
gage inlet
power supply
milliammetermilli- voltmeter
filament
thermocouple element
Figure 5.8 Cutaway view of a thermocouple gauge and a schematic of the gauge and
control circuitry. The operating range of most thermocouple gauges is between atmospheric pressure and 10-3 Torr. Thermocouple gauges are very widely used in the vacuum industry due to their low cost, ease of installation, use, ruggedness, and small size. Common applications for this type of pressure gauge include measurement of the foreline pressure of a high vacuum pump. The major disadvantage of the gauge is its inherent slow response to pressure change. The pressure range of operation of simple TC gauges is from about 1 Torr to 10-3 Torr. As rugged and reliable as these gauges are, the quality of the pressure measurement will be seriously degraded if any foreign fluid, such as pump oil is allowed into the gauge body where it may become pyrolyzed on the hot filament. Gauges are often mounted vertically with the gauge inlet pointing downwards for this reason. Sample Problem: 5.5 A thermocouple gauge is used to measure the pressure in a vacuum vessel
during a sputter deposition operation. If the process gas is changed from argon to xenon what will be the effect on the pressure reading made using the thermocouple gauge?
Pirani Gauge: In the Pirani gauge, the reference filament (or compensator) is enclosed in a leak tight glass envelope evacuated to a pressure of less than 1 Torr. In a similar glass envelope which is open at the gauge inlet end is housed the gauge filament. As gas density exposed to the gauge filament changes, the gauge filament, which is heated using a constant electrical current flow, experiences a change in electrical resistivity and this is measured in the Wheatstone bridge circuit and displayed in pressure units on the read-out dial. As with other gauges that measure the thermal conductivity of gases, the Pirani

Las Positas College Vacuum Technology 60A & 60B
Page 81 Rights Reserved, Biltoft, Benapfl, and Swain Fall 2002
gauge does not read pressure changes instantaneously. Some time is required for the heated filament to respond to changes in its environment.
reference fila(inside sealed tube)
gage filament (inside open tube)
power supply
reference filament gage
filament
meter
Figure 5.9 Pirani gauge drawing (above) and control circuit (below).
Convectron Gauge: A useful (and patented) modification of the thermal conductivity gauge allows for measurement of convection currents at higher pressures, increasing the range of this gauge to atmospheric pressure. Convectron gauges typically include a gold plated tungsten sensing wire surrounded by a cylinder wound with kovar wire. This cylindrical temperature compensator helps to reduce the effect changes in ambient temperature has on the gauge readings. The large volume inside the compensator provides space for convection currents to develop at higher gas densities (1 Torr to atmospheric pressure), improving the resolution of the gauge at the high pressure end of its range of operation. Because this gauge uses convection currents to infer gas pressure,

Las Positas College Vacuum Technology 60A & 60B
Page 82 Rights Reserved, Biltoft, Benapfl, and Swain Fall 2002
orientation of the gauge is critical. The body of a convectron gauge should always be oriented horizontally (as shown below, in figure 5.8).
Temperature compensator windings (Kovar wire)heated sensor wire (gold coated tungsten)
gage body
to vacuum environment
Figure 5.10 Cutaway view of a convectron gauge.
Gas Ionization Gauges Gas density (and pressure) may be deduced from the ability of the gas to undergo ionization caused by electron impact with the gas molecules. The ionization gauges that will be discussed here are both designed for use in the medium to ultra-high vacuum range (10-3 Torr to 10-10 Torr). Hot Cathode Ionization gauge: Also called the Bayard-Alpert gauge, the hot cathode ion gauge is a simple and reliable gauge that is widely used in vacuum processing industries. The triode (three electrode) design is easily understood if we examine each component independently, become familiar with its function, then see how they work together. The filament is usually a thin ribbon of tungsten which is in the shape of a coil or inverted "vee". Low voltage electric current from the gauge power supply is passed through the filament which heats up much like the filament in an incandescent light bulb (operating temperature of a gauge filament is almost 1800°C). In addition to heat and light, the filament emits enormous quantities of electrons which can collide with gas atoms and in that collision, eject an electron from the gas atom making it an ion. Electrons from the filament are attracted to a helical "grid" or electron collector which is maintained at a positive voltage of approximately 150V with respect to the filament. The additional energy input into the electrons by the electron collector bias is to insure efficient ionization of gases in the gauge. Finally, the gas ions created are collected on an ion collector operated at zero volts with respect to the electron collector.
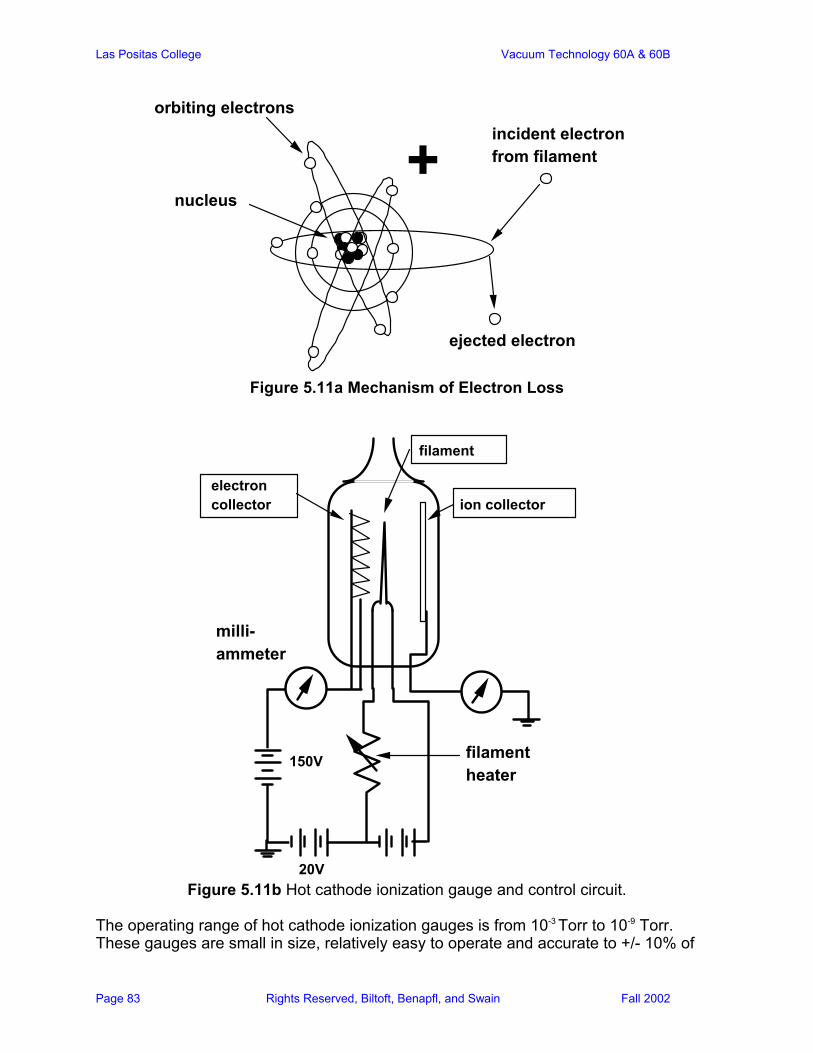
Las Positas College Vacuum Technology 60A & 60B
Page 83 Rights Reserved, Biltoft, Benapfl, and Swain Fall 2002
nucleus
orbiting electrons
+incident electron from filament
ejected electron
Figure 5.11a Mechanism of Electron Loss
150V filament heater
milli- ammeter
20V
filament
ion collectorelectron collector
Figure 5.11b Hot cathode ionization gauge and control circuit.
The operating range of hot cathode ionization gauges is from 10-3 Torr to 10-9 Torr. These gauges are small in size, relatively easy to operate and accurate to +/- 10% of
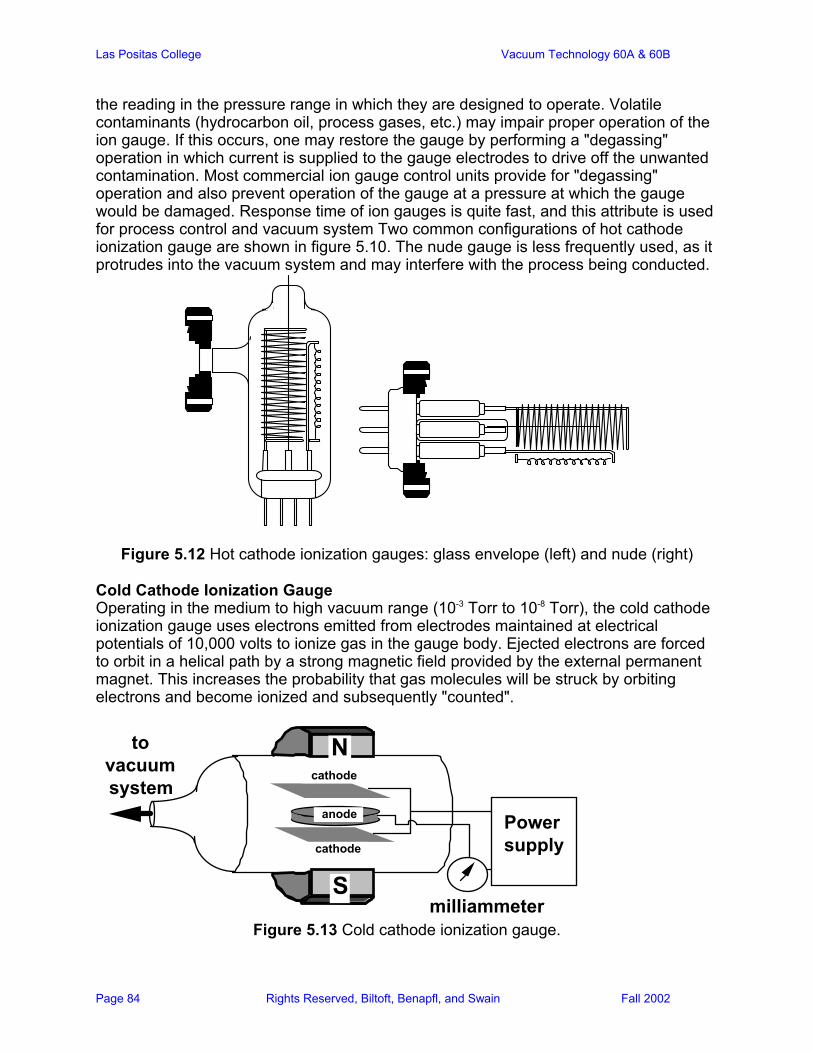
Las Positas College Vacuum Technology 60A & 60B
Page 84 Rights Reserved, Biltoft, Benapfl, and Swain Fall 2002
the reading in the pressure range in which they are designed to operate. Volatile contaminants (hydrocarbon oil, process gases, etc.) may impair proper operation of the ion gauge. If this occurs, one may restore the gauge by performing a "degassing" operation in which current is supplied to the gauge electrodes to drive off the unwanted contamination. Most commercial ion gauge control units provide for "degassing" operation and also prevent operation of the gauge at a pressure at which the gauge would be damaged. Response time of ion gauges is quite fast, and this attribute is used for process control and vacuum system Two common configurations of hot cathode ionization gauge are shown in figure 5.10. The nude gauge is less frequently used, as it protrudes into the vacuum system and may interfere with the process being conducted.
Figure 5.12 Hot cathode ionization gauges: glass envelope (left) and nude (right) Cold Cathode Ionization Gauge Operating in the medium to high vacuum range (10-3 Torr to 10-8 Torr), the cold cathode ionization gauge uses electrons emitted from electrodes maintained at electrical potentials of 10,000 volts to ionize gas in the gauge body. Ejected electrons are forced to orbit in a helical path by a strong magnetic field provided by the external permanent magnet. This increases the probability that gas molecules will be struck by orbiting electrons and become ionized and subsequently "counted".
Power supply
milliammeter
cathode
cathode
anode
to vacuum system
N
S
Figure 5.13 Cold cathode ionization gauge.
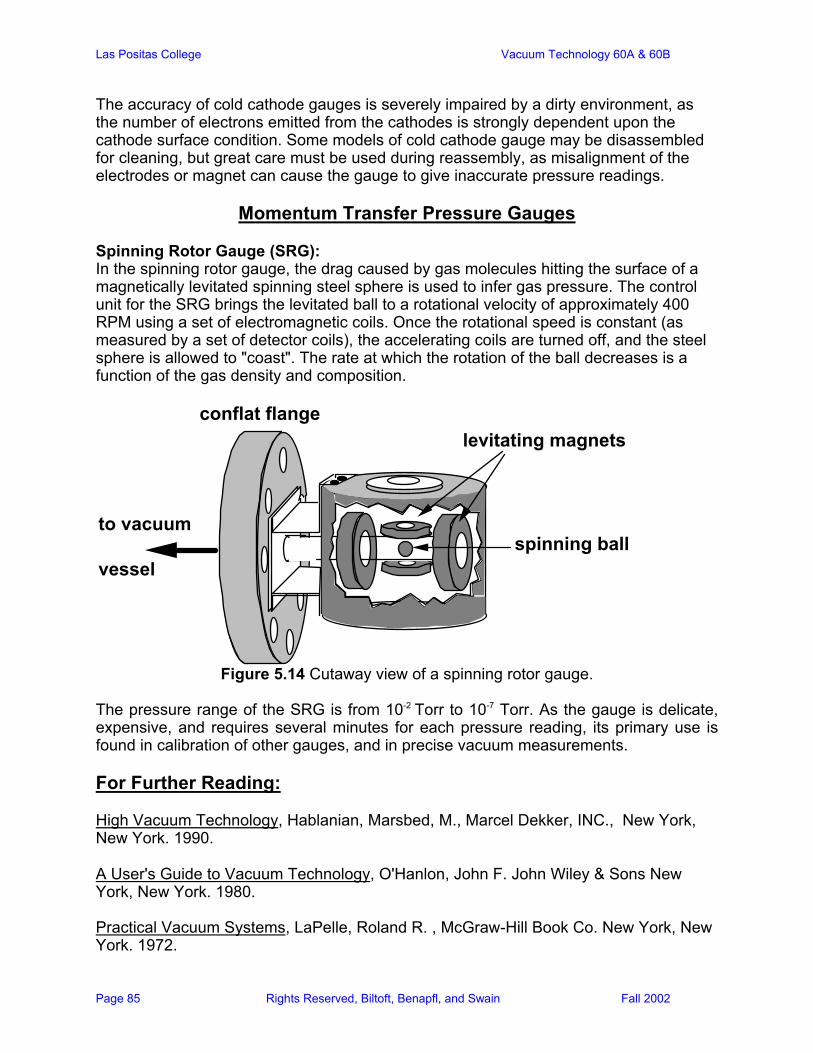
Las Positas College Vacuum Technology 60A & 60B
Page 85 Rights Reserved, Biltoft, Benapfl, and Swain Fall 2002
The accuracy of cold cathode gauges is severely impaired by a dirty environment, as the number of electrons emitted from the cathodes is strongly dependent upon the cathode surface condition. Some models of cold cathode gauge may be disassembled for cleaning, but great care must be used during reassembly, as misalignment of the electrodes or magnet can cause the gauge to give inaccurate pressure readings.
Momentum Transfer Pressure Gauges
Spinning Rotor Gauge (SRG): In the spinning rotor gauge, the drag caused by gas molecules hitting the surface of a magnetically levitated spinning steel sphere is used to infer gas pressure. The control unit for the SRG brings the levitated ball to a rotational velocity of approximately 400 RPM using a set of electromagnetic coils. Once the rotational speed is constant (as measured by a set of detector coils), the accelerating coils are turned off, and the steel sphere is allowed to "coast". The rate at which the rotation of the ball decreases is a function of the gas density and composition.
levitating magnets
spinning ball
conflat flange
to vacuum vessel
Figure 5.14 Cutaway view of a spinning rotor gauge.
The pressure range of the SRG is from 10-2 Torr to 10-7 Torr. As the gauge is delicate, expensive, and requires several minutes for each pressure reading, its primary use is found in calibration of other gauges, and in precise vacuum measurements. For Further Reading: High Vacuum Technology, Hablanian, Marsbed, M., Marcel Dekker, INC., New York, New York. 1990. A User's Guide to Vacuum Technology, O'Hanlon, John F. John Wiley & Sons New York, New York. 1980. Practical Vacuum Systems, LaPelle, Roland R. , McGraw-Hill Book Co. New York, New York. 1972.
Las Positas College Vacuum Technology 60A & 60B
Page 86 Rights Reserved, Biltoft, Benapfl, and Swain Fall 2002
Answers to Chapter 5 Sample Problems 5.1 100 Torr. 5.2 There are some distinct disadvantages to the U-tube manometer that explains
why they are not widely used. The pressure range of U-tubes is limited; carefully constructed models can only read pressure from atmospheric down to about 1 Torr. Mercury has the obvious health and safety concerns, but also may cause problems if the process being measured reacts chemically with mercury vapor. Other concerns include the substantial equilibrium vapor pressure of mercury at room temperature and the fragile nature of the glass tubulation.
Laboratory Exercise 5.1: Pressure Gauge Identification and Inspection Identify the vacuum gauge you have selected for this exercise: A. Gauge Identification: What is the principle of operation? Who is the manufacturer? What is the gauge model number? Locate the manufacturer's literature from the bookcase and find the appropriate reference information. What is the advertised pressure range? Is the gauge gas specific? Are there any calibration curves available to aid in understanding the performance of the gauge as a function of pressure or gas specie? B. Physical Inspection of Pressure Gauge: Inspect the gauge for signs of wear or misuse. What type of vacuum connection is provided? Is this connection appropriate for the application the gauge was designed for? Locate the gauge control unit and/or power supply (if applicable). Check electrical cables of the power supply for cracks in insulation. Laboratory Exercise 5.2: Operation of Spinning Rotor Gauge Before beginning this procedure, read the operating manual carefully. Procedure: Assemble an operating vacuum system capable of attaining a pressure of 10-5 Torr or lower using an ion pump as the high vacuum pump. Operate the SRG following the instructions in the manual. Discussion:
• What assumptions did you make in the gauge calibration? • How did the gauge perform compared to the hot cathode ion gauge? • Can you explain any inconsistencies you observed?
Las Positas College Vacuum Technology 60A & 60B
Page 87 Rights Reserved, Biltoft, Benapfl, and Swain Fall 2002
Chapter 6: Mechanical Vacuum Pumps In this chapter we will review the principles of operation of several commonly used mechanical vacuum pumps, provide information on the performance and typical applications, and describe appropriate preventative maintenance techniques. This chapter also includes several laboratory procedures that are designed to aid in your understanding of mechanical vacuum pumps. Positive gas displacement pumps of one type or another have been used since 1640! Almost all of the very early pumps used liquid mercury within glass tubes and vessels to create a vacuum. For an excellent review of this early technology, read the History of Vacuum Science and Technology, edited by T.E. Madley and W.C Brown, published for the American Vacuum Society by the American Institute of Physics. Modern mechanical pumps may well be considered the workhorses of vacuum technology; they are simple in design, require little maintenance, are relatively inexpensive, and can operate for long periods of time without failure. Several mechanical vacuum pumps that we are aware of have operated continuously for fifteen years with only occasional oil changes! The range of pumping speeds for commercially available pumps runs from about 0.5 liters per second to over 300 liters per second. Mechanical vacuum pumps fall into two basic categories: reciprocating pumps, and rotary pumps. Further distinctions for mechanical pumps include: the number of stages (single stage or compound), the use of oil in a pump (pumps may be oil sealed or "dry"), and the means of driving the mechanics of a pump (direct drive or belt drive). Below is a brief outline of the types of modern mechanical vacuum pumps. + Mechanical positive displacement pumps + Reciprocating positive displacement pumps - Diaphragm pump - Piston pump + Rotary positive displacement Pumps - Liquid ring pump + Sliding vane pump - multiple vane rotary pump - Rotary piston pump - Rotary plunger pump - Roots pump For this laboratory, we will concentrate on two oil sealed mechanical pumps: the sliding vane rotary pump, and the rotary piston pump.
Theory of Operation
Mechanical vacuum pumps work by the process of positive gas displacement, that is, during operation the pump periodically creates increasing and decreasing volumes to remove gases from the system, and exhaust them to the atmosphere. In most designs a motor driven rotor spins inside a cylindrical stator of larger diameter. The ratio of the exhaust pressure (atmospheric) to the base pressure (lowest pressure obtained at the
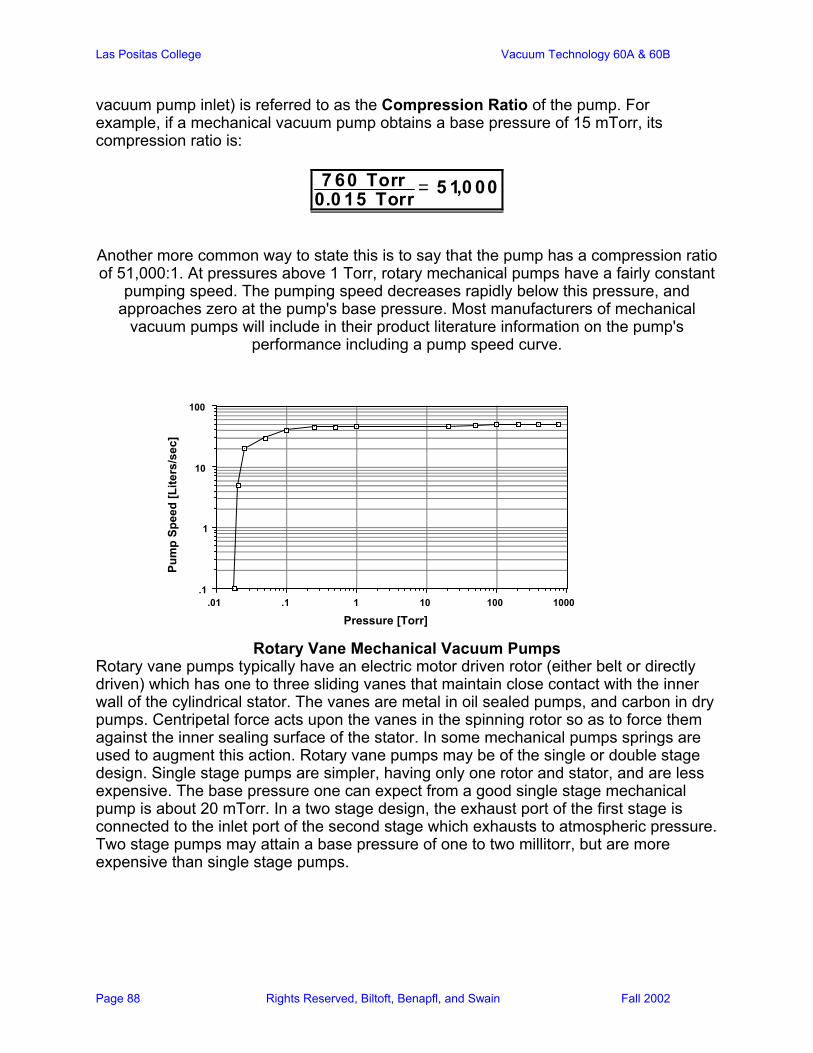
Las Positas College Vacuum Technology 60A & 60B
Page 88 Rights Reserved, Biltoft, Benapfl, and Swain Fall 2002
vacuum pump inlet) is referred to as the Compression Ratio of the pump. For example, if a mechanical vacuum pump obtains a base pressure of 15 mTorr, its compression ratio is:
7 60 Torr0.0 15 Torr = 5 1,0 00
Another more common way to state this is to say that the pump has a compression ratio of 51,000:1. At pressures above 1 Torr, rotary mechanical pumps have a fairly constant
pumping speed. The pumping speed decreases rapidly below this pressure, and approaches zero at the pump's base pressure. Most manufacturers of mechanical
vacuum pumps will include in their product literature information on the pump's performance including a pump speed curve.
1000100101.1.01.1
1
10
100
Pressure [Torr]
Pum
p Sp
eed
[Lite
rs/s
ec]
Rotary Vane Mechanical Vacuum Pumps
Rotary vane pumps typically have an electric motor driven rotor (either belt or directly driven) which has one to three sliding vanes that maintain close contact with the inner wall of the cylindrical stator. The vanes are metal in oil sealed pumps, and carbon in dry pumps. Centripetal force acts upon the vanes in the spinning rotor so as to force them against the inner sealing surface of the stator. In some mechanical pumps springs are used to augment this action. Rotary vane pumps may be of the single or double stage design. Single stage pumps are simpler, having only one rotor and stator, and are less expensive. The base pressure one can expect from a good single stage mechanical pump is about 20 mTorr. In a two stage design, the exhaust port of the first stage is connected to the inlet port of the second stage which exhausts to atmospheric pressure. Two stage pumps may attain a base pressure of one to two millitorr, but are more expensive than single stage pumps.

Las Positas College Vacuum Technology 60A & 60B
Page 89 Rights Reserved, Biltoft, Benapfl, and Swain Fall 2002
12
In the figure above are simplified drawings of a single stage oil sealed rotary vane mechanical pump (left) and a two stage, or compound pump of the same type. In the compound design the high vacuum side of the pump (stage labeled 1) operates at a lower pressure due to the lack of exposure to high partial pressures of oxygen in that stage. It should be noted that supply of very little or no oil to the first stage of a compound pump in order to achieve even lower pressures can, in practice, lead to severe difficulties in the reliable operation of a compound pump. The oil in an oil sealed pump serves three important functions: A) providing a vacuum seal at the pump exhaust, B) as a lubricant and C) provides cooling for the pump.
1 2
3 4
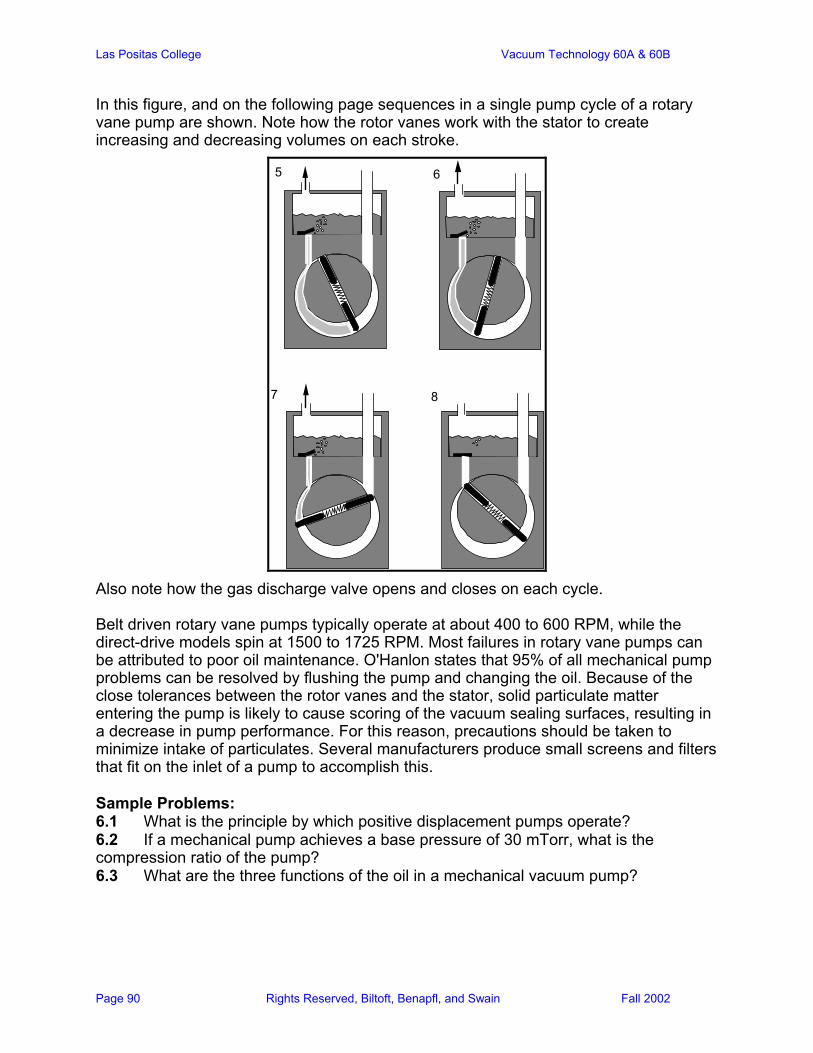
Las Positas College Vacuum Technology 60A & 60B
Page 90 Rights Reserved, Biltoft, Benapfl, and Swain Fall 2002
In this figure, and on the following page sequences in a single pump cycle of a rotary vane pump are shown. Note how the rotor vanes work with the stator to create increasing and decreasing volumes on each stroke.
7
5 6
8
Also note how the gas discharge valve opens and closes on each cycle. Belt driven rotary vane pumps typically operate at about 400 to 600 RPM, while the direct-drive models spin at 1500 to 1725 RPM. Most failures in rotary vane pumps can be attributed to poor oil maintenance. O'Hanlon states that 95% of all mechanical pump problems can be resolved by flushing the pump and changing the oil. Because of the close tolerances between the rotor vanes and the stator, solid particulate matter entering the pump is likely to cause scoring of the vacuum sealing surfaces, resulting in a decrease in pump performance. For this reason, precautions should be taken to minimize intake of particulates. Several manufacturers produce small screens and filters that fit on the inlet of a pump to accomplish this. Sample Problems: 6.1 What is the principle by which positive displacement pumps operate? 6.2 If a mechanical pump achieves a base pressure of 30 mTorr, what is the compression ratio of the pump? 6.3 What are the three functions of the oil in a mechanical vacuum pump?
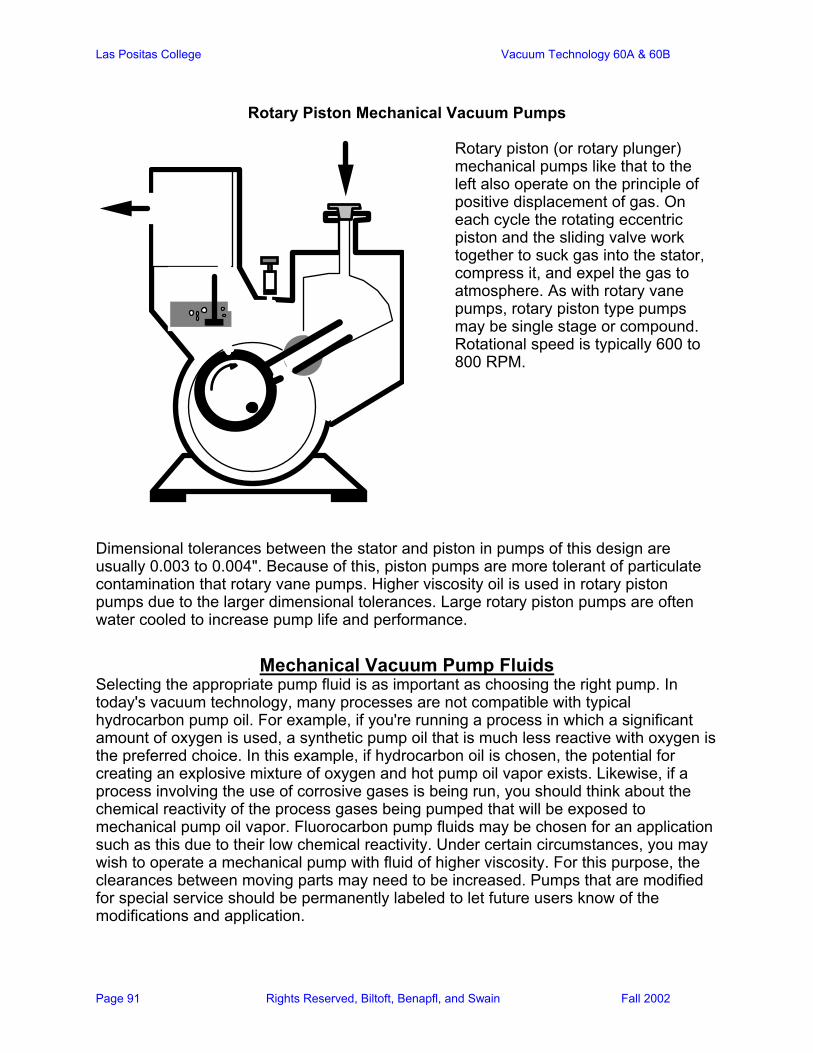
Las Positas College Vacuum Technology 60A & 60B
Page 91 Rights Reserved, Biltoft, Benapfl, and Swain Fall 2002
Rotary Piston Mechanical Vacuum Pumps
Rotary piston (or rotary plunger) mechanical pumps like that to the left also operate on the principle of positive displacement of gas. On each cycle the rotating eccentric piston and the sliding valve work together to suck gas into the stator, compress it, and expel the gas to atmosphere. As with rotary vane pumps, rotary piston type pumps may be single stage or compound. Rotational speed is typically 600 to 800 RPM.
Dimensional tolerances between the stator and piston in pumps of this design are usually 0.003 to 0.004". Because of this, piston pumps are more tolerant of particulate contamination that rotary vane pumps. Higher viscosity oil is used in rotary piston pumps due to the larger dimensional tolerances. Large rotary piston pumps are often water cooled to increase pump life and performance.
Mechanical Vacuum Pump Fluids Selecting the appropriate pump fluid is as important as choosing the right pump. In today's vacuum technology, many processes are not compatible with typical hydrocarbon pump oil. For example, if you're running a process in which a significant amount of oxygen is used, a synthetic pump oil that is much less reactive with oxygen is the preferred choice. In this example, if hydrocarbon oil is chosen, the potential for creating an explosive mixture of oxygen and hot pump oil vapor exists. Likewise, if a process involving the use of corrosive gases is being run, you should think about the chemical reactivity of the process gases being pumped that will be exposed to mechanical pump oil vapor. Fluorocarbon pump fluids may be chosen for an application such as this due to their low chemical reactivity. Under certain circumstances, you may wish to operate a mechanical pump with fluid of higher viscosity. For this purpose, the clearances between moving parts may need to be increased. Pumps that are modified for special service should be permanently labeled to let future users know of the modifications and application.

Las Positas College Vacuum Technology 60A & 60B
Page 92 Rights Reserved, Biltoft, Benapfl, and Swain Fall 2002
One last word on mechanical vacuum pump fluids-research the characteristics of a fluid carefully before using it. Many of the current commercially available fluids will not operate well when mixed with one another! For a good review of mechanical pump fluids, see O'Hanlon's A User's Guide to Vacuum Technology, page 163.
Dry Mechanical Vacuum Pumps In recent years, the concern over mechanical pump fluids (from both safety and vacuum system contamination standpoints) has become a great concern. Vacuum pump manufacturers have responded by developing and marketing oil-free mechanical roughing pumps. These pumps have, for some applications, very appealing characteristics, but there are a few drawbacks of which to be aware. The advantages of dry pumps (usually of the rotary vane design) are that they eliminate the possibility of backstreaming pump oil into your vacuum vessel. In addition, dry pumps may be used to safely pump large percentages of oxygen without fear of explosion. Dry pumps are also well suited for pumping of certain corrosive vapors and gases. Disadvantages of dry mechanical vacuum pumps include their initial high cost (as much as 5 times the cost of a oil-sealed pump of equal capacity), excessive noise, and higher ultimate pressure. For Further Reading: Rotary oil sealed mechanical vacuum pumps-
A User's Guide to Vacuum Technology, O'Hanlon, J., Wiley-Interscience, New York, NY, 1980.
Practical Vacuum Techniques, Batzer, T.H., and Brunner, W.F., Robert E. Krieger Publishing Company, New York, NY, 1974. Vacuum Technology, Roth, A., North-Holland Publishing Company, New York, NY, 1978.
Laboratory Exercise 6.1: Mechanical Pump Identification and Inspection. Identify the mechanical vacuum pump you have selected for the next three exercises: A. Pump Identification: Who is the manufacturer? What is the pump model number? Locate the manufacturer's literature from the bookcase, and find the appropriate reference information. What is the advertised pump speed? What is the base pressure listed? Is the pump of single stage or compound design? What is the rotational speed? What is the suggested volume of pump fluid? B. Physical Inspection of Mechanical Pump: Inspect the pump for signs of wear or misuse. Check electrical cables for cracks in insulation. Are the prongs of the electrical
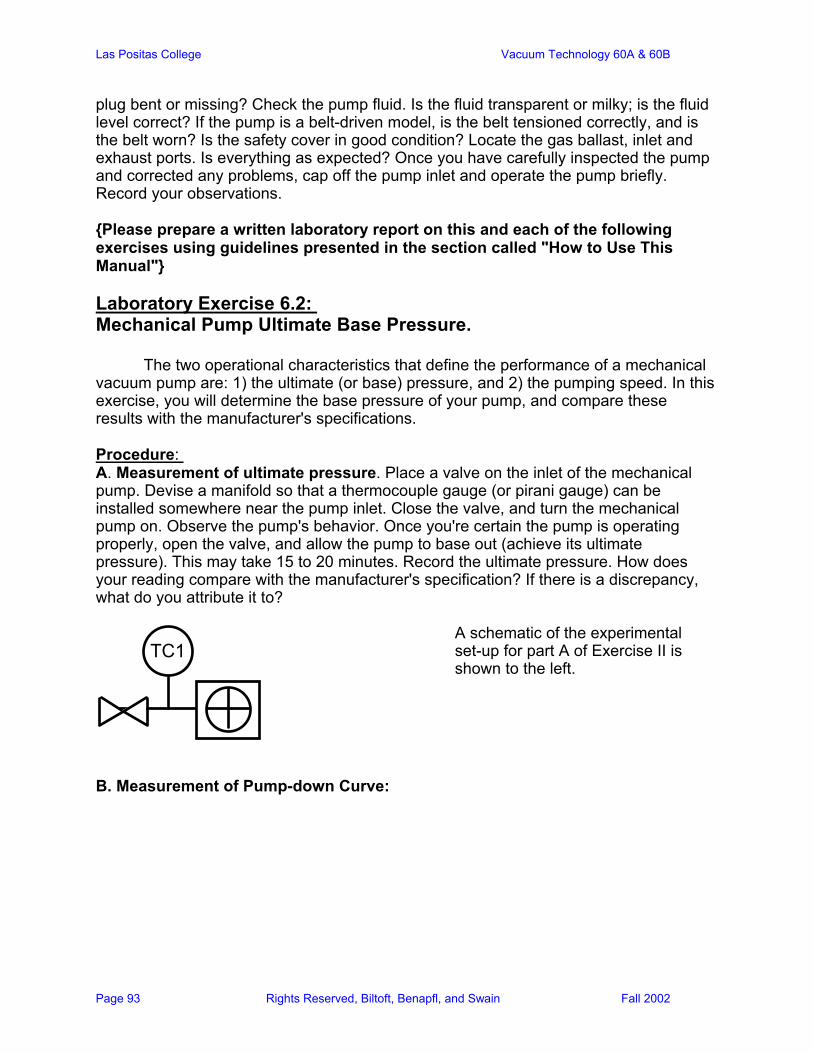
Las Positas College Vacuum Technology 60A & 60B
Page 93 Rights Reserved, Biltoft, Benapfl, and Swain Fall 2002
plug bent or missing? Check the pump fluid. Is the fluid transparent or milky; is the fluid level correct? If the pump is a belt-driven model, is the belt tensioned correctly, and is the belt worn? Is the safety cover in good condition? Locate the gas ballast, inlet and exhaust ports. Is everything as expected? Once you have carefully inspected the pump and corrected any problems, cap off the pump inlet and operate the pump briefly. Record your observations. Please prepare a written laboratory report on this and each of the following exercises using guidelines presented in the section called "How to Use This Manual" Laboratory Exercise 6.2: Mechanical Pump Ultimate Base Pressure. The two operational characteristics that define the performance of a mechanical vacuum pump are: 1) the ultimate (or base) pressure, and 2) the pumping speed. In this exercise, you will determine the base pressure of your pump, and compare these results with the manufacturer's specifications. Procedure: A. Measurement of ultimate pressure. Place a valve on the inlet of the mechanical pump. Devise a manifold so that a thermocouple gauge (or pirani gauge) can be installed somewhere near the pump inlet. Close the valve, and turn the mechanical pump on. Observe the pump's behavior. Once you're certain the pump is operating properly, open the valve, and allow the pump to base out (achieve its ultimate pressure). This may take 15 to 20 minutes. Record the ultimate pressure. How does your reading compare with the manufacturer's specification? If there is a discrepancy, what do you attribute it to?
TC1
A schematic of the experimental set-up for part A of Exercise II is shown to the left.
B. Measurement of Pump-down Curve:
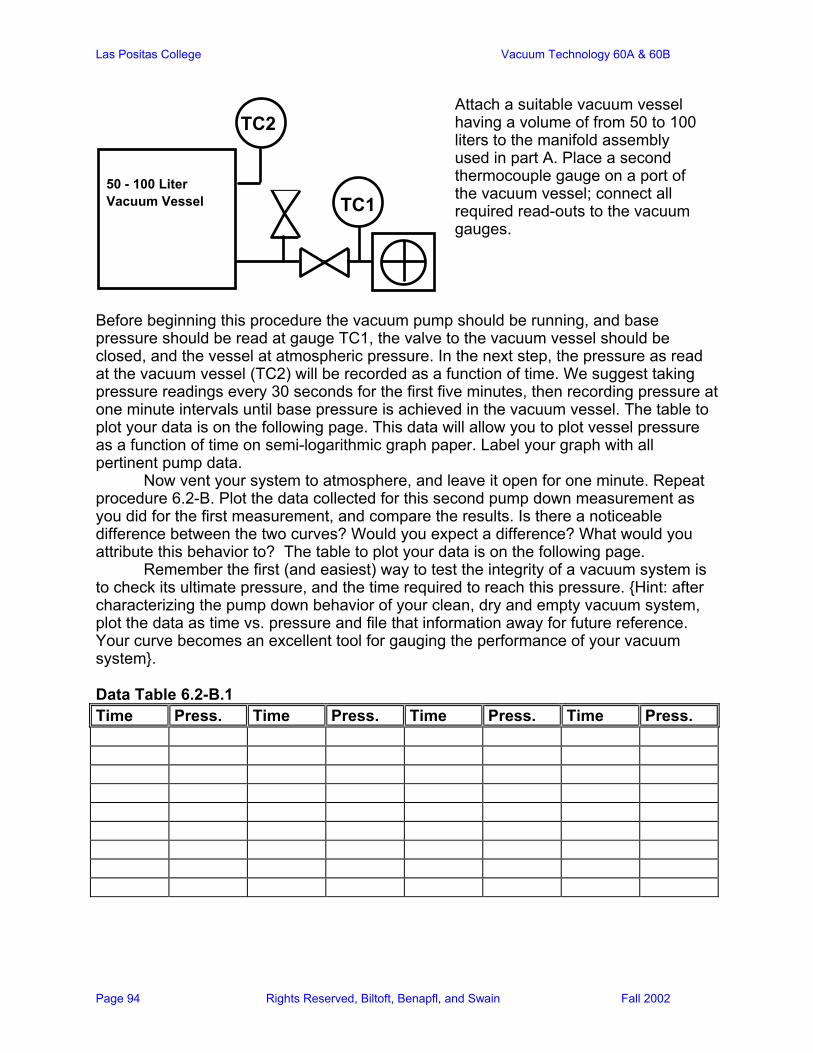
Las Positas College Vacuum Technology 60A & 60B
Page 94 Rights Reserved, Biltoft, Benapfl, and Swain Fall 2002
50 - 100 Liter Vacuum Vessel TC1
TC2
Attach a suitable vacuum vessel having a volume of from 50 to 100 liters to the manifold assembly used in part A. Place a second thermocouple gauge on a port of the vacuum vessel; connect all required read-outs to the vacuum gauges.
Before beginning this procedure the vacuum pump should be running, and base pressure should be read at gauge TC1, the valve to the vacuum vessel should be closed, and the vessel at atmospheric pressure. In the next step, the pressure as read at the vacuum vessel (TC2) will be recorded as a function of time. We suggest taking pressure readings every 30 seconds for the first five minutes, then recording pressure at one minute intervals until base pressure is achieved in the vacuum vessel. The table to plot your data is on the following page. This data will allow you to plot vessel pressure as a function of time on semi-logarithmic graph paper. Label your graph with all pertinent pump data. Now vent your system to atmosphere, and leave it open for one minute. Repeat procedure 6.2-B. Plot the data collected for this second pump down measurement as you did for the first measurement, and compare the results. Is there a noticeable difference between the two curves? Would you expect a difference? What would you attribute this behavior to? The table to plot your data is on the following page. Remember the first (and easiest) way to test the integrity of a vacuum system is to check its ultimate pressure, and the time required to reach this pressure. Hint: after characterizing the pump down behavior of your clean, dry and empty vacuum system, plot the data as time vs. pressure and file that information away for future reference. Your curve becomes an excellent tool for gauging the performance of your vacuum system. Data Table 6.2-B.1 Time Press. Time Press. Time Press. Time Press.
Las Positas College Vacuum Technology 60A & 60B
Page 95 Rights Reserved, Biltoft, Benapfl, and Swain Fall 2002
Data Table 6.2-B.2 Time Press. Time Press. Time Press. Time Press. Laboratory Exercise 6.3: Measurement of Pumping Speed The manufacturer's listed pumping speed for any given pump is usually the free air displacement at STP (standard temperature and pressure). As pressure decreases from atmospheric, there will be a reduction in the amount of gas pumped per unit time (mass flow rate). The pumping speed (volumetric flow rate) will decrease only slightly until a pressure of about 1 Torr is attained. Below this pressure, the decrease in pumping speed becomes more rapid, depending upon the type of mechanical vacuum pump, and falls to zero at the ultimate pressure. We can determine the speed of a pump by measuring either pumping speed under constant volume or constant pressure conditions. The constant volume technique is generally used in the pressure range between atmospheric and one Torr. In this method, you will measure the time required to reduce the pressure in a vessel a specified amount. The pump speed in that pressure range is then calculated using the equation:
Sp =2.3 Vt2 − t1
Log10
P1P2
V = volume of vessel [liters] t1= time at pressure P1 [seconds]
t2= time to reach pressure P2 from pressure P1 [seconds]
In contrast to the constant volume method, the measurement of pumping speed at constant pressure is typically performed in the pressure range between one Torr and the mechanical pump's ultimate pressure. To determine pumping speed by the constant pressure method, a measured amount of gas (Q) is admitted to the vacuum system being pumped to establish a constant pressure P. Pumping speed is then obtained from the equation:
S= Q
P
S = pump speed [liters/sec] Q = mass flow rate [Torr-liters/sec] P = pressure [Torr]
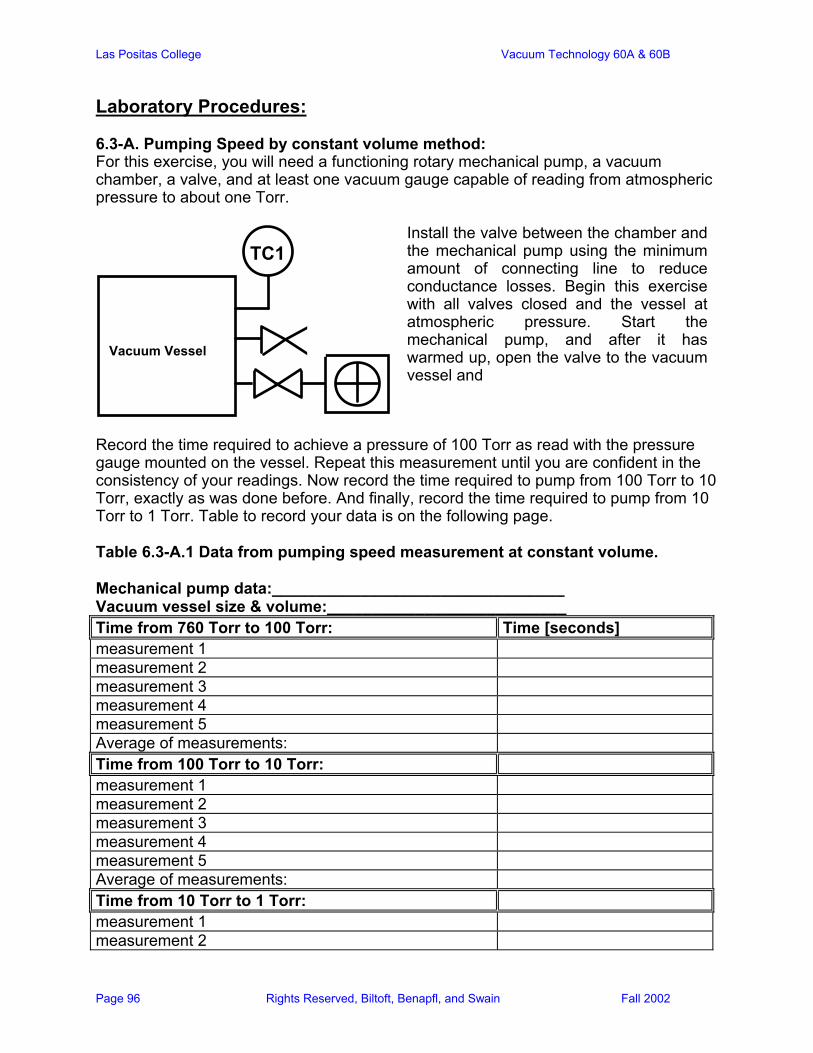
Las Positas College Vacuum Technology 60A & 60B
Page 96 Rights Reserved, Biltoft, Benapfl, and Swain Fall 2002
Laboratory Procedures: 6.3-A. Pumping Speed by constant volume method: For this exercise, you will need a functioning rotary mechanical pump, a vacuum chamber, a valve, and at least one vacuum gauge capable of reading from atmospheric pressure to about one Torr.
Vacuum Vessel
TC1
Install the valve between the chamber and the mechanical pump using the minimum amount of connecting line to reduce conductance losses. Begin this exercise with all valves closed and the vessel at atmospheric pressure. Start the mechanical pump, and after it has warmed up, open the valve to the vacuum vessel and
Record the time required to achieve a pressure of 100 Torr as read with the pressure gauge mounted on the vessel. Repeat this measurement until you are confident in the consistency of your readings. Now record the time required to pump from 100 Torr to 10 Torr, exactly as was done before. And finally, record the time required to pump from 10 Torr to 1 Torr. Table to record your data is on the following page. Table 6.3-A.1 Data from pumping speed measurement at constant volume. Mechanical pump data:_________________________________ Vacuum vessel size & volume:___________________________ Time from 760 Torr to 100 Torr: Time [seconds] measurement 1 measurement 2 measurement 3 measurement 4 measurement 5 Average of measurements: Time from 100 Torr to 10 Torr: measurement 1 measurement 2 measurement 3 measurement 4 measurement 5 Average of measurements: Time from 10 Torr to 1 Torr: measurement 1 measurement 2

Las Positas College Vacuum Technology 60A & 60B
Page 97 Rights Reserved, Biltoft, Benapfl, and Swain Fall 2002
measurement 3 measurement 4 measurement 5 Average of measurements: Time from 1 Torr to 0.1 Torr: measurement 1 measurement 2 measurement 3 measurement 4 measurement 5 Average of measurements: From the data in Table 6.3-A.1 you will be able to calculate pumping speeds for several pressure ranges using the equation:
Sp =2.3 Vt2 − t1
Log10
P1P2
Table 6.3-A.2 Calculation of Speed at Constant Volume for Vessel #1 Pressure [Torr]
Range Average [Torr]†
Pressure Pumping Speed [Torr-L/s]
760 to 100 100 to 10 10 to 1 1 to 0.1 †Note: the average pressure is defined as (P1 + P2)/2 Now plot the calculated pumping speed as a function of the average pressure for each of the four pressure regimes in Table 6.3-A.2. Following your splendid success in this measurement, replace the vacuum vessel in your system with another vessel of significantly different volume. Repeat the measurements performed and plot the data. How do the speed vs. average pressure curves compare? Is the behavior as you would expect? Why or why not? Another data table is provided on the following page. Table 6.3-A.3 Data from Pumping Speed Measurement at constant volume. Mechanical pump data__________________________________ Vacuum vessel size & volume:___________________________ Time from 760 Torr to 100 Torr: Time [seconds]
Las Positas College Vacuum Technology 60A & 60B
Page 98 Rights Reserved, Biltoft, Benapfl, and Swain Fall 2002
measurement 1 measurement 2 measurement 3 measurement 4 measurement 5 Average of measurements: Time from 100 Torr to 10 Torr: measurement 1 measurement 2 measurement 3 measurement 4 measurement 5 Average of measurements: Time from 10 Torr to 1 Torr: measurement 1 measurement 2 measurement 3 measurement 4 measurement 5 Average of measurements: Time from 1 Torr to 0.1 Torr: measurement 1 measurement 2 measurement 3 measurement 4 measurement 5 Average of measurements:

Las Positas College Vacuum Technology 60A & 60B
Page 99 Rights Reserved, Biltoft, Benapfl, and Swain Fall 2002
Table 6.3-A.4 Calculation of Pumping Speed at Constant volume for Vessel #2 Pressure [Torr]
Range Average [Torr]†
Pressure Pumping Speed [Torr-L/s]
760 to 100 100 to 10 10 to 1 1 to 0.1 Discussion:
Is it possible to make your plots more representative by using shorter time increments? What are the drawbacks (if any) for this idea? How do the speeds that you have calculated compare to those listed by the manufacturer for this pressure range? Is there any significant difference in speeds calculated for the two vacuum vessels of differing volumes?
6.3 B: Measurement of pumping speed by the constant pressure method. For this portion of the exercise, you will need a mechanical vacuum pump, a vacuum valve, a variable leak valve, an atmosphere valve, a vacuum vessel, a flow indicator and a pressure gauge capable of reading pressures from one Torr to about one millitorr.
Vacuum Vessel TC1
TC2
atmosphere valve
pipette
Install the pump valve at the pump inlet. Place the pressure gauge on the vacuum vessel, and install the variable leak valve on the chamber also. The flow meter must be plumbed to the inlet of the leak valve and the atmosphere valve must be plumbed to the flow meter. Confused? Follow the diagram and have a lab instructor check your setup before you begin. Initial conditions should be something like this: mechanical vacuum pump is off, the valve between the vessel and pump is closed; the vessel is at atmospheric pressure; the leak valve is closed. Start the mechanical pump, and allow it a few minutes to warm up to operating temperature. Open the valve between the pump and vessel, and allow the pressure to be reduced to a stable base pressure (~20 mTorr).
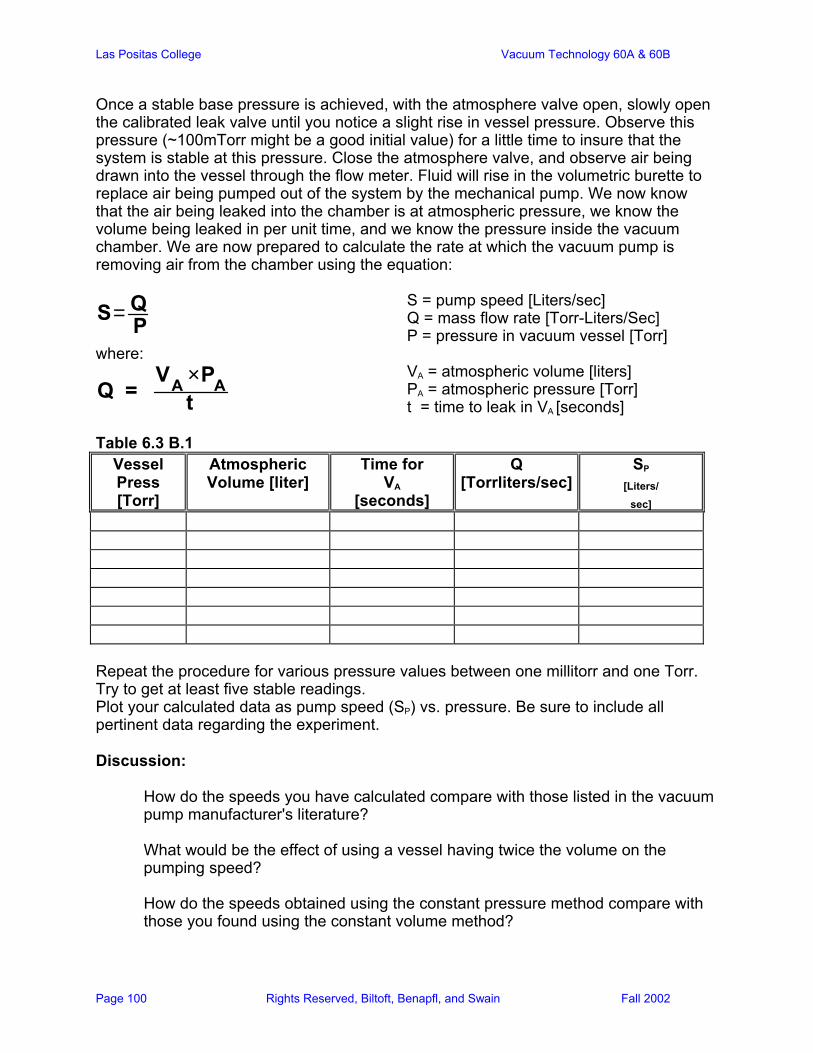
Las Positas College Vacuum Technology 60A & 60B
Page 100 Rights Reserved, Biltoft, Benapfl, and Swain Fall 2002
Once a stable base pressure is achieved, with the atmosphere valve open, slowly open the calibrated leak valve until you notice a slight rise in vessel pressure. Observe this pressure (~100mTorr might be a good initial value) for a little time to insure that the system is stable at this pressure. Close the atmosphere valve, and observe air being drawn into the vessel through the flow meter. Fluid will rise in the volumetric burette to replace air being pumped out of the system by the mechanical pump. We now know that the air being leaked into the chamber is at atmospheric pressure, we know the volume being leaked in per unit time, and we know the pressure inside the vacuum chamber. We are now prepared to calculate the rate at which the vacuum pump is removing air from the chamber using the equation:
S= Q
P
S = pump speed [Liters/sec] Q = mass flow rate [Torr-Liters/Sec] P = pressure in vacuum vessel [Torr]
where:
Q =
VA ×PAt
VA = atmospheric volume [liters] PA = atmospheric pressure [Torr] t = time to leak in VA [seconds]
Table 6.3 B.1
Vessel Press [Torr]
Atmospheric Volume [liter]
Time for VA
[seconds]
Q [Torrliters/sec]
SP
[Liters/ sec]
Repeat the procedure for various pressure values between one millitorr and one Torr. Try to get at least five stable readings. Plot your calculated data as pump speed (SP) vs. pressure. Be sure to include all pertinent data regarding the experiment. Discussion:
How do the speeds you have calculated compare with those listed in the vacuum pump manufacturer's literature? What would be the effect of using a vessel having twice the volume on the pumping speed? How do the speeds obtained using the constant pressure method compare with those you found using the constant volume method?
Las Positas College Vacuum Technology 60A & 60B
Page 101 Rights Reserved, Biltoft, Benapfl, and Swain Fall 2002
Chapter 7: Oil Vapor Diffusion Pumps It wasn't that long ago when you could walk into any vacuum laboratory and find a vapor diffusion pump on every system. Vapor diffusion pumps were first conceived about 1915-16, and used mercury as the pumping fluid. A decade later, experimenters found that some oils had high boiling points and low vapor pressures and were good pumping fluids. These oils were useful because they remained in the pump indefinitely and allowed lower pressures to be attained without the use of a cold trap. During W.W.II, and again during the 1960's for the space effort, diffusion pumps went through some significant design changes that increased their pumping speed, increased their ability to produce lower pressures, and oils gave way to synthetic pumping fluids. Due to it's simplicity, high performance, and low initial cost, the diffusion pump remains the primary industrial high vacuum pumping mechanism. Applications for this type of pump are found in R&D labs, coatings facilities, manufacturing, and space simulation. When diffusion pumps are used with the correct fluid, traps, and baffle, they can produce pressures to approximately 2*10-10 Torr. Theory Of Operation Diffusion pumps are vapor jet pumps that work on the principle of momentum transfer. This occurs when a heavy, high speed vapor molecule collides with a gas molecule and moves it in a preferred direction through the pump. The bottom of the pump contains an electric heater which is used to heat the pumping fluid to it's boiling point, thus, producing the vapor. This must be done at a reduced pressure. This means that before the diffusion pump is started, it must be "rough pumped" down to an acceptable pressure, typically 100 millitorr. To do otherwise will result in no pumping action and possible damage to the pumping fluid. Once boiling of the fluid has begun, the vapor is forced up the central columns of the jet assembly. It then exits at each downward directed jet in the form of a molecular curtain that impacts the pump body. The pump body is externally cooled so that the fluid will condense on its inside surface and run back down into the boiler. Pump bodies are typically water-cooled, but some are air-cooled. As gas molecules from the system randomly enter the pump (molecular flow conditions), they encounter the top jet. Some of them are impacted and driven on to the next jet. Subsequently, they reach the foreline where they are exhausted to the atmosphere by the mechanical backing pump. Compression Ratio The diffusion pump is similar in character to other compression pumps in that it develops a relatively high exhaust pressure compared to the inlet pressure. For most gases this compression ratio may be one million to one (or greater). For example; for an inlet pressure of 2*10-7 Torr and a foreline pressure of 2.0*10-1 Torr, the compression ratio would be one million. As far as compression goes, in a mixture of gases, each species may be pumped with different effects. It is possible to have different maximum compression ratios and different flow rates for gases having different molecular weights. For example, the compression ratio for hydrogen will differ greatly from the compression ratio for argon simply because their molecular weights are very different. Also, when the pumped gas has a molecular weight different from air the maximum compression ratio
Las Positas College Vacuum Technology 60A & 60B
Page 102 Rights Reserved, Biltoft, Benapfl, and Swain Fall 2002
will shift, but the tolerable foreline pressure (critical discharge pressure) remains the same. Critical Discharge Pressure The critical discharge pressure of a diffusion pump is the maximum permissible pressure at the foreline during normal pump operation. The expected pumping action of a diffusion pump ceases when the critical discharge pressure is exceeded. That is, the vapor of the discharge stage of the pump does not have sufficient energy and density to provide a barrier for the air in the foreline, thus, this air will flow through the pump in the wrong direction carrying with it the pumping fluid vapor. For most modern diffusion pumps, the maximum allowable foreline pressure is about 0.5 Torr. Diffusion pumps cannot function at all unless the foreline pressure is held below this limit by the backing pump. The most important rule of diffusion pump operation is: Do not exceed the critical discharge pressure! If this single most important rule is observed, then most difficulties associated with diffusion pump operation can be eliminated. Backstreaming Backstreaming can be defined as the passage of the pumping fluid through the inlet port of the pump and in the direction opposite to the direction of desired gas flow. However, backstreaming must not be limited to the pump, but must include the trap, baffle, and plumbing as well because all affect the transfer of pumping fluid vapors from the pump body to the chamber. There is a multitude of conditions that can cause backstreaming. The most common are; exceeding the critical discharge pressure in the foreline, exceeding maximum throughput capacity for long periods of time, and incorrect start-up or shutdown procedures. Backstreaming of pumping fluids into your work environment is always considered catastrophic. I know of very few vacuum related processes in which oil contamination is not a disaster! My suggestion to system operators is to know their equipment thoroughly and learn proper operating techniques. Ninety-nine percent of costly backstreaming problems are due to operator error. Finally, equip your system with the appropriate interlocks that will prohibit valve cycling above a specified pressure. This will protect your system whenever it is left unattended. Baffles And Traps Baffles have one particular purpose: to reduce the backstreaming of pump fluid into the vacuum chamber. Most baffles are "optically opaque" which implies that their internal geometry is such that light cannot pass directly through them. This insures that a molecule will collide at least once with a surface regardless of the incoming direction. Baffles do impede the flow of pumped gases, but well designed units can retain about 60% of the pumping speed. Baffles are installed directly above the pump inlet and are often used in conjunction with a trap. Water-cooled baffles can reduce the rate of reevaporation of condensed fluid thereby reducing the density of vapor in the space between the baffle and the trap. See illustration for several baffle designs. Cryogenic or refrigerated traps serve two purposes. They act as barriers against the flow of condensable vapors from pump to system; and they also serve as cryopumps for condensable vapors (primarily water vapor) emanating from the system. In typical unbaked systems, water vapor may constitute about 90% of the remaining gas after initial evacuation. Chilled traps increase the pumping speed for water vapor and therefore can in many cases lower the base pressure of your system. I know of two
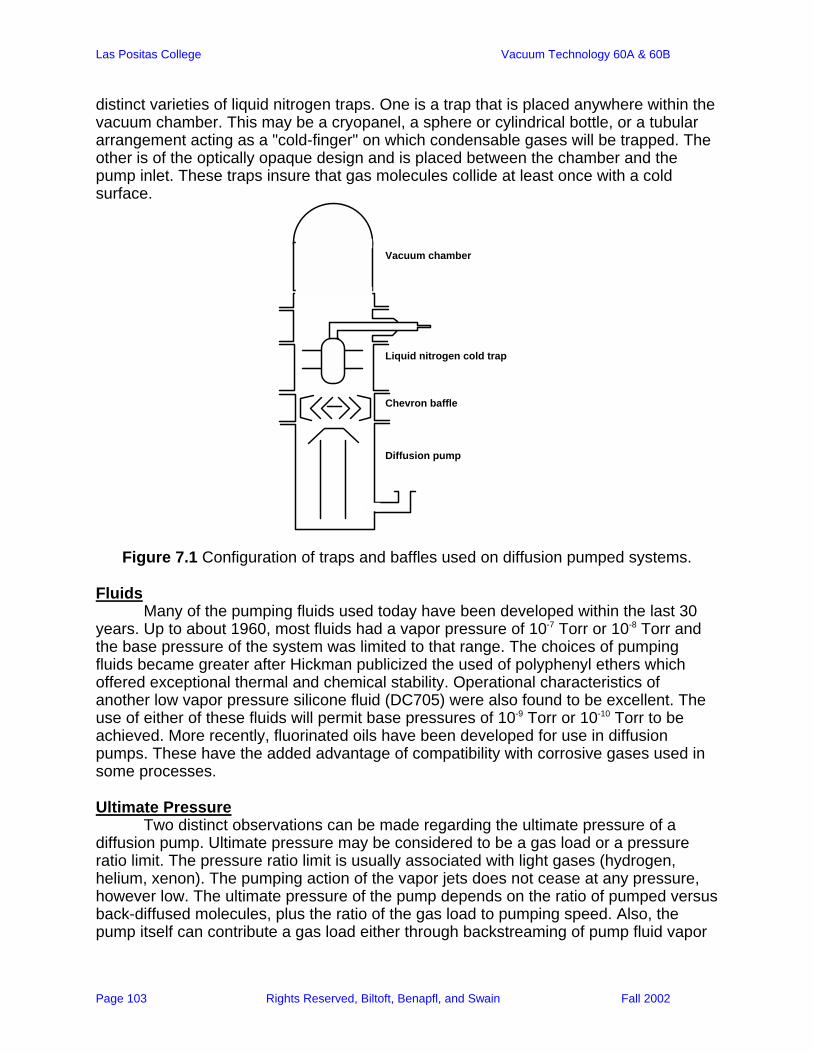
Las Positas College Vacuum Technology 60A & 60B
Page 103 Rights Reserved, Biltoft, Benapfl, and Swain Fall 2002
distinct varieties of liquid nitrogen traps. One is a trap that is placed anywhere within the vacuum chamber. This may be a cryopanel, a sphere or cylindrical bottle, or a tubular arrangement acting as a "cold-finger" on which condensable gases will be trapped. The other is of the optically opaque design and is placed between the chamber and the pump inlet. These traps insure that gas molecules collide at least once with a cold surface.
Vacuum chamber
Liquid nitrogen cold trap
Chevron baffle
Diffusion pump
Figure 7.1 Configuration of traps and baffles used on diffusion pumped systems.
Fluids Many of the pumping fluids used today have been developed within the last 30 years. Up to about 1960, most fluids had a vapor pressure of 10-7 Torr or 10-8 Torr and the base pressure of the system was limited to that range. The choices of pumping fluids became greater after Hickman publicized the used of polyphenyl ethers which offered exceptional thermal and chemical stability. Operational characteristics of another low vapor pressure silicone fluid (DC705) were also found to be excellent. The use of either of these fluids will permit base pressures of 10-9 Torr or 10-10 Torr to be achieved. More recently, fluorinated oils have been developed for use in diffusion pumps. These have the added advantage of compatibility with corrosive gases used in some processes. Ultimate Pressure Two distinct observations can be made regarding the ultimate pressure of a diffusion pump. Ultimate pressure may be considered to be a gas load or a pressure ratio limit. The pressure ratio limit is usually associated with light gases (hydrogen, helium, xenon). The pumping action of the vapor jets does not cease at any pressure, however low. The ultimate pressure of the pump depends on the ratio of pumped versus back-diffused molecules, plus the ratio of the gas load to pumping speed. Also, the pump itself can contribute a gas load either through backstreaming of pump fluid vapor

Las Positas College Vacuum Technology 60A & 60B
Page 104 Rights Reserved, Biltoft, Benapfl, and Swain Fall 2002
and its cracked fractions or the outgassing from its parts. In practice, then, the ultimate pressure of a pump is a composite of several elements. The first limit of the ultimate pressure is usually due to the vapor pressure of the pumping fluid, although this limit may not be observed at pressures below 10-8 Torr. Operating Procedures The operation of high vacuum, diffusion pumped systems requires certain care and attention to several items. General cleanliness is extremely important, especially in smaller systems. Remember, if a drop of oil were to be trapped somewhere in your vacuum system, it may take days or weeks to evaporate that drop from your system. Humidity and temperature can be important in view of the constant presence of water vapor in the atmosphere. When your system is opened to the environment, pump down time is significantly longer if the air is humid. The time of exposure is also significant. If possible, the backfilling should be done with nitrogen or argon. For short exposures, this appears to reduce the amount of water vapor adsorption in the vacuum system. It is extremely important to develop good habits in valve sequencing operations, especially in systems with manual valves. It is useful to have a "map" or schematic of your system on your control panel that shows valve locations and functions. A single wrong operation can result in very costly maintenance to the system. Automatic valve sequence controllers have been used widely for many years, and they all have built in interlocks to prevent accidental opening of the wrong valves. During the evacuation of a vessel, the question arises regarding the proper time to switch from the roughing pump to the diffusion pump. In other words, when should the high vacuum valve be opened? There is no general answer to this question because each system is different with different gas loads and different volumes. In practice, the transfer from roughing to the diffusion pump is made between 50 and 150 millitorr. Below this pressure region, the mechanical pump rapidly loses it's pumping effectiveness and the possibility of oil backstreaming increases. Although the throughput of a diffusion pump is nearly constant when inlet pressures are in the 1 to 100 millitorr range, the initial surge of air into the pump when the high vacuum valve is opened will overload the diffusion pump temporarily. We recommend that the period in which pump inlet pressure is above 150 millitorr be kept as short as possible; i.e., just a few seconds! Without a doubt, you'll have questions on proper diffusion pump operation. There is literature available to help you, and one document we suggest is a Varian Corp. publication written by M. H. Hablanian called "DIFFUSION PUMPS: PERFORMANCE AND OPERATION" which is part of the AVS Monograph Series. Sample Problems:
7.1 What is generally regarded as the single most important thing to remember about operating your diffusion pumped vacuum system?
7.2 Determine the compression ratio of a typical diffusion pump which has an inlet pressure of 5x10⁻⁷Torr and a discharge pressure of 1x10⁻¹ Torr.
7.3 Explain what may happen if an operating diffusion pump is accidentally vented through the foreline with air.
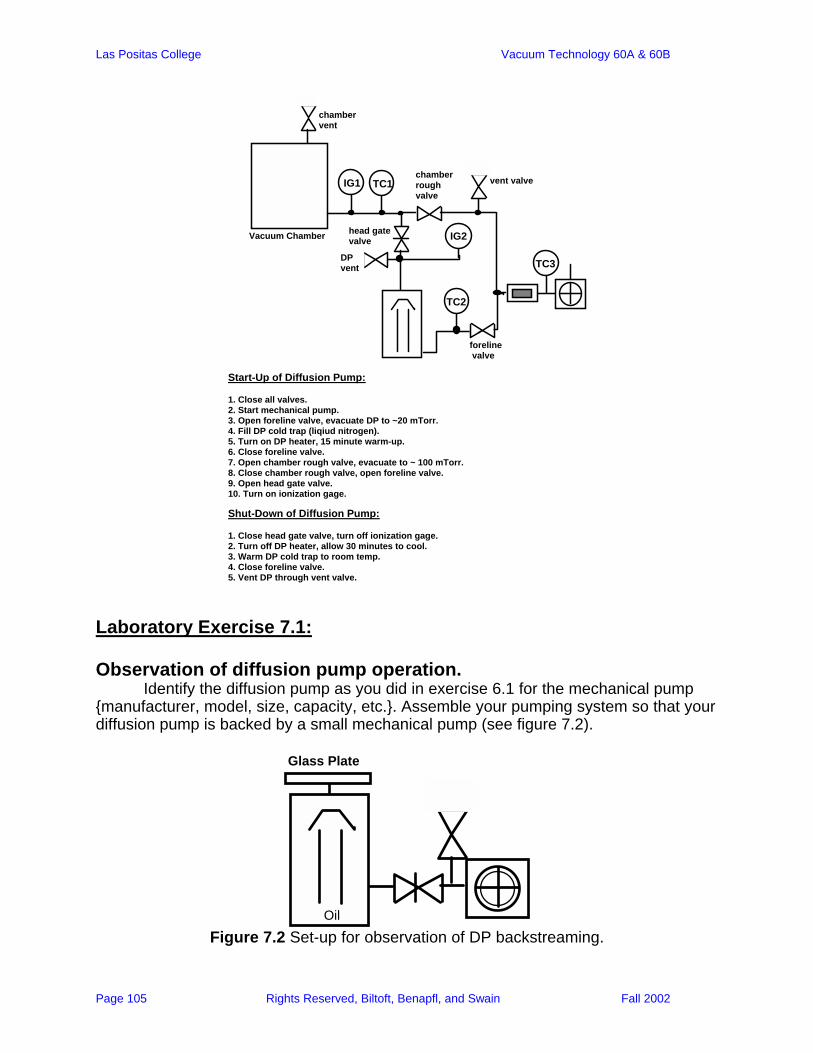
Las Positas College Vacuum Technology 60A & 60B
Page 105 Rights Reserved, Biltoft, Benapfl, and Swain Fall 2002
Start-Up of Diffusion Pump: 1. Close all valves. 2. Start mechanical pump. 3. Open foreline valve, evacuate DP to ~20 mTorr. 4. Fill DP cold trap (liqiud nitrogen). 5. Turn on DP heater, 15 minute warm-up. 6. Close foreline valve. 7. Open chamber rough valve, evacuate to ~ 100 mTorr. 8. Close chamber rough valve, open foreline valve. 9. Open head gate valve. 10. Turn on ionization gage.
Shut-Down of Diffusion Pump: 1. Close head gate valve, turn off ionization gage. 2. Turn off DP heater, allow 30 minutes to cool. 3. Warm DP cold trap to room temp. 4. Close foreline valve. 5. Vent DP through vent valve.
foreline valve
Vacuum Chamber
TC1
TC2
IG1 vent valvechamber rough valve
head gate valve
chamber vent
DP vent
IG2
TC3
Laboratory Exercise 7.1: Observation of diffusion pump operation. Identify the diffusion pump as you did in exercise 6.1 for the mechanical pump manufacturer, model, size, capacity, etc.. Assemble your pumping system so that your diffusion pump is backed by a small mechanical pump (see figure 7.2).
Oil
Glass Plate
Figure 7.2 Set-up for observation of DP backstreaming.

Las Positas College Vacuum Technology 60A & 60B
Page 106 Rights Reserved, Biltoft, Benapfl, and Swain Fall 2002
Place a pyrex view port on the pump inlet and start the mechanical pump. When system pressure is below 100 millitorr, turn on the diffusion pump and observe the formation of oil condensation on the pump side of the pyrex view port. How long does it take for a slight haze to form? a heavy haze?, how long before droplets appear on the view port? Report your observations. What, in your mind, is the sequence of events that cause droplet formation on the view port? If you took a heat lamp and aimed it at the view port, what would you expect to see?
Data table 7.1 Observations for experiment 7.1 Time [minutes]
Observation Laboratory Exercise 7.2: Testing and recording your system's base pressure. Now add the components to make your system look like the one in figure 7.3.
TC2
TC1 IG
Figure 7.3 Experimental set-up for measurement of DP base pressure.
You'll need a thermocouple gauge at the DP inlet, a pressure gauge on the mechanical pump, and an ionization gauge at the inlet to the diffusion pump. Start the mechanical pump and reduce the pressure in the system to below 100 millitorr. Now, turn on the diffusion pump and allow the pump to reach normal operating temperature. As you progress through this assignment, record the foreline pressure at frequent intervals so that it may be graphed later. Once your pump is working, turn on the ionization gauge

Las Positas College Vacuum Technology 60A & 60B
Page 107 Rights Reserved, Biltoft, Benapfl, and Swain Fall 2002
and record the steady drop in pressure. You should give the pump a couple hours to reach it's base pressure. Now you have two data sets to record on semi-log graph paper. A table for data entry is provided for you on the following page.
Data Table 7.2 Data for DP experiment 7.2 Time [minutes] Mech. pump
press. [Torr] TC2
System press. [Torr] TC1
System press. [Torr] IG1
Laboratory Exercise7.3: Measurement of pump down behavior for DP system. Assemble your system so that a vacuum chamber is attached to the diffusion pump through an isolation valve. You'll need pressure gauges on the chamber and also at the DP inlet. Rough pump the system as you've done previously, and allow the DP to warm up to normal operating temperature. Open the isolation valve and record time versus pressure data until the base pressure is achieved. You can monitor foreline pressure as well, and plot both sets of data on semi-log paper.
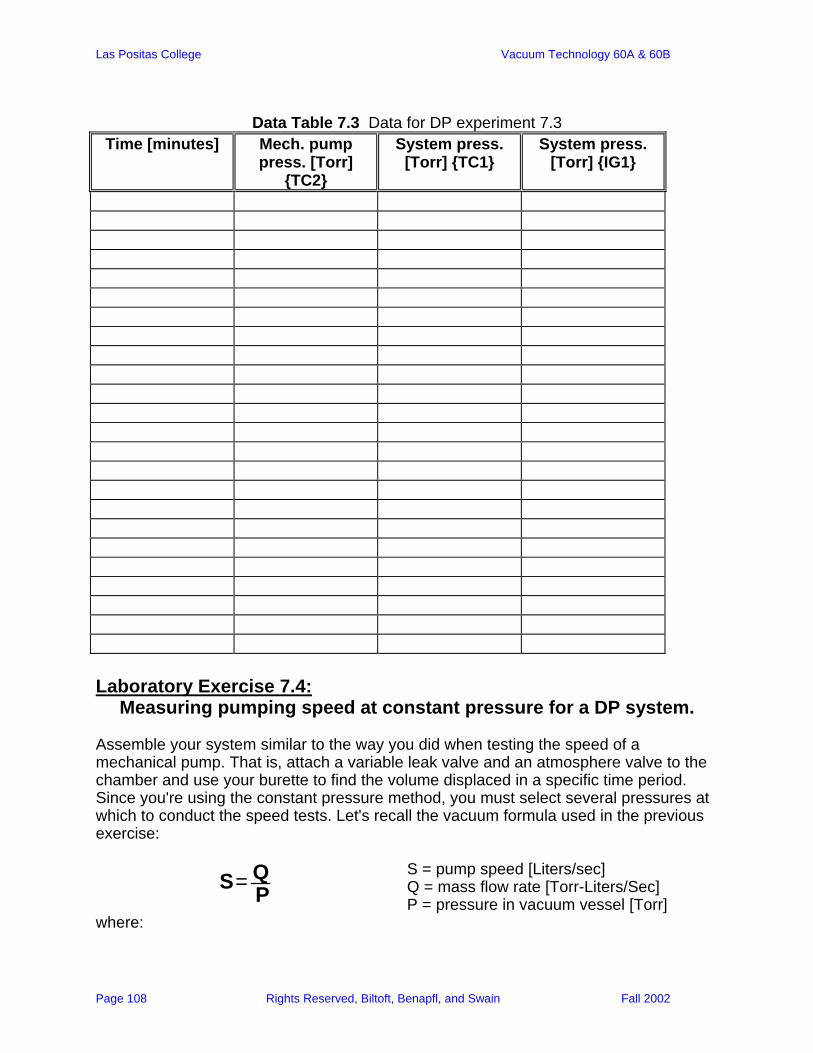
Las Positas College Vacuum Technology 60A & 60B
Page 108 Rights Reserved, Biltoft, Benapfl, and Swain Fall 2002
Data Table 7.3 Data for DP experiment 7.3
Time [minutes] Mech. pump press. [Torr]
TC2
System press. [Torr] TC1
System press. [Torr] IG1
Laboratory Exercise 7.4:
Measuring pumping speed at constant pressure for a DP system. Assemble your system similar to the way you did when testing the speed of a mechanical pump. That is, attach a variable leak valve and an atmosphere valve to the chamber and use your burette to find the volume displaced in a specific time period. Since you're using the constant pressure method, you must select several pressures at which to conduct the speed tests. Let's recall the vacuum formula used in the previous exercise:
S= Q
P
S = pump speed [Liters/sec] Q = mass flow rate [Torr-Liters/Sec] P = pressure in vacuum vessel [Torr]
where:

Las Positas College Vacuum Technology 60A & 60B
Page 109 Rights Reserved, Biltoft, Benapfl, and Swain Fall 2002
Q =
VA ×PAt
VA = atmospheric volume [liters] PA = atmospheric pressure [Torr] t = time to leak in VA [seconds]
We suggest you start somewhere in the mid to high 10-5Torr range. Then pick higher pressures at intervals suitable to the apparatus you have assembled. You will be plotting pumping speed versus pressure. When you graph pumping speed for the diffusion pumped system, be sure to include all information that may be pertinent to the outcome of the test. A table for data entry is provided for you on the following page.
Table 7.4 Data for pumping speed of diffusion pump at constant pressure. Vessel Press [Torr]
Atmospheric Volume [liter]
Time for VA
[seconds]
Q [Torrliters/sec]
SP
[liters/sec]
Answers to Chapter 7 Sample Problems 7.1 Don't exceed the critical foreline pressure! 7.2 200,000. 7.3 The critical foreline pressure will be exceeded, the pump will cease to function, and hot diffusion pump oil will very likely backstream into the vacuum system.
Las Positas College Vacuum Technology 60A & 60B
Page 110 Rights Reserved, Biltoft, Benapfl, and Swain Fall 2002
Chapter 8: Cryo-sorption pumps
Cryo-sorption pumps offer a clean, quiet, safe, vibration free and inexpensive way to rough pump a vacuum system. They are often used on vacuum systems that are sensitive to oil contamination from mechanical roughing pumps (surface science instruments, for example). Cryo-sorption pumps are a sub category of sorption pumps. All sorption pumps work by gas-capture. Pumped gases and vapors are bound at the active surfaces of these pumps by physical means (Van der Waal's Forces), chemical means ( Chemisorption) or are mechanically embedded in a continuous deposition of material, as in a sputter ion pump (more on this in Chapter 9). Gas capture pumps of these types share a few operational characteristics. With use, they will eventually become "saturated" and will cease to pump- gases effectively. When this occurs, a sorption pump will either need to be "regenerated" or replaced. Theory of operation- Cryo-sorption pumps work by providing a very large surface area of material that is cooled to below the boiling point of most gases. Gas molecules that strike this cooled micro-porous surface become attached and are removed from the gas phase, and are effectively "pumped" from the vacuum system. The active surface area of a cryo-sorption pump is typically made of zeolite 13X. This alkali alumino-silicate possesses a very high surface area to mass ratio (about 103 m2 per gram). The diameter of pores in this material is about 13Å (1.3*10-9 m) which is approximately the size of a molecule of water, oil vapor and larger gas molecules (nitrogen and oxygen, for example). The pore size is appropriate for capture of the gases most predominant in the atmosphere. Low atomic weight gases, such as hydrogen, helium and neon have molecular diameters smaller than the 13Å pore size of the zeolite, and are captured by this material less effectively. Absorption of gases by a given sorbent is a function of gas specie, sorbent temperature, and gas pressure. As nitrogen gas is cooled, the amount of gas that can be adsorbed by the zeolite per gram increases, as is shown in figure 8.1. Also note in this figure that helium, even when cooled to -195 °C is pumped much less efficiently than nitrogen. Another piece of information that may be gleaned from the data presented in figure 8.1 is that in general, as gas pressure decreases, the amount of gas that is adsorbed per gram of sorbent decreases.
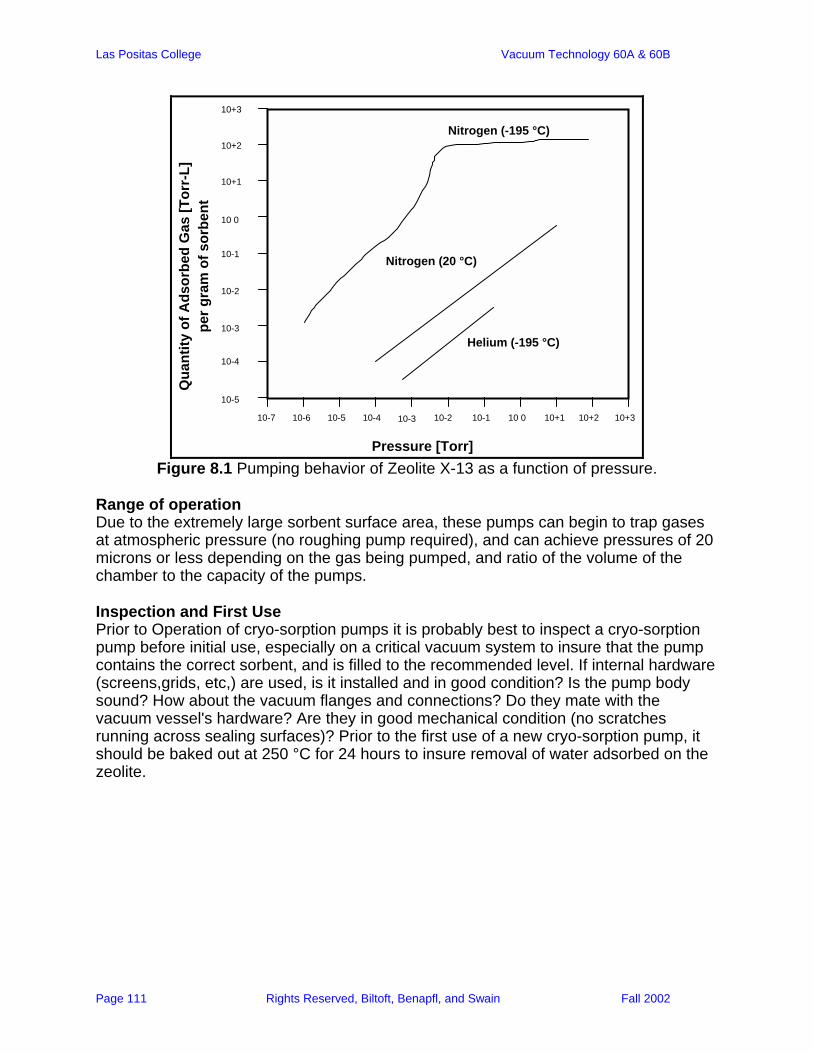
Las Positas College Vacuum Technology 60A & 60B
Page 111 Rights Reserved, Biltoft, Benapfl, and Swain Fall 2002
Nitrogen (-195 °C)
Nitrogen (20 °C)
Helium (-195 °C)
10-7 10-6 10-5 10-4 10-3 10-2 10-1 10 0 10+1 10+2 10+3
10+3
10+2
10+1
10 0
10-1
10-2
10-3
10-4
10-5
Pressure [Torr]
Qua
ntity
of A
dsor
bed
Gas
[Tor
r-L]
pe
r gra
m o
f sor
bent
Figure 8.1 Pumping behavior of Zeolite X-13 as a function of pressure.
Range of operation Due to the extremely large sorbent surface area, these pumps can begin to trap gases at atmospheric pressure (no roughing pump required), and can achieve pressures of 20 microns or less depending on the gas being pumped, and ratio of the volume of the chamber to the capacity of the pumps. Inspection and First Use Prior to Operation of cryo-sorption pumps it is probably best to inspect a cryo-sorption pump before initial use, especially on a critical vacuum system to insure that the pump contains the correct sorbent, and is filled to the recommended level. If internal hardware (screens,grids, etc,) are used, is it installed and in good condition? Is the pump body sound? How about the vacuum flanges and connections? Do they mate with the vacuum vessel's hardware? Are they in good mechanical condition (no scratches running across sealing surfaces)? Prior to the first use of a new cryo-sorption pump, it should be baked out at 250 °C for 24 hours to insure removal of water adsorbed on the zeolite.
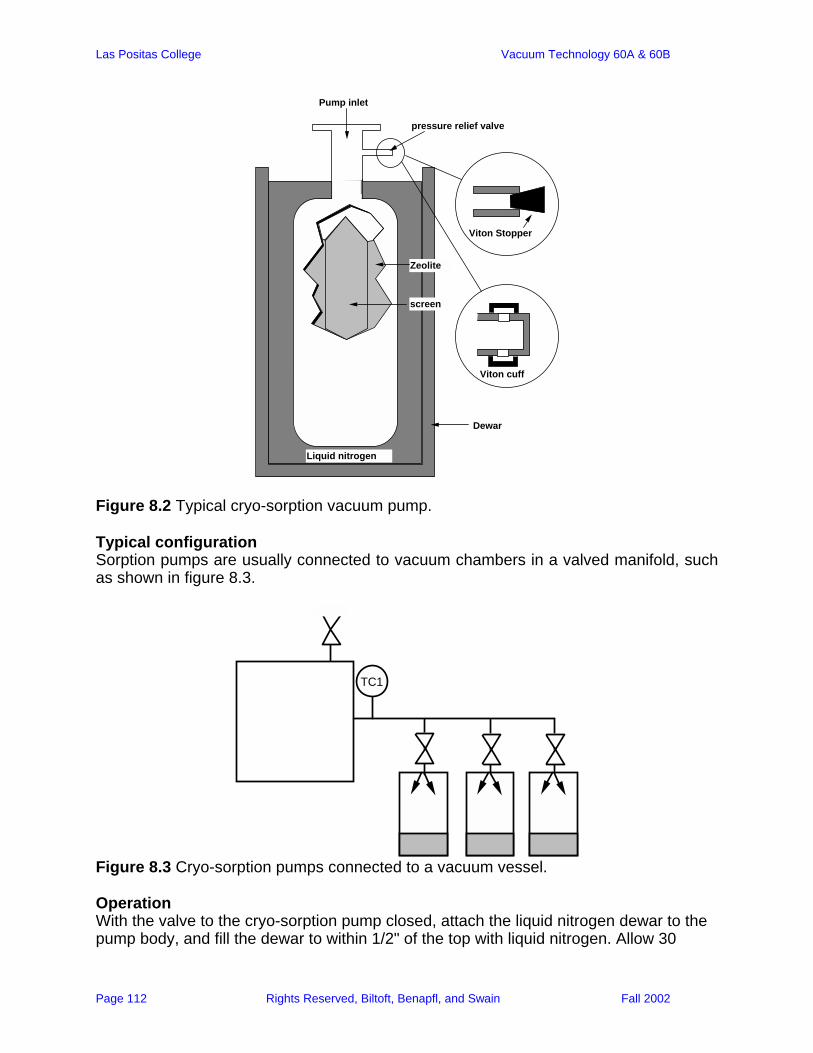
Las Positas College Vacuum Technology 60A & 60B
Page 112 Rights Reserved, Biltoft, Benapfl, and Swain Fall 2002
Viton Stopper
Viton cuff
Zeolite
Liquid nitrogen
Dewar
screen
Pump inlet
pressure relief valve
Figure 8.2 Typical cryo-sorption vacuum pump. Typical configuration Sorption pumps are usually connected to vacuum chambers in a valved manifold, such as shown in figure 8.3.
TC1
Figure 8.3 Cryo-sorption pumps connected to a vacuum vessel. Operation With the valve to the cryo-sorption pump closed, attach the liquid nitrogen dewar to the pump body, and fill the dewar to within 1/2" of the top with liquid nitrogen. Allow 30
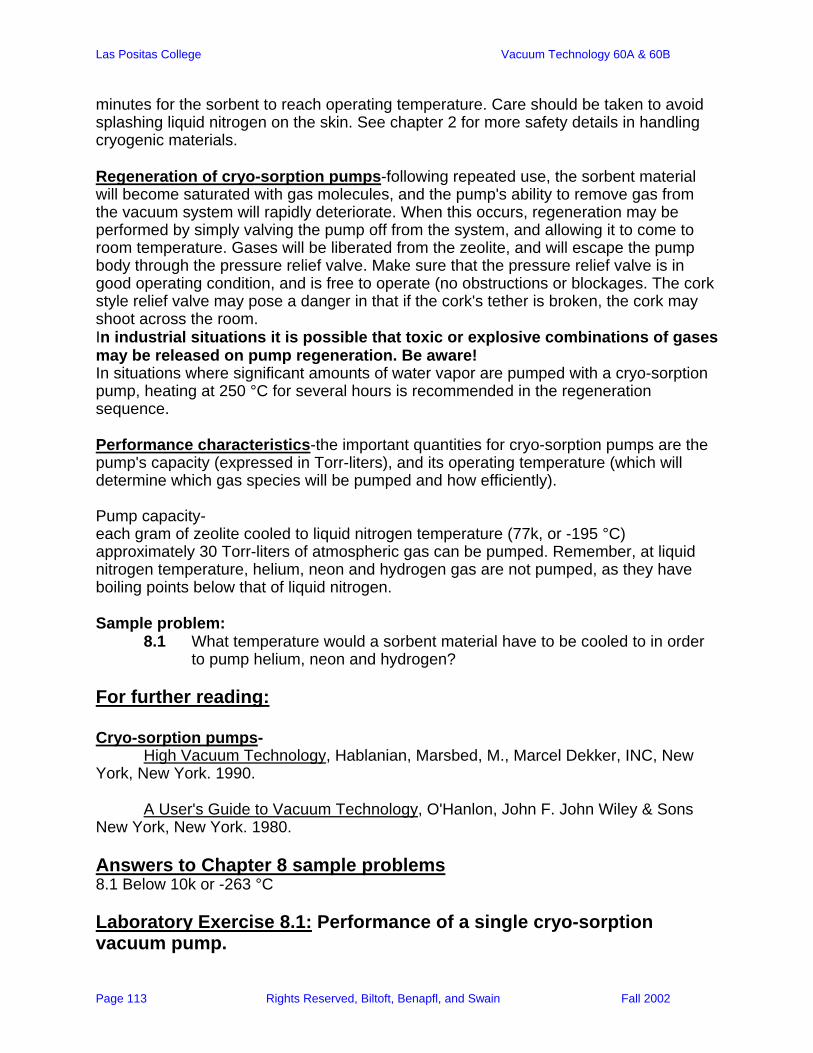
Las Positas College Vacuum Technology 60A & 60B
Page 113 Rights Reserved, Biltoft, Benapfl, and Swain Fall 2002
minutes for the sorbent to reach operating temperature. Care should be taken to avoid splashing liquid nitrogen on the skin. See chapter 2 for more safety details in handling cryogenic materials. Regeneration of cryo-sorption pumps-following repeated use, the sorbent material will become saturated with gas molecules, and the pump's ability to remove gas from the vacuum system will rapidly deteriorate. When this occurs, regeneration may be performed by simply valving the pump off from the system, and allowing it to come to room temperature. Gases will be liberated from the zeolite, and will escape the pump body through the pressure relief valve. Make sure that the pressure relief valve is in good operating condition, and is free to operate (no obstructions or blockages. The cork style relief valve may pose a danger in that if the cork's tether is broken, the cork may shoot across the room. In industrial situations it is possible that toxic or explosive combinations of gases may be released on pump regeneration. Be aware! In situations where significant amounts of water vapor are pumped with a cryo-sorption pump, heating at 250 °C for several hours is recommended in the regeneration sequence. Performance characteristics-the important quantities for cryo-sorption pumps are the pump's capacity (expressed in Torr-liters), and its operating temperature (which will determine which gas species will be pumped and how efficiently). Pump capacity- each gram of zeolite cooled to liquid nitrogen temperature (77k, or -195 °C) approximately 30 Torr-liters of atmospheric gas can be pumped. Remember, at liquid nitrogen temperature, helium, neon and hydrogen gas are not pumped, as they have boiling points below that of liquid nitrogen. Sample problem:
8.1 What temperature would a sorbent material have to be cooled to in order to pump helium, neon and hydrogen?
For further reading: Cryo-sorption pumps- High Vacuum Technology, Hablanian, Marsbed, M., Marcel Dekker, INC, New York, New York. 1990. A User's Guide to Vacuum Technology, O'Hanlon, John F. John Wiley & Sons New York, New York. 1980. Answers to Chapter 8 sample problems 8.1 Below 10k or -263 °C Laboratory Exercise 8.1: Performance of a single cryo-sorption vacuum pump.

Las Positas College Vacuum Technology 60A & 60B
Page 114 Rights Reserved, Biltoft, Benapfl, and Swain Fall 2002
A. Pump Identification: Who is the manufacturer? What is the pump model number? Locate the manufacturer's literature from the bookcase, and find the appropriate reference information. What is the sorbent? What is the advertised pump capacity? B. Physical Inspection of Cryo-sorption Pump: Inspect the pump for signs of wear or misuse. Are the screens in place? Is the correct amount of sorbent in place? Are the vacuum sealing surfaces in good condition? C. Bake-out of Cryo-sorption Pump: in a safe area, set up a fire-safe area to bake-out your cryo-sorption pump. Bake out the pump for 60 minutes. D. Pumping speed and capacity: once the pump has been regenerated, allow it to cool to room temperature with the pump isolation and relief valves closed. Attach the pump to a vacuum vessel of at least 10 liter volume as shown in figure 8.4. Connect a dewar to the pump body, and fill the dewar with liquid nitrogen. Allow 30 minutes for the sorbent to cool. With the vessel at atmospheric pressure, and the vent valve closed, open the cryo-sorption pump isolation valve, and record pressure versus time for 20 minutes. Close the cryo-sorption pump isolation valve and vent the chamber to atmosphere. Close the vent valve and repeat the experiment. Do this sequence of steps until a noticeable decrease in pumping speed is noted. Plot your data as pressure vs. time and pumping speed vs pressure.
TC1
Calculate the amount of air pumped in each of the sequential pump-downs. If pure com-pressed gas is available, repeat the experiment with argon, nitrogen and helium.
Figure 8.4 Experimental set-up for experiment 8.1.

Las Positas College Vacuum Technology 60A & 60B
Page 115 Rights Reserved, Biltoft, Benapfl, and Swain Fall 2002
Time Run #1
pressure [Torr] Run #2
pressure [Torr] Run #3
pressure [Torr] Run #4
pressure [Torr]
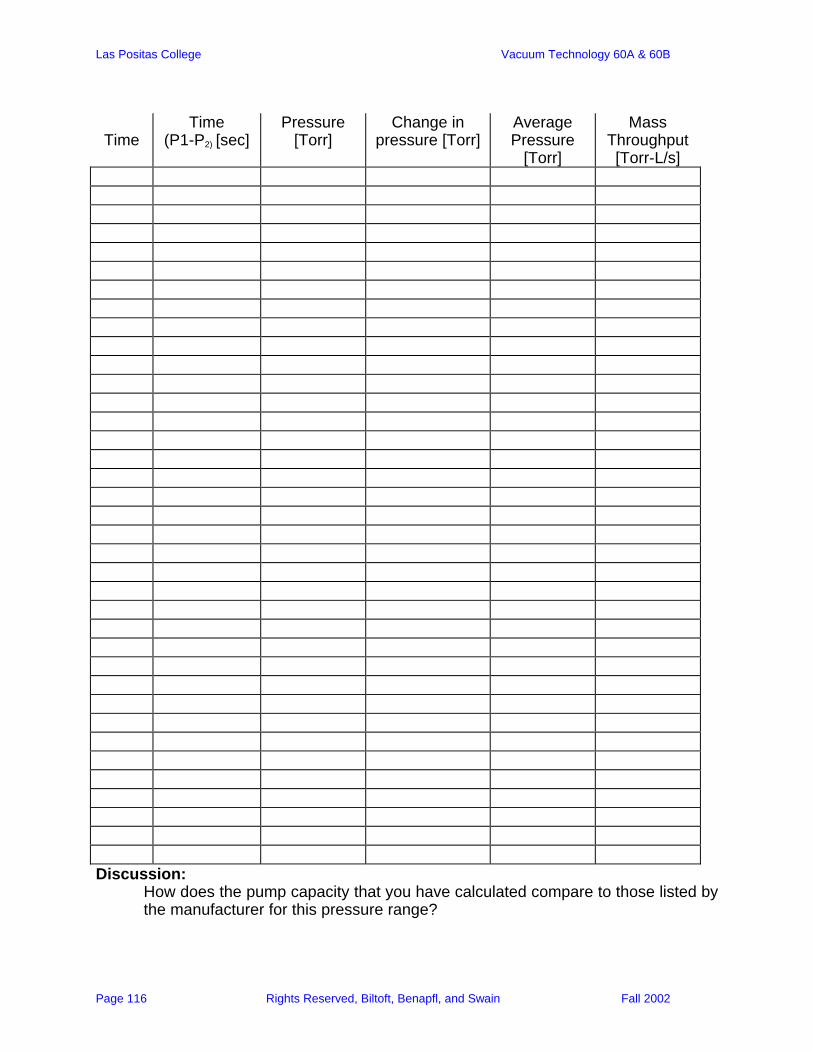
Las Positas College Vacuum Technology 60A & 60B
Page 116 Rights Reserved, Biltoft, Benapfl, and Swain Fall 2002
Time Time
(P1-P2) [sec] Pressure
[Torr] Change in
pressure [Torr] Average Pressure
[Torr]
Mass Throughput [Torr-L/s]
Discussion: How does the pump capacity that you have calculated compare to those listed by the manufacturer for this pressure range?
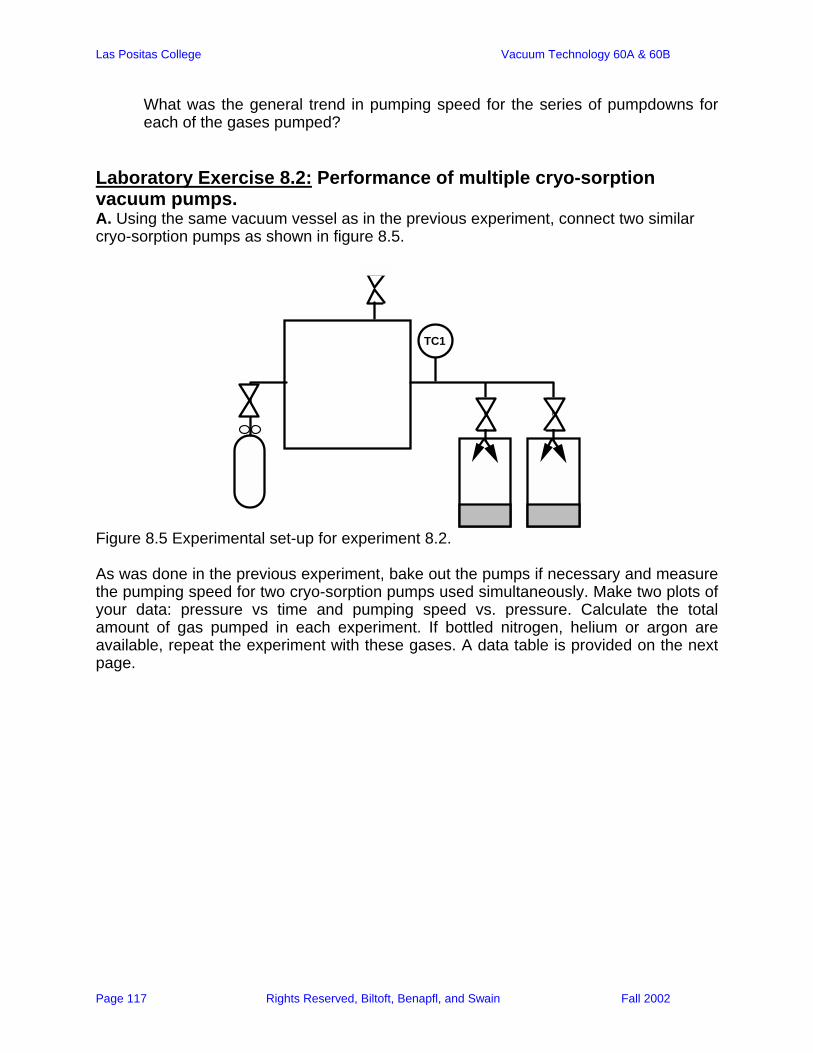
Las Positas College Vacuum Technology 60A & 60B
Page 117 Rights Reserved, Biltoft, Benapfl, and Swain Fall 2002
What was the general trend in pumping speed for the series of pumpdowns for each of the gases pumped?
Laboratory Exercise 8.2: Performance of multiple cryo-sorption vacuum pumps. A. Using the same vacuum vessel as in the previous experiment, connect two similar cryo-sorption pumps as shown in figure 8.5.
TC1
Figure 8.5 Experimental set-up for experiment 8.2. As was done in the previous experiment, bake out the pumps if necessary and measure the pumping speed for two cryo-sorption pumps used simultaneously. Make two plots of your data: pressure vs time and pumping speed vs. pressure. Calculate the total amount of gas pumped in each experiment. If bottled nitrogen, helium or argon are available, repeat the experiment with these gases. A data table is provided on the next page.
Las Positas College Vacuum Technology 60A & 60B
Page 118 Rights Reserved, Biltoft, Benapfl, and Swain Fall 2002
Time Run #1
pressure [Torr] Run #2
pressure [Torr] Run #3
pressure [Torr] Run #4
pressure [Torr]
Las Positas College Vacuum Technology 60A & 60B
Page 119 Rights Reserved, Biltoft, Benapfl, and Swain Fall 2002
Time
Time (P1-P2) [sec]
Pressure [Torr]
Change in pressure [Torr]
Average Pressure
[Torr]
Mass Throughput [Torr-L/s]
Las Positas College Vacuum Technology 60A & 60B
Page 120 Rights Reserved, Biltoft, Benapfl, and Swain Fall 2002
Chapter 9: Sputter ion pumps The invention of the ion pump did not occur until the 1950's when the Varian company exploited the pumping characteristics of the Penning cold cathode gauge. While it had been known that the sputtering effect caused by high voltage in the Penning gauge resulted in burial of ionized gas molecules, and that gettering of gases such as oxygen by reactive metals (titanium) were both occurring, the concept of using these mechanisms to remove gas molecules from a system was ignored. Soon after commercial sputter-ion pumps were made available, they were applied to the then new field of space environment simulation. Ion pumps were fitted to large carefully constructed vacuum vessels, and pressures as low as 10-11 Torr were obtained. This enabled evaluation of satellite components, space suits and rocket components. Currently sputter ion pumps are used in a variety of UHV applications including surface science techniques (study of the first few atomic layers of a surface), and ultra-high purity thin film deposition processes (e.g. molecular beam epitaxy). Sputter-ion pumps are gas capture type vacuum pumps that function without pump fluids or any moving parts. They offer a clean, quiet, and safe way to achieve ultra-high vacuum (10-11 Torr). Sputter-ion, or getter-ion pumps are often used on vacuum systems that are sensitive to oil contamination that is possible from oil diffusion pumps and turbo pumps. In general, sputter-ion pumps are used in systems in which pumping speed is less important than cleanliness and achieving an extremely low base pressure. Sputter-ion pump characteristics The operational characteristics of a sputter-ion pump may be simply described by the following three factors: 1. Pumping speed As with any high vacuum pump, the pumping speed will determine the ultimate base pressure for a given gas load. Ion pumps, however, exhibit pumping speeds that are a function of the gas specie being pumped. Hydrogen is pumped at a relatively high rate compared to argon. It is critical to match the ion pump to the application. 2. Starting pressure Ion pumps must be rough pumped to an acceptable pressure (2x10⁻² Torr or lower) before being turned on. Typically, this is done with a cryo-sorption pump or dry pump to eliminate the possiblity of oil backstreaming into the vacuum vessel or ion pump body. If well-trapped, oil sealed mechanical pumps may be used for roughing the ion pump and vacuum vessel. 3. Operating principle Sputter-ion pumps may be single or multiple cell types, and can be of diode or triode design. For the purposes of this laboratory, we will describe the operation of a single cell diode type sputter-ion vacuum pump. As with all gas capture pumps, the sputter-ion pump requires no backing pump, and does have a limited lifetime, based on its
Las Positas College Vacuum Technology 60A & 60B
Page 121 Rights Reserved, Biltoft, Benapfl, and Swain Fall 2002
capacity. The pump reduces pressure in a vacuum vessel by three distinct mechanisms: chemisorption, ion burial, and physical burial. During operation, titanium metal is sputtered (energetically liberated by ion bombardment) from the cathode surfaces. Titanium, being a very reactive metal, will chemically combine with active gas molecules present (oxygen and hydrogen) to form stable compounds, thus removing the gases from the vacuum vessel. Additionally, gas molecules and atoms are ionized by electrons that are constrained to orbit in the anode tube by a strong external magnet. These ionized gases are accelerated to the cathode by high voltage from the pump power supply. On impact, gas ions become buried in the titanium cathode, and also sputter (or knock free by momentum transfer) titanium atoms that act as getters as explained earlier. On start-up the amount of sputtering that occurs is very high, resulting in an initially high electrical current in the pump. Sputter-ion pumps will be warm or even hot to the touch during this phase of operation. After the gas pressure reduces, the pump will draw much less current from the power supply, and the operating voltage will increase. The amount of current that a sputter-ion pump draws during operation may be used, along with conversion charts supplied by the vendor, to determine pressure in the pump. Table 9.1 Comparison of pumping speeds for various gases.
Gas relative pumping speed [L/s]
Gas relative pumping speed [L/s]
hydrogen 270 oxygen 60 air 100 helium 50
nitrogen 95 argon 1 Sample problems: 9.1 Would you place a spinning rotor gauge in close proximity to a sputter-ion pump? why or why not? 9.2. Does a sputter-ion pump have a limited lifetime?
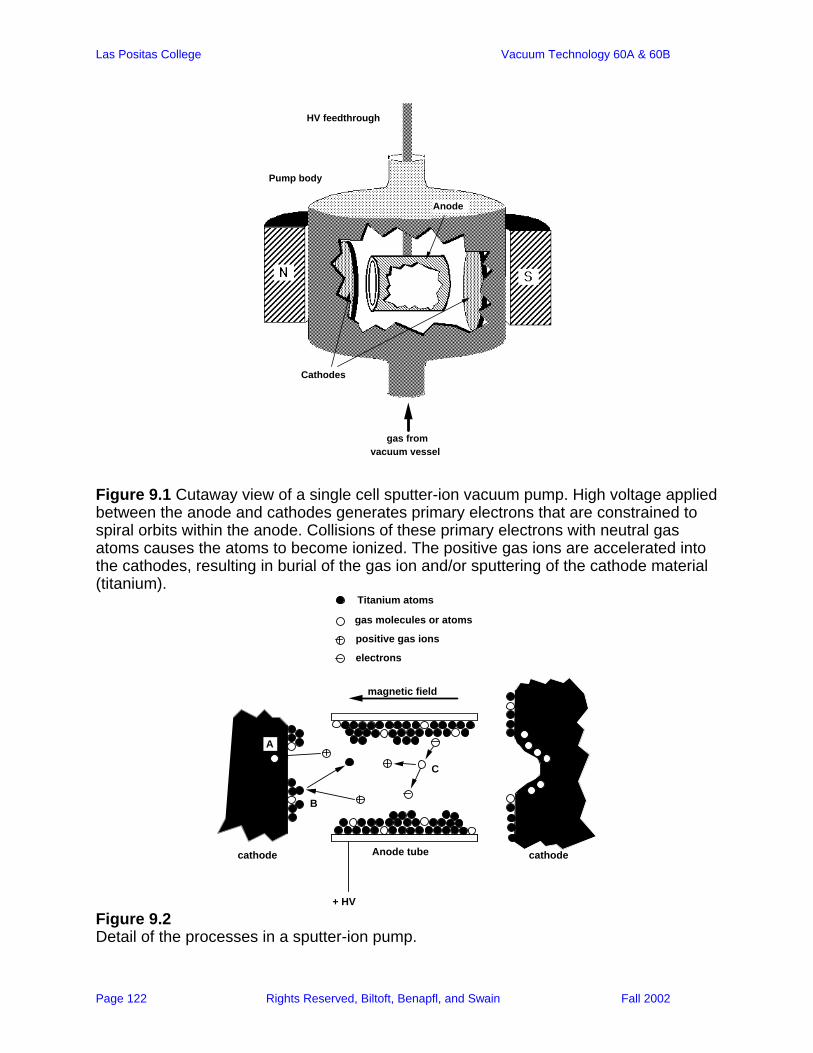
Las Positas College Vacuum Technology 60A & 60B
Page 122 Rights Reserved, Biltoft, Benapfl, and Swain Fall 2002
Pump body
HV feedthrough
Anode
Cathodes
gas from vacuum vessel
Figure 9.1 Cutaway view of a single cell sputter-ion vacuum pump. High voltage applied between the anode and cathodes generates primary electrons that are constrained to spiral orbits within the anode. Collisions of these primary electrons with neutral gas atoms causes the atoms to become ionized. The positive gas ions are accelerated into the cathodes, resulting in burial of the gas ion and/or sputtering of the cathode material (titanium).
Titanium atoms
gas molecules or atoms
positive gas ions
electrons
magnetic field
A
B
C
+ HV
Anode tubecathode cathode
Figure 9.2 Detail of the processes in a sputter-ion pump.
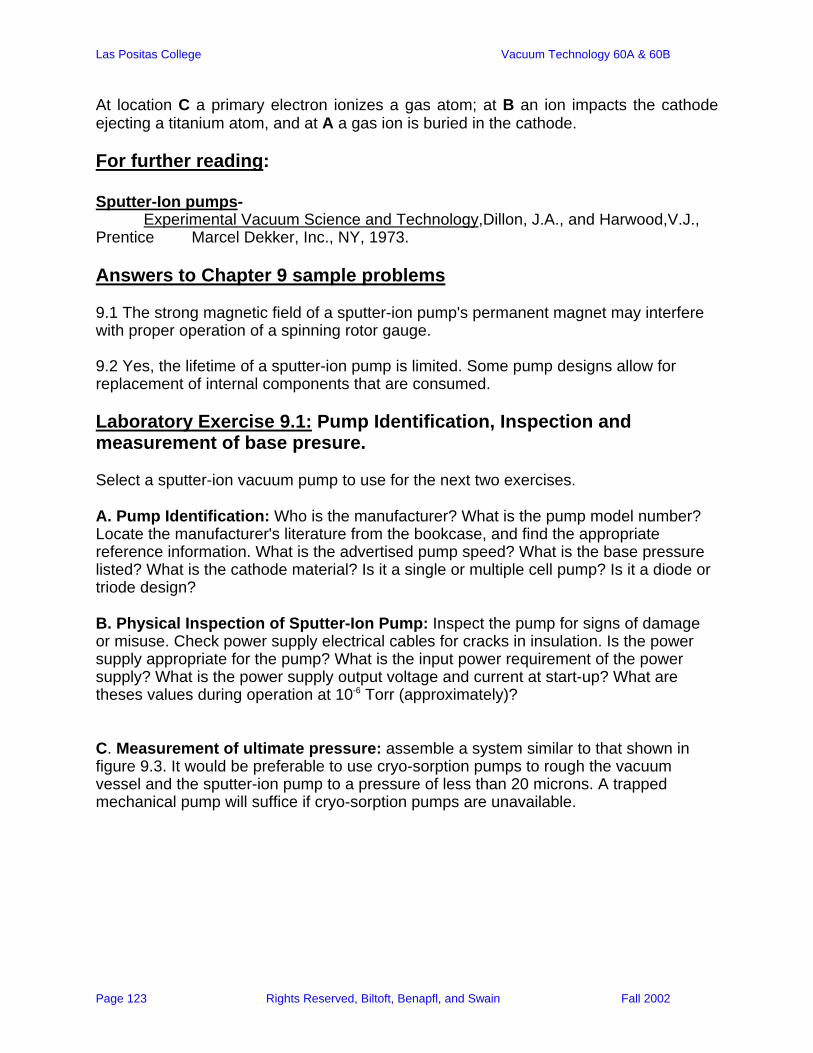
Las Positas College Vacuum Technology 60A & 60B
Page 123 Rights Reserved, Biltoft, Benapfl, and Swain Fall 2002
At location C a primary electron ionizes a gas atom; at B an ion impacts the cathode ejecting a titanium atom, and at A a gas ion is buried in the cathode. For further reading: Sputter-Ion pumps- Experimental Vacuum Science and Technology,Dillon, J.A., and Harwood,V.J., Prentice Marcel Dekker, Inc., NY, 1973. Answers to Chapter 9 sample problems 9.1 The strong magnetic field of a sputter-ion pump's permanent magnet may interfere with proper operation of a spinning rotor gauge. 9.2 Yes, the lifetime of a sputter-ion pump is limited. Some pump designs allow for replacement of internal components that are consumed. Laboratory Exercise 9.1: Pump Identification, Inspection and measurement of base presure. Select a sputter-ion vacuum pump to use for the next two exercises. A. Pump Identification: Who is the manufacturer? What is the pump model number? Locate the manufacturer's literature from the bookcase, and find the appropriate reference information. What is the advertised pump speed? What is the base pressure listed? What is the cathode material? Is it a single or multiple cell pump? Is it a diode or triode design? B. Physical Inspection of Sputter-Ion Pump: Inspect the pump for signs of damage or misuse. Check power supply electrical cables for cracks in insulation. Is the power supply appropriate for the pump? What is the input power requirement of the power supply? What is the power supply output voltage and current at start-up? What are theses values during operation at 10-6 Torr (approximately)? C. Measurement of ultimate pressure: assemble a system similar to that shown in figure 9.3. It would be preferable to use cryo-sorption pumps to rough the vacuum vessel and the sputter-ion pump to a pressure of less than 20 microns. A trapped mechanical pump will suffice if cryo-sorption pumps are unavailable.
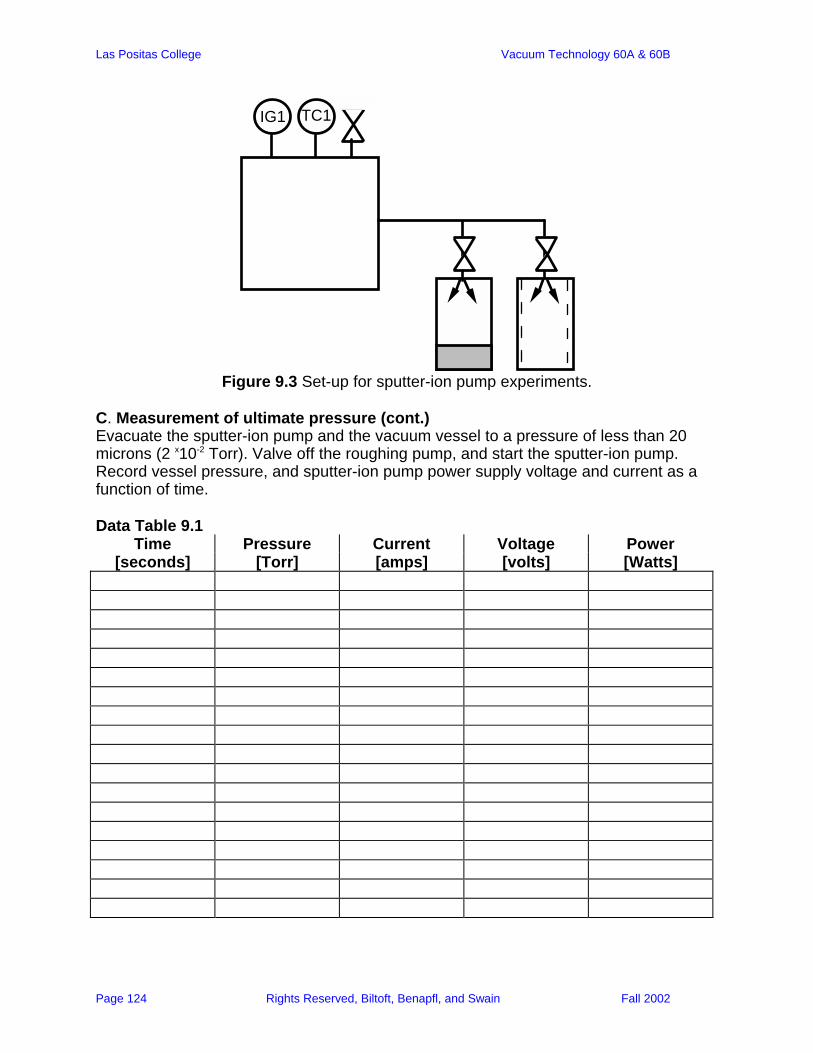
Las Positas College Vacuum Technology 60A & 60B
Page 124 Rights Reserved, Biltoft, Benapfl, and Swain Fall 2002
IG1 TC1
Figure 9.3 Set-up for sputter-ion pump experiments.
C. Measurement of ultimate pressure (cont.) Evacuate the sputter-ion pump and the vacuum vessel to a pressure of less than 20 microns (2 x10⁻² Torr). Valve off the roughing pump, and start the sputter-ion pump. Record vessel pressure, and sputter-ion pump power supply voltage and current as a function of time. Data Table 9.1
Time Pressure Current Voltage Power [seconds] [Torr] [amps] [volts] [Watts]

Las Positas College Vacuum Technology 60A & 60B
Page 125 Rights Reserved, Biltoft, Benapfl, and Swain Fall 2002
Time Pressure Current Voltage Power
[seconds] [Torr] [amps] [volts] [Watts]
Calculate power for each of your readings (power = current*voltage). Plot the data you have collected as sputter-ion pump current, voltage and power as a function of time. Also plot vessel pressure vs. time. If the equipment and materials are available, isolate the sputter-ion pump from the evacuated chamber, and back fill the process chamber with an inert gas such as helium or argon and repeat the experiment.
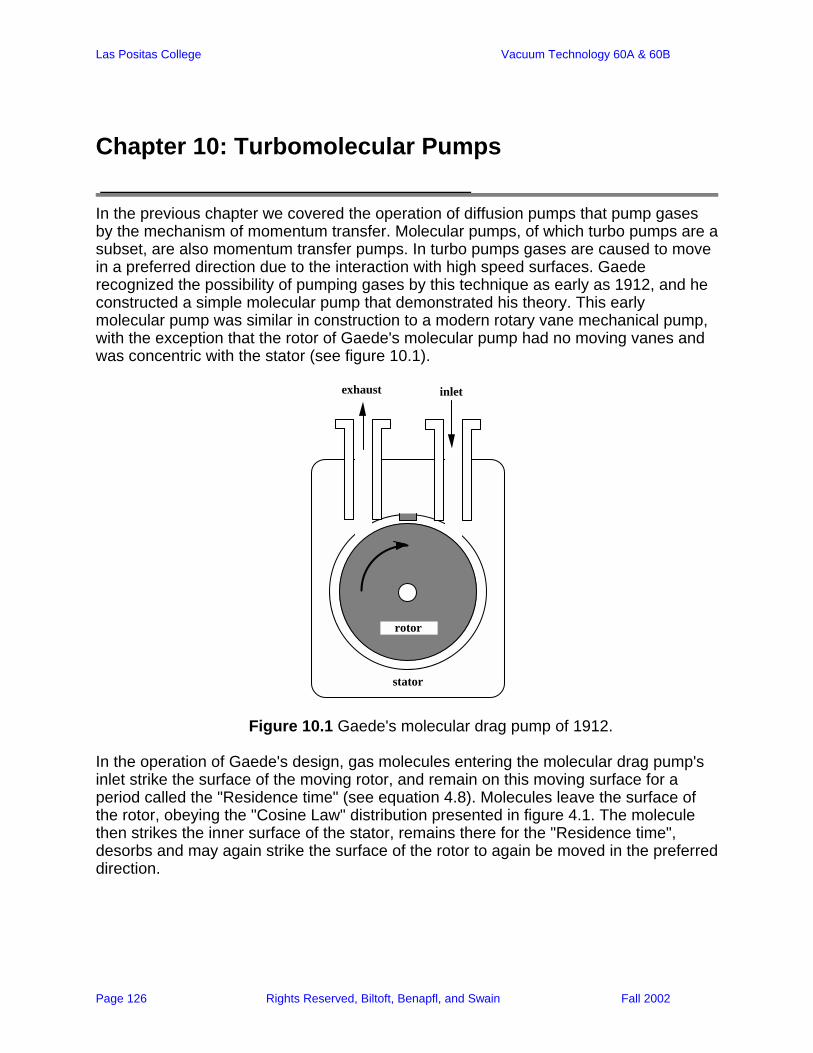
Las Positas College Vacuum Technology 60A & 60B
Page 126 Rights Reserved, Biltoft, Benapfl, and Swain Fall 2002
In the previous chapter we covered the operation of diffusion pumps that pump gases by the mechanism of momentum transfer. Molecular pumps, of which turbo pumps are a subset, are also momentum transfer pumps. In turbo pumps gases are caused to move in a preferred direction due to the interaction with high speed surfaces. Gaede recognized the possibility of pumping gases by this technique as early as 1912, and he constructed a simple molecular pump that demonstrated his theory. This early molecular pump was similar in construction to a modern rotary vane mechanical pump, with the exception that the rotor of Gaede's molecular pump had no moving vanes and was concentric with the stator (see figure 10.1).
inletexhaust
rotor
stator
Figure 10.1 Gaede's molecular drag pump of 1912.
In the operation of Gaede's design, gas molecules entering the molecular drag pump's inlet strike the surface of the moving rotor, and remain on this moving surface for a period called the "Residence time" (see equation 4.8). Molecules leave the surface of the rotor, obeying the "Cosine Law" distribution presented in figure 4.1. The molecule then strikes the inner surface of the stator, remains there for the "Residence time", desorbs and may again strike the surface of the rotor to again be moved in the preferred direction.
Chapter 10: Turbomolecular Pumps
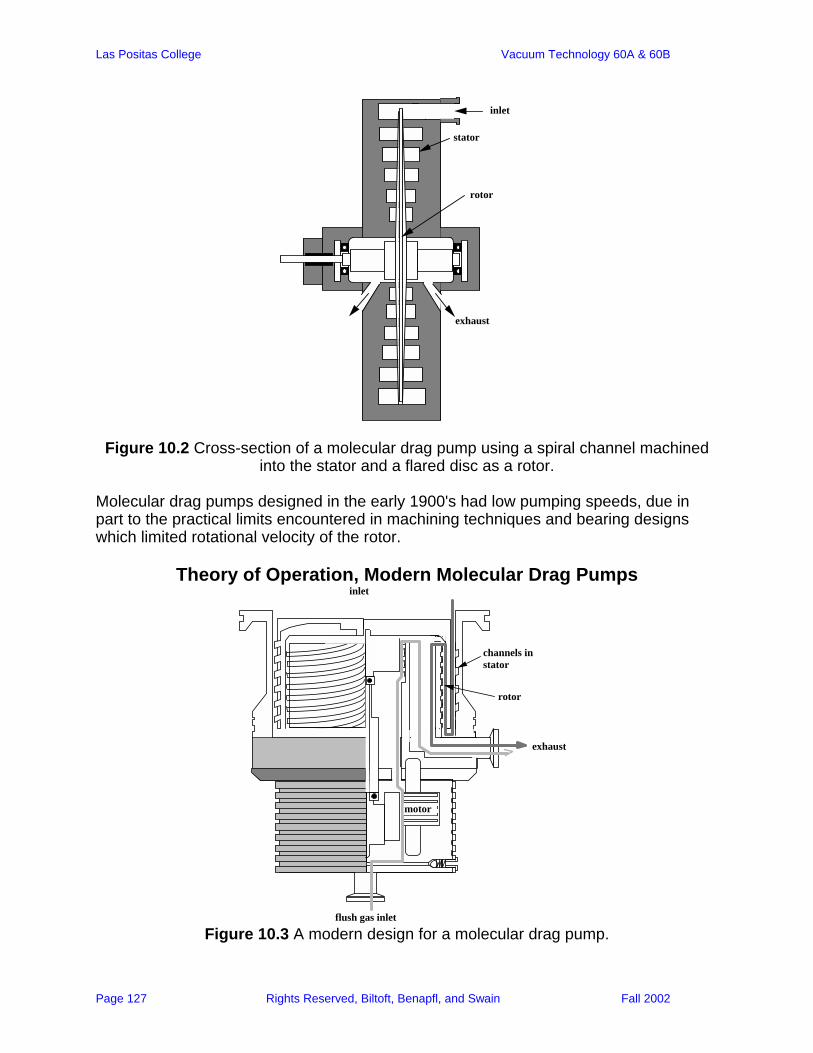
Las Positas College Vacuum Technology 60A & 60B
Page 127 Rights Reserved, Biltoft, Benapfl, and Swain Fall 2002
rotor
stator
inlet
exhaust
Figure 10.2 Cross-section of a molecular drag pump using a spiral channel machined into the stator and a flared disc as a rotor.
Molecular drag pumps designed in the early 1900's had low pumping speeds, due in part to the practical limits encountered in machining techniques and bearing designs which limited rotational velocity of the rotor.
Theory of Operation, Modern Molecular Drag Pumps inlet
exhaust
flush gas inlet
motor
channels in stator
rotor
Figure 10.3 A modern design for a molecular drag pump.
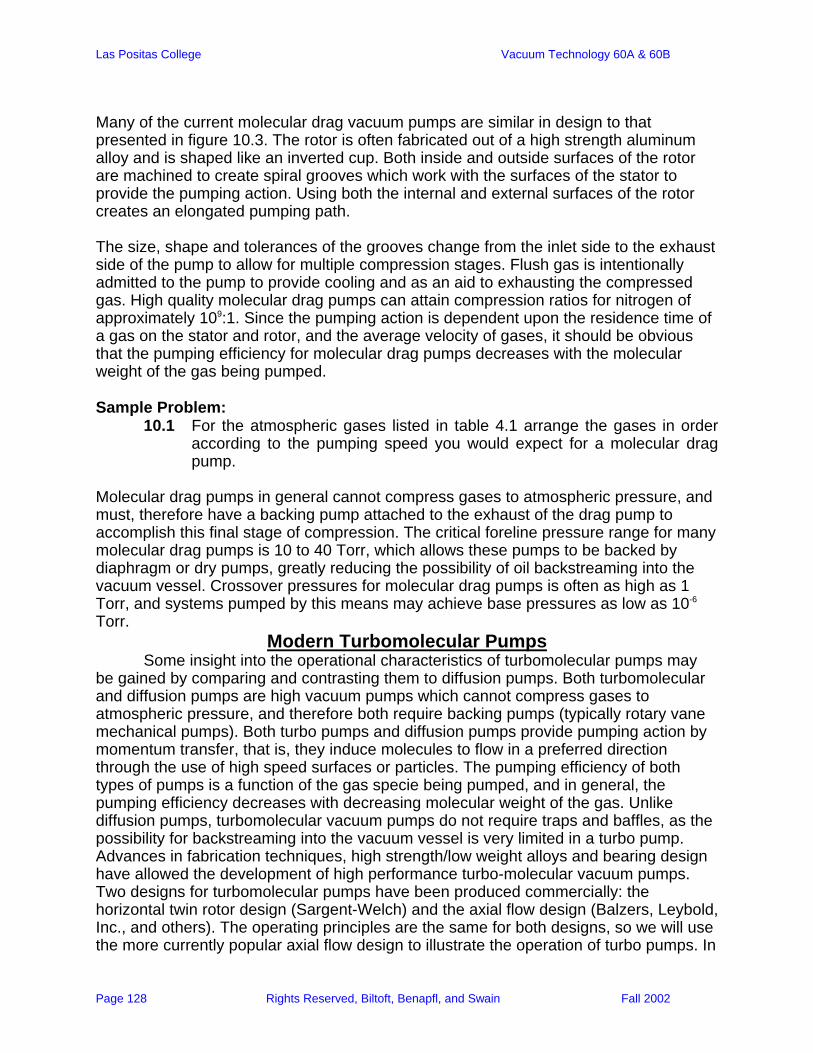
Las Positas College Vacuum Technology 60A & 60B
Page 128 Rights Reserved, Biltoft, Benapfl, and Swain Fall 2002
Many of the current molecular drag vacuum pumps are similar in design to that presented in figure 10.3. The rotor is often fabricated out of a high strength aluminum alloy and is shaped like an inverted cup. Both inside and outside surfaces of the rotor are machined to create spiral grooves which work with the surfaces of the stator to provide the pumping action. Using both the internal and external surfaces of the rotor creates an elongated pumping path. The size, shape and tolerances of the grooves change from the inlet side to the exhaust side of the pump to allow for multiple compression stages. Flush gas is intentionally admitted to the pump to provide cooling and as an aid to exhausting the compressed gas. High quality molecular drag pumps can attain compression ratios for nitrogen of approximately 109:1. Since the pumping action is dependent upon the residence time of a gas on the stator and rotor, and the average velocity of gases, it should be obvious that the pumping efficiency for molecular drag pumps decreases with the molecular weight of the gas being pumped. Sample Problem:
10.1 For the atmospheric gases listed in table 4.1 arrange the gases in order according to the pumping speed you would expect for a molecular drag pump.
Molecular drag pumps in general cannot compress gases to atmospheric pressure, and must, therefore have a backing pump attached to the exhaust of the drag pump to accomplish this final stage of compression. The critical foreline pressure range for many molecular drag pumps is 10 to 40 Torr, which allows these pumps to be backed by diaphragm or dry pumps, greatly reducing the possibility of oil backstreaming into the vacuum vessel. Crossover pressures for molecular drag pumps is often as high as 1 Torr, and systems pumped by this means may achieve base pressures as low as 10-6
Torr. Modern Turbomolecular Pumps
Some insight into the operational characteristics of turbomolecular pumps may be gained by comparing and contrasting them to diffusion pumps. Both turbomolecular and diffusion pumps are high vacuum pumps which cannot compress gases to atmospheric pressure, and therefore both require backing pumps (typically rotary vane mechanical pumps). Both turbo pumps and diffusion pumps provide pumping action by momentum transfer, that is, they induce molecules to flow in a preferred direction through the use of high speed surfaces or particles. The pumping efficiency of both types of pumps is a function of the gas specie being pumped, and in general, the pumping efficiency decreases with decreasing molecular weight of the gas. Unlike diffusion pumps, turbomolecular vacuum pumps do not require traps and baffles, as the possibility for backstreaming into the vacuum vessel is very limited in a turbo pump. Advances in fabrication techniques, high strength/low weight alloys and bearing design have allowed the development of high performance turbo-molecular vacuum pumps. Two designs for turbomolecular pumps have been produced commercially: the horizontal twin rotor design (Sargent-Welch) and the axial flow design (Balzers, Leybold, Inc., and others). The operating principles are the same for both designs, so we will use the more currently popular axial flow design to illustrate the operation of turbo pumps. In
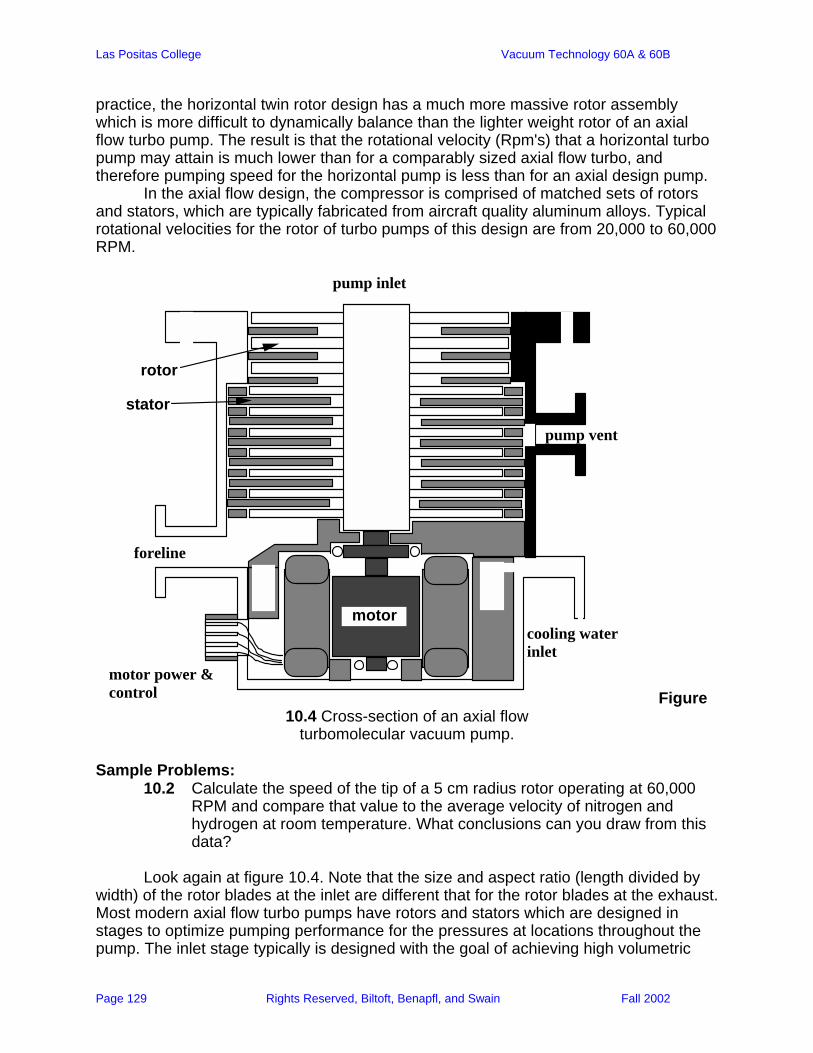
Las Positas College Vacuum Technology 60A & 60B
Page 129 Rights Reserved, Biltoft, Benapfl, and Swain Fall 2002
practice, the horizontal twin rotor design has a much more massive rotor assembly which is more difficult to dynamically balance than the lighter weight rotor of an axial flow turbo pump. The result is that the rotational velocity (Rpm's) that a horizontal turbo pump may attain is much lower than for a comparably sized axial flow turbo, and therefore pumping speed for the horizontal pump is less than for an axial design pump. In the axial flow design, the compressor is comprised of matched sets of rotors and stators, which are typically fabricated from aircraft quality aluminum alloys. Typical rotational velocities for the rotor of turbo pumps of this design are from 20,000 to 60,000 RPM.
pump inlet
pump vent
cooling water inlet
foreline
motor power & control
motor
rotor
stator
motor
Figure 10.4 Cross-section of an axial flow
turbomolecular vacuum pump. Sample Problems:
10.2 Calculate the speed of the tip of a 5 cm radius rotor operating at 60,000 RPM and compare that value to the average velocity of nitrogen and hydrogen at room temperature. What conclusions can you draw from this data?
Look again at figure 10.4. Note that the size and aspect ratio (length divided by width) of the rotor blades at the inlet are different that for the rotor blades at the exhaust. Most modern axial flow turbo pumps have rotors and stators which are designed in stages to optimize pumping performance for the pressures at locations throughout the pump. The inlet stage typically is designed with the goal of achieving high volumetric

Las Positas College Vacuum Technology 60A & 60B
Page 130 Rights Reserved, Biltoft, Benapfl, and Swain Fall 2002
speed with minimal compression. Stages at the exhaust line are designed with the opposite goal in mind: maximizing compression of the gas at the expense of volumetric speed. It should be noted that the function of the stators and rotors is slightly different. The high speed rotors provide a surface on which gas molecules "reside" for some short time, then desorb, leaving in a preferred direction. The stators serve to improve the effectiveness of the rotors by providing a baffle effect, directing the gas flow to the next rotor. For this reason, the stator is often omitted from the final stage of the turbo pump, as it would serve no purpose, and would impede the flow of gas to the backing pump. Since the low molecular weight gases are the most difficult to pump using a turbo, the ultimate pressure one may attain using a turbomolecular pump is often due to the inefficiency of the pumping of these gases.
Operational Aspects of Turbomolecular Pumps The maximum crossover pressure for turbomolecular pumps is approximately 1 Torr, this is a factor of ten times higher pressure than the maximum suggested crossover pressure for most oil vapor diffusion pumps (100 mTorr). At pressures above 1 Torr the turbo pump blades will be slowed by collisions with gas molecules such that the motor will overload and the rotational velocity of the rotor will decrease to a speed that is ineffective for pumping gas. Unlike diffusion pumps, turbo pumps do have moving parts that can cause vibration which may adversely affect some precision instruments including scanning electron microscopes and surface science probes. A 60 or 120 Hz vibration typically is caused by a mechanical backing pump, while high frequency vibration is due to imbalances in the turbo pump rotor. Most vacuum applications are insensitive to this minute amount of vibration, but if vibration must be held to a minimum, and the pumping characteristics of a turbo pump are desired, a magnetically levitated rotor design may provide the solution. In this type of turbo pump conventional (but oil free) bearings are only used on start-up and shut-down of the turbo. During normal operation the rotor is suspended above the bearings by well matched sets of strong magnets, virtually eliminating all mechanical vibration. Magnetically levitated turbo pumps are designed to operate for long periods of time with very few interruptions. Each time a magnetically levitated turbo pump is started or stopped, the oil-free mechanical bearings suffer wear and eventually will require replacement. Beyond reduction of vibration, the magnetically levitated rotor design turbos offer the option of mounting in any orientation, as there is no oil sump as in most conventional turbo pumps. Standard sequence of operation of turbomolecular pumped vacuum systems (see figure 10.5) is as follows:
Las Positas College Vacuum Technology 60A & 60B
Page 131 Rights Reserved, Biltoft, Benapfl, and Swain Fall 2002
Start-up: 1. Close all valves in the vacuum system. 2. Start the mechanical pump. 3. Open the foreline valve and rough pump the turbomolecular pump to a
pressure of less than 1 Torr. 4. Start turbo pump; wait for rotor to attain normal operational velocity (20
minutes for most small to medium size pumps). 5. Close the foreline valve. 6. Open the vessel roughing valve; evacuate the vacuum vessel to a
pressure of less than 500 mTorr*. 7. Close the vessel roughing valve; open the foreline valve. 8. Open the head gate valve; turn on the ion gauge. Venting the vessel without stopping the turbo pump: 1. Turn off the ion gauge. 2. Close the head gate valve. 3. Open the vessel vent valve. 4. Open the vessel as soon as it reaches an internal pressure equal to
atmospheric. 5. Close the vacuum vessel and the vessel vent valve. 6. Close the foreline valve. 7. Open the vessel roughing valve; evacuate the vacuum vessel to a
pressure of less than 500 mTorr*. 8. Close the vessel roughing valve; open the foreline valve. 9. Open the head gate valve; turn on the ion gauge. Shut-down: 1. Turn off the ion gauge. 2. Close the head gate valve. 3. Turn off power to the turbo pump, wait for rotation to stop. 4. Close the foreline valve and turn off the mechanical pump. 5. Vent the roughing line. 6. Open the air admittance valve on the turbo pump to gradually bring the
pump to atmospheric pressure. 7. Open the vacuum vessel vent valve. *Check manufacturer's suggested crossover pressure for the particular pump you
are using. Sample Problem: 10.3 Why are turbomolecular pump compressors designed in several "stages"? What are the characteristics of the inlet and exhaust stages?
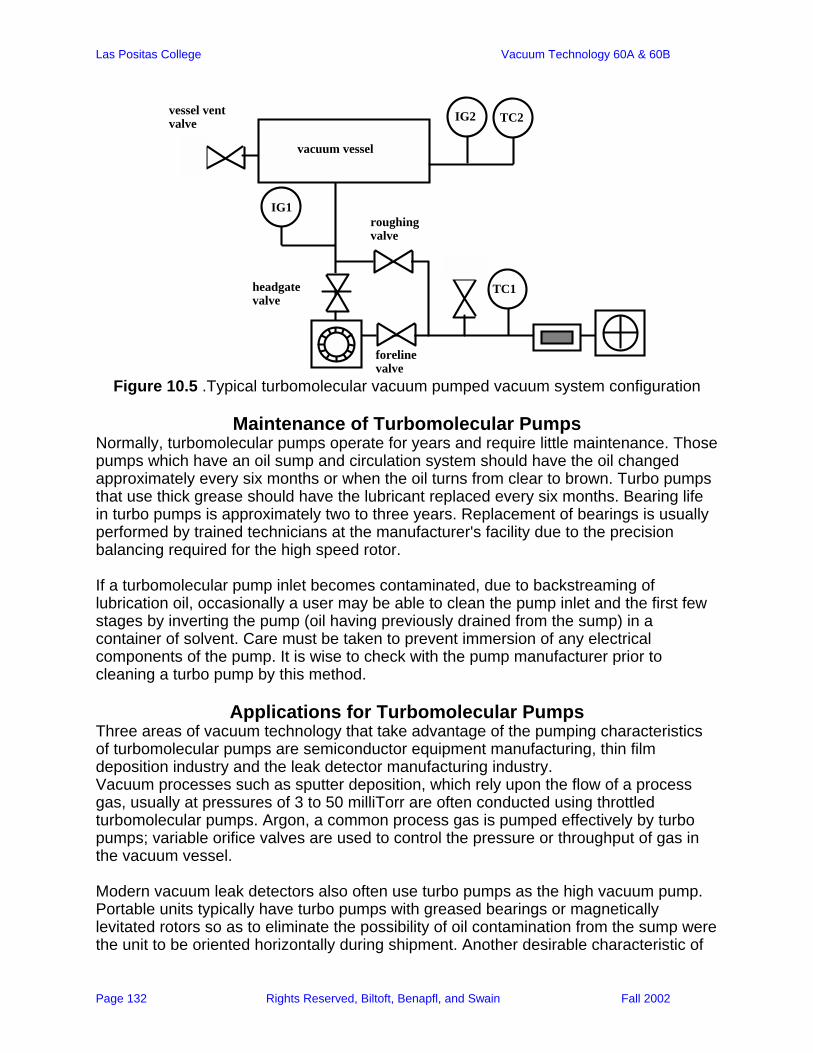
Las Positas College Vacuum Technology 60A & 60B
Page 132 Rights Reserved, Biltoft, Benapfl, and Swain Fall 2002
TC1
vacuum vessel
IG2 TC2
IG1
foreline valve
roughing valve
headgate valve
vessel vent valve
Figure 10.5 .Typical turbomolecular vacuum pumped vacuum system configuration
Maintenance of Turbomolecular Pumps
Normally, turbomolecular pumps operate for years and require little maintenance. Those pumps which have an oil sump and circulation system should have the oil changed approximately every six months or when the oil turns from clear to brown. Turbo pumps that use thick grease should have the lubricant replaced every six months. Bearing life in turbo pumps is approximately two to three years. Replacement of bearings is usually performed by trained technicians at the manufacturer's facility due to the precision balancing required for the high speed rotor. If a turbomolecular pump inlet becomes contaminated, due to backstreaming of lubrication oil, occasionally a user may be able to clean the pump inlet and the first few stages by inverting the pump (oil having previously drained from the sump) in a container of solvent. Care must be taken to prevent immersion of any electrical components of the pump. It is wise to check with the pump manufacturer prior to cleaning a turbo pump by this method.
Applications for Turbomolecular Pumps Three areas of vacuum technology that take advantage of the pumping characteristics of turbomolecular pumps are semiconductor equipment manufacturing, thin film deposition industry and the leak detector manufacturing industry. Vacuum processes such as sputter deposition, which rely upon the flow of a process gas, usually at pressures of 3 to 50 milliTorr are often conducted using throttled turbomolecular pumps. Argon, a common process gas is pumped effectively by turbo pumps; variable orifice valves are used to control the pressure or throughput of gas in the vacuum vessel. Modern vacuum leak detectors also often use turbo pumps as the high vacuum pump. Portable units typically have turbo pumps with greased bearings or magnetically levitated rotors so as to eliminate the possibility of oil contamination from the sump were the unit to be oriented horizontally during shipment. Another desirable characteristic of
Las Positas College Vacuum Technology 60A & 60B
Page 133 Rights Reserved, Biltoft, Benapfl, and Swain Fall 2002
turbo pumps for leak detector application is the relatively high pumping speed for atmospheric gases (oxygen, nitrogen, carbon dioxide) compared with that for the light gas, helium. In most instances helium is used for leak detection due to its small molecular size, rarity in the atmosphere, and low toxicity. Some of the newer "counter-flow" leak detectors rely upon the low pumping efficiency of turbo pumps for light gases, such as helium, to permit backwards flow of helium through the operating turbo pump. This design allows for a much more compact and portable leak detector unit (more on this in Unit 13, Leak detection). Sample Problems:
10.4 What are advantages of a turbomolecular pump over a diffusion pump? 10.5 Turbomolecular pump suffer severe mechanical damage when solid
objects fall into the inlet during operation of the pump. Can you suggest two ways to prevent this occurrence?
10.6 What limits the base pressure one may attain using a turbomolecular pump?
10.7 Accessories available for turbomolecular pumps include the following: Flange Heaters: To aid in the removal of residual gases and any contamination that may be present at the inlet area of the pump. Care must be taken not to exceed the manufacturer's suggested maximum temperature, as severe bearing wear may result. Venting Devices: Upon interruption of electrical power these valves admit air into the inlet area of the pump to achieve pressure equilibrium within the turbo pump. This action serves to reduce the possibility of mechanical damage to the rotors and to minimize backstreaming of oil from the foreline. Vibration Isolation Bellows: Reduce the transmission of high frequency vibration from the turbo pump to the vacuum vessel. Water Flow Interlock: Prevents the operation of the turbo pump without proper flow of cooling water.
Compound Molecular Pumps Compound molecular pumps are typically of the axial flow design and are essentially a combination of a turbomolecular and a molecular drag pump built into one unit. The advantage of a compound pump is that the molecular drag pump at the exhaust stage is able to compress the gas to a higher pressure than a conventional turbo pump. Most compound pumps are made to be backed by a diaphragm pump, thereby eliminating the possibility of backstreaming oil from an oil sealed rotary vane pump. Some of the newer compound pump can exhaust to atmospheric pressure; these pumps are often small (less than 150 liters per second pumping speed). For Further Reading:
High Vacuum Technology, Hablanian, Marsbed, M., Marcel Dekker, INC., New York, New York. 1990, pp. 231-258.

Las Positas College Vacuum Technology 60A & 60B
Page 134 Rights Reserved, Biltoft, Benapfl, and Swain Fall 2002
A User's Guide to Vacuum Technology, O'Hanlon, John F. John Wiley & Sons New York, New York. 1980, pp. 181-191. Modern Vacuum Practice, Harris, Nigel, McGraw-Hill, New York, New York, 1989, pp.146-159.
Laboratory Exercise 10.1: Inspection of a turbomolecular high vacuum pump. Goals of this experiment: to operate a turbo pumped vacuum system, to observe the pump down rate for a vessel, to observe the base pressure of the system and to calculate the total gas load in the vessel. Equipment required: An axial flow turbomolecular pump. Procedure: Locate the manufacturer's literature for the model pump you will be working with. What is the rated speed for air? What is the ultimate pressure the pump can attain? What is the crossover pressure? What is the critical foreline pressure? What type bearings does the pump have? How is the pump cooled? What are the utilities requirements (water and electrical)? What is the recommended routine maintenance procedure? Inspect the pump. Is there an air admittance valve on the unit? How is this valve actuated? Will this valve safely vent the pump during a power failure? If the pump has an oil sump, inspect the oil through the viewport. Note the appearance, clarity and level of the oil. Create a written report of your findings for submission to the Laboratory Instructor. Laboratory Exercise 10.2: Operation of a vacuum system with a turbomolecular pump. Equipment required: small vacuum vessel or bell jar vacuum system to which a suitably sized turbomolecular pump can be attached, a vent valve for the vessel, two ionization gauges two thermocouple gauges and controllers, a gate valve to match the turbo pump inlet, roughing lines, a mechanical pump, a roughing valve, a foreline valve and a roughing line vent valve. Procedure: Prior to any experimental work, make certain that the roughing pump selected will deliver adequate pumping speed to the foreline of the turbo pump. Assemble the equipment as shown in figure 10.5. Make certain the cooling water flow is adequate if the pump is a water cooled model. After the Laboratory Instructor has checked the vacuum system, follow the system start-up procedures provided in this unit. Measure the vacuum vessel pressure as a function of time during pump down. Graph the data clearly showing which portion of the curve is due to evacuation by the mechanical pump, the point of crossover, and the pumping action due to the turbo pump. Following completion of the measurements safely shut down the turbo pumped vacuum system as outlined in this unit.
Las Positas College Vacuum Technology 60A & 60B
Page 135 Rights Reserved, Biltoft, Benapfl, and Swain Fall 2002
Submit a written report for this experiment to the Laboratory Instructor. Discussion: Assuming the rated speed of the turbo pump, and the measured base pressure, calculate the total gas load in the vacuum system. What, in your opinion, are the sources of this gas load? How would you reduce these gas sources? Laboratory Exercise 10.3: Measurement of pumping speed for a turbo pump. Goals of this experiment: to measure the pumping speed of a turbo pump using the constant pressure method. Equipment required: The turbo pumped system assembled for experiment 10.1, a needle valve /atmosphere valve assembly, a 1 ml graduated pipette, tygon tubing to fit the pipette, a 500 ml plastic beaker, food coloring or ink, and two thermocouple gauges with controllers. Procedure: Using the vacuum system assembled for experiment 10.1, attach a needle valve/atmosphere valve assembly to the vacuum vessel as was done for the speed measurement at constant pressure for diffusion pumps. Bring the system into high vacuum operation using the set of procedures used in this unit. Open the needle valve slightly; wait for the pressure in the vessel to stabilize. Close the atmosphere valve by placing a thumb over the hole, and record the time required to pull 1 ml of water up into the graduated pipette. Record this time along with the pressure during the measurement. Open the needle valve another small increment and repeat the measurement of time required to draw 1 ml of water into the graduated pipette at the new pressure. Make at least ten measurements in this manner. Using equations 8.1 and 8.2 calculate the speed at each pressure, then plot the data as speed versus pressure. Following completion of the measurements safely shut down the turbo pumped vacuum system as outlined in this unit. Submit a written report for this experiment to the Laboratory Instructor. Discussion: Was the pumping speed data you collected over a range of pressures comparable to the data published by the turbo pump manufacturer?
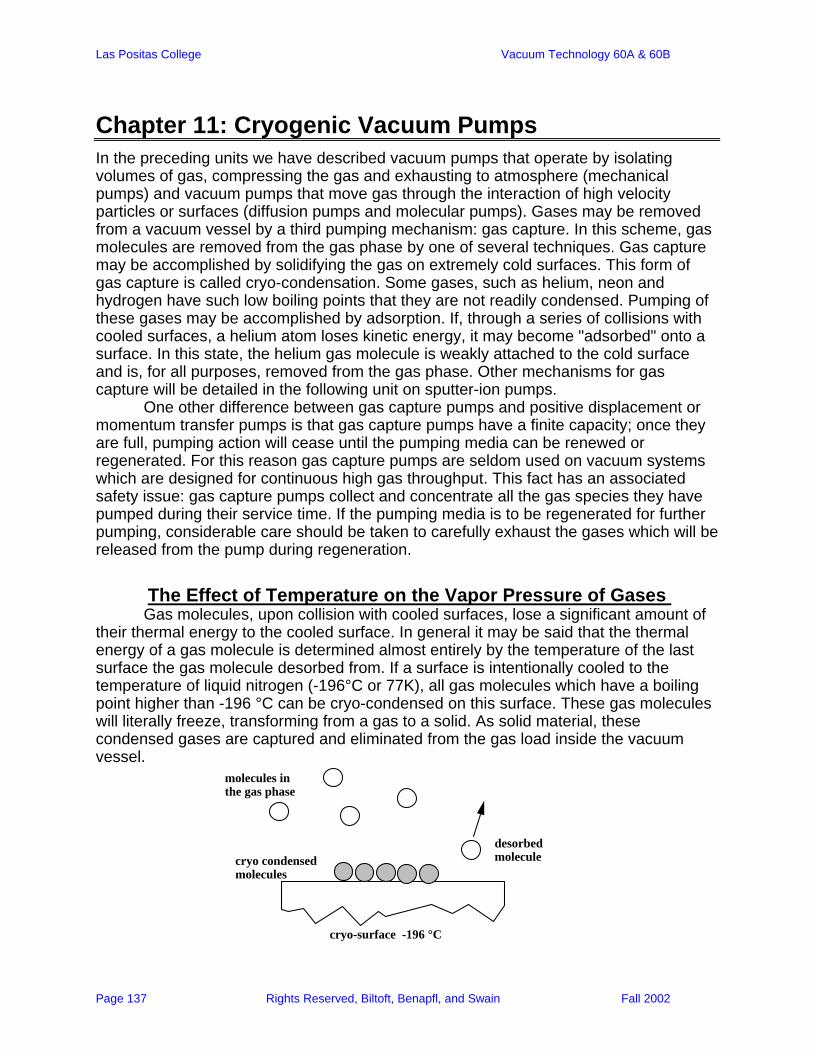
Las Positas College Vacuum Technology 60A & 60B
Page 137 Rights Reserved, Biltoft, Benapfl, and Swain Fall 2002
Chapter 11: Cryogenic Vacuum Pumps In the preceding units we have described vacuum pumps that operate by isolating volumes of gas, compressing the gas and exhausting to atmosphere (mechanical pumps) and vacuum pumps that move gas through the interaction of high velocity particles or surfaces (diffusion pumps and molecular pumps). Gases may be removed from a vacuum vessel by a third pumping mechanism: gas capture. In this scheme, gas molecules are removed from the gas phase by one of several techniques. Gas capture may be accomplished by solidifying the gas on extremely cold surfaces. This form of gas capture is called cryo-condensation. Some gases, such as helium, neon and hydrogen have such low boiling points that they are not readily condensed. Pumping of these gases may be accomplished by adsorption. If, through a series of collisions with cooled surfaces, a helium atom loses kinetic energy, it may become "adsorbed" onto a surface. In this state, the helium gas molecule is weakly attached to the cold surface and is, for all purposes, removed from the gas phase. Other mechanisms for gas capture will be detailed in the following unit on sputter-ion pumps. One other difference between gas capture pumps and positive displacement or momentum transfer pumps is that gas capture pumps have a finite capacity; once they are full, pumping action will cease until the pumping media can be renewed or regenerated. For this reason gas capture pumps are seldom used on vacuum systems which are designed for continuous high gas throughput. This fact has an associated safety issue: gas capture pumps collect and concentrate all the gas species they have pumped during their service time. If the pumping media is to be regenerated for further pumping, considerable care should be taken to carefully exhaust the gases which will be released from the pump during regeneration.
The Effect of Temperature on the Vapor Pressure of Gases Gas molecules, upon collision with cooled surfaces, lose a significant amount of their thermal energy to the cooled surface. In general it may be said that the thermal energy of a gas molecule is determined almost entirely by the temperature of the last surface the gas molecule desorbed from. If a surface is intentionally cooled to the temperature of liquid nitrogen (-196°C or 77K), all gas molecules which have a boiling point higher than -196 °C can be cryo-condensed on this surface. These gas molecules will literally freeze, transforming from a gas to a solid. As solid material, these condensed gases are captured and eliminated from the gas load inside the vacuum vessel.
cryo-surface -196 °C
molecules in the gas phase
cryo condensed molecules
desorbed molecule

Las Positas College Vacuum Technology 60A & 60B
Page 138 Rights Reserved, Biltoft, Benapfl, and Swain Fall 2002
Figure 11.1 Molecules in the gas phase,upon contact with a cryo-cooled surface, condense on that surface. The residence time for molecules is dependent upon the specie of gas, the temperature of the cryo-surface and the heat of adsorption (see equation 4.8). Sample Problems:
11.1 The boiling point of liquid nitrogen is -196 °C. Which of the following gases can be condensed on a surface cooled by liquid nitrogen?
11.2 For gas molecules which are not cryo-condensed onto a surface cooled by liquid nitrogen, what would the temperature of the desorbed gas molecules be after they leave the cold surface? How would the velocity of these gas molecules be affected?
11.3 Calculate the residence time for common atmospheric gases which have been condensed onto a surface cooled to liquid nitrogen temperature.
Cryo-sorption Pumps Cryo-sorption pumps provide a safe, quiet, clean and reasonably inexpensive method for evacuation of a vacuum vessel to a pressure of 10-3 Torr. Most commercial cryo sorption pumps resemble the diagram in figure 11.2. Liquid nitrogen is used to cool the exterior of the welded aluminum pump body to -196 °C. The interior of the pump body has radially arrayed heat transfer fins that aid in extracting the heat from the sorbent, which is usually activated carbon or alumina. A metal screen, often made of stainless steel creates an open channel that runs vertically through the pump body. This channel aids in exposing the pumping media, or sorbent to gases entering the pump inlet. Linde 5A is a popular sorbent material, which has micro pores of approximately 5Å diameter, which are optimal for trapping most atmospheric gases. Other advantages of this sorbent are that it is chemically inert and will not thermally decompose during a bake-out at 250 °C.
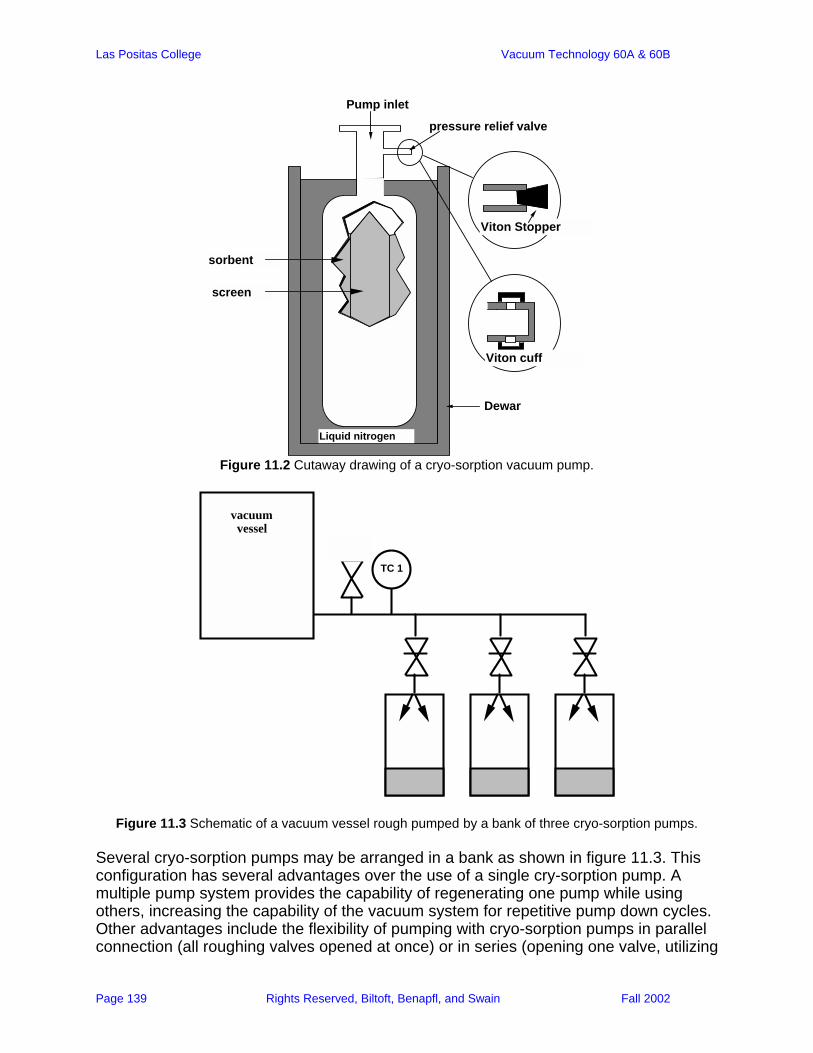
Las Positas College Vacuum Technology 60A & 60B
Page 139 Rights Reserved, Biltoft, Benapfl, and Swain Fall 2002
Viton Stopper
Viton cuff
sorbent
Liquid nitrogen
Dewar
screen
Pump inlet
pressure relief valve
Figure 11.2 Cutaway drawing of a cryo-sorption vacuum pump.
TC 1
vacuum vessel
Figure 11.3 Schematic of a vacuum vessel rough pumped by a bank of three cryo-sorption pumps. Several cryo-sorption pumps may be arranged in a bank as shown in figure 11.3. This configuration has several advantages over the use of a single cry-sorption pump. A multiple pump system provides the capability of regenerating one pump while using others, increasing the capability of the vacuum system for repetitive pump down cycles. Other advantages include the flexibility of pumping with cryo-sorption pumps in parallel connection (all roughing valves opened at once) or in series (opening one valve, utilizing
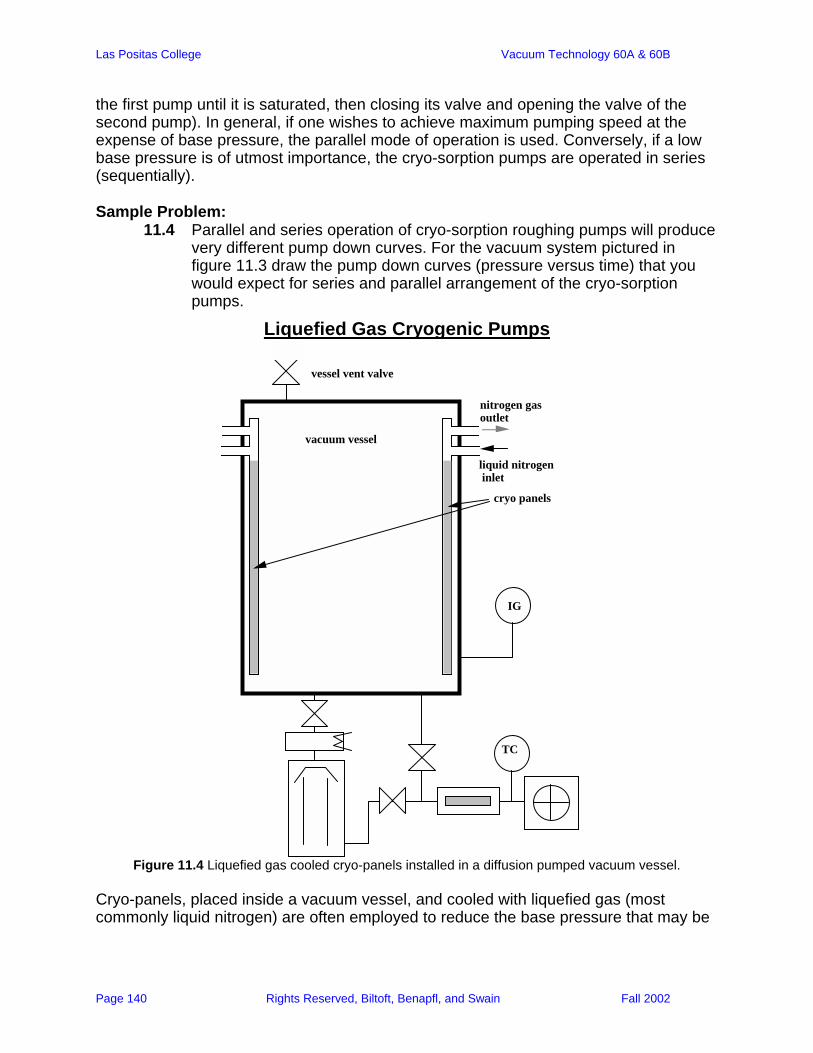
Las Positas College Vacuum Technology 60A & 60B
Page 140 Rights Reserved, Biltoft, Benapfl, and Swain Fall 2002
the first pump until it is saturated, then closing its valve and opening the valve of the second pump). In general, if one wishes to achieve maximum pumping speed at the expense of base pressure, the parallel mode of operation is used. Conversely, if a low base pressure is of utmost importance, the cryo-sorption pumps are operated in series (sequentially). Sample Problem:
11.4 Parallel and series operation of cryo-sorption roughing pumps will produce very different pump down curves. For the vacuum system pictured in figure 11.3 draw the pump down curves (pressure versus time) that you would expect for series and parallel arrangement of the cryo-sorption pumps.
Liquefied Gas Cryogenic Pumps
liquid nitrogen inlet
nitrogen gas outlet
TC
IG
vacuum vessel
vessel vent valve
cryo panels
Figure 11.4 Liquefied gas cooled cryo-panels installed in a diffusion pumped vacuum vessel.
Cryo-panels, placed inside a vacuum vessel, and cooled with liquefied gas (most commonly liquid nitrogen) are often employed to reduce the base pressure that may be
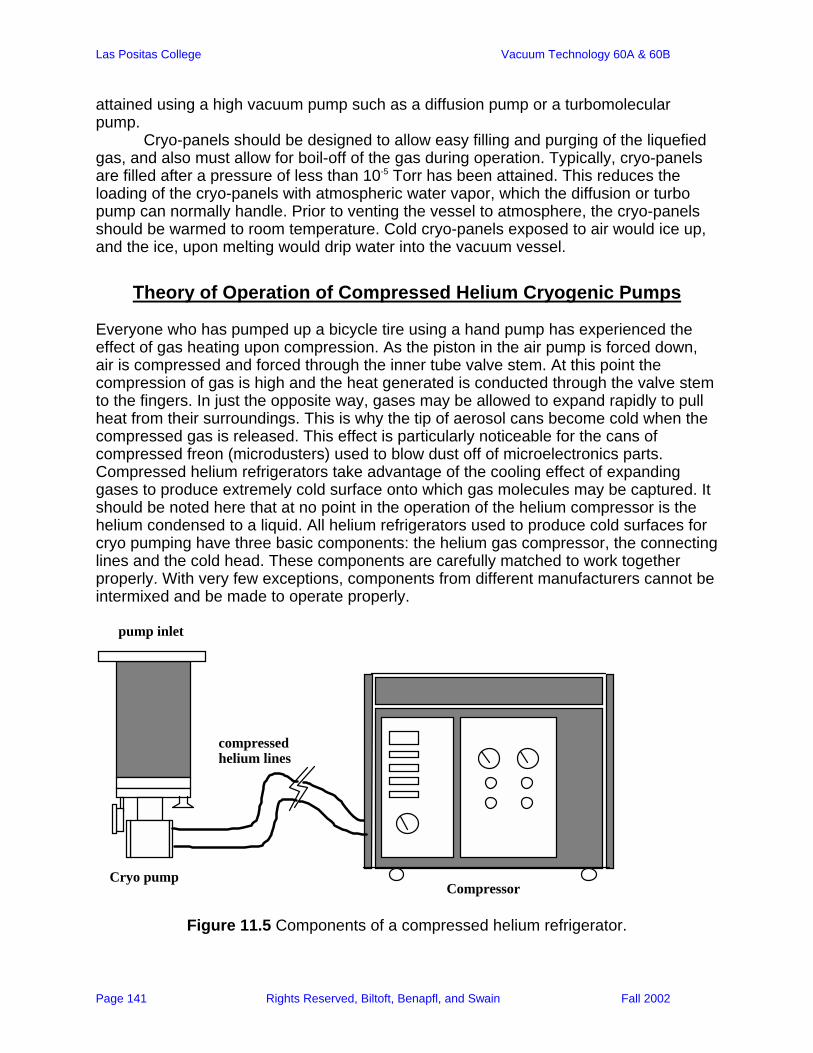
Las Positas College Vacuum Technology 60A & 60B
Page 141 Rights Reserved, Biltoft, Benapfl, and Swain Fall 2002
attained using a high vacuum pump such as a diffusion pump or a turbomolecular pump. Cryo-panels should be designed to allow easy filling and purging of the liquefied gas, and also must allow for boil-off of the gas during operation. Typically, cryo-panels are filled after a pressure of less than 10-5 Torr has been attained. This reduces the loading of the cryo-panels with atmospheric water vapor, which the diffusion or turbo pump can normally handle. Prior to venting the vessel to atmosphere, the cryo-panels should be warmed to room temperature. Cold cryo-panels exposed to air would ice up, and the ice, upon melting would drip water into the vacuum vessel.
Theory of Operation of Compressed Helium Cryogenic Pumps Everyone who has pumped up a bicycle tire using a hand pump has experienced the effect of gas heating upon compression. As the piston in the air pump is forced down, air is compressed and forced through the inner tube valve stem. At this point the compression of gas is high and the heat generated is conducted through the valve stem to the fingers. In just the opposite way, gases may be allowed to expand rapidly to pull heat from their surroundings. This is why the tip of aerosol cans become cold when the compressed gas is released. This effect is particularly noticeable for the cans of compressed freon (microdusters) used to blow dust off of microelectronics parts. Compressed helium refrigerators take advantage of the cooling effect of expanding gases to produce extremely cold surface onto which gas molecules may be captured. It should be noted here that at no point in the operation of the helium compressor is the helium condensed to a liquid. All helium refrigerators used to produce cold surfaces for cryo pumping have three basic components: the helium gas compressor, the connecting lines and the cold head. These components are carefully matched to work together properly. With very few exceptions, components from different manufacturers cannot be intermixed and be made to operate properly.
Cryo pumpCompressor
compressed helium lines
pump inlet
Figure 11.5 Components of a compressed helium refrigerator.
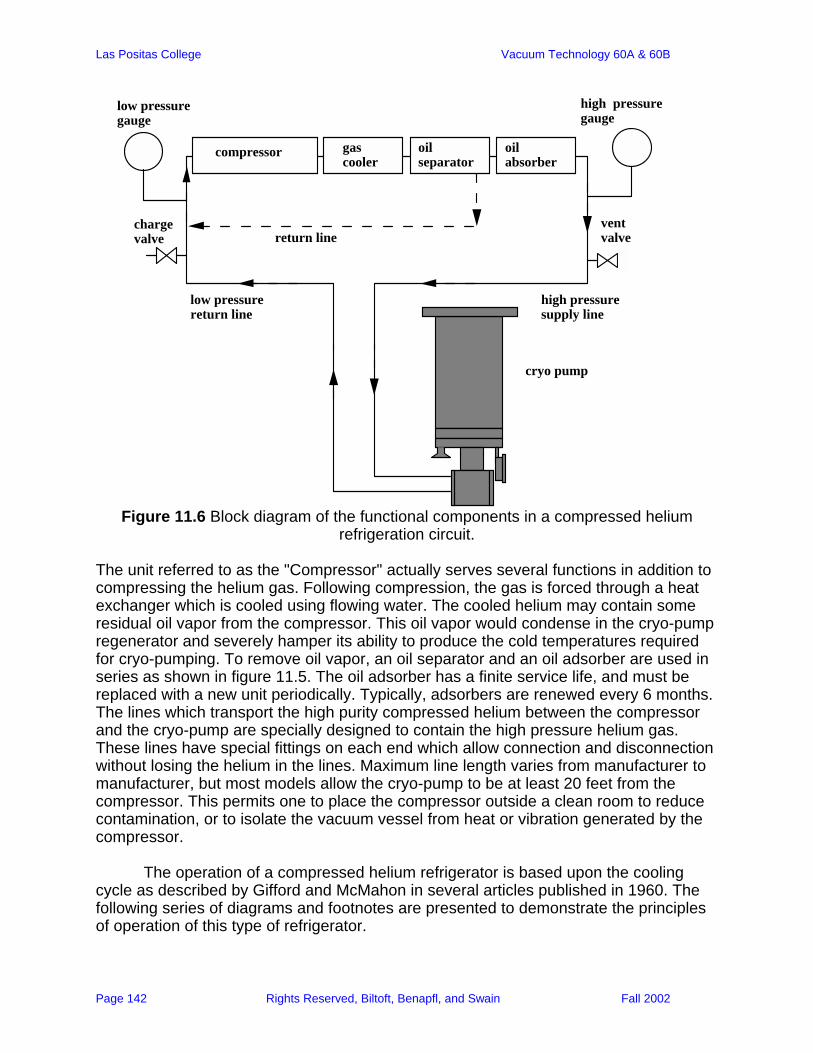
Las Positas College Vacuum Technology 60A & 60B
Page 142 Rights Reserved, Biltoft, Benapfl, and Swain Fall 2002
compressor gas cooler
oil separator
oil absorber
cryo pump
low pressure return line
high pressure supply line
charge valve
vent valvereturn line
low pressure gauge
high pressure gauge
Figure 11.6 Block diagram of the functional components in a compressed helium
refrigeration circuit. The unit referred to as the "Compressor" actually serves several functions in addition to compressing the helium gas. Following compression, the gas is forced through a heat exchanger which is cooled using flowing water. The cooled helium may contain some residual oil vapor from the compressor. This oil vapor would condense in the cryo-pump regenerator and severely hamper its ability to produce the cold temperatures required for cryo-pumping. To remove oil vapor, an oil separator and an oil adsorber are used in series as shown in figure 11.5. The oil adsorber has a finite service life, and must be replaced with a new unit periodically. Typically, adsorbers are renewed every 6 months. The lines which transport the high purity compressed helium between the compressor and the cryo-pump are specially designed to contain the high pressure helium gas. These lines have special fittings on each end which allow connection and disconnection without losing the helium in the lines. Maximum line length varies from manufacturer to manufacturer, but most models allow the cryo-pump to be at least 20 feet from the compressor. This permits one to place the compressor outside a clean room to reduce contamination, or to isolate the vacuum vessel from heat or vibration generated by the compressor. The operation of a compressed helium refrigerator is based upon the cooling cycle as described by Gifford and McMahon in several articles published in 1960. The following series of diagrams and footnotes are presented to demonstrate the principles of operation of this type of refrigerator.

Las Positas College Vacuum Technology 60A & 60B
Page 143 Rights Reserved, Biltoft, Benapfl, and Swain Fall 2002
supply valve
helium compressor
return valve
displacer
regenerator
Figure 11.7 Cross-section of a compressed helium refrigerator. In the first part of the refrigeration cycle, the displacer, which is made of a thermally insulating material (usually micarta) is at the lower end of its stroke. The compressed helium supply valve is opened, and high pressure (300 PSI) helium gas at room temperature is flowed into the cylinder in which the displacer oscillates.
supply valve
helium compressor
return valve
Figure 11.8 As the high pressure gas is admitted into the cylinder, the displacer moves upwards, forcing the gas to pass into and through the regenerator. The regenerator is made up of tightly packed material of high thermal inertia or heat capacity. Heat
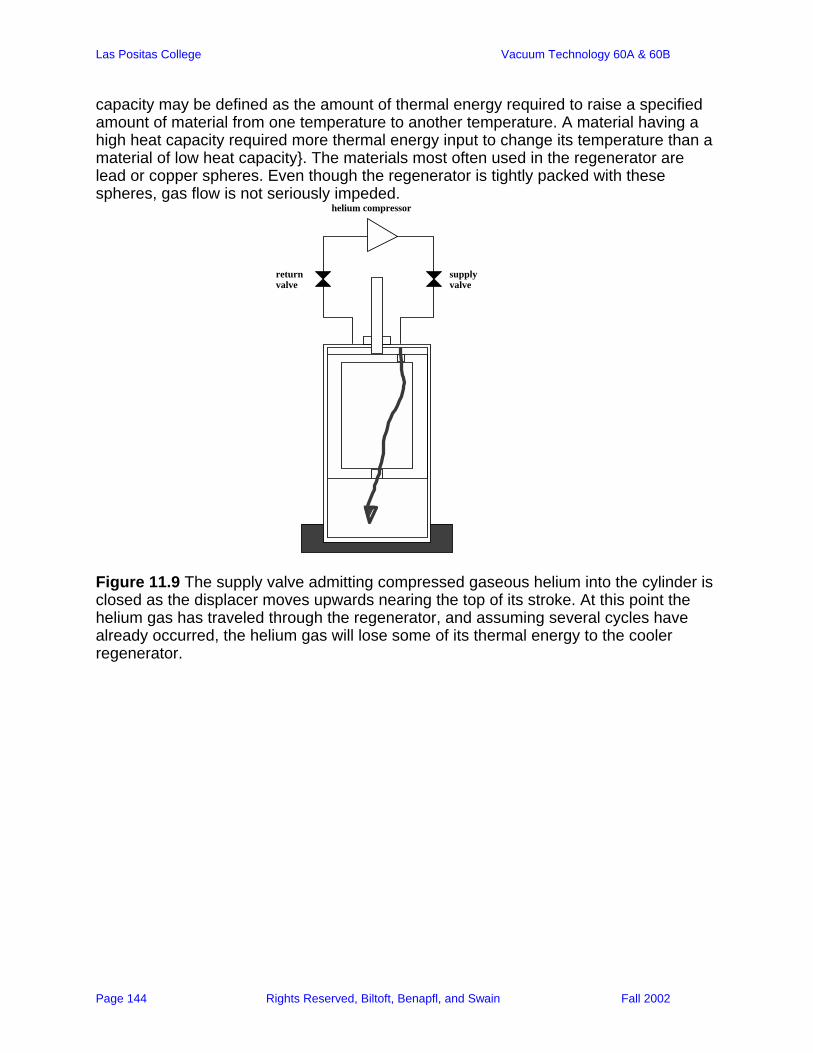
Las Positas College Vacuum Technology 60A & 60B
Page 144 Rights Reserved, Biltoft, Benapfl, and Swain Fall 2002
capacity may be defined as the amount of thermal energy required to raise a specified amount of material from one temperature to another temperature. A material having a high heat capacity required more thermal energy input to change its temperature than a material of low heat capacity. The materials most often used in the regenerator are lead or copper spheres. Even though the regenerator is tightly packed with these spheres, gas flow is not seriously impeded.
supply valve
helium compressor
return valve
Figure 11.9 The supply valve admitting compressed gaseous helium into the cylinder is closed as the displacer moves upwards nearing the top of its stroke. At this point the helium gas has traveled through the regenerator, and assuming several cycles have already occurred, the helium gas will lose some of its thermal energy to the cooler regenerator.
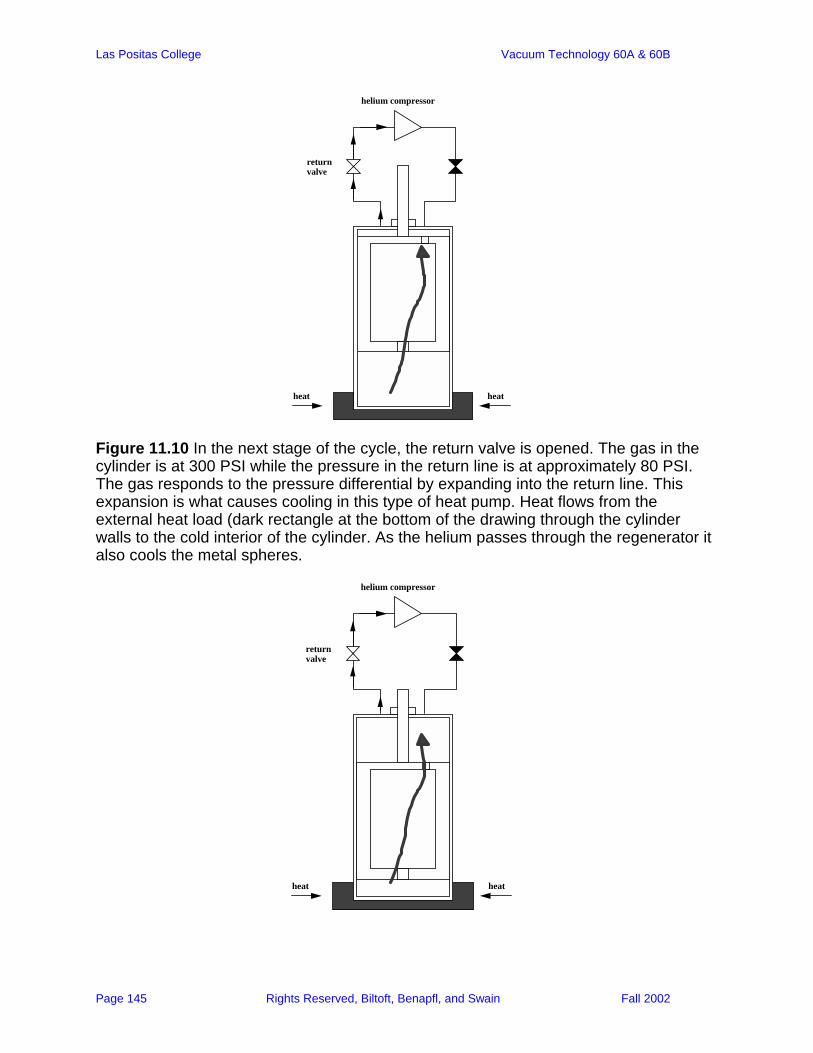
Las Positas College Vacuum Technology 60A & 60B
Page 145 Rights Reserved, Biltoft, Benapfl, and Swain Fall 2002
helium compressor
return valve
heatheat
Figure 11.10 In the next stage of the cycle, the return valve is opened. The gas in the cylinder is at 300 PSI while the pressure in the return line is at approximately 80 PSI. The gas responds to the pressure differential by expanding into the return line. This expansion is what causes cooling in this type of heat pump. Heat flows from the external heat load (dark rectangle at the bottom of the drawing through the cylinder walls to the cold interior of the cylinder. As the helium passes through the regenerator it also cools the metal spheres.
helium compressor
return valve
heatheat
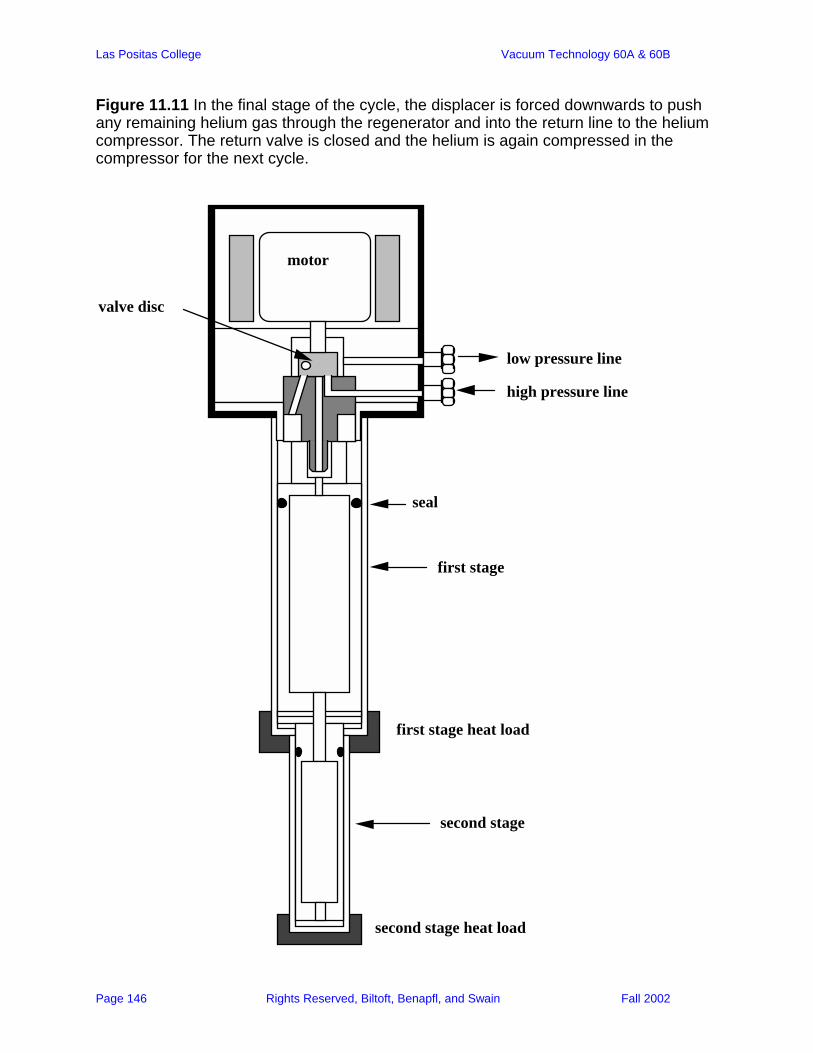
Las Positas College Vacuum Technology 60A & 60B
Page 146 Rights Reserved, Biltoft, Benapfl, and Swain Fall 2002
Figure 11.11 In the final stage of the cycle, the displacer is forced downwards to push any remaining helium gas through the regenerator and into the return line to the helium compressor. The return valve is closed and the helium is again compressed in the compressor for the next cycle.
motor
valve disc
low pressure line
high pressure line
seal
first stage
second stage
first stage heat load
second stage heat load
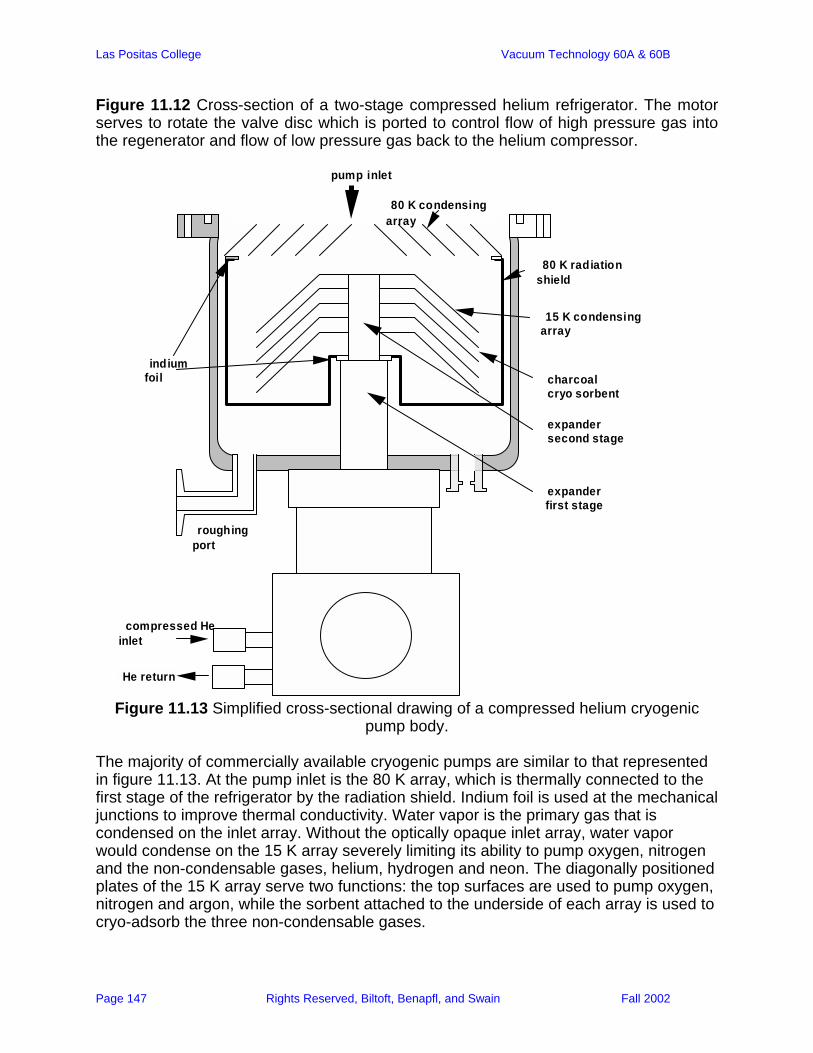
Las Positas College Vacuum Technology 60A & 60B
Page 147 Rights Reserved, Biltoft, Benapfl, and Swain Fall 2002
Figure 11.12 Cross-section of a two-stage compressed helium refrigerator. The motor serves to rotate the valve disc which is ported to control flow of high pressure gas into the regenerator and flow of low pressure gas back to the helium compressor.
80 K condensing array
pump inlet
80 K radiation shield
indium foil
15 K condensing array
charcoal cryo sorbent
expander first stage
expander second stage
roughing port
compressed He inlet
He return
Figure 11.13 Simplified cross-sectional drawing of a compressed helium cryogenic pump body.
The majority of commercially available cryogenic pumps are similar to that represented in figure 11.13. At the pump inlet is the 80 K array, which is thermally connected to the first stage of the refrigerator by the radiation shield. Indium foil is used at the mechanical junctions to improve thermal conductivity. Water vapor is the primary gas that is condensed on the inlet array. Without the optically opaque inlet array, water vapor would condense on the 15 K array severely limiting its ability to pump oxygen, nitrogen and the non-condensable gases, helium, hydrogen and neon. The diagonally positioned plates of the 15 K array serve two functions: the top surfaces are used to pump oxygen, nitrogen and argon, while the sorbent attached to the underside of each array is used to cryo-adsorb the three non-condensable gases.
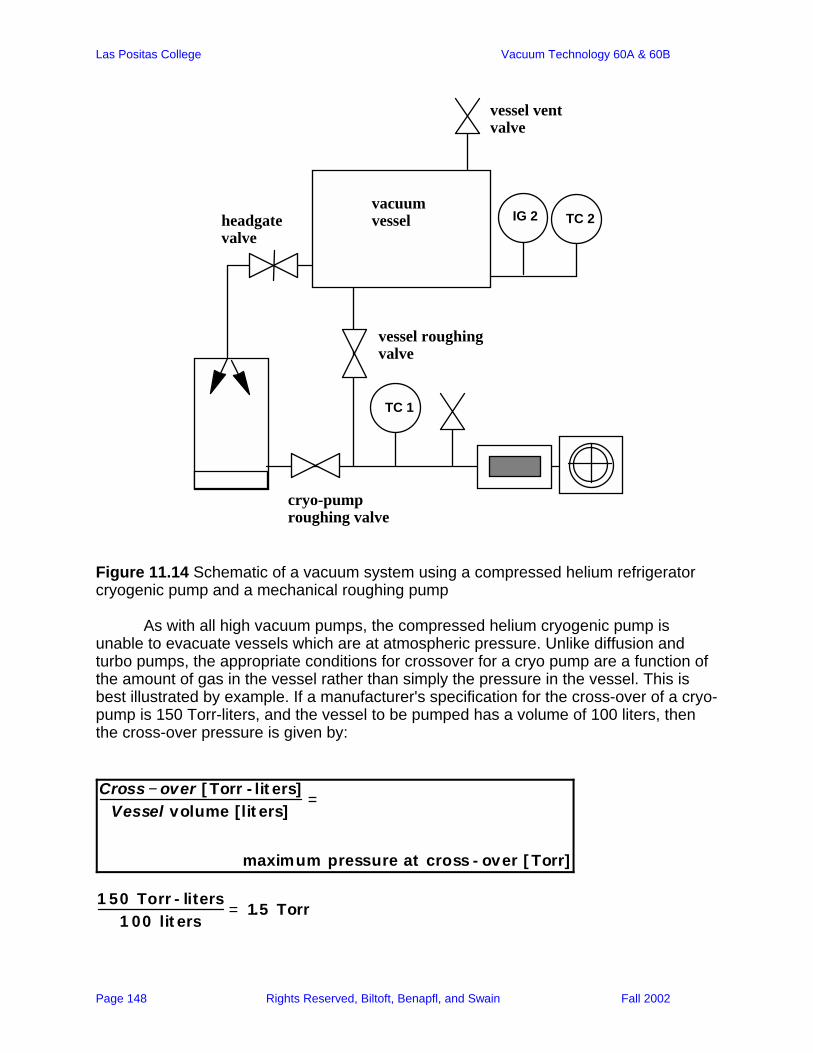
Las Positas College Vacuum Technology 60A & 60B
Page 148 Rights Reserved, Biltoft, Benapfl, and Swain Fall 2002
TC 1
IG 2 TC 2vacuum vessel
vessel vent valve
headgate valve
vessel roughing valve
cryo-pump roughing valve
Figure 11.14 Schematic of a vacuum system using a compressed helium refrigerator cryogenic pump and a mechanical roughing pump As with all high vacuum pumps, the compressed helium cryogenic pump is unable to evacuate vessels which are at atmospheric pressure. Unlike diffusion and turbo pumps, the appropriate conditions for crossover for a cryo pump are a function of the amount of gas in the vessel rather than simply the pressure in the vessel. This is best illustrated by example. If a manufacturer's specification for the cross-over of a cryo-pump is 150 Torr-liters, and the vessel to be pumped has a volume of 100 liters, then the cross-over pressure is given by:
Cross − over [ Torr - lit ers]Vessel volume [lit ers]
=
maximum pressure at cross - over [ Torr]
1 50 Torr - liters
1 00 lit ers= 1.5 Torr

Las Positas College Vacuum Technology 60A & 60B
Page 149 Rights Reserved, Biltoft, Benapfl, and Swain Fall 2002
It has been mentioned that cryogenic pumps, being of the gas capture type, have a finite capacity. Once these pumps have reached their capacity (become saturated) pumping action will cease. At this point the pump needs to be warmed up in a controlled manner to allow the release of the condensed gases in the pump's cryo arrays. This process is referred to as regeneration. During regeneration, all of the gases which have been captured by the pump will be released in concentrations much greater than normal in the atmosphere. It is possible, during regeneration, to release explosive or toxic gases in dangerous concentrations. For this reason the process of regeneration must be performed safely, following the pump manufacturer's directions. In general, one regenerates a compressed helium cryogenic pump following this procedure:
Regeneration Procedure for a Compressed Helium Cryo-pump:
1. Close the head gate valve between the pump inlet and the vacuum vessel. Turn off any pressure gauges that are exposed to the cryo-pump body.
2. Stop the cold head motor. 3. Check the poppet valve on the cryo-pump body to insure that it is in good
condition and is not physically obstructed. Dangerous over pressurization of the pump body will occur if the pressure release valve fails to operate properly.
4. Begin purging the pump body with dry, inert gas such as nitrogen or argon. (In some cases it is possible to speed regeneration if the purge gas is heated by flowing it through an electrically heated tube on its way to the cryo pump body).
5. If the cryo-pump is equipped with a blanket heater, turn this heater on. 6. Allow the pump to be purged with gas for a sufficient amount of time to
allow removal of all trapped gases inside the cryo-pump. This time is a function of pump size and design; check manufacturer's specifications for the time duration for this operation.
Following proper regeneration of the cryo-pump, the pump will be ready to resume service.
Operation of a Cryo-pumped Vacuum System:
Assuming all of the compressed helium lines are connected and properly purged, the sequence of operations is as follows:
1. Check the compressor to verify cooling water flow to the heat exchanger. 2. Start the compressor, allow it to operate for 30 minutes (the auto bypass
circuit in the compressor will cycle compressed helium from the high pressure side of the compressor to the low pressure side).
3. Close all valves on the vacuum system. 4. Start the roughing pump; allow time for the roughing pump to warm up. 5. Open the roughing valve to the cryo-pump; pump the cryo-pump body
down to a pressure of less than 50 milliTorr.
Las Positas College Vacuum Technology 60A & 60B
Page 150 Rights Reserved, Biltoft, Benapfl, and Swain Fall 2002
6. Close the roughing valve. 7. Record the rate of pressure rise inside the cryo-pump body. If the rate of
rise is less than 10 millitorr per minute, begin operation of the cold head. If the rate of rise is greater than 10 milliTorr per minute, the gas load in the pump is unacceptably high, and the cause must be identified and eliminated.
8. Observe the temperature of the cooled surfaces inside the pump using the pump's temperature monitor. Assuming the temp. probe is reading the second stage, when the temperature is below 10K, the pump is in a stable operational mode.
9. Refer to the manufacturer's literature for the crossover pressure specification for the pump model you are using. Calculate the crossover pressure.
10. Evacuate the vacuum vessel to a pressure below that calculated in step 10.
11. Close the vessel roughing valve and open the head gate valve. 12. Turn on vessel ionization gauge.
Sample Problems: 11.5 Why is the regenerator filled with lead spheres? 11.6 Is the helium in the refrigeration cycle of a compressed helium cryogenic pump ever in the form of a liquid? For Further Reading:
High Vacuum Technology, Hablanian, Marsbed, M., Marcel Dekker, INC, New York, New York. 1990, pp. 259-288.
A User's Guide to Vacuum Technology, O'Hanlon, John F. John Wiley &
Sons New York, New York. 1980, pp. 260-272.
Advanced Cryogenic Engineering, Vol. 11, Gifford, W.E., K.D. Timmerhaus, ed. Plenum, New York, New York, 1966, p. 49.
Laboratory Exercise 11.1: Inspection of a cryo-sorption pump. Equipment required: a cryo-sorption pump, Linde 5A sorbent, a heating jacket or "cal-rod" heating assembly, a manually operated vacuum valve to fit the inlet of the cryo-sorption pump. Procedure: Locate the manufacturer's literature for the model cryo-sorption pump to be used in this activity. Answer the following questions:
Las Positas College Vacuum Technology 60A & 60B
Page 151 Rights Reserved, Biltoft, Benapfl, and Swain Fall 2002
1. What is the capacity of the pump for atmospheric gases? 2. What type of sorbent is recommended? What amount of sorbent is
recommended? 3. What are the time and temperatures recommended for regeneration of the
cryo-sorption pump? 4. Identify the pressure relief valve on the cryo-sorption pump. How does it
work? Is the pressure relief valve in good operating condition? What are the potential dangers associated with regeneration of this type of vacuum pump?
5. Can this pump be mounted on a vacuum vessel in any orientation?
Laboratory Exercise 11.2: Pumping various gas species using cryo-sorption vacuum pumps. Equipment required: small vacuum vessel or bell jar vacuum system (less than 100 liters internal volume), two or three cryo-sorption vacuum pumps, isolation valves for each sorption pump, a vacuum gauge capable of reading from atmospheric pressure to 10-3 Torr, connecting tubulation, lecture bottles of back-fill gases (Helium, argon). Procedure: Assemble the equipment as shown in figure 11.3. Make certain the vacuum connections are secure. If necessary, regenerate the cryo-sorption pumps following the manufacturer's directions. Be careful to avoid contacting the hot surfaces with the skin and keep flammable materials at a safe distance from the sorption pumps during regeneration. Close isolation valves on each pump at the end of the regeneration cycle. When the pumps have cooled to room temperature, and are ready for use, attach a dewar to one pump at a time, fill the dewar with liquid nitrogen, and perform the following experimental measurements:
1. Using only one cryo-sorption pump, measure the time to evacuate the vessel from atmospheric pressure to 50 milliTorr. Close the isolation valve, vent the vacuum vessel to room air and repeat the evacuation, again recording the time to pump to 50 milliTorr. Repeat this process until the time to achieve the specified pressure is unacceptably long, or the pump fails to reach 50 milliTorr. Plot the data as pressure versus time for all the runs performed on a single piece of graph paper, clearly identifying each plot. Calculate the number of Torr-liters pumped during each measurement. Calculate the amount of gas (expressed in Torr-liters) required to saturate the pump. Compare this value to the manufacturer's specifications.
2. Repeat the steps in the first series of measurements, using a fresh cryo-
sorption pump, this time initially flooding the vessel with helium. Following
Las Positas College Vacuum Technology 60A & 60B
Page 152 Rights Reserved, Biltoft, Benapfl, and Swain Fall 2002
each evacuation, back-fill the vacuum vessel with helium. Plot the data as before and compare the results with the data for pumping air. What conclusions can you draw from this comparison?
3. Repeat the procedure in (2) using argon gas instead of helium. Again plot
the data and draw conclusions on the performance of cryo-sorption pumps used to pump these three gas loads.
Laboratory Exercise 11.3: Parallel and series pumping using cryo-sorption vacuum pumps. Equipment required: small vacuum vessel or bell jar vacuum system (less than 100 liters internal volume), two or three cryo-sorption vacuum pumps, isolation valves for each sorption pump, a vacuum gauge capable of reading from atmospheric pressure to 10-3 Torr, connecting tubulation, lecture bottles of back-fill gases (Helium, argon). Procedure: Assemble the equipment as was done for experiment 11.1. Regenerate the cryo-sorption pumps if necessary. Evacuate the vessel by opening all isolation valves simultaneously (parallel pumping). Record pressure as a function of time. Regenerate the cryo-sorption pumps and repeat the experiment, only this time open the cryo-sorption pump isolation valves sequentially (series pumping). Allow each pump to achieve its base pressure before closing its isolation valve and opening the isolation valve to the next pump. Plot the data for both measurements as pressure versus time, carefully labeling each set of data. Mark the plot of series pumping to show the point at which switching from one pump to the next occurred. How do the two sets of data (parallel versus series) compare? Which configuration produced the fastest initial pumping speed? Which achieved the lowest base pressure? Is your data consistent with your understanding of cryo-sorption pump operation? Laboratory Exercise 11.4: Inspection of a compressed helium cryogenic pump. Equipment required: a cryogenic pump, manufacturer's literature. Procedure: Using manufacturer's literature for the model cryo-sorption pump to be used in this activity. Answer the following questions:
1. What is the capacity of the pump for atmospheric gases? 2. Which gases are pumped on the inlet (80 K) array? 3. Which gases are pumped on the inlet (15 K) array?
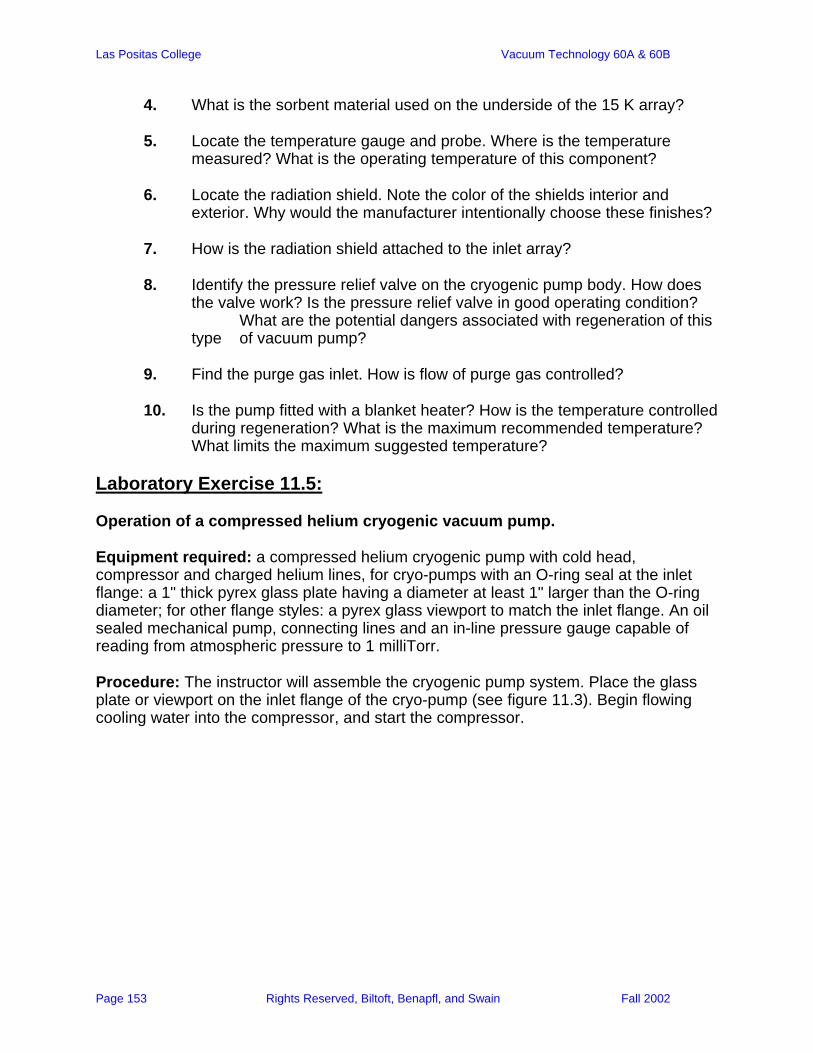
Las Positas College Vacuum Technology 60A & 60B
Page 153 Rights Reserved, Biltoft, Benapfl, and Swain Fall 2002
4. What is the sorbent material used on the underside of the 15 K array? 5. Locate the temperature gauge and probe. Where is the temperature
measured? What is the operating temperature of this component? 6. Locate the radiation shield. Note the color of the shields interior and
exterior. Why would the manufacturer intentionally choose these finishes? 7. How is the radiation shield attached to the inlet array? 8. Identify the pressure relief valve on the cryogenic pump body. How does
the valve work? Is the pressure relief valve in good operating condition? What are the potential dangers associated with regeneration of this type of vacuum pump?
9. Find the purge gas inlet. How is flow of purge gas controlled? 10. Is the pump fitted with a blanket heater? How is the temperature controlled
during regeneration? What is the maximum recommended temperature? What limits the maximum suggested temperature?
Laboratory Exercise 11.5: Operation of a compressed helium cryogenic vacuum pump. Equipment required: a compressed helium cryogenic pump with cold head, compressor and charged helium lines, for cryo-pumps with an O-ring seal at the inlet flange: a 1" thick pyrex glass plate having a diameter at least 1" larger than the O-ring diameter; for other flange styles: a pyrex glass viewport to match the inlet flange. An oil sealed mechanical pump, connecting lines and an in-line pressure gauge capable of reading from atmospheric pressure to 1 milliTorr. Procedure: The instructor will assemble the cryogenic pump system. Place the glass plate or viewport on the inlet flange of the cryo-pump (see figure 11.3). Begin flowing cooling water into the compressor, and start the compressor.
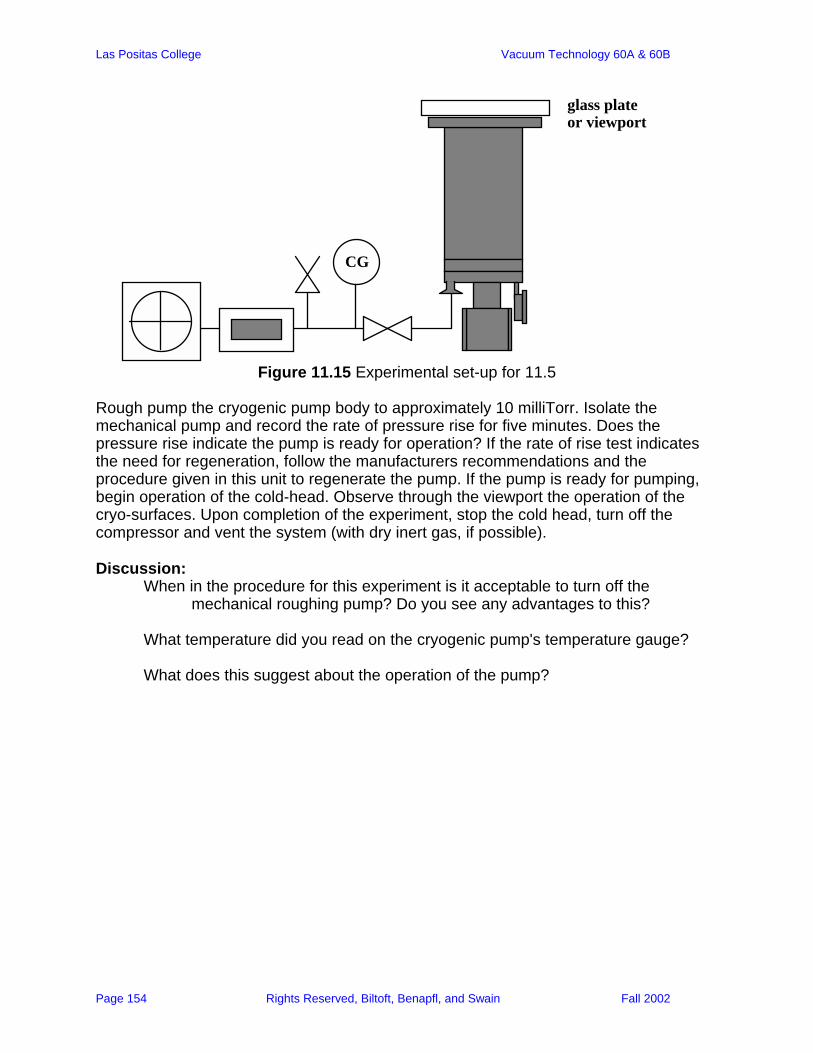
Las Positas College Vacuum Technology 60A & 60B
Page 154 Rights Reserved, Biltoft, Benapfl, and Swain Fall 2002
glass plate or viewport
CG
Figure 11.15 Experimental set-up for 11.5
Rough pump the cryogenic pump body to approximately 10 milliTorr. Isolate the mechanical pump and record the rate of pressure rise for five minutes. Does the pressure rise indicate the pump is ready for operation? If the rate of rise test indicates the need for regeneration, follow the manufacturers recommendations and the procedure given in this unit to regenerate the pump. If the pump is ready for pumping, begin operation of the cold-head. Observe through the viewport the operation of the cryo-surfaces. Upon completion of the experiment, stop the cold head, turn off the compressor and vent the system (with dry inert gas, if possible). Discussion:
When in the procedure for this experiment is it acceptable to turn off the mechanical roughing pump? Do you see any advantages to this?
What temperature did you read on the cryogenic pump's temperature gauge? What does this suggest about the operation of the pump?

Las Positas College Vacuum Technology 60A & 60B
Page 151 Rights Reserved, Biltoft, Benapfl, and Swain Fall 2002
Chapter 12: Leak Detection Not available at present

Las Positas College Vacuum Technology 60A & 60B
Page 152 Rights Reserved, Biltoft, Benapfl, and Swain Fall 2002
Chapter 13: Partial Pressure Analysis Previously several types of sub-atmospheric pressure gauge were described. All of these gauges share one common feature: they report the total gas pressure. Partial pressure analyzers, in contrast, provide more detailed information about the gases that exist in vacuum systems following evacuation (the so-called "Residual gases"). The data provided by partial pressure analyzers can be qualitative (specifying the identity of the gases present), or quantitative (giving the partial pressure of each gas). As one might expect, instruments that can identify and measure the partial pressures of individual gases that exist in a working vacuum system are somewhat more complicated than simple total pressure gauges. Partial pressure analyzers, or residual gas analyzers (RGA's) as they are commonly known, function by ionizing samples of gas from the vacuum system, separating the ions into discrete groups based upon their masses, and then counting the amount of ions in each group. The details of each of these steps will be discussed in the unit. Partial pressure analysis is a comparatively recent addition to vacuum technology. While the principles of mass spectroscopy (analysis of ionized gases on the basis of mass differences) have been known since 1918, practical application in the field of vacuum technology was not demonstrated until 1960. In his ground-breaking work, H.L. Caswell used a mass spectrometer to show the beneficial effect of viton gaskets over other elastomer seals, and also the effectiveness of Meissner coils and getter pumps. Today we can select from a wide variety of partial pressure analysis instruments which conveniently attach to standard vacuum hardware. These instruments can range from small, simple to operate and reasonably inexpensive units used to monitor specific gases in a vacuum process chamber, to large, extremely sensitive and very expensive instruments used to detect minute traces of gases. Although there exist quite a few methods by which ions may be separated, only two of these methods are used in current commercial partial pressure analyzers: magnetic field and electric field separation.
Magnetic fieldsMagnetic & Electric fieldsElectric fields
Quadrupole Monopole
Cycloidial Cyclotron Resonance
Magnetic sector
SPATIAL SEPARATION
TEMPORAL SEPARATION
Time of flight
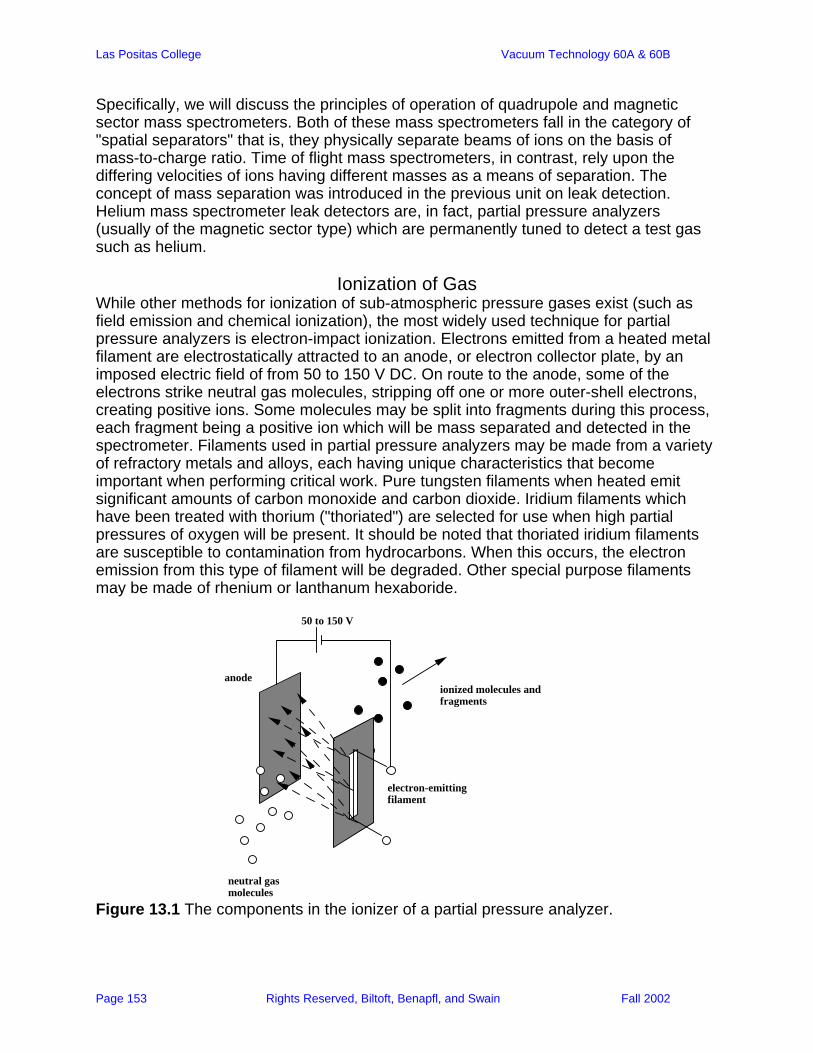
Las Positas College Vacuum Technology 60A & 60B
Page 153 Rights Reserved, Biltoft, Benapfl, and Swain Fall 2002
Specifically, we will discuss the principles of operation of quadrupole and magnetic sector mass spectrometers. Both of these mass spectrometers fall in the category of "spatial separators" that is, they physically separate beams of ions on the basis of mass-to-charge ratio. Time of flight mass spectrometers, in contrast, rely upon the differing velocities of ions having different masses as a means of separation. The concept of mass separation was introduced in the previous unit on leak detection. Helium mass spectrometer leak detectors are, in fact, partial pressure analyzers (usually of the magnetic sector type) which are permanently tuned to detect a test gas such as helium.
Ionization of Gas While other methods for ionization of sub-atmospheric pressure gases exist (such as field emission and chemical ionization), the most widely used technique for partial pressure analyzers is electron-impact ionization. Electrons emitted from a heated metal filament are electrostatically attracted to an anode, or electron collector plate, by an imposed electric field of from 50 to 150 V DC. On route to the anode, some of the electrons strike neutral gas molecules, stripping off one or more outer-shell electrons, creating positive ions. Some molecules may be split into fragments during this process, each fragment being a positive ion which will be mass separated and detected in the spectrometer. Filaments used in partial pressure analyzers may be made from a variety of refractory metals and alloys, each having unique characteristics that become important when performing critical work. Pure tungsten filaments when heated emit significant amounts of carbon monoxide and carbon dioxide. Iridium filaments which have been treated with thorium ("thoriated") are selected for use when high partial pressures of oxygen will be present. It should be noted that thoriated iridium filaments are susceptible to contamination from hydrocarbons. When this occurs, the electron emission from this type of filament will be degraded. Other special purpose filaments may be made of rhenium or lanthanum hexaboride.
neutral gas molecules
ionized molecules and fragments
anode
50 to 150 V
electron-emitting filament
Figure 13.1 The components in the ionizer of a partial pressure analyzer.
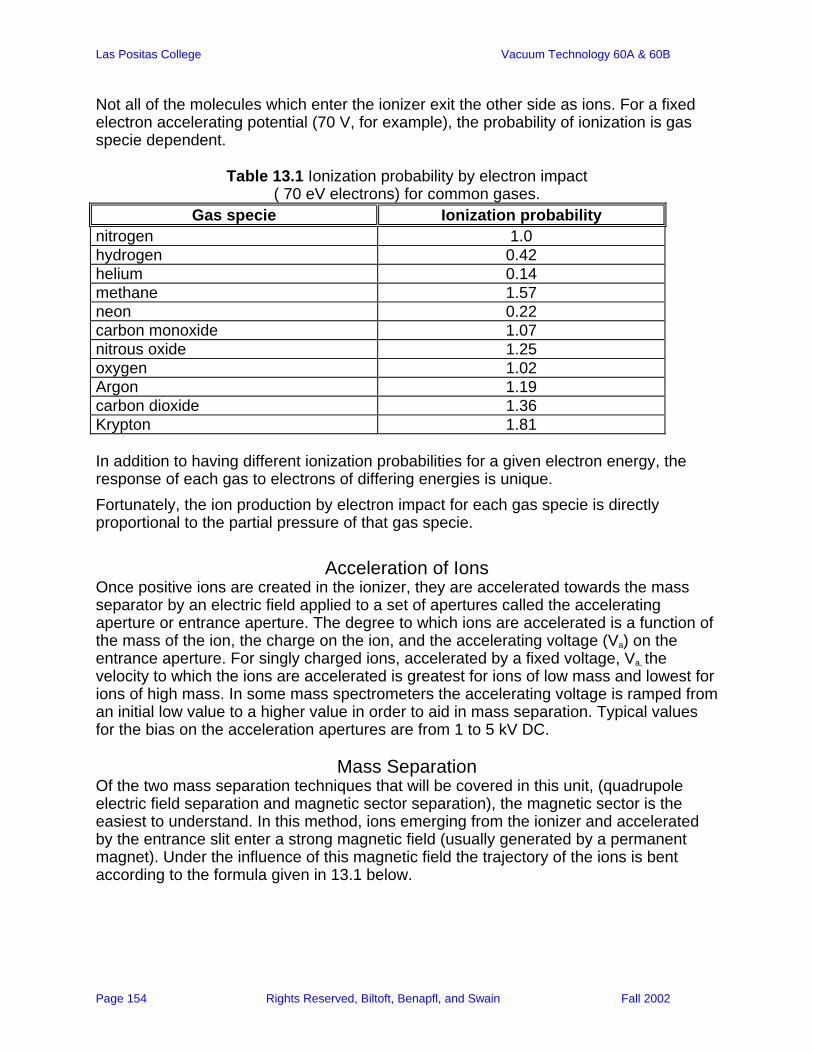
Las Positas College Vacuum Technology 60A & 60B
Page 154 Rights Reserved, Biltoft, Benapfl, and Swain Fall 2002
Not all of the molecules which enter the ionizer exit the other side as ions. For a fixed electron accelerating potential (70 V, for example), the probability of ionization is gas specie dependent.
Table 13.1 Ionization probability by electron impact ( 70 eV electrons) for common gases.
Gas specie Ionization probability nitrogen 1.0 hydrogen 0.42 helium 0.14 methane 1.57 neon 0.22 carbon monoxide 1.07 nitrous oxide 1.25 oxygen 1.02 Argon 1.19 carbon dioxide 1.36 Krypton 1.81 In addition to having different ionization probabilities for a given electron energy, the response of each gas to electrons of differing energies is unique. Fortunately, the ion production by electron impact for each gas specie is directly proportional to the partial pressure of that gas specie.
Acceleration of Ions Once positive ions are created in the ionizer, they are accelerated towards the mass separator by an electric field applied to a set of apertures called the accelerating aperture or entrance aperture. The degree to which ions are accelerated is a function of the mass of the ion, the charge on the ion, and the accelerating voltage (Va) on the entrance aperture. For singly charged ions, accelerated by a fixed voltage, Va, the velocity to which the ions are accelerated is greatest for ions of low mass and lowest for ions of high mass. In some mass spectrometers the accelerating voltage is ramped from an initial low value to a higher value in order to aid in mass separation. Typical values for the bias on the acceleration apertures are from 1 to 5 kV DC.
Mass Separation Of the two mass separation techniques that will be covered in this unit, (quadrupole electric field separation and magnetic sector separation), the magnetic sector is the easiest to understand. In this method, ions emerging from the ionizer and accelerated by the entrance slit enter a strong magnetic field (usually generated by a permanent magnet). Under the influence of this magnetic field the trajectory of the ions is bent according to the formula given in 13.1 below.
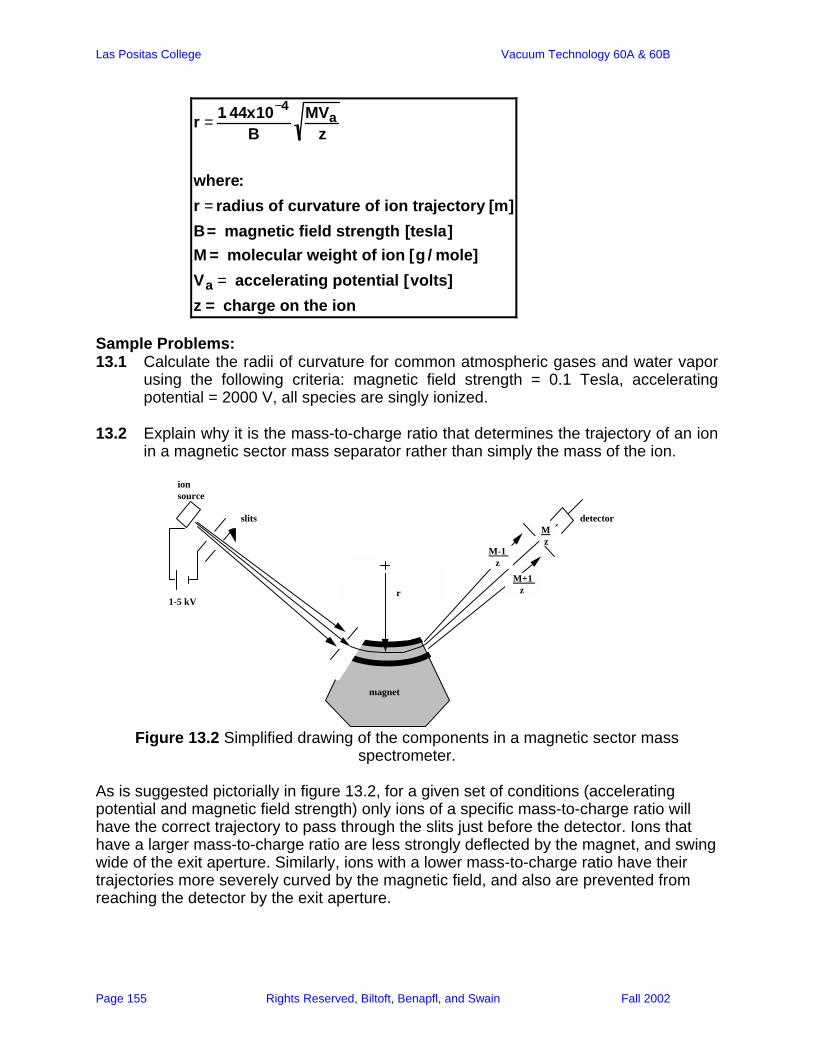
Las Positas College Vacuum Technology 60A & 60B
Page 155 Rights Reserved, Biltoft, Benapfl, and Swain Fall 2002
r = 1. 44x10−4
BMVa
z
where:r = radius of curvature of ion trajectory [m]B= magnetic field strength [tesla]M = molecular weight of ion [g / mole]Va = accelerating potential [volts]z = charge on the ion
Sample Problems: 13.1 Calculate the radii of curvature for common atmospheric gases and water vapor
using the following criteria: magnetic field strength = 0.1 Tesla, accelerating potential = 2000 V, all species are singly ionized.
13.2 Explain why it is the mass-to-charge ratio that determines the trajectory of an ion
in a magnetic sector mass separator rather than simply the mass of the ion.
magnet
M-1 z
M z
M+1 z
ion source
slits
1-5 kV
detector
r
Figure 13.2 Simplified drawing of the components in a magnetic sector mass
spectrometer. As is suggested pictorially in figure 13.2, for a given set of conditions (accelerating potential and magnetic field strength) only ions of a specific mass-to-charge ratio will have the correct trajectory to pass through the slits just before the detector. Ions that have a larger mass-to-charge ratio are less strongly deflected by the magnet, and swing wide of the exit aperture. Similarly, ions with a lower mass-to-charge ratio have their trajectories more severely curved by the magnetic field, and also are prevented from reaching the detector by the exit aperture.
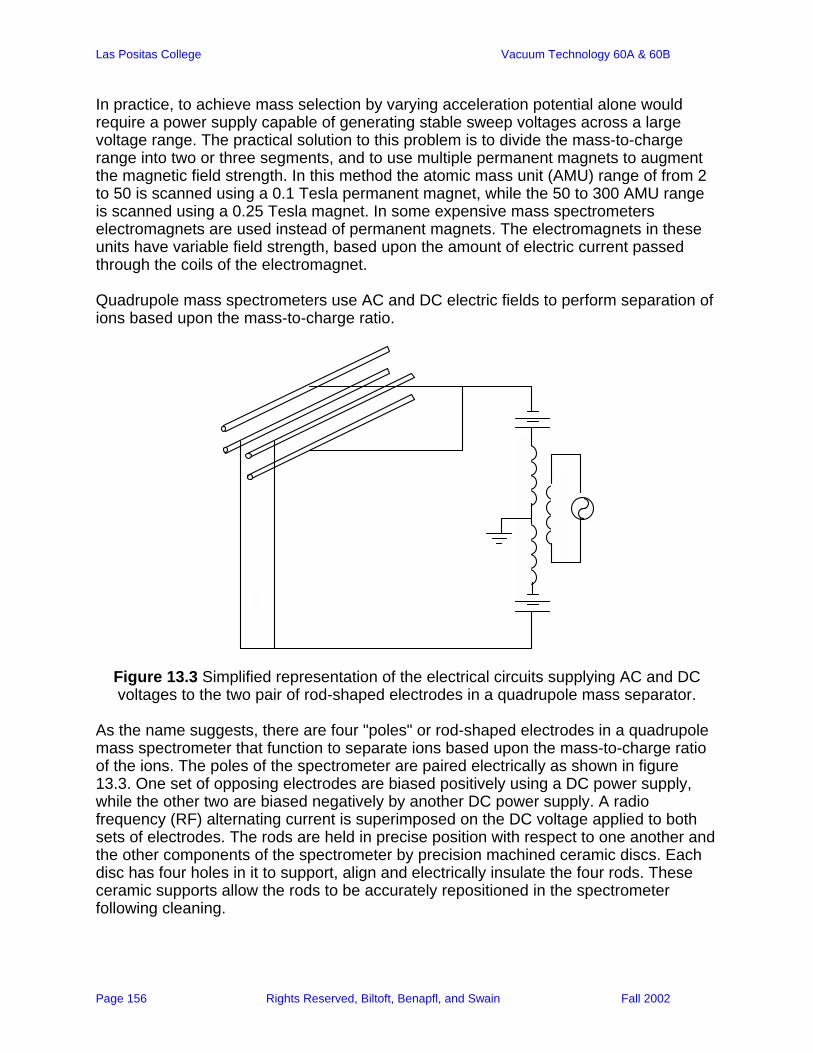
Las Positas College Vacuum Technology 60A & 60B
Page 156 Rights Reserved, Biltoft, Benapfl, and Swain Fall 2002
In practice, to achieve mass selection by varying acceleration potential alone would require a power supply capable of generating stable sweep voltages across a large voltage range. The practical solution to this problem is to divide the mass-to-charge range into two or three segments, and to use multiple permanent magnets to augment the magnetic field strength. In this method the atomic mass unit (AMU) range of from 2 to 50 is scanned using a 0.1 Tesla permanent magnet, while the 50 to 300 AMU range is scanned using a 0.25 Tesla magnet. In some expensive mass spectrometers electromagnets are used instead of permanent magnets. The electromagnets in these units have variable field strength, based upon the amount of electric current passed through the coils of the electromagnet. Quadrupole mass spectrometers use AC and DC electric fields to perform separation of ions based upon the mass-to-charge ratio.
Figure 13.3 Simplified representation of the electrical circuits supplying AC and DC voltages to the two pair of rod-shaped electrodes in a quadrupole mass separator.
As the name suggests, there are four "poles" or rod-shaped electrodes in a quadrupole mass spectrometer that function to separate ions based upon the mass-to-charge ratio of the ions. The poles of the spectrometer are paired electrically as shown in figure 13.3. One set of opposing electrodes are biased positively using a DC power supply, while the other two are biased negatively by another DC power supply. A radio frequency (RF) alternating current is superimposed on the DC voltage applied to both sets of electrodes. The rods are held in precise position with respect to one another and the other components of the spectrometer by precision machined ceramic discs. Each disc has four holes in it to support, align and electrically insulate the four rods. These ceramic supports allow the rods to be accurately repositioned in the spectrometer following cleaning.
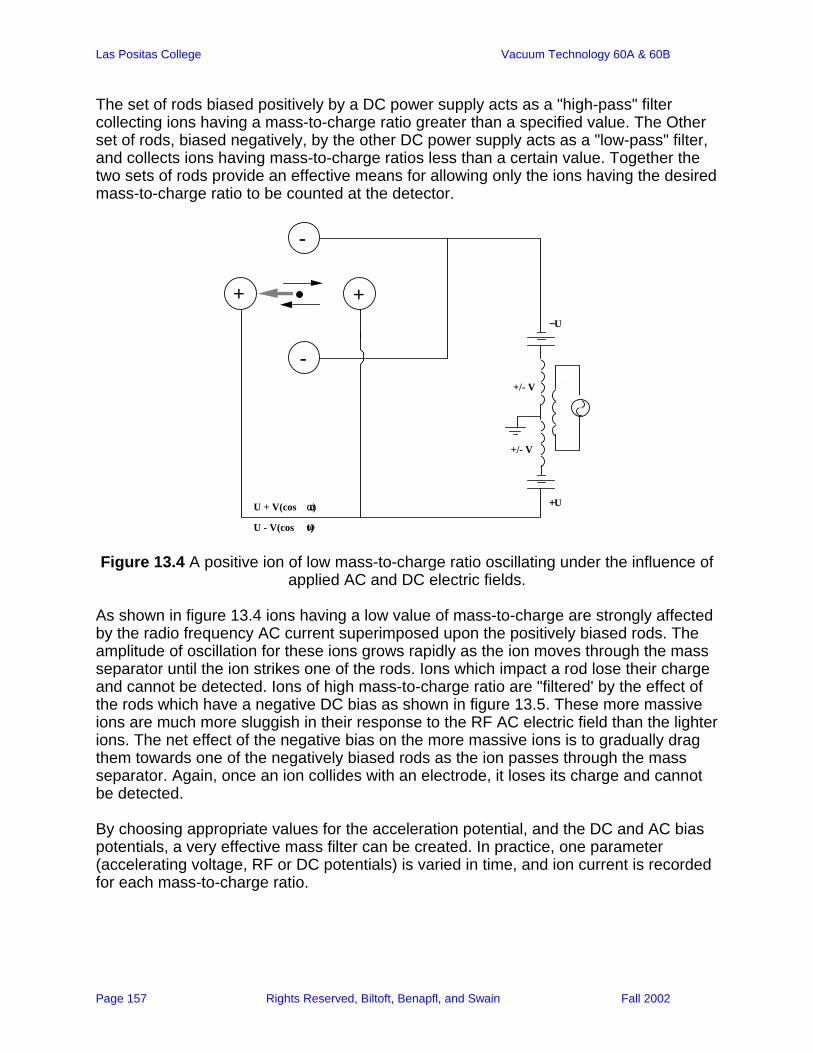
Las Positas College Vacuum Technology 60A & 60B
Page 157 Rights Reserved, Biltoft, Benapfl, and Swain Fall 2002
The set of rods biased positively by a DC power supply acts as a "high-pass" filter collecting ions having a mass-to-charge ratio greater than a specified value. The Other set of rods, biased negatively, by the other DC power supply acts as a "low-pass" filter, and collects ions having mass-to-charge ratios less than a certain value. Together the two sets of rods provide an effective means for allowing only the ions having the desired mass-to-charge ratio to be counted at the detector.
+ +
-
-
U + V(cos t)ω
U - V(cos t)ω
−U
+U
+/- V
+/- V
Figure 13.4 A positive ion of low mass-to-charge ratio oscillating under the influence of applied AC and DC electric fields.
As shown in figure 13.4 ions having a low value of mass-to-charge are strongly affected by the radio frequency AC current superimposed upon the positively biased rods. The amplitude of oscillation for these ions grows rapidly as the ion moves through the mass separator until the ion strikes one of the rods. Ions which impact a rod lose their charge and cannot be detected. Ions of high mass-to-charge ratio are "filtered' by the effect of the rods which have a negative DC bias as shown in figure 13.5. These more massive ions are much more sluggish in their response to the RF AC electric field than the lighter ions. The net effect of the negative bias on the more massive ions is to gradually drag them towards one of the negatively biased rods as the ion passes through the mass separator. Again, once an ion collides with an electrode, it loses its charge and cannot be detected. By choosing appropriate values for the acceleration potential, and the DC and AC bias potentials, a very effective mass filter can be created. In practice, one parameter (accelerating voltage, RF or DC potentials) is varied in time, and ion current is recorded for each mass-to-charge ratio.

Las Positas College Vacuum Technology 60A & 60B
Page 158 Rights Reserved, Biltoft, Benapfl, and Swain Fall 2002
+ +
-
-
U + V(cos t)ω
U - V(cos t)ω
−U
+U
+/- V
+/- V
Figure 13.5 A positive ion of high mass-to-charge ratio oscillating under the influence of applied AC and DC electric fields is strongly attracted to the rods having a negativeDC bias.
Detection of Ions For either type of mass separator (magnetic sector or quadrupole) the ions which are not "selected out" impact the ion detector, where they generate an electrical signal. This signal is amplified electronically and sent on to pulse counting circuitry, and finally emerges as intensity (ion current) versus mass-to-charge ratio. Several types of ion detectors are used in commercial mass spectrometers. Simple, inexpensive units often employ a Faraday cup, while the more sensitive, higher-end units use either a Faraday cup/secondary electron multiplier combination or a channel electron multiplier. The sensitivity of ion detectors is typically specified in terms of electrical current per pressure, such as amps/Torr. Values for the sensitivity of detectors can range from 4 x 10⁻⁶ to 1.0 x 10⁻⁵ Amp/Torr, assuming nitrogen ions. For an operational pressure range of from 10-2 to 10-12 Torr, the current range that a typical detector must be able to register is from 10-6 to 10-17 amps.
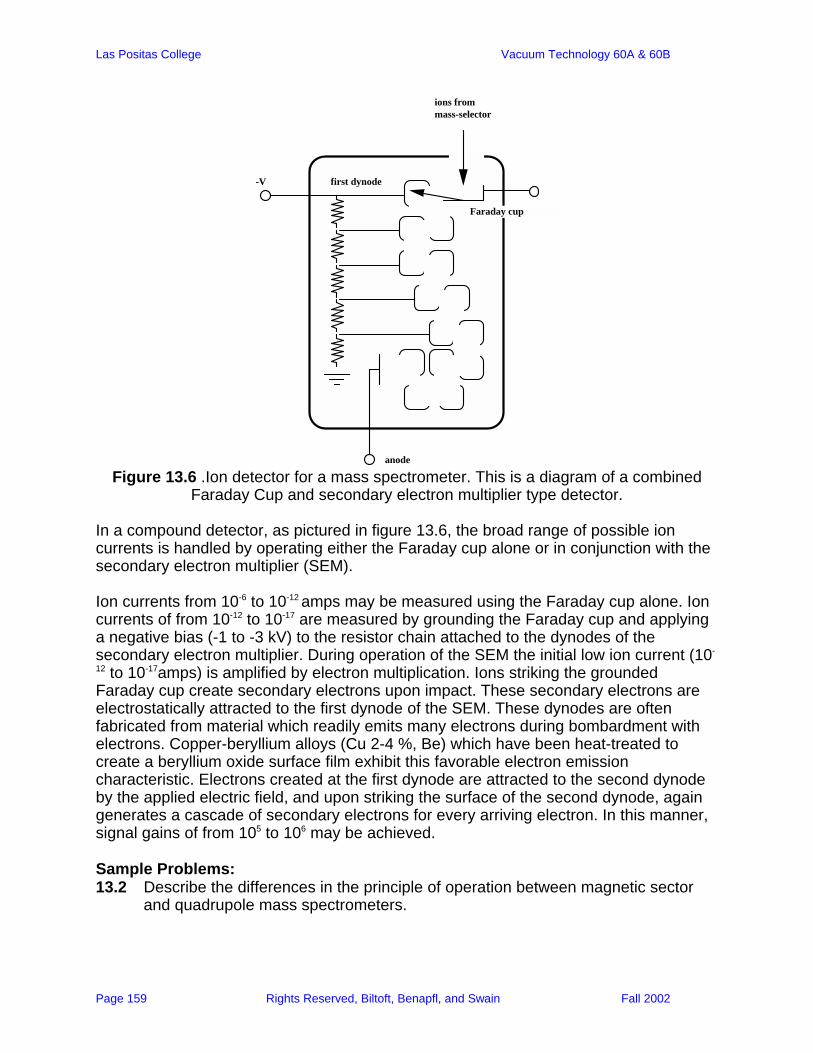
Las Positas College Vacuum Technology 60A & 60B
Page 159 Rights Reserved, Biltoft, Benapfl, and Swain Fall 2002
anode
first dynode-V
Faraday cup
ions from mass-selector
Figure 13.6 .Ion detector for a mass spectrometer. This is a diagram of a combined
Faraday Cup and secondary electron multiplier type detector. In a compound detector, as pictured in figure 13.6, the broad range of possible ion currents is handled by operating either the Faraday cup alone or in conjunction with the secondary electron multiplier (SEM). Ion currents from 10-6 to 10-12 amps may be measured using the Faraday cup alone. Ion currents of from 10-12 to 10-17 are measured by grounding the Faraday cup and applying a negative bias (-1 to -3 kV) to the resistor chain attached to the dynodes of the secondary electron multiplier. During operation of the SEM the initial low ion current (10-
12 to 10-17amps) is amplified by electron multiplication. Ions striking the grounded Faraday cup create secondary electrons upon impact. These secondary electrons are electrostatically attracted to the first dynode of the SEM. These dynodes are often fabricated from material which readily emits many electrons during bombardment with electrons. Copper-beryllium alloys (Cu 2-4 %, Be) which have been heat-treated to create a beryllium oxide surface film exhibit this favorable electron emission characteristic. Electrons created at the first dynode are attracted to the second dynode by the applied electric field, and upon striking the surface of the second dynode, again generates a cascade of secondary electrons for every arriving electron. In this manner, signal gains of from 105 to 106 may be achieved. Sample Problems: 13.2 Describe the differences in the principle of operation between magnetic sector
and quadrupole mass spectrometers.
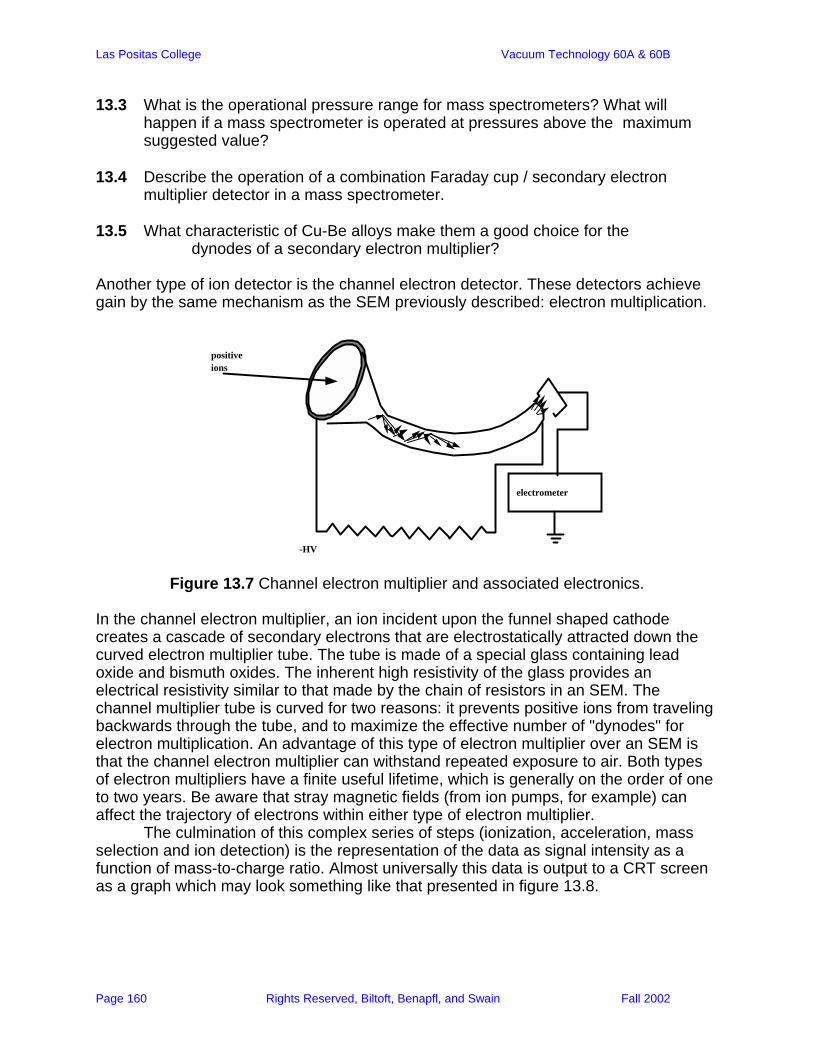
Las Positas College Vacuum Technology 60A & 60B
Page 160 Rights Reserved, Biltoft, Benapfl, and Swain Fall 2002
13.3 What is the operational pressure range for mass spectrometers? What will happen if a mass spectrometer is operated at pressures above the maximum suggested value?
13.4 Describe the operation of a combination Faraday cup / secondary electron
multiplier detector in a mass spectrometer. 13.5 What characteristic of Cu-Be alloys make them a good choice for the
dynodes of a secondary electron multiplier? Another type of ion detector is the channel electron detector. These detectors achieve gain by the same mechanism as the SEM previously described: electron multiplication.
electrometer
-HV
positive ions
Figure 13.7 Channel electron multiplier and associated electronics. In the channel electron multiplier, an ion incident upon the funnel shaped cathode creates a cascade of secondary electrons that are electrostatically attracted down the curved electron multiplier tube. The tube is made of a special glass containing lead oxide and bismuth oxides. The inherent high resistivity of the glass provides an electrical resistivity similar to that made by the chain of resistors in an SEM. The channel multiplier tube is curved for two reasons: it prevents positive ions from traveling backwards through the tube, and to maximize the effective number of "dynodes" for electron multiplication. An advantage of this type of electron multiplier over an SEM is that the channel electron multiplier can withstand repeated exposure to air. Both types of electron multipliers have a finite useful lifetime, which is generally on the order of one to two years. Be aware that stray magnetic fields (from ion pumps, for example) can affect the trajectory of electrons within either type of electron multiplier. The culmination of this complex series of steps (ionization, acceleration, mass selection and ion detection) is the representation of the data as signal intensity as a function of mass-to-charge ratio. Almost universally this data is output to a CRT screen as a graph which may look something like that presented in figure 13.8.
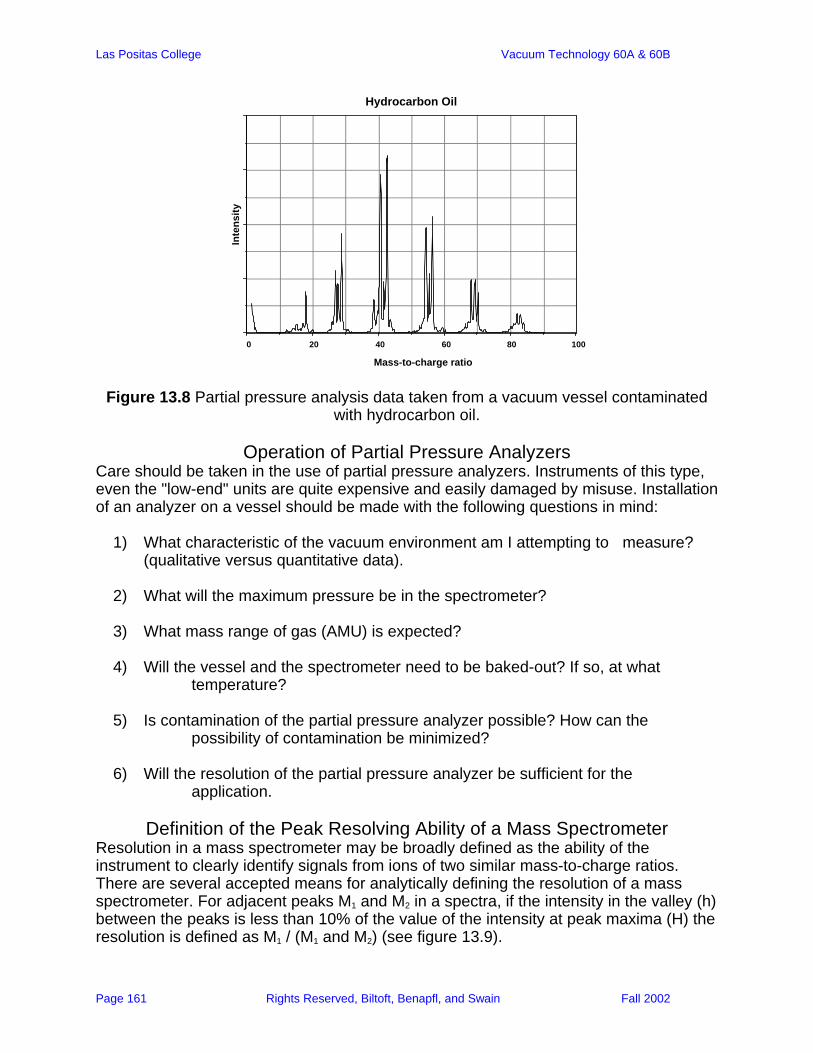
Las Positas College Vacuum Technology 60A & 60B
Page 161 Rights Reserved, Biltoft, Benapfl, and Swain Fall 2002
100806040200
Hydrocarbon Oil
Mass-to-charge ratio
Inte
nsity
Figure 13.8 Partial pressure analysis data taken from a vacuum vessel contaminated with hydrocarbon oil.
Operation of Partial Pressure Analyzers
Care should be taken in the use of partial pressure analyzers. Instruments of this type, even the "low-end" units are quite expensive and easily damaged by misuse. Installation of an analyzer on a vessel should be made with the following questions in mind:
1) What characteristic of the vacuum environment am I attempting to measure? (qualitative versus quantitative data).
2) What will the maximum pressure be in the spectrometer? 3) What mass range of gas (AMU) is expected? 4) Will the vessel and the spectrometer need to be baked-out? If so, at what
temperature? 5) Is contamination of the partial pressure analyzer possible? How can the
possibility of contamination be minimized? 6) Will the resolution of the partial pressure analyzer be sufficient for the
application.
Definition of the Peak Resolving Ability of a Mass Spectrometer Resolution in a mass spectrometer may be broadly defined as the ability of the instrument to clearly identify signals from ions of two similar mass-to-charge ratios. There are several accepted means for analytically defining the resolution of a mass spectrometer. For adjacent peaks M1 and M2 in a spectra, if the intensity in the valley (h) between the peaks is less than 10% of the value of the intensity at peak maxima (H) the resolution is defined as M1 / (M1 and M2) (see figure 13.9).
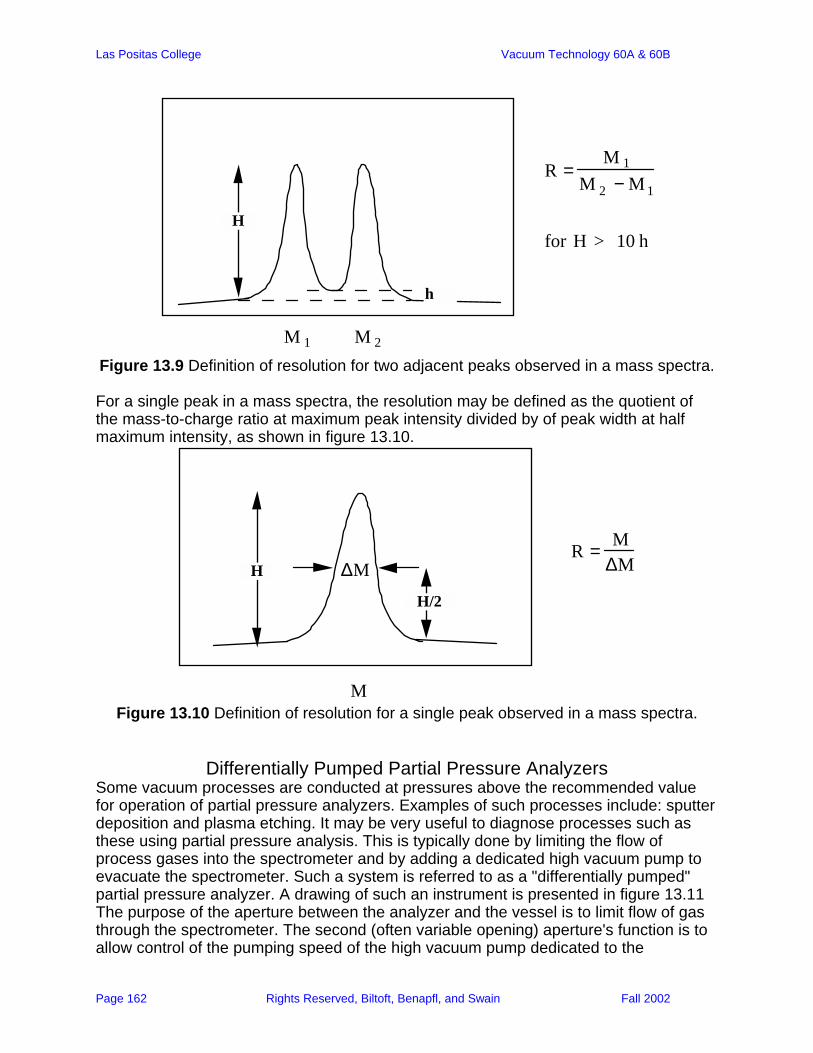
Las Positas College Vacuum Technology 60A & 60B
Page 162 Rights Reserved, Biltoft, Benapfl, and Swain Fall 2002
H
h
R =M 1
M 2 − M 1
for H > 10 h
M 1 M 2 Figure 13.9 Definition of resolution for two adjacent peaks observed in a mass spectra. For a single peak in a mass spectra, the resolution may be defined as the quotient of the mass-to-charge ratio at maximum peak intensity divided by of peak width at half maximum intensity, as shown in figure 13.10.
H
M
∆MH/2
R = M
∆M
Figure 13.10 Definition of resolution for a single peak observed in a mass spectra.
Differentially Pumped Partial Pressure Analyzers Some vacuum processes are conducted at pressures above the recommended value for operation of partial pressure analyzers. Examples of such processes include: sputter deposition and plasma etching. It may be very useful to diagnose processes such as these using partial pressure analysis. This is typically done by limiting the flow of process gases into the spectrometer and by adding a dedicated high vacuum pump to evacuate the spectrometer. Such a system is referred to as a "differentially pumped" partial pressure analyzer. A drawing of such an instrument is presented in figure 13.11 The purpose of the aperture between the analyzer and the vessel is to limit flow of gas through the spectrometer. The second (often variable opening) aperture's function is to allow control of the pumping speed of the high vacuum pump dedicated to the
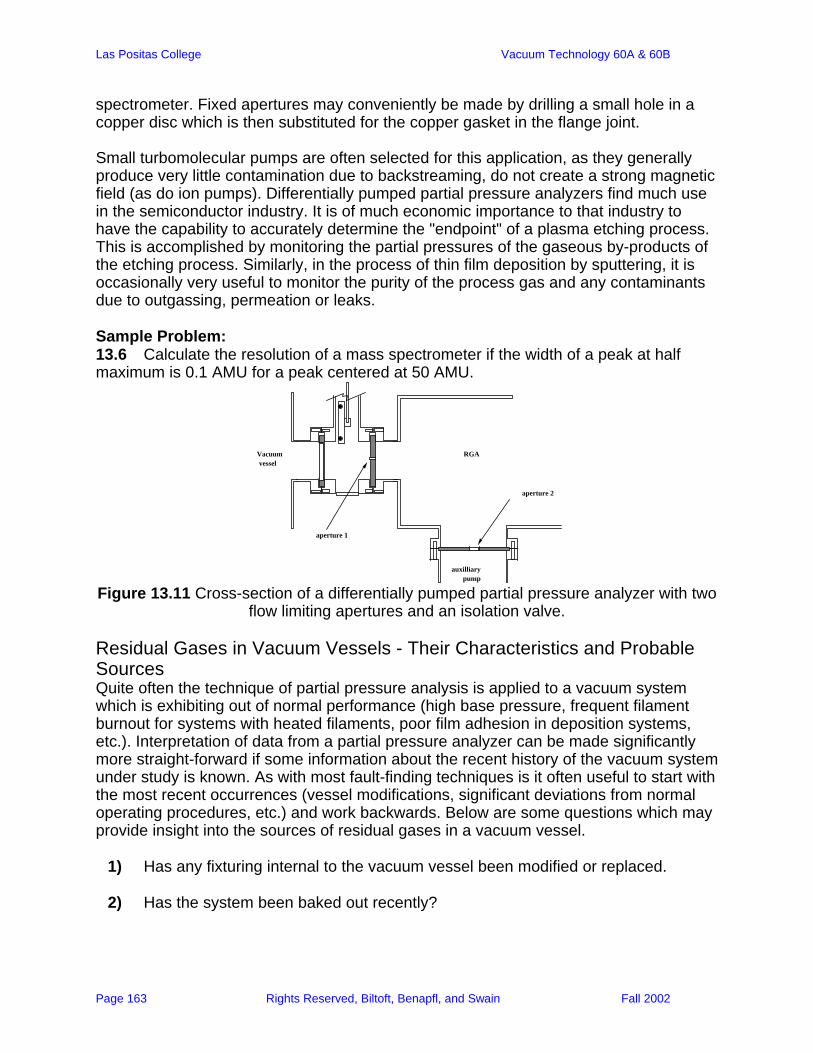
Las Positas College Vacuum Technology 60A & 60B
Page 163 Rights Reserved, Biltoft, Benapfl, and Swain Fall 2002
spectrometer. Fixed apertures may conveniently be made by drilling a small hole in a copper disc which is then substituted for the copper gasket in the flange joint. Small turbomolecular pumps are often selected for this application, as they generally produce very little contamination due to backstreaming, do not create a strong magnetic field (as do ion pumps). Differentially pumped partial pressure analyzers find much use in the semiconductor industry. It is of much economic importance to that industry to have the capability to accurately determine the "endpoint" of a plasma etching process. This is accomplished by monitoring the partial pressures of the gaseous by-products of the etching process. Similarly, in the process of thin film deposition by sputtering, it is occasionally very useful to monitor the purity of the process gas and any contaminants due to outgassing, permeation or leaks. Sample Problem: 13.6 Calculate the resolution of a mass spectrometer if the width of a peak at half maximum is 0.1 AMU for a peak centered at 50 AMU.
auxilliary pump
RGAVacuum vessel
aperture 1
aperture 2
Figure 13.11 Cross-section of a differentially pumped partial pressure analyzer with two
flow limiting apertures and an isolation valve. Residual Gases in Vacuum Vessels - Their Characteristics and Probable Sources Quite often the technique of partial pressure analysis is applied to a vacuum system which is exhibiting out of normal performance (high base pressure, frequent filament burnout for systems with heated filaments, poor film adhesion in deposition systems, etc.). Interpretation of data from a partial pressure analyzer can be made significantly more straight-forward if some information about the recent history of the vacuum system under study is known. As with most fault-finding techniques is it often useful to start with the most recent occurrences (vessel modifications, significant deviations from normal operating procedures, etc.) and work backwards. Below are some questions which may provide insight into the sources of residual gases in a vacuum vessel.
1) Has any fixturing internal to the vacuum vessel been modified or replaced. 2) Has the system been baked out recently?
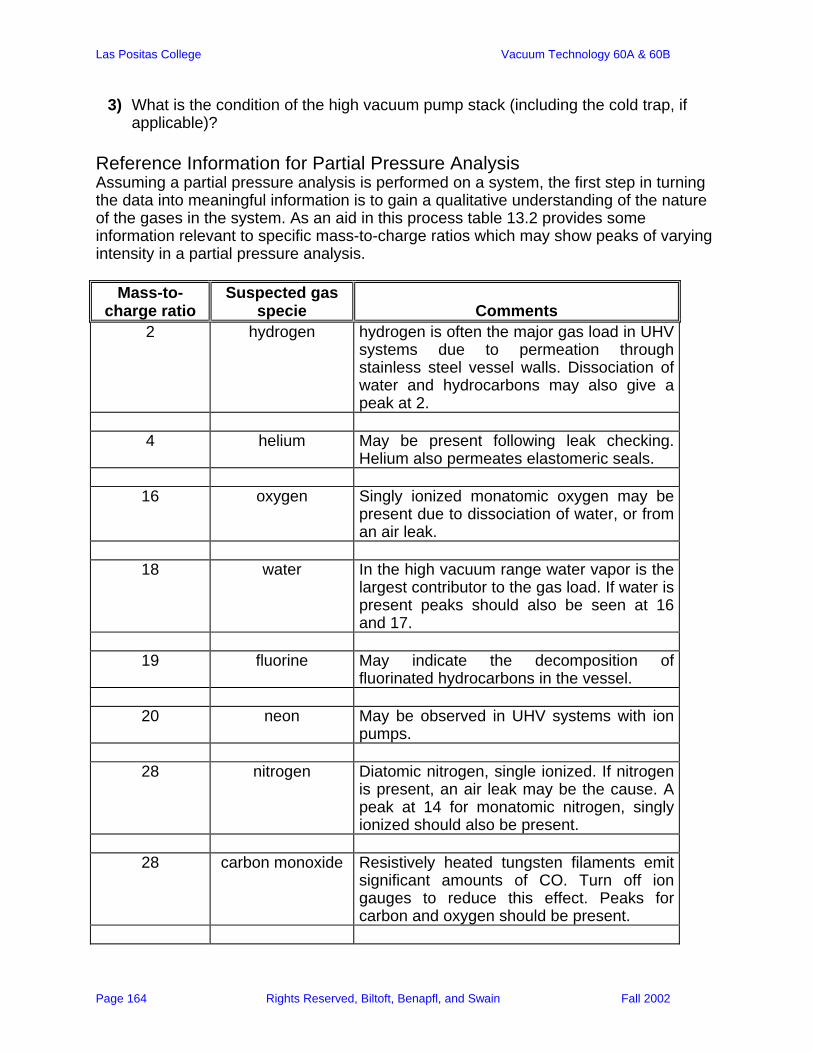
Las Positas College Vacuum Technology 60A & 60B
Page 164 Rights Reserved, Biltoft, Benapfl, and Swain Fall 2002
3) What is the condition of the high vacuum pump stack (including the cold trap, if applicable)?
Reference Information for Partial Pressure Analysis Assuming a partial pressure analysis is performed on a system, the first step in turning the data into meaningful information is to gain a qualitative understanding of the nature of the gases in the system. As an aid in this process table 13.2 provides some information relevant to specific mass-to-charge ratios which may show peaks of varying intensity in a partial pressure analysis.
Mass-to-charge ratio
Suspected gas specie
Comments
2 hydrogen hydrogen is often the major gas load in UHV systems due to permeation through stainless steel vessel walls. Dissociation of water and hydrocarbons may also give a peak at 2.
4 helium May be present following leak checking.
Helium also permeates elastomeric seals.
16 oxygen Singly ionized monatomic oxygen may be present due to dissociation of water, or from an air leak.
18 water In the high vacuum range water vapor is the
largest contributor to the gas load. If water is present peaks should also be seen at 16 and 17.
19 fluorine May indicate the decomposition of
fluorinated hydrocarbons in the vessel.
20 neon May be observed in UHV systems with ion pumps.
28 nitrogen Diatomic nitrogen, single ionized. If nitrogen
is present, an air leak may be the cause. A peak at 14 for monatomic nitrogen, singly ionized should also be present.
28 carbon monoxide Resistively heated tungsten filaments emit
significant amounts of CO. Turn off ion gauges to reduce this effect. Peaks for carbon and oxygen should be present.
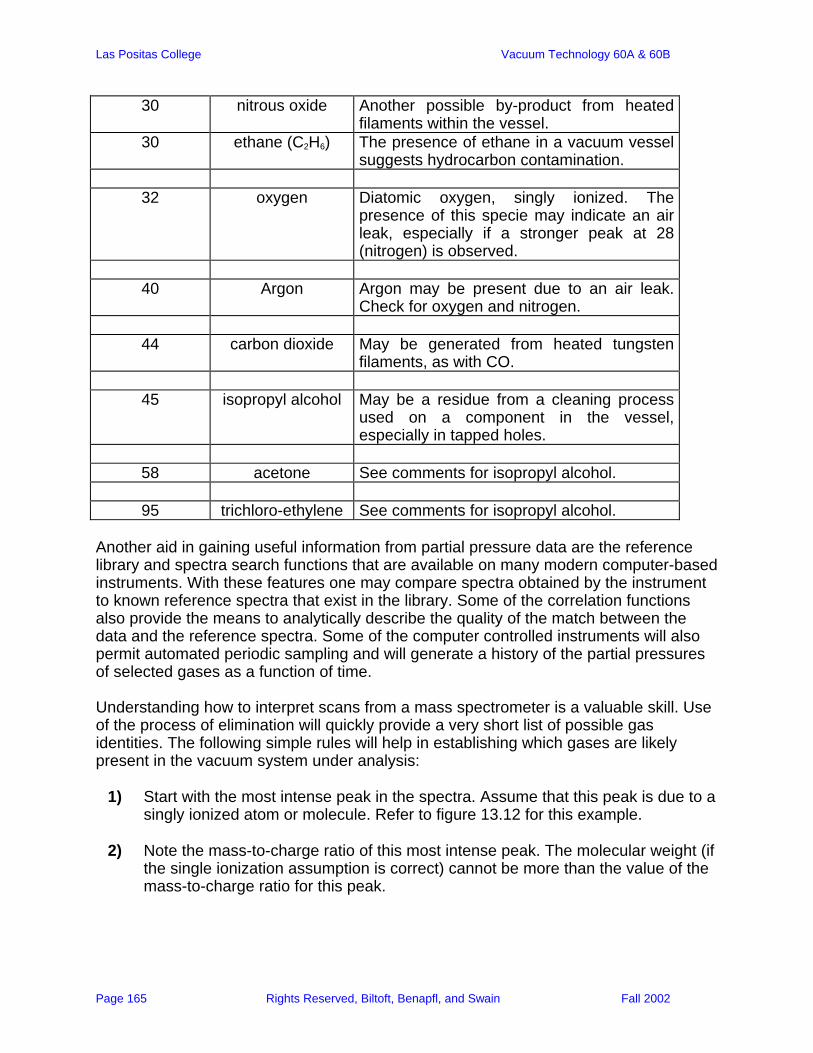
Las Positas College Vacuum Technology 60A & 60B
Page 165 Rights Reserved, Biltoft, Benapfl, and Swain Fall 2002
30 nitrous oxide Another possible by-product from heated filaments within the vessel.
30 ethane (C2H6) The presence of ethane in a vacuum vessel suggests hydrocarbon contamination.
32 oxygen Diatomic oxygen, singly ionized. The
presence of this specie may indicate an air leak, especially if a stronger peak at 28 (nitrogen) is observed.
40 Argon Argon may be present due to an air leak.
Check for oxygen and nitrogen.
44 carbon dioxide May be generated from heated tungsten filaments, as with CO.
45 isopropyl alcohol May be a residue from a cleaning process
used on a component in the vessel, especially in tapped holes.
58 acetone See comments for isopropyl alcohol.
95 trichloro-ethylene See comments for isopropyl alcohol.
Another aid in gaining useful information from partial pressure data are the reference library and spectra search functions that are available on many modern computer-based instruments. With these features one may compare spectra obtained by the instrument to known reference spectra that exist in the library. Some of the correlation functions also provide the means to analytically describe the quality of the match between the data and the reference spectra. Some of the computer controlled instruments will also permit automated periodic sampling and will generate a history of the partial pressures of selected gases as a function of time. Understanding how to interpret scans from a mass spectrometer is a valuable skill. Use of the process of elimination will quickly provide a very short list of possible gas identities. The following simple rules will help in establishing which gases are likely present in the vacuum system under analysis:
1) Start with the most intense peak in the spectra. Assume that this peak is due to a singly ionized atom or molecule. Refer to figure 13.12 for this example.
2) Note the mass-to-charge ratio of this most intense peak. The molecular weight (if
the single ionization assumption is correct) cannot be more than the value of the mass-to-charge ratio for this peak.
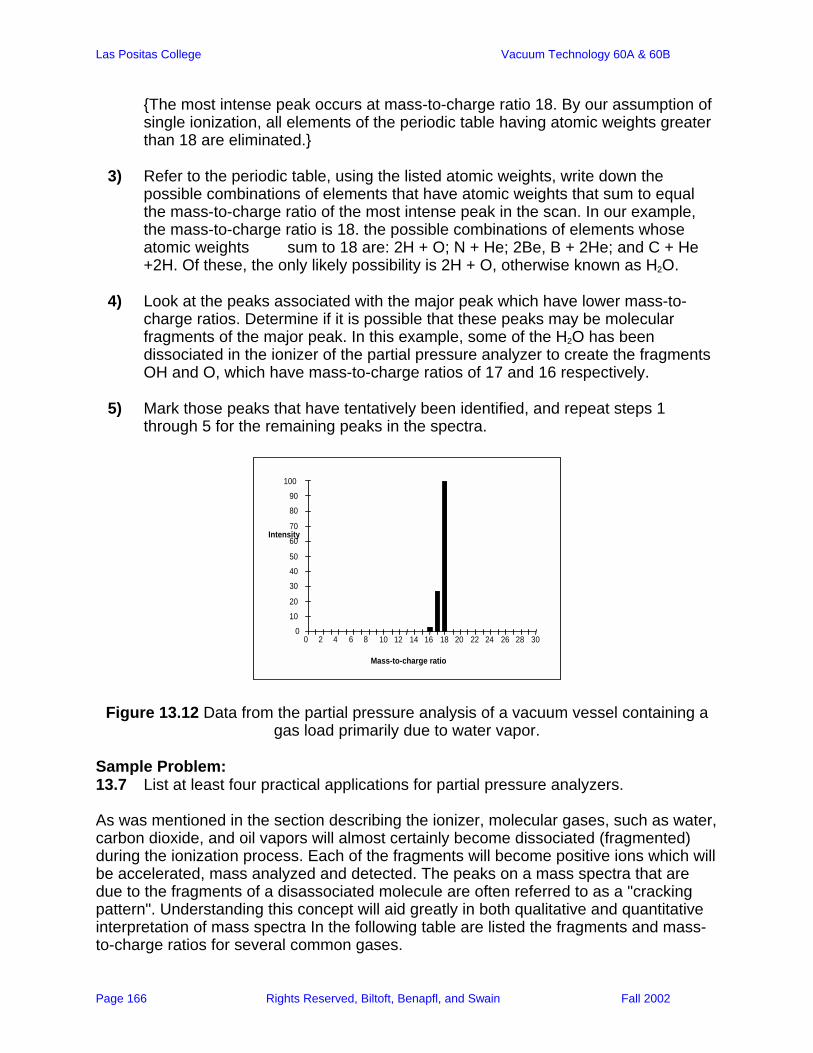
Las Positas College Vacuum Technology 60A & 60B
Page 166 Rights Reserved, Biltoft, Benapfl, and Swain Fall 2002
The most intense peak occurs at mass-to-charge ratio 18. By our assumption of single ionization, all elements of the periodic table having atomic weights greater than 18 are eliminated.
3) Refer to the periodic table, using the listed atomic weights, write down the
possible combinations of elements that have atomic weights that sum to equal the mass-to-charge ratio of the most intense peak in the scan. In our example, the mass-to-charge ratio is 18. the possible combinations of elements whose atomic weights sum to 18 are: 2H + O; N + He; 2Be, B + 2He; and C + He +2H. Of these, the only likely possibility is 2H + O, otherwise known as H2O.
4) Look at the peaks associated with the major peak which have lower mass-to-
charge ratios. Determine if it is possible that these peaks may be molecular fragments of the major peak. In this example, some of the H2O has been dissociated in the ionizer of the partial pressure analyzer to create the fragments OH and O, which have mass-to-charge ratios of 17 and 16 respectively.
5) Mark those peaks that have tentatively been identified, and repeat steps 1
through 5 for the remaining peaks in the spectra.
Mass-to-charge ratio
Intensity
0 10 20 30 40 50 60 70 80 90
100
0 2 4 6 8 10 12 14 16 18 20 22 24 26 28 30
Figure 13.12 Data from the partial pressure analysis of a vacuum vessel containing a gas load primarily due to water vapor.
Sample Problem: 13.7 List at least four practical applications for partial pressure analyzers. As was mentioned in the section describing the ionizer, molecular gases, such as water, carbon dioxide, and oil vapors will almost certainly become dissociated (fragmented) during the ionization process. Each of the fragments will become positive ions which will be accelerated, mass analyzed and detected. The peaks on a mass spectra that are due to the fragments of a disassociated molecule are often referred to as a "cracking pattern". Understanding this concept will aid greatly in both qualitative and quantitative interpretation of mass spectra In the following table are listed the fragments and mass-to-charge ratios for several common gases.
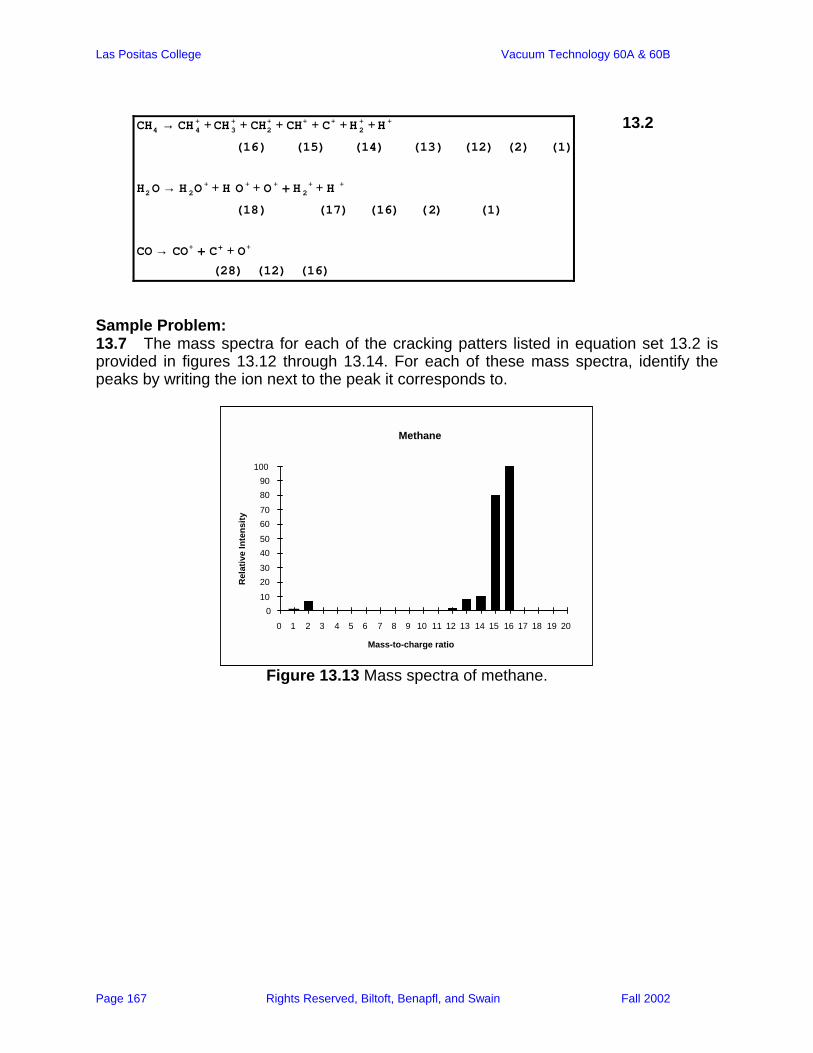
Las Positas College Vacuum Technology 60A & 60B
Page 167 Rights Reserved, Biltoft, Benapfl, and Swain Fall 2002
CH4 → CH4+ +CH3
+ + CH2+ + CH+ + C+ +H 2
+ +H +
(16) (15) (14) (13) (12) (2) (1)
H2O → H 2O+ + H O + + O + + H 2
+ + H +
(18) (17) (16) (2) (1)
CO → CO+ + C+ + O+
(28) (12) (16)
13.2
Sample Problem: 13.7 The mass spectra for each of the cracking patters listed in equation set 13.2 is provided in figures 13.12 through 13.14. For each of these mass spectra, identify the peaks by writing the ion next to the peak it corresponds to.
Methane
Mass-to-charge ratio
Rel
ativ
e In
tens
ity
010
2030
4050
6070
8090
100
0 1 2 3 4 5 6 7 8 9 10 11 12 13 14 15 16 17 18 19 20
Figure 13.13 Mass spectra of methane.

Las Positas College Vacuum Technology 60A & 60B
Page 168 Rights Reserved, Biltoft, Benapfl, and Swain Fall 2002
Carbon Monoxide
Mass-to-charge ratio
Rel
ativ
e In
tens
ity
0
1020
30
4050
60
7080
90
100
0 2 4 6 8
10 12 14 16 18 20 22 24 26 28 30
Figure 13.14 Mass spectra of carbon monoxide.
Further complication in the mass spectra is due to multiple ionization of gas species.
H 2O →
H 2O+ + H O+ + O+ + H2
+ + H + + H2O+ + + H O+ + + O ++
(18) (17) (16) (2) (1) (9) (8.5) (8)
CO → CO+ + C+ + O+ + CO++ + O+ + + C+ +
(28) (12) (16) (14) (8) (6)
High resolution mass spectrometers can also discriminate between the isotopes of gas species. An isotope of an element has a different number of neutrons in its nucleus than other isotopes of the same element. This difference in nuclear structure creates a slightly different atomic weight. This effect can be seen in the mass spectra of the noble gas, Argon(see equation 13.3, and figure 13.15)
Ar →40Ar + +38 Ar+ +36 Ar+ +40 Ar ++ +38 Ar + + +36 Ar+ +
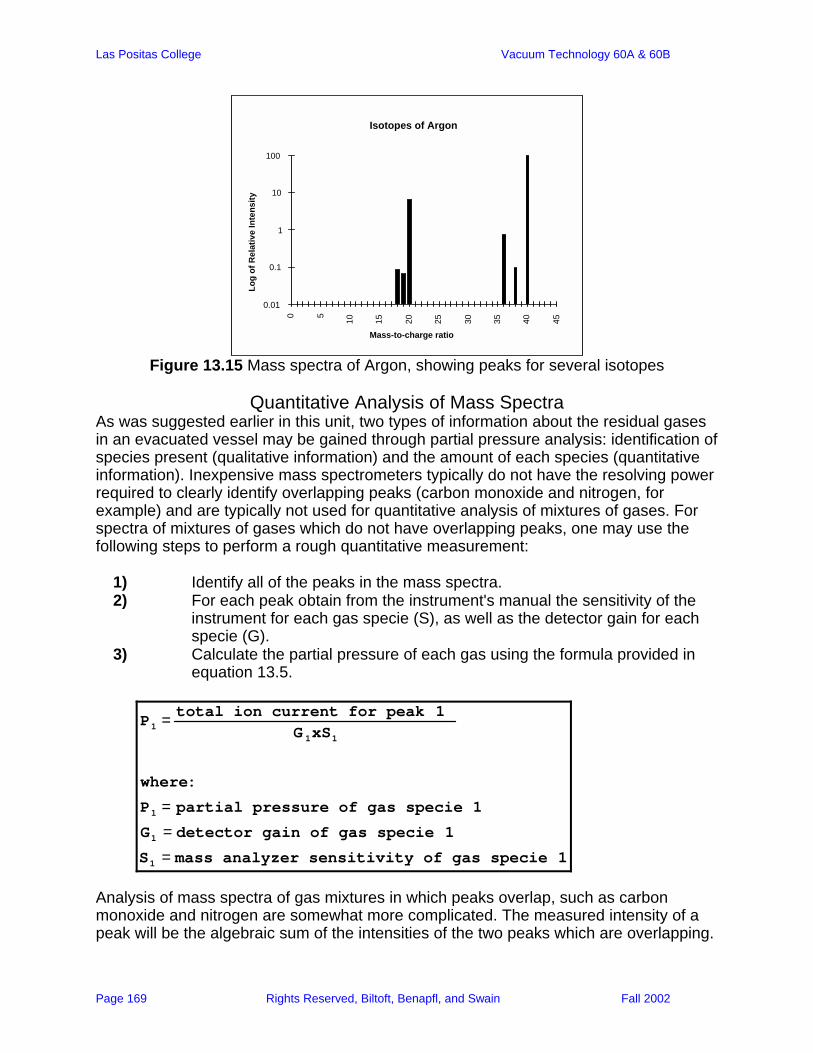
Las Positas College Vacuum Technology 60A & 60B
Page 169 Rights Reserved, Biltoft, Benapfl, and Swain Fall 2002
Isotopes of Argon
Mass-to-charge ratio
Log
of R
elat
ive
Inte
nsity
0.01
0.1
1
10
100
0 5
10 15 20 25 30 35 40 45
Figure 13.15 Mass spectra of Argon, showing peaks for several isotopes
Quantitative Analysis of Mass Spectra
As was suggested earlier in this unit, two types of information about the residual gases in an evacuated vessel may be gained through partial pressure analysis: identification of species present (qualitative information) and the amount of each species (quantitative information). Inexpensive mass spectrometers typically do not have the resolving power required to clearly identify overlapping peaks (carbon monoxide and nitrogen, for example) and are typically not used for quantitative analysis of mixtures of gases. For spectra of mixtures of gases which do not have overlapping peaks, one may use the following steps to perform a rough quantitative measurement:
1) Identify all of the peaks in the mass spectra. 2) For each peak obtain from the instrument's manual the sensitivity of the
instrument for each gas specie (S), as well as the detector gain for each specie (G).
3) Calculate the partial pressure of each gas using the formula provided in equation 13.5.
P1 = total ion current for peak 1
G 1xS1
where:
P1 = partial pressure of gas specie 1
G1 = detector gain of gas specie 1
S1 = mass analyzer sensitivity of gas specie 1
Analysis of mass spectra of gas mixtures in which peaks overlap, such as carbon monoxide and nitrogen are somewhat more complicated. The measured intensity of a peak will be the algebraic sum of the intensities of the two peaks which are overlapping.
Las Positas College Vacuum Technology 60A & 60B
Page 170 Rights Reserved, Biltoft, Benapfl, and Swain Fall 2002
One must use reference data to establish the ratios of peak intensities for the peaks from each of the gases in the mixture. Using the subsidiary peaks which do not overlap, estimate the partial pressures of the gases in the mixture, using the technique just described. Once this initial estimate of the partial pressures of each gas is in hand, use the gain and sensitivity to solve for the total ion current for each component that contributes to the intensity of an overlapped peak.
Laboratory Exercise 13.1: Qualitative identification of species in mass spectra. Equipment required: none. Procedure: Using the table of cracking patterns for materials commonly used in vacuum technology (Appendix X), identify the constituents in each of the following mass spectra Laboratory Exercise 13.2: Operation of a Partial Pressure Analyzer Equipment required: small vacuum vessel or bell jar vacuum system capable of attaining a pressure of 10-5 Torr or lower; a complete partial pressure analysis instrument; calibrated leaks (helium, nitrogen, Argon). Procedure: Review the installation and operating guidelines for the partial pressure analyzer you have selected for this experiment. After reading and understanding the procedures in these instructions, inform the laboratory instructor of your procedure for installation and operation of the instrument. With his approval, begin the installation of the spectrometer head onto the vacuum vessel. Attach the mass spectrometer head to the vacuum vessel with an isolation valve between the two. Attach the reference leaks to the vessel. Connect the spectrometer to the control unit as suggested by the manufacturer. Evacuate the vacuum vessel to a pressure of 10-5 Torr or less. Following the manufacturer's operating procedures, obtain the partial pressure analysis of the residual gases in the vessel. Repeat the measurement at five minute intervals for an hour to see how the partial pressures of gases in the vessel change during operation of the high vacuum pump. Following this series of measurements, open one reference leak briefly (1-2 seconds), and observe the mass spectra. Note any changes in the mass spectra. Wait until the mass spectra returns to a "baseline" reading similar to that prior to the injection of gas from the reference leak. Repeat the controlled injection of known gas with the remaining reference leaks that are attached to the vessel. Following completion of all experimental work, turn off the partial pressure analyzer following the manufacturer's suggested procedures. Shut down the vacuum system safely, and vent the pumps and vessel. Write a laboratory report of your procedures and findings, including the data collected.
Las Positas College Vacuum Technology 60A & 60B
Page 171 Rights Reserved, Biltoft, Benapfl, and Swain Fall 2002
Chapter 14: Thin Film Deposition Processes Up to this point in the course almost all of the emphasis has been placed on the techniques involved with certain activities related to achieving and characterizing a vacuum environment. Now we will turn our attention to the reasons for working so hard to achieve a vacuum: the processes that are conducted in this environment. The deposition of thin films has made a tremendous impact on the level of technology we utilize in our daily lives. Thin film coatings provide enhanced optical performance on items ranging from camera lenses to sunglasses. Architectural glass is often coated to reduce the heat load in large office buildings, and provide significant cost savings by reducing air conditioning requirements. Microelectronics as we know them today would not be possible without vacuum technology. Microcircuits fabricated in multi-step vacuum processes are used in devices ranging from wrist watches to microwave ovens to automobile ignition and monitoring systems. The computer industry would not exist if it were not for vacuum technology. In 1990 the world market for integrated circuits was $50 billion; and for the electronic devices which rely on these microcircuits, $0.9 trillion. Decorative coatings applied to jewelry and plumbing fixtures is another large industry based upon vacuum technology. Many of the components of plumbing fixtures are manufactured by depositing thin films of chromium onto injection molded plastic parts. The useful life of tool bits has also been increased by the application of thin films that are chemical compounds. Tool steel cutting tools used in lathes and mills are often coated with the chemical compound titanium nitride to reduce wear of the cutting edges. The deposition of thin films composed of chemical compounds may be performed in several ways. Co-deposition is a technique in which vapors of two different materials are generated simultaneously. These two vapors condense together, forming an alloy or compound. Other techniques for deposition of compounds include thermal evaporation of the compound (as is performed for salt coatings), sputtering of the compound, and reactive sputtering or evaporation. In the reactive processes, atoms of the evaporant (typically a metal) chemically react with gas species which are intentionally injected into the process chamber. Each of these processes will be described in detail.
Thin Film Deposition in a Vacuum Environment Early references to the science of thin film deposition include the research conducted by Michael Faraday in 1857. In this series of experiments, Faraday created thin metallic films by exploding metal wires in a vacuum vessel. Historically, the techniques for thin film deposition have evolved in approximately this order: thermally induced evaporation (by electrical resistance heating, induction heating, and electron beam heating), sputtering (diode, triode, magnetron, ion beam), arc processes, and most recently, laser ablation. In general, there are three steps in any physical vacuum deposition (PVD) process: creation of an evaporant from the source material, transport of the evaporant from the source to the substrate (item to be coated), and condensation of the evaporant onto the substrate to form the thin film deposit. There are two reasons why this process is best conducted under vacuum: 1. the process of evaporation involves significant amounts of heat, if oxygen were present, any reactive metal would form oxides; 2. collisions with
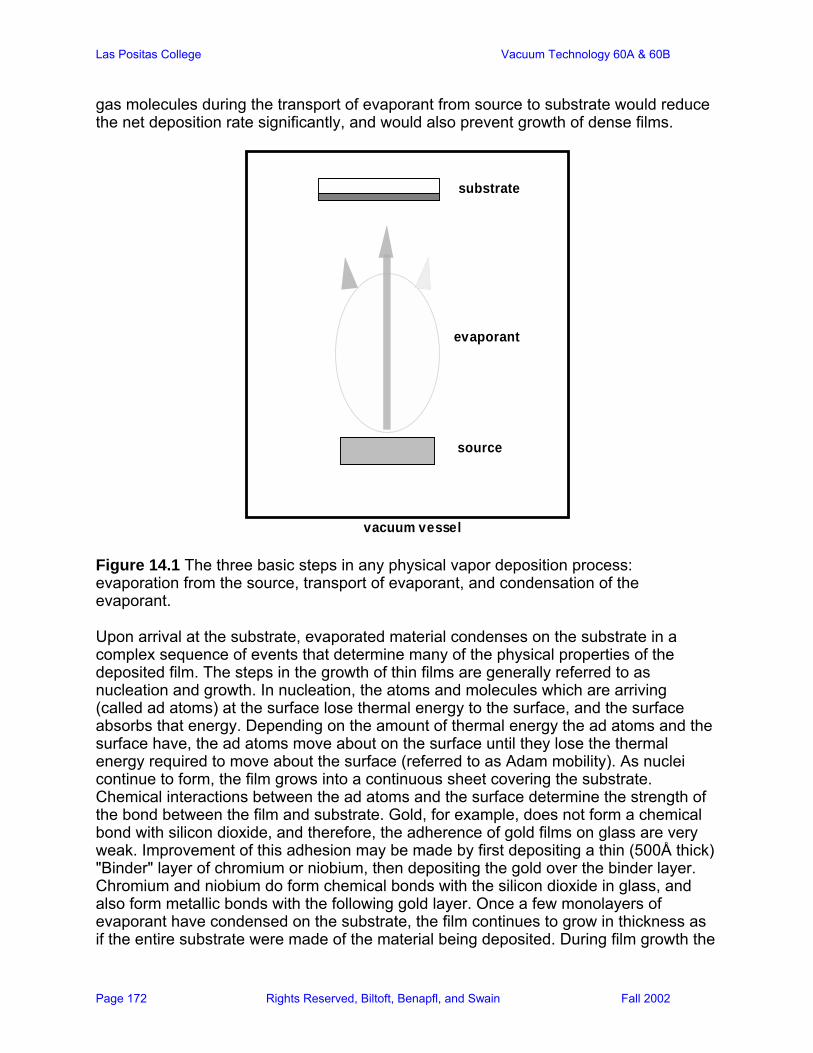
Las Positas College Vacuum Technology 60A & 60B
Page 172 Rights Reserved, Biltoft, Benapfl, and Swain Fall 2002
gas molecules during the transport of evaporant from source to substrate would reduce the net deposition rate significantly, and would also prevent growth of dense films.
source
evaporant
substrate
vacuum vessel Figure 14.1 The three basic steps in any physical vapor deposition process: evaporation from the source, transport of evaporant, and condensation of the evaporant. Upon arrival at the substrate, evaporated material condenses on the substrate in a complex sequence of events that determine many of the physical properties of the deposited film. The steps in the growth of thin films are generally referred to as nucleation and growth. In nucleation, the atoms and molecules which are arriving (called ad atoms) at the surface lose thermal energy to the surface, and the surface absorbs that energy. Depending on the amount of thermal energy the ad atoms and the surface have, the ad atoms move about on the surface until they lose the thermal energy required to move about the surface (referred to as Adam mobility). As nuclei continue to form, the film grows into a continuous sheet covering the substrate. Chemical interactions between the ad atoms and the surface determine the strength of the bond between the film and substrate. Gold, for example, does not form a chemical bond with silicon dioxide, and therefore, the adherence of gold films on glass are very weak. Improvement of this adhesion may be made by first depositing a thin (500Å thick) "Binder" layer of chromium or niobium, then depositing the gold over the binder layer. Chromium and niobium do form chemical bonds with the silicon dioxide in glass, and also form metallic bonds with the following gold layer. Once a few monolayers of evaporant have condensed on the substrate, the film continues to grow in thickness as if the entire substrate were made of the material being deposited. During film growth the

Las Positas College Vacuum Technology 60A & 60B
Page 173 Rights Reserved, Biltoft, Benapfl, and Swain Fall 2002
microstructure of the deposited film will be developed. This microstructure may be described in terms of grain size, orientation, porosity, impurity content, and entrained gases. Normally, vacuum deposition processes are selected over other processes (electrochemical deposition, flame spraying, etc.) to achieve the following desirable properties:
1) High chemical purity. 2) Good adhesion between the thin film and substrate. 3) Control over mechanical stress in the film. 4) Deposition of very thin layers, and multiple layers of different materials. 5) Low gas entrapment.
For each of the vacuum deposition process described in this unit, keep in mind the ultimate goal is to provide a means for depositing a thin film having the required physical and chemical properties. The parameters one can control to achieve the specified goals are:
1) Kinetic energy of the ad atoms. 2) Substrate temperature. 3) Deposition rate of the thin film. 4) Augmented energy applied to the film during growth. 5) Gas scattering during transport of the evaporant.
By varying these parameters one can generate thin films of a given material that have different mechanical strength, adhesion, optical reflectivity, electrical resistivity, magnetic properties and density.
Thermally Induced Evaporation In this process, heat is input into the source material (often called the charge) to create a plume of vapor which travels in straight-line paths to the substrate. Upon arrival at the substrate, the atoms, molecules, and clusters of molecules condense from the vapor phase to form a solid film. The heat of condensation is absorbed by the substrate. On a microscopic scale the localized heating from this process can be enormous. It is common, in the development of metal coating techniques for thin cross-section plastic parts, to melt substrates during the initial deposition runs. With experience, one can select source-to-substrate distances and deposition rates which will allow coating of temperature sensitive substrates without melting. There are several methods by which heat can be delivered to the charge to cause vaporization: electric resistance heating, induction heating, and electron beam heating. Deposition of thin films by laser ablation and cathodic arc could be grouped in this section with thermal processes, but there are some unique characteristics of these techniques which are beyond the simple model of thermally induced evaporation. For this reason we will cover these two deposition techniques separately.
Resistance Evaporation

Las Positas College Vacuum Technology 60A & 60B
Page 174 Rights Reserved, Biltoft, Benapfl, and Swain Fall 2002
Evaporation of material by electrical resistance evaporation is very likely the easiest of the thermal evaporation techniques. Quite simply, in a vacuum environment the charge (which may be an elemental metal, an alloy, a mixture or a compound) is heated to become a vapor. Low voltage, high current (typically 10 to 40 VDC, 1 to 10 amps) power is brought into the vacuum vessel using electrical power feed throughs. The electrical power is passed through a filament which is in intimate contact with the charge (see figure 13.1). Filaments are often heated to 1000 to 2000° C. A materials requirement for efficient thermal evaporation is that the charge have an appreciable vapor pressure at the operating temperature of the filament. Table 14.1 Temperatures for efficient evaporation of selected metals.
Material
Evaporation temperature,
°C
Comments
Zinc 325 High vapor pressure at RT Aluminum 1390 Copper 1516 Chromium 1612 Lead 1680 Toxic Iron 1829 Nickel 1848
All materials evaporate, even at room temperature. The addition of heat simply accelerates the process. At a specified temperature the pressure of the vapor emitted by a material is called the equilibrium vapor pressure.
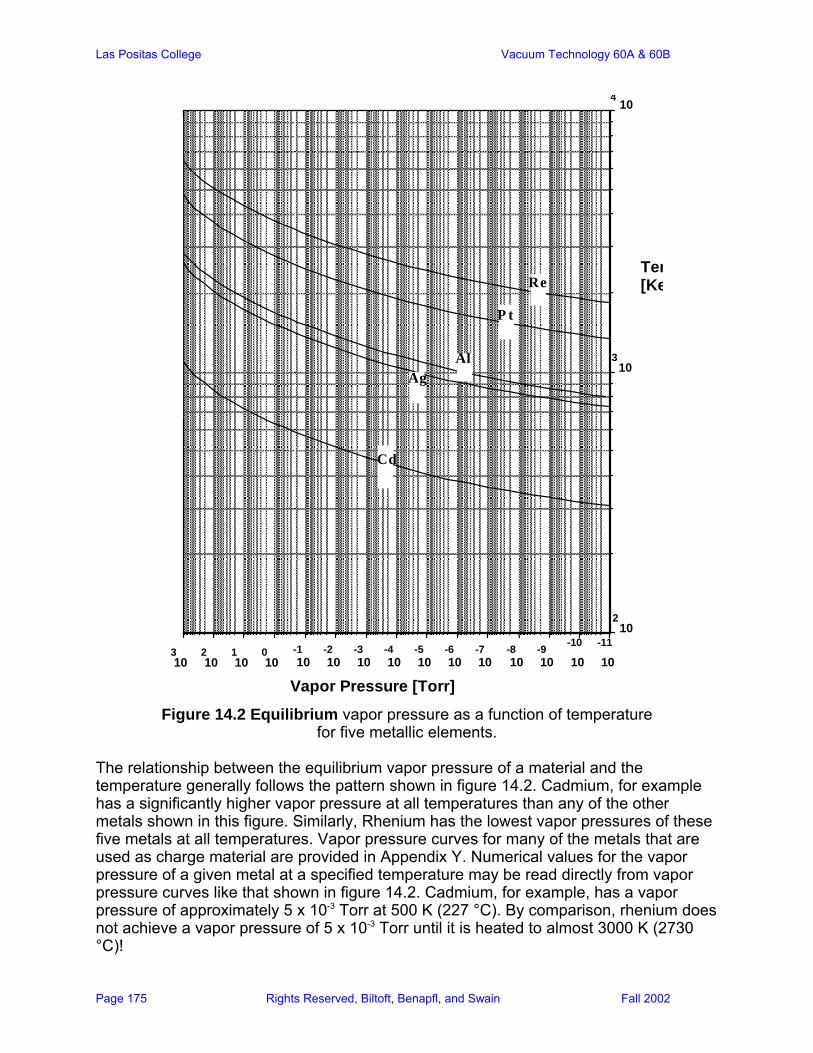
Las Positas College Vacuum Technology 60A & 60B
Page 175 Rights Reserved, Biltoft, Benapfl, and Swain Fall 2002
10 4
10 3
10 2
10 -11
10 -10
10-9
10-8
10-7
10-6
10-5
10-4
10-3
10-2
10 -1
10 0
10 1
10 2
10 3
Tem[Ke
Vapor Pressure [Torr]
Cd
AgAl
Pt
Re
Figure 14.2 Equilibrium vapor pressure as a function of temperature
for five metallic elements. The relationship between the equilibrium vapor pressure of a material and the temperature generally follows the pattern shown in figure 14.2. Cadmium, for example has a significantly higher vapor pressure at all temperatures than any of the other metals shown in this figure. Similarly, Rhenium has the lowest vapor pressures of these five metals at all temperatures. Vapor pressure curves for many of the metals that are used as charge material are provided in Appendix Y. Numerical values for the vapor pressure of a given metal at a specified temperature may be read directly from vapor pressure curves like that shown in figure 14.2. Cadmium, for example, has a vapor pressure of approximately 5 x 10⁻³ Torr at 500 K (227 °C). By comparison, rhenium does not achieve a vapor pressure of 5 x 10⁻³ Torr until it is heated to almost 3000 K (2730 °C)!
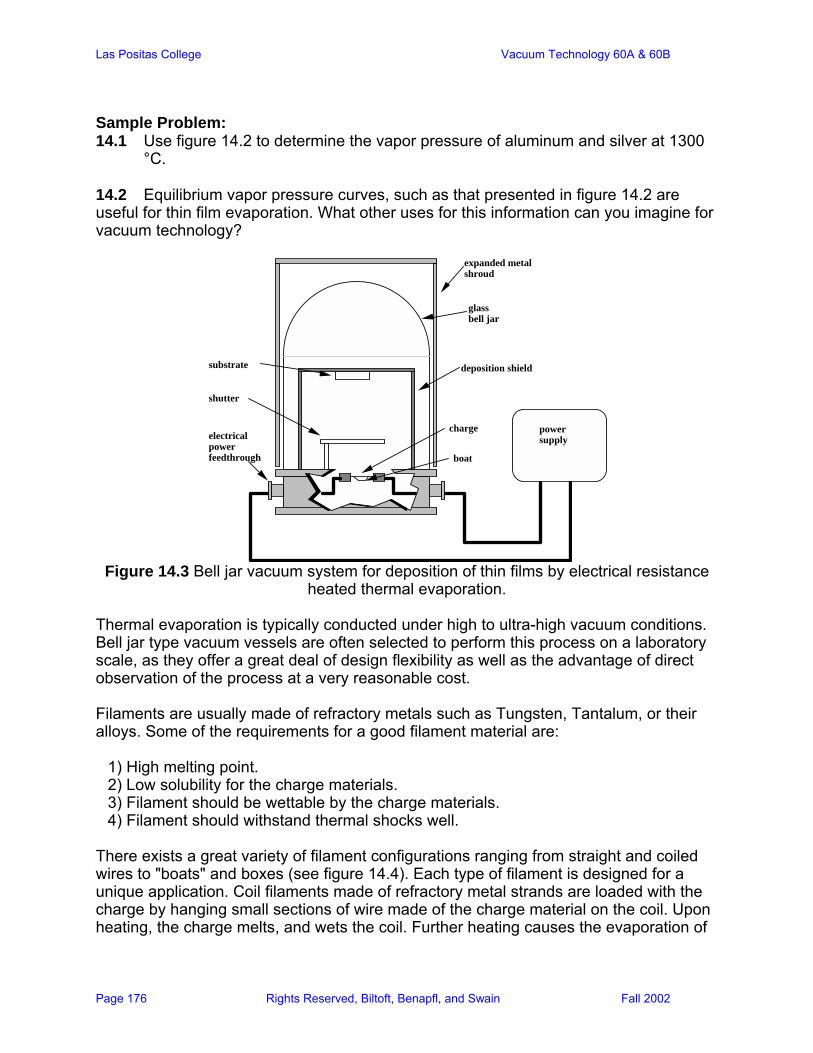
Las Positas College Vacuum Technology 60A & 60B
Page 176 Rights Reserved, Biltoft, Benapfl, and Swain Fall 2002
Sample Problem: 14.1 Use figure 14.2 to determine the vapor pressure of aluminum and silver at 1300
°C. 14.2 Equilibrium vapor pressure curves, such as that presented in figure 14.2 are useful for thin film evaporation. What other uses for this information can you imagine for vacuum technology?
glass bell jar
expanded metal shroud
deposition shieldsubstrate
shutter
electrical power feedthrough
charge power supply
boat
Figure 14.3 Bell jar vacuum system for deposition of thin films by electrical resistance
heated thermal evaporation.
Thermal evaporation is typically conducted under high to ultra-high vacuum conditions. Bell jar type vacuum vessels are often selected to perform this process on a laboratory scale, as they offer a great deal of design flexibility as well as the advantage of direct observation of the process at a very reasonable cost. Filaments are usually made of refractory metals such as Tungsten, Tantalum, or their alloys. Some of the requirements for a good filament material are:
1) High melting point. 2) Low solubility for the charge materials. 3) Filament should be wettable by the charge materials. 4) Filament should withstand thermal shocks well.
There exists a great variety of filament configurations ranging from straight and coiled wires to "boats" and boxes (see figure 14.4). Each type of filament is designed for a unique application. Coil filaments made of refractory metal strands are loaded with the charge by hanging small sections of wire made of the charge material on the coil. Upon heating, the charge melts, and wets the coil. Further heating causes the evaporation of
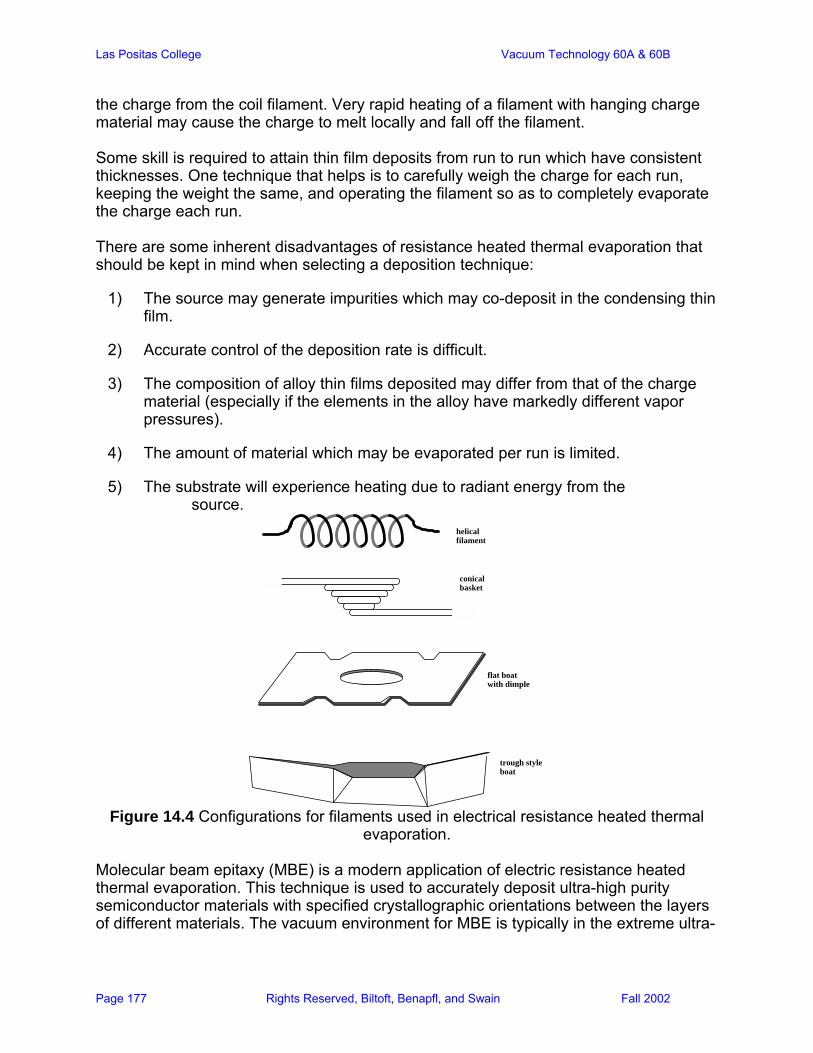
Las Positas College Vacuum Technology 60A & 60B
Page 177 Rights Reserved, Biltoft, Benapfl, and Swain Fall 2002
the charge from the coil filament. Very rapid heating of a filament with hanging charge material may cause the charge to melt locally and fall off the filament. Some skill is required to attain thin film deposits from run to run which have consistent thicknesses. One technique that helps is to carefully weigh the charge for each run, keeping the weight the same, and operating the filament so as to completely evaporate the charge each run. There are some inherent disadvantages of resistance heated thermal evaporation that should be kept in mind when selecting a deposition technique:
1) The source may generate impurities which may co-deposit in the condensing thin film.
2) Accurate control of the deposition rate is difficult.
3) The composition of alloy thin films deposited may differ from that of the charge material (especially if the elements in the alloy have markedly different vapor pressures).
4) The amount of material which may be evaporated per run is limited.
5) The substrate will experience heating due to radiant energy from the source.
helical filament
conical basket
flat boat with dimple
trough style boat
Figure 14.4 Configurations for filaments used in electrical resistance heated thermal
evaporation. Molecular beam epitaxy (MBE) is a modern application of electric resistance heated thermal evaporation. This technique is used to accurately deposit ultra-high purity semiconductor materials with specified crystallographic orientations between the layers of different materials. The vacuum environment for MBE is typically in the extreme ultra-
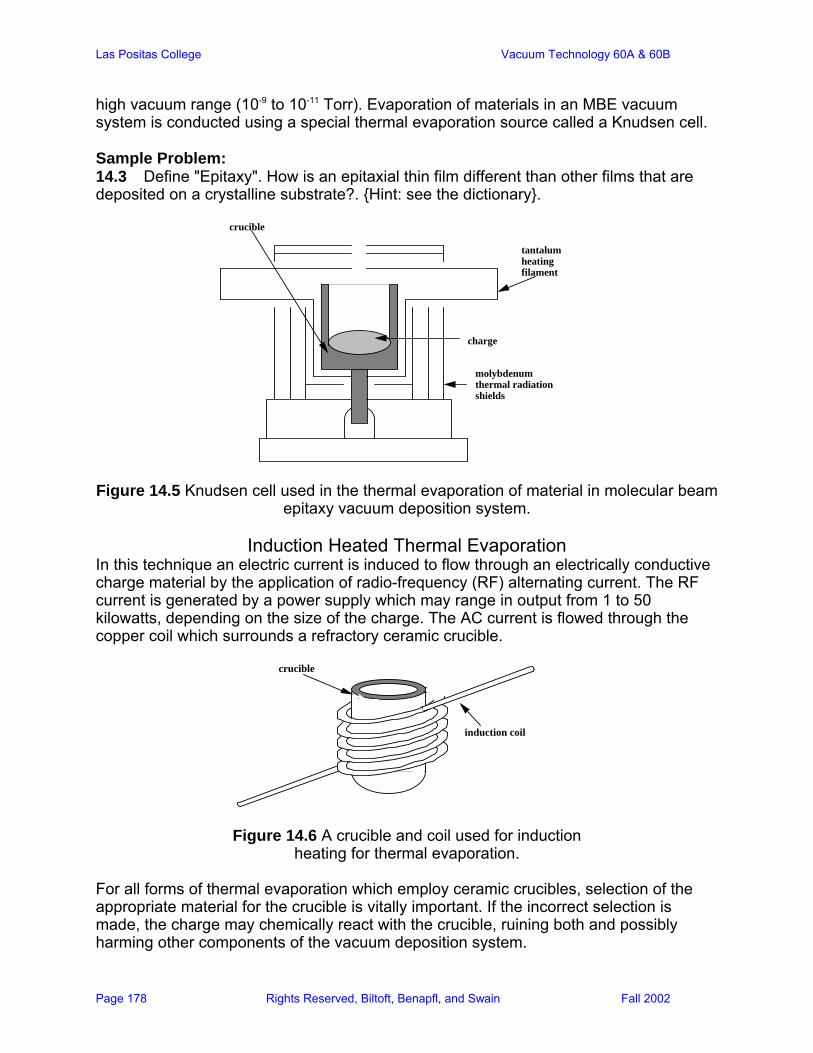
Las Positas College Vacuum Technology 60A & 60B
Page 178 Rights Reserved, Biltoft, Benapfl, and Swain Fall 2002
high vacuum range (10-9 to 10-11 Torr). Evaporation of materials in an MBE vacuum system is conducted using a special thermal evaporation source called a Knudsen cell. Sample Problem: 14.3 Define "Epitaxy". How is an epitaxial thin film different than other films that are deposited on a crystalline substrate?. Hint: see the dictionary.
charge
molybdenum thermal radiation shields
tantalum heating filament
crucible
Figure 14.5 Knudsen cell used in the thermal evaporation of material in molecular beam
epitaxy vacuum deposition system.
Induction Heated Thermal Evaporation In this technique an electric current is induced to flow through an electrically conductive charge material by the application of radio-frequency (RF) alternating current. The RF current is generated by a power supply which may range in output from 1 to 50 kilowatts, depending on the size of the charge. The AC current is flowed through the copper coil which surrounds a refractory ceramic crucible.
induction coil
crucible
Figure 14.6 A crucible and coil used for induction heating for thermal evaporation.
For all forms of thermal evaporation which employ ceramic crucibles, selection of the appropriate material for the crucible is vitally important. If the incorrect selection is made, the charge may chemically react with the crucible, ruining both and possibly harming other components of the vacuum deposition system.
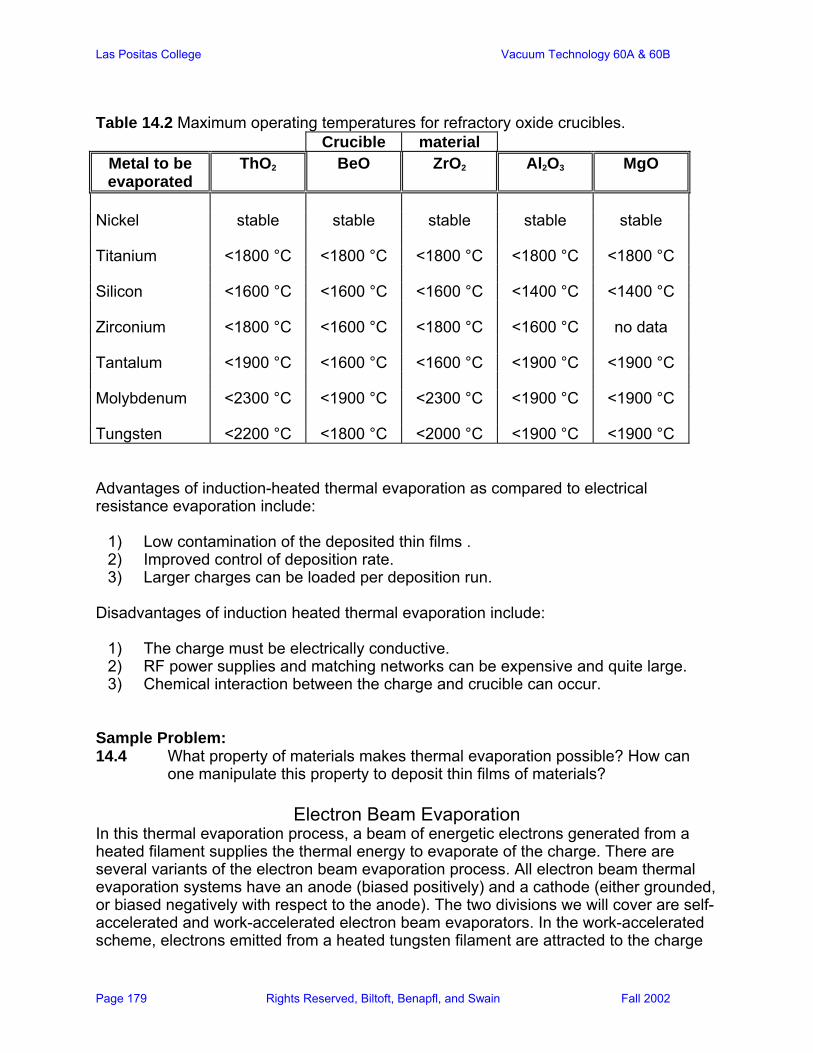
Las Positas College Vacuum Technology 60A & 60B
Page 179 Rights Reserved, Biltoft, Benapfl, and Swain Fall 2002
Table 14.2 Maximum operating temperatures for refractory oxide crucibles. Crucible material
Metal to be evaporated
ThO2 BeO ZrO2 Al2O3 MgO
Nickel stable stable stable stable stable Titanium <1800 °C <1800 °C <1800 °C <1800 °C <1800 °C Silicon <1600 °C <1600 °C <1600 °C <1400 °C <1400 °C Zirconium <1800 °C <1600 °C <1800 °C <1600 °C no data Tantalum <1900 °C <1600 °C <1600 °C <1900 °C <1900 °C Molybdenum <2300 °C <1900 °C <2300 °C <1900 °C <1900 °C Tungsten <2200 °C <1800 °C <2000 °C <1900 °C <1900 °C Advantages of induction-heated thermal evaporation as compared to electrical resistance evaporation include:
1) Low contamination of the deposited thin films . 2) Improved control of deposition rate. 3) Larger charges can be loaded per deposition run.
Disadvantages of induction heated thermal evaporation include:
1) The charge must be electrically conductive. 2) RF power supplies and matching networks can be expensive and quite large. 3) Chemical interaction between the charge and crucible can occur.
Sample Problem: 14.4 What property of materials makes thermal evaporation possible? How can
one manipulate this property to deposit thin films of materials?
Electron Beam Evaporation In this thermal evaporation process, a beam of energetic electrons generated from a heated filament supplies the thermal energy to evaporate of the charge. There are several variants of the electron beam evaporation process. All electron beam thermal evaporation systems have an anode (biased positively) and a cathode (either grounded, or biased negatively with respect to the anode). The two divisions we will cover are self-accelerated and work-accelerated electron beam evaporators. In the work-accelerated scheme, electrons emitted from a heated tungsten filament are attracted to the charge
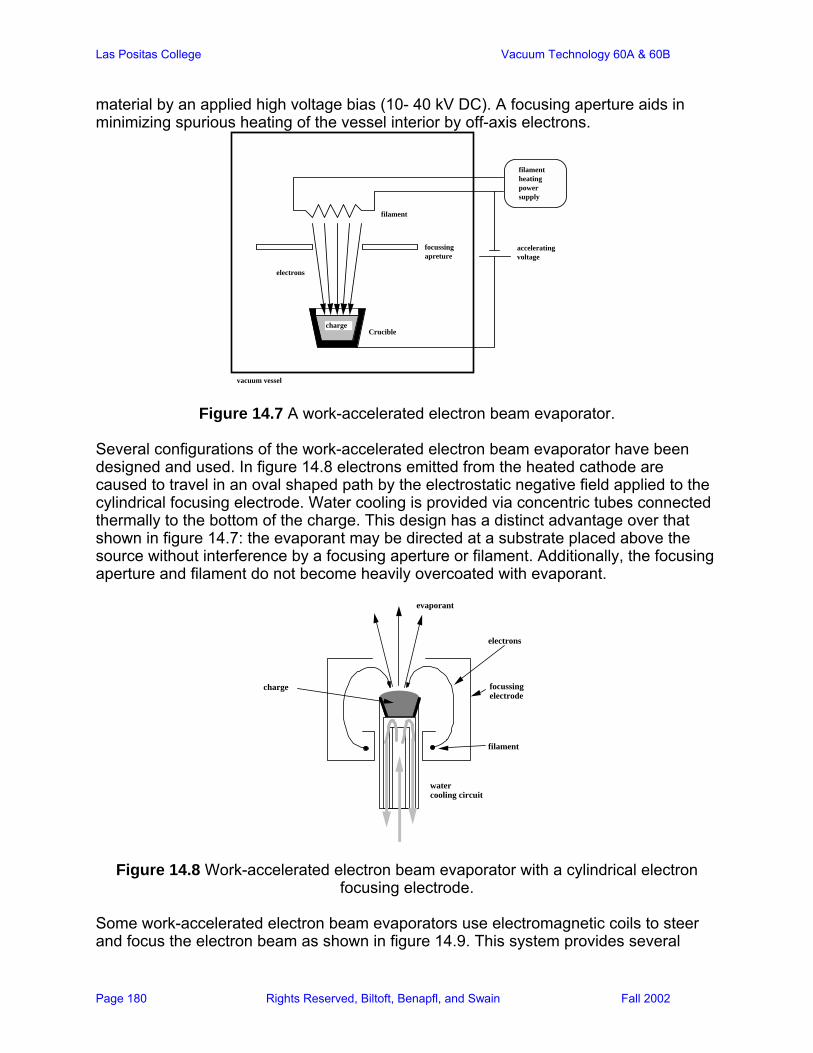
Las Positas College Vacuum Technology 60A & 60B
Page 180 Rights Reserved, Biltoft, Benapfl, and Swain Fall 2002
material by an applied high voltage bias (10- 40 kV DC). A focusing aperture aids in minimizing spurious heating of the vessel interior by off-axis electrons.
filament
focussing apreture
Cruciblecharge
electrons
filament heating power supply
accelerating voltage
vacuum vessel
Figure 14.7 A work-accelerated electron beam evaporator. Several configurations of the work-accelerated electron beam evaporator have been designed and used. In figure 14.8 electrons emitted from the heated cathode are caused to travel in an oval shaped path by the electrostatic negative field applied to the cylindrical focusing electrode. Water cooling is provided via concentric tubes connected thermally to the bottom of the charge. This design has a distinct advantage over that shown in figure 14.7: the evaporant may be directed at a substrate placed above the source without interference by a focusing aperture or filament. Additionally, the focusing aperture and filament do not become heavily overcoated with evaporant.
filament
charge
evaporant
focussing electrode
electrons
water cooling circuit
Figure 14.8 Work-accelerated electron beam evaporator with a cylindrical electron focusing electrode.
Some work-accelerated electron beam evaporators use electromagnetic coils to steer and focus the electron beam as shown in figure 14.9. This system provides several

Las Positas College Vacuum Technology 60A & 60B
Page 181 Rights Reserved, Biltoft, Benapfl, and Swain Fall 2002
advantages: source utilization can be controlled and maximized by rastering the electron beam; and the effective source size can be made large by rastering the beam, improving the thickness uniformity and coverage of the substrate. Note that in this design the electrons emitted from the filament impact the backside of the cathode, heating it so that it will in turn emit electrons. The cathode area which emits electrons is hemispherical, which improves the three-dimensional uniformity of the electron beam emitted from it. Self-accelerated electron beam evaporators use an auxiliary anode to impart kinetic energy to the electrons emitted by the filament (cathode). This allows the evaporation of charge materials which are not electrically conductive, such as calcium fluoride, which is used to coat camera lenses for improved optical performance. A self-accelerated electron beam gun configuration is presented in figure 14.10.
filament heating power supply
focussing electro- magnets
charge
substrates
evaporant
Figure 14.9 Work-accelerated electron beam evaporator electromagnets to focus and
steer the electron beam on the charge material. As was the case with the work accelerated electron beam evaporator in figure 14.9, the self-accelerated gun has a set of electromagnets which may be used to scan the electron beam during evaporation. Automated scan controls for both types of guns are commercially available. These scan controls vary the current in the electromagnets so as to sweep the beam in a "Lissajous" pattern, which is sinusoidal in two dimensions.

Las Positas College Vacuum Technology 60A & 60B
Page 182 Rights Reserved, Biltoft, Benapfl, and Swain Fall 2002
filament
focussing apreture
Cruciblecharge
filament heating power supply
accelerating voltage
vacuum vessel
anode
focussing coils
Figure 14.10 Self-accelerated electron beam evaporation. The majority of commercial electron beam evaporators are of the transverse design, as shown in figure 14.11. These guns use a permanent magnet to steer the electrons emitted from the cathode around 270°, and a set of electromagnets to raster the beam on the charge material. Modern electron beam guns of the transverse design are available with a rotating multiple pocket hearth, which allows deposition of up to five different materials without venting the vacuum vessel. Some of these units also have integral shutters which allow the gun to achieve a stable operating temperature before deposition of the substrate is begun. Since the process of electron beam evaporation is normally performed under UHV conditions, the evaporant generally travels in straight-line paths from the source to the substrate. To aid in attaining uniform thickness coatings by this technique, substrates are often mounted on "carousels" which rotate, and may wobble or spin individual substrates each revolution (see figure 14.12). Deposition shielding is often placed inside the vacuum vessel to facilitate cleaning. Multiple sets of shields allows for continuous operation of the system: one set may be cleaned while the other set is in operation.
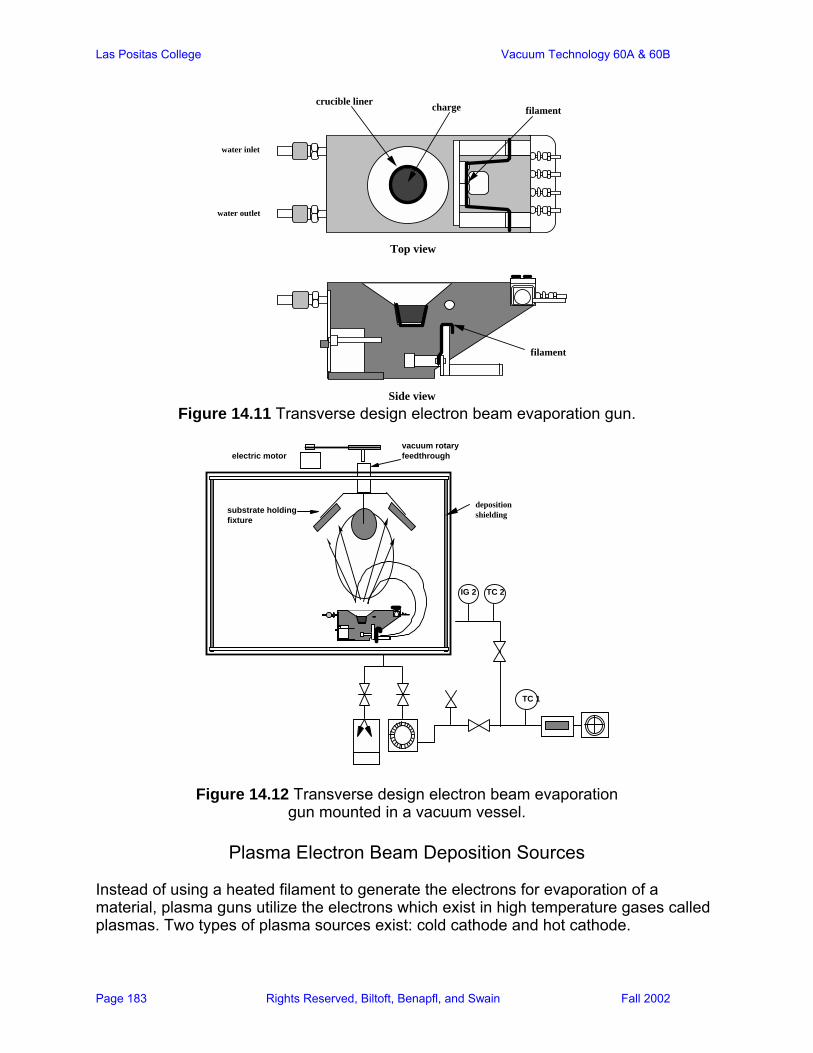
Las Positas College Vacuum Technology 60A & 60B
Page 183 Rights Reserved, Biltoft, Benapfl, and Swain Fall 2002
water inlet
water outlet
Top view
Side view
filamentcrucible liner charge
filament
Figure 14.11 Transverse design electron beam evaporation gun.
TC 1
IG 2 TC 2
electric motorvacuum rotary feedthrough
substrate holding fixture
deposition shielding
Figure 14.12 Transverse design electron beam evaporation gun mounted in a vacuum vessel.
Plasma Electron Beam Deposition Sources
Instead of using a heated filament to generate the electrons for evaporation of a material, plasma guns utilize the electrons which exist in high temperature gases called plasmas. Two types of plasma sources exist: cold cathode and hot cathode.
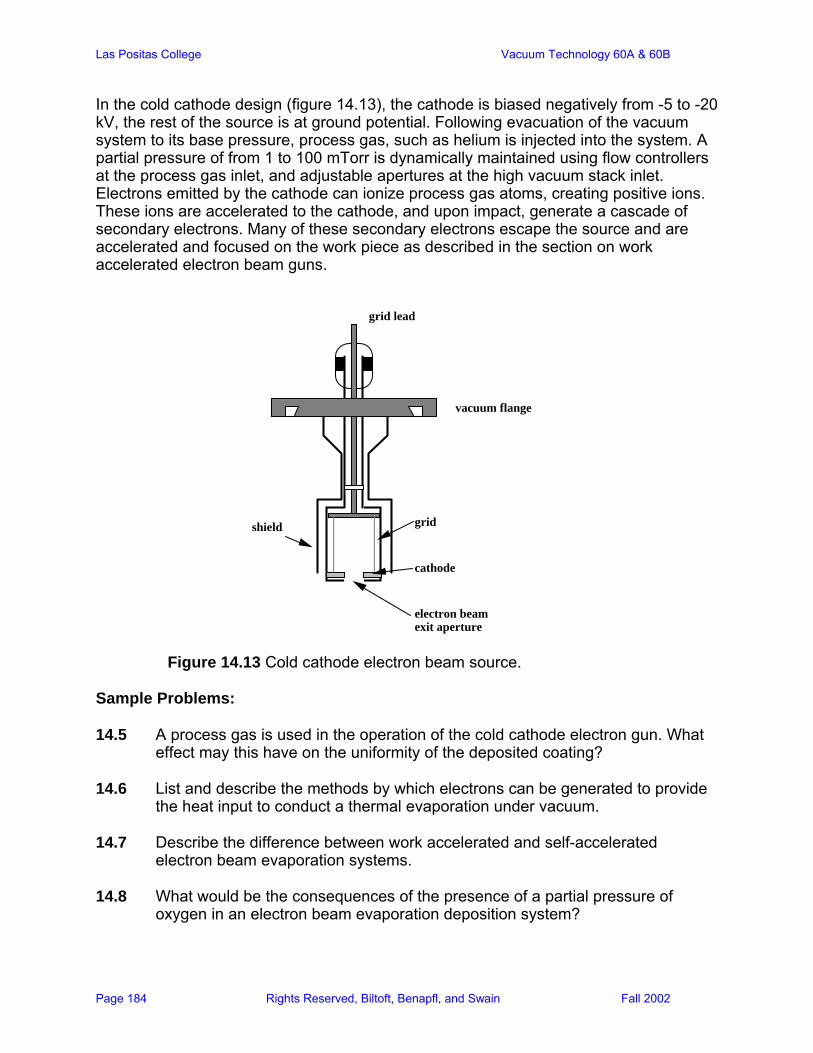
Las Positas College Vacuum Technology 60A & 60B
Page 184 Rights Reserved, Biltoft, Benapfl, and Swain Fall 2002
In the cold cathode design (figure 14.13), the cathode is biased negatively from -5 to -20 kV, the rest of the source is at ground potential. Following evacuation of the vacuum system to its base pressure, process gas, such as helium is injected into the system. A partial pressure of from 1 to 100 mTorr is dynamically maintained using flow controllers at the process gas inlet, and adjustable apertures at the high vacuum stack inlet. Electrons emitted by the cathode can ionize process gas atoms, creating positive ions. These ions are accelerated to the cathode, and upon impact, generate a cascade of secondary electrons. Many of these secondary electrons escape the source and are accelerated and focused on the work piece as described in the section on work accelerated electron beam guns.
vacuum flange
grid lead
grid
cathode
electron beam exit aperture
shield
Figure 14.13 Cold cathode electron beam source. Sample Problems: 14.5 A process gas is used in the operation of the cold cathode electron gun. What
effect may this have on the uniformity of the deposited coating? 14.6 List and describe the methods by which electrons can be generated to provide
the heat input to conduct a thermal evaporation under vacuum. 14.7 Describe the difference between work accelerated and self-accelerated
electron beam evaporation systems. 14.8 What would be the consequences of the presence of a partial pressure of
oxygen in an electron beam evaporation deposition system?
Las Positas College Vacuum Technology 60A & 60B
Page 185 Rights Reserved, Biltoft, Benapfl, and Swain Fall 2002
14.9 Calculate the mean-free-path in a vacuum vessel at a pressure of 5 x 10⁻⁷ Torr at room temperature. From this data what could you predict about the path vapor atoms and molecules would take between the evaporation source and the substrate? Can you think of situations in which this would be advantageous or disadvantageous?
The Hot Hollow Cathode Electron Beam Gun Following evacuation to the vessel's base pressure, a process gas, such as Argon is flowed in a controlled manner through the cylindrical hollow cathode. Radio frequency AC electric current is supplied to the cathode of the electron beam source from a low voltage, high current power supply. Ionization of the process gas occurs as a result of the applied electrical power. The cathode operating temperature is very high. For this reason, the cathode is made of a refractory metal, such as tungsten, and must be actively water cooled. Electrons emitted from the hot cathode and from the plasma may be steered and accelerated as described for other electron sources. Very high deposition rates may be achieved using the hot hollow cathode electron beam source to perform thermal evaporation of materials. The electrons emitted from this source may be work or self-accelerated, and may be magnetically steered. Sample Problems: 14.10 The operating pressure in a thermal evaporation deposition chamber using
a hot hollow cathode electron source is approximately 50 mTorr, with Argon as the process gas. Calculate the mean-free-path at this pressure, and describe the effect this will have on the deposited thin film.
14.11 If you were interested in depositing a thin film of Zirconium Oxide, which of
the thermal evaporation deposition processes described would you select? Why?
14.12 Describe methods by which thickness uniformity in thin film coatings can be
improved for films made by thermally evaporation.
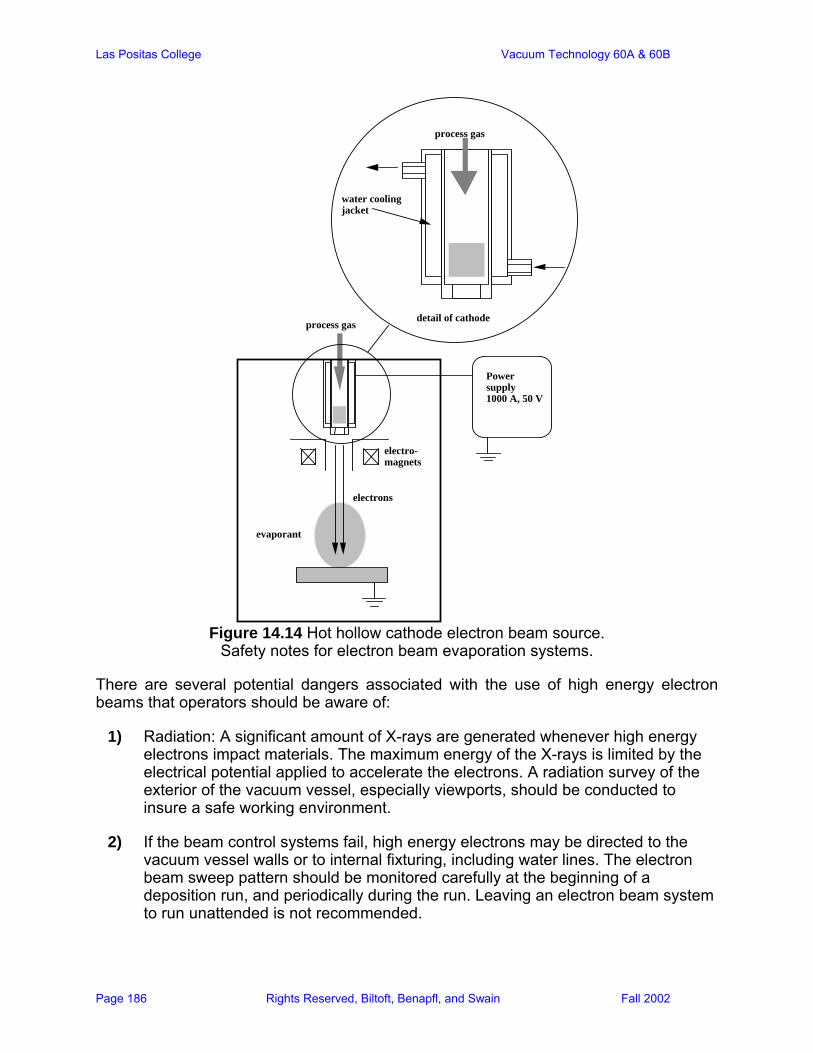
Las Positas College Vacuum Technology 60A & 60B
Page 186 Rights Reserved, Biltoft, Benapfl, and Swain Fall 2002
Power supply 1000 A, 50 V
process gas
electrons
electro- magnets
process gas
evaporant
water cooling jacket
detail of cathode
Figure 14.14 Hot hollow cathode electron beam source.
Safety notes for electron beam evaporation systems.
There are several potential dangers associated with the use of high energy electron beams that operators should be aware of:
1) Radiation: A significant amount of X-rays are generated whenever high energy electrons impact materials. The maximum energy of the X-rays is limited by the electrical potential applied to accelerate the electrons. A radiation survey of the exterior of the vacuum vessel, especially viewports, should be conducted to insure a safe working environment.
2) If the beam control systems fail, high energy electrons may be directed to the vacuum vessel walls or to internal fixturing, including water lines. The electron beam sweep pattern should be monitored carefully at the beginning of a deposition run, and periodically during the run. Leaving an electron beam system to run unattended is not recommended.

Las Positas College Vacuum Technology 60A & 60B
Page 187 Rights Reserved, Biltoft, Benapfl, and Swain Fall 2002
3) High voltage and high current are used in the process. The vacuum vessel and power supplies should be electrically grounded.
Sputter Deposition of Thin Films
Unlike thermal evaporation, in which a material is heated to increase its equilibrium vapor pressure, in sputter deposition, material is made to go into the vapor phase by the physical interaction of particles impacting the source material (often referred to as the "target"). There is a wide variety of sputtering techniques that are currently used to deposit thin films for use in magnetic storage media (cassette tapes, computer discs), optical thin films and microcircuits. The forms of sputtering which will be described in this section are: diode sputtering, magnetron sputtering, RF sputtering, and ion beam sputtering.
Diode Sputtering A simple diode sputtering process system is presented in figure 14.15. Following evacuation of the vessel to its base pressure to reduce contamination of the film by atmospheric gases or water vapor, a process gas (most often Argon) is admitted into the vessel. The pressure of this process gas is maintained at a user-selectable pressure between 1-100 mTorr using a set of upstream mass flow controllers to regulate the process gas mix, as well as a downstream throttling gate valve. Such a valve, situated right at the turbpuump, is equipped with a controller that can perform fast, realtime pressure control using a capacitance manometer as a sensor element. An electric bias of from 500 to 5000 V DC is applied to the target. Electrons emitted by the target strike process gas molecules in the vicinity of the target, and may cause the gas to become ionized. The positive ions thus created are accelerated towards the cathode by the applied negative bias. When the positive ions collide with the cathode, the kinetic energy transferred is sufficient to eject atoms of the cathode material. Secondary electrons, ions, and light (IR, visible, UV and X-rays) are also emitted during this collision.
Power supply
plasma
target
substrate
film
to vacuum pumps
process gas
-V
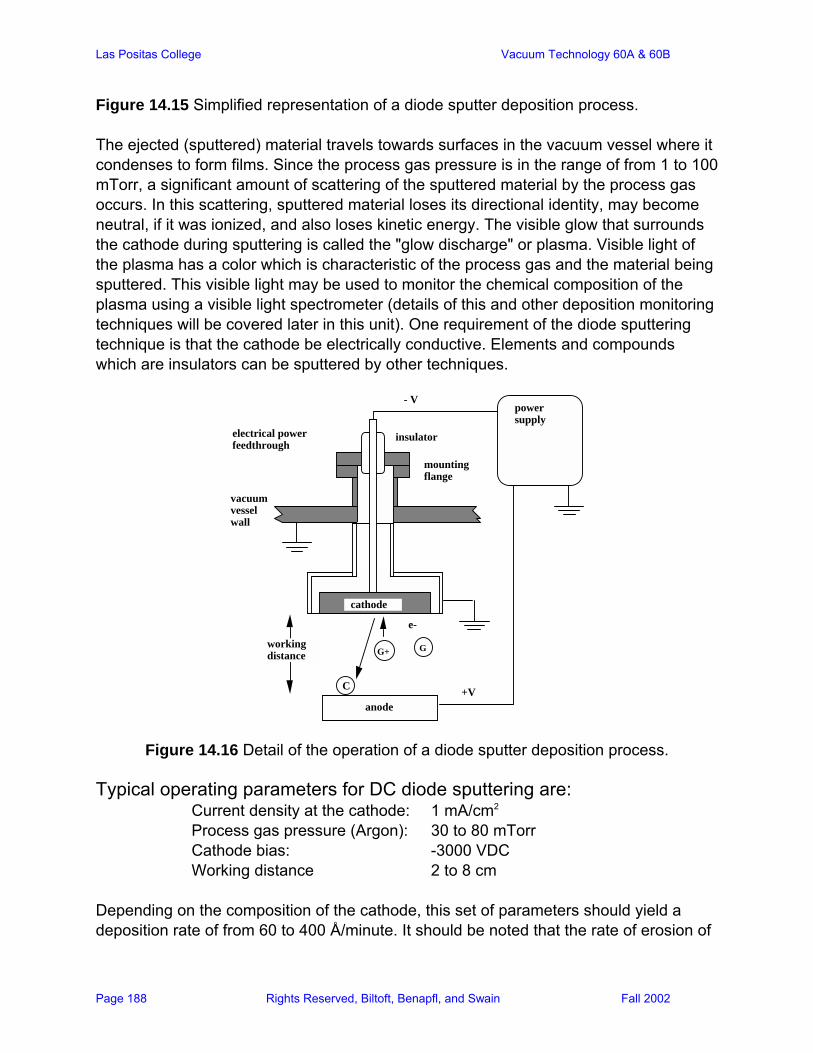
Las Positas College Vacuum Technology 60A & 60B
Page 188 Rights Reserved, Biltoft, Benapfl, and Swain Fall 2002
Figure 14.15 Simplified representation of a diode sputter deposition process. The ejected (sputtered) material travels towards surfaces in the vacuum vessel where it condenses to form films. Since the process gas pressure is in the range of from 1 to 100 mTorr, a significant amount of scattering of the sputtered material by the process gas occurs. In this scattering, sputtered material loses its directional identity, may become neutral, if it was ionized, and also loses kinetic energy. The visible glow that surrounds the cathode during sputtering is called the "glow discharge" or plasma. Visible light of the plasma has a color which is characteristic of the process gas and the material being sputtered. This visible light may be used to monitor the chemical composition of the plasma using a visible light spectrometer (details of this and other deposition monitoring techniques will be covered later in this unit). One requirement of the diode sputtering technique is that the cathode be electrically conductive. Elements and compounds which are insulators can be sputtered by other techniques.
working distance
cathode
anode
G
e-
G+
C
vacuum vessel wall
mounting flange
electrical power feedthrough
insulator
power supply
- V
+V
Figure 14.16 Detail of the operation of a diode sputter deposition process. Typical operating parameters for DC diode sputtering are:
Current density at the cathode: 1 mA/cm2
Process gas pressure (Argon): 30 to 80 mTorr Cathode bias: -3000 VDC Working distance 2 to 8 cm
Depending on the composition of the cathode, this set of parameters should yield a deposition rate of from 60 to 400 Å/minute. It should be noted that the rate of erosion of
Las Positas College Vacuum Technology 60A & 60B
Page 189 Rights Reserved, Biltoft, Benapfl, and Swain Fall 2002
the cathode is expected to be greater than the rate of deposition at the substrate. Some of the sputtered material condenses on the inner surfaces of the vacuum vessel (a good reason for removable deposition shields), and some may react chemically with residual gases to form volatile by-products which are pumped away. Now that the concept of diode sputtering has been introduced, a few of the relevant concepts that apply to all sputtering processes will be covered.
Sputtering Yield The number of target atoms which are ejected from the cathode for every incident ion is called the "Sputtering yield". The magnitude of the sputtering yield is a function of the composition of the process gas and target material, the energy of the incident ions, and the angle of incidence of the ions on the target. In general, the sputter yield is greatest for the following set of conditions:
1) High atomic weight process gas. 2) Low atomic weight cathode material. 3) Low concentration of reactive gas species in the vessel.
The noble gas Argon is the most commonly employed process gas for sputter deposition processes, as it has a high sputter yield for most metals, is chemically inert and non-toxic, and is relatively inexpensive (compared with the other noble gases (Krypton and Xenon). Table 14.3 Sputter yields for several elements at 200, 600 and 1000 V DC. Target material 200 V 600 V 1000 V Silver 1.6 3.4 no data Aluminum .35 1.2 no data Gold 1.1 2.8 3.6 Cobalt 0.6 1.4 no data Molybdenum 0.40 0.9 1.1 Silicon 0.2 0.5 0.6
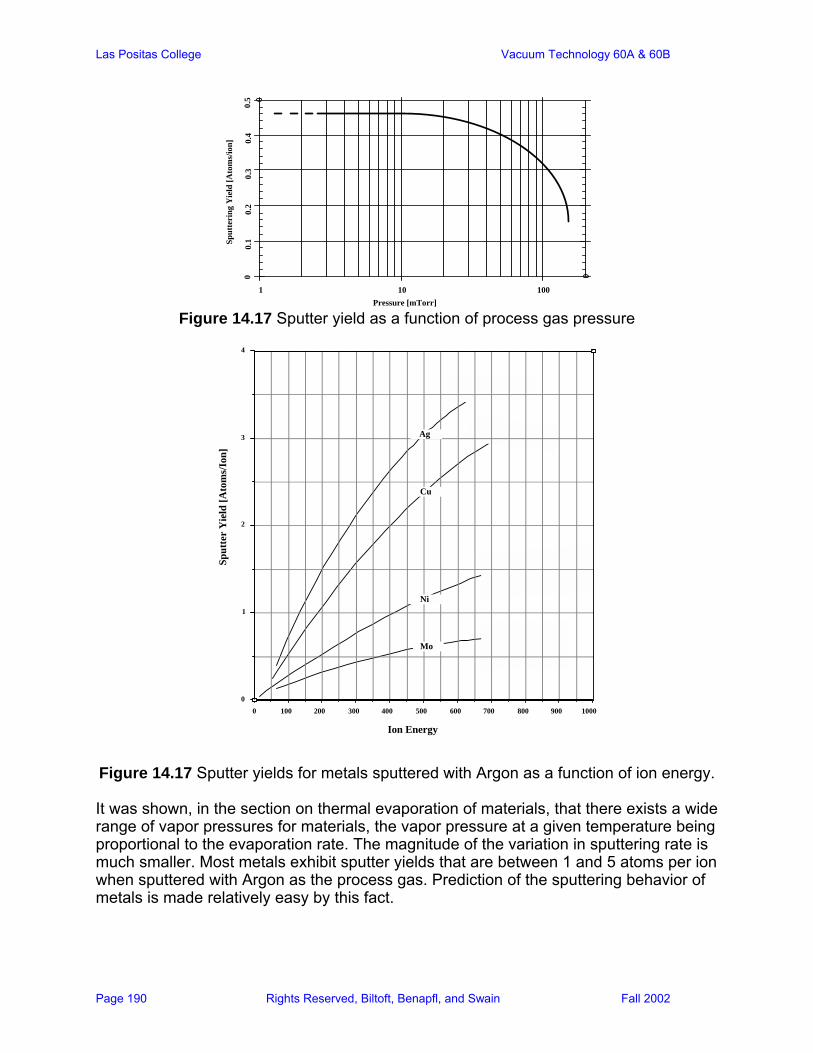
Las Positas College Vacuum Technology 60A & 60B
Page 190 Rights Reserved, Biltoft, Benapfl, and Swain Fall 2002
00.
10.
20.
30.
40.
5
Sput
teri
ng Y
ield
[Ato
ms/
ion]
1 10 100Pressure [mTorr]
Figure 14.17 Sputter yield as a function of process gas pressure
100090080070060050040030020010000
1
2
3
4
Ion Energy
Sput
ter
Yie
ld [A
tom
s/Io
n]
Ag
Cu
Ni
Mo
Figure 14.17 Sputter yields for metals sputtered with Argon as a function of ion energy. It was shown, in the section on thermal evaporation of materials, that there exists a wide range of vapor pressures for materials, the vapor pressure at a given temperature being proportional to the evaporation rate. The magnitude of the variation in sputtering rate is much smaller. Most metals exhibit sputter yields that are between 1 and 5 atoms per ion when sputtered with Argon as the process gas. Prediction of the sputtering behavior of metals is made relatively easy by this fact.

Las Positas College Vacuum Technology 60A & 60B
Page 191 Rights Reserved, Biltoft, Benapfl, and Swain Fall 2002
Sputtering Alloys and Compounds The deposition of thin films of metallic alloys and some chemical compounds may be accomplished by sputtering. In general, the composition of thin films deposited by sputtering will have the same overall chemical composition as the source (target) after an initial equilibration period. In figure 14.18 is presented a simplified representation of a two component alloy target, made of "A" and "B". Assume that the sputtering yields for material "A" is higher than for material "B". Initially, as material is sputtered from this compound cathode the vapor stream will be higher in concentration of "A" due to its larger sputter yield. After some time, the surface of the cathode will become depleted in "A" and more concentrated in "B". When this occurs, the thin films being deposited will have approximately the same composition as the target.
A B
A B
initial erosion of target
equilibrium erosion of target
Figure 14.18 Sputtering alloy target made of "A" and "B".
Characteristics of Sputtered Material in the Vapor Phase
The vapor emanating from a sputter deposition source cathode contains neutral atoms, ions (both positive and negative), electrons, neutral clusters of atoms and charged clusters of atoms. Of these, the vast majority are neutral atoms. These atoms have kinetic energies approximately 50 to 100 times that of neutral atoms generated from thermal evaporation sources. This additional energy is thought to be the reason for the
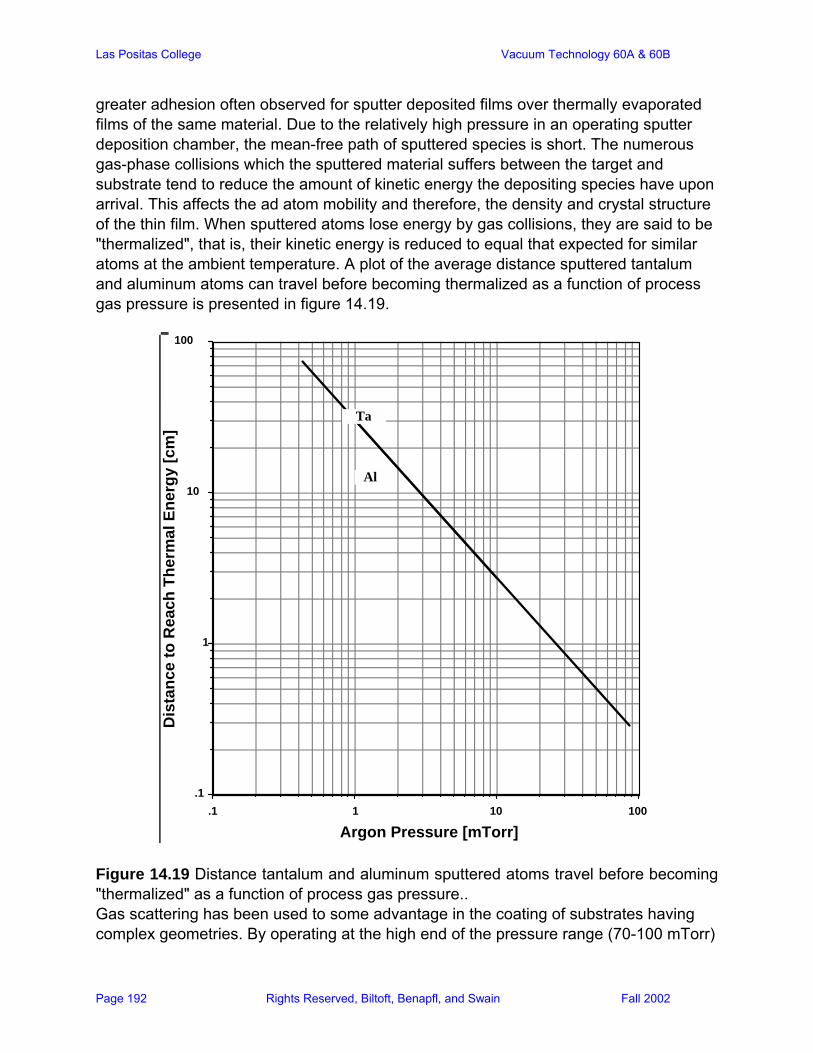
Las Positas College Vacuum Technology 60A & 60B
Page 192 Rights Reserved, Biltoft, Benapfl, and Swain Fall 2002
greater adhesion often observed for sputter deposited films over thermally evaporated films of the same material. Due to the relatively high pressure in an operating sputter deposition chamber, the mean-free path of sputtered species is short. The numerous gas-phase collisions which the sputtered material suffers between the target and substrate tend to reduce the amount of kinetic energy the depositing species have upon arrival. This affects the ad atom mobility and therefore, the density and crystal structure of the thin film. When sputtered atoms lose energy by gas collisions, they are said to be "thermalized", that is, their kinetic energy is reduced to equal that expected for similar atoms at the ambient temperature. A plot of the average distance sputtered tantalum and aluminum atoms can travel before becoming thermalized as a function of process gas pressure is presented in figure 14.19.
100101.1.1
1
10
100
Argon Pressure [mTorr]
Dis
tanc
e to
Rea
ch T
herm
al E
nerg
y [c
m]
Ta
Al
Figure 14.19 Distance tantalum and aluminum sputtered atoms travel before becoming "thermalized" as a function of process gas pressure.. Gas scattering has been used to some advantage in the coating of substrates having complex geometries. By operating at the high end of the pressure range (70-100 mTorr)
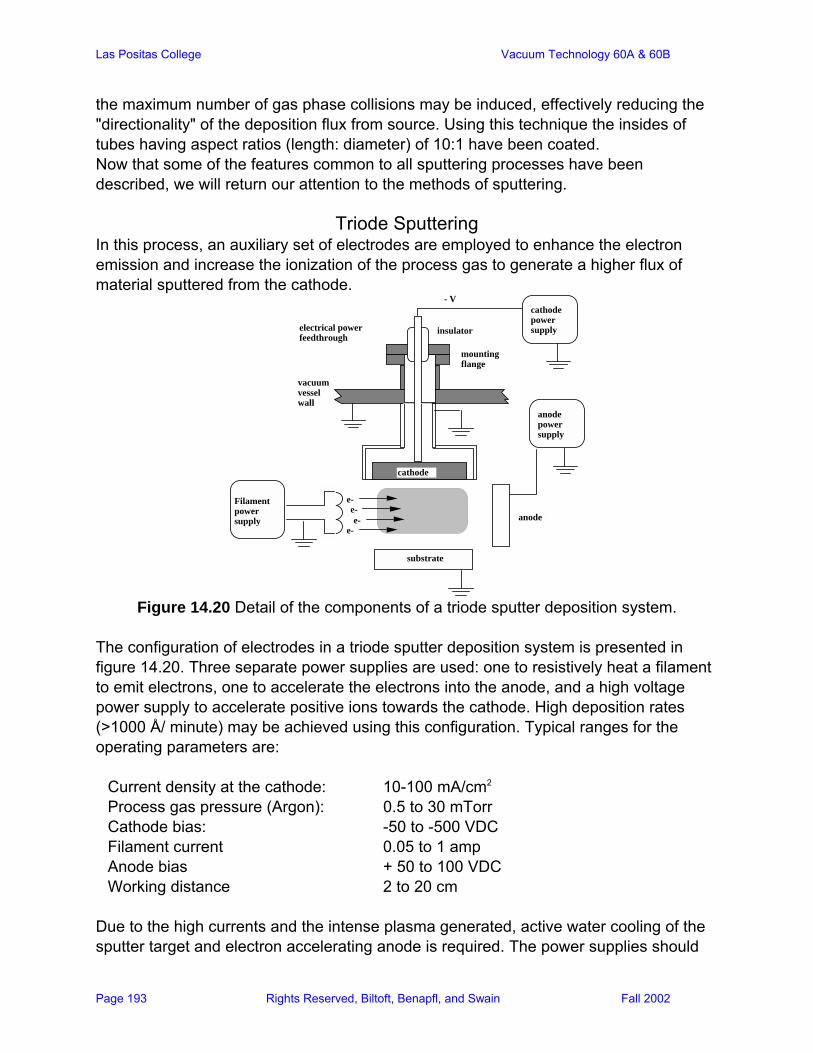
Las Positas College Vacuum Technology 60A & 60B
Page 193 Rights Reserved, Biltoft, Benapfl, and Swain Fall 2002
the maximum number of gas phase collisions may be induced, effectively reducing the "directionality" of the deposition flux from source. Using this technique the insides of tubes having aspect ratios (length: diameter) of 10:1 have been coated. Now that some of the features common to all sputtering processes have been described, we will return our attention to the methods of sputtering.
Triode Sputtering In this process, an auxiliary set of electrodes are employed to enhance the electron emission and increase the ionization of the process gas to generate a higher flux of material sputtered from the cathode.
cathode
anode
vacuum vessel wall
mounting flange
electrical power feedthrough
insulator
cathode power supply
- V
Filament power supply
e-e-e-
e-
anode power supply
substrate
Figure 14.20 Detail of the components of a triode sputter deposition system.
The configuration of electrodes in a triode sputter deposition system is presented in figure 14.20. Three separate power supplies are used: one to resistively heat a filament to emit electrons, one to accelerate the electrons into the anode, and a high voltage power supply to accelerate positive ions towards the cathode. High deposition rates (>1000 Å/ minute) may be achieved using this configuration. Typical ranges for the operating parameters are:
Current density at the cathode: 10-100 mA/cm2
Process gas pressure (Argon): 0.5 to 30 mTorr Cathode bias: -50 to -500 VDC Filament current 0.05 to 1 amp Anode bias + 50 to 100 VDC Working distance 2 to 20 cm
Due to the high currents and the intense plasma generated, active water cooling of the sputter target and electron accelerating anode is required. The power supplies should
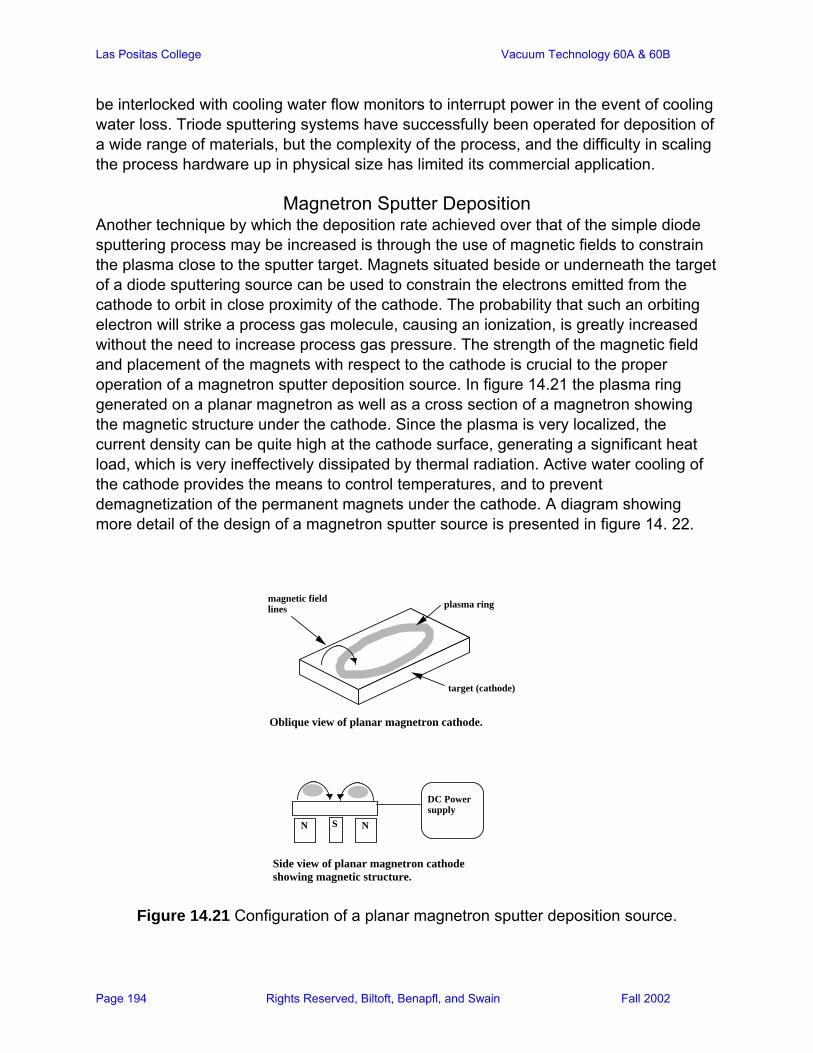
Las Positas College Vacuum Technology 60A & 60B
Page 194 Rights Reserved, Biltoft, Benapfl, and Swain Fall 2002
be interlocked with cooling water flow monitors to interrupt power in the event of cooling water loss. Triode sputtering systems have successfully been operated for deposition of a wide range of materials, but the complexity of the process, and the difficulty in scaling the process hardware up in physical size has limited its commercial application.
Magnetron Sputter Deposition Another technique by which the deposition rate achieved over that of the simple diode sputtering process may be increased is through the use of magnetic fields to constrain the plasma close to the sputter target. Magnets situated beside or underneath the target of a diode sputtering source can be used to constrain the electrons emitted from the cathode to orbit in close proximity of the cathode. The probability that such an orbiting electron will strike a process gas molecule, causing an ionization, is greatly increased without the need to increase process gas pressure. The strength of the magnetic field and placement of the magnets with respect to the cathode is crucial to the proper operation of a magnetron sputter deposition source. In figure 14.21 the plasma ring generated on a planar magnetron as well as a cross section of a magnetron showing the magnetic structure under the cathode. Since the plasma is very localized, the current density can be quite high at the cathode surface, generating a significant heat load, which is very ineffectively dissipated by thermal radiation. Active water cooling of the cathode provides the means to control temperatures, and to prevent demagnetization of the permanent magnets under the cathode. A diagram showing more detail of the design of a magnetron sputter source is presented in figure 14. 22.
N S N
DC Power supply
target (cathode)
plasma ringmagnetic field lines
Oblique view of planar magnetron cathode.
Side view of planar magnetron cathode showing magnetic structure.
Figure 14.21 Configuration of a planar magnetron sputter deposition source.

Las Positas College Vacuum Technology 60A & 60B
Page 195 Rights Reserved, Biltoft, Benapfl, and Swain Fall 2002
The DC magnetron sputter deposition source has found wide application in industry. Deposition systems using this source range from desktop units for deposition of thin films for prototype electronic devices to 150' long architectural glass coating chambers which use arrays of magnetron sputter guns to coat 4 x 8 foot sheets of glass with several layers in a single pass. Sputtering of all areas of the gun except the cathode is prevented by the use of a ground plane shield (see figure 14.22). This shield, along with the water cooling lines are electrically insulated from the high voltage applied to the cathode through the use of ceramic insulating spacers. It should be noted that in some magnetron sputter guns the water lines (often made from formed stainless steel bellows) are used to conduct high voltage power to the cathode, and are electrically isolated at the vacuum feed through. Under some circumstances, sputtering of these biased lines may occur, which has been known to lead to rupture of the water cooling lines within the vacuum vessel.
N
S
N
SS
N
S S
water cooling circuit
magnetic field lines
sputtered material
ground plane shield
Figure 14.22 Magnetic structure and cooling circuit of a magnetron sputter gun
In addition to the planar magnetron configuration, there has been developed a cylindrical or "Post" magnetron source which may be used to deposit thin films onto the inner surfaces of tubes (see figures 14.22 and 14.23). Electromagnets may be used instead of permanent magnets to generate the magnetic field which constrains the electrons to orbit near the cathode. Using electromagnets it is possible to vary the position of the plasma with respect to the cathode by changing the field strength in sets of magnets. If the magnets are mounted outside the vacuum environment, as shown in figure 14. Sample Problem:
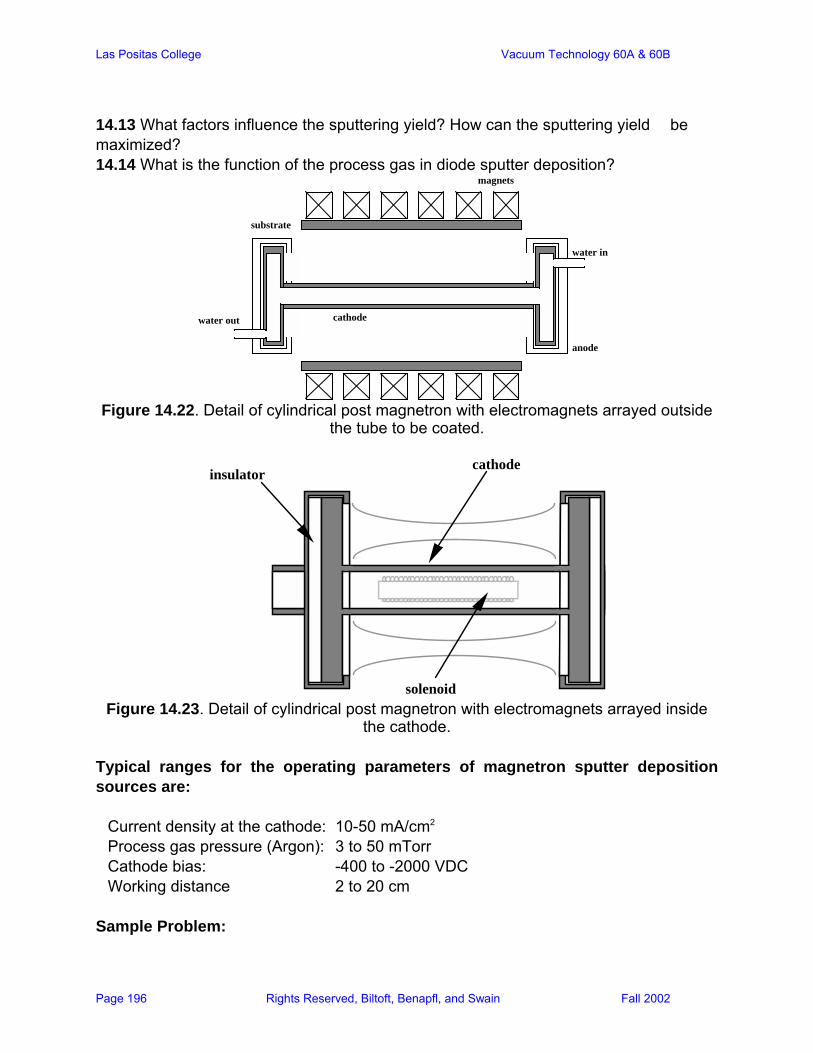
Las Positas College Vacuum Technology 60A & 60B
Page 196 Rights Reserved, Biltoft, Benapfl, and Swain Fall 2002
14.13 What factors influence the sputtering yield? How can the sputtering yield be maximized? 14.14 What is the function of the process gas in diode sputter deposition?
magnets
water in
anode
cathodewater out
substrate
Figure 14.22. Detail of cylindrical post magnetron with electromagnets arrayed outside
the tube to be coated.
cathodeinsulator
solenoid Figure 14.23. Detail of cylindrical post magnetron with electromagnets arrayed inside
the cathode. Typical ranges for the operating parameters of magnetron sputter deposition sources are:
Current density at the cathode: 10-50 mA/cm2
Process gas pressure (Argon): 3 to 50 mTorr Cathode bias: -400 to -2000 VDC Working distance 2 to 20 cm
Sample Problem:
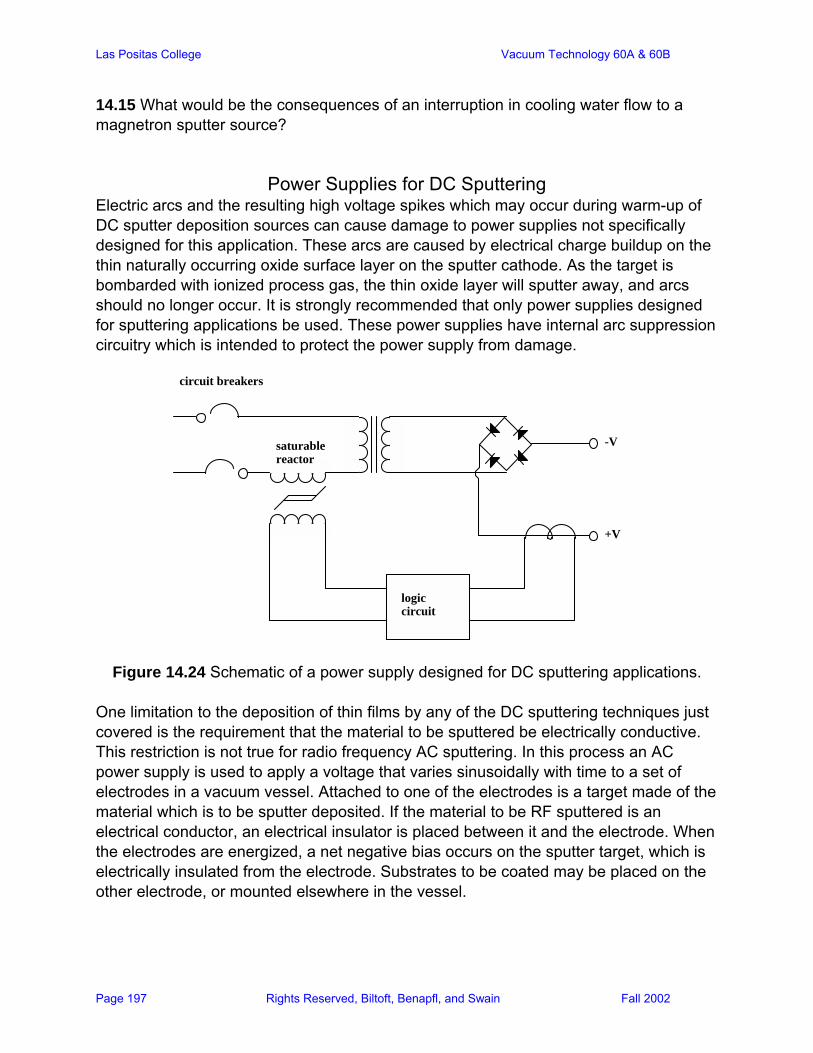
Las Positas College Vacuum Technology 60A & 60B
Page 197 Rights Reserved, Biltoft, Benapfl, and Swain Fall 2002
14.15 What would be the consequences of an interruption in cooling water flow to a magnetron sputter source?
Power Supplies for DC Sputtering
Electric arcs and the resulting high voltage spikes which may occur during warm-up of DC sputter deposition sources can cause damage to power supplies not specifically designed for this application. These arcs are caused by electrical charge buildup on the thin naturally occurring oxide surface layer on the sputter cathode. As the target is bombarded with ionized process gas, the thin oxide layer will sputter away, and arcs should no longer occur. It is strongly recommended that only power supplies designed for sputtering applications be used. These power supplies have internal arc suppression circuitry which is intended to protect the power supply from damage.
logic circuit
saturable reactor
circuit breakers
-V
+V
Figure 14.24 Schematic of a power supply designed for DC sputtering applications. One limitation to the deposition of thin films by any of the DC sputtering techniques just covered is the requirement that the material to be sputtered be electrically conductive. This restriction is not true for radio frequency AC sputtering. In this process an AC power supply is used to apply a voltage that varies sinusoidally with time to a set of electrodes in a vacuum vessel. Attached to one of the electrodes is a target made of the material which is to be sputter deposited. If the material to be RF sputtered is an electrical conductor, an electrical insulator is placed between it and the electrode. When the electrodes are energized, a net negative bias occurs on the sputter target, which is electrically insulated from the electrode. Substrates to be coated may be placed on the other electrode, or mounted elsewhere in the vessel.
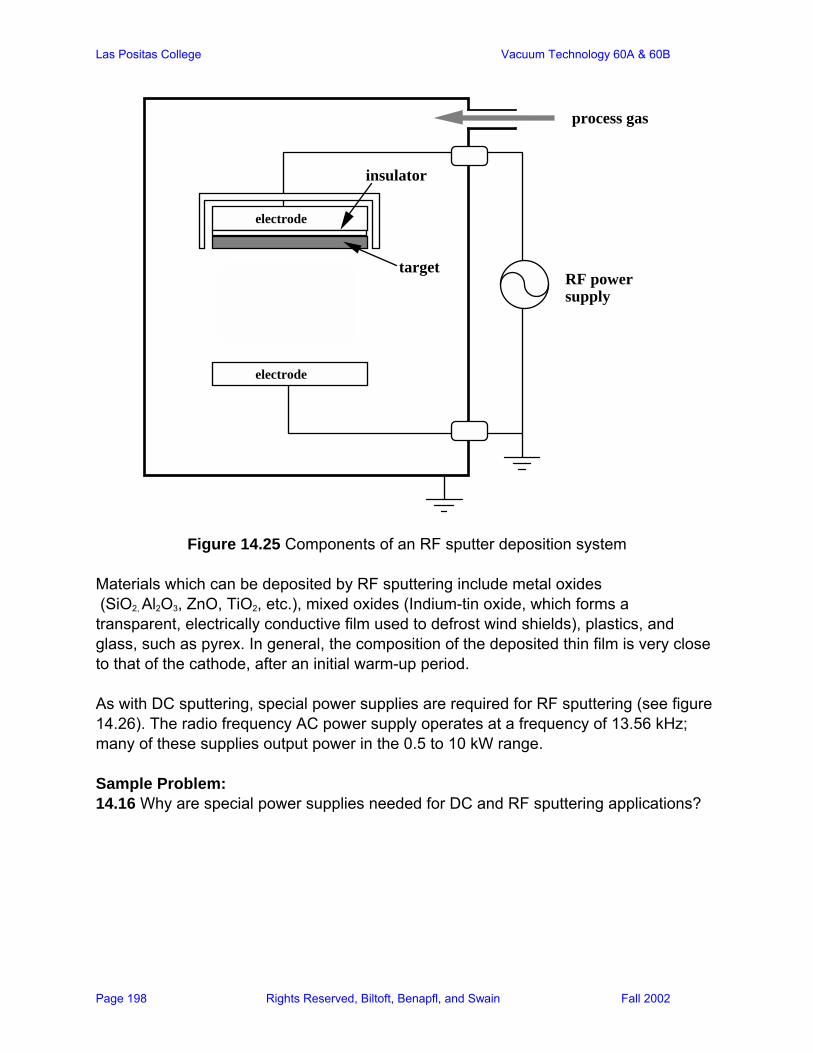
Las Positas College Vacuum Technology 60A & 60B
Page 198 Rights Reserved, Biltoft, Benapfl, and Swain Fall 2002
RF power supply
electrode
electrode
target
process gas
insulator
Figure 14.25 Components of an RF sputter deposition system Materials which can be deposited by RF sputtering include metal oxides (SiO2, Al2O3, ZnO, TiO2, etc.), mixed oxides (Indium-tin oxide, which forms a transparent, electrically conductive film used to defrost wind shields), plastics, and glass, such as pyrex. In general, the composition of the deposited thin film is very close to that of the cathode, after an initial warm-up period. As with DC sputtering, special power supplies are required for RF sputtering (see figure 14.26). The radio frequency AC power supply operates at a frequency of 13.56 kHz; many of these supplies output power in the 0.5 to 10 kW range. Sample Problem: 14.16 Why are special power supplies needed for DC and RF sputtering applications?

Las Positas College Vacuum Technology 60A & 60B
Page 199 Rights Reserved, Biltoft, Benapfl, and Swain Fall 2002
RF power supply
inductive coupling
impedance matching network
+/- V
+/- V
output to electrodes
Figure 14.26 Components of an RF sputter deposition system.
Ion-Beam Sputtering
In this sputter deposition process, special ion sources, such as that presented in figure 14.27 are used to generate ions and accelerate these ions towards a sputtering target. The material sputtered from the target by impact of the energetic ions forms the coating on the substrate.
process gas inlet
magnets
anodecathode
accelerator grid
screen grid
Figure 14.27 Kaufman ion source used in ion-beam sputtering. In the Kaufman ion source, electrons emitted from the heated filament (cathode) are attracted to the anode, but the strong magnetic field prevents this. Gas molecules impacted by the oscillating electrons become ionized, and, being positively charged, are attracted to the negatively biased accelerator grid. By controlling the bias applied to the screen and accelerator grids, a certain amount of ion beam focusing may be accomplished.
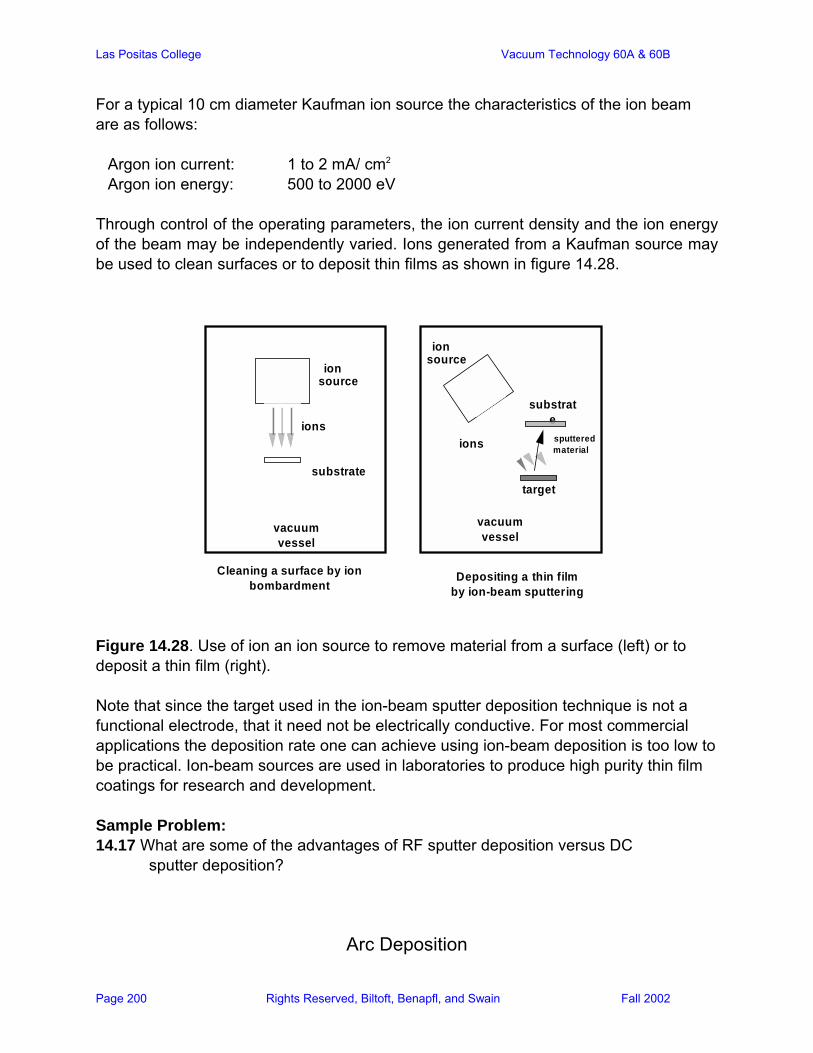
Las Positas College Vacuum Technology 60A & 60B
Page 200 Rights Reserved, Biltoft, Benapfl, and Swain Fall 2002
For a typical 10 cm diameter Kaufman ion source the characteristics of the ion beam are as follows:
Argon ion current: 1 to 2 mA/ cm2
Argon ion energy: 500 to 2000 eV Through control of the operating parameters, the ion current density and the ion energy of the beam may be independently varied. Ions generated from a Kaufman source may be used to clean surfaces or to deposit thin films as shown in figure 14.28.
ion source
substrate
ion source
substrate ions
ions
vacuum vessel
vacuum vessel
Cleaning a surface by ion bombardment
Depositing a thin film by ion-beam sputtering
target
sputtered material
Figure 14.28. Use of ion an ion source to remove material from a surface (left) or to deposit a thin film (right). Note that since the target used in the ion-beam sputter deposition technique is not a functional electrode, that it need not be electrically conductive. For most commercial applications the deposition rate one can achieve using ion-beam deposition is too low to be practical. Ion-beam sources are used in laboratories to produce high purity thin film coatings for research and development. Sample Problem: 14.17 What are some of the advantages of RF sputter deposition versus DC sputter deposition?
Arc Deposition
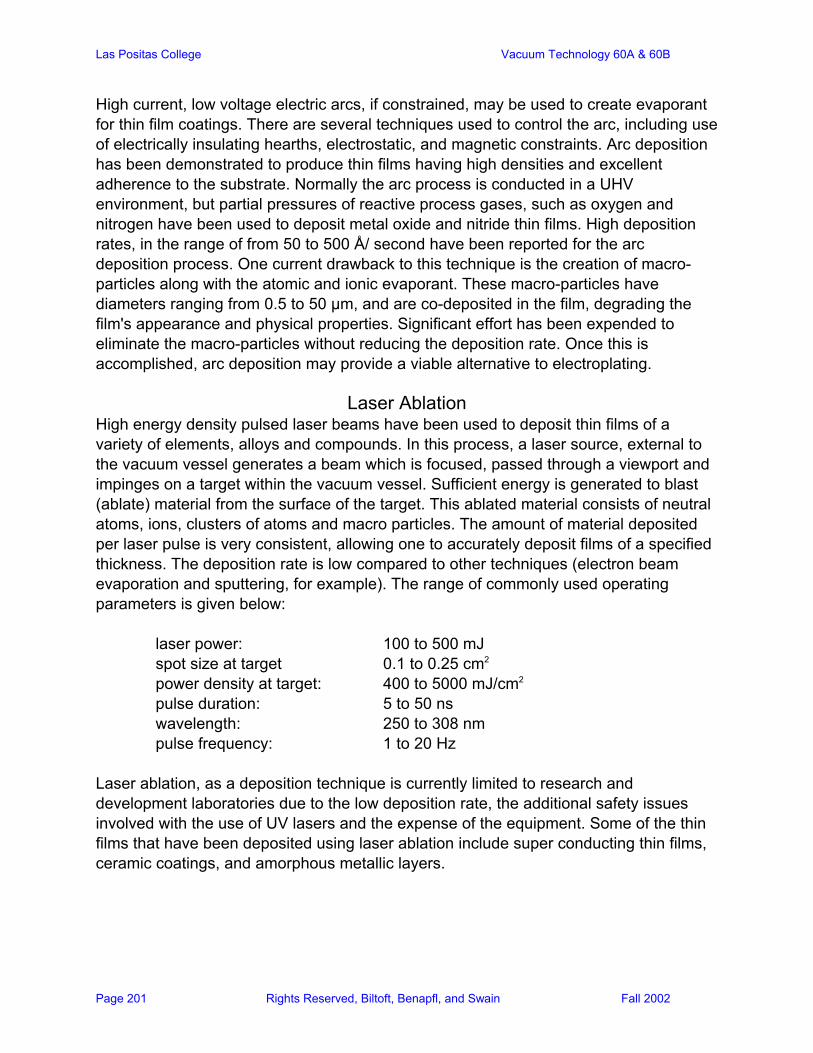
Las Positas College Vacuum Technology 60A & 60B
Page 201 Rights Reserved, Biltoft, Benapfl, and Swain Fall 2002
High current, low voltage electric arcs, if constrained, may be used to create evaporant for thin film coatings. There are several techniques used to control the arc, including use of electrically insulating hearths, electrostatic, and magnetic constraints. Arc deposition has been demonstrated to produce thin films having high densities and excellent adherence to the substrate. Normally the arc process is conducted in a UHV environment, but partial pressures of reactive process gases, such as oxygen and nitrogen have been used to deposit metal oxide and nitride thin films. High deposition rates, in the range of from 50 to 500 Å/ second have been reported for the arc deposition process. One current drawback to this technique is the creation of macro-particles along with the atomic and ionic evaporant. These macro-particles have diameters ranging from 0.5 to 50 µm, and are co-deposited in the film, degrading the film's appearance and physical properties. Significant effort has been expended to eliminate the macro-particles without reducing the deposition rate. Once this is accomplished, arc deposition may provide a viable alternative to electroplating.
Laser Ablation High energy density pulsed laser beams have been used to deposit thin films of a variety of elements, alloys and compounds. In this process, a laser source, external to the vacuum vessel generates a beam which is focused, passed through a viewport and impinges on a target within the vacuum vessel. Sufficient energy is generated to blast (ablate) material from the surface of the target. This ablated material consists of neutral atoms, ions, clusters of atoms and macro particles. The amount of material deposited per laser pulse is very consistent, allowing one to accurately deposit films of a specified thickness. The deposition rate is low compared to other techniques (electron beam evaporation and sputtering, for example). The range of commonly used operating parameters is given below:
laser power: 100 to 500 mJ spot size at target 0.1 to 0.25 cm2 power density at target: 400 to 5000 mJ/cm2
pulse duration: 5 to 50 ns wavelength: 250 to 308 nm pulse frequency: 1 to 20 Hz
Laser ablation, as a deposition technique is currently limited to research and development laboratories due to the low deposition rate, the additional safety issues involved with the use of UV lasers and the expense of the equipment. Some of the thin films that have been deposited using laser ablation include super conducting thin films, ceramic coatings, and amorphous metallic layers.
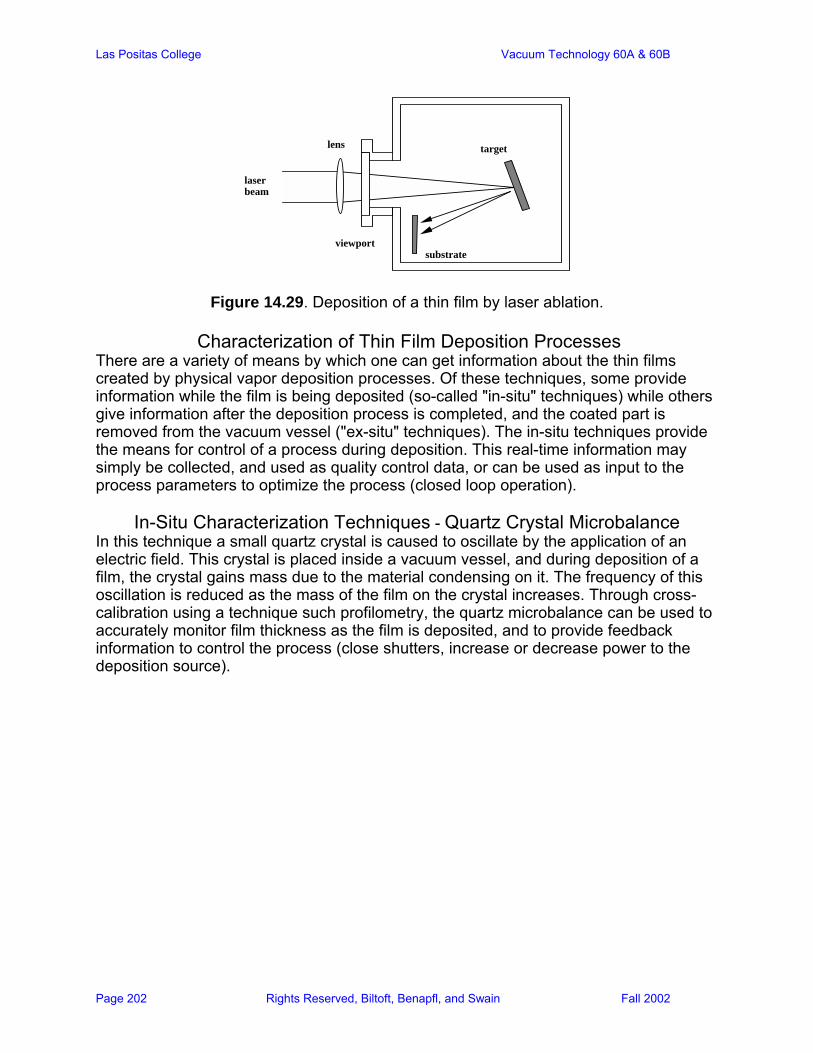
Las Positas College Vacuum Technology 60A & 60B
Page 202 Rights Reserved, Biltoft, Benapfl, and Swain Fall 2002
laser beam
lens
viewport
target
substrate
Figure 14.29. Deposition of a thin film by laser ablation.
Characterization of Thin Film Deposition Processes
There are a variety of means by which one can get information about the thin films created by physical vapor deposition processes. Of these techniques, some provide information while the film is being deposited (so-called "in-situ" techniques) while others give information after the deposition process is completed, and the coated part is removed from the vacuum vessel ("ex-situ" techniques). The in-situ techniques provide the means for control of a process during deposition. This real-time information may simply be collected, and used as quality control data, or can be used as input to the process parameters to optimize the process (closed loop operation).
In-Situ Characterization Techniques - Quartz Crystal Microbalance In this technique a small quartz crystal is caused to oscillate by the application of an electric field. This crystal is placed inside a vacuum vessel, and during deposition of a film, the crystal gains mass due to the material condensing on it. The frequency of this oscillation is reduced as the mass of the film on the crystal increases. Through cross-calibration using a technique such profilometry, the quartz microbalance can be used to accurately monitor film thickness as the film is deposited, and to provide feedback information to control the process (close shutters, increase or decrease power to the deposition source).
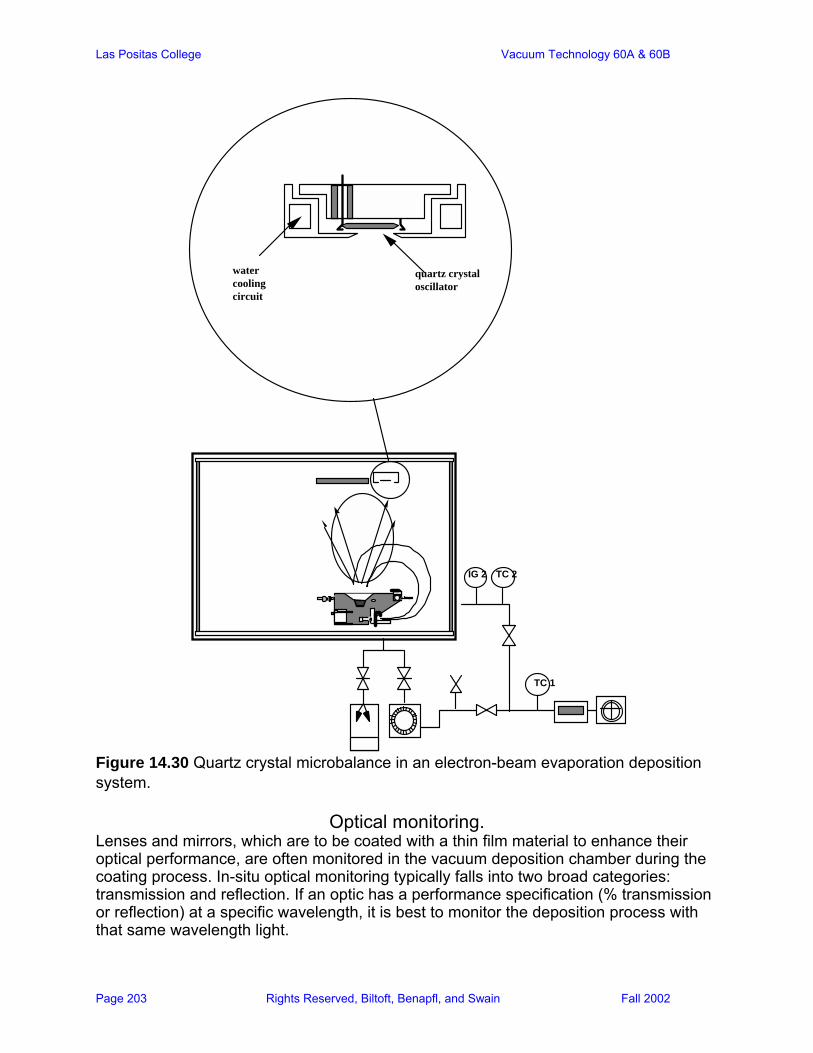
Las Positas College Vacuum Technology 60A & 60B
Page 203 Rights Reserved, Biltoft, Benapfl, and Swain Fall 2002
quartz crystal oscillator
water cooling circuit
TC 1
IG 2 TC 2
Figure 14.30 Quartz crystal microbalance in an electron-beam evaporation deposition system.
Optical monitoring.
Lenses and mirrors, which are to be coated with a thin film material to enhance their optical performance, are often monitored in the vacuum deposition chamber during the coating process. In-situ optical monitoring typically falls into two broad categories: transmission and reflection. If an optic has a performance specification (% transmission or reflection) at a specific wavelength, it is best to monitor the deposition process with that same wavelength light.

Las Positas College Vacuum Technology 60A & 60B
Page 204 Rights Reserved, Biltoft, Benapfl, and Swain Fall 2002
light source
viewport
substratedeposition sources
detector
viewport
light source
viewport
substratedeposition sources
detector
Figure 14.31 In-situ optical monitoring of the deposition process in transmission (top)
and reflection (bottom). Interpretation of in-situ reflectivity and transmission data can become complex. The effect of absorption and reflection of light by the glass viewport can affect the results. It is important to choose viewports having good transmission for the wavelength of light being used for the in-situ monitoring. Both reflection and transmission measurements can be used to monitor film thickness during the deposition. In the reflection method, the intensity of the reflected light will resemble a sine curve as the film grows. This is due to constructive interference between the light reflected from the surface of the film (If) and light reflected from the film/substrate interface (Is).
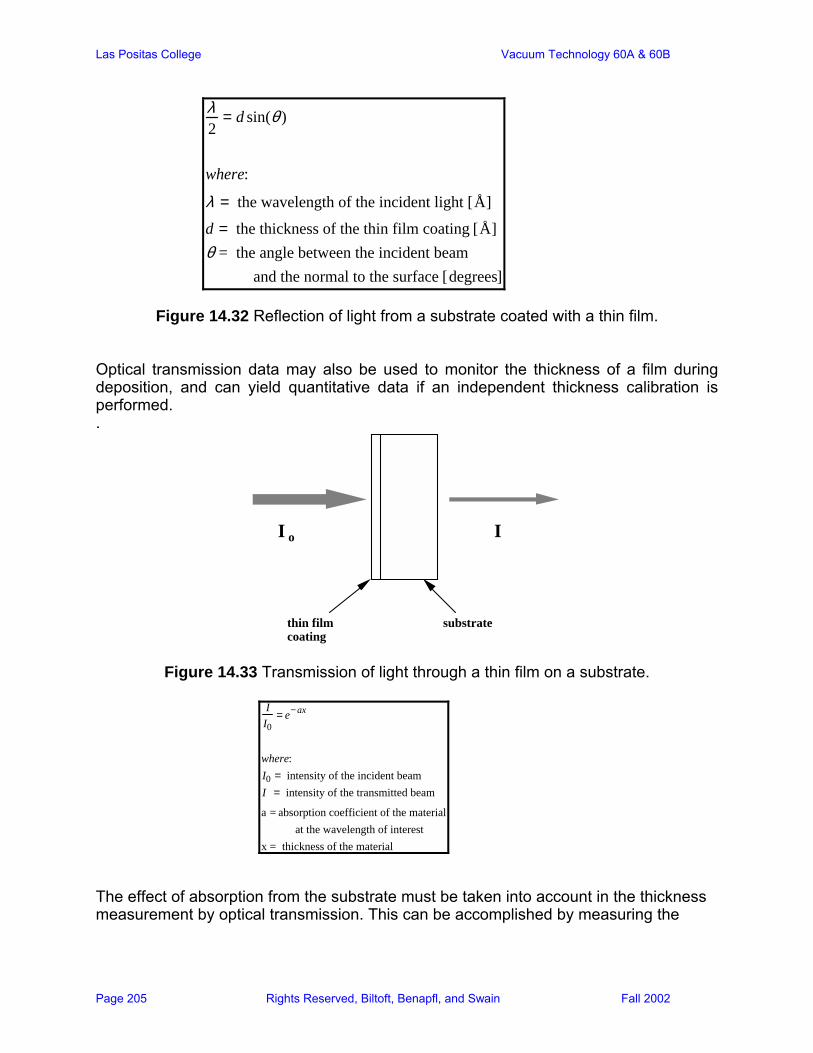
Las Positas College Vacuum Technology 60A & 60B
Page 205 Rights Reserved, Biltoft, Benapfl, and Swain Fall 2002
λ2
= d sin(θ )
where:
λ = the wavelength of the incident light [Å]
d = the thickness of the thin film coating [Å]θ = the angle between the incident beam
and the normal to the surface [degrees]
Figure 14.32 Reflection of light from a substrate coated with a thin film. Optical transmission data may also be used to monitor the thickness of a film during deposition, and can yield quantitative data if an independent thickness calibration is performed. .
I Io
substratethin film coating
Figure 14.33 Transmission of light through a thin film on a substrate.
II0
= e−ax
where:I0 = intensity of the incident beamI = intensity of the transmitted beam
a = absorption coefficient of the materialat the wavelength of interest
x = thickness of the material The effect of absorption from the substrate must be taken into account in the thickness measurement by optical transmission. This can be accomplished by measuring the
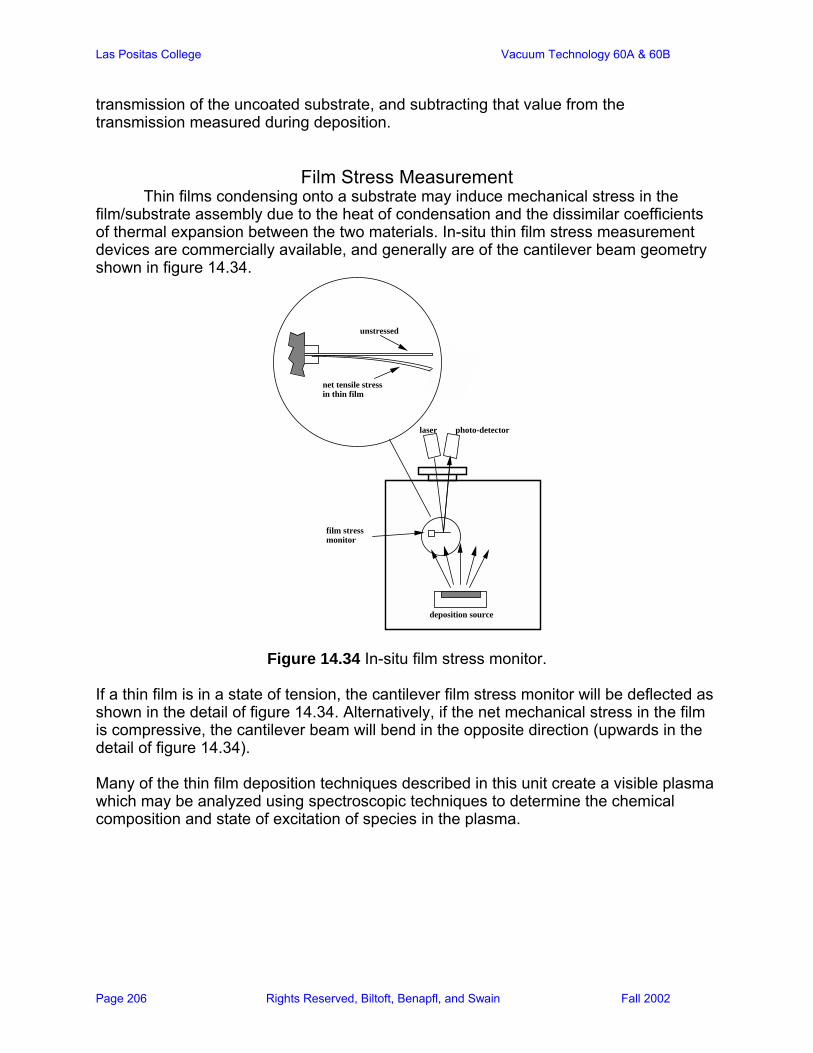
Las Positas College Vacuum Technology 60A & 60B
Page 206 Rights Reserved, Biltoft, Benapfl, and Swain Fall 2002
transmission of the uncoated substrate, and subtracting that value from the transmission measured during deposition.
Film Stress Measurement Thin films condensing onto a substrate may induce mechanical stress in the film/substrate assembly due to the heat of condensation and the dissimilar coefficients of thermal expansion between the two materials. In-situ thin film stress measurement devices are commercially available, and generally are of the cantilever beam geometry shown in figure 14.34.
deposition source
laser photo-detector
film stress monitor
unstressed
net tensile stress in thin film
Figure 14.34 In-situ film stress monitor. If a thin film is in a state of tension, the cantilever film stress monitor will be deflected as shown in the detail of figure 14.34. Alternatively, if the net mechanical stress in the film is compressive, the cantilever beam will bend in the opposite direction (upwards in the detail of figure 14.34). Many of the thin film deposition techniques described in this unit create a visible plasma which may be analyzed using spectroscopic techniques to determine the chemical composition and state of excitation of species in the plasma.

Las Positas College Vacuum Technology 60A & 60B
Page 207 Rights Reserved, Biltoft, Benapfl, and Swain Fall 2002
deposition source
optical spectrometer
plasma
substrate
Figure 14.35 Optical spectrometer used to monitor light emissions from the
plasma during the deposition of a thin film. In sputtering processes, for example, the optical emission can be monitored to establish the purity of the sputtering gas, or to determine when the native oxide layer has been sputtered off a target. The intensity of peaks in the spectra observed using this technique are proportional to the concentration of species in the plasma. One can select a spectral line of interest (the line at 4189 Å for oxygen) to monitor intensity as a function of sputtering time. In-situ monitors of this type are commercially available, and can provide feedback to control the deposition process, based on the intensity of a particular spectral feature.
Ex-situ Thin Film Characterization Techniques Care must be taken to prevent altering the thin film coating in the performance of ex-situ characterization techniques. In general, it is good practice to allow a coated substrate to cool to room temperature before venting the vacuum vessel. This minimizes the possibility of oxidation of the part. Thermal shock, due to rapid cooling caused by premature venting may cause films to tear or delaminate from the substrate, making them virtually useless for physical characterization purposes. Contamination of the coated substrate due to handling and storage should be kept to a minimum for best characterization results.
Contact Profilometry In this ex-situ characterization technique, the sample is prepared by masking off a portion of a smooth substrate, such as floatglass, then depositing a thin film onto the sample. This creates coated and uncoated areas ( a so-called "step slide") on the smooth substrate which can be used to determine film thickness. After the part is removed from the deposition system, a ruby or diamond tipped miniature stylus is scrolled across the sample.
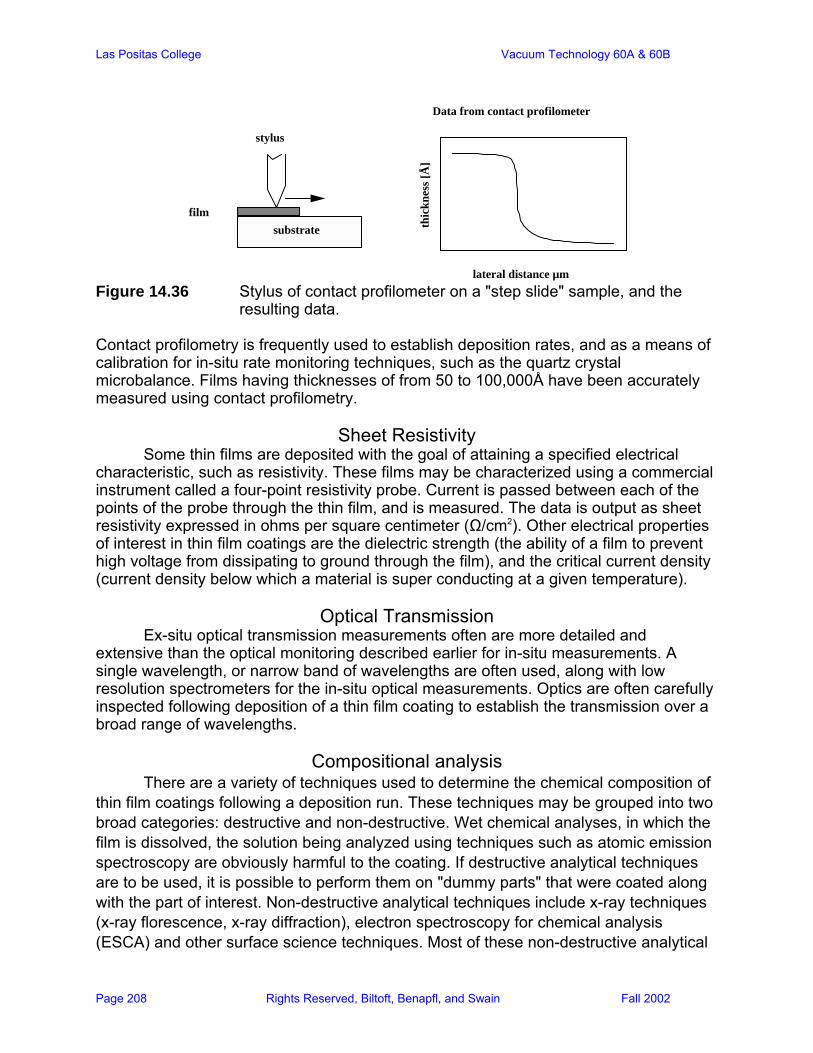
Las Positas College Vacuum Technology 60A & 60B
Page 208 Rights Reserved, Biltoft, Benapfl, and Swain Fall 2002
lateral distance µm
thic
knes
s [Å
]
stylus
filmsubstrate
Data from contact profilometer
Figure 14.36 Stylus of contact profilometer on a "step slide" sample, and the
resulting data. Contact profilometry is frequently used to establish deposition rates, and as a means of calibration for in-situ rate monitoring techniques, such as the quartz crystal microbalance. Films having thicknesses of from 50 to 100,000Å have been accurately measured using contact profilometry.
Sheet Resistivity Some thin films are deposited with the goal of attaining a specified electrical characteristic, such as resistivity. These films may be characterized using a commercial instrument called a four-point resistivity probe. Current is passed between each of the points of the probe through the thin film, and is measured. The data is output as sheet resistivity expressed in ohms per square centimeter (Ω/cm2). Other electrical properties of interest in thin film coatings are the dielectric strength (the ability of a film to prevent high voltage from dissipating to ground through the film), and the critical current density (current density below which a material is super conducting at a given temperature).
Optical Transmission Ex-situ optical transmission measurements often are more detailed and extensive than the optical monitoring described earlier for in-situ measurements. A single wavelength, or narrow band of wavelengths are often used, along with low resolution spectrometers for the in-situ optical measurements. Optics are often carefully inspected following deposition of a thin film coating to establish the transmission over a broad range of wavelengths.
Compositional analysis There are a variety of techniques used to determine the chemical composition of thin film coatings following a deposition run. These techniques may be grouped into two broad categories: destructive and non-destructive. Wet chemical analyses, in which the film is dissolved, the solution being analyzed using techniques such as atomic emission spectroscopy are obviously harmful to the coating. If destructive analytical techniques are to be used, it is possible to perform them on "dummy parts" that were coated along with the part of interest. Non-destructive analytical techniques include x-ray techniques (x-ray florescence, x-ray diffraction), electron spectroscopy for chemical analysis (ESCA) and other surface science techniques. Most of these non-destructive analytical
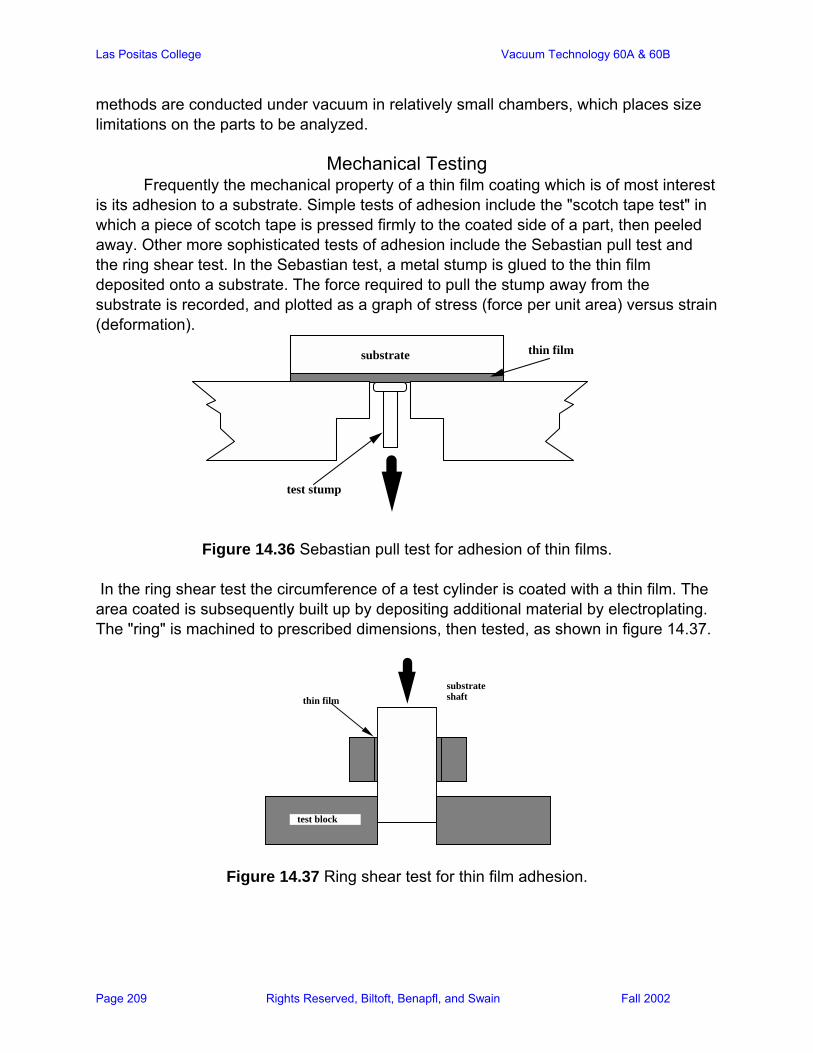
Las Positas College Vacuum Technology 60A & 60B
Page 209 Rights Reserved, Biltoft, Benapfl, and Swain Fall 2002
methods are conducted under vacuum in relatively small chambers, which places size limitations on the parts to be analyzed.
Mechanical Testing Frequently the mechanical property of a thin film coating which is of most interest is its adhesion to a substrate. Simple tests of adhesion include the "scotch tape test" in which a piece of scotch tape is pressed firmly to the coated side of a part, then peeled away. Other more sophisticated tests of adhesion include the Sebastian pull test and the ring shear test. In the Sebastian test, a metal stump is glued to the thin film deposited onto a substrate. The force required to pull the stump away from the substrate is recorded, and plotted as a graph of stress (force per unit area) versus strain (deformation).
thin filmsubstrate
test stump
Figure 14.36 Sebastian pull test for adhesion of thin films. In the ring shear test the circumference of a test cylinder is coated with a thin film. The area coated is subsequently built up by depositing additional material by electroplating. The "ring" is machined to prescribed dimensions, then tested, as shown in figure 14.37.
thin filmsubstrate shaft
test block
Figure 14.37 Ring shear test for thin film adhesion.
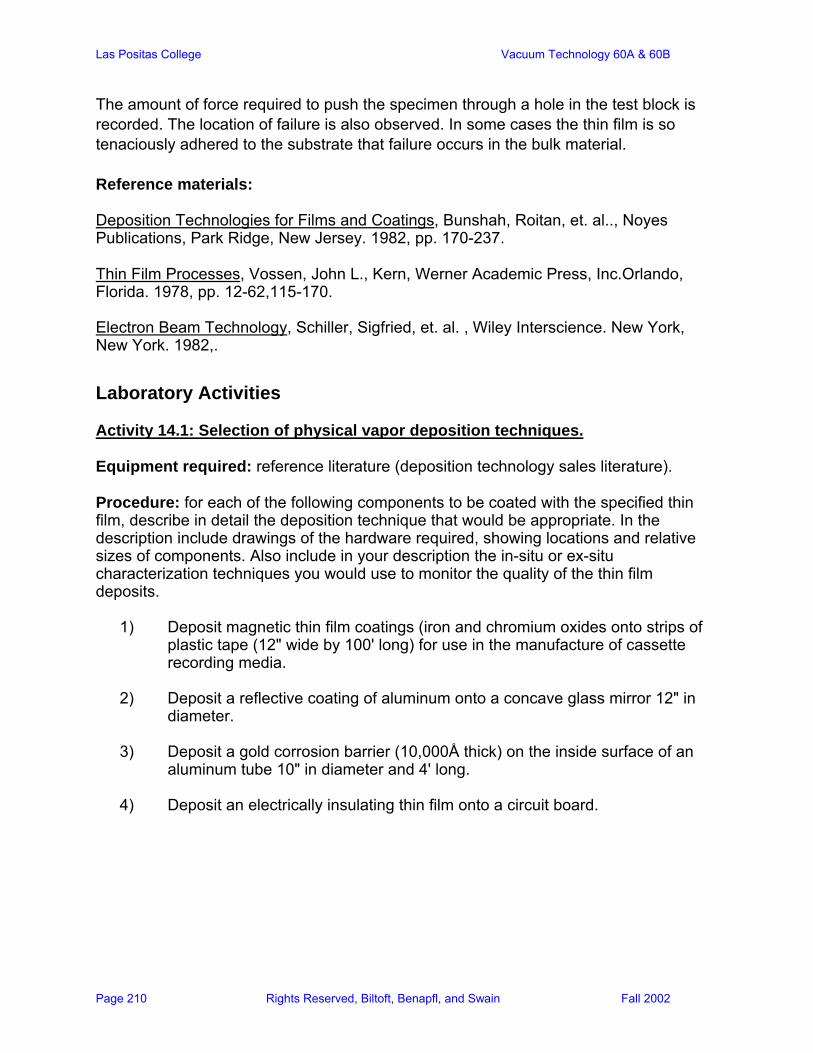
Las Positas College Vacuum Technology 60A & 60B
Page 210 Rights Reserved, Biltoft, Benapfl, and Swain Fall 2002
The amount of force required to push the specimen through a hole in the test block is recorded. The location of failure is also observed. In some cases the thin film is so tenaciously adhered to the substrate that failure occurs in the bulk material. Reference materials: Deposition Technologies for Films and Coatings, Bunshah, Roitan, et. al.., Noyes Publications, Park Ridge, New Jersey. 1982, pp. 170-237. Thin Film Processes, Vossen, John L., Kern, Werner Academic Press, Inc.Orlando, Florida. 1978, pp. 12-62,115-170. Electron Beam Technology, Schiller, Sigfried, et. al. , Wiley Interscience. New York, New York. 1982,.
Laboratory Activities Activity 14.1: Selection of physical vapor deposition techniques. Equipment required: reference literature (deposition technology sales literature). Procedure: for each of the following components to be coated with the specified thin film, describe in detail the deposition technique that would be appropriate. In the description include drawings of the hardware required, showing locations and relative sizes of components. Also include in your description the in-situ or ex-situ characterization techniques you would use to monitor the quality of the thin film deposits.
1) Deposit magnetic thin film coatings (iron and chromium oxides onto strips of plastic tape (12" wide by 100' long) for use in the manufacture of cassette recording media.
2) Deposit a reflective coating of aluminum onto a concave glass mirror 12" in
diameter. 3) Deposit a gold corrosion barrier (10,000Å thick) on the inside surface of an
aluminum tube 10" in diameter and 4' long. 4) Deposit an electrically insulating thin film onto a circuit board.
Las Positas College Vacuum Technology 60A & 60B
Page 211 Rights Reserved, Biltoft, Benapfl, and Swain Fall 2002
Experiment 14.1 Deposition of a thin film by electrical resistance heated thermal evaporation. Equipment required: small vacuum vessel or bell jar vacuum system with Feed throughs and internal hardware for deposition of thin films by resistance heated thermal evaporation (see figure 14.3). A low voltage power supply (5 to 40 VDC, 10 to 50 A) with power leads compatible with power Feed throughs on the vacuum vessel. Procedure: Assemble the equipment as shown in figure 14.3. Make certain the electrical connections are secure, and that the vessel and power supply are both safely grounded. Prior to any experimental work, have the laboratory instructor inspect the vacuum vessel and power supply. Before pump down mount at least one substrate (glass microscope slides work well for this) on the opposite side of the shutter from the deposition source. Load the source with an appropriate amount of charge material (aluminum). Evacuate the vessel and conduct the thermal evaporation. Allow the filament to cool for 30 minutes after the power is turned off prior to venting the vessel. Upon completion of experimental work shut down the vacuum system safely and write a lab report describing your experiment. Include any characterization of the thin film you perform. Experiment 14.2: Deposition of a thin film by DC diode sputtering. Equipment required: small vacuum vessel or bell jar vacuum system with electrical power feed throughs; a diode sputtering power supply with appropriate power leads; a copper cathode and an aluminum cathode; a bottle of compressed Argon with regulator; a leak valve. Procedure: Assemble the equipment as shown in figure 14.38. Make certain the electrical connections are secure, and that the vessel and power supply are both safely grounded. Prior to any experimental work, have the laboratory instructor inspect the vessel for safety. Evacuate the vessel to a pressure of less than 5 x 10⁻⁵Torr. Before proceeding, turn off the ion gauge. The next task is to throttle the high vacuum pump to control the flow of process gas through the system. If an iris valve is installed between the inlet of the high vacuum pump and the vessel, close it approximately 95%. In the absence of an iris valve, close the gate valve almost completely. Use the leak valve to inject process gas into the vessel. The goal here is to achieve a steady pressure of between 5 to 50 mTorr of Argon.

Las Positas College Vacuum Technology 60A & 60B
Page 212 Rights Reserved, Biltoft, Benapfl, and Swain Fall 2002
TC 1
IG 2
deposition shielding
power supply
leak valve
Ar
cathode
electrically insulating support
viewport
TC 2-V
Figure 14.38 Experimental setup for DC diode sputtering.
Once a stable process gas pressure is established, turn on the sputter source power supply and slowly increase the negative bias applied to the cathode. A glow discharge should appear at an applied bias of from 500 to 800 V. Note the color and distribution of the plasma. Allow the cathode to sputter for ten minutes. Turn the sputter source power supply down to zero volts and shut it off. Allow the system to cool for 30 minutes. Vent the vessel and inspect the cathode and substrate. Exchange the copper cathode for the aluminum cathode and repeat the sputtering experiment. Upon completion of all experimental work, shut the vacuum system down safely, venting all pumps. Write a report of your observations. Discussion questions:
1. What causes the plasma to be a different color when different cathodes are sputtered?
2. Why does the cathode heat up during sputtering?
3. What useful applications can you imagine for this process?