Embed Size (px)
Citation preview
8/7/2019 ValueUtilityGIS_WhitePaper
http://slidepdf.com/reader/full/valueutilitygiswhitepaper 1/15
WH
ITE PAPER
The Value of
a Utility GISImproving Service Reliability, Reducing Costs, andManaging Infrastructure with Geospatial Solutions

8/7/2019 ValueUtilityGIS_WhitePaper
http://slidepdf.com/reader/full/valueutilitygiswhitepaper 2/15
The Value of a Utility GIS
i
Contents
1. Introduction ................................................................................................................. 1 2. Industry ROI Analysis .................................................................................................. 2 3. Geospatial Infrastructure Solutions ............................................................................. 3 4. Case Studies ............................................................................................................... 4
4.1. Design and Analysis ........................................................................................................................ 4 4.2. Enterprise Access ............................................................................................................................ 5 4.3. Enterprise Operations ...................................................................................................................... 8
5. Geospatial Technology: Platform for Solutions ......................................................... 11
6. References ................................................................................................................ 12

8/7/2019 ValueUtilityGIS_WhitePaper
http://slidepdf.com/reader/full/valueutilitygiswhitepaper 3/15
The Value of a Utility GIS
1
1. Introduction
Utilities are striving to decrease their operating costs to increase their revenues, while improving customerservice at the same time. However, market pressures such as safety, reliability, critical infrastructure
protection, regulatory compliance, aging infrastructure, and process improvements continue to increasethe cost of operations. Geospatial infrastructure solutions provide utility and communications companieswith many benefits, such as improving service reliability, reducing costs, and managing infrastructure.Geospatial infrastructure solutions are not just for distribution and operation maps, but they can alsomaintain and manage the facility network model. However, according to IDC and Daratech, only one totwo percent of the $1.16 trillion spent globally on IT projects is spent on geospatial technology. Why isthis? Executives realize that IT is not just critical to running business operations, but also capable ofcreating significant economic and strategic benefits. Today there is huge resistance to long-term projects,so companies are breaking big projects into several smaller projects. The trends of today are toimplement smaller projects, show results, and then implement more. This allows companies to minimize,mitigate, and manage risks much more effectively.
Approximately 90 percent of corporations conduct a return on investment (ROI) analysis before theymake any large-scale investment. How can companies prove the ROI business case for geospatialinfrastructure solutions? Industry studies have shown the downstream applications that leverage thegeospatial network model – outage management, mobile workforce management, engineering networkanalysis, customer reporting, and work and asset management – deliver real results that improve thebottom line. The benefits increase as the enterprise implements more geospatial data. This white paperpresents real-world examples along with the resulting benefits.

8/7/2019 ValueUtilityGIS_WhitePaper
http://slidepdf.com/reader/full/valueutilitygiswhitepaper 4/15
The Value of a Utility GIS
2
2. Industry ROI Analysis
A utility can gain more benefits when it implements additional operating tools through geospatialtechnology. A geospatial infrastructure solution has a benefit-to-cost ratio of 1:1. If this solution is used to
automate the company’s planning and engineering departments, then the benefit-to-cost ratio doubles to2:1. If the company creates a common database for its geospatial infrastructure solution and thenintegrates that solution throughout the enterprise providing data to employees companywide, the benefit-to-cost ratio rises to 4:1. If the company then expands the network model from the geospatialinfrastructure solution to network operations and maintenance, the benefit-to-cost ratio goes beyondknown studies (Figure 1).
Figure 1: As a utility expands its use of the geospatial infrastructure data, the benefit-to-cost ratio continues to increase.

8/7/2019 ValueUtilityGIS_WhitePaper
http://slidepdf.com/reader/full/valueutilitygiswhitepaper 5/15
The Value of a Utility GIS
3
3. Geospatial Infrastructure Solutions
Geospatial technology is an enabler, not an end in and of itself. Traditional geographic informationsystems (GIS) focused mainly on the production of a map of the facilities, which provided no real returnon investment. To maximize ROI and benefits, the geospatial information must be integrated into the IT
infrastructure. A geospatial infrastructure management solution provides a much broader scope thantraditional, general purpose automated mapping, facility management, and GIS. It integrates withoperational support and service-delivery applications, enabling these systems to cooperate seamlessly tomanage the planning, design, construction, operations, maintenance, and emergency response functionsof a utility or communications company, as well as transportation and government agencies. Itincorporates complete deployment of geospatial infrastructure data across the enterprise with fullintegration at all levels of systems, applications, access, view, and update. Integrating geospatialinfrastructure solutions with other delivery systems is essential to staying competitive, providing significantbenefits – such as improved productivity, better data and reliability, and improved and real-time dataaccess – and maximizing return on investment.

8/7/2019 ValueUtilityGIS_WhitePaper
http://slidepdf.com/reader/full/valueutilitygiswhitepaper 6/15
The Value of a Utility GIS
4
4. Case Studies
Every utility has different operating conditions that can affect the results after the implementation andintegration of a geospatial infrastructure solution. Local environments will affect the way systems are used
and the extent of benefits achieved. Studying how utilities use geospatial technology reveals its significantbenefits. Every utility pursues combinations of different activities to achieve similar levels of benefits. Thefollowing examples support cost/benefit study discussions and indicate how a utility can benefit fromimplementing specific applications.
4.1. Design and Analysis
Design is becoming an encapsulated, one-person job. Sophisticated software assists the service planneror designer in several areas. As components are selected, compatible units automatically generate bills ofmaterial for cost estimation and feeding material management systems. Engineering design calculationtools can assist with or validate designs. More extensive network analysis tools can evaluate the newdesign’s impact on the distribution system. You can accomplish all of these tasks in a single work session.
Figure 2: An integrated graphical work order design provides several opportunities for cost savings.
Companies save millions of dollars delivering materials directly to the job site just in time for construction,maintenance, and repair avoiding high warehousing costs. This process is called supply chainmanagement (SCM), and enables companies to project material requirements in advance to synchronizedelivery schedules with crew and equipment arrival. Capturing compatible unit information early in thedesign phase of a work order makes this process possible.

8/7/2019 ValueUtilityGIS_WhitePaper
http://slidepdf.com/reader/full/valueutilitygiswhitepaper 7/15
The Value of a Utility GIS
5
An integrated graphical work order design environment provides many areas for cost savings (Figure 2).The basis for achieving the cost benefits, however, cannot be achieved solely by implementingtechnology. Organizational changes that focus on a redesign of the information processes must go hand-in-hand with the technology, eliminating redundant work that supports the existing processes, along withsupervisory and administration costs.
Restructuring to take advantage of new tools is not an easy process, and many organizations have haddifficulty implementing new solutions. For those who recognize the advantages, the financial impact willbe significant once the new work environment is in place, allowing the graphical work order design applicationto feed information throughout the organization and support the majority of operational processes.
At FortisAlberta, an electric service provider for approximately 450,000 residents in Alberta, Canada,designers use the geospatial infrastructure solution to create work orders that generate correspondingwork prints, material lists, and cost estimations. By entering information only at the time of creation andavoiding a duplicate as-built record process, the company realized a 25 percent increase in productivity.According to FortisAlberta, business cases have identified approximately five million dollars in benefitsannually since 1995. The utility continues to gain from the benefits, which break down as follows:
Elimination of “as-builts” drafting costs, 40 positions, $1.2M annually
Reduction of design costs, 20 positions, $1M annually
Simplified symbology and color thematic maps, saves field staff $1M annually in ease-of-use,coloring of paper maps and facility management
Load flow and fuse coordination analysis, two labor years of effort or $200K annually
MidAmerican Energy Company (MEC), an electric and gas distribution company in the Midwest, provedthat a geospatial solution enables them to better manage their infrastructure – from inception through toits day-to-day operation. In the area of design, the work management system is integrated with the utility’s geospatial infrastructure management solution to improve design quality. The integration not onlyprovides greater accuracy for material requisition and cost estimation, but also forces a more consistentwork order design process across the company. MEC posts the proposed infrastructure addition ormodification at design finalization, making information immediately available to employees across thecompany, such as field crews and front-line supervisors.
This makes new subdivision service installations at MEC much easier because the finalized designinformation is available to the crews – either within the mobile geospatial infrastructure application or on aprinted map. This supports visualization and instruction on installation locations, size and type ofequipment, and other data. For field locators, there is no delay in getting the finalized infrastructuredesign and installation information, reducing the risk of potential violations, fines, and damaged linesbecause of the accuracy and immediate availability of the data.
From the operational aspect, MEC can prepare the network switching orders for each job directly withintheir outage management system, because data are almost immediately available. This eliminates theneed for maintaining redline markup maps within the control room and significantly reduces the risk oferrors during switch plan preparation and execution.
4.2. Enterprise Access
At the heart of the corporate IT infrastructure are data, where the benefits of a geospatial infrastructuremanagement solution are most obvious. Location information is used by nearly everyone – from thecustomer care representative to the field crews. The access and distribution of data across the enterpriseis crucial to making informed decisions regarding the management of the infrastructure, control ofoperating expenses, and extension of infrastructure life.

8/7/2019 ValueUtilityGIS_WhitePaper
http://slidepdf.com/reader/full/valueutilitygiswhitepaper 8/15
The Value of a Utility GIS
6
One area where enterprise access is critical is operations and maintenance (O&M). O&M is highlydependent on regulatory requirements and infrastructure performance history. Traditionally, utilities storethis information in independent department files, an asset database or registry, plant maintenance files,and on maps and miscellaneous documents. With the integration and dissemination of the geospatialinfrastructure data, sources can now be assembled and accessed from a single point for unified analysisfor inspection and maintenance.
Hawaiian Electric Company (HECo) needed to transition its field crews from paper to a mobile geospatialinfrastructure management solution to satisfy field crews. HECo wanted a solution that took it beyondtraditional field map viewing. The company also wanted to automate infrastructure inspections for boththe field and office, with the ability to automate the recording and submission of inspections and workplanning. HECo has been utilizing this mobile geospatial infrastructure management solution for severalyears and captures inspection reports, as well as infrastructure photography, electronically (Figure 3).The inspection records and corresponding data are uploaded to the enterprise nightly, providing moreefficient communication and data sharing with departments across the company. The solution allowedHECo to increase the number of inspections per inspector, as well as the number of work planningdocuments. The solution also improved the quality of the inspection and work planning information.
For utilities, pipelines, and communications companies – operators of often widely dispersed transmissionand distribution networks – critical infrastructure protection (CIP) and disaster management are key
concerns. Communicating the exact location of facilities and resources, as well as dispatching, guiding,and tracking the movement of emergency personnel to a specific location, is fundamental to effectivecollaboration and response.
During a disaster and emergency response scenario, many organizations – city, state, federal, private,and non-profit – must pool resources and work together. Fundamental to this activity is the ability toquickly access and combine geospatially enabled data in disparate formats from diverse sources. Thiscapability enables rapid analysis of information and Web sharing of informative maps, providing thefooting for geospatially enabled enterprise data integration.
Utilities can view and coordinate public information and interdepartmental activities more easily with a map.For example, you can combine images and features of a landbase with water, sewer, electric, gas, andcommunications infrastructure layers to deal with massive utility outages. This kind of integrated geospatial
infrastructure effort streamlines collaborative field operations between utilities and government agencies.

8/7/2019 ValueUtilityGIS_WhitePaper
http://slidepdf.com/reader/full/valueutilitygiswhitepaper 9/15
The Value of a Utility GIS
7
Figure 3: Hawaiian Electric Company has improved inspection and work planning with the use of a mobile inspection application.
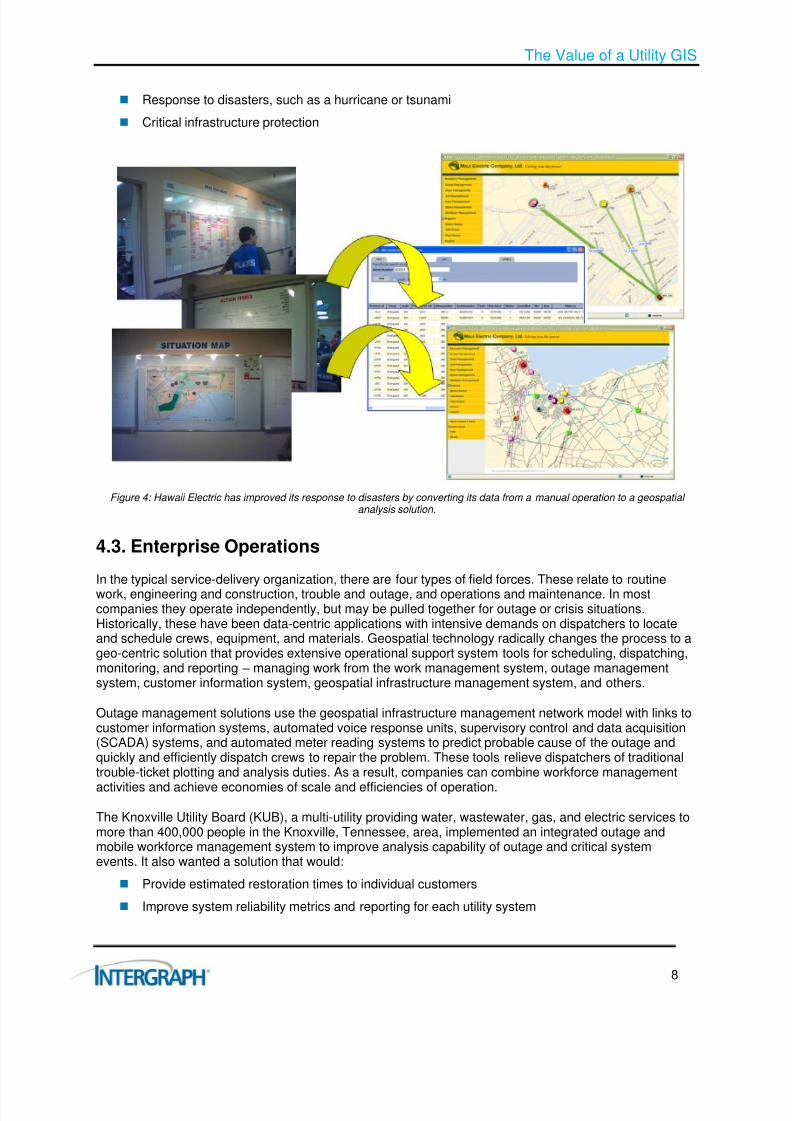
Participating in a recent oil spill drill with environmental and government agencies, HECo achievedmeasurable benefits by implementing a geospatial analysis and enterprise Web environment that couldassist in oil spills and other disaster response. This solution met the oil spill response need of quicklyshowing the incident area and various features in the vicinity. During the drill, a sensitive life reporting tool
was developed. When the user defined a polygon, which could be around a spill incident, the tool foundall sensitive life within the polygon and displayed a report. Previously, an environmental expert needed 30minutes to generate this kind of report because it involved coordinating disparate data. With all datageospatially referenced and electronically managed by the solution, the same quantity and quality ofsensitive life reporting was returned in less than a minute. HECo also uses the solution to display newand dynamic information, such as response crews and equipment.
This solution greatly enhanced the speed of HECo’s decision making, and helped quickly identify itsresponse strategy (Figure 4). The solution also provided:
Real-time adjustment of response resources
Efficient integration of disparate data sources
Instantaneous updates of the situation
Quick assessment of key and most critical infrastructure
Immeasurable ROI dollars
As a result of the drill, HECo’s enterprise Web site was declared appropriate for providing supportinggraphics and query results during the following dramatic situations:
Response to oil spills both on land and in water
8/7/2019 ValueUtilityGIS_WhitePaper
http://slidepdf.com/reader/full/valueutilitygiswhitepaper 10/15
The Value of a Utility GIS
8
Response to disasters, such as a hurricane or tsunami
Critical infrastructure protection
Figure 4: Hawaii Electric has improved its response to disasters by converting its data from a manual operation to a geospatial analysis solution.
4.3. Enterprise Operations
In the typical service-delivery organization, there are four types of field forces. These relate to routinework, engineering and construction, trouble and outage, and operations and maintenance. In mostcompanies they operate independently, but may be pulled together for outage or crisis situations.Historically, these have been data-centric applications with intensive demands on dispatchers to locateand schedule crews, equipment, and materials. Geospatial technology radically changes the process to ageo-centric solution that provides extensive operational support system tools for scheduling, dispatching,monitoring, and reporting – managing work from the work management system, outage managementsystem, customer information system, geospatial infrastructure management system, and others.
Outage management solutions use the geospatial infrastructure management network model with links tocustomer information systems, automated voice response units, supervisory control and data acquisition(SCADA) systems, and automated meter reading systems to predict probable cause of the outage andquickly and efficiently dispatch crews to repair the problem. These tools relieve dispatchers of traditionaltrouble-ticket plotting and analysis duties. As a result, companies can combine workforce management
activities and achieve economies of scale and efficiencies of operation.
The Knoxville Utility Board (KUB), a multi-utility providing water, wastewater, gas, and electric services tomore than 400,000 people in the Knoxville, Tennessee, area, implemented an integrated outage andmobile workforce management system to improve analysis capability of outage and critical systemevents. It also wanted a solution that would:
Provide estimated restoration times to individual customers
Improve system reliability metrics and reporting for each utility system

8/7/2019 ValueUtilityGIS_WhitePaper
http://slidepdf.com/reader/full/valueutilitygiswhitepaper 11/15
The Value of a Utility GIS
9
Provide dynamic information from real-time applications
Document and archive all system operation actions
Support mobile computing capabilities for all first responders
Use current geospatial infrastructure network connectivity for trouble analysis and circuit tracing
The KUB solution manages electric, gas, water, and wastewater utilities, including software, services,support, and maintenance. The solution is integrated with the geospatial infrastructure management,customer information, supervisory control and data acquisition, interactive voice response, and high-volume call systems. It provides a seamless environment for dispatch, mobile workforce management,scheduling, crew management, and outage management, fulfilling KUB’s vision of a consolidatedoperations environment to improve the decision-making process for restoration and service orders. Thesystem tracks individual trouble calls from customers and associates the calls with an outage event for aspecific device. This minimizes paper forms in the field and reduces radio voice communication. Using theglobal positioning system (GPS), operations personnel view each vehicle’s location in real time ondetailed map displays, enabling them to optimize assignments. The system also tracks the events a crewhas worked, time spent, and the resolution of the problem when an outage is restored. KUB has realizednumerous benefits, which include increased productivity, decreased back-office support, better resourceallocation, and faster deployment of job-related information to the field.
Progress Energy Florida (PEF), an electric utility service provider to more than 1.4 million customers, hasa completely integrated geospatial infrastructure management, work management, outage management,and mobile environment. Its project goals were to reduce power interruption time through optimization oftheir restoration workflow, increase customer satisfaction, and reduce costs through efficient restoration.The company implemented an outage management system that provided an accurate analysis engine withcall grouping and estimated outage device, mobile outage management with an integrated map, crewmanagement and field force automation, and management analysis through Web reporting and monitoring(Figure 5).
Figure 5: Progress Energy has vastly improved restoration efforts with an outage management system.
This system proved a major contributor in significantly reducing customer minutes of interruption (CMI). Itenabled PEF to reduce labor costs by getting crews on the job faster and allowing them to use their timemore efficiently (Figure 6). The system provides dynamic up-to-date maps, including the infrastructureinformation, intelligent street network, and GPS locations. Crews can create and confirm outages in the

8/7/2019 ValueUtilityGIS_WhitePaper
http://slidepdf.com/reader/full/valueutilitygiswhitepaper 12/15
The Value of a Utility GIS
10
field. PEF discovered that providing a mobile outage management solution to crews – which puts thenecessary tool as close to the actual damage as possible – and real-time access to necessary data vastlyimproves restoration efforts and increases performance. PEF also discovered that integrating ageospatial infrastructure network model with improved weather forecasts of storm tracks and intensityallows it to more accurately predict the location and extent of damage to critical utility infrastructure, aswell as accelerate the coordination and improve the accuracy of deploying response resources beforestorms strike. PEF estimated a 20 percent process improvement, which is more than $10 million insavings based on just one storm of similar impact during the 2004 storm season or approximately $1million in annual savings excluding extraordinary years of storm restoration.
Figure 6: Progress Energy has improved the time it spends on dispatching field crews, travel, and location with an outage management system.

8/7/2019 ValueUtilityGIS_WhitePaper
http://slidepdf.com/reader/full/valueutilitygiswhitepaper 13/15
The Value of a Utility GIS
11
5. Geospatial Technology: Platform for Solutions
Geospatial technology provides many benefits to utilities and communications companies. To reallymaximize the ROI and benefits on geospatial projects, utilities must integrate geospatial solutions into theIT infrastructure. By integrating a geospatial infrastructure management system with operational support
and service-delivery applications, these systems can cooperate seamlessly to manage the planning,design, construction, operations, maintenance, and emergency response functions of a utility orcommunications company, as well as transportation and government agencies. The benefits increasewith the implementation of additional geospatial data across the enterprise – the broader the solution, thegreater the benefits.
8/7/2019 ValueUtilityGIS_WhitePaper
http://slidepdf.com/reader/full/valueutilitygiswhitepaper 14/15
The Value of a Utility GIS
12
6. References
Daratech, Inc., 2007, GIS/Geospatial Markets & Opportunities 2006: Daratech Inc. GIS/GeospatialReview & Outlook, pg. 5
Morgan, T., 2007, IDC Says Global IT Spending Will Kiss $1.5 Trillion by 2010: The Four Hundred,Volume 16, Number 2, pg. 1
The Geospatial Information & Technology Association (GITA) owns copyrights for this whitepaper, which was previously published at the 2008 GITA Infrastructure Solutions Conference inSeattle, Wash.

8/7/2019 ValueUtilityGIS_WhitePaper
http://slidepdf.com/reader/full/valueutilitygiswhitepaper 15/15
For more information about Intergraph, visit our Web site atwww.intergraph.com.
Intergraph and the Intergraph logo are registered trademarks ofIntergraph Corporation. Other brands and product names aretrademarks of their respective owners. Intergraph believes thatthe information in this publication is accurate as of its publicationdate. Such information is subject to change without notice.Intergraph is not responsible for i nadvertent errors. ©2010Intergraph Corporation. All Rights Reserved. 3/10 UAC-US-0010A-ENG


