Embed Size (px)
Citation preview
ValVoline FlUiD analYSiS PRoGRaM
SM
Visit us at www.valvolinehd.com or call us at 1-800-354-9061.learn more about all of our full line of off-Road, on-Highway and industrial products at www.valvolinehd.com or phone 1-800 354-9061 to put the Valvoline advantage PeRFoRManCe and PRoTeCTion to work for you. CF
-243
9-a
©
2012
ash
land
P
rinte
d in
U.S
.a.
11/
12™
Tra
dem
ark,
ash
land
and
its
subs
idia
ries,
regi
ster
ed in
var
ious
cou
ntrie
s
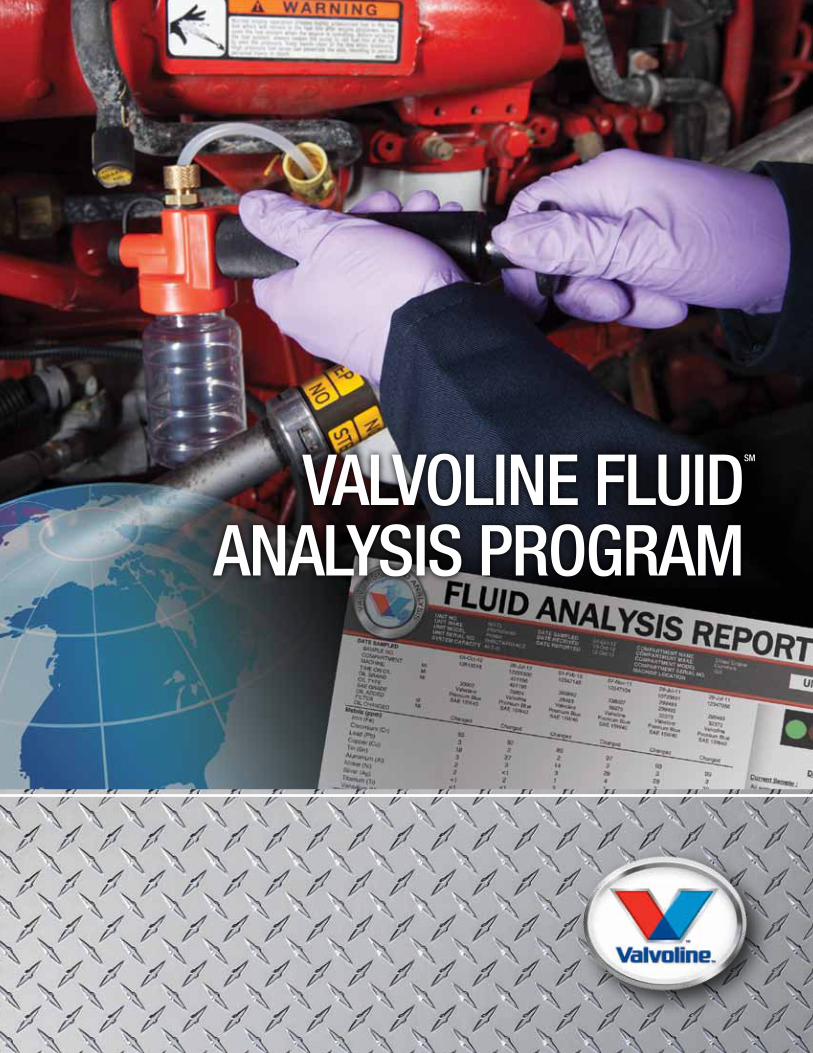
What Can The Fluid Analysis Program Do For You? The Valvoline™ Fluid Analysis Program is a monitoring and preventative maintenance ser-
vice, designed to help our customers gain additional insight into equipment condition.
This service gives vital information about the health of your equipment can help
predict and prevent catastrophic failure.
Benefits include: • Identifyminorproblemsbeforetheybecomemajorfailures
• Optimizeoildrainintervals*
• Provideback-upforwarrantyclaims
• CentralizedGlobaldatabasewithWebaccess,canmonitorinformation
internationally
• RegionalLabsAcrossTheU.S.EnsureRapidSampleProcessing
• E-MailAlertsProvideImmediateIndicationOfPotentialConcerns
• OnlinePortalForOilSampleData,WithToolsForReportGenerationAndDataAnalysis
• OngoingAssistanceAvailableFromValvolineApplicationEngineers
WhenusingValvoline’sFluidAnalysisprogram,youcanbeconfidentthatthetestresultsareaccurate,repeatable
andperformedtoconsistentmethodologiesandinterpretation,whetherthesamplewasprocessedinWestern
USA,orWesternAustralia.AllValvolineanalysislaboratoriesprovideconsistent,globalsupport,testingand
diagnostic interpretation.
*Fluidanalysesareonesupportingcomponentofacomprehensivemaintenanceprogram.
Equipmentmanufacturer(s)shouldbeconsultedforspecificrecommendationsregardingmaintenance
practices,including(butnotlimitedto)fluiddrainintervals
VA
LV
OLI
NE FLUID AN
ALY
SIS
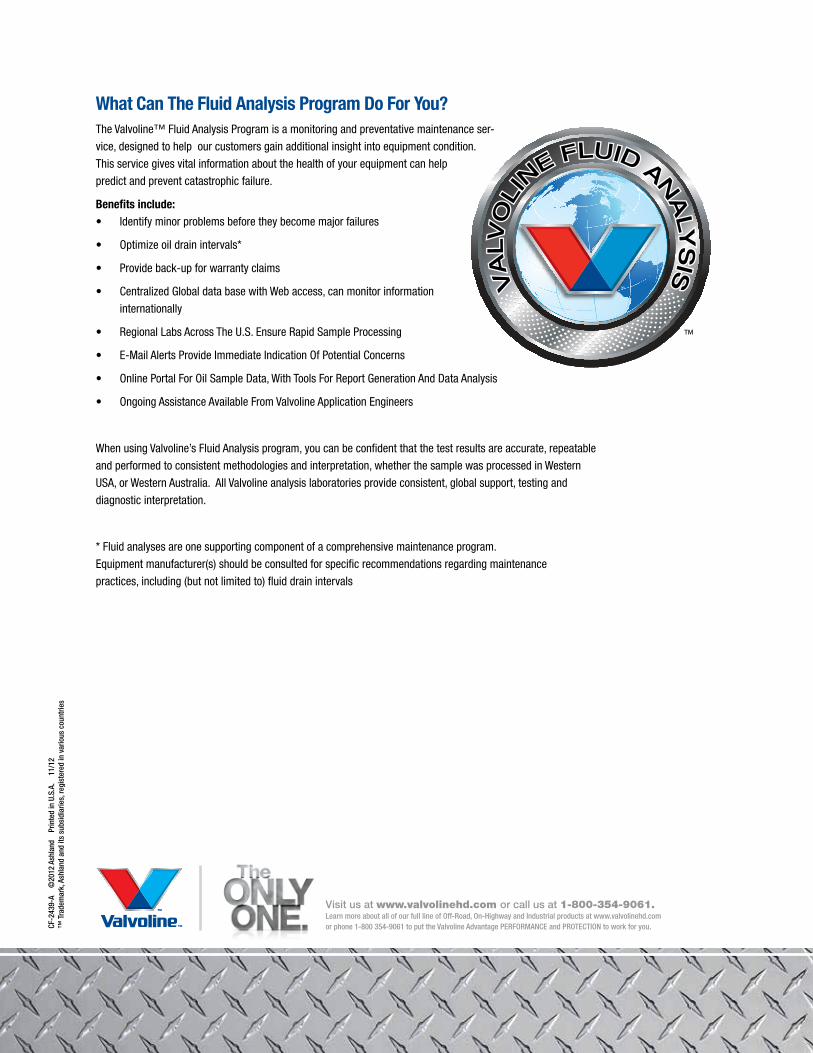
Results and Interpretation Valvoline’s Fluid Analysis program offers our customers a
great deal of flexibility in the delivery and management of
their data. We can transmit reports via e-mail, provide access
to our Valvoline Fluid Analysis web-site to view and manage data
or send a data file that can be imported into other software programs.
Valvoline Fluid Analysis has a full suite of management reports and data
mining capabilities to assist you with improving and managing your main-
tenance programs.
Searching for information based on a compartment type and/or other
variables is easy and quick through Valvoline’s global web portal. Web
users are able to assess compartments by problem
and number of occurrences to aid in root cause
analysis. This application allows your organization
to review, e-mail and print reports, print sample
labels and run various management reports. The
system is easy to use and allows for numerous
levels of access and data viewing permissions.
www.http://ValvolineFluidAnalysis.com
Reference GuidesMany times, users that test their in-service lubricants will
look at reports and ask “what do these tests mean?” Most
routine analysis reports display similar test parameters for
monitoring the condition of the operating equipment and the
lubricant in service. This simple guideline will help explain the use and
meaning behind the routine tests you are likely to see on an analysis report.
Please note that this serves only as a guideline; the elements listed do not
purport to include all possible resources.
Physical and Chemical Tests for Lubricant Condition and Service Life
Viscosity: Improper viscosity can affect a lubri-
cants performance.
• Too low of a viscosity will not create sufficient
surface film to keep moving parts separated and
prevent rubbing on opposing metal surfaces.
• Too high of a viscosity will create excessive heat
and reduced fluid flow within circulating systems.
• A change in viscosity will indicate a change in
the fluid performance integrity. A drop in viscosity
generally indicates contamination with a lighter
product, addition of an incorrect viscosity grade,
and in some cases thermal cracking. An increase in
viscosity can indicate oxidation and reduced service
life due to age, addition of an incorrect viscosity
grade, or excessive soot or insolubles content.
™
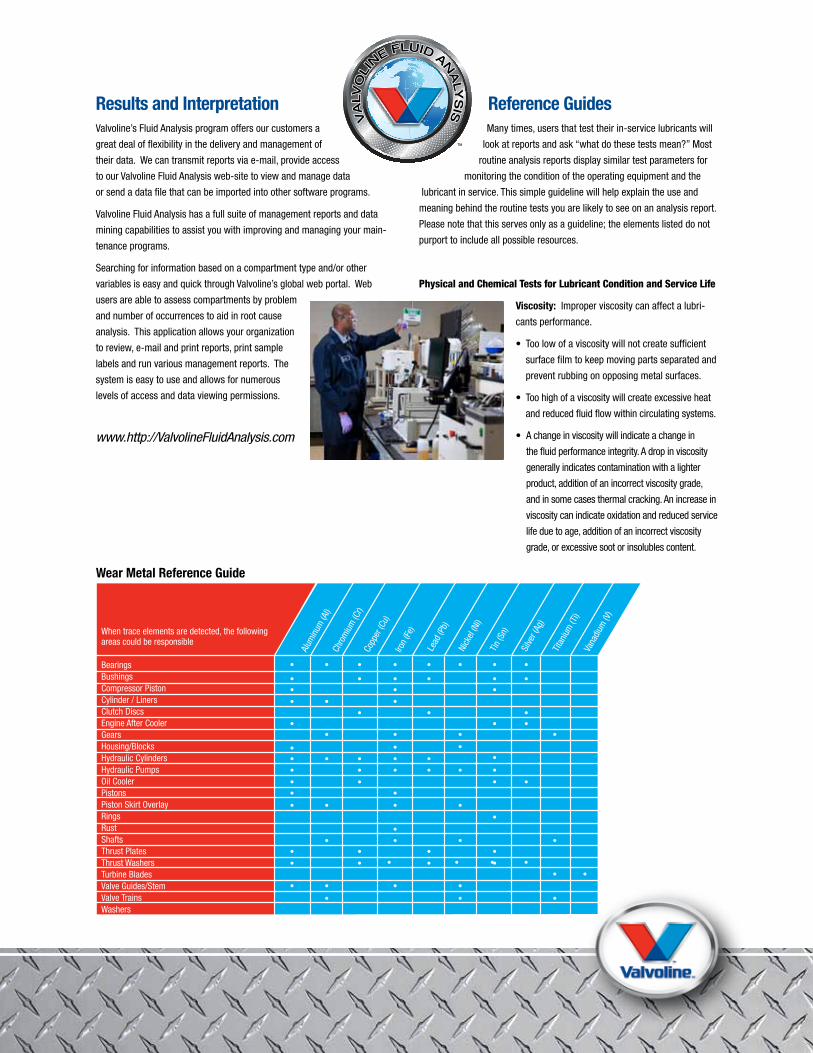
When trace elements are detected, the following areas could be responsible
BearingsBushingsCompressor PistonCylinder / Liners Clutch DiscsEngine After CoolerGearsHousing/BlocksHydraulic CylindersHydraulic PumpsOil CoolerPistonsPiston Skirt OverlayRingsRustShaftsThrust PlatesThrust WashersTurbine BladesValve Guides/StemValve TrainsWashers
Alum
inum
(Al)
Chro
miu
m (C
r) Co
pper
(Cu)
Iro
n (Fe
)
Lead
(Pb)
Nick
el (N
i)
Tin (S
n)
Silve
r (Ag
)
Titan
ium
(Ti)
Vana
dium
(V)
Wear Metal Reference Guide
VA
LV
OLI
NE FLUID AN
ALY
SIS
CF-2
439-
B
©20
12 A
shla
nd
Prin
ted
in U
.S.A
. 1
1/12
™ T
rade
mar
k, A
shla
nd a
nd it
s su
bsid
iarie
s, re
gist
ered
in v
ario
us c
ount
ries
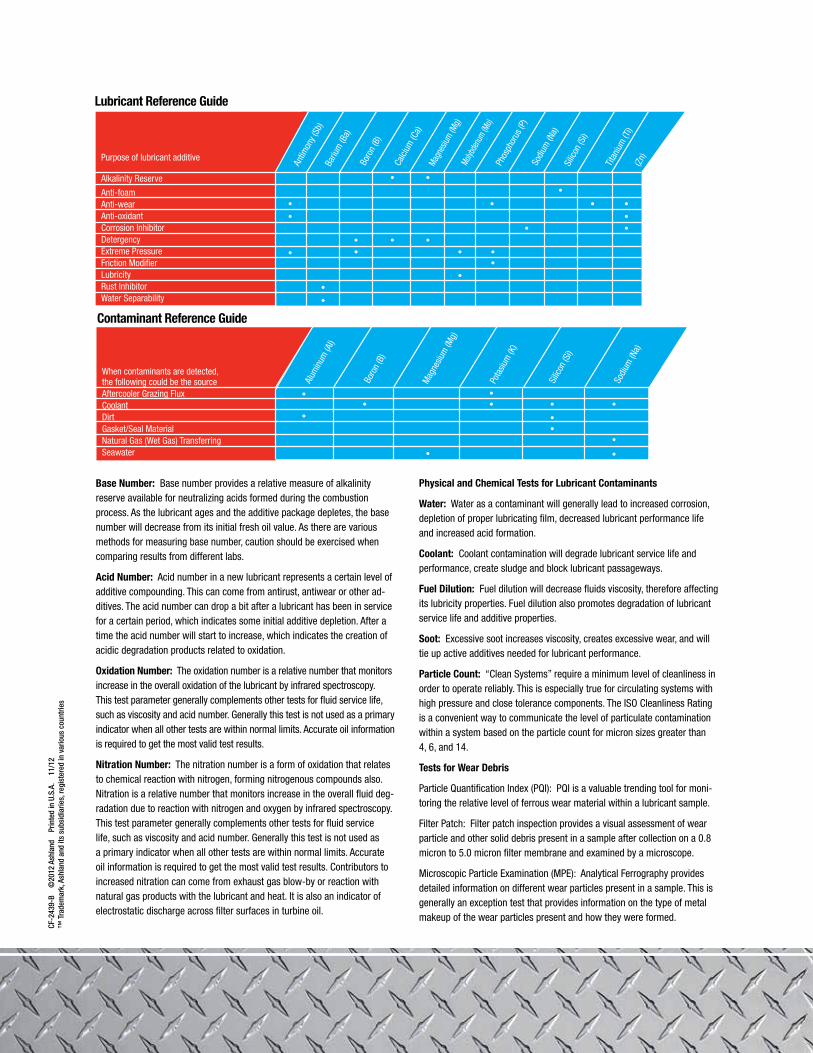
Base Number: Base number provides a relative measure of alkalinity reserve available for neutralizing acids formed during the combustion process. As the lubricant ages and the additive package depletes, the base number will decrease from its initial fresh oil value. As there are various methods for measuring base number, caution should be exercised when comparing results from different labs.
Acid Number: Acid number in a new lubricant represents a certain level of additive compounding. This can come from antirust, antiwear or other ad-ditives. The acid number can drop a bit after a lubricant has been in service for a certain period, which indicates some initial additive depletion. After a time the acid number will start to increase, which indicates the creation of acidic degradation products related to oxidation.
Oxidation Number: The oxidation number is a relative number that monitors increase in the overall oxidation of the lubricant by infrared spectroscopy. This test parameter generally complements other tests for fluid service life, such as viscosity and acid number. Generally this test is not used as a primary indicator when all other tests are within normal limits. Accurate oil information is required to get the most valid test results.
Nitration Number: The nitration number is a form of oxidation that relates to chemical reaction with nitrogen, forming nitrogenous compounds also. Nitration is a relative number that monitors increase in the overall fluid deg-radation due to reaction with nitrogen and oxygen by infrared spectroscopy. This test parameter generally complements other tests for fluid service life, such as viscosity and acid number. Generally this test is not used as a primary indicator when all other tests are within normal limits. Accurate oil information is required to get the most valid test results. Contributors to increased nitration can come from exhaust gas blow-by or reaction with natural gas products with the lubricant and heat. It is also an indicator of electrostatic discharge across filter surfaces in turbine oil.
Physical and Chemical Tests for Lubricant Contaminants
Water: Water as a contaminant will generally lead to increased corrosion, depletion of proper lubricating film, decreased lubricant performance life and increased acid formation.
Coolant: Coolant contamination will degrade lubricant service life and performance, create sludge and block lubricant passageways.
Fuel Dilution: Fuel dilution will decrease fluids viscosity, therefore affecting its lubricity properties. Fuel dilution also promotes degradation of lubricant service life and additive properties.
Soot: Excessive soot increases viscosity, creates excessive wear, and will tie up active additives needed for lubricant performance.
Particle Count: “Clean Systems” require a minimum level of cleanliness in order to operate reliably. This is especially true for circulating systems with high pressure and close tolerance components. The ISO Cleanliness Rating is a convenient way to communicate the level of particulate contamination within a system based on the particle count for micron sizes greater than 4, 6, and 14.
Tests for Wear Debris
Particle Quantification Index (PQI): PQI is a valuable trending tool for moni-toring the relative level of ferrous wear material within a lubricant sample.
Filter Patch: Filter patch inspection provides a visual assessment of wear particle and other solid debris present in a sample after collection on a 0.8 micron to 5.0 micron filter membrane and examined by a microscope.
Microscopic Particle Examination (MPE): Analytical Ferrography provides detailed information on different wear particles present in a sample. This is generally an exception test that provides information on the type of metal makeup of the wear particles present and how they were formed.
When contaminants are detected, the following could be the sourceAftercooler Grazing FluxCoolantDirtGasket/Seal MaterialNatural Gas (Wet Gas) TransferringSeawater
Alum
inum
(AI)
Boro
n (B
)
Mag
nesiu
m (M
g)
Pota
sium
(K)
Silic
on (S
i)
Sodi
um (N
a)
Contaminant Reference Guide
Purpose of lubricant additive
Alkalinity Reserve
Anti-foamAnti-wearAnti-oxidantCorrosion InhibitorDetergencyExtreme PressureFriction ModifierLubricityRust InhibitorWater Separability
Antim
ony (
Sb)
Bariu
m (B
a)
Boro
n (B
)
Calci
um (C
a)
Magn
esium
(Mg)
Molyb
denu
m (Mo)
Phos
phor
us (P
) So
dium
(Na)
Silic
on (S
i)
Titan
ium
(Ti)
Zinc
(Z
n)
Lubricant Reference Guide
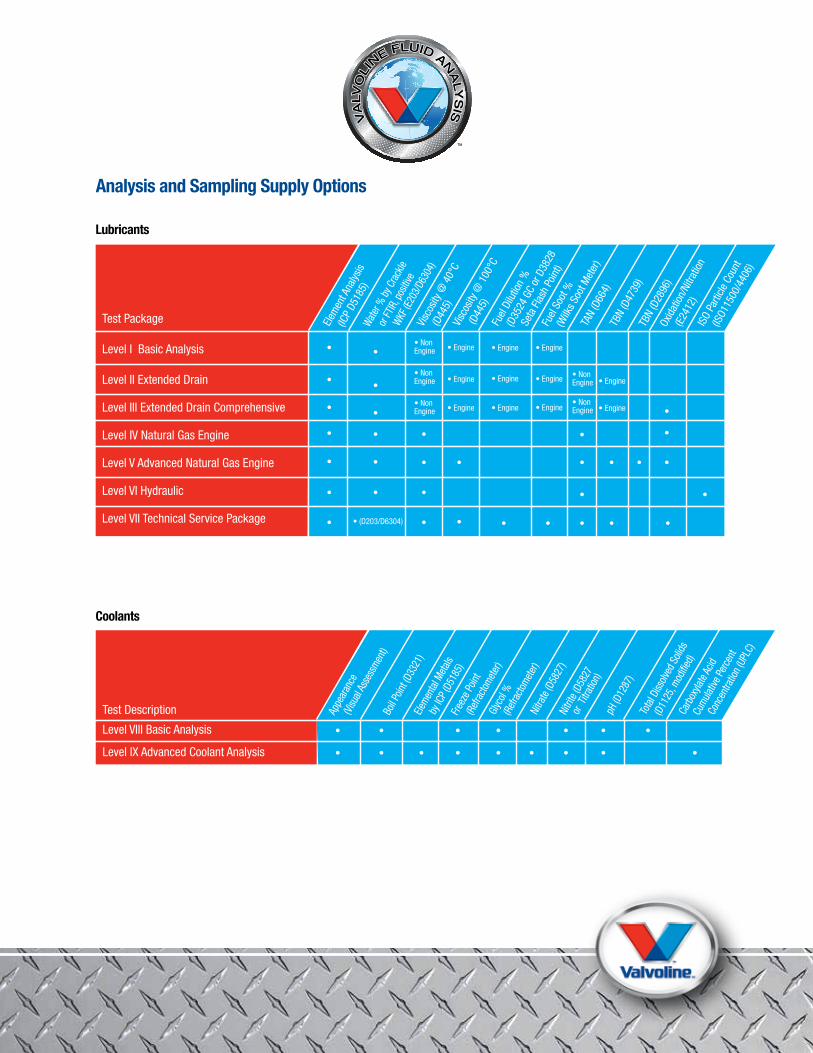
Analysis and Sampling Supply Options
VA
LV
OLI
NE FLUID AN
ALY
SIS
Lubricants
Coolants
Test Package
Level I Basic Analysis
Level II Extended Drain
Level III Extended Drain Comprehensive
Level IV Natural Gas Engine
Level V Advanced Natural Gas Engine
Level VI Hydraulic
Level VII Technical Service Package
• Non Engine • Engine • Engine • Engine
• Engine • Engine • Engine • Engine
• Engine • Engine • Engine • Engine
• Non Engine
• Non Engine
• Non Engine
• (D203/D6304)
• Non Engine
Elem
ent A
nalys
is
(ICP
D518
5)
Water
% by
Cra
ckle
or FT
IR, po
sitive
WKF (E
203/
D630
4) Vi
scos
ity @
40°
C
(D44
5)
Visc
osity
@ 1
00°C
(D44
5)
Fuel
Dilu
tion
%
(D35
24 G
C or
D38
28
Seta
Flas
h Po
int)
Fuel
Soot
%
(Wilk
s Soo
t Met
er)
TAN
(D66
4)TB
N (D
4739
)TB
N (D
2896
)
Oxid
ation
/Nitr
ation
(E24
12)
ISO
Parti
cle C
ount
(ISO1
1500
/440
6)
Test Description
Level VIII Basic Analysis
Level IX Advanced Coolant Analysis
Appe
aran
ce
(Visu
al As
sess
ment)
Bo
il Poin
t (D3
321)
Elemen
tal M
etals
by IC
P (D5
185)
Freez
e Poin
t (R
efrac
tomete
r) Gl
ycol
%
(Refr
actom
eter)
Nitra
te (D
5827
) Ni
trite
(D58
27
or T
itrati
on)
pH (D
1287
)
To
tal D
issolv
ed S
olids
(D11
25, m
odifie
d)
Carb
oxyla
te Ac
id
Cumula
tive P
erce
nt
Conc
entra
tion (
UPLC
)
CF-2
439-
C
©20
12 A
shla
nd
Prin
ted
in U
.S.A
. 1
1/12
™ T
rade
mar
k, A
shla
nd a
nd it
s su
bsid
iarie
s, re
gist
ered
in v
ario
us c
ount
ries
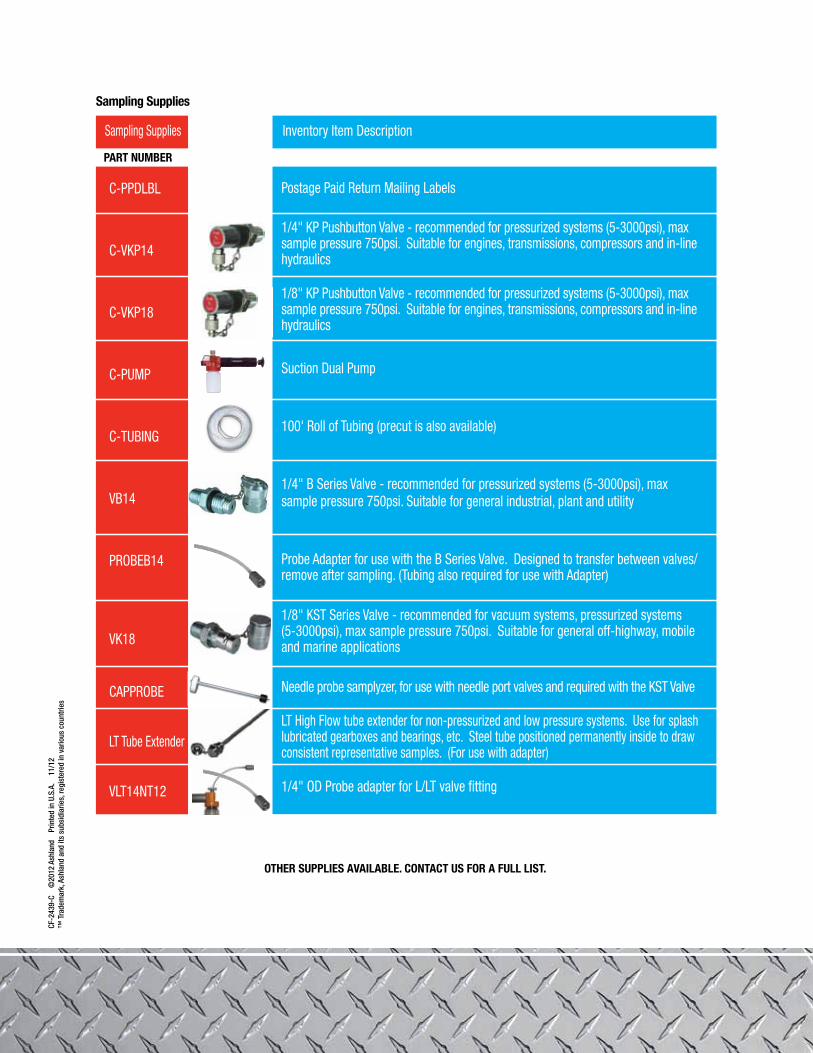
Inventory Item Description
Postage Paid Return Mailing Labels
1/4" KP Pushbutton Valve - recommended for pressurized systems (5-3000psi), max sample pressure 750psi. Suitable for engines, transmissions, compressors and in-line hydraulics
1/8" KP Pushbutton Valve - recommended for pressurized systems (5-3000psi), max sample pressure 750psi. Suitable for engines, transmissions, compressors and in-line hydraulics
Suction Dual Pump
100' Roll of Tubing (precut is also available)
1/4" B Series Valve - recommended for pressurized systems (5-3000psi), max sample pressure 750psi. Suitable for general industrial, plant and utility
Probe Adapter for use with the B Series Valve. Designed to transfer between valves/remove after sampling. (Tubing also required for use with Adapter)
1/8" KST Series Valve - recommended for vacuum systems, pressurized systems (5-3000psi), max sample pressure 750psi. Suitable for general off-highway, mobile and marine applications
Needle probe samplyzer, for use with needle port valves and required with the KST Valve
LT High Flow tube extender for non-pressurized and low pressure systems. Use for splash lubricated gearboxes and bearings, etc. Steel tube positioned permanently inside to draw consistent representative samples. (For use with adapter)
1/4" OD Probe adapter for L/LT valve fitting
Sampling Supplies
OTHER SUPPLIES AVAILABLE. CONTACT US FOR A FULL LIST.
Sampling Supplies
PART NUMBER
C-PPDLBL
C-VKP14
C-VKP18
C-PUMP
C-TUBING
VB14
PROBEB14
VK18
CAPPROBE
LT Tube Extender
VLT14NT12
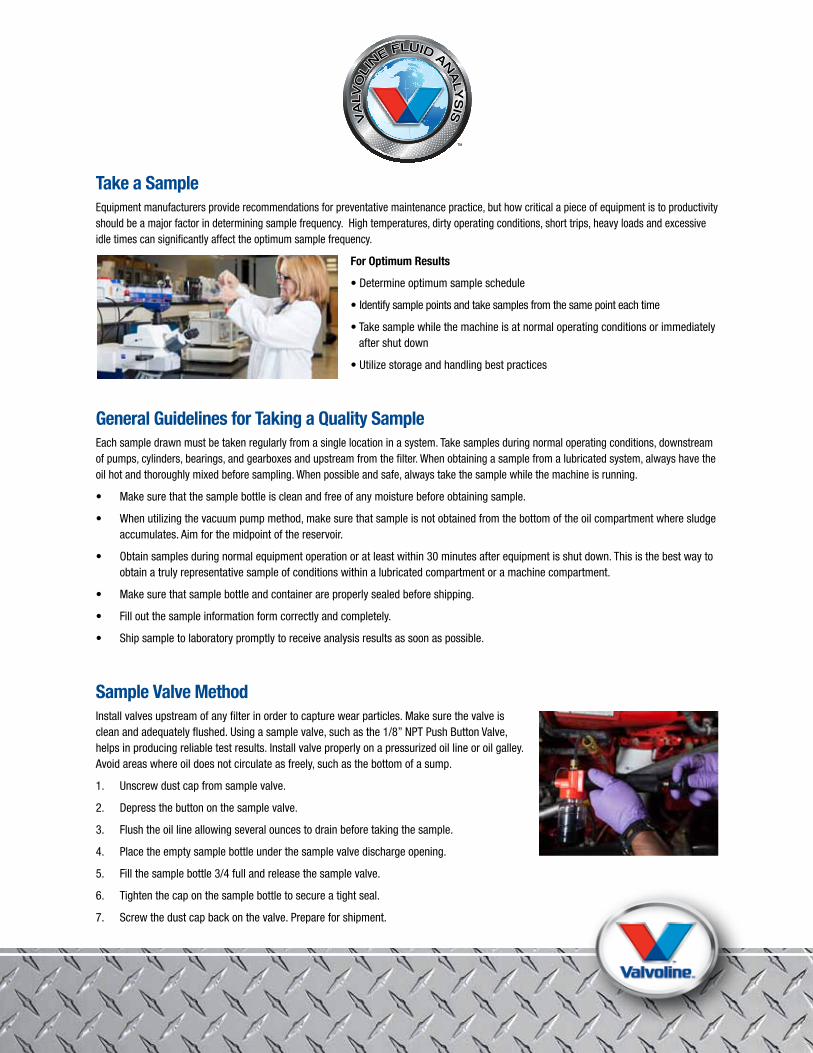
Take a Sample Equipment manufacturers provide recommendations for preventative maintenance practice, but how critical a piece of equipment is to productivity should be a major factor in determining sample frequency. High temperatures, dirty operating conditions, short trips, heavy loads and excessive idle times can significantly affect the optimum sample frequency.
For Optimum Results
• Determine optimum sample schedule
• Identify sample points and take samples from the same point each time
• Take sample while the machine is at normal operating conditions or immediately after shut down
• Utilize storage and handling best practices
General Guidelines for Taking a Quality Sample Each sample drawn must be taken regularly from a single location in a system. Take samples during normal operating conditions, downstream of pumps, cylinders, bearings, and gearboxes and upstream from the filter. When obtaining a sample from a lubricated system, always have the oil hot and thoroughly mixed before sampling. When possible and safe, always take the sample while the machine is running.
• Make sure that the sample bottle is clean and free of any moisture before obtaining sample.
• When utilizing the vacuum pump method, make sure that sample is not obtained from the bottom of the oil compartment where sludge accumulates. Aim for the midpoint of the reservoir.
• Obtain samples during normal equipment operation or at least within 30 minutes after equipment is shut down. This is the best way to obtain a truly representative sample of conditions within a lubricated compartment or a machine compartment.
• Make sure that sample bottle and container are properly sealed before shipping.
• Fill out the sample information form correctly and completely.
• Ship sample to laboratory promptly to receive analysis results as soon as possible.
Sample Valve Method Install valves upstream of any filter in order to capture wear particles. Make sure the valve is clean and adequately flushed. Using a sample valve, such as the 1/8” NPT Push Button Valve, helps in producing reliable test results. Install valve properly on a pressurized oil line or oil galley. Avoid areas where oil does not circulate as freely, such as the bottom of a sump.
1. Unscrew dust cap from sample valve.
2. Depress the button on the sample valve.
3. Flush the oil line allowing several ounces to drain before taking the sample.
4. Place the empty sample bottle under the sample valve discharge opening.
5. Fill the sample bottle 3/4 full and release the sample valve.
6. Tighten the cap on the sample bottle to secure a tight seal.
7. Screw the dust cap back on the valve. Prepare for shipment.
VA
LV
OLI
NE FLUID AN
ALY
SIS
CF-2
439-
E
©20
12 A
shla
nd
Prin
ted
in U
.S.A
. 1
1/12
™ T
rade
mar
k, A
shla
nd a
nd it
s su
bsid
iarie
s, re
gist
ered
in v
ario
us c
ount
ries
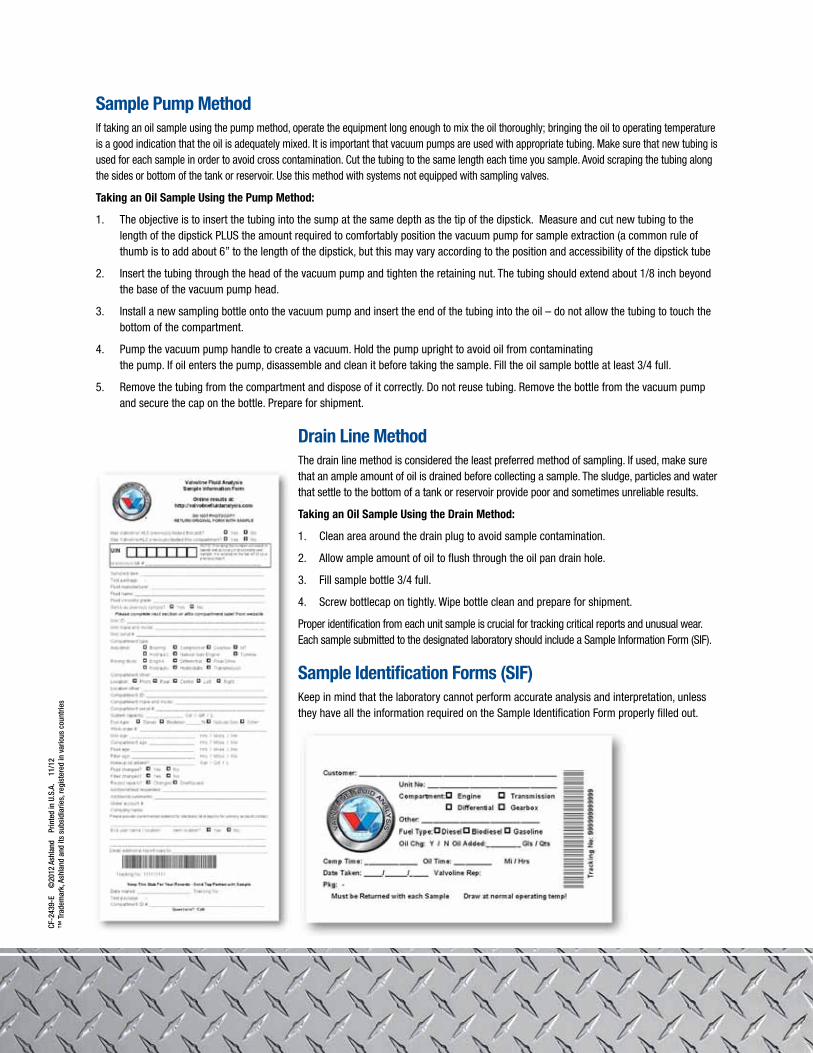
Sample Pump Method If taking an oil sample using the pump method, operate the equipment long enough to mix the oil thoroughly; bringing the oil to operating temperature is a good indication that the oil is adequately mixed. It is important that vacuum pumps are used with appropriate tubing. Make sure that new tubing is used for each sample in order to avoid cross contamination. Cut the tubing to the same length each time you sample. Avoid scraping the tubing along the sides or bottom of the tank or reservoir. Use this method with systems not equipped with sampling valves.
Taking an Oil Sample Using the Pump Method:
1. The objective is to insert the tubing into the sump at the same depth as the tip of the dipstick. Measure and cut new tubing to the length of the dipstick PLUS the amount required to comfortably position the vacuum pump for sample extraction (a common rule of thumb is to add about 6” to the length of the dipstick, but this may vary according to the position and accessibility of the dipstick tube
2. Insert the tubing through the head of the vacuum pump and tighten the retaining nut. The tubing should extend about 1/8 inch beyond the base of the vacuum pump head.
3. Install a new sampling bottle onto the vacuum pump and insert the end of the tubing into the oil – do not allow the tubing to touch the bottom of the compartment.
4. Pump the vacuum pump handle to create a vacuum. Hold the pump upright to avoid oil from contaminating the pump. If oil enters the pump, disassemble and clean it before taking the sample. Fill the oil sample bottle at least 3/4 full.
5. Remove the tubing from the compartment and dispose of it correctly. Do not reuse tubing. Remove the bottle from the vacuum pump and secure the cap on the bottle. Prepare for shipment.
Drain Line MethodThe drain line method is considered the least preferred method of sampling. If used, make sure that an ample amount of oil is drained before collecting a sample. The sludge, particles and water that settle to the bottom of a tank or reservoir provide poor and sometimes unreliable results.
Taking an Oil Sample Using the Drain Method:
1. Clean area around the drain plug to avoid sample contamination.
2. Allow ample amount of oil to flush through the oil pan drain hole.
3. Fill sample bottle 3/4 full.
4. Screw bottlecap on tightly. Wipe bottle clean and prepare for shipment.
Proper identification from each unit sample is crucial for tracking critical reports and unusual wear. Each sample submitted to the designated laboratory should include a Sample Information Form (SIF).
Sample Identification Forms (SIF)Keep in mind that the laboratory cannot perform accurate analysis and interpretation, unless they have all the information required on the Sample Identification Form properly filled out.
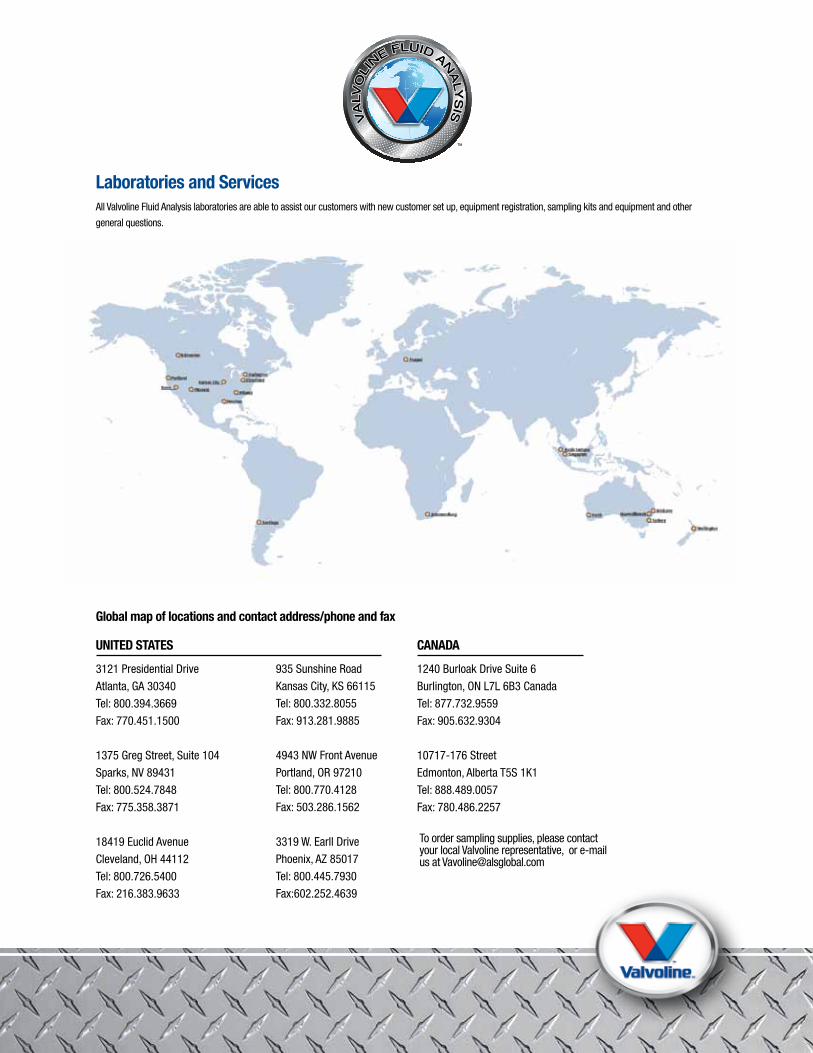
Laboratories and Services All Valvoline Fluid Analysis laboratories are able to assist our customers with new customer set up, equipment registration, sampling kits and equipment and other
general questions.
VA
LV
OLI
NE FLUID AN
ALY
SIS
UNITED STATES
3121 Presidential Drive
Atlanta, GA 30340
Tel: 800.394.3669
Fax: 770.451.1500
1375 Greg Street, Suite 104
Sparks, NV 89431
Tel: 800.524.7848
Fax: 775.358.3871
18419 Euclid Avenue
Cleveland, OH 44112
Tel: 800.726.5400
Fax: 216.383.9633
CANADA
1240 Burloak Drive Suite 6
Burlington, ON L7L 6B3 Canada
Tel: 877.732.9559
Fax: 905.632.9304
10717-176 Street
Edmonton, Alberta T5S 1K1
Tel: 888.489.0057
Fax: 780.486.2257
To order sampling supplies, please contact your local Valvoline representative, or e-mail us at [email protected]
935 Sunshine Road
Kansas City, KS 66115
Tel: 800.332.8055
Fax: 913.281.9885
4943 NW Front Avenue
Portland, OR 97210
Tel: 800.770.4128
Fax: 503.286.1562
3319 W. Earll Drive
Phoenix, AZ 85017
Tel: 800.445.7930
Fax:602.252.4639
Global map of locations and contact address/phone and fax

CF-2
439-
F
©20
12 A
shla
nd
Prin
ted
in U
.S.A
. 1
1/12
™ T
rade
mar
k, A
shla
nd a
nd it
s su
bsid
iarie
s, re
gist
ered
in v
ario
us c
ount
ries
Exam
ple
Of F
luid
Ana
lysi
s Re
port
CF-2
439-
G
©20
12 A
shla
nd
Prin
ted
in U
.S.A
. 1
1/12
™ T
rade
mar
k, A
shla
nd a
nd it
s su
bsid
iarie
s, re
gist
ered
in v
ario
us c
ount
ries
Engine Coolant Reference GuideEngine coolants are a mixture of glycol, inhibitors, and water. Each formula is designed for specific protection and engine requirements. Mixing
different coolants is not recommended and can compromise the coolant’s general overall protective capability, resulting in decreased coolant life
and damage to the cooling system and/or engine. The following is a reference guide to assist in understanding the engine coolant data.
VA
LV
OLI
NE FLUID AN
ALY
SIS
Appearance Assessment
Clarity
Color
Visible Sediment
Visible Petroleum Layer
pH
ELC Engine Coolant and Conventional Engine Coolant
Clear
Clear, bright, and representative of the original engine coolant color
None
None
Extended Life 7.5 - 9.5 pH
Conventional 8.5 - 11.0 pH
Appear hazy or opaque
Brown could indicate improper mixing of different coolants
Presence of sediment is typically indicative of additive fallout, corrosion, rust, scale buildup, or other contaminants
Indication of fuel or oil contamination will be observed usually in the form of a separated layer
ELC Low pH (< 7.5 ) Conventional Low pH (< 8.5 )
Low pH can lead to metal corrosion
Air leaks will lower pH
Improper coolant volume
Shelf life of coolant, age will lower the pH
Under additized SCA concentration (conventional coolant)
Degraded or contaminated engine coolants or a mixture of incompatible coolant types
Decreased coolant protection
Water pump and seal deterioration, liner pitting, copper and aluminum corrosion, plugged oil cooler and radiator; poor sampling technique.
Combustion gas blow-by into the coolant, leaking oil cooler; poor sampling technique
ELC High pH ( > 9.5);
Conventional High pH (>11.0)
Mixed coolant types
Over additized SCA concentration
Check shelf life of the coolant; check coolant handling practices
Verify original coolant color of product in use; if brown was reported, check coolant handling practices
Add a non-SCA filter for ELC coolants; add an SCA filter to conventional coolant systems
Check for any seal failures and system integrity
Check coolant volume
Check for air leaks Pressure check radiator cap
Check SCA filter and replace if needed (conventional coolant only)
Electrical grounding issues (if coolant has a burnt smell)
Combustion gas leak if pH is below 7.0
Remove SCA filter when ELC coolants are in use, this will add pH buffer and raise the pH
Drain, flush, refill then resample
Targ
et
Obse
rvat
ion
Poss
ible
Resu
lt
Corre
ctive
Act
ion
Targ
et
Obse
rvat
ion L
ow p
H
Obse
rvat
ion H
igh
pH
Corre
ctive
Act
ion
pH
Appearance
Glycol Concentration
Percent Glycol
TDS
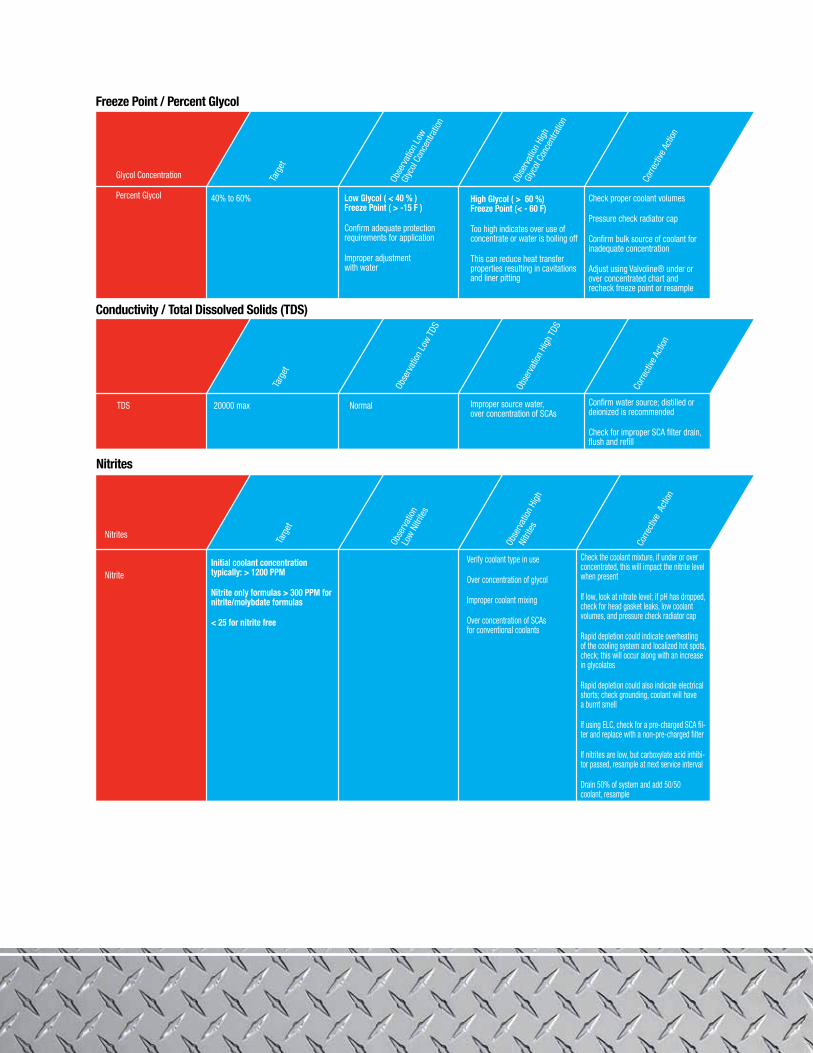
40% to 60%
20000 max Normal
Low Glycol ( < 40 % ) Freeze Point ( > -15 F )
Confirm adequate protection requirements for application
Improper adjustment with water
High Glycol ( > 60 %) Freeze Point (< - 60 F)
Too high indicates over use of concentrate or water is boiling off
This can reduce heat transfer properties resulting in cavitations and liner pitting
Improper source water, over concentration of SCAs
Check proper coolant volumes
Pressure check radiator cap
Confirm bulk source of coolant for inadequate concentration
Adjust using Valvoline® under or over concentrated chart and recheck freeze point or resample
Confirm water source; distilled or deionized is recommended
Check for improper SCA filter drain, flush and refill
Targ
et
Obse
rvat
ion L
ow
Glyc
ol Co
ncen
tratio
n Ob
serv
ation
Hig
h
Glyc
ol Co
ncen
tratio
n
Corre
ctive
Act
ion
Targ
et
Obse
rvat
ion L
ow T
DS
Obse
rvat
ion H
igh
TDS
Corre
ctive
Act
ion
Conductivity / Total Dissolved Solids (TDS)
Freeze Point / Percent Glycol
Nitrites
NitriteInitial coolant concentration typically: > 1200 PPM
Nitrite only formulas > 300 PPM for nitrite/molybdate formulas
< 25 for nitrite free
Verify coolant type in use
Over concentration of glycol
Improper coolant mixing
Over concentration of SCAs for conventional coolants
Check the coolant mixture, if under or over concentrated, this will impact the nitrite level when present
If low, look at nitrate level; if pH has dropped, check for head gasket leaks, low coolant volumes, and pressure check radiator cap
Rapid depletion could indicate overheating of the cooling system and localized hot spots, check; this will occur along with an increase in glycolates
Rapid depletion could also indicate electrical shorts; check grounding, coolant will have a burnt smell
If using ELC, check for a pre-charged SCA fil-ter and replace with a non-pre-charged filter
If nitrites are low, but carboxylate acid inhibi-tor passed, resample at next service interval
Drain 50% of system and add 50/50 coolant, resample
Targ
et
Obse
rvat
ion
Low
Nitri
tes
Obse
rvat
ion H
igh
Nitri
tes
Corre
ctive
Act
ion
Nitrites
Carboxylate Acid
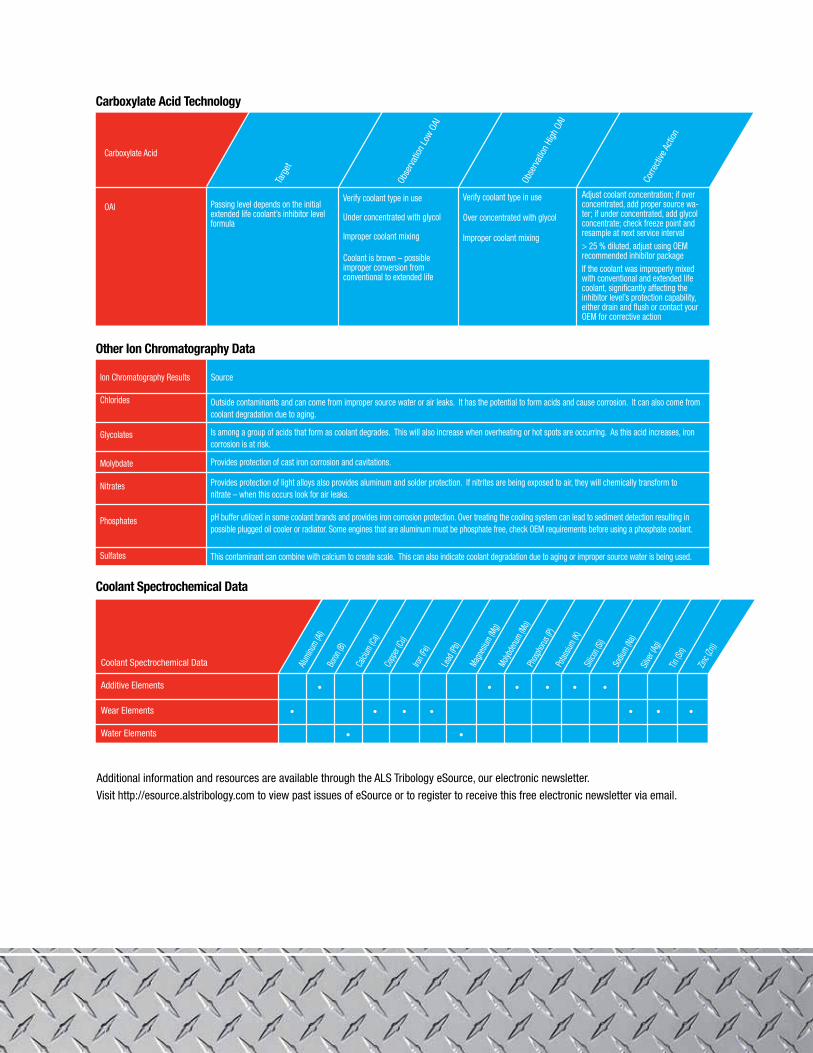
OAI
Ion Chromatography Results
Chlorides
Glycolates
Molybdate
Nitrates
Phosphates
Sulfates
Source
Passing level depends on the initial extended life coolant’s inhibitor level formula
Outside contaminants and can come from improper source water or air leaks. It has the potential to form acids and cause corrosion. It can also come from coolant degradation due to aging.
Is among a group of acids that form as coolant degrades. This will also increase when overheating or hot spots are occurring. As this acid increases, iron corrosion is at risk.
Provides protection of cast iron corrosion and cavitations.
Provides protection of light alloys also provides aluminum and solder protection. If nitrites are being exposed to air, they will chemically transform to nitrate – when this occurs look for air leaks.
pH buffer utilized in some coolant brands and provides iron corrosion protection. Over treating the cooling system can lead to sediment detection resulting in possible plugged oil cooler or radiator. Some engines that are aluminum must be phosphate free, check OEM requirements before using a phosphate coolant.
This contaminant can combine with calcium to create scale. This can also indicate coolant degradation due to aging or improper source water is being used.
Verify coolant type in use Under concentrated with glycol Improper coolant mixing
Coolant is brown – possible improper conversion from conventional to extended life
Verify coolant type in use
Over concentrated with glycol
Improper coolant mixing
Adjust coolant concentration; if over concentrated, add proper source wa-ter; if under concentrated, add glycol concentrate; check freeze point and resample at next service interval> 25 % diluted, adjust using OEM recommended inhibitor packageIf the coolant was improperly mixed with conventional and extended life coolant, significantly affecting the inhibitor level’s protection capability, either drain and flush or contact your OEM for corrective action
Targ
et
Obse
rvat
ion L
ow O
AI
Obse
rvat
ion H
igh
OAI
Corre
ctive
Act
ion
Carboxylate Acid Technology
Other Ion Chromatography Data
Coolant Spectrochemical Data
Coolant Spectrochemical Data
Additive Elements
Wear Elements
Water Elements
Aluminu
m (Al)
Boron
(B)
Calci
um (C
a) Co
pper
(Cu)
Iron (
Fe)
Lead
(Pb)
Magn
esium
(Mg)
Molyb
denu
m (Mo)
Phos
phoru
s (P)
Potas
sium (K
)
Sil
icon (
Si)
So
dium (N
a)
Silve
r (Ag)
Tin (S
n)
Zinc (
Zn))
Additional information and resources are available through the ALS Tribology eSource, our electronic newsletter.
Visit http://esource.alstribology.com to view past issues of eSource or to register to receive this free electronic newsletter via email.