Embed Size (px)
Citation preview
ww
w . g
reen
pea
ce . d
e
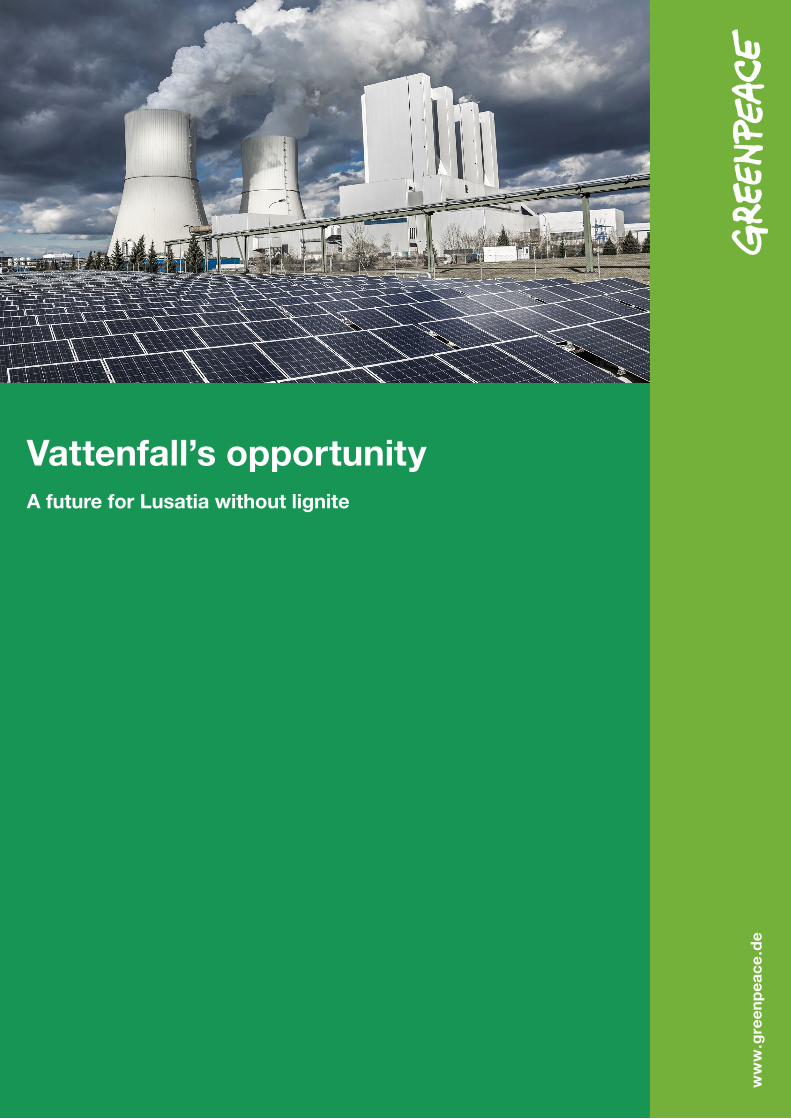
Vattenfall’s opportunityA future for Lusatia without lignite
This study was commissioned by Greenpeace Germany and executed by Institut für ökologische Wirtschaftsforschung.
Katharina Heinbach, Mark Bost, Steven Salecki, Julika Weiß
Berlin | April 2015
Kein Geld von Industrie und StaatGreenpeace ist international, überparteilich und völlig unabhängig von Politik, Parteien und Industrie. Mit gewaltfreien Aktionen kämpft Greenpeace für den Schutz der Lebensgrundlagen. Rund 590.000 Menschen in Deutschland spenden an Greenpeace und gewährleisten damit unsere tägliche Arbeit zum Schutz der Umwelt.
Gedruckt auf 100% Recyclingpapier
Impressum Greenpeace e. V., Hongkongstraße 10, 20457 Hamburg, Tel. 040/3 06 18 - 0 Pressestelle Tel. 040/3 06 18 - 340, F 040/3 06 18-340, [email protected] , www . greenpeace . de Politische Vertretung Berlin Marienstraße 19 – 20, 10117 Berlin, Tel. 030/30 88 99 - 0 V.i.S.d.P. Gregor Kessler Foto Paul Langrock / GreenpeaceZur Deckung unserer Herstellungskosten bitten wir um eine Spende: GLS Bank, IBAN DE49 4306 0967 0000 0334 01, BIC GENODEM1GLS
ROAD MAP FOR TRANSITION — VATTENFALL 2030 | 3
Contents
1 Introduction ........................................................................................................... 6
2 The Phaseout of Lignite ........................................................................................ 6
2.1 Lignite in the context of low-carbon targets ....................................................................................... 7 2.1.1 Germany’s national targets ................................................................................................ 7 2.1.2 Brandenburg ....................................................................................................................... 8
2.1.3 Berlin ………………………………………………………………………………………….……8 2.1.4 Vattenfall ............................................................................................................................ 9
2.2 The significance of lignite in the context of Germany’s energy transition ........................................ 11 2.3 Drawing up a road map for Vattenfall’s phaseout of brown coal electricity ..................................... 14
2.3.1 A review of power plants .................................................................................................. 14 14 2.3.2 An overview of surface mining ......................................................................................... 15 2.3.3 Assumptions and premises for phasing out lignite ........................................................... 17 2.3.4 The phaseout road map ................................................................................................... 17
2.4 Economic Aspects ........................................................................................................................... 23 2.4.1 Employement ................................................................................................................... 23 2.4.2 Follow-up costs of lignite mining and electricity generation ............................................. 24
3 Alternative Road Map 2030: Investments in Renewable Energies ................. 28
3.1 Methodology .................................................................................................................................... 29 3.2 A scenario-based estimate for 2030: methodology and assumptions ............................................. 33 3.3 Renewable energy potential in Brandenburg and Saxony .............................................................. 35
3.3.1 Brandenburg ..................................................................................................................... 35 3.3.2 Saxony ............................................................................................................................. 37
3.4 Conclusions under the Alternative Road Map 2030 ........................................................................ 39
4 Conclusion .......................................................................................................... 46
5 Literature ............................................................................................................. 48
4 | K. HEINBACH, M. BOST, S. SALECKI, J. WEISS
List of Figures
Figure 1: The needed reduction in greenhouse gas emissions released by Vattenfall’s
lignite operations to achieve Vattenfall’s own low-carbon targets by 2020 ................. 11 Figure 2: CO2 emissions from lignite-fired electricity in the phaseout road map ........................ 20 Figure 3: Lignite-fired electricity production in the phaseout road map ...................................... 21 Figure 4: Reduction of installed capacity in the phaseout road map .......................................... 21 Figure 5: Reduction in lignite production according to the phaseout road map .......................... 22 Figure 6: Reduction of lignite reserves in the surface mines licensed by the beginning of
2013 ............................................................................................................................ 22 Figure 7: Mining-related provisions of Vattenfall Europe Mining AG from 2005 to 2013 ............ 27 Figure 8: Defining value creation in the IÖW's WeBEE model ................................................... 31 Figure 9: Presentation of an example of value creation computation in the WeBEE model of
IÖW ............................................................................................................................. 33 Figure 10: Direct value creation effects at the state level in 2030 from renewable energy
expansion under the Alternative Road Map 2030, by technology area and local content scenarios ........................................................................................................ 45
ROAD MAP FOR TRANSITION — VATTENFALL 2030 | 5
List of Tables Table 1: The needed reduction in greenhouse gas emissions released by Vattenfall’s
lignite operations to achieve Vattenfall’s own low-carbon targets by 2020 ................. 10 Table 2: Characteristics of various types of fossil fuel-fired power plants ................................. 12 Table 3: Overview of various assumptions or forecasts regarding the development of the
utilized capacity of lignite-fired power plants (full-load hours) .................................... 13 Table 4: Overview of Vattenfall’s lignite-fired power plants ...................................................... 15 Table 5: Overview of surface mining in the Lausitz region and central Germany .................... 16 Table 6: Development of utilized capacity of Vattenfall power plants in phaseout schedule
[%] ............................................................................................................................... 18 Table 7: Benchmark data for phasing out lignite from 2015 to 2030 ......................................... 19 Table 8: Benchmark data for phasing out lignite from 2015 to 2030 ......................................... 19 Table 9: Environmental costs of electricity generation in Germany .......................................... 25 Table 10: Renewable energy potential for power generation in Brandenburg ............................ 37 Table 11: Renewable energy potential for power generation in Saxony ..................................... 39 Table 12: Renewable energy expansion in Brandenburg under the Alternative Road Map
2030 ............................................................................................................................ 40 Table 13: Renewable energy expansion in Saxony under the Alternative Road Map 2030 ....... 41 Table 14: Investment in renewable energy technologies in the Alternative Road Map 2030
and the effect on jobs in 2030, by technology area ..................................................... 42 Table 15: Direct value created and employment effects in 2030 from renewable energy
expansion in the Alternative Road Map – lower local content ..................................... 43 Table 16: Direct value created and employment effects in 2030 from renewable energy
expansion under the Alternative Road Map – medium local content .......................... 43 Table 17: Direct value created and employment effects in 2030 from renewable energy
expansion under the Alternative Road Map – higher local content ............................. 44
6 | K. HEINBACH, M. BOST, S. SALECKI, J. WEISS
1 Introduction In view of the Swedish government’s low-carbon objectives, Vattenfall is considering selling off its lignite (brown coal) operations in Germany. Any new owner would want this business to turn as high a profit for as long as possible and further expand surface mining in accordance with existing plans. Permits for these plans would commit the region to the environmentally damaging generation of electricity from coal until at least 2050. A possible alternative would be not to sell; instead Vattenfall could systematically stop generating electricity from brown coal while expanding renewable energies. This would make Vattenfall a pioneer in climate protection and drive forward the phaseout of environmentally damaging brown coal, as it is unlikely that third parties would continue coal mining operations once the existing coal-fired power plants were decommissioned and demolished.
This scenario brings up the question of what an appropriate climate-friendly and socially responsible road map for transition to be completed by 2030 would look like. Such a transition road map would need to pursue the following goals with a view to phasing out the generation of coal-fired electricity:
– No further open-pit mines to be opened up beyond those approved in late 2013 (this applies to any surface mines approved since then and any other potential sites).
– An end to the production and use of lignite in the Lausitz region by 2030.
– Vattenfall must adhere to its own CO2 targets for 2020.
– The German state of Brandenburg must honor its CO2 target for 2030.
– Vattenfall will make an appropriate contribution to Germany’s national action program for climate protection.
Another goal would be to create opportunities for the brown coal regions through the active investment of Vattenfall. With this in mind, the transition road map also includes targets for the expansion of renewable energies by 2030 to counteract any loss of jobs in the area. In this short study, it is assumed that carbon capture, transport and storage (CCTS) technologies are not used in the power plants.
2 The Phaseout of Lignite A road map for Vattenfall’s exit from lignite-fired electricity will be laid out in this chapter. In order to provide a general framework, we will start by delineating Germany’s most important climate protection goals, as well as those of Vattenfall and the German states in which Vattenfall operates lignite-fired power plants (Chapter 2.1). This will be followed by a brief outline of the significance of brown coal in the context of Germany’s energy transition (Chapter 2.2). Building on this, a road map for the phaseout of lignite-fired electricity (Chapter 2.3) will be developed which will ensure that previously outlined climate protection goals are met and serve as the basis for a scenario of the expansion of renewable energies (Chapter 3).
ROAD MAP FOR TRANSITION — VATTENFALL 2030 | 7
2.1 Lignite in the context of low-carbon targets The burning of fossil fuels such as coal, gas and oil to generate electricity and heat, and to power machinery, emits large amounts of greenhouse gases such as carbon dioxide (CO2), resulting in a continuing increase in global temperatures since the beginning of the Industrial Revolution. The consequences of this human-induced climate change – an increasing number of droughts, more frequent floods, more severe storms and rising sea levels due to melting polar ice – can already be observed across the globe. Scientists predict that in coming decades these consequences could reach levels posing a threat to more and more people if we do not succeed in reducing greenhouse gas emissions. Since 2011, a total of 191 states and the European Union (EU) have been party to the United Nations Framework Convention on Climate Change of 1992 and the Kyoto Protocol of 1997, and are bound under international law to contain greenhouse gas emissions. In this context, the EU Member States committed themselves to the 20-20-20-targets to be met by 2020: a 20% reduction in greenhouse gas emissions from 1990 levels; a 20% increase in energy efficiency; and achieving a 20% share of renewable energies in total energy consumption.
From a historical point of view, industrial nations with high levels of fossil fuel consumption have already emitted a large amount of greenhouse gases and continue to do so today. They therefore have a special responsibility, prompting the German government and several German states to set particularly ambitious goals for the reduction of greenhouse gas emissions. Germany’s, Brandenburg’s, Berlin’s and Vattenfall’s greenhouse gas reduction targets are briefly outlined below to subsequently allow for a better understanding of the role Vattenfall’s lignite operations play in meeting these targets. Any secondary goals (regarding energy efficiency or the share of renewable energies) will not be discussed here.
Although Vattenfall also operates lignite-fired power plants in Saxony, the state has not yet set specific greenhouse gas reduction targets, but it does refer to lignite in the context of the energy and climate program (2013) as a ‘transitory technology’.
2.1.1 Germany’s national targets
The German government formulated ambitious climate targets for Germany in its energy plan. Annual greenhouse gas emissions are to be reduced by 40% from 1990 levels to a maximum of 750 million tons of carbon dioxide equivalents by 2020. The German government and the Bundestag have repeatedly confirmed this goal. In addition, a reduction path ending in 2050 has been laid out: a reduction of 55% by 2030; a reduction of 70% by 2040; a reduction of 80% to 95% by 2050 (BMU and BMWi 2010, 4).
By the end of 2014, emissions had already been reduced by about 27% to 912 million tons, but it has been apparent for some time now that if additional measures are not introduced the 40% target will definitely not be met. Thus the German government’s projection report of 2015 expects that the measures thus far adopted and implemented will only enable a reduction of 33% to 34% by 2020. On 3 December 2014, the German government therefore adopted the “Action Plan Climate Protection 2020”, which aims for additional savings in the electricity sector to reduce CO2 emissions by another 22 million tons.
To ensure this, in March 2015 the German Ministry for Economic Affairs and Energy (BMWi) proposed the introduction of a national ‘Klimabeitrag’ [national climate contribution scheme] to take effect in 2017. This national climate contribution scheme specifically targets older fossil fuel
8 | K. HEINBACH, M. BOST, S. SALECKI, J. WEISS
power plants with low efficiency and high CO2 emissions per kWh of electricity generated; it is meant to induce them to reduce their electricity output and thus their CO2 emissions. The measures apply to all fossil fuel power plants that are more than 20 years old, regardless of what kind of fuel they burn. Each power plant will receive an emissions allowance of 7 million tons of CO2 per GW of installed capacity. This allowance will decrease linearly to 3 million tons per GW once the power plant reaches its forty-first year of operation and will then remain constant at this level. A climate contribution levy will have to be paid for every ton of CO2 that exceeds the emissions allowance; the amount due is expected to be 18 to 20 euros per ton of CO2. This is meant to deter power plants from exceeding emissions allowances.
2.1.2 Brandenburg
Brandenburg has also introduced ambitious low-carbon targets as part of its energy strategy. For instance, by 2020, energy-related CO2 emissions are to be reduced by 40% from1990 levels and cut by 75% by 2030 (MWE 2012, 18). Brandenburg has already greatly expanded renewable energies in recent years, receiving three consecutive “Leitstern” (Guiding Star) awards from Germany’s Renewable Energy Agency from 2010 to 2012. In the years following the reunification of Germany, shutdowns and modernization projects in the country’s traditionally large and conventional power plant network had already resulted in a 36.5% reduction of greenhouse gas emissions by 2010, making the 40% target by 2020 look like it could be achieved without greater effort. However, since then, the utilized capacity of lignite-fired power plants has increased again so that the reduction achieved in 2012 amounted to only 34.6% (LUGV 2014, 7). CO2 emissions therefore must still be reduced by about 4.9 million tons by 2020.
The target for 2030 is even more ambitious, as the CO2 reduction the state is aiming for corresponds to the emissions of all of Brandenburg’s lignite-fired power plants put together. However, to date, the state’s energy strategy does not necessarily call for the phaseout of lignite-fired electricity to meet that target, but rather assumes that a reduction in emissions could be achieved mainly by capturing CO2 from flue gas and storing it underground, or by using it in chemical industries to manufacture base materials. But safety and acceptance issues related to carbon capture, transport, and storage (CCTS) technology have made it highly controversial. The German Institute for Economic Research (DIW Berlin) stated in 2014 that there was not a single industrial-scale CCTS plant in operation worldwide and that nine of the 20 European CCTS projects had been abandoned and the rest postponed (Oei et al. 2014, XVII; von Hirschhausen et al. 2012). Moreover, DIW Berlin believes that the potential for the material utilization of CO2 (carbon capture and use, CCU) in Germany is limited and concludes that “The development of lignite power plants that are low in CO2 emissions due to CO2 capture […] has thus far failed worldwide and does not offer any prospects for the sustainable use of lignite.” (Oei et al. 2014, I) If Brandenburg wants to meet the targets of its own climate policy, it has no choice but to begin phasing out lignite-fired power plants.
2.1.3 Berlin
With the enactment of its state energy program (2006), Berlin committed to the reduction of greenhouse gas emissions by at least 40% from 1990 levels (13 million tons of CO2) by 2020. Berlin reached a CO2 emissions agreement in 2009 with Vattenfall, which operates practically all of the city-state’s major combined heat and power (CHP) plants; the agreement stipulates that Vattenfall will reduce its greenhouse gas emissions in Berlin by 52% to 6.4 million tons by 2020. This corresponds to a reduction of 15% or 1 million tons of CO2 compared to average levels from
ROAD MAP FOR TRANSITION — VATTENFALL 2030 | 9
2006 to 2008 (State of Berlin, Vattenfall 2009). The agreement provides for the shutdown of Reuter C, the oldest and most inefficient anthracite-fired combined heat and power plant, to ensure that targets are met. In addition, the lignite-fired Klingenberg CHP plant is to be replaced by an efficient gas and steam power plant by 2020 (Stroedter 2015). Klingenberg emits 1.4 to 1.7 million tons of CO2 per year, making it the plant with the second highest CO2 emissions in Berlin following Reuter West. The agreement also stipulated that the burning of anthracite to fuel the Lichterfelde CHP plant would be replaced by efficient gas combustion; this project has been nearly completed.
An energy and low-carbon target program is currently being developed for Berlin with the aim of making the city climate neutral by 2050.
2.1.4 Vattenfall
Vattenfall is an internationally active company owned by the Swedish government. In 2012, business operations carried out by the company generated a total of 85 million tons of CO2 emissions, of which nearly 71% (60.3 million tons) were produced by the use of German lignite. The company’s operations in Germany focus predominantly on conventional methods of power generation, which is unusual compared to its other operations and its own sustainability targets. Vattenfall plans to shift this focus and make operations more sustainable in coming years. To this end, it intends to reduce CO2 emissions by 2020 to 65 million tons, and reduce them to half of 1990 levels by 2030. The company aspires to be totally CO2 neutral by 2050 (Vattenfall 2009; Vattenfall 2014; Vattenfall 2013). As a state-owned company, Vattenfall is under no obligation to maximize profits for other shareholders and therefore has more leeway than other energy companies to achieve these targets.
The present study poses the question of how high the contribution of Vattenfall’s brown coal sector should be to reduce overall emissions down to 65 million tons by 2020. Vattenfall already lists the contribution of various measures introduced to reduce CO2 emissions by 2020 in its annual and sustainability reports of 2013; these measures also affect their lignite operations (Table 1). Taking these measures into account, Vattenfall believes that it needs to bridge an existing gap of 14.6 million tons to meet its sustainability targets. In the present study, the following changes in CO2 emissions are taken into account based on the measures planned by Vattenfall: – In addition to reductions, there are plans to invest in replacement and growth; these
investments will initially result in an increase of 9.1 million tons in CO2 emissions. Vattenfall specifically mentions the Moorburg anthracite-fired CHP plant and the Lichterfelde gas CHP plant, which would replace older anthracite CHP plants in Berlin and Hamburg. The company also plans to replace the Buggenum power plant in the Netherlands.
– On the other hand, a reduction will result through the closure and decommissioning of power plants that are no longer profitable or that have reached the end of their operating lives; these are not specifically mentioned. As power plants frequently continue to operate longer than originally planned, and we can expect that some of the reduction measures will affect lignite-fired power plants (the shutdown of the Klingenberg CHP plant, for example), it can be safely assumed that one-third of the CO2 reductions listed by Vattenfall – amounting to 4 million tons – will be achieved by 2020 through the closure and decommissioning of operations that are not part of its brown coal division.
– The same applies to reductions amounting to 6.2 million tons expected by Vattenfall as a result of changes in the number of operating hours; this seems unlikely in view of the increase in the number of operating hours in recent years. Most of the fossil fuel power plants outside of
10 | K. HEINBACH, M. BOST, S. SALECKI, J. WEISS
Vattenfall’s brown coal division are thermal power stations whose output is used primarily to meet demand for heat. Since many urban energy and CO2 programs are striving to expand district heating systems, there seems to be no reason to expect a decline in the number of their operating hours. At most, a lower number of operating hours could actually be expected in power plants fired by natural gas – a comparatively expensive fuel – that are not used primarily to supply heat. Most of these power plants are located in the Netherlands and in 2013 generated about 2.4 million tons of CO2, which only accounts for roughly 2.8% of Vattenfall’s greenhouse gas emissions. Their relevance to the Dutch energy system cannot be adequately addressed here. Overall, we do not expect to see substantial reductions outside of the brown coal division, so such reductions are not taken into consideration in this study, although they are expected by Vattenfall.
– Other measures such as the planned sale of facilities and operations that no longer belong to the company’s core business (combined heat and power (CHP) plants in Denmark, CHPs in Sweden, engineering operations in Germany), and the co-firing of biomass in anthracite-fired power plants are however taken into account without deductions.
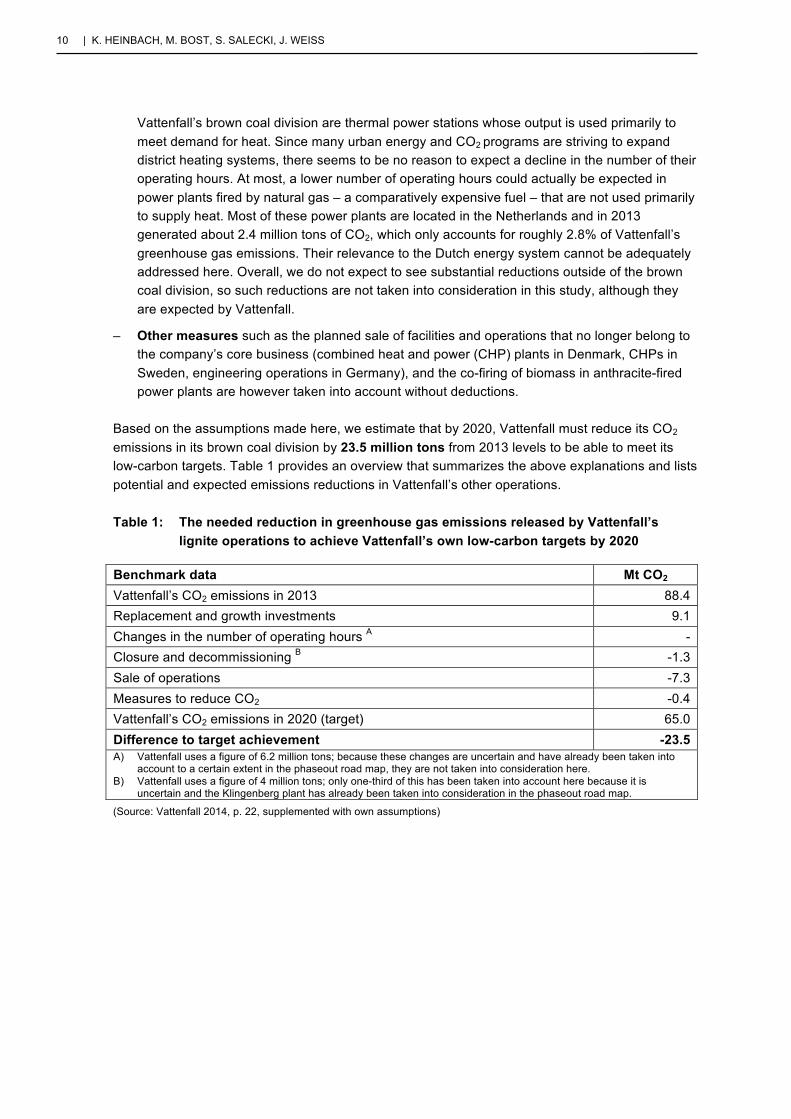
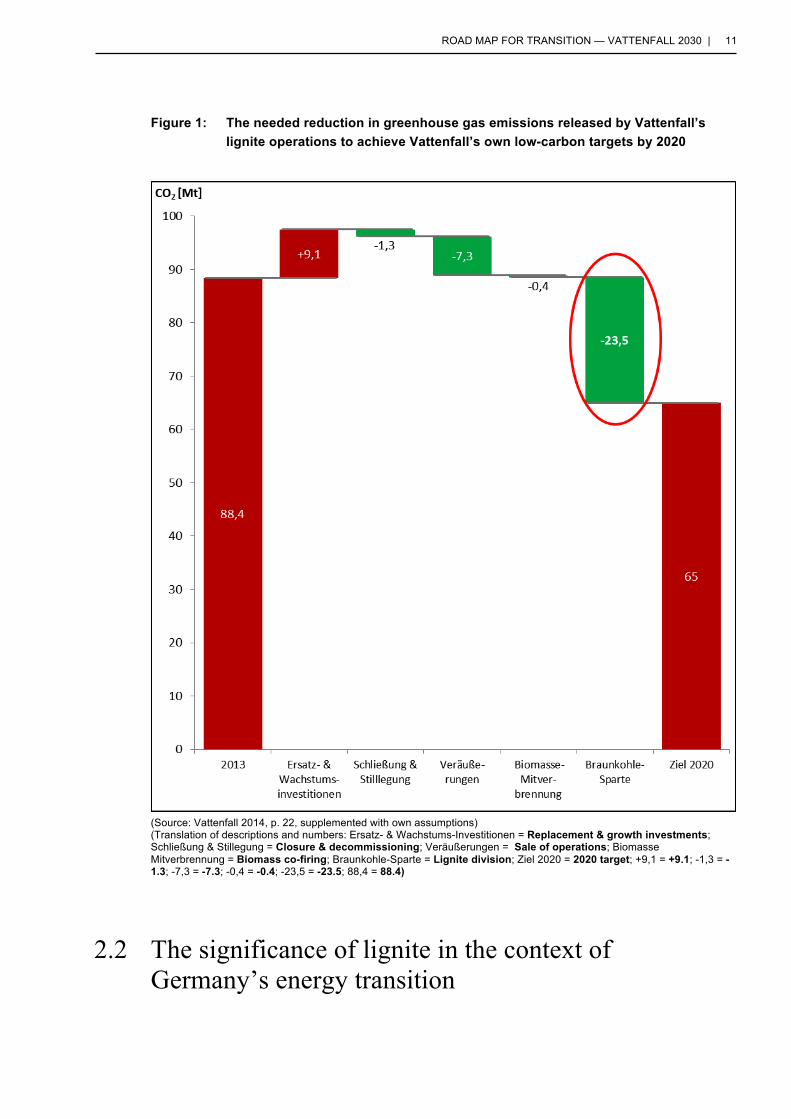
Based on the assumptions made here, we estimate that by 2020, Vattenfall must reduce its CO2 emissions in its brown coal division by 23.5 million tons from 2013 levels to be able to meet its low-carbon targets. Table 1 provides an overview that summarizes the above explanations and lists potential and expected emissions reductions in Vattenfall’s other operations.
Table 1: The needed reduction in greenhouse gas emissions released by Vattenfall’s lignite operations to achieve Vattenfall’s own low-carbon targets by 2020
Benchmark data Mt CO2 Vattenfall’s CO2 emissions in 2013 88.4 Replacement and growth investments 9.1 Changes in the number of operating hours A - Closure and decommissioning B -1.3 Sale of operations -7.3 Measures to reduce CO2 -0.4 Vattenfall’s CO2 emissions in 2020 (target) 65.0 Difference to target achievement -23.5 A) Vattenfall uses a figure of 6.2 million tons; because these changes are uncertain and have already been taken into
account to a certain extent in the phaseout road map, they are not taken into consideration here. B) Vattenfall uses a figure of 4 million tons; only one-third of this has been taken into account here because it is
uncertain and the Klingenberg plant has already been taken into consideration in the phaseout road map.
(Source: Vattenfall 2014, p. 22, supplemented with own assumptions)
ROAD MAP FOR TRANSITION — VATTENFALL 2030 | 11
Figure 1: The needed reduction in greenhouse gas emissions released by Vattenfall’s lignite operations to achieve Vattenfall’s own low-carbon targets by 2020
(Source: Vattenfall 2014, p. 22, supplemented with own assumptions) (Translation of descriptions and numbers: Ersatz- & Wachstums-Investitionen = Replacement & growth investments; Schließung & Stillegung = Closure & decommissioning; Veräußerungen = Sale of operations; Biomasse Mitverbrennung = Biomass co-firing; Braunkohle-Sparte = Lignite division; Ziel 2020 = 2020 target; +9,1 = +9.1; -1,3 = -1.3; -7,3 = -7.3; -0,4 = -0.4; -23,5 = -23.5; 88,4 = 88.4)
2.2 The significance of lignite in the context of Germany’s energy transition
12 | K. HEINBACH, M. BOST, S. SALECKI, J. WEISS
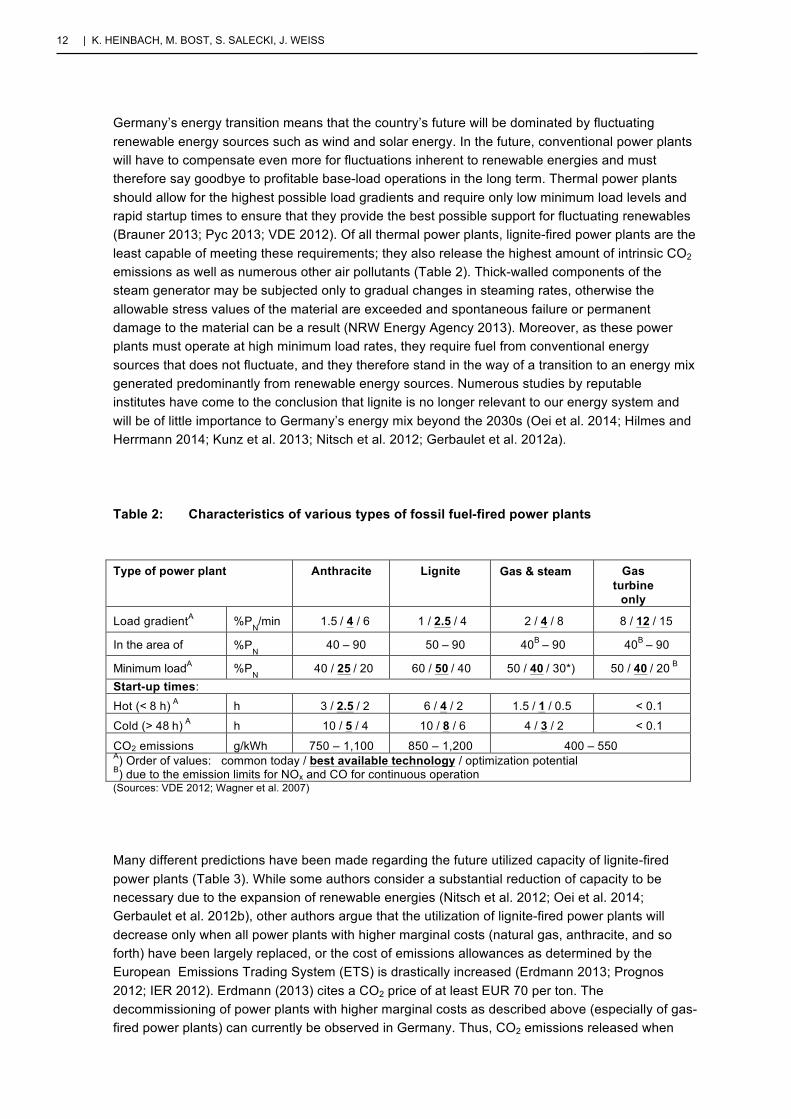
Germany’s energy transition means that the country’s future will be dominated by fluctuating renewable energy sources such as wind and solar energy. In the future, conventional power plants will have to compensate even more for fluctuations inherent to renewable energies and must therefore say goodbye to profitable base-load operations in the long term. Thermal power plants should allow for the highest possible load gradients and require only low minimum load levels and rapid startup times to ensure that they provide the best possible support for fluctuating renewables (Brauner 2013; Pyc 2013; VDE 2012). Of all thermal power plants, lignite-fired power plants are the least capable of meeting these requirements; they also release the highest amount of intrinsic CO2 emissions as well as numerous other air pollutants (Table 2). Thick-walled components of the steam generator may be subjected only to gradual changes in steaming rates, otherwise the allowable stress values of the material are exceeded and spontaneous failure or permanent damage to the material can be a result (NRW Energy Agency 2013). Moreover, as these power plants must operate at high minimum load rates, they require fuel from conventional energy sources that does not fluctuate, and they therefore stand in the way of a transition to an energy mix generated predominantly from renewable energy sources. Numerous studies by reputable institutes have come to the conclusion that lignite is no longer relevant to our energy system and will be of little importance to Germany’s energy mix beyond the 2030s (Oei et al. 2014; Hilmes and Herrmann 2014; Kunz et al. 2013; Nitsch et al. 2012; Gerbaulet et al. 2012a).
Table 2: Characteristics of various types of fossil fuel-fired power plants
Type of power plant Anthracite Lignite Gas & steam Gas turbine
only Load gradientA
%P
N/min
1.5 / 4 / 6
1 / 2.5 / 4
2 / 4 / 8
8 / 12 / 15
In the area of %PN 40 – 90 50 – 90 40B – 90 40B – 90
Minimum loadA %PN 40 / 25 / 20 60 / 50 / 40 50 / 40 / 30*) 50 / 40 / 20 B
Start-up times: Hot (< 8 h) A h 3 / 2.5 / 2 6 / 4 / 2 1.5 / 1 / 0.5 < 0.1
Cold (> 48 h) A h 10 / 5 / 4 10 / 8 / 6 4 / 3 / 2 < 0.1
CO2 emissions g/kWh 750 – 1,100 850 – 1,200 400 – 550 A) Order of values: common today / best available technology / optimization potential B) due to the emission limits for NOx and CO for continuous operation
(Sources: VDE 2012; Wagner et al. 2007)
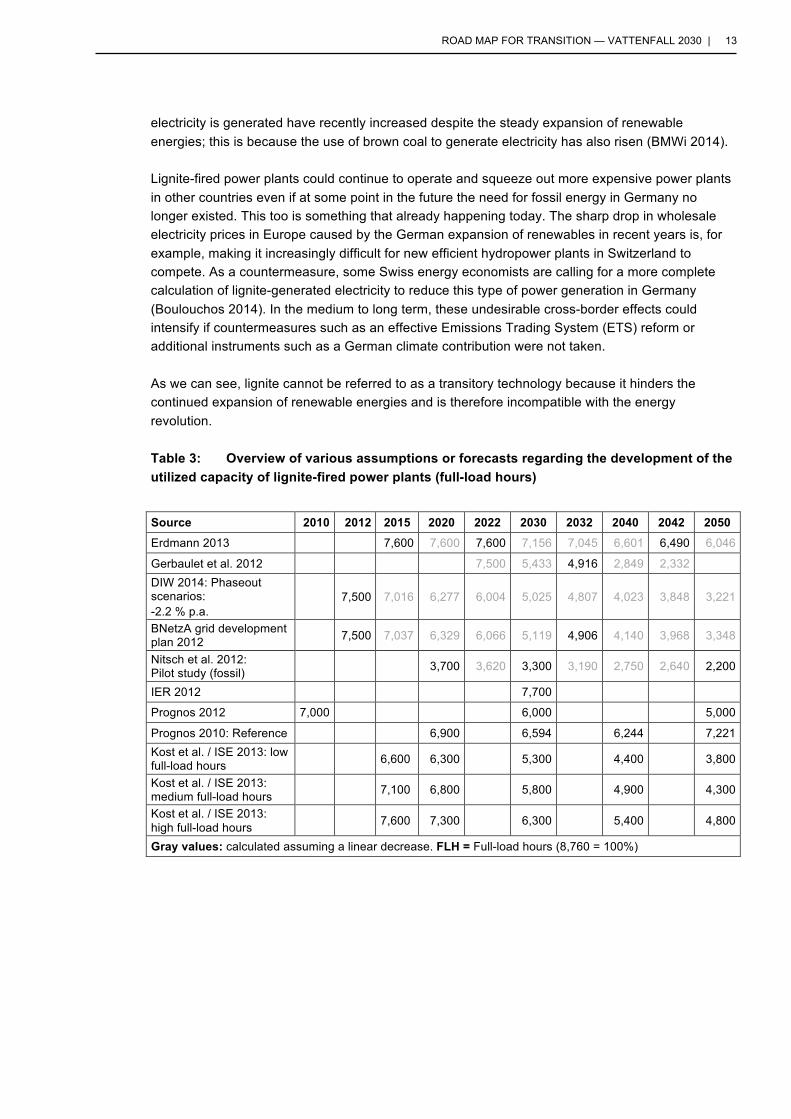
Many different predictions have been made regarding the future utilized capacity of lignite-fired power plants (Table 3). While some authors consider a substantial reduction of capacity to be necessary due to the expansion of renewable energies (Nitsch et al. 2012; Oei et al. 2014; Gerbaulet et al. 2012b), other authors argue that the utilization of lignite-fired power plants will decrease only when all power plants with higher marginal costs (natural gas, anthracite, and so forth) have been largely replaced, or the cost of emissions allowances as determined by the European Emissions Trading System (ETS) is drastically increased (Erdmann 2013; Prognos 2012; IER 2012). Erdmann (2013) cites a CO2 price of at least EUR 70 per ton. The decommissioning of power plants with higher marginal costs as described above (especially of gas-fired power plants) can currently be observed in Germany. Thus, CO2 emissions released when
ROAD MAP FOR TRANSITION — VATTENFALL 2030 | 13
electricity is generated have recently increased despite the steady expansion of renewable energies; this is because the use of brown coal to generate electricity has also risen (BMWi 2014).
Lignite-fired power plants could continue to operate and squeeze out more expensive power plants in other countries even if at some point in the future the need for fossil energy in Germany no longer existed. This too is something that already happening today. The sharp drop in wholesale electricity prices in Europe caused by the German expansion of renewables in recent years is, for example, making it increasingly difficult for new efficient hydropower plants in Switzerland to compete. As a countermeasure, some Swiss energy economists are calling for a more complete calculation of lignite-generated electricity to reduce this type of power generation in Germany (Boulouchos 2014). In the medium to long term, these undesirable cross-border effects could intensify if countermeasures such as an effective Emissions Trading System (ETS) reform or additional instruments such as a German climate contribution were not taken.
As we can see, lignite cannot be referred to as a transitory technology because it hinders the continued expansion of renewable energies and is therefore incompatible with the energy revolution.
Table 3: Overview of various assumptions or forecasts regarding the development of the utilized capacity of lignite-fired power plants (full-load hours)
Source 2010 2012 2015 2020 2022 2030 2032 2040 2042 2050 Erdmann 2013 7,600 7,600 7,600 7,156 7,045 6,601 6,490 6,046
Gerbaulet et al. 2012 7,500 5,433 4,916 2,849 2,332
DIW 2014: Phaseout scenarios: -2.2 % p.a.
7,500 7,016 6,277 6,004 5,025 4,807 4,023 3,848 3,221
BNetzA grid development plan 2012 7,500 7,037 6,329 6,066 5,119 4,906 4,140 3,968 3,348
Nitsch et al. 2012: Pilot study (fossil) 3,700 3,620 3,300 3,190 2,750 2,640 2,200
IER 2012 7,700
Prognos 2012 7,000 6,000 5,000
Prognos 2010: Reference 6,900 6,594 6,244 7,221 Kost et al. / ISE 2013: low full-load hours 6,600 6,300 5,300 4,400 3,800
Kost et al. / ISE 2013: medium full-load hours 7,100 6,800 5,800 4,900 4,300
Kost et al. / ISE 2013: high full-load hours 7,600 7,300 6,300 5,400 4,800
Gray values: calculated assuming a linear decrease. FLH = Full-load hours (8,760 = 100%)
14 | K. HEINBACH, M. BOST, S. SALECKI, J. WEISS
2.3 Drawing up a road map for Vattenfall’s phaseout of brown coal electricity
2.3.1 A review of power plants
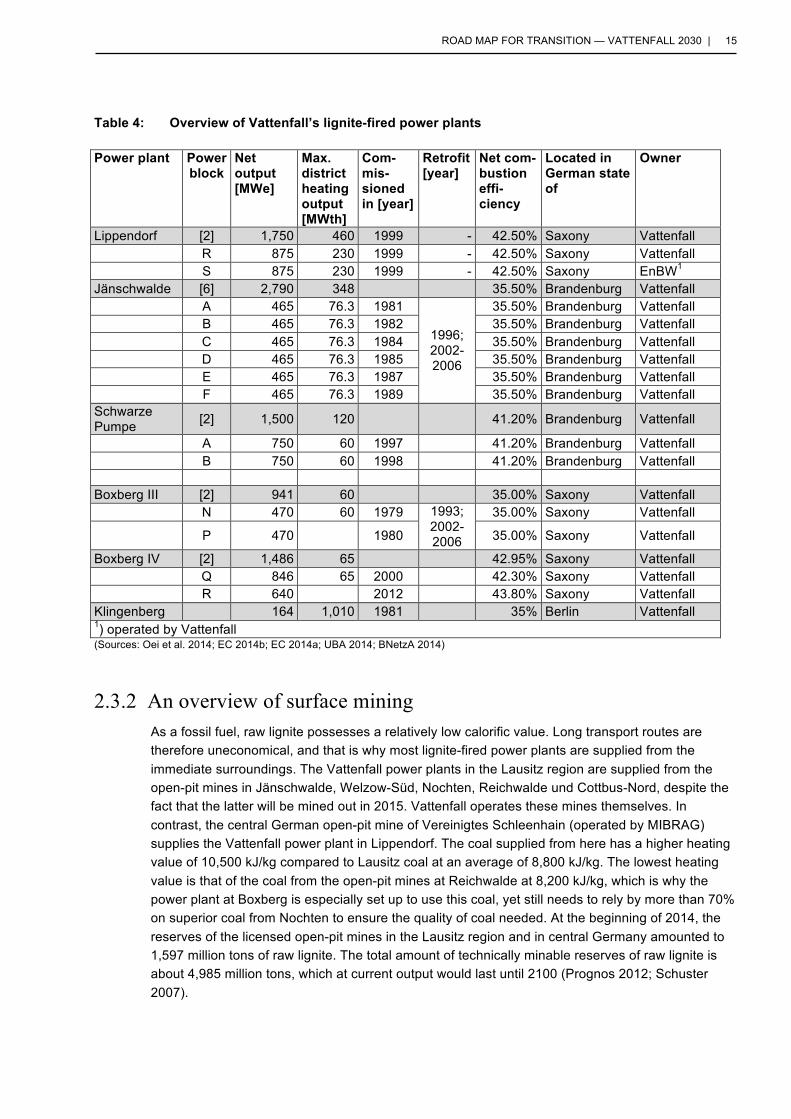
Vattenfall operates six large lignite-fired power plants with a total of 15 power blocks. Table 4 below illustrates the most important technical data of these power plants. Boxberg III (1979/1980) and Jänschwalde (1981-89) are the oldest and most inefficient of these plants with a combustion efficiency of 35%. Correspondingly, they also have the highest intrinsic CO2 emissions at around 1,150g CO2/kWh. The newer power plants Schwarze Pumpe (1997/98), Lippendorf (1999), and Boxberg IV (2000/2012), have far higher combustion efficiencies ranging from 41.2% to 43.8%, and accordingly lower CO2 emissions between 940 and 1,050g/kWh.
The Lippendorf plant is a special case because although Vattenfall operates both of the plant’s power blocks, Block S is owned by EnBW. This is the only power plant that is not supplied from a Vattenfall-operated surface mine. Coal is supplied from the Vereinigtes Schleenhain open surface mine run by Mitteldeutschen Braunkohlengesellschaft (MIBRAG). All other Vattenfall-operated power blocks are owned by Vattenfall and supplied by Vattenfall-owned open-pit mines.
Another special case is the Klingenberg combined heat and power (CHP) plant in Berlin that is supplied by open-pit mines in Cottbus. Its primary role is to provide district heating. Supplying electricity has a secondary role, which is why its utilization varies enormously according to heating needs. In contrast, electricity generation is the main purpose of Vattenfall’s other brown coal power plants, in which heat generation plays a comparatively small role.
In Brandenburg, there are two other lignite-fired CHP plants in Cottbus and Frankfurt/Oder. These are not owned or supplied by Vattenfall. With an electrical capacity of 74 and 45 MW respectively, they hardly compare with the other Brandenburg power plants. As with the Klingenberg power plant, they are fueled by a mix of lignite, natural gas, and heating oil. Since the focus of this study is on Vattenfall’s power plants, the two above-mentioned plants will not be discussed in particular later, nor will other fossil-fueled Vattenfall power plants (using anthracite, natural gas, oil) because they do not burn brown coal.
ROAD MAP FOR TRANSITION — VATTENFALL 2030 | 15
Table 4: Overview of Vattenfall’s lignite-fired power plants Power plant Power
block Net output [MWe]
Max. district heating output [MWth]
Com-mis-sioned in [year]
Retrofit [year]
Net com-bustion effi-ciency
Located in German state of
Owner
Lippendorf [2] 1,750 460 1999 - 42.50% Saxony Vattenfall
R 875 230 1999 - 42.50% Saxony Vattenfall
S 875 230 1999 - 42.50% Saxony EnBW1 Jänschwalde [6] 2,790 348 35.50% Brandenburg Vattenfall
A 465 76.3 1981
1996; 2002-2006
35.50% Brandenburg Vattenfall
B 465 76.3 1982 35.50% Brandenburg Vattenfall
C 465 76.3 1984 35.50% Brandenburg Vattenfall
D 465 76.3 1985 35.50% Brandenburg Vattenfall
E 465 76.3 1987 35.50% Brandenburg Vattenfall
F 465 76.3 1989 35.50% Brandenburg Vattenfall Schwarze Pumpe [2] 1,500 120 41.20% Brandenburg Vattenfall
A 750 60 1997 41.20% Brandenburg Vattenfall B 750 60 1998 41.20% Brandenburg Vattenfall Boxberg III [2] 941 60 35.00% Saxony Vattenfall N 470 60 1979 1993;
2002-2006
35.00% Saxony Vattenfall
P 470 1980 35.00% Saxony Vattenfall
Boxberg IV [2] 1,486 65 42.95% Saxony Vattenfall Q 846 65 2000 42.30% Saxony Vattenfall R 640 2012 43.80% Saxony Vattenfall Klingenberg 164 1,010 1981 35% Berlin Vattenfall 1) operated by Vattenfall (Sources: Oei et al. 2014; EC 2014b; EC 2014a; UBA 2014; BNetzA 2014)
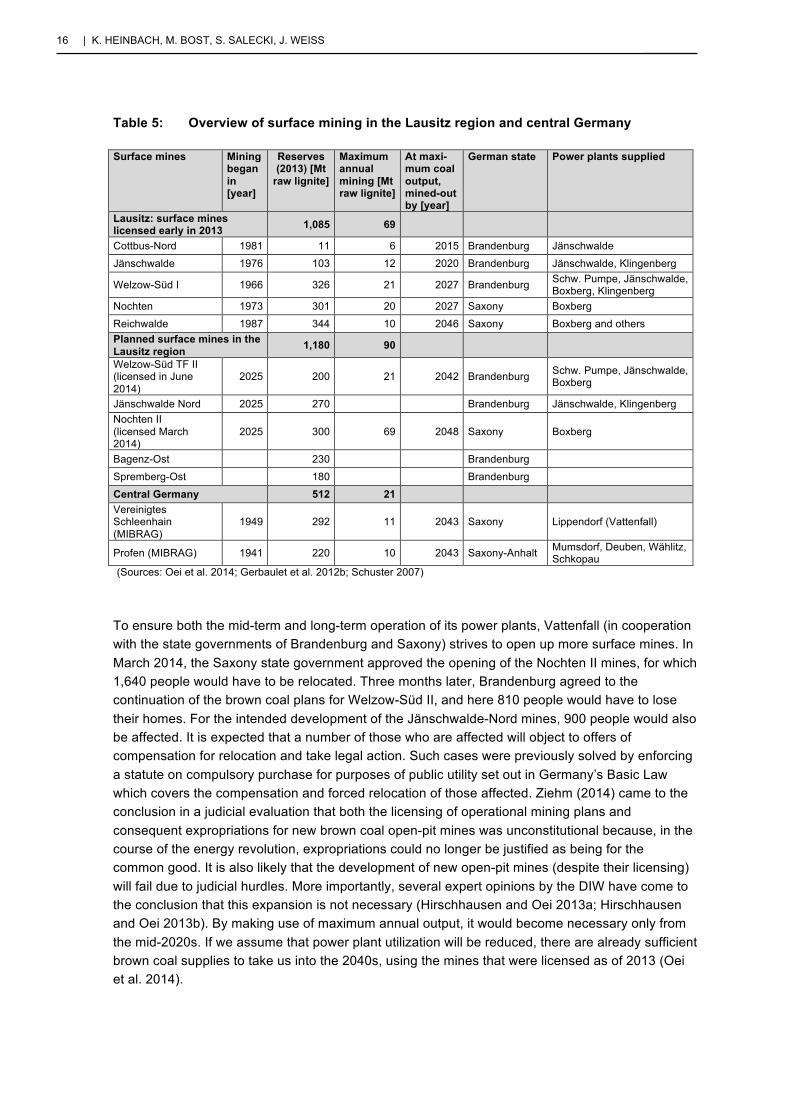
2.3.2 An overview of surface mining As a fossil fuel, raw lignite possesses a relatively low calorific value. Long transport routes are therefore uneconomical, and that is why most lignite-fired power plants are supplied from the immediate surroundings. The Vattenfall power plants in the Lausitz region are supplied from the open-pit mines in Jänschwalde, Welzow-Süd, Nochten, Reichwalde und Cottbus-Nord, despite the fact that the latter will be mined out in 2015. Vattenfall operates these mines themselves. In contrast, the central German open-pit mine of Vereinigtes Schleenhain (operated by MIBRAG) supplies the Vattenfall power plant in Lippendorf. The coal supplied from here has a higher heating value of 10,500 kJ/kg compared to Lausitz coal at an average of 8,800 kJ/kg. The lowest heating value is that of the coal from the open-pit mines at Reichwalde at 8,200 kJ/kg, which is why the power plant at Boxberg is especially set up to use this coal, yet still needs to rely by more than 70% on superior coal from Nochten to ensure the quality of coal needed. At the beginning of 2014, the reserves of the licensed open-pit mines in the Lausitz region and in central Germany amounted to 1,597 million tons of raw lignite. The total amount of technically minable reserves of raw lignite is about 4,985 million tons, which at current output would last until 2100 (Prognos 2012; Schuster 2007).
16 | K. HEINBACH, M. BOST, S. SALECKI, J. WEISS
Table 5: Overview of surface mining in the Lausitz region and central Germany Surface mines Mining
began in [year]
Reserves (2013) [Mt
raw lignite]
Maximum annual mining [Mt raw lignite]
At maxi-mum coal output, mined-out by [year]
German state Power plants supplied
Lausitz: surface mines licensed early in 2013 1,085 69
Cottbus-Nord 1981 11 6 2015 Brandenburg Jänschwalde
Jänschwalde 1976 103 12 2020 Brandenburg Jänschwalde, Klingenberg
Welzow-Süd I 1966 326 21 2027 Brandenburg Schw. Pumpe, Jänschwalde, Boxberg, Klingenberg
Nochten 1973 301 20 2027 Saxony Boxberg
Reichwalde 1987 344 10 2046 Saxony Boxberg and others Planned surface mines in the Lausitz region 1,180 90
Welzow-Süd TF II (licensed in June 2014)
2025 200 21 2042 Brandenburg Schw. Pumpe, Jänschwalde, Boxberg
Jänschwalde Nord 2025 270 Brandenburg Jänschwalde, Klingenberg Nochten II (licensed March 2014)
2025 300 69 2048 Saxony Boxberg
Bagenz-Ost 230 Brandenburg
Spremberg-Ost 180 Brandenburg
Central Germany 512 21 Vereinigtes Schleenhain (MIBRAG)
1949 292 11 2043 Saxony Lippendorf (Vattenfall)
Profen (MIBRAG) 1941 220 10 2043 Saxony-Anhalt Mumsdorf, Deuben, Wählitz, Schkopau
(Sources: Oei et al. 2014; Gerbaulet et al. 2012b; Schuster 2007)
To ensure both the mid-term and long-term operation of its power plants, Vattenfall (in cooperation with the state governments of Brandenburg and Saxony) strives to open up more surface mines. In March 2014, the Saxony state government approved the opening of the Nochten II mines, for which 1,640 people would have to be relocated. Three months later, Brandenburg agreed to the continuation of the brown coal plans for Welzow-Süd II, and here 810 people would have to lose their homes. For the intended development of the Jänschwalde-Nord mines, 900 people would also be affected. It is expected that a number of those who are affected will object to offers of compensation for relocation and take legal action. Such cases were previously solved by enforcing a statute on compulsory purchase for purposes of public utility set out in Germany’s Basic Law which covers the compensation and forced relocation of those affected. Ziehm (2014) came to the conclusion in a judicial evaluation that both the licensing of operational mining plans and consequent expropriations for new brown coal open-pit mines was unconstitutional because, in the course of the energy revolution, expropriations could no longer be justified as being for the common good. It is also likely that the development of new open-pit mines (despite their licensing) will fail due to judicial hurdles. More importantly, several expert opinions by the DIW have come to the conclusion that this expansion is not necessary (Hirschhausen and Oei 2013a; Hirschhausen and Oei 2013b). By making use of maximum annual output, it would become necessary only from the mid-2020s. If we assume that power plant utilization will be reduced, there are already sufficient brown coal supplies to take us into the 2040s, using the mines that were licensed as of 2013 (Oei et al. 2014).
ROAD MAP FOR TRANSITION — VATTENFALL 2030 | 17
2.3.3 Assumptions and premises for phasing out lignite The following premises and assumptions were used to develop a road map for phasing out brown coal:
1. There is compliance with the climate protection objectives of the German government, the state of Brandenburg, and Vattenfall.
2. The restrictions regarding surface mines (calorific values, reserves and maximum output) are taken into account. Apart from the surface mines that were licensed up until the beginning of 2013, no further mines are opened, not even the Nochten II and Welzow-Süd II mines that were licensed in 2014.
3. There is a gradual but complete phaseout by 2030 of brown coal being used to generate electricity. This is structured as evenly as possible to allow the expansion of renewable energy sources to continue at the same time and to enable a socially acceptable transformation in employment.
4. We assume that today’s high utilized capacity of power plants remains constant at 72% to 92% until the end of 2016 because lignite-fired power plants sell a large share of their electricity up to four years in advance in the form of futures contracts, and because they are among the most economical power plants in Germany’s “merit order” ranking. From 2017, we assume that the climate contribution proposed by the German Ministry for Economic Affairs and Energy (BMWi) is introduced, which according to the BMWi should come into force by 2020. For this “phasing in”, we assume that the most seriously affected old power plants, Jänschwalde and Boxberg III, will not be able to stay within their emissions allowances immediately due to their futures contracts, and that their electricity production each year from 2017 until 2019 will correspond to the mean between that of the previous year and the emissions allowance. We also assume that from 2020, power plants will only generate electricity according to their emissions allowances, and that the climate contribution actually has the desired effect or that Vattenfall voluntarily stays within the emissions allowances.
2.3.4 The phaseout road map
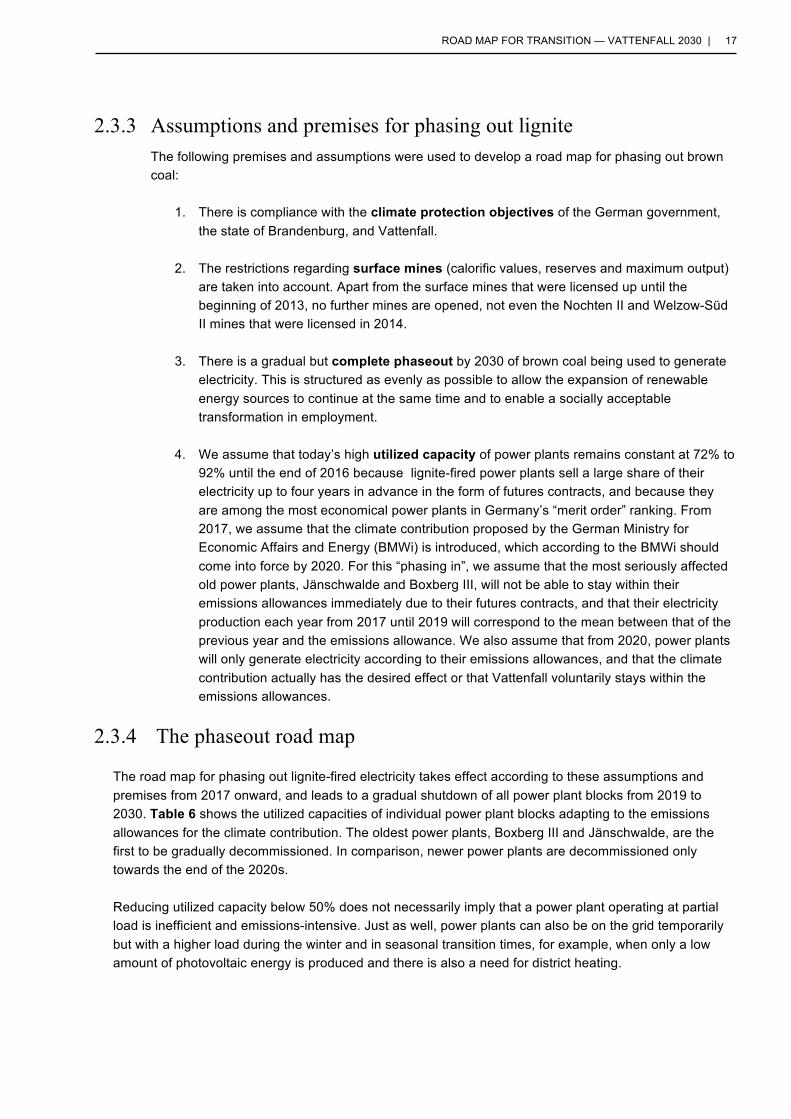
The road map for phasing out lignite-fired electricity takes effect according to these assumptions and premises from 2017 onward, and leads to a gradual shutdown of all power plant blocks from 2019 to 2030. Table 6 shows the utilized capacities of individual power plant blocks adapting to the emissions allowances for the climate contribution. The oldest power plants, Boxberg III and Jänschwalde, are the first to be gradually decommissioned. In comparison, newer power plants are decommissioned only towards the end of the 2020s.
Reducing utilized capacity below 50% does not necessarily imply that a power plant operating at partial load is inefficient and emissions-intensive. Just as well, power plants can also be on the grid temporarily but with a higher load during the winter and in seasonal transition times, for example, when only a low amount of photovoltaic energy is produced and there is also a need for district heating.
18 | K. HEINBACH, M. BOST, S. SALECKI, J. WEISS
Table 6: Development of utilized capacity of Vattenfall power plants in phaseout schedule [%]
Power plant Bl. MWe Start 2015 2016 2017 2018 2019 2020 2021 2022 2023 2024 2025 2026 2027 2028 2029 2030
Lippendorf [2] 1,750 1999 72 72 72 72 72 72 72 72 70 67 65 63 61 59 56 27
R 875 1999 72 72 72 72 72 72 72 72 70 67 65 63 61 59 56
S 875 1999 72 72 72 72 72 72 72 72 70 67 65 63 61 59 56 54
Jänschwalde [6] 2,790 90 90 69 57 50 36 28 21 14 7
A 465 1981 90 90 65 51 44
B 465 1982 90 90 66 53 45 36
C 465 1984 90 90 68 56 49 40 38
D 465 1985 90 90 69 57 51 42 40 38
E 465 1987 90 90 71 60 54 46 44 42 40
F 465 1989 90 90 73 63 58 50 48 46 44 42
Schwarze Pumpe [2] 1,500 82 82 82 81 80 77 75 73 71 68 66 64 61 59 29
A 750 1997 82 82 82 81 79 76 74 72 69 67 65 62 60 58 0
B 750 1998 82 82 82 82 81 79 76 74 72 69 67 65 62 60 58
Boxberg Werk III [2] 941 90 90 63 49 41 16
N 470 1979 90 90 63 48 40
P 470 1980 90 90 64 50 41 31
Boxberg Werk IV [2] 1,486 91 91 91 91 91 91 87 85 84 83 82 81 79 78 77 44
Q 846 2000 93 93 93 93 93 93 84 82 80 77 75 72 70 67 65
R 640 2012 89 89 89 89 89 89 89 89 89 89 89 89 89 89 89 89
Klingenberg
164 1981 54 52 49 47 44
The phaseout road map allows the climate protection goals of Vattenfall and Brandenburg to be reliably achieved (Table 7). The same holds true for Berlin with the cessation of lignite-fired electricity at the Klingenberg power plant. The CO2 reduction of 24.6 million tons also exceeds the total reduction foreseen in Germany’s national action program for climate protection in the electricity sector of 22 million tons, and thus contributes to achieving national goals for an energy plan by 2020, provided that other measures in the national action program have the intended effect. However, if additional emissions from the new Moorburg and Lichterfelde power plants are taken into account, an overall CO2 emissions reduction of only 15.5 million tons is reached at the federal level. Next to Vattenfall’s large contribution, other power plants must also make a significant contribution to enable Germany to reach its low-carbon targets by 2020. This includes lignite-fired plants in North Rhine-Westphalia, Saxony, and Saxony-Anhalt, as well as older anthracite-fueled power plants.
ROAD MAP FOR TRANSITION — VATTENFALL 2030 | 19
Moreover, the phaseout of lignite-fired electricity allows Brandenburg to achieve its emissions reduction target for 2030. Nationwide, there is no clear goal for the electricity sector in 2030. In this respect, we cannot analyze goal achievement here.
Table 7: Benchmark data for phasing out lignite from 2015 to 2030
CO2 reduction targets (2012 as base year)
2020 2030 Target Present Target Present
Vattenfall -23.4 -24.6 - -59 Brandenburg -4.9 -15.8 -36 -36 Germany’s national action program for climate protection -22.0A -24.6
A) This is the CO2 reduction goal in Germany’s national action program for climate protection that must be reached by 2020 in addition to existing measures and expected effects in Germany’s electricity sector.
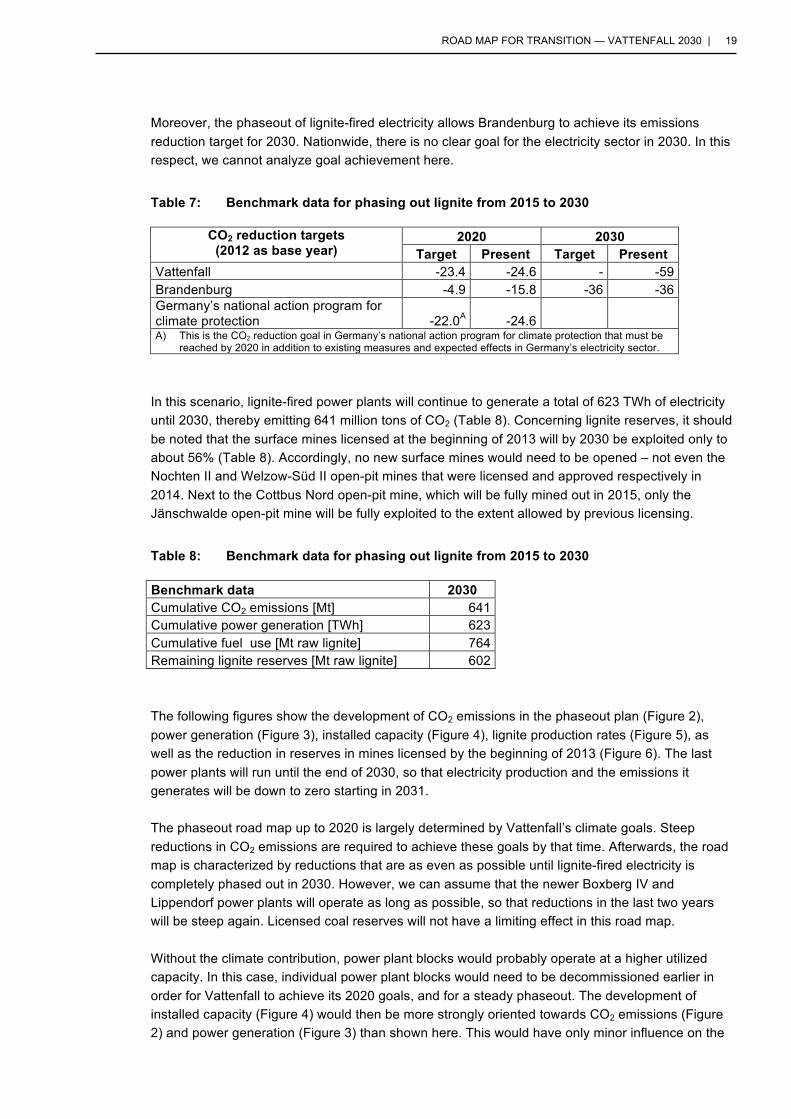
In this scenario, lignite-fired power plants will continue to generate a total of 623 TWh of electricity until 2030, thereby emitting 641 million tons of CO2 (Table 8). Concerning lignite reserves, it should be noted that the surface mines licensed at the beginning of 2013 will by 2030 be exploited only to about 56% (Table 8). Accordingly, no new surface mines would need to be opened – not even the Nochten II and Welzow-Süd II open-pit mines that were licensed and approved respectively in 2014. Next to the Cottbus Nord open-pit mine, which will be fully mined out in 2015, only the Jänschwalde open-pit mine will be fully exploited to the extent allowed by previous licensing.
Table 8: Benchmark data for phasing out lignite from 2015 to 2030
Benchmark data 2030 Cumulative CO2 emissions [Mt] 641 Cumulative power generation [TWh] 623 Cumulative fuel use [Mt raw lignite] 764 Remaining lignite reserves [Mt raw lignite] 602
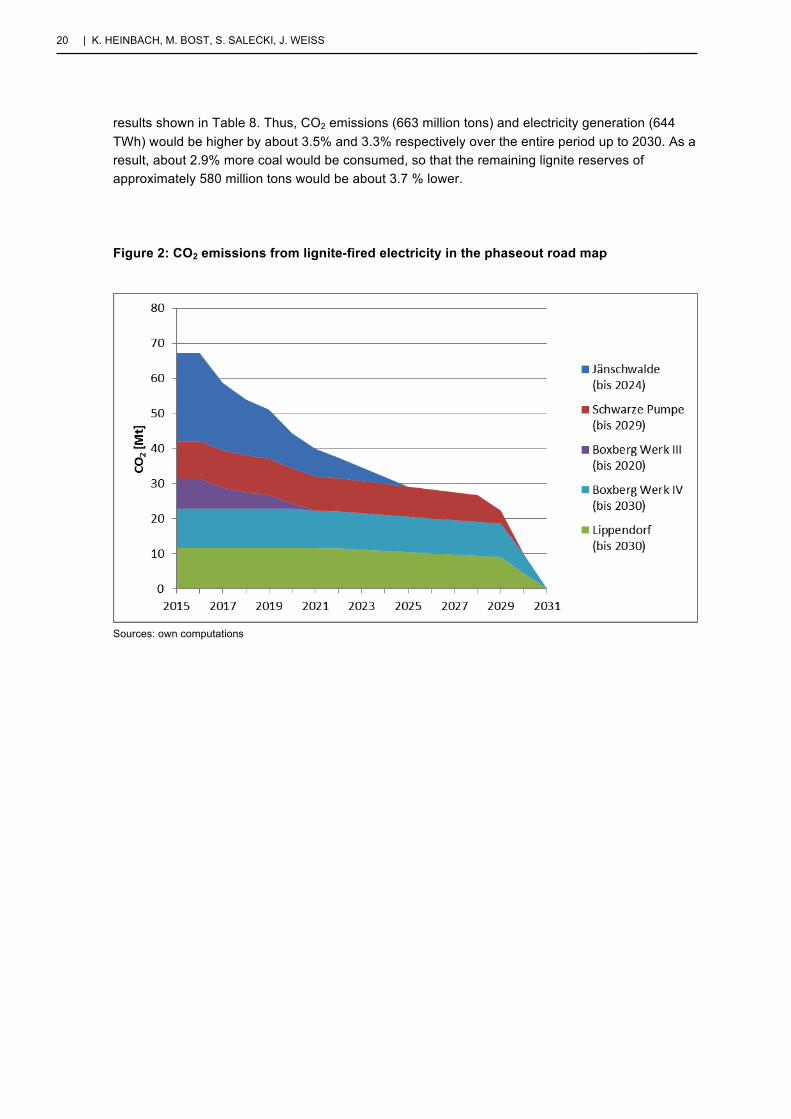
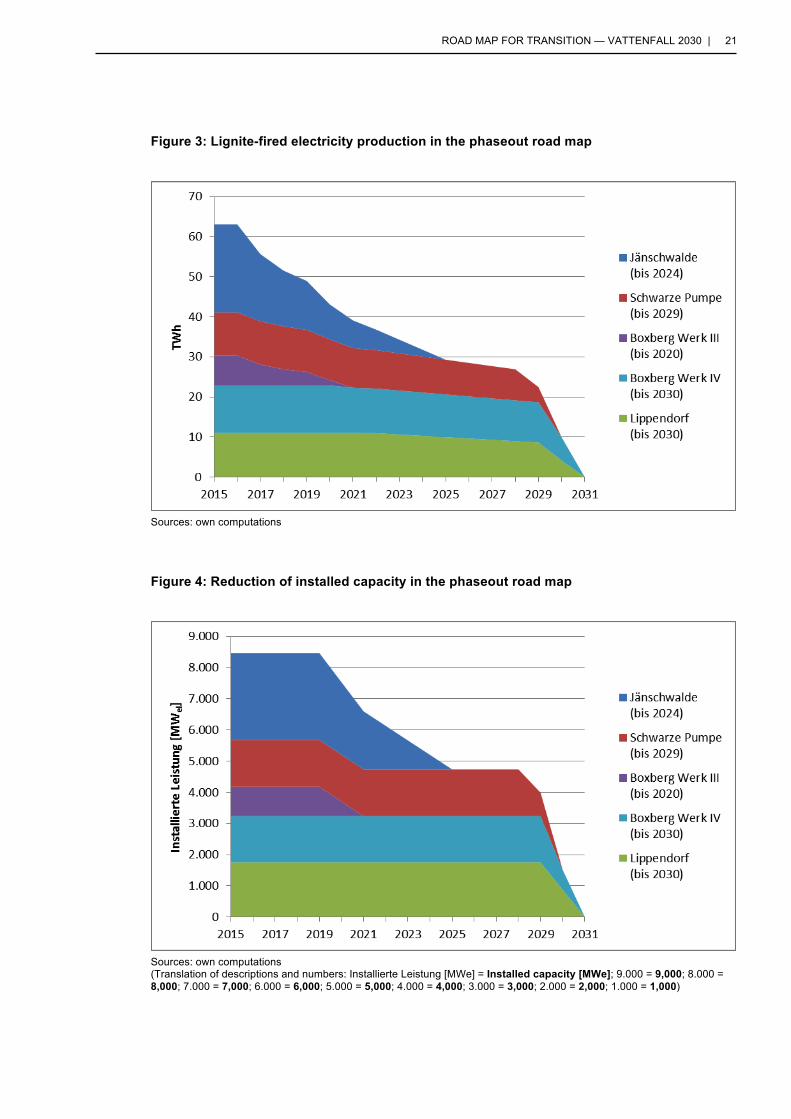
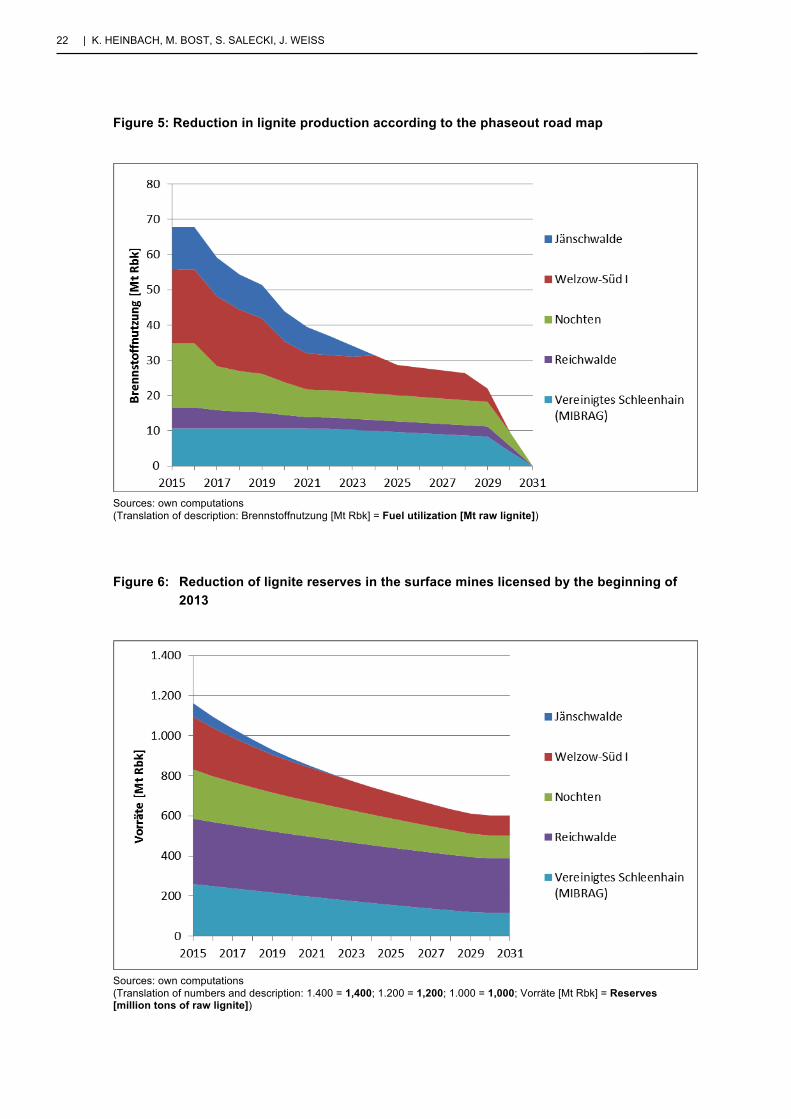
The following figures show the development of CO2 emissions in the phaseout plan (Figure 2), power generation (Figure 3), installed capacity (Figure 4), lignite production rates (Figure 5), as well as the reduction in reserves in mines licensed by the beginning of 2013 (Figure 6). The last power plants will run until the end of 2030, so that electricity production and the emissions it generates will be down to zero starting in 2031.
The phaseout road map up to 2020 is largely determined by Vattenfall’s climate goals. Steep reductions in CO2 emissions are required to achieve these goals by that time. Afterwards, the road map is characterized by reductions that are as even as possible until lignite-fired electricity is completely phased out in 2030. However, we can assume that the newer Boxberg IV and Lippendorf power plants will operate as long as possible, so that reductions in the last two years will be steep again. Licensed coal reserves will not have a limiting effect in this road map.
Without the climate contribution, power plant blocks would probably operate at a higher utilized capacity. In this case, individual power plant blocks would need to be decommissioned earlier in order for Vattenfall to achieve its 2020 goals, and for a steady phaseout. The development of installed capacity (Figure 4) would then be more strongly oriented towards CO2 emissions (Figure 2) and power generation (Figure 3) than shown here. This would have only minor influence on the
20 | K. HEINBACH, M. BOST, S. SALECKI, J. WEISS
results shown in Table 8. Thus, CO2 emissions (663 million tons) and electricity generation (644 TWh) would be higher by about 3.5% and 3.3% respectively over the entire period up to 2030. As a result, about 2.9% more coal would be consumed, so that the remaining lignite reserves of approximately 580 million tons would be about 3.7 % lower.
Figure 2: CO2 emissions from lignite-fired electricity in the phaseout road map
Sources: own computations
ROAD MAP FOR TRANSITION — VATTENFALL 2030 | 21
Figure 3: Lignite-fired electricity production in the phaseout road map
Sources: own computations
Figure 4: Reduction of installed capacity in the phaseout road map
Sources: own computations (Translation of descriptions and numbers: Installierte Leistung [MWe] = Installed capacity [MWe]; 9.000 = 9,000; 8.000 = 8,000; 7.000 = 7,000; 6.000 = 6,000; 5.000 = 5,000; 4.000 = 4,000; 3.000 = 3,000; 2.000 = 2,000; 1.000 = 1,000)
22 | K. HEINBACH, M. BOST, S. SALECKI, J. WEISS
Figure 5: Reduction in lignite production according to the phaseout road map
Sources: own computations (Translation of description: Brennstoffnutzung [Mt Rbk] = Fuel utilization [Mt raw lignite])
Figure 6: Reduction of lignite reserves in the surface mines licensed by the beginning of 2013
Sources: own computations (Translation of numbers and description: 1.400 = 1,400; 1.200 = 1,200; 1.000 = 1,000; Vorräte [Mt Rbk] = Reserves [million tons of raw lignite])
ROAD MAP FOR TRANSITION — VATTENFALL 2030 | 23
2.4 Economic aspects If, instead of selling its brown coal operations in the Lausitz region, Vattenfall were to phase out brown coal by 2030 as described in the road map above, it would, on one hand, affect the employment structure in the region. On the other hand, the phaseout would also have an effect on the development of the costs of climate change from surface mining and the use of lignite and the impact they both have on people and the environment. In the present study, selected economic aspects of such a development will be examined more closely. More specifically:
– The study will compare the consequences of expected job cuts as a result of the phaseout of
surface mining and the use of lignite for electricity in the Lausitz region by 2030 to the consequences of continued mining activities and operation of lignite-fired power plants by potential buyers.
– It will also compare selected costs that could be avoided if Vattenfall were to systematically phase out lignite to the costs of continued lignite mining activities and the generation of electricity by potential buyers.
2.4.1 Employment
In 2010, Vattenfall employed nearly 8,200 people in its brown coal mining operations and lignite-fired power plants. That corresponds to about 7,800 full-time positions (Prognos 2011). If Vattenfall were to phase out brown coal operations in the Lausitz region as described in subsection 2.1, the jobs that depend on these activities would also be eliminated by 2030. A certain number of temporary jobs would be created because Vattenfall would have to dismantle power plants and rehabilitate brown coal mining sites. But it is difficult to quantify the effect these two activities would have on employment figures (Oei et al. 2014), making it impossible to include them in calculations in this study. However, current employment figures cannot be used as a benchmark for the comparison of the number of jobs lost to the phaseout of lignite with the employment situation created through the sale of Vattenfall’s brown coal interests and their continued operation by potential buyers.
Even if coal-mining activities continue and power plants are kept in operation, employment directly associated with the brown coal industry is expected to decline by 2030. A study commissioned by Vattenfall came to the same conclusion (Prognos 2011). This is because a reduction in brown coal electricity and the CO2 emissions it produces is absolutely necessary to ensure compliance with the German government’s low-carbon targets, as stipulated in its energy plan of 2010, reaffirmed in its decision of 2011 to phase out nuclear energy, and in its Action Plan Climate Protection 2020 adopted in late 2014. The study carried out by Prognos shows what the development of employment figures up to 2030 could look like, taking into account the climate protection targets set by the German government. According to the study, some 11,180 people in eastern Germany were employed directly by the brown coal industry in 2010 (Prognos 2011). In the “Bundesregierung 2011” (German Government 2011) scenario, the German government’s low-carbon targets correspond to the government’s energy plan and its decision to phase out nuclear energy. In this scenario, the number of jobs will have decreased to 5,860 by 2030 (Prognos 2011), which corresponds roughly to a 48% drop in employment from 2010. Using the same target scenario for 2030, Prognos (2012) created a forecast for employment trends in the brown coal industry specifically tailored to the situation in the state of Brandenburg. The findings of the study
24 | K. HEINBACH, M. BOST, S. SALECKI, J. WEISS
show that by 2030, the number of jobs will have decreased by about 50% from 2010. Based on these findings, the present study assumes that by 2030 – to comply with the German government’s low-carbon targets – the current number of jobs at brown coal mining sites and lignite-fired power plants operated by Vattenfall in the Lausitz region will decline by half even if operations are sold and maintained. Increasingly ambitious targets – for instance, the introduction of the ‘Klimabeitrag’, the national climate contribution scheme currently under debate, could result in even lower employment rates by 2030. The Lausitz region would lose 4,100 jobs as a direct result of the phaseout of lignite; those jobs would be saved if the brown coal industry maintained mining operations and kept power plants in operation. If we assume that the distribution of full-time and part-time positions in 2030 is the same as today’s, that figure would correspond to roughly 3,900 full-time positions. As already mentioned above, the dismantling of power plants and the rehabilitation of mining sites would create temporary jobs; these however cannot be readily quantified here.
Since there are no alternatives for the future development of the brown coal industry, this study relies on the employment figures from Prognos for estimating the number of jobs that will be lost in the brown coal industry. In so doing, consideration must be given to the fact that the underlying studies were commissioned by Vattenfall so that the independence of the figures computed is somewhat in doubt (Grüne Liga 2015). In particular, we question why two Prognos opinions (Prognos 2005; Prognos 2011) conclude that jobs increased in the eastern German brown coal industry between 2005 and 2011 while the "Coal Industry Statistics" for that timeframe indicate a reduction of employment numbers in eastern German mines (Coal Industry Statistics 2015). In addition, we note that the scenarios were produced in 2011 so they do not reflect current developments.
The report on the regional economic importance of lignite (see Prognos 2011; Prognos 2012) lists employment directly related to the brown coal industry (in other words, jobs in mines and lignite-fired power plants) as well as indirect and induced employment effects. The term indirect employment effect refers to employment created by intermediate products of the brown coal industry. Consumer spending by people directly and indirectly employed in the brown coal industry results in the creation of more jobs and is referred to as induced effects. The findings of the above-mentioned studies or the computational models they are based on (the underlying computational models) have been critically evaluated by Netzwerk Grüne Liga (Grüne Liga 2015) and others. It is also necessary to note that it is not clear to what extent jobs in upstream industries depend directly on the brown coal industry. According to Prognos (2011), a large proportion of indirect jobs are to be found in the following sectors: trade and repair services, construction, business-related services, construction, mechanical engineering and automotive construction. But these sectors also supply the renewables industry with goods and services. Should a transition toward an electricity industry based on renewable energy sources succeed in the region as outlined in Chapter 3, and a general diversification of the regional economic structure occur, the loss of jobs in coal mines and power plants would not necessarily lead to a decline in employment in upstream industries, as alternative business and trade opportunities would still exist.
2.4.2 Follow-up costs of lignite mining and electricity generation
Mining and generating electricity from brown coal are responsible for a number of environmental, social and economic follow-up costs. From the perspective of the regions affected, but also from the point of view of society overall, a positive effect of the transition road map is the avoidance of these follow-up costs. On one hand, these costs are incurred by earth movements due to surface
ROAD MAP FOR TRANSITION — VATTENFALL 2030 | 25
mining and their consequences – this includes costs of resettlement, large-scale draining of mines, soil degradation, acidification, the contamination of groundwater watercourses with iron ochre, and the cost of health care for people affected by noise and air pollution (Wronski and Küchler 2014). On the other hand, the generation of power from lignite releases greenhouse gases and other air contaminants responsible for follow-up costs caused by global warming and air pollution. Schemes do exist to internalize some of the follow-up costs: for example, an emissions trading system and an energy tax for brown coal electricity; and provisions for mining-related liabilities held by lignite mine operators to cover follow-up costs of surface mining. However, a large part of these follow-up costs are external costs, meaning costs not charged to the party responsible and must therefore be borne by society at large.
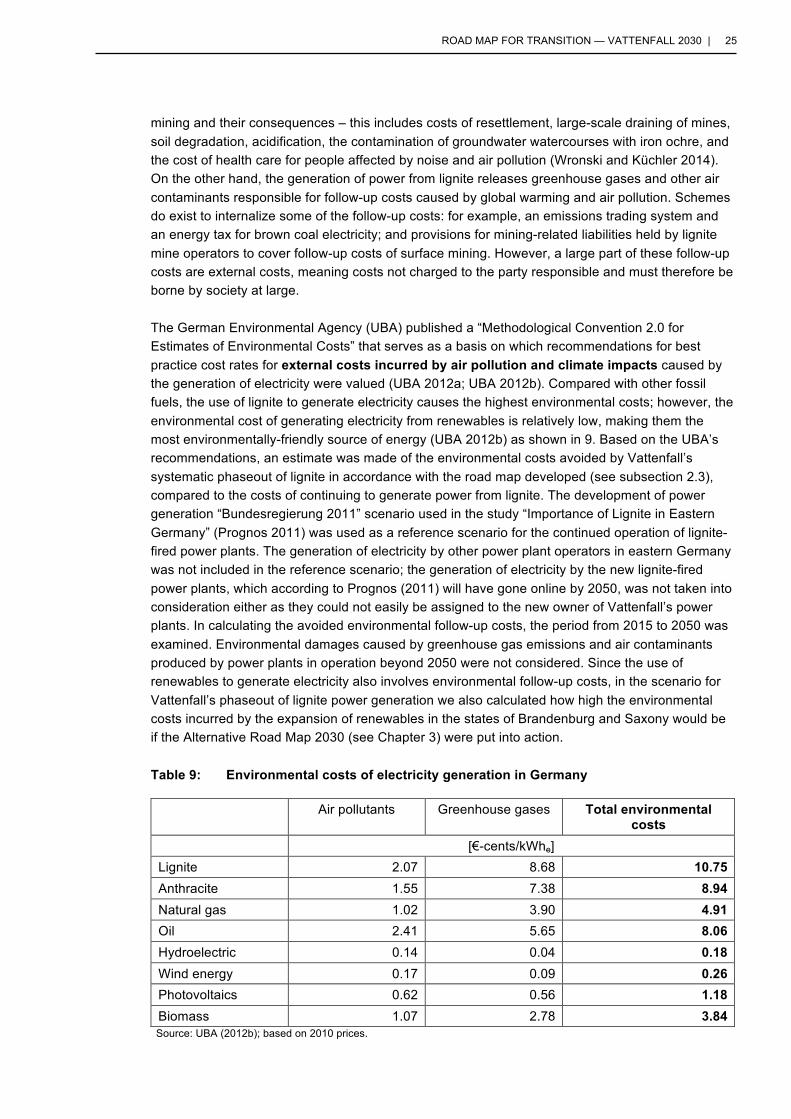
The German Environmental Agency (UBA) published a “Methodological Convention 2.0 for Estimates of Environmental Costs” that serves as a basis on which recommendations for best practice cost rates for external costs incurred by air pollution and climate impacts caused by the generation of electricity were valued (UBA 2012a; UBA 2012b). Compared with other fossil fuels, the use of lignite to generate electricity causes the highest environmental costs; however, the environmental cost of generating electricity from renewables is relatively low, making them the most environmentally-friendly source of energy (UBA 2012b) as shown in 9. Based on the UBA’s recommendations, an estimate was made of the environmental costs avoided by Vattenfall’s systematic phaseout of lignite in accordance with the road map developed (see subsection 2.3), compared to the costs of continuing to generate power from lignite. The development of power generation “Bundesregierung 2011” scenario used in the study “Importance of Lignite in Eastern Germany” (Prognos 2011) was used as a reference scenario for the continued operation of lignite-fired power plants. The generation of electricity by other power plant operators in eastern Germany was not included in the reference scenario; the generation of electricity by the new lignite-fired power plants, which according to Prognos (2011) will have gone online by 2050, was not taken into consideration either as they could not easily be assigned to the new owner of Vattenfall’s power plants. In calculating the avoided environmental follow-up costs, the period from 2015 to 2050 was examined. Environmental damages caused by greenhouse gas emissions and air contaminants produced by power plants in operation beyond 2050 were not considered. Since the use of renewables to generate electricity also involves environmental follow-up costs, in the scenario for Vattenfall’s phaseout of lignite power generation we also calculated how high the environmental costs incurred by the expansion of renewables in the states of Brandenburg and Saxony would be if the Alternative Road Map 2030 (see Chapter 3) were put into action.
Table 9: Environmental costs of electricity generation in Germany
Air pollutants Greenhouse gases Total environmental costs
[€-cents/kWhe] Lignite 2.07 8.68 10.75 Anthracite 1.55 7.38 8.94 Natural gas 1.02 3.90 4.91 Oil 2.41 5.65 8.06 Hydroelectric 0.14 0.04 0.18 Wind energy 0.17 0.09 0.26 Photovoltaics 0.62 0.56 1.18 Biomass 1.07 2.78 3.84
Source: UBA (2012b); based on 2010 prices.
26 | K. HEINBACH, M. BOST, S. SALECKI, J. WEISS
The calculations show that according to the reference scenario drafted by Prognos (2011), the continued operation of Vattenfall’s lignite-fired power plants until 2050 by a potential buyer would involve a cumulative power generation of 1,458 TWh. If Vattenfall stops using lignite to generate electricity by 2030, as proposed in the road map, it would reduce the amount of electricity generated in the period from 2015 to 2030 to just under 664 TWh. That means that the phaseout of lignite power generation by 2030 would amount to EUR 85.4 billion in avoided environmental costs.1 If the environmental costs caused by the expansion of the power generation capacity of renewables as proposed in the Alternative Road Map 2030 are taken into account, savings would amount to about EUR 82.7 billion.2 The regional construction of additional renewable energy facilities in Saxony and Brandenburg as provided by the Alternative Road Map 2030 cannot completely compensate the amount of electricity generated by the lignite-fired power plants as described in the reference scenario. However, as the use of lignite to generate electricity produces the highest environmental costs (see Table 9), significantly lower environmental costs would result even if electricity were generated from a mix of renewables and fossil fuels based on gas and anthracite. So even in that case, the phaseout of lignite in the Lausitz region would result in lower external costs caused by air pollution and impacts.
The mining-related provisions made by mine operators in the lignite industry give an indication of how high the follow-up costs resulting from lignite mining are. According to the Federal Mining Law (BbergG), mining companies are legally bound to: – to compensate people forced to abandon their property (§§ 84-90);
– to take precautions to prevent harm to people’s health or lives, and to protect property, workers and other parties involved in operations against damages (§ 55);
– to ensure that adequate measures are taken to rehabilitate mining sites so that the surface may be used for other purposes (§ 55);
– to properly recycle or dispose of any waste generated (§ 55);
– to protect third parties against any hazards to health or life caused by mining operations even following the cessation of operations (§ 55);
– to reclaim the surface area of the mining site once mining operations have ended (§ 55).
1 Based on 2010 prices.
2 Based on 2010 prices.
ROAD MAP FOR TRANSITION — VATTENFALL 2030 | 27
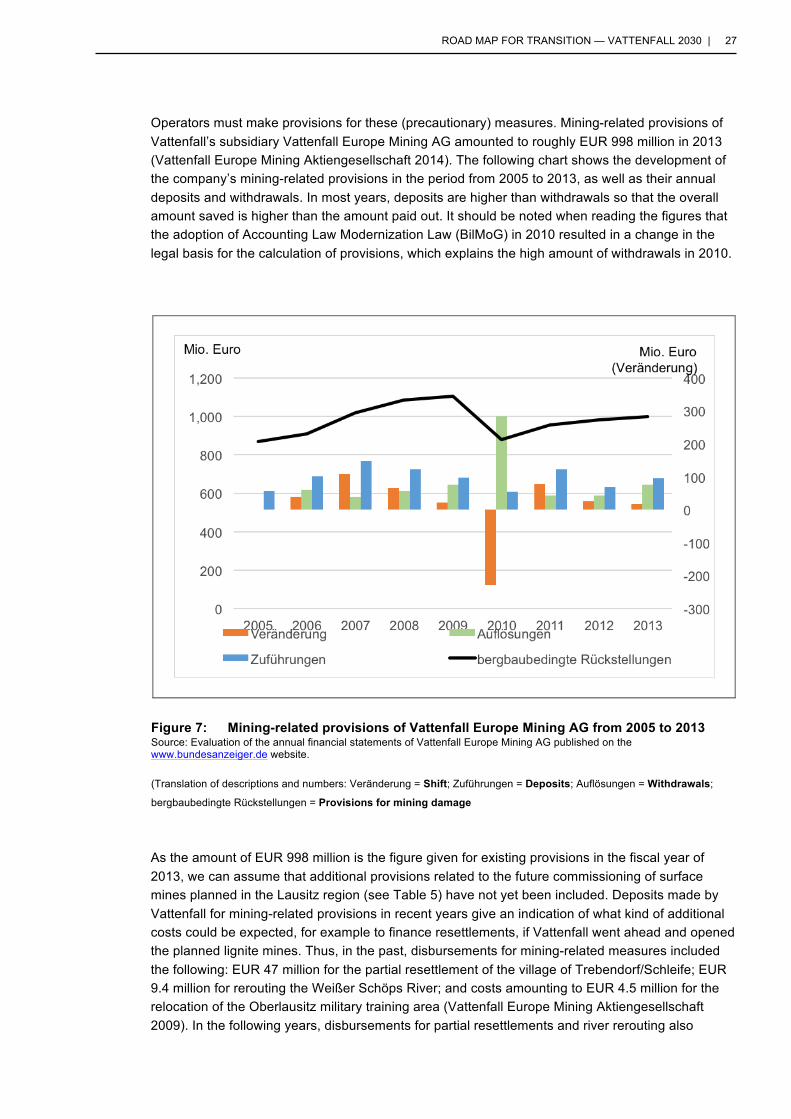
Operators must make provisions for these (precautionary) measures. Mining-related provisions of Vattenfall’s subsidiary Vattenfall Europe Mining AG amounted to roughly EUR 998 million in 2013 (Vattenfall Europe Mining Aktiengesellschaft 2014). The following chart shows the development of the company’s mining-related provisions in the period from 2005 to 2013, as well as their annual deposits and withdrawals. In most years, deposits are higher than withdrawals so that the overall amount saved is higher than the amount paid out. It should be noted when reading the figures that the adoption of Accounting Law Modernization Law (BilMoG) in 2010 resulted in a change in the legal basis for the calculation of provisions, which explains the high amount of withdrawals in 2010.
As the amount of EUR 998 million is the figure given for existing provisions in the fiscal year of 2013, we can assume that additional provisions related to the future commissioning of surface mines planned in the Lausitz region (see Table 5) have not yet been included. Deposits made by Vattenfall for mining-related provisions in recent years give an indication of what kind of additional costs could be expected, for example to finance resettlements, if Vattenfall went ahead and opened the planned lignite mines. Thus, in the past, disbursements for mining-related measures included the following: EUR 47 million for the partial resettlement of the village of Trebendorf/Schleife; EUR 9.4 million for rerouting the Weißer Schöps River; and costs amounting to EUR 4.5 million for the relocation of the Oberlausitz military training area (Vattenfall Europe Mining Aktiengesellschaft 2009). In the following years, disbursements for partial resettlements and river rerouting also
Figure 7: Mining-related provisions of Vattenfall Europe Mining AG from 2005 to 2013 Source: Evaluation of the annual financial statements of Vattenfall Europe Mining AG published on the www.bundesanzeiger.de website. (Translation of descriptions and numbers: Veränderung = Shift; Zuführungen = Deposits; Auflösungen = Withdrawals;
bergbaubedingte Rückstellungen = Provisions for mining damage
28 | K. HEINBACH, M. BOST, S. SALECKI, J. WEISS
appear as a partial aspect of deposits for provisions made so that the figures listed above probably only reflect part of the disbursements made.
A study by FÖS on the “Cost Risks for Society Posed by German Lignite Mining” (Wronski and Küchler 2014) concludes that provisions mandated by the Federal Mining Law do not cover all aspects of follow-up costs of lignite mining. For example, the psychosocial costs of resettlement, of disease and illness caused by particulate matter emissions, of long-term disruptions to the water balance and the loss of biodiversity are not or only partly covered by the legally prescribed provisions and must therefore be classified as external costs of lignite mining. Secondly, due to the lack of transparency regarding the basis and models used by Vattenfall and other companies in the lignite business to calculate follow-up costs, there is the risk that the provisions made for the rehabilitation of mining sites will not be high enough to cover actual costs. The authors also criticized the fact that the prescribed discount rate seems too high in view of how low current real interest rates are on capital markets (Wronski and Küchler 2014).
In summary, we can conclude that although part of the follow-up costs of lignite mining and electricity generation must be paid for by Vattenfall or any other potential operator of the mines and power plants, a large share of the follow-up costs incurred by the adverse effects of lignite operations on people and the environment and the climate impact must be borne by society at large and not by the companies responsible. If Vattenfall undertakes a gradual phaseout of lignite and does not open any additional mines in the Lausitz region as planned, considerable savings in the follow-up costs of lignite operations would be achieved.
3. Alternative Road Map 2030: Investments in Renewable Energies From the regional perspective, a transformation road map for Vattenfall's brown coal division in the Lausitz can be compensated for in various respects by expanding renewable energies and adding emphasis to future-oriented energy services. In drawing up an Alternative Road Map for the region we use the number of jobs lost from a brown coal phaseout as a reference number (see subsection 2.4).
At the end of 2013, 50% of the employees in the brown coal industry were older than 50 years of age, and even more employees, 65%, were over 45 (Coal Industry Statistics 2014). One can reasonably expect that a large number of these employees will have retired by 2030. In a comparable scenario without a phaseout, the employment numbers could be expected to fall by about half by 2030. The number of jobs created through the expansion of renewable energies according to this study is thus greater than the number of employees remaining in the brown coal industry by 2030. Even if for reasons of qualifications or locality, employees could not be taken on by other employers, it is reasonable to expect that a large number of now young employees could be retrained in the next decades to work in the field of renewable energy.
At this juncture we do not take into account the issue of energy security that has to be decided at a supra-regional level. However, more flexibly operated power plants will be needed in the future to compensate for fluctuating renewables and to ensure energy security. In addition, from the climate protection standpoint, we must reduce fossil fuel must-run capacities and maximize the efficient use of remaining fossil residual energy production through predominantly urban combined heat and
ROAD MAP FOR TRANSITION — VATTENFALL 2030 | 29
power (CHP) facilities. These factors also argue for a phaseout from this type of electrical power generation (see Chapter 2.2). The production of hydrogen or methane from excess green power that, with existing natural gas infrastructure, allows for easy storage, transport and flexible reconversion, heat production, or use as fuel in the transportation sector, may likewise enjoy increased significance in this connection. Vattenfall, together with the Brandenburg wind power specialist Enertrag, has already successfully realized a first demonstration system. However, since this technology is still in development, its potential value creation and employment effects in this area cannot be taken into consideration within the scope of this study.
The use of regionally available renewable energy can accompany diverse positive regional economic aspects. Besides the climate and environmental protective effects of a phaseout, the Alternative Road Map 2030 also demonstrates the economic alternatives for the region. A proposal for a green energy concept has been worked out for the Alternative Road Map 2030 for the Lausitz region and the affected states of Brandenburg and Saxony that will allow employment in the green energy area to compensate for jobs lost in the brown coal industry and shows what investment will be required in green energy technology. This study examines only the employment compensation that can be achieved through green energy expansion in electricity generation. Fundamentally, however, measures to expand activities in the area of green energy heat and efficiency measures also offer employment possibilities (see Hirschl et al. 2010; Aretz et al. 2013; Weiß et al. 2014).
In order to estimate the realization possibilities of this Alternative Road Map we must compare the green energy expansion needed to compensate for employment in the brown coal industry with regional green energy potential. In designing the Alternative Road Map 2030, it was assumed that Vattenfall would make a large part of the necessary investment and thus the focus of activities is expected to be on larger projects (e.g. wind farms and open array photovoltaic systems). Beyond that, the Alternative Road Map shows how value creation effects can be linked to an assumed green energy expansion in 2030.
To determine investment and job effects, the IÖW has recourse to a model for determining value creation and employment effects through renewable energy (called the WeBEE model) that has existed for several years and that has been used in a number of research projects (see in this connection Hirschl et al. 2010 and Aretz et al. 2013). In the following, we first briefly explain the WeBEE model and the procedure used for computing value creation and employment effects before we discuss green energy potential and the green energy expansion needed to compensate for the jobs lost in the brown coal industry in the region.
3.1 Methodology As part of its study entitled "Community Value Creation through Renewable Energies", commissioned by the Agentur für Erneuerbare Energien (AEE) [Agency for Renewable Energies], the IÖW developed a model for computing value creation and employment effects at the community level (hereafter referred to as the WeBEE model) (Hirschl et al. 2010). The model, which has since been continuously developed, now encompasses over 50 green energy value creation chains including 19 green energy value creation chains in the area of power generation. Using the model for these value creation chains, it is possible to compute company profits, net income of employees, and tax income for the communities at the state and federal level. In addition, the model allows for the determination of employment effects in the form of full-time jobs.
30 | K. HEINBACH, M. BOST, S. SALECKI, J. WEISS
The central basis for computing value creation using the WeBEE model is the analysis of the investment and operating costs of individual green energy technologies. These correspond to the specific implementations along the value creation chain of a given green energy technology and are related to installed system capacity.
The value creation chains are subdivided into four aggregate value creation stages and the cost positions included in them:
- Facility manufacturing (investment costs for green energy facilities and individual system components)
- Planning and installation (ancillary investment costs for planning offices, assembly, the purchase of real estate, and the like)
- Facility operation and maintenance - (operating costs for maintenance, fuel and energy costs, insurance, third-party debt interest, and to
a certain extent operating personnel and lease payments, etc.) - Operator profits
(profits of the facility operator and taxes paid on profits).
The methodology described subsumes trade in facility components or installation and maintenance material in the four value creation stages referenced above. Depending on the value creation chain, each of the value creation stages above can in turn be subdivided into various value creation steps that can differ between various green energy technologies. For example, the facility manufacturing value creation stage includes the value creation steps of individual system components. In the system operation stage, the value creation steps include, for example, facility maintenance, insurance premiums, or where appropriate, personnel costs. Individual or multiple typical business branches are assigned to the individual value creation steps for which statistical data sources for economic figures are available. Revenues in the individual stages are computed by assigning individual investment and operating cost positions to the corresponding value creation steps. In academic literature, cost structures are predominantly described relative to investment costs or in part are shown relative to ancillary investment costs. This percentage structure allows the application of cost structures to the specific investment costs that are derived from the current literature (market analyses, evaluation reports, and the like). The costs or revenues in the value creation stages of "facility manufacturing" and "planning and installation" accrue on a one-time basis through investment in a green energy system. On the other hand, the costs and revenues for the operation are generated annually over the entire operating life of the green energy facility.
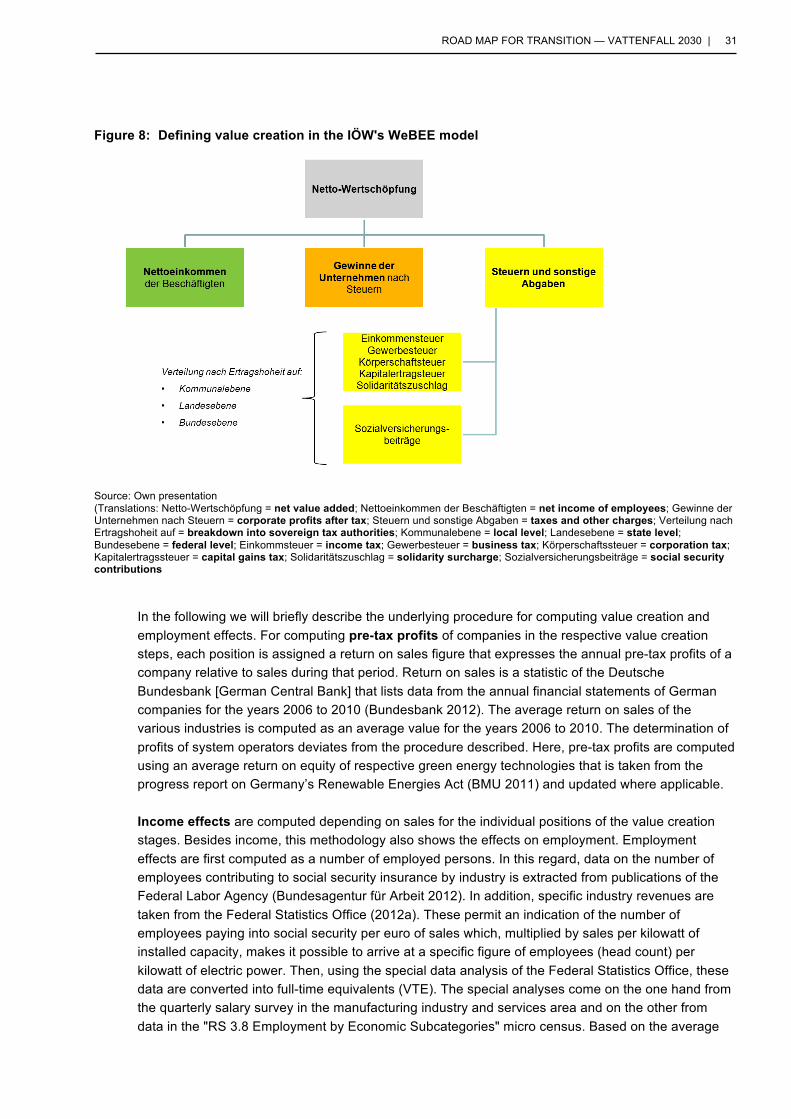
Generally speaking, value creation is a combination of the following three components:
1. The profits of the participating company net of income taxes.
2. The net income of the participating employees.
3. The taxes paid on company profits and gross income.
ROAD MAP FOR TRANSITION — VATTENFALL 2030 | 31
Figure 8: Defining value creation in the IÖW's WeBEE model
Source: Own presentation (Translations: Netto-Wertschöpfung = net value added; Nettoeinkommen der Beschäftigten = net income of employees; Gewinne der Unternehmen nach Steuern = corporate profits after tax; Steuern und sonstige Abgaben = taxes and other charges; Verteilung nach Ertragshoheit auf = breakdown into sovereign tax authorities; Kommunalebene = local level; Landesebene = state level; Bundesebene = federal level; Einkommsteuer = income tax; Gewerbesteuer = business tax; Körperschaftssteuer = corporation tax; Kapitalertragssteuer = capital gains tax; Solidaritätszuschlag = solidarity surcharge; Sozialversicherungsbeiträge = social security contributions
In the following we will briefly describe the underlying procedure for computing value creation and employment effects. For computing pre-tax profits of companies in the respective value creation steps, each position is assigned a return on sales figure that expresses the annual pre-tax profits of a company relative to sales during that period. Return on sales is a statistic of the Deutsche Bundesbank [German Central Bank] that lists data from the annual financial statements of German companies for the years 2006 to 2010 (Bundesbank 2012). The average return on sales of the various industries is computed as an average value for the years 2006 to 2010. The determination of profits of system operators deviates from the procedure described. Here, pre-tax profits are computed using an average return on equity of respective green energy technologies that is taken from the progress report on Germany’s Renewable Energies Act (BMU 2011) and updated where applicable.
Income effects are computed depending on sales for the individual positions of the value creation stages. Besides income, this methodology also shows the effects on employment. Employment effects are first computed as a number of employed persons. In this regard, data on the number of employees contributing to social security insurance by industry is extracted from publications of the Federal Labor Agency (Bundesagentur für Arbeit 2012). In addition, specific industry revenues are taken from the Federal Statistics Office (2012a). These permit an indication of the number of employees paying into social security per euro of sales which, multiplied by sales per kilowatt of installed capacity, makes it possible to arrive at a specific figure of employees (head count) per kilowatt of electric power. Then, using the special data analysis of the Federal Statistics Office, these data are converted into full-time equivalents (VTE). The special analyses come on the one hand from the quarterly salary survey in the manufacturing industry and services area and on the other from data in the "RS 3.8 Employment by Economic Subcategories" micro census. Based on the average

32 | K. HEINBACH, M. BOST, S. SALECKI, J. WEISS
gross annual income in the business branch of the respective value creation steps, the wages and salaries paid in euro per kilowatt can be computed from sources provided by the Federal Statistics Office (2012b).
Tax receipts and income from other levies come from taxing company income and the income of employees. Within the framework of taxes and other levies on company profits at the company level, this also includes consideration of the taxation of distributed profits. The model includes the trade tax, individual income tax, corporate income tax and the tax on investment income as well as the solidarity surcharge, church taxes and, where applicable, health insurance fund contributions. Generally speaking, the company's choice of legal entity governs the computation of its tax rate. Therefore, the companies participating in the value creation process on the basis of WZ-08 are subdivided into corporate and partnership entities in order to take into consideration the differences in company taxation (Federal Statistics Office 2012c). In order to model after-tax profits one must first estimate the taxable income which is the basis upon which income and corporate income taxes are assessed. Taxable income is computed using Bundesbank (2012) data on taxes paid on pre-tax profits and an ideally typical company taxation of corporate and partnership taxation. For the sake of simplicity, trade taxes are computed on the basis of pre-tax profits. In the case of corporate entities (Corp.), the trade tax, and corporate income tax plus the solidarity surcharge on corporate income tax, are due at the corporate level. With the exception of the trade tax, taxation of partnership entities (Part.) takes place at the partner level.
In the case of distributed profits we assume in the case of corporations that 50% of shares are owned by private persons and 25% each by corporations and partnerships. In addition, we assume 50% of after-tax profits are distributed. Private persons as investors pay the investment tax on their distributed profits, corporations pay corporate income tax and the solidarity surcharge, and partnerships pay income tax, church tax and the solidarity surcharge. The taxation of partnerships is done by dividing the partners into private persons, corporations and partnerships using a 2008 special analysis by the Federal Statistics Office of statistics on partnerships/associations. Corporations must pay corporate income tax and the solidarity surcharge, and partnerships and private persons must pay the individual income tax, church tax and solidarity surcharge; private persons, in addition, have to pay contributions to their health insurance fund.
For taxes and other levies on the income of employees, the previously computed gross annual wages govern. Here the corresponding payments of income tax, church tax, solidarity surcharge and social levies (employer and employee) are taken into consideration.
Using this method, the scope of tax and levy payments can be computed as well as after-tax profits or net income.
Besides the indirect effect of profits and income, communities profit directly from the value creation process in two ways. First, they receive almost all of the trade tax. Only a small amount goes to the federal government (3.72%) and the states (13.23%). In addition, the communities participate proportionally in the assessed individual income tax (15%) as well as the investment income tax (12%).
Moreover, in addition to the community-relevant gross value creation components, the WeBEE model can be used to compute the gross value creation effects at the state and federal levels. At the state level, income from corporate income, individual income, investment income and trade taxes are considered. At the federal level, the respective shares of the corporate income tax, individual income, investment income and trade taxes, as well as income from the solidarity surcharge, and the social
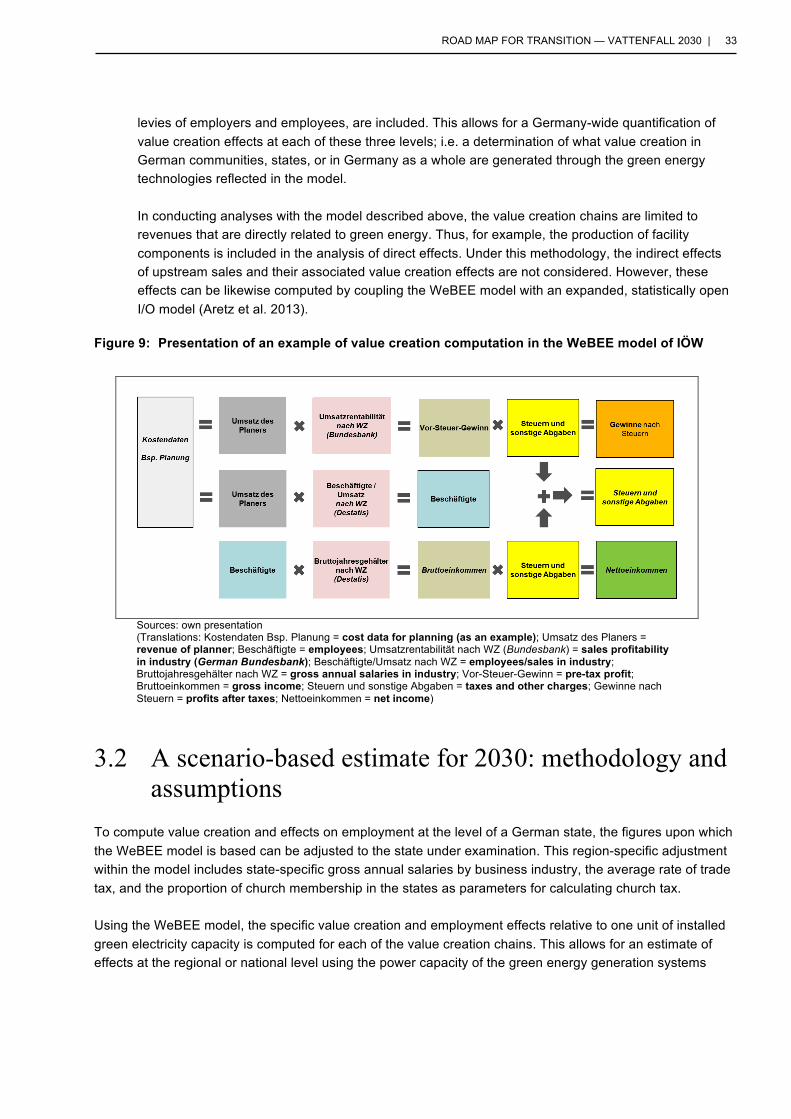
ROAD MAP FOR TRANSITION — VATTENFALL 2030 | 33
levies of employers and employees, are included. This allows for a Germany-wide quantification of value creation effects at each of these three levels; i.e. a determination of what value creation in German communities, states, or in Germany as a whole are generated through the green energy technologies reflected in the model.
In conducting analyses with the model described above, the value creation chains are limited to revenues that are directly related to green energy. Thus, for example, the production of facility components is included in the analysis of direct effects. Under this methodology, the indirect effects of upstream sales and their associated value creation effects are not considered. However, these effects can be likewise computed by coupling the WeBEE model with an expanded, statistically open I/O model (Aretz et al. 2013).
Figure 9: Presentation of an example of value creation computation in the WeBEE model of IÖW
3.2 A scenario-based estimate for 2030: methodology and assumptions
To compute value creation and effects on employment at the level of a German state, the figures upon which the WeBEE model is based can be adjusted to the state under examination. This region-specific adjustment within the model includes state-specific gross annual salaries by business industry, the average rate of trade tax, and the proportion of church membership in the states as parameters for calculating church tax.
Using the WeBEE model, the specific value creation and employment effects relative to one unit of installed green electricity capacity is computed for each of the value creation chains. This allows for an estimate of effects at the regional or national level using the power capacity of the green energy generation systems
Sources: own presentation (Translations: Kostendaten Bsp. Planung = cost data for planning (as an example); Umsatz des Planers = revenue of planner; Beschäftigte = employees; Umsatzrentabilität nach WZ (Bundesbank) = sales profitability in industry (German Bundesbank); Beschäftigte/Umsatz nach WZ = employees/sales in industry; Bruttojahresgehälter nach WZ = gross annual salaries in industry; Vor-Steuer-Gewinn = pre-tax profit; Bruttoeinkommen = gross income; Steuern und sonstige Abgaben = taxes and other charges; Gewinne nach Steuern = profits after taxes; Nettoeinkommen = net income)
34 | K. HEINBACH, M. BOST, S. SALECKI, J. WEISS
installed and added within a region, a state, or in Germany3. In the context of this study, this means that value creation and employment effects at the value creation stages of “planning and installation”, “facility operation and maintenance” as well as “operator profits” can be computed on the basis of assumed added construction of installed green energy system capacity through 2030 needed to compensate for the jobs lost in the brown coal industry. Assuming there is potential for the additional expansion of renewable energies in states, computations for Saxony and Brandenburg are done separately to compute the effects with the model adjusted for the specific state.
In addition to the inventory and expansion of installed green energy capacity in 2030 that is being analyzed, assumptions must be made concerning the residence of green energy companies and green energy employees in the two states because, in the normal case, not all value creation steps along the green energy value creation chains can be performed entirely by actors residing in the state. Including the factor of the regional residency of companies and employees along the individual green energy value creation chains in a state requires comprehensive research and empirical data gathering. Such a detailed analysis was not possible within the scope of this brief study, so the effects on the value creation stages of “planning and installation” as well as “facility operation and maintenance” were computed assuming an 80% regional residency. Already today there are companies resident in the states of Brandenburg and Saxony that are active in the green energy sector. Under the assumption that green energy service providers will continue to expand their competencies in those regions affected by the phaseout from brown coal, a percentage of 80% regional residency is deemed realistic or realizable.
In some value creation steps, regional residency of 100% was assumed since in this case at the state level it can be assumed that these steps will be covered by local actors. This affects personnel for operating systems and rental payments or real estate purchases.
Regional residency of the operator company and the shareholders is dispositive of the question as to what portion of the value created will remain in the region or leave the state. Here we have created three scenarios with different assumptions concerning the residence of the operator and investors in green energy systems:
- Scenario 1: less local content relative to the regional residency of the operator companies and shareholders (overall 20% assumption)
- Scenario 2: medium local content relative to the regional residency of operator companies and shareholders (overall 50% assumption)
- Scenario 3: higher local content relative to regional residency of the operator companies and shareholders (overall 80% assumption).
The effects of manufacturing green energy facilities and components cannot be computed within the scope of the study because the economic activities of the manufacturers of green energy facilities and components in individual states are very independent of the capacity added to and installed within the state. Also, it is possible to estimate value creation and employment only on the basis of economic figures (revenues, employees) from firms resident in the states. This, too, requires comprehensive research and empirical data gathering which could not be done within the scope of this study. However, trading in facility components was taken into account and included in computations at the systems manufacturing stage.
3 In this regard it should be observed that the estimate is done on the basis of green energy technologies that are reflected in the IÖW
model. Thus, it covers a large part of the green energy capacity installed in Germany but does not include the entire range of technologies.
ROAD MAP FOR TRANSITION — VATTENFALL 2030 | 35
For the scenario-based estimate, we must also take into account that by 2030 the investment costs in most cases will be reduced because of learning curve effects. Thus, the specific investment costs of green energy technologies will necessarily be subject to a degressive effect. The cost degression through 2030 was computed on the basis of assumed cost developments in long-term scenarios by the BMU [Germany’s environment ministry] (Nitsch et al. 2012a; Nitsch et al. 2012b). For simplification, we have assumed no changes in the remaining cost structure.
Tax computations for 2030 are made on the basis of tax legislation existing in 2012. The computation of operator profits is done on the basis of a technology-specific return on equity. The required information on this point is derived from the literature, including the progress report on Germany’s Renewable Energies Act (BMU 2011). Against the background of profitability reductions in the photovoltaic industry in past years, we have reduced the return on equity from photovoltaic roof systems to 6% for 2030.
3.3 Renewable energy potential in Brandenburg and Saxony An Alternative Road Map to possibly compensate for the loss of jobs at Vattenfall in the brown coal industry through further expansion of renewable energies in the affected regions can only be drawn up on the basis of existing green energy potential. A detailed or up-to-date analysis of green energy potential could not be done within the scope of a brief study so we analyzed the data on potential that had already been gathered. For simplicity, green energy potential for the Alternative Road Map 2030 is viewed at the level of the states affected by phaseout from the brown coal industry. It was not possible to make a clear geographical assignment of green energy added capacity and the associated employment potential within the green energy section for the Lausitz region. It can, however, be assumed that upon phaseout from the brown coal industry by 2030, additional potential, in particular for wind energy and photovoltaics, will be available in the Lausitz when the recultivated areas of former surface mines become available. In addition, region-specific studies such as, for example, the " Lausitz-Spreewald Regional Energy Plan" (RPG Lausitz-Spreewald 2013)4 show that there is considerable potential for further expansion of renewable energies in the region. The following subsection provides an overview of green energy potential in Brandenburg and Saxony in the power generation sector.
3.3.1 Brandenburg
In 2012, as part of a study commissioned by Greenpeace entitled "Renewable energy potential in Brandenburg 2030: technical developmental potential and value creation and employment effects - a scenario-based analysis" (Bost et al. 2012a), the IÖW investigated the developmental green energy potential in the state of Brandenburg through to 2030. The study showed that there was still
4 Although the Lausitz-Spreewald Regional Planning Association (RPG) is one of a total of five planning associations in
Brandenburg, the regional wind potential in a time horizon through to 2030 is about one-third of the wind power potential according to Bost et al (2012a) that can be developed in the EE-0BK scenario in Brandenburg by 2030. In the case of photovoltaics, the demonstrated potential in the energy plan has the same dimension as the photovoltaic potential for all of Brandenburg portrayed by Bost et al. (2012a) in the EE-OBK scenario.
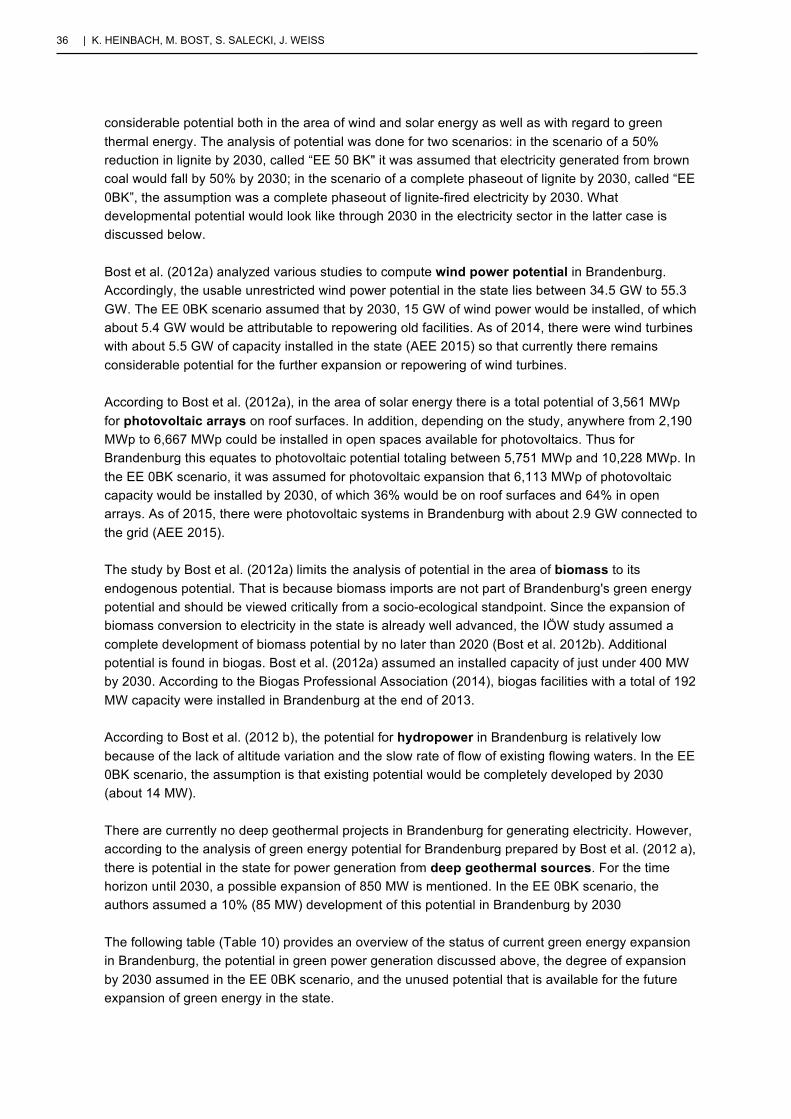
36 | K. HEINBACH, M. BOST, S. SALECKI, J. WEISS
considerable potential both in the area of wind and solar energy as well as with regard to green thermal energy. The analysis of potential was done for two scenarios: in the scenario of a 50% reduction in lignite by 2030, called “EE 50 BK" it was assumed that electricity generated from brown coal would fall by 50% by 2030; in the scenario of a complete phaseout of lignite by 2030, called “EE 0BK”, the assumption was a complete phaseout of lignite-fired electricity by 2030. What developmental potential would look like through 2030 in the electricity sector in the latter case is discussed below.
Bost et al. (2012a) analyzed various studies to compute wind power potential in Brandenburg. Accordingly, the usable unrestricted wind power potential in the state lies between 34.5 GW to 55.3 GW. The EE 0BK scenario assumed that by 2030, 15 GW of wind power would be installed, of which about 5.4 GW would be attributable to repowering old facilities. As of 2014, there were wind turbines with about 5.5 GW of capacity installed in the state (AEE 2015) so that currently there remains considerable potential for the further expansion or repowering of wind turbines.
According to Bost et al. (2012a), in the area of solar energy there is a total potential of 3,561 MWp for photovoltaic arrays on roof surfaces. In addition, depending on the study, anywhere from 2,190 MWp to 6,667 MWp could be installed in open spaces available for photovoltaics. Thus for Brandenburg this equates to photovoltaic potential totaling between 5,751 MWp and 10,228 MWp. In the EE 0BK scenario, it was assumed for photovoltaic expansion that 6,113 MWp of photovoltaic capacity would be installed by 2030, of which 36% would be on roof surfaces and 64% in open arrays. As of 2015, there were photovoltaic systems in Brandenburg with about 2.9 GW connected to the grid (AEE 2015).
The study by Bost et al. (2012a) limits the analysis of potential in the area of biomass to its endogenous potential. That is because biomass imports are not part of Brandenburg's green energy potential and should be viewed critically from a socio-ecological standpoint. Since the expansion of biomass conversion to electricity in the state is already well advanced, the IÖW study assumed a complete development of biomass potential by no later than 2020 (Bost et al. 2012b). Additional potential is found in biogas. Bost et al. (2012a) assumed an installed capacity of just under 400 MW by 2030. According to the Biogas Professional Association (2014), biogas facilities with a total of 192 MW capacity were installed in Brandenburg at the end of 2013.
According to Bost et al. (2012 b), the potential for hydropower in Brandenburg is relatively low because of the lack of altitude variation and the slow rate of flow of existing flowing waters. In the EE 0BK scenario, the assumption is that existing potential would be completely developed by 2030 (about 14 MW).
There are currently no deep geothermal projects in Brandenburg for generating electricity. However, according to the analysis of green energy potential for Brandenburg prepared by Bost et al. (2012 a), there is potential in the state for power generation from deep geothermal sources. For the time horizon until 2030, a possible expansion of 850 MW is mentioned. In the EE 0BK scenario, the authors assumed a 10% (85 MW) development of this potential in Brandenburg by 2030
The following table (Table 10) provides an overview of the status of current green energy expansion in Brandenburg, the potential in green power generation discussed above, the degree of expansion by 2030 assumed in the EE 0BK scenario, and the unused potential that is available for the future expansion of green energy in the state.
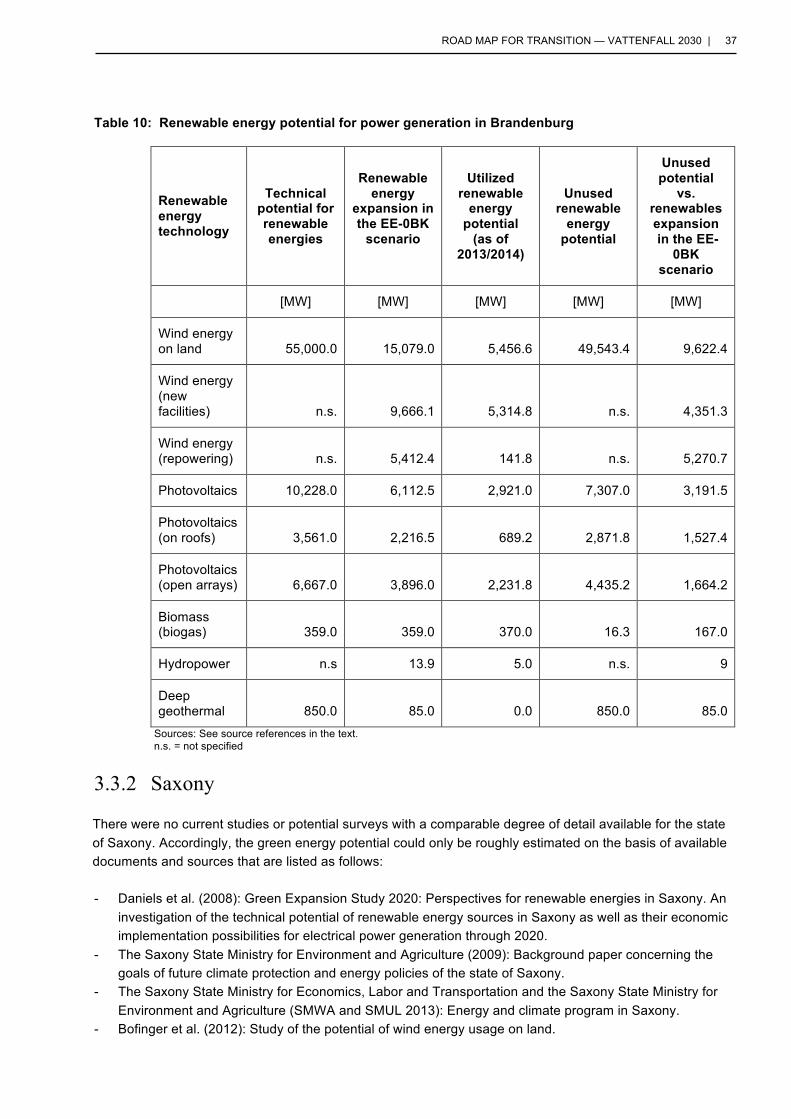
ROAD MAP FOR TRANSITION — VATTENFALL 2030 | 37
Table 10: Renewable energy potential for power generation in Brandenburg
Renewable energy technology
Technical potential for renewable energies
Renewable energy
expansion in the EE-0BK
scenario
Utilized renewable
energy potential
(as of 2013/2014)
Unused renewable
energy potential
Unused potential
vs. renewables expansion in the EE-
0BK scenario
[MW] [MW] [MW] [MW] [MW]
Wind energy on land 55,000.0 15,079.0 5,456.6 49,543.4 9,622.4
Wind energy (new facilities) n.s. 9,666.1 5,314.8 n.s. 4,351.3
Wind energy (repowering) n.s. 5,412.4 141.8 n.s. 5,270.7
Photovoltaics 10,228.0 6,112.5 2,921.0 7,307.0 3,191.5
Photovoltaics (on roofs) 3,561.0 2,216.5 689.2 2,871.8 1,527.4
Photovoltaics (open arrays) 6,667.0 3,896.0 2,231.8 4,435.2 1,664.2
Biomass (biogas) 359.0 359.0 370.0 16.3 167.0
Hydropower n.s 13.9 5.0 n.s. 9
Deep geothermal 850.0 85.0 0.0 850.0 85.0
Sources: See source references in the text. n.s. = not specified
3.3.2 Saxony
There were no current studies or potential surveys with a comparable degree of detail available for the state of Saxony. Accordingly, the green energy potential could only be roughly estimated on the basis of available documents and sources that are listed as follows:
- Daniels et al. (2008): Green Expansion Study 2020: Perspectives for renewable energies in Saxony. An investigation of the technical potential of renewable energy sources in Saxony as well as their economic implementation possibilities for electrical power generation through 2020.
- The Saxony State Ministry for Environment and Agriculture (2009): Background paper concerning the goals of future climate protection and energy policies of the state of Saxony.
- The Saxony State Ministry for Economics, Labor and Transportation and the Saxony State Ministry for Environment and Agriculture (SMWA and SMUL 2013): Energy and climate program in Saxony.
- Bofinger et al. (2012): Study of the potential of wind energy usage on land.
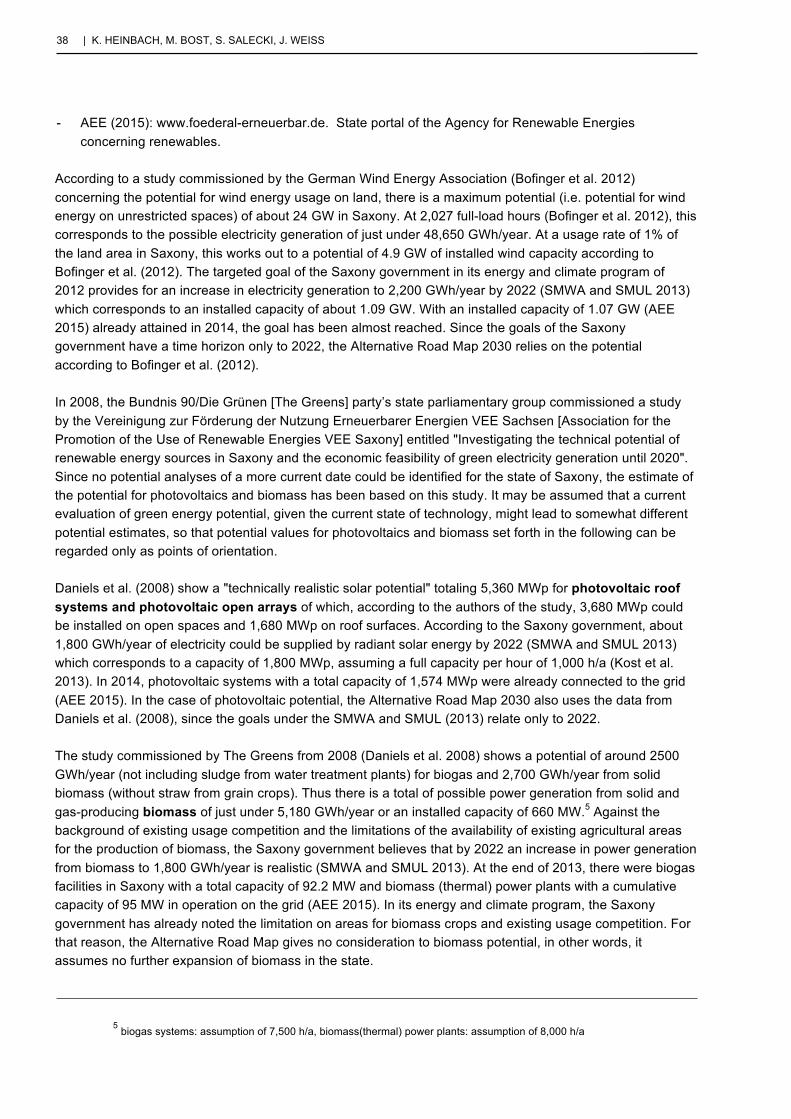
38 | K. HEINBACH, M. BOST, S. SALECKI, J. WEISS
- AEE (2015): www.foederal-erneuerbar.de. State portal of the Agency for Renewable Energies concerning renewables.
According to a study commissioned by the German Wind Energy Association (Bofinger et al. 2012) concerning the potential for wind energy usage on land, there is a maximum potential (i.e. potential for wind energy on unrestricted spaces) of about 24 GW in Saxony. At 2,027 full-load hours (Bofinger et al. 2012), this corresponds to the possible electricity generation of just under 48,650 GWh/year. At a usage rate of 1% of the land area in Saxony, this works out to a potential of 4.9 GW of installed wind capacity according to Bofinger et al. (2012). The targeted goal of the Saxony government in its energy and climate program of 2012 provides for an increase in electricity generation to 2,200 GWh/year by 2022 (SMWA and SMUL 2013) which corresponds to an installed capacity of about 1.09 GW. With an installed capacity of 1.07 GW (AEE 2015) already attained in 2014, the goal has been almost reached. Since the goals of the Saxony government have a time horizon only to 2022, the Alternative Road Map 2030 relies on the potential according to Bofinger et al. (2012).
In 2008, the Bundnis 90/Die Grünen [The Greens] party’s state parliamentary group commissioned a study by the Vereinigung zur Förderung der Nutzung Erneuerbarer Energien VEE Sachsen [Association for the Promotion of the Use of Renewable Energies VEE Saxony] entitled "Investigating the technical potential of renewable energy sources in Saxony and the economic feasibility of green electricity generation until 2020". Since no potential analyses of a more current date could be identified for the state of Saxony, the estimate of the potential for photovoltaics and biomass has been based on this study. It may be assumed that a current evaluation of green energy potential, given the current state of technology, might lead to somewhat different potential estimates, so that potential values for photovoltaics and biomass set forth in the following can be regarded only as points of orientation.
Daniels et al. (2008) show a "technically realistic solar potential" totaling 5,360 MWp for photovoltaic roof systems and photovoltaic open arrays of which, according to the authors of the study, 3,680 MWp could be installed on open spaces and 1,680 MWp on roof surfaces. According to the Saxony government, about 1,800 GWh/year of electricity could be supplied by radiant solar energy by 2022 (SMWA and SMUL 2013) which corresponds to a capacity of 1,800 MWp, assuming a full capacity per hour of 1,000 h/a (Kost et al. 2013). In 2014, photovoltaic systems with a total capacity of 1,574 MWp were already connected to the grid (AEE 2015). In the case of photovoltaic potential, the Alternative Road Map 2030 also uses the data from Daniels et al. (2008), since the goals under the SMWA and SMUL (2013) relate only to 2022.
The study commissioned by The Greens from 2008 (Daniels et al. 2008) shows a potential of around 2500 GWh/year (not including sludge from water treatment plants) for biogas and 2,700 GWh/year from solid biomass (without straw from grain crops). Thus there is a total of possible power generation from solid and gas-producing biomass of just under 5,180 GWh/year or an installed capacity of 660 MW.5 Against the background of existing usage competition and the limitations of the availability of existing agricultural areas for the production of biomass, the Saxony government believes that by 2022 an increase in power generation from biomass to 1,800 GWh/year is realistic (SMWA and SMUL 2013). At the end of 2013, there were biogas facilities in Saxony with a total capacity of 92.2 MW and biomass (thermal) power plants with a cumulative capacity of 95 MW in operation on the grid (AEE 2015). In its energy and climate program, the Saxony government has already noted the limitation on areas for biomass crops and existing usage competition. For that reason, the Alternative Road Map gives no consideration to biomass potential, in other words, it assumes no further expansion of biomass in the state.
5 biogas systems: assumption of 7,500 h/a, biomass(thermal) power plants: assumption of 8,000 h/a
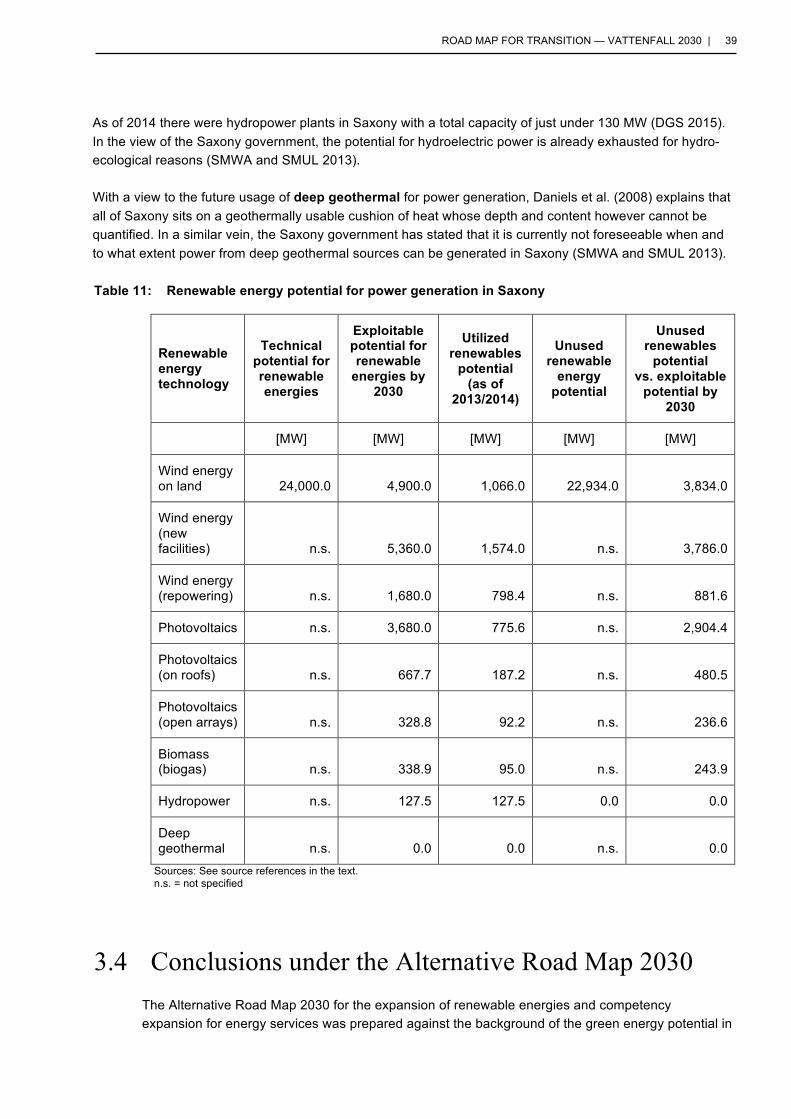
ROAD MAP FOR TRANSITION — VATTENFALL 2030 | 39
As of 2014 there were hydropower plants in Saxony with a total capacity of just under 130 MW (DGS 2015). In the view of the Saxony government, the potential for hydroelectric power is already exhausted for hydro-ecological reasons (SMWA and SMUL 2013).
With a view to the future usage of deep geothermal for power generation, Daniels et al. (2008) explains that all of Saxony sits on a geothermally usable cushion of heat whose depth and content however cannot be quantified. In a similar vein, the Saxony government has stated that it is currently not foreseeable when and to what extent power from deep geothermal sources can be generated in Saxony (SMWA and SMUL 2013).
Table 11: Renewable energy potential for power generation in Saxony
Renewable energy technology
Technical potential for renewable energies
Exploitable potential for renewable
energies by 2030
Utilized renewables
potential (as of
2013/2014)
Unused renewable
energy potential
Unused renewables
potential vs. exploitable
potential by 2030
[MW] [MW] [MW] [MW] [MW]
Wind energy on land 24,000.0 4,900.0 1,066.0 22,934.0 3,834.0
Wind energy (new facilities) n.s. 5,360.0 1,574.0 n.s. 3,786.0
Wind energy (repowering) n.s. 1,680.0 798.4 n.s. 881.6
Photovoltaics n.s. 3,680.0 775.6 n.s. 2,904.4
Photovoltaics (on roofs) n.s. 667.7 187.2 n.s. 480.5
Photovoltaics (open arrays) n.s. 328.8 92.2 n.s. 236.6
Biomass (biogas) n.s. 338.9 95.0 n.s. 243.9
Hydropower n.s. 127.5 127.5 0.0 0.0
Deep geothermal n.s. 0.0 0.0 n.s. 0.0
Sources: See source references in the text. n.s. = not specified
3.4 Conclusions under the Alternative Road Map 2030 The Alternative Road Map 2030 for the expansion of renewable energies and competency expansion for energy services was prepared against the background of the green energy potential in
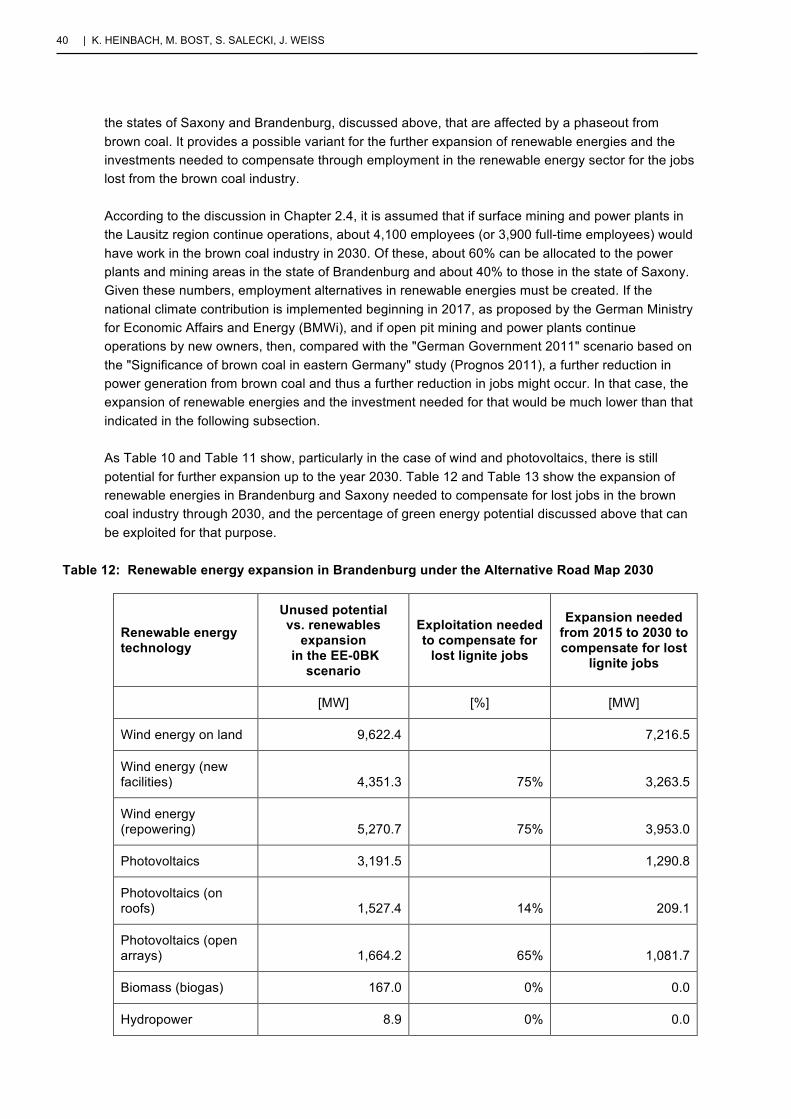
40 | K. HEINBACH, M. BOST, S. SALECKI, J. WEISS
the states of Saxony and Brandenburg, discussed above, that are affected by a phaseout from brown coal. It provides a possible variant for the further expansion of renewable energies and the investments needed to compensate through employment in the renewable energy sector for the jobs lost from the brown coal industry.
According to the discussion in Chapter 2.4, it is assumed that if surface mining and power plants in the Lausitz region continue operations, about 4,100 employees (or 3,900 full-time employees) would have work in the brown coal industry in 2030. Of these, about 60% can be allocated to the power plants and mining areas in the state of Brandenburg and about 40% to those in the state of Saxony. Given these numbers, employment alternatives in renewable energies must be created. If the national climate contribution is implemented beginning in 2017, as proposed by the German Ministry for Economic Affairs and Energy (BMWi), and if open pit mining and power plants continue operations by new owners, then, compared with the "German Government 2011" scenario based on the "Significance of brown coal in eastern Germany" study (Prognos 2011), a further reduction in power generation from brown coal and thus a further reduction in jobs might occur. In that case, the expansion of renewable energies and the investment needed for that would be much lower than that indicated in the following subsection.
As Table 10 and Table 11 show, particularly in the case of wind and photovoltaics, there is still potential for further expansion up to the year 2030. Table 12 and Table 13 show the expansion of renewable energies in Brandenburg and Saxony needed to compensate for lost jobs in the brown coal industry through 2030, and the percentage of green energy potential discussed above that can be exploited for that purpose.
Table 12: Renewable energy expansion in Brandenburg under the Alternative Road Map 2030
Renewable energy technology
Unused potential vs. renewables
expansion in the EE-0BK
scenario
Exploitation needed to compensate for
lost lignite jobs
Expansion needed from 2015 to 2030 to compensate for lost
lignite jobs
[MW] [%] [MW]
Wind energy on land 9,622.4 7,216.5
Wind energy (new facilities) 4,351.3 75% 3,263.5
Wind energy (repowering) 5,270.7 75% 3,953.0
Photovoltaics 3,191.5 1,290.8
Photovoltaics (on roofs) 1,527.4 14% 209.1
Photovoltaics (open arrays) 1,664.2 65% 1,081.7
Biomass (biogas) 167.0 0% 0.0
Hydropower 8.9 0% 0.0
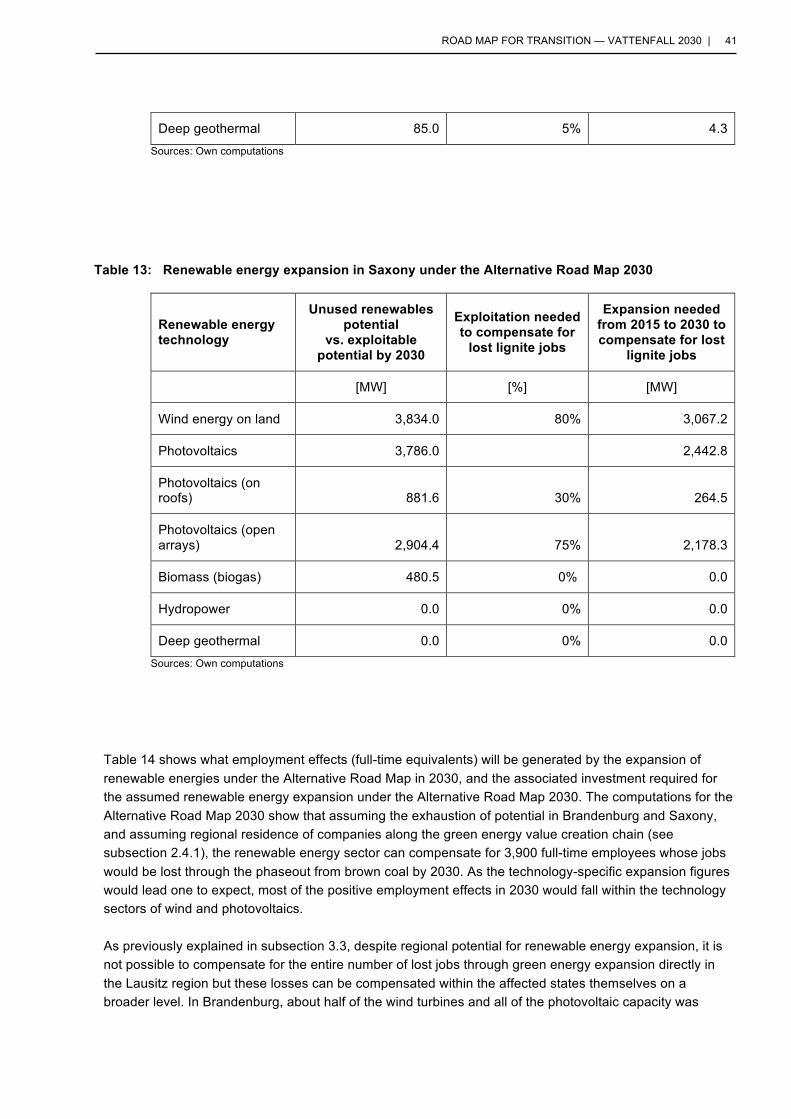
ROAD MAP FOR TRANSITION — VATTENFALL 2030 | 41
Deep geothermal 85.0 5% 4.3 Sources: Own computations
Table 13: Renewable energy expansion in Saxony under the Alternative Road Map 2030
Renewable energy technology
Unused renewables potential
vs. exploitable potential by 2030
Exploitation needed to compensate for
lost lignite jobs
Expansion needed from 2015 to 2030 to compensate for lost
lignite jobs
[MW] [%] [MW]
Wind energy on land 3,834.0 80% 3,067.2
Photovoltaics 3,786.0 2,442.8
Photovoltaics (on roofs) 881.6 30% 264.5
Photovoltaics (open arrays) 2,904.4 75% 2,178.3
Biomass (biogas) 480.5 0% 0.0
Hydropower 0.0 0% 0.0
Deep geothermal 0.0 0% 0.0 Sources: Own computations
Table 14 shows what employment effects (full-time equivalents) will be generated by the expansion of renewable energies under the Alternative Road Map in 2030, and the associated investment required for the assumed renewable energy expansion under the Alternative Road Map 2030. The computations for the Alternative Road Map 2030 show that assuming the exhaustion of potential in Brandenburg and Saxony, and assuming regional residence of companies along the green energy value creation chain (see subsection 2.4.1), the renewable energy sector can compensate for 3,900 full-time employees whose jobs would be lost through the phaseout from brown coal by 2030. As the technology-specific expansion figures would lead one to expect, most of the positive employment effects in 2030 would fall within the technology sectors of wind and photovoltaics.
As previously explained in subsection 3.3, despite regional potential for renewable energy expansion, it is not possible to compensate for the entire number of lost jobs through green energy expansion directly in the Lausitz region but these losses can be compensated within the affected states themselves on a broader level. In Brandenburg, about half of the wind turbines and all of the photovoltaic capacity was
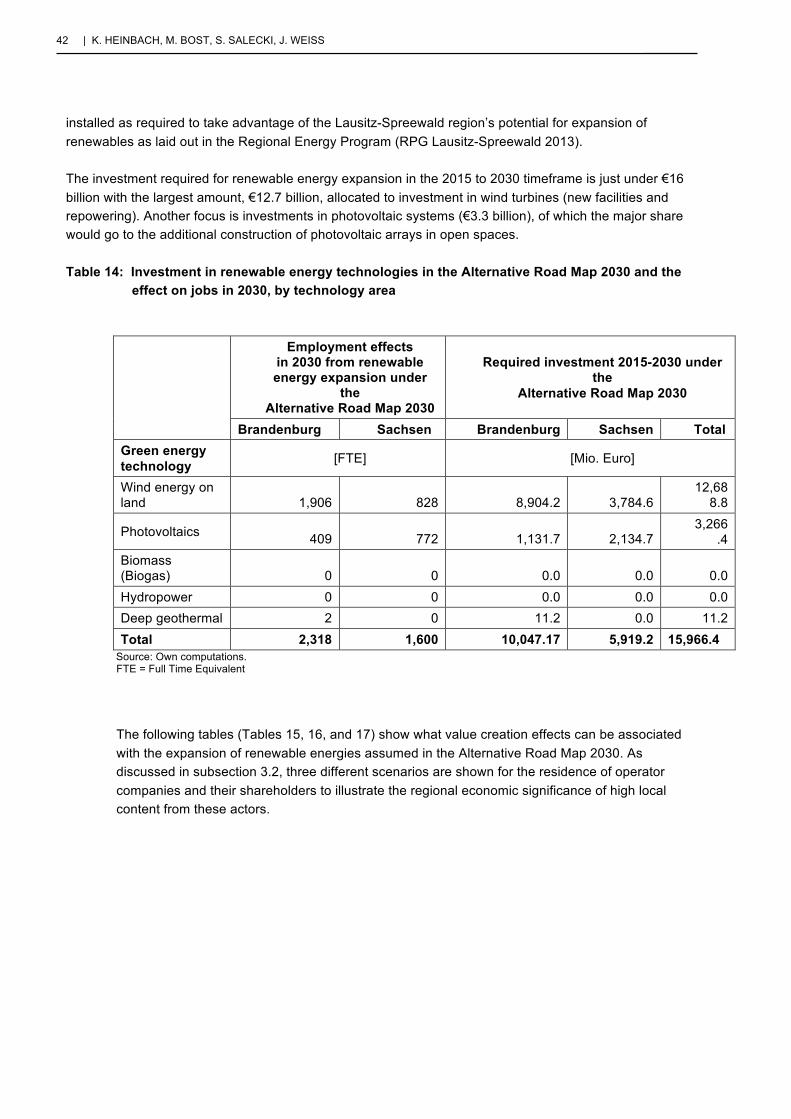
42 | K. HEINBACH, M. BOST, S. SALECKI, J. WEISS
installed as required to take advantage of the Lausitz-Spreewald region’s potential for expansion of renewables as laid out in the Regional Energy Program (RPG Lausitz-Spreewald 2013).
The investment required for renewable energy expansion in the 2015 to 2030 timeframe is just under €16 billion with the largest amount, €12.7 billion, allocated to investment in wind turbines (new facilities and repowering). Another focus is investments in photovoltaic systems (€3.3 billion), of which the major share would go to the additional construction of photovoltaic arrays in open spaces.
Table 14: Investment in renewable energy technologies in the Alternative Road Map 2030 and the effect on jobs in 2030, by technology area
Employment effects in 2030 from renewable energy expansion under
the Alternative Road Map 2030
Required investment 2015-2030 under the
Alternative Road Map 2030
Brandenburg Sachsen Brandenburg Sachsen Total Green energy technology [FTE] [Mio. Euro]
Wind energy on land 1,906 828 8,904.2 3,784.6
12,688.8
Photovoltaics 409 772 1,131.7 2,134.7 3,266
.4 Biomass (Biogas) 0 0 0.0 0.0 0.0 Hydropower 0 0 0.0 0.0 0.0 Deep geothermal 2 0 11.2 0.0 11.2 Total 2,318 1,600 10,047.17 5,919.2 15,966.4
Source: Own computations. FTE = Full Time Equivalent
The following tables (Tables 15, 16, and 17) show what value creation effects can be associated with the expansion of renewable energies assumed in the Alternative Road Map 2030. As discussed in subsection 3.2, three different scenarios are shown for the residence of operator companies and their shareholders to illustrate the regional economic significance of high local content from these actors.
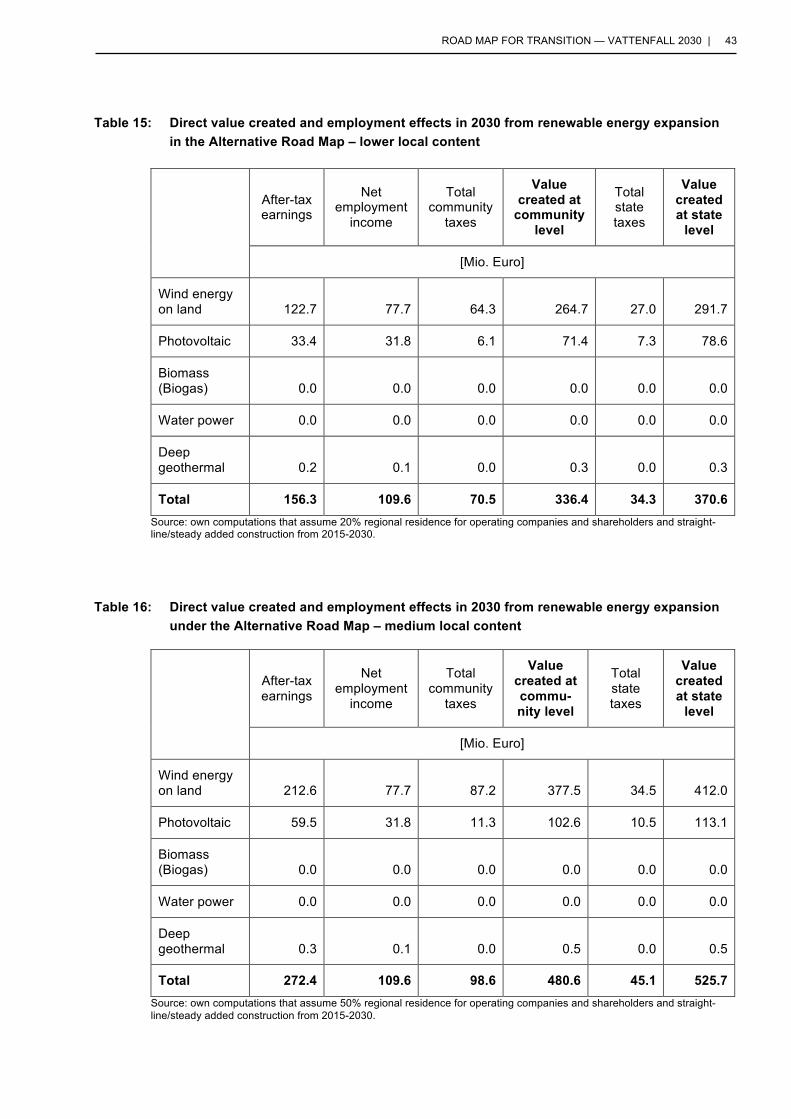
ROAD MAP FOR TRANSITION — VATTENFALL 2030 | 43
Table 15: Direct value created and employment effects in 2030 from renewable energy expansion in the Alternative Road Map – lower local content
After-tax earnings
Net employment
income
Total community
taxes
Value created at
community level
Total state taxes
Value created at state
level
[Mio. Euro]
Wind energy on land 122.7 77.7 64.3 264.7 27.0 291.7
Photovoltaic 33.4 31.8 6.1 71.4 7.3 78.6
Biomass (Biogas) 0.0 0.0 0.0 0.0 0.0 0.0
Water power 0.0 0.0 0.0 0.0 0.0 0.0
Deep geothermal 0.2 0.1 0.0 0.3 0.0 0.3
Total 156.3 109.6 70.5 336.4 34.3 370.6 Source: own computations that assume 20% regional residence for operating companies and shareholders and straight-line/steady added construction from 2015-2030.
Table 16: Direct value created and employment effects in 2030 from renewable energy expansion under the Alternative Road Map – medium local content
After-tax earnings
Net employment
income
Total community
taxes
Value created at commu-nity level
Total state taxes
Value created at state
level
[Mio. Euro]
Wind energy on land 212.6 77.7 87.2 377.5 34.5 412.0
Photovoltaic 59.5 31.8 11.3 102.6 10.5 113.1
Biomass (Biogas) 0.0 0.0 0.0 0.0 0.0 0.0
Water power 0.0 0.0 0.0 0.0 0.0 0.0
Deep geothermal 0.3 0.1 0.0 0.5 0.0 0.5
Total 272.4 109.6 98.6 480.6 45.1 525.7 Source: own computations that assume 50% regional residence for operating companies and shareholders and straight-line/steady added construction from 2015-2030.
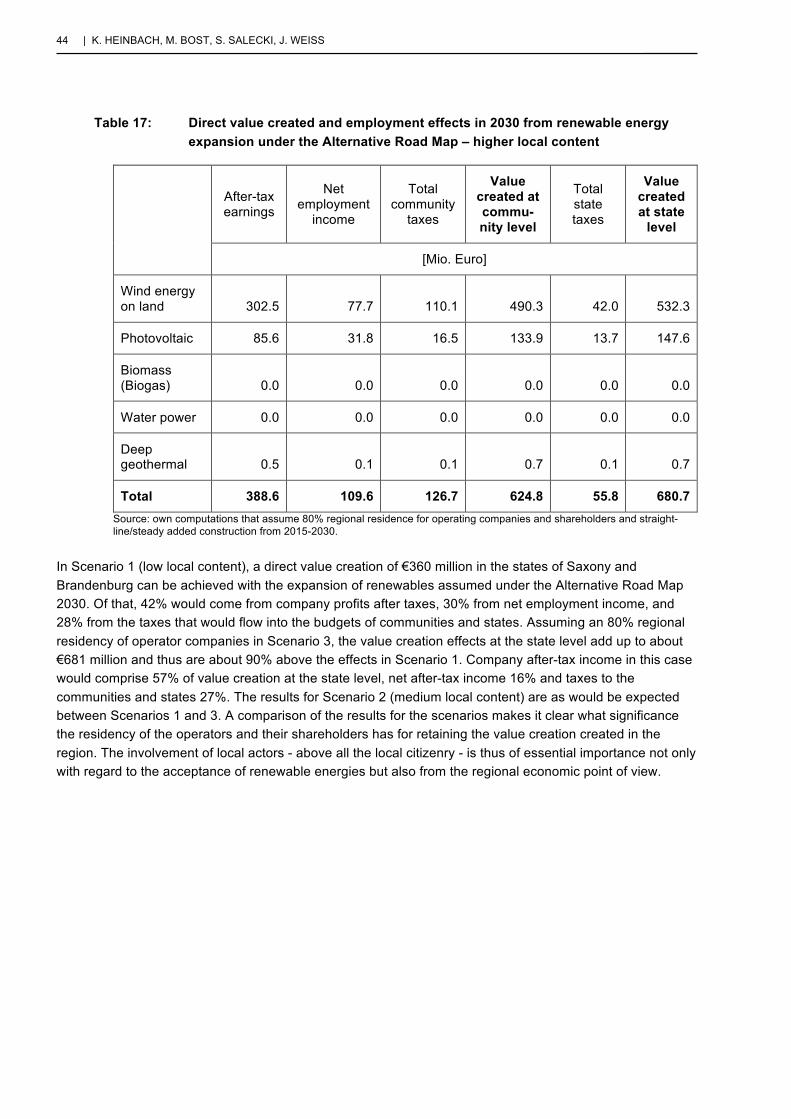
44 | K. HEINBACH, M. BOST, S. SALECKI, J. WEISS
Table 17: Direct value created and employment effects in 2030 from renewable energy expansion under the Alternative Road Map – higher local content
After-tax earnings
Net employment
income
Total community
taxes
Value created at commu-nity level
Total state taxes
Value created at state
level
[Mio. Euro]
Wind energy on land 302.5 77.7 110.1 490.3 42.0 532.3
Photovoltaic 85.6 31.8 16.5 133.9 13.7 147.6
Biomass (Biogas) 0.0 0.0 0.0 0.0 0.0 0.0
Water power 0.0 0.0 0.0 0.0 0.0 0.0
Deep geothermal 0.5 0.1 0.1 0.7 0.1 0.7
Total 388.6 109.6 126.7 624.8 55.8 680.7 Source: own computations that assume 80% regional residence for operating companies and shareholders and straight-line/steady added construction from 2015-2030.
In Scenario 1 (low local content), a direct value creation of €360 million in the states of Saxony and Brandenburg can be achieved with the expansion of renewables assumed under the Alternative Road Map 2030. Of that, 42% would come from company profits after taxes, 30% from net employment income, and 28% from the taxes that would flow into the budgets of communities and states. Assuming an 80% regional residency of operator companies in Scenario 3, the value creation effects at the state level add up to about €681 million and thus are about 90% above the effects in Scenario 1. Company after-tax income in this case would comprise 57% of value creation at the state level, net after-tax income 16% and taxes to the communities and states 27%. The results for Scenario 2 (medium local content) are as would be expected between Scenarios 1 and 3. A comparison of the results for the scenarios makes it clear what significance the residency of the operators and their shareholders has for retaining the value creation created in the region. The involvement of local actors - above all the local citizenry - is thus of essential importance not only with regard to the acceptance of renewable energies but also from the regional economic point of view.
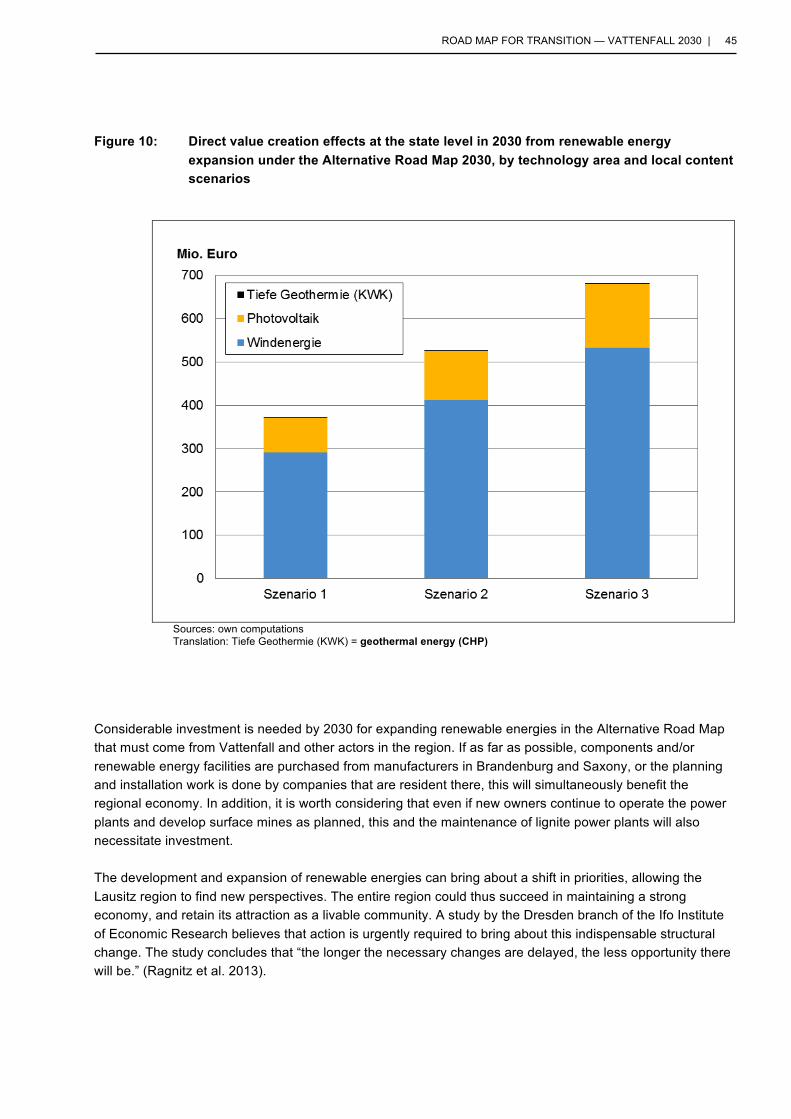
ROAD MAP FOR TRANSITION — VATTENFALL 2030 | 45
Figure 10: Direct value creation effects at the state level in 2030 from renewable energy expansion under the Alternative Road Map 2030, by technology area and local content scenarios
Considerable investment is needed by 2030 for expanding renewable energies in the Alternative Road Map that must come from Vattenfall and other actors in the region. If as far as possible, components and/or renewable energy facilities are purchased from manufacturers in Brandenburg and Saxony, or the planning and installation work is done by companies that are resident there, this will simultaneously benefit the regional economy. In addition, it is worth considering that even if new owners continue to operate the power plants and develop surface mines as planned, this and the maintenance of lignite power plants will also necessitate investment.
The development and expansion of renewable energies can bring about a shift in priorities, allowing the Lausitz region to find new perspectives. The entire region could thus succeed in maintaining a strong economy, and retain its attraction as a livable community. A study by the Dresden branch of the Ifo Institute of Economic Research believes that action is urgently required to bring about this indispensable structural change. The study concludes that “the longer the necessary changes are delayed, the less opportunity there will be.” (Ragnitz et al. 2013).
Sources: own computations Translation: Tiefe Geothermie (KWK) = geothermal energy (CHP)
46 | K. HEINBACH, M. BOST, S. SALECKI, J. WEISS
4 Conclusions The aim of this short study was to demonstrate what a climate-friendly and socially responsible road map for transition for Vattenfall’s phaseout of lignite in Germany by 2030 could look like. To this end, the report first outlined a road map for the phaseout of lignite and compared its (regional) economic advantages and disadvantages. Then, to ensure a socially responsible phaseout, and in particular to provide for the loss of jobs, an alternative road map was drafted that showed how this loss of jobs could be compensated by the expansion of renewable energies, at least in terms of numbers.
The road map for transition until 2020 was determined largely by Vattenfall’s own climate targets. High reductions in emissions of CO2 are necessary if these targets are to be met. They could in fact be met by reducing the installed capacity of the power plants in accordance with the national ‘Klimabeitrag’ [national climate contribution scheme] proposed by Germany’s Ministry for Economic Affairs and Energy and by decommissioning two power plant units. Secondly, the road map calls for a constant and steady reduction in lignite-fired electricity until the complete phaseout of lignite power generation is completed in 2030. We can however assume that the newer power plants Boxberg IV and Lippendorf are meant to continue operating as long as possible so that a particularly sharp decline in emissions can be expected in the last two years. Without CCTS and/or CCU technologies, the use of which currently seems unlikely, Brandenburg’s low-carbon targets for 2030 could probably only be met by phasing out the use of lignite to generate electricity. At the same time, the road map for transition plays an important role in meeting the German government’s climate protection goals. Coal reserves that were approved and earmarked for exploitation by the beginning of 2013, do not at any time have a limiting influence on this road map.
Economic aspects were taken into consideration, and job losses expected in the region as a result of the phaseout were examined, as well as the follow-up costs of lignite mining and power generation. The reduction of selected follow-up costs should a phaseout be carried out were also calculated. If a phaseout takes place, we can expect the loss of all jobs in Vattenfall’s mines and in the lignite-fired power plants by 2030. But Prognos (2011; 2012) calculates that if the operation of power plants and lignite mines continues, direct employment in the lignite industry will decline by 50% by 2030. Due to the demographics of employees, we assume that a higher number of employees would be retired by 2030, so that the loss of jobs would be managed in a socially responsible way.
Should a phaseout take place, about 4,100 jobs would be lost. The computed ecological follow-up costs are incurred by lignite mining and power generation. Even if measures are in place to internalized these costs (for example, follow-up costs are at least partially covered by provisions made by the companies responsible), a large part of the follow-up costs are externalized and must be paid for by society. The phaseout could significantly reduce external costs. In the event of such a phaseout, alone the environmental cost of emissions released when lignite is used to generate electricity, would be EUR 82.7 billion less than if lignite operations were to continue – that is, if a shift to renewable energies is carried out as recommended by the Alternative Road Map 2030.
There are different ways of responding to job losses resulting from the phaseout of lignite operations. In the present study, we examined to what extent the regional use of renewable energy sources to generate electricity could replace those jobs. Findings show that there is sufficient potential for a further expansion of renewable energies to compensate for job losses in the German states concerned. In fact, regional studies show that there is considerable potential for the
ROAD MAP FOR TRANSITION — VATTENFALL 2030 | 47
expansion of renewable energies in the Lausitz region in particular. Even though other opportunities for investment in sustainable energy industries and the creation of jobs in areas such as renewable heat, the expansion of heat networks, energy efficiency, energy services and new technologies such as power to heat, power to gas, and power to X were not taken into account in this study.
Vattenfall’s close collaboration with the various groups and initiatives committed to change in the energy industry and a phaseout of lignite in the Lausitz region is desirable so that in future, they can work together to bring about an energy transition in the region. The citizen’s groups Bürger für die Lausitz - Klinger Runde and the Lausitzer Allianz – the latter represents the interests of the Sorbs – explicitly advocate structural change in the Lausitz region. Local initiatives that actively promote the expansion of renewables as an alternative to lignite, and work to bring about change in the country’s energy policies are, for example, Pro Guben e.V., KRABAT - Energiepark Proschim as well as Bündnis Heimat and Zukunft in Brandenburg. Communities and counties in the Lausitz-Spreewald planning region have united and created the Lausitz Energy Region. They too are committed to the expansion of renewable energies and sustainable development in the region – without however questioning the use of lignite power generation.
The study “Industrial and Economic Lausitz Region: Current Situation and Perspectives” compiled by the Ifo Institute for Economic Research in Dresden in 2013 concludes that concerted efforts are necessary to secure the economic future of the Lausitz region (Ragnitz et al. 2013). Although individual players are already active in this area, there is no specific plan to date for an ecological and socially responsible industrial transition for the Lausitz region, which also envisions an end of the lignite industry. The present report succeeds in developing a framework for the development of such a transition plan. It shows that jobs that are still expected to exist in the lignite industry in 2030 can also be secured through the widespread expansion of renewable energies (without taking other future technologies into account). Investments made by Vattenfall and other regional players could contribute to a climate-friendly and socially responsible shift in the energy industry of the Lausitz region. That would make the company a pioneer of the energy revolution and would contribute to a socially responsible and ecologically acceptable alternative for the region and the people who currently work there. The Lausitz region has potential, but the longer it holds on to structures dependent on the old lignite industry, the lower its chances of bringing about change will be.
48 | K. HEINBACH, M. BOST, S. SALECKI, J. WEISS
5 Literature AEE [Agentur für Erneuerbare Energien] (2015): Bundesländer mit neuer Energie. In: Föderal erneuerbar. http://www.foederal-
erneuerbar.de/startseite (Zugegriffen 20. März 2015).
Aretz, Astrid, Katharina Heinbach, Bernd Hirschl und André Schröder [Institut für ökologische Wirtschaftsforschung] (2013): Wertschöpfungs- und Beschäftigungseffekte durch den Ausbau Erneuerbarer Energien. Hamburg. http://www.greenpeace.de/fileadmin/gpd/user_upload/themen/energie/20130902-Greenpeace-Studie-Wertschoepfung.pdf.
BMU [Bundesministerium für Umwelt, Naturschutz und Reaktorsicherheit] (2011): Erfahrungsbericht 2011 zum Erneuerbare-Energien-Gesetz. http://www.erneuerbare-energien.de/files/pdfs/allgemein/application/pdf/eeg_erfahrungsbericht_2011_entwurf.pdf (Zugegriffen 8. Juli 2011).
BMU und BMWi (2010): Energiekonzept für eine umweltschonende, zuverlässige und bezahlbare Energieversorgung. Berlin: Bundesministerium für Umwelt, Naturschutz und Reaktorsicherheit (BMU); Bundesministerium für Wirtschaft und Technologie (BMWi). http://www.bundesregierung.de/ContentArchiv/DE/Archiv17/_Anlagen/2012/02/energiekonzept-final.pdf?__blob=publicationFile&v=5.
BMWi [00000] (2014): Energiedaten (Stand: August 2014). http://www.bmwi.de/BMWi/Redaktion/Binaer/energie-daten-gesamt,property=blob,bereich=bmwi,sprache=de,rwb=true.xls (Zugegriffen 19. August 2014).
BNetzA [Bundesnetzagentur] (2014): Kraftwerksliste Bundesnetzagentur (bundesweit; alle Netz- und Umspannebenen). 29. Oktober.
Bofinger, Stefan, Doron Callies, Michael Scheibe, Yves-Marie Saint-Drenan und Kurt Rohrig (2012): Potenzial der Windenergienutzung an Land. Kurzfassung. Berlin.
Bost, Mark, Timo Böther, Bernd Hirschl, Sebastian Kreuz, Anna Neumann und Julika Weiß (2012a): Erneuerbare Energien Potenziale in Brandenburg 2030. Berlin: Institut für ökologische Wirtschaftsforschung (IÖW). http://www.ioew.de/publikation_single/Erneuerbare_Energien_Potenziale_in_Brandenburg_2030/.
Bost, Mark, Timo Böther, Bernd Hirschl, Sebastian Kreuz, Anna Neumann und Julika Weiß [00002] (2012b): Erneuerbare Energien Potenziale in Brandenburg 2030. Berlin: Institut für ökologische Wirtschaftsforschung (IÖW). http://www.ioew.de/publikation_single/Erneuerbare_Energien_Potenziale_in_Brandenburg_2030/.
Boulouchos, Konstantinos (2014): Verzerrter Strommarkt: Sind die Erneuerbaren daran schuld? Zukunftsblog Energie. In: ETH Zürich. 8. Juli. https://www.ethz.ch/de/news-und-veranstaltungen/eth-news/news/2014/07/verzerrter-strommarkt-sind-die-erneuerbaren-dara-schuld.html.
Brauner, Günther (2013): Flexibilisierung der thermischen Kraftwerke für die Energiewende. Netzregelung uns Betriebsführung, 11. Juni, München. http://publik.tuwien.ac.at/files/PubDat_225342.pdf.
Bundesagentur für Arbeit (2012): Arbeitsmarkt in Zahlen - Beschäftigungsstatistik: Sozialversicherungspflichtig Beschäftigte nach Wirtschaftszweigen (WZ 2008) Deutschland.
Bundesbank (2012): Hochgerechnete Angaben aus Jahresabschlüssen deutscher Unternehmen von 2006 bis 2011.
Daniels, Wolfgang, Hans-Peter Grafe, Antje Koppen, Eckhard Kreibich, Uwe Mixdorf, Hans-Jürgen Schlegel, Peter Volkmer, Volkmar Weise, Dieter Winkler und Gerd Wolf (2008): Ermittlung der technischen Potenziale der erneuerbaren Energieträger in Sachsen sowie deren wirtschaftliche Umsetzungsmöglichkeiten für die Stromerzeugung bis zum Jahr 2020. Dresden: Vereinigung zur Förderung der Nutzung Erneuerbarer Energien VEE Sachsen.
DGS [Deutsche Gesellschaft für Sonnenenergie] (2015): EnergyMap - Bundesland Sachsen. In: EnergyMap.info. http://www.energymap.info/energieregionen/DE/105/121.html (Zugegriffen 15. April 2015).
EC [European Commission] (2014a): List of Stationary Installations in the Union Registry. In: Emissions Trading System (EU ETS). 27. Februar. http://ec.europa.eu/clima/policies/ets/registry/documentation_en.htm.
EC [European Commission] (2014b): Verified Emissions for 2013. In: Emissions Trading System (EU ETS). 1. April. http://ec.europa.eu/clima/policies/ets/registry/documentation_en.htm.
EnergieAgentur NRW (2013): Flexibilität von Kraftwerken. Für Netzstabilität und Versorgungssicherheit. April. https://broschueren.nordrheinwestfalendirekt.de/herunterladen/der/datei/bro-kwt-flexibilitaet-final2-pdf/von/flexibilitaet-von-kraftwerken-fuer-netzstabilitaet-und-versorgungssicherhei/vom/energieagentur/1405.
ROAD MAP FOR TRANSITION — VATTENFALL 2030 | 49
Erdmann, Georg (2013): Kurzgutachten zur energiewirtschaftlichen Planrechtfertigung im Entwurf des Braunkohlenplans „Tagebau Welzow-Süd räumlicher Teilabschnitt II“.
Fachverband Biogas (2014): Branchenzahlenprognose für die Jahre 2014 und 2015.
Gerbaulet, Clemens, Jonas Egerer, Pao-Yu Oei und Christian von Hirschhausen (2012a): Abnehmende Bedeutung der Braunkohleverstromung: Weder neue Kraftwerke noch Tagebaue benötigt. DIW Wochenbericht. Berlin: DIW, 28. November. http://www.diw.de/documents/publikationen/73/diw_01.c.412252.de/12-48-4.pdf.
Gerbaulet, Clemens, Jonas Egerer, Pao-Yu Oei, Judith Paeper und Christian von Hirschhausen (2012b): Die Zukunft der Braunkohle in Deutschland im Rahmen der Energiewende. Politikberatung kompakt. Berlin: DIW.
Grüne Liga (2015): Arbeitsplatzeffekte der Lausitzer Braunkohlewirtschaft. Hintergrundpapier. http://www.lausitzer-braunkohle.de/Texte/hintergrund_arbeitsplaetze.pdf (Zugegriffen 12. April 2015).
Hilmes, Uwe und Nicolai Herrmann (2014): Der „ideale Kraftwerkspark“ der Zukunft; Flexibel, klimafreundlich, kosteneffizient – Maßstab für einen optimierten Entwicklungspfad der Energieversorgung bis 2040; Energiewirtschaftliche Untersuchung. Berlin: enervis energy advisors GmbH.
Von Hirschhausen, Christian, Johannes Herold und Oei, Pao-Yu (2012): CCTS-Technologie ein Fehlschlag: Umdenken in der Energiewende notwendig. In: DIW-Wochenbericht 6/2012: 3–9.
Hirschhausen, Christian von und Pao-Yu Oei (2013a): Gutachten zur energiepolitischen Notwendigkeit der Inanspruchnahme der im Teilfeld II des Tagebau Welzow-Süd lagernden Kohlevorräte unter besonderer Berücksichtigung der Zielfunktionen der Energiestrategie 2030 des Landes Brandenburg. Politikberatung kompakt. Berlin: DIW.
Hirschhausen, Christian von und Pao-Yu Oei (2013b): Gutachten zur energiewirtschaftlichen Notwendigkeit der Fortschreibung des Braunkohlenplans „Tagebau Nochten“. Gutachten. Berlin: DIW.
Hirschl, Bernd, Astrid Aretz, Andreas Prahl, Timo Böther, Katharina Heinbach, Daniel Pick und Simon Funcke [00040] (2010): Kommunale Wertschöpfung durch erneuerbare Energien. Schriftenreihe des Instituts für ökologische Wirtschaftsforschung (Hrsg.). Nr. 196/10. Berlin. http://www.ioew.de/uploads/tx_ukioewdb/IOEW_SR_196_Kommunale_Wertsch%C3%B6pfung_durch_Erneuerbare_Energien.pdf.
IER (2012): Energiewirtschaftliche Bedeutung der Braunkohlenutzung in Deutschland. Stuttgart: Institut für Energiewirtschaft und Rationelle Energieanwendung der Universität Stuttgart.
Kost, Christoph, Johannes N. Mayer, Jessica Thomsen, Niklas Hartmann, Charlotte Senkpiel, Simon Philipps, Sebastian Nold, Simon Lude und Thomas Schlegl (2013): Stromgestehungskosten Erneuerbare Energien. Studie. Freiburg: Fraunhofer Institut für solare Energiesysteme. http://www.ise.fraunhofer.de/de/veroeffentlichungen/veroeffentlichungen-pdf-dateien/studien-und-konzeptpapiere/studie-stromgestehungskosten-erneuerbare-energien.pdf (Zugegriffen 3. April 2014).
Kunz, Friedrich, Gerbaulet, Clemens und Christian von Hirschhausen (2013): Mittelfristige Strombedarfsdeckung durch Kraftwerke und Netze nicht gefährdet. In: DIW Wochenbericht (18. September).
Land Berlin und Vattenfall (2009): Klimaschutzvereinbarung zwischen dem Land Berlin und Vattenfall. 8. Oktober. http://www.stadtentwicklung.berlin.de/umwelt/klimaschutz/aktiv/vereinbarung/download/vattenfall-ks_senguv.pdf.
LUGV [Brandenburgisches Landesamt für Umwelt, Gesundheit und Verbraucherschutz] (2014): Klimagasinventur 2013 für das Land Brandenburg. Oktober. http://www.lugv.brandenburg.de/media_fast/4055/klimagas_2013.pdf.
MWE [Ministerium für Wirtschaft und Europaangelegenheiten des Landes Brandenburg] (2012): Energiestrategie 2030 des Landes Brandenburg. 21. Februar. http://www.energie.brandenburg.de/media/bb1.a.2865.de/Energiestrategie_2030.pdf.
Nitsch, Joachim, Thomas Pregger, Tobias Naegler, Dominik Heide, Diego Luca de Tena, Franz Trieb, Yvonne Scholz, et al. (2012a): Langfristszenarien und Strategien für den Ausbau der erneuerbaren Energien in Deutschland bei Berücksichtigung der Entwicklung in Europa und global. Schlussbericht. Stuttgart, Kassel, Teltow.
Nitsch, Joachim, Thomas Pregger, Tobias Naegler, Dominik Heide, Diego Luca de Tena, Franz Trieb, Yvonne Scholz, et al. (2012b): Langfristszenarien und Strategien für den Ausbau der erneuerbaren Energien in Deutschland bei Berücksichtigung der Entwicklung in Europa und global. Datenanhang II zum Schlussbericht. Stuttgart, Kassel, Teltow.
Oei, Pao-Yu, Claudia Kemfert, Felix Reitz und Christian von Hirschhausen (2014): Braunkohleausstieg – Gestaltungsoptionen im Rahmen der Energiewende. Politikberatung kompakt. Berlin: DIW. http://www.diw.de/documents/publikationen/73/diw_01.c.471589.de/diwkompakt_2014-084.pdf.
50 | HEINBACH, BOST, SALECKI, WEISS
Prognos (2005): Energie- und regionalwirtschaftliche Bedeutung der Braunkohle in Ostdeutschland. Endbericht. Berlin.
Prognos (2011): Bedeutung der Braunkohle in Ostdeutschland. http://www.prognos.com/fileadmin/pdf/publikationsdatenbank/Prognos_Studie_Braunkohle_Ostdeutschland_2011_Langfassung.pdf.
Prognos (2012): Untersuchung der energiestrategischen und regionalwirtschaftlichen Auswirkungen der im Rahmen der systematischen Weiterentwicklung der Energiestrategie des Landes Brandenburg untersuchten Szenarien in zwei Leistungspaketen. Berlin.
Pyc, Ireneusz (2013): VDE-Studie: Erneuerbare Energie braucht flexible Kraftwerke – Szenarien bis 2020 22. November. https://www.vde.com/de/regionalorganisation/bezirksvereine/suedbayern/facharbeit%20regional/akenergietechnik/documents/vortrag%2021-11-2013%20flexible%20kraftwerke.pdf.
RPG Lausitz-Spreewald [Regionale Planungsgemeinschaft Lausitz-Spreewald] (2013): Regionales Energiekonzept Lausitz-Spreewald. Kurzfassung. Cottbus.
Schuster, René (2007): Zur Zukunft der Lausitzer Braunkohle: Kohlebedarf des konventionellen Kraftwerkparks sowie Folgen für den Klimaschutz und die Inanspruchnahme von Siedlungen. Cottbus: Fraktion die Linke.
SMUL [Sächsisches Staatsministerium für Umwelt und Landwirtschaft] (2009): Hintergrundpapier zu den Zielen der künftigen Klimaschutz und Energiepolitik des Freistaates Sachsen.
SMWA und SMUL [Sächsisches Staatsministerium für Wirtschaft, Arbeit und Verkehr, Sächsisches Staatsministeriumfür Umwelt und Landwirtschaft] (2013): Energie- und Klimaprogramm Sachsen 2012. Dresden.
Statistik der Kohlenwirtschaft (2014): Altersgliederung der Belegschaft. Stand 4/14. http://www.kohlenstatistik.de/19-0-Braunkohle.html (Zugegriffen 17. April 2015).
Statistik der Kohlenwirtschaft (2015): Beschäftigte im Braunkohlenbergbau. Stand: 03/15. http://www.kohlenstatistik.de/19-0-Braunkohle.html (Zugegriffen 17. April 2015).
Statistisches Bundesamt (2012a): Statistisches Jahrbuch - Deutschland und Internationales.
Statistisches Bundesamt (2012b): Verdienste und Arbeitskosten - Arbeitnehmerverdienste 2011.
Statistisches Bundesamt (2012c): Finanzen und Steuern - Umsatzsteuerstatistik (Voranmeldungen) 2010.
Stroedter, Jörg (2015): Zwischenbericht der Enquete-Kommission „Neue Energie für Berlin – Zukunft der energiewirtschaftlichen Strukturen“. Abgeordnetenhaus von Berlin, 9. Februar. http://www.parlament-berlin.de/ados/17/IIIPlen/vorgang/d17-2100.pdf.
UBA [Umweltbundesamt] (2012a): Ökonomische Bewertung von Umweltschäden: Methodenkonvention 2.0 zur Schätzung von Umweltkosten (inklusive Anhang A und B). Dessau-Roßlau.
UBA [Umweltbundesamt] (2012b): Schätzung der Umweltkosten in den Bereichen Energie und Verkehr. Empfehlungen des Umweltbundesamtes. Dessau-Roßlau.
UBA [Umweltbundesamt] (2014): Kraftwerke in Deutschland (ab 100 Megawatt elektrischer Leistung). August.
Vattenfall (2009): 24/7/365. Vattenfall Europe AG. http://corporate.vattenfall.de/globalassets/deutschland/finanzberichte/vattenfall_europe_24_7_365.pdf.
Vattenfall (2013): Eine neue Energielandschaft. Geschäftsbericht 2012 inklusive Nachhaltigkeitsbericht.
Vattenfall (2014): Fortgesetzte Positionierung für den Energiemarkt von morgen. Geschäfts- und Nachhaltigkeitsbericht 2013.
Vattenfall Europe Mining Aktiengesellschaft (2009): Jahresabschluss zum Geschäftsjahr vom 01.01.2008 bis zum 31.12.2008.
Vattenfall Europe Mining Aktiengesellschaft (2014): Jahresabschluss zum Geschäftsjahr vom 01.01.2013 bis zum 31.12.2013. Bericht über das Geschäftsjahr 2013 vom 1. Januar bis 31. Dezember 2013.
VDE (2012): Erneuerbare Energie braucht flexible Kraftwerke – Szenarien bis 2020. ETG - Energietechnische Gesellschaft im VDE.
Wagner, Hermann-Josef, Marco K. Koch und Jörg Burkhardt (2007): CO2-Emissionen der Stromerzeugung. Ein ganzheitlicher Vergleich verschiedener Techniken. In: BWK 59, Nr. 10: 44–52.
Wronski, Rupert und Swantje Küchler (2014): Kostenrisiken für die Gesellschaft durch den deutschen Braunkohletagebau. Berlin.
Ziehm, Cornelia (2014): Neue Braunkohlentagebaue und Verfassungsrecht – Konsequenzen aus dem Garzweiler-Urteil des Bundesverfassungsgerichts. Deutsche Umwelthilfe (DUH).

![V.S LIGNITE POWER Pvt. Ltd [Gurha East Lignite Mine (1 MPTA)] · V.S LIGNITE POWER Pvt. Ltd [Gurha East Lignite Mine (1 MPTA)] AT VILLAGE-GURHA, KOLAYAT, BIKANER, ... Embankment has](https://img.pdfslide.net/doc/110x75/5e8c64539924dc7ac37938bd/vs-lignite-power-pvt-ltd-gurha-east-lignite-mine-1-mpta-vs-lignite-power.jpg)