Embed Size (px)
Citation preview
Dan LeBeau, ConsultantAllan Martin, PartnerTony Ferrara, CAIA, Senior Analyst
May 18, 2015
Investment Performance Analysisfor the period ending March 31, 2015
Ventura County Employees’ Retirement Association
Page
Market Environment Update and Outlook 2
Total Fund Performance 17
Manager Due Diligence 49
Appendix: Market Environment; Performance Disclosures 54
ContentsVentura County Employees’ Retirement Association
March 31, 2015
1

Market Environment Update and Outlook
2
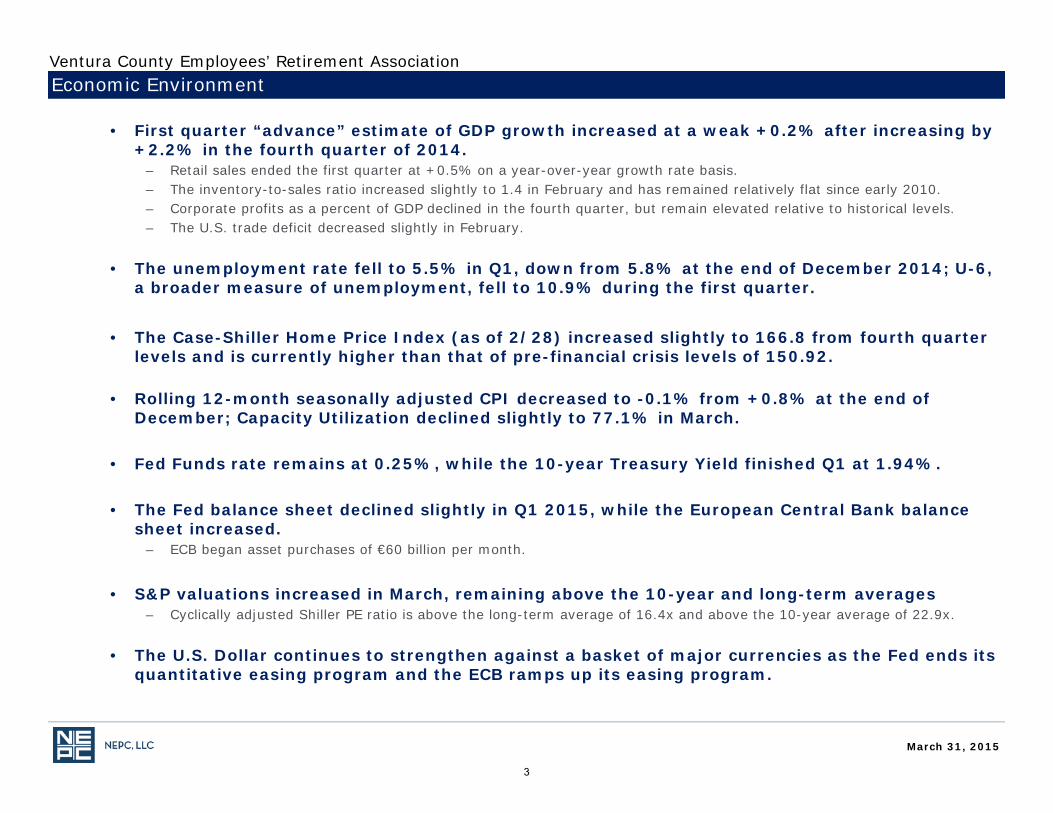
• First quarter “advance” estimate of GDP growth increased at a weak +0.2% after increasing by +2.2% in the fourth quarter of 2014.
– Retail sales ended the first quarter at +0.5% on a year-over-year growth rate basis.– The inventory-to-sales ratio increased slightly to 1.4 in February and has remained relatively flat since early 2010. – Corporate profits as a percent of GDP declined in the fourth quarter, but remain elevated relative to historical levels.– The U.S. trade deficit decreased slightly in February.
• The unemployment rate fell to 5.5% in Q1, down from 5.8% at the end of December 2014; U-6, a broader measure of unemployment, fell to 10.9% during the first quarter.
• The Case-Shiller Home Price Index (as of 2/28) increased slightly to 166.8 from fourth quarter levels and is currently higher than that of pre-financial crisis levels of 150.92.
• Rolling 12-month seasonally adjusted CPI decreased to -0.1% from +0.8% at the end of December; Capacity Utilization declined slightly to 77.1% in March.
• Fed Funds rate remains at 0.25%, while the 10-year Treasury Yield finished Q1 at 1.94%.
• The Fed balance sheet declined slightly in Q1 2015, while the European Central Bank balance sheet increased.
– ECB began asset purchases of €60 billion per month.
• S&P valuations increased in March, remaining above the 10-year and long-term averages– Cyclically adjusted Shiller PE ratio is above the long-term average of 16.4x and above the 10-year average of 22.9x.
• The U.S. Dollar continues to strengthen against a basket of major currencies as the Fed ends its quantitative easing program and the ECB ramps up its easing program.
Economic Environment
March 31, 2015
Ventura County Employees’ Retirement Association
3
Market Environment – Q1 2015 Overview
* As of 12/31/2014
March 31, 2015
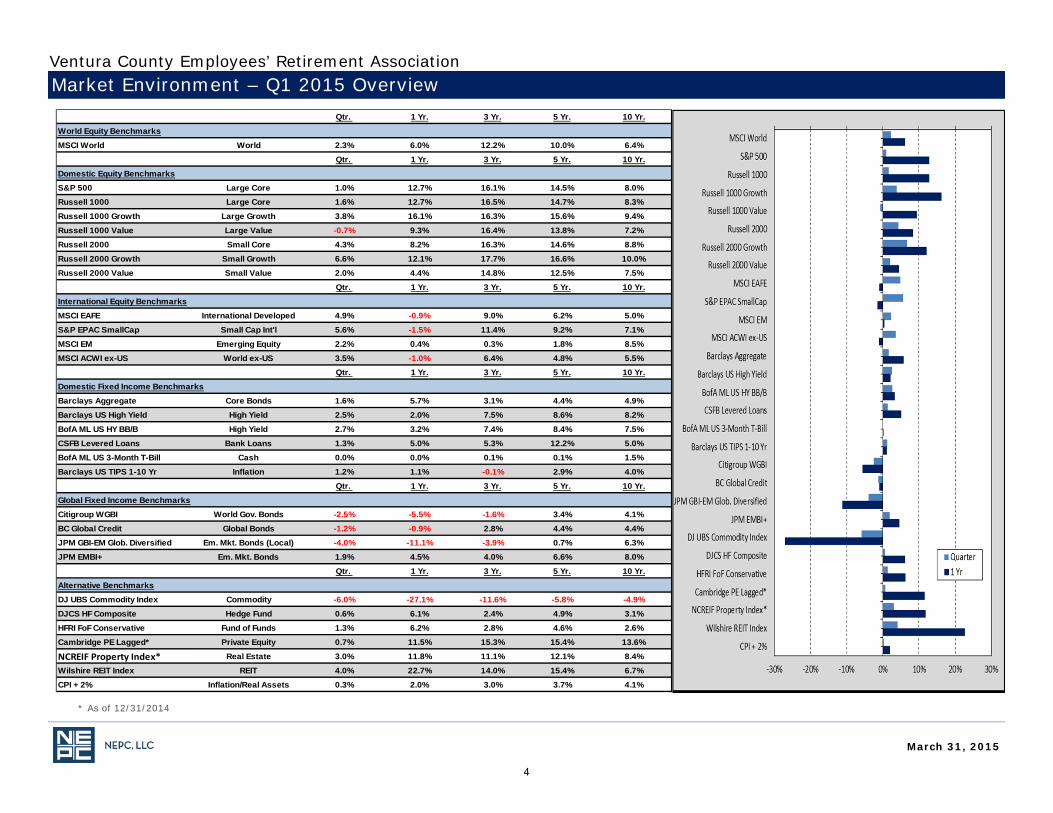
Qtr. 1 Yr. 3 Yr. 5 Yr. 10 Yr.
World Equity Benchmarks
MSCI World World 2.3% 6.0% 12.2% 10.0% 6.4%
Qtr. 1 Yr. 3 Yr. 5 Yr. 10 Yr.
Domestic Equity Benchmarks
S&P 500 Large Core 1.0% 12.7% 16.1% 14.5% 8.0%Russell 1000 Large Core 1.6% 12.7% 16.5% 14.7% 8.3%
Russell 1000 Growth Large Growth 3.8% 16.1% 16.3% 15.6% 9.4%
Russell 1000 Value Large Value -0.7% 9.3% 16.4% 13.8% 7.2%
Russell 2000 Small Core 4.3% 8.2% 16.3% 14.6% 8.8%
Russell 2000 Growth Small Growth 6.6% 12.1% 17.7% 16.6% 10.0%
Russell 2000 Value Small Value 2.0% 4.4% 14.8% 12.5% 7.5%
Qtr. 1 Yr. 3 Yr. 5 Yr. 10 Yr.
International Equity Benchmarks
MSCI EAFE International Developed 4.9% -0.9% 9.0% 6.2% 5.0%
S&P EPAC SmallCap Small Cap Int'l 5.6% -1.5% 11.4% 9.2% 7.1%
MSCI EM Emerging Equity 2.2% 0.4% 0.3% 1.8% 8.5%
MSCI ACWI ex-US World ex-US 3.5% -1.0% 6.4% 4.8% 5.5%Qtr. 1 Yr. 3 Yr. 5 Yr. 10 Yr.
Domestic Fixed Income Benchmarks
Barclays Aggregate Core Bonds 1.6% 5.7% 3.1% 4.4% 4.9%
Barclays US High Yield High Yield 2.5% 2.0% 7.5% 8.6% 8.2%
BofA ML US HY BB/B High Yield 2.7% 3.2% 7.4% 8.4% 7.5%
CSFB Levered Loans Bank Loans 1.3% 5.0% 5.3% 12.2% 5.0%
BofA ML US 3-Month T-Bill Cash 0.0% 0.0% 0.1% 0.1% 1.5%
Barclays US TIPS 1-10 Yr Inflation 1.2% 1.1% -0.1% 2.9% 4.0%
Qtr. 1 Yr. 3 Yr. 5 Yr. 10 Yr.
Global Fixed Income Benchmarks
Citigroup WGBI World Gov. Bonds -2.5% -5.5% -1.6% 3.4% 4.1%
BC Global Credit Global Bonds -1.2% -0.9% 2.8% 4.4% 4.4%JPM GBI-EM Glob. Diversified Em. Mkt. Bonds (Local) -4.0% -11.1% -3.9% 0.7% 6.3%
JPM EMBI+ Em. Mkt. Bonds 1.9% 4.5% 4.0% 6.6% 8.0%
Qtr. 1 Yr. 3 Yr. 5 Yr. 10 Yr.
Alternative Benchmarks
DJ UBS Commodity Index Commodity -6.0% -27.1% -11.6% -5.8% -4.9%
DJCS HF Composite Hedge Fund 0.6% 6.1% 2.4% 4.9% 3.1%
HFRI FoF Conservative Fund of Funds 1.3% 6.2% 2.8% 4.6% 2.6%
Cambridge PE Lagged* Private Equity 0.7% 11.5% 15.3% 15.4% 13.6%
NCREIF Property Index* Real Estate 3.0% 11.8% 11.1% 12.1% 8.4%
Wilshire REIT Index REIT 4.0% 22.7% 14.0% 15.4% 6.7%
CPI + 2% Inflation/Real Assets 0.3% 2.0% 3.0% 3.7% 4.1%
Ventura County Employees’ Retirement Association
4
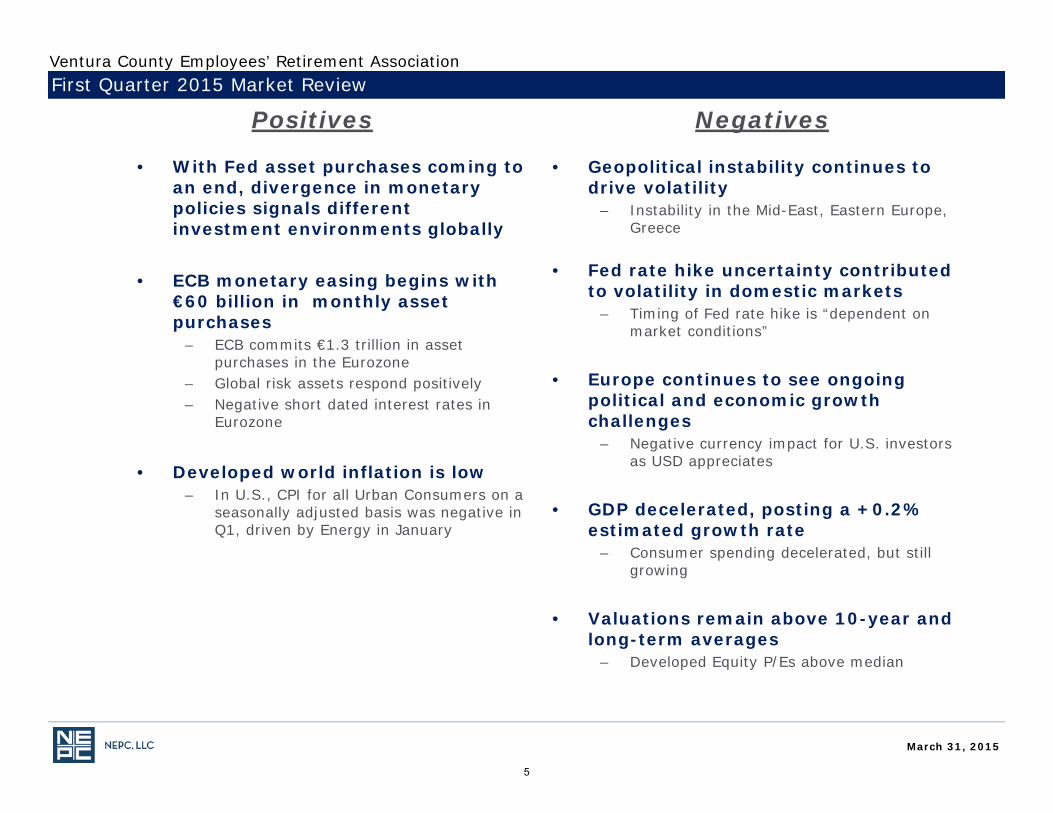
• With Fed asset purchases coming to an end, divergence in monetary policies signals different investment environments globally
• ECB monetary easing begins with €60 billion in monthly asset purchases
– ECB commits €1.3 trillion in asset purchases in the Eurozone
– Global risk assets respond positively– Negative short dated interest rates in
Eurozone
• Developed world inflation is low – In U.S., CPI for all Urban Consumers on a
seasonally adjusted basis was negative in Q1, driven by Energy in January
• Geopolitical instability continues to drive volatility
– Instability in the Mid-East, Eastern Europe, Greece
• Fed rate hike uncertainty contributed to volatility in domestic markets
– Timing of Fed rate hike is “dependent on market conditions”
• Europe continues to see ongoing political and economic growth challenges
– Negative currency impact for U.S. investors as USD appreciates
• GDP decelerated, posting a +0.2% estimated growth rate
– Consumer spending decelerated, but still growing
• Valuations remain above 10-year and long-term averages
– Developed Equity P/Es above median
First Quarter 2015 Market Review
Positives Negatives
March 31, 2015
Ventura County Employees’ Retirement Association
5
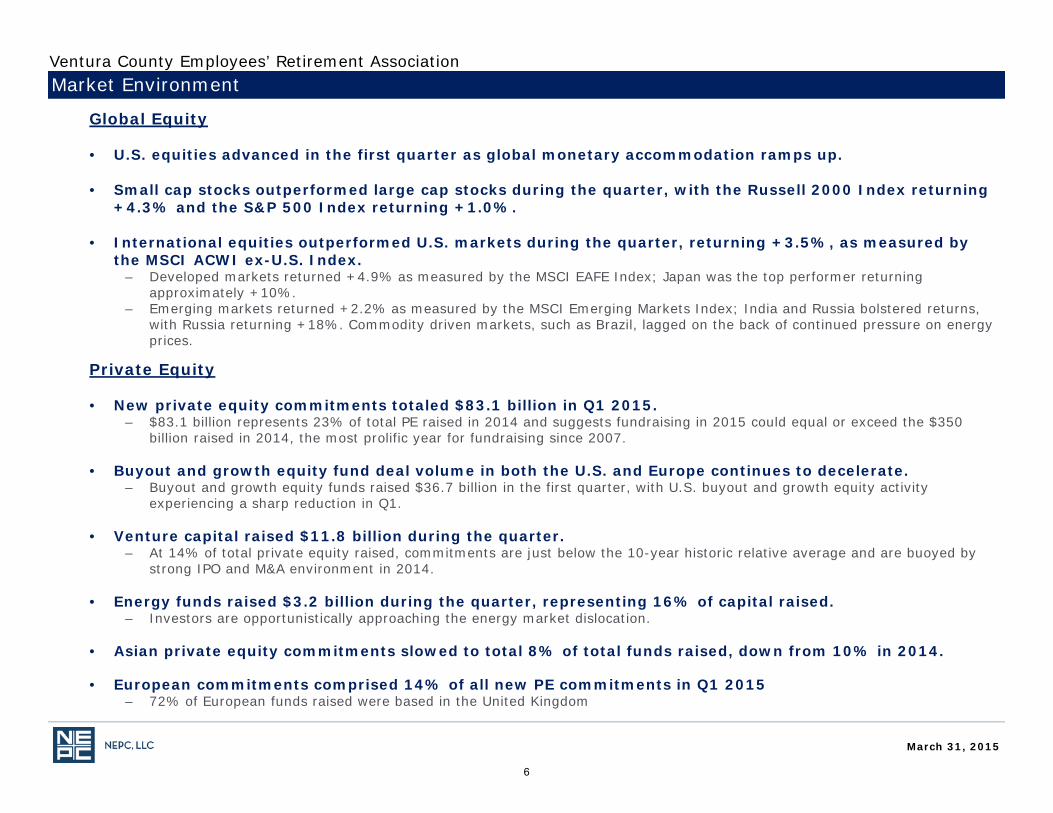
Global Equity
• U.S. equities advanced in the first quarter as global monetary accommodation ramps up.
• Small cap stocks outperformed large cap stocks during the quarter, with the Russell 2000 Index returning +4.3% and the S&P 500 Index returning +1.0%.
• International equities outperformed U.S. markets during the quarter, returning +3.5%, as measured by the MSCI ACWI ex-U.S. Index.
– Developed markets returned +4.9% as measured by the MSCI EAFE Index; Japan was the top performer returning approximately +10%.
– Emerging markets returned +2.2% as measured by the MSCI Emerging Markets Index; India and Russia bolstered returns, with Russia returning +18%. Commodity driven markets, such as Brazil, lagged on the back of continued pressure on energy prices.
Private Equity
• New private equity commitments totaled $83.1 billion in Q1 2015.– $83.1 billion represents 23% of total PE raised in 2014 and suggests fundraising in 2015 could equal or exceed the $350
billion raised in 2014, the most prolific year for fundraising since 2007.
• Buyout and growth equity fund deal volume in both the U.S. and Europe continues to decelerate. – Buyout and growth equity funds raised $36.7 billion in the first quarter, with U.S. buyout and growth equity activity
experiencing a sharp reduction in Q1.
• Venture capital raised $11.8 billion during the quarter. – At 14% of total private equity raised, commitments are just below the 10-year historic relative average and are buoyed by
strong IPO and M&A environment in 2014.
• Energy funds raised $3.2 billion during the quarter, representing 16% of capital raised. – Investors are opportunistically approaching the energy market dislocation.
• Asian private equity commitments slowed to total 8% of total funds raised, down from 10% in 2014.
• European commitments comprised 14% of all new PE commitments in Q1 2015– 72% of European funds raised were based in the United Kingdom
Market Environment
March 31, 2015
Ventura County Employees’ Retirement Association
6
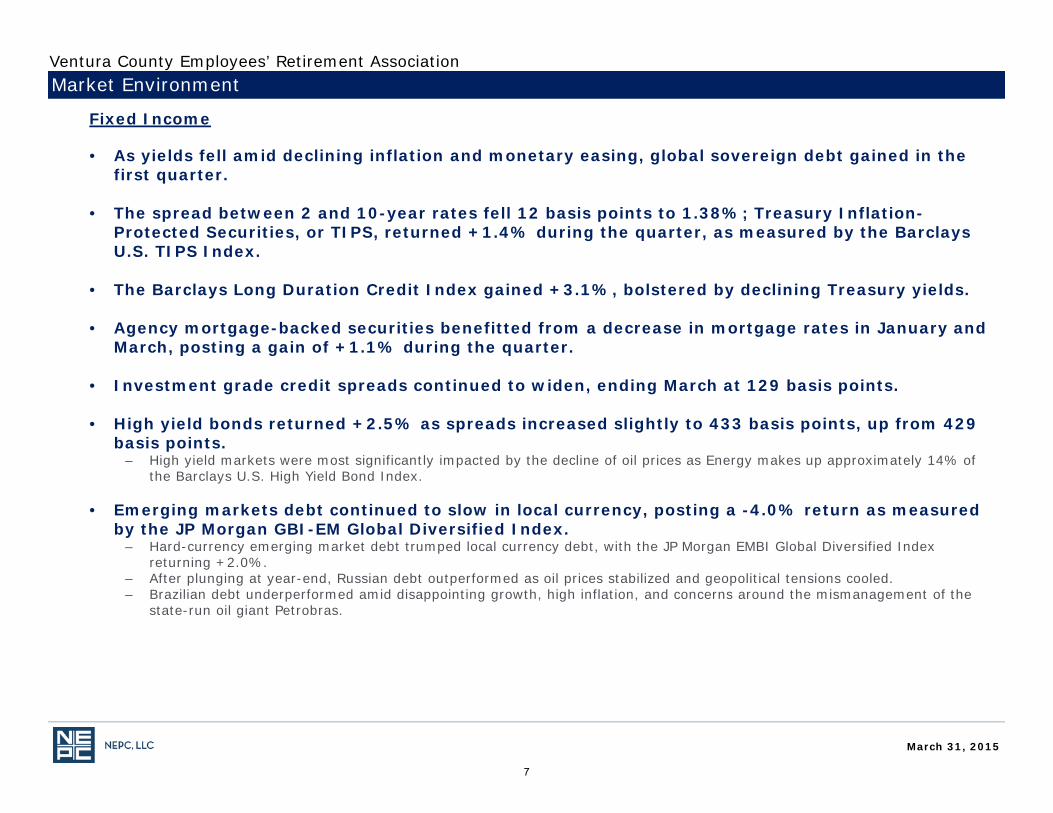
Fixed Income
• As yields fell amid declining inflation and monetary easing, global sovereign debt gained in the first quarter.
• The spread between 2 and 10-year rates fell 12 basis points to 1.38%; Treasury Inflation-Protected Securities, or TIPS, returned +1.4% during the quarter, as measured by the Barclays U.S. TIPS Index.
• The Barclays Long Duration Credit Index gained +3.1%, bolstered by declining Treasury yields.
• Agency mortgage-backed securities benefitted from a decrease in mortgage rates in January and March, posting a gain of +1.1% during the quarter.
• Investment grade credit spreads continued to widen, ending March at 129 basis points.
• High yield bonds returned +2.5% as spreads increased slightly to 433 basis points, up from 429 basis points.
– High yield markets were most significantly impacted by the decline of oil prices as Energy makes up approximately 14% of the Barclays U.S. High Yield Bond Index.
• Emerging markets debt continued to slow in local currency, posting a -4.0% return as measured by the JP Morgan GBI-EM Global Diversified Index.
– Hard-currency emerging market debt trumped local currency debt, with the JP Morgan EMBI Global Diversified Index returning +2.0%.
– After plunging at year-end, Russian debt outperformed as oil prices stabilized and geopolitical tensions cooled. – Brazilian debt underperformed amid disappointing growth, high inflation, and concerns around the mismanagement of the
state-run oil giant Petrobras.
Market Environment
March 31, 2015
Ventura County Employees’ Retirement Association
7
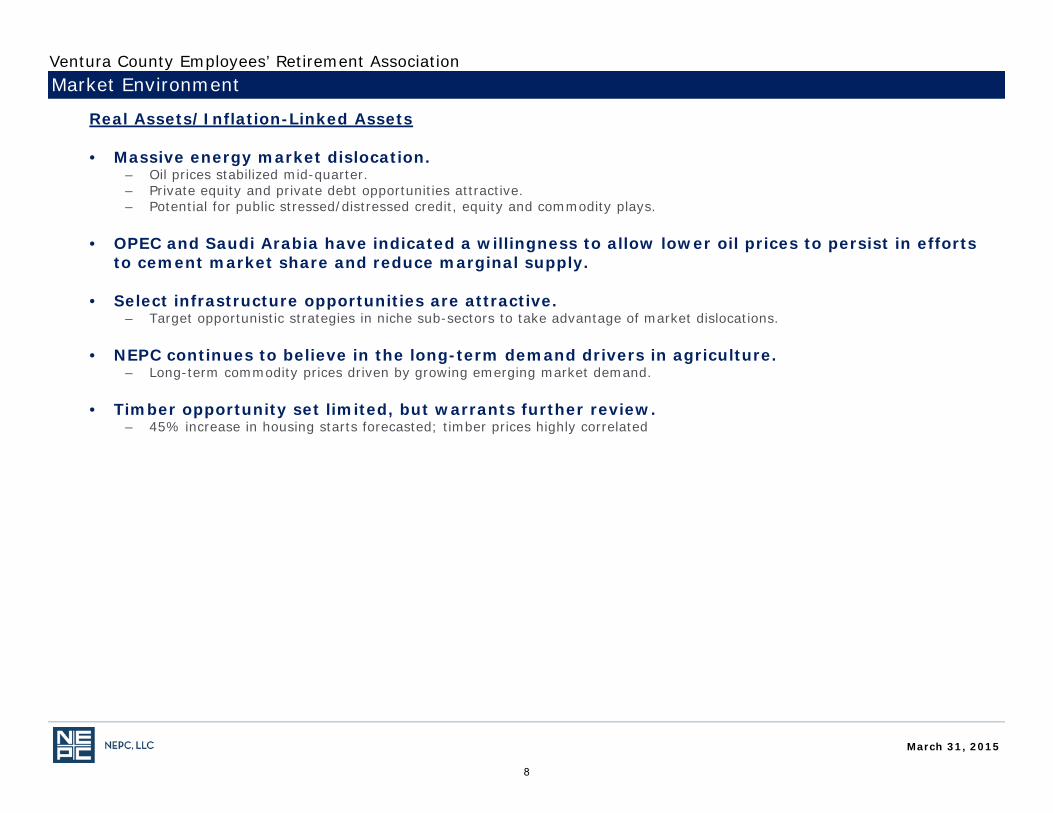
Real Assets/Inflation-Linked Assets
• Massive energy market dislocation.– Oil prices stabilized mid-quarter. – Private equity and private debt opportunities attractive.– Potential for public stressed/distressed credit, equity and commodity plays.
• OPEC and Saudi Arabia have indicated a willingness to allow lower oil prices to persist in efforts to cement market share and reduce marginal supply.
• Select infrastructure opportunities are attractive.– Target opportunistic strategies in niche sub-sectors to take advantage of market dislocations.
• NEPC continues to believe in the long-term demand drivers in agriculture.– Long-term commodity prices driven by growing emerging market demand.
• Timber opportunity set limited, but warrants further review. – 45% increase in housing starts forecasted; timber prices highly correlated
Market Environment
March 31, 2015
Ventura County Employees’ Retirement Association
8
Commodities
• Commodities continued their losing streak, with the Bloomberg Commodity Index posting a loss (-5.9%) for the third straight quarter.
– Volatility in commodities trumped other asset classes, including equities, bonds and the US dollar during the quarter.– Brent crude dropped -9.9% in January, then sharply recovered, gaining +14.8% in February, and slipped again in March,
losing -12.3%, posting a -9.3% loss in Q1.
Real Estate
• NEPC continues to be neutral on core real estate in the U.S. and remains positive on non-core real estate, that is, value-add and opportunistic strategies.
• Within U.S. core real estate, strong fundamentals continue to be the story along with attractive income spreads relative to interest rates.
– The concerns for U.S. core real estate (and U.S. real estate, broadly) continue to be 1) plentiful capital that is driving up pricing, and 2) the market’s expectation for higher future interest rates and their impact on capitalization rates and capital values.
• U.S. REITs posted a strong quarter with a +4.0% return. – REITs are trading at slight premiums to NAV– FFO multiples are up to approximately 18x, remaining considerably above the average of 12.5x since 2000.
• Overall, the non-core real estate investment environment in the U.S. is normalizing; however, select areas remain attractive.
• Europe is viewed as the best place for a marginal dollar of non-core real estate investment. – Europe is emerging from a multi-year recession, but recovery is slow and uneven with global markets experiencing large
capital inflows.– Banks in EU are still overleveraged and have significant real estate exposure to jettison.
Market Environment
March 31, 2015
Ventura County Employees’ Retirement Association
9
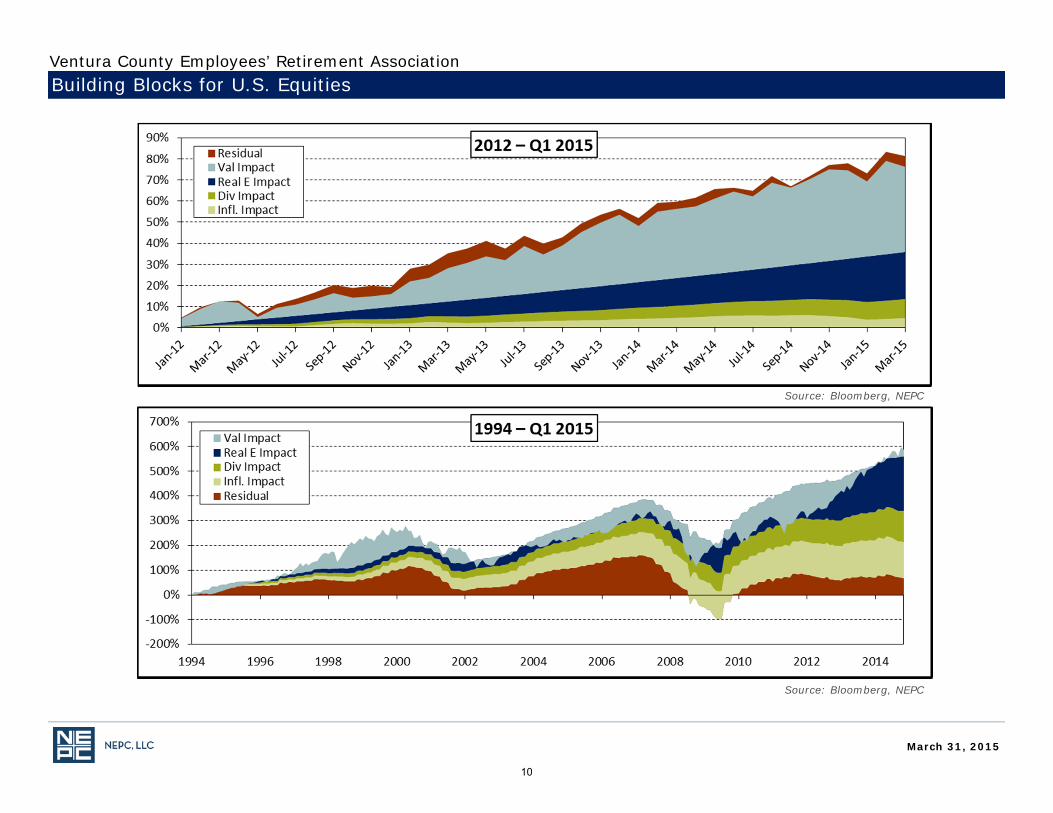
Building Blocks for U.S. Equities
Source: Bloomberg, NEPC
Source: Bloomberg, NEPC
March 31, 2015
Ventura County Employees’ Retirement Association
10
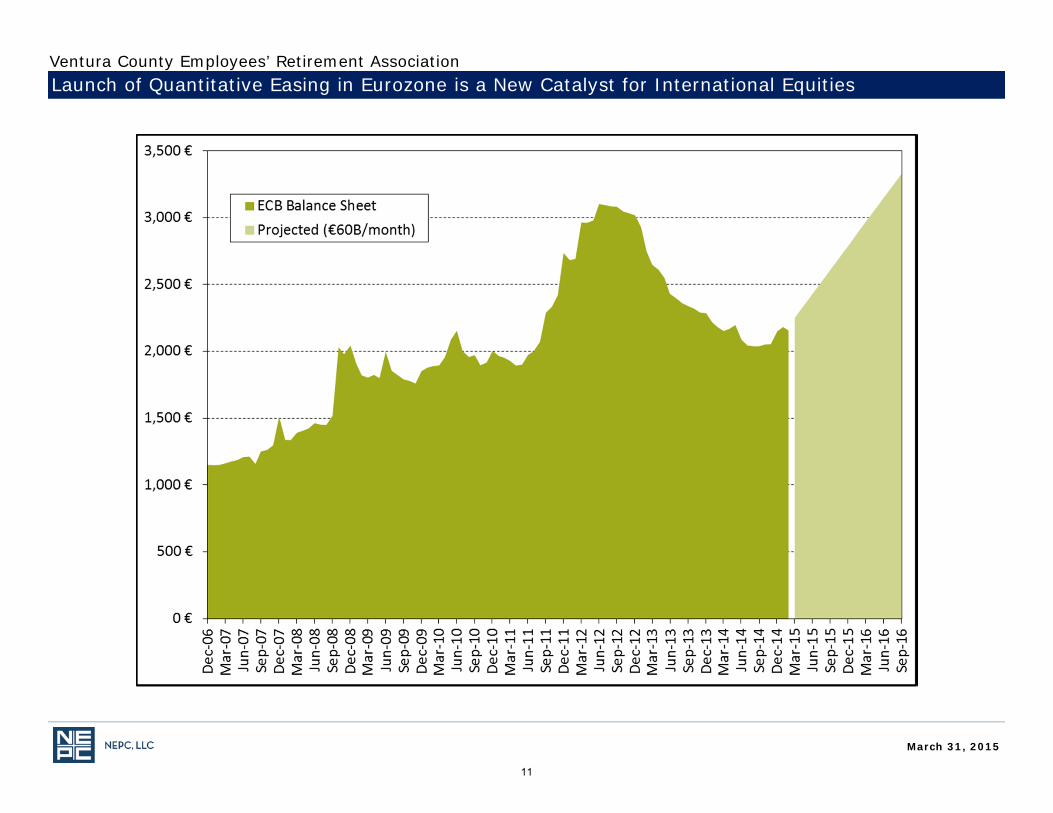
Launch of Quantitative Easing in Eurozone is a New Catalyst for International Equities
March 31, 2015
Ventura County Employees’ Retirement Association
11
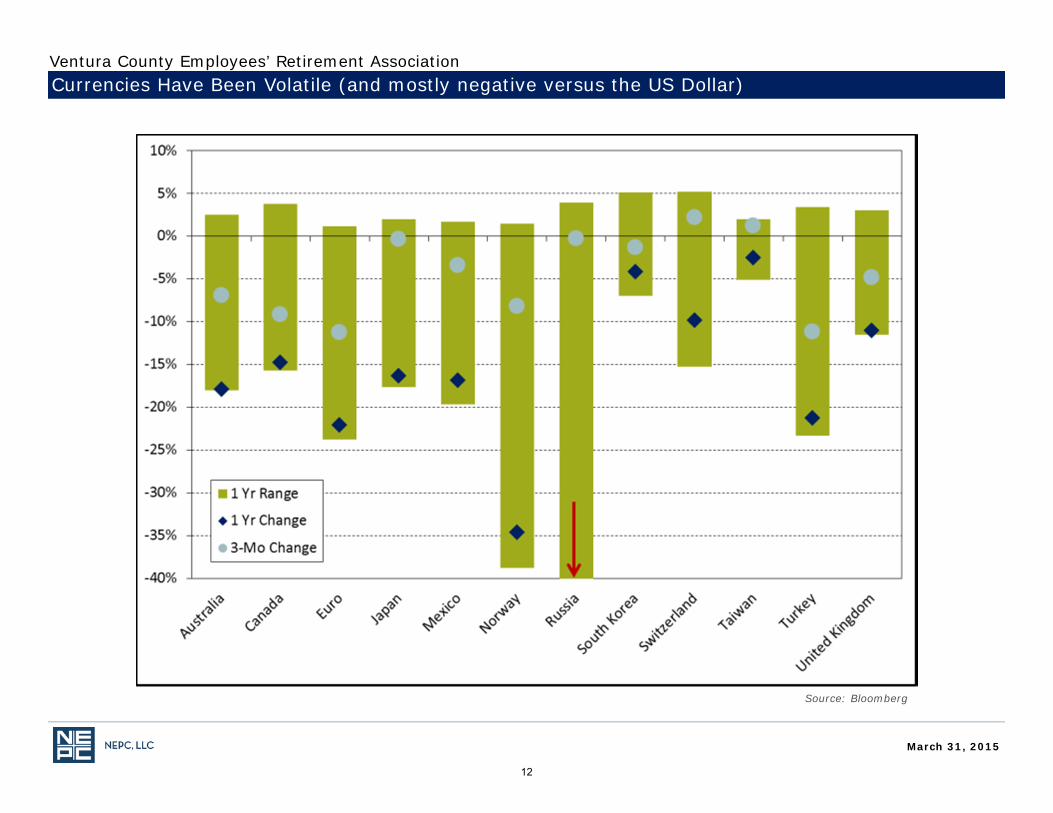
Currencies Have Been Volatile (and mostly negative versus the US Dollar)
Source: Bloomberg
March 31, 2015
Ventura County Employees’ Retirement Association
12
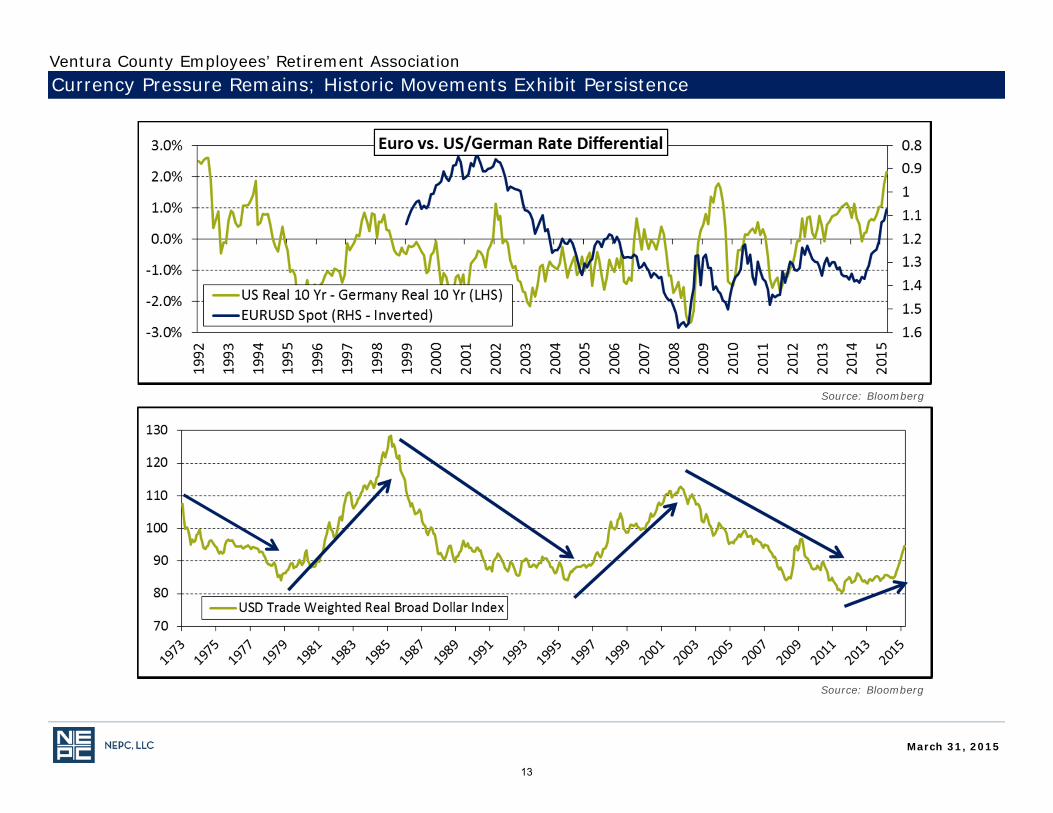
Currency Pressure Remains; Historic Movements Exhibit Persistence
Source: Bloomberg
Source: Bloomberg
March 31, 2015
Ventura County Employees’ Retirement Association
13
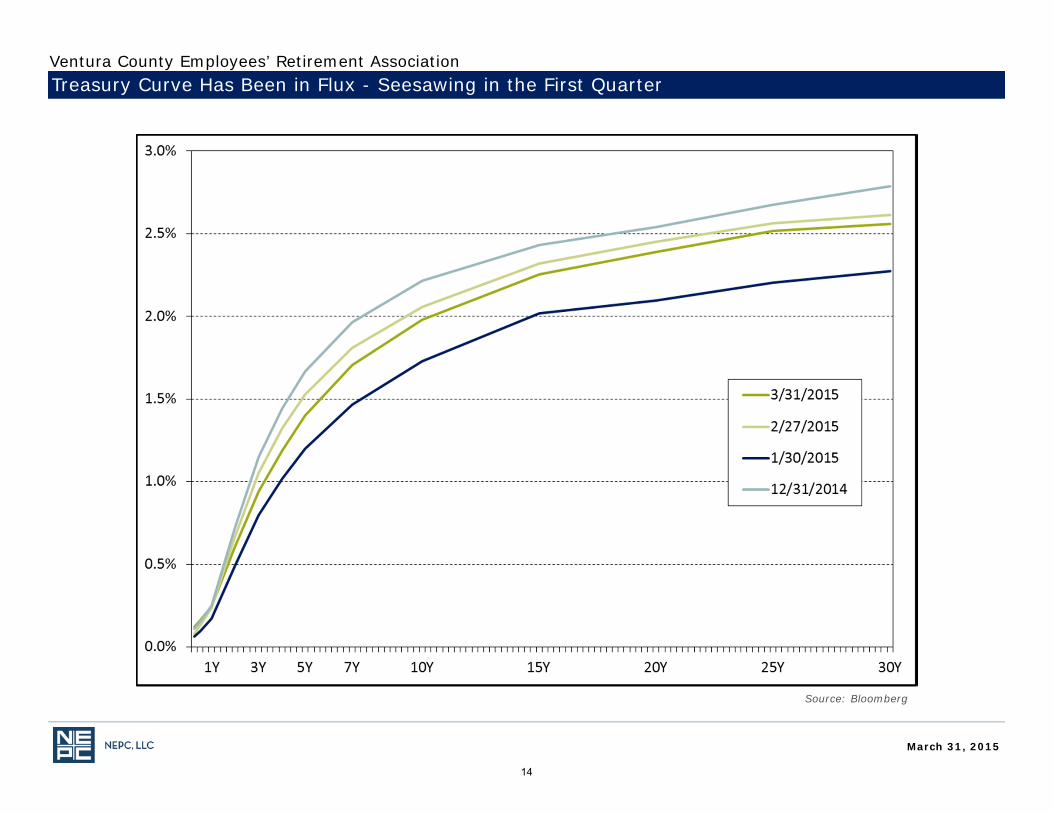
Treasury Curve Has Been in Flux - Seesawing in the First Quarter
Source: Bloomberg
March 31, 2015
Ventura County Employees’ Retirement Association
14
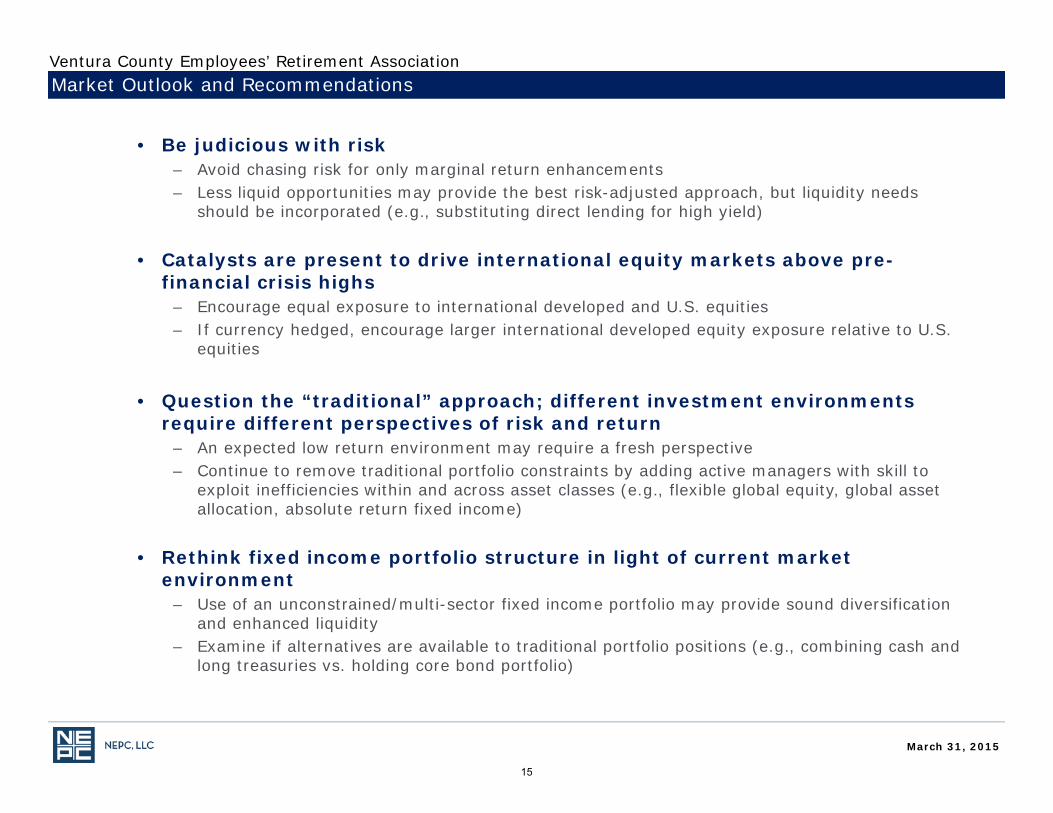
• Be judicious with risk – Avoid chasing risk for only marginal return enhancements– Less liquid opportunities may provide the best risk-adjusted approach, but liquidity needs
should be incorporated (e.g., substituting direct lending for high yield)
• Catalysts are present to drive international equity markets above pre-financial crisis highs
– Encourage equal exposure to international developed and U.S. equities– If currency hedged, encourage larger international developed equity exposure relative to U.S.
equities
• Question the “traditional” approach; different investment environments require different perspectives of risk and return
– An expected low return environment may require a fresh perspective – Continue to remove traditional portfolio constraints by adding active managers with skill to
exploit inefficiencies within and across asset classes (e.g., flexible global equity, global asset allocation, absolute return fixed income)
• Rethink fixed income portfolio structure in light of current market environment
– Use of an unconstrained/multi-sector fixed income portfolio may provide sound diversification and enhanced liquidity
– Examine if alternatives are available to traditional portfolio positions (e.g., combining cash and long treasuries vs. holding core bond portfolio)
Market Outlook and Recommendations
March 31, 2015
Ventura County Employees’ Retirement Association
15
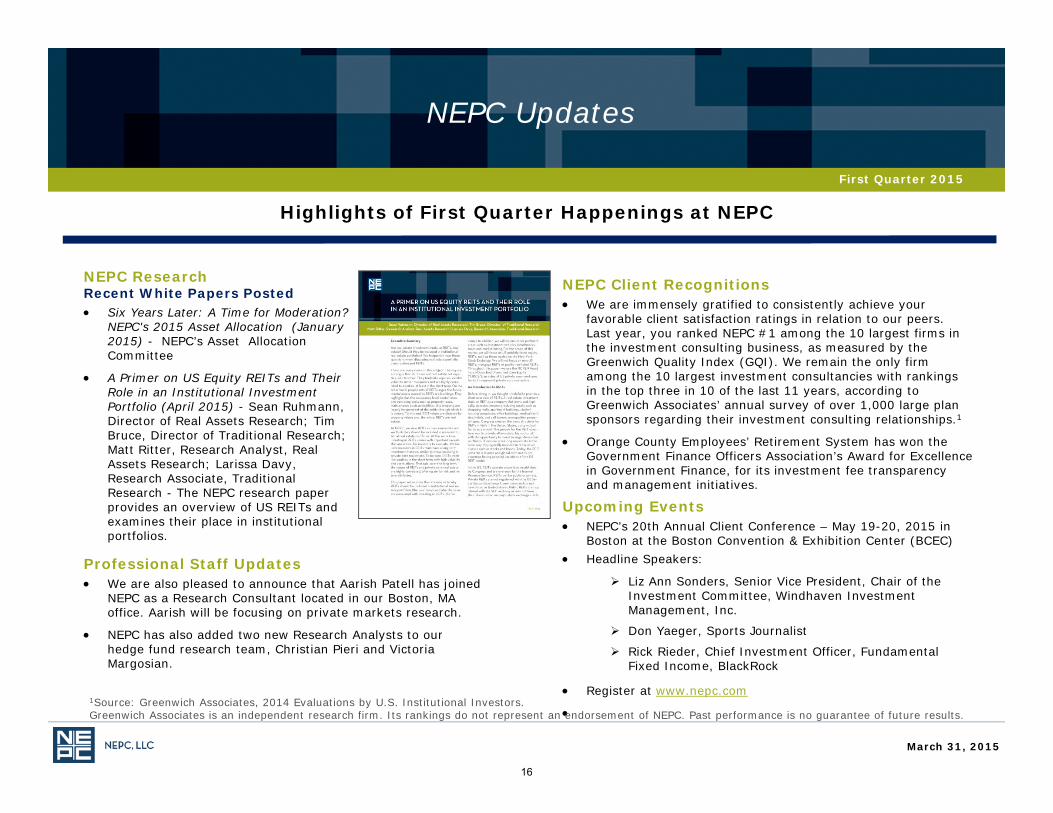
Highlights of First Quarter Happenings at NEPC
First Quarter 2015
NEPC Updates
NEPC ResearchRecent White Papers Posted Six Years Later: A Time for Moderation?
NEPC's 2015 Asset Allocation (January 2015) - NEPC’s Asset Allocation Committee
A Primer on US Equity REITs and Their Role in an Institutional Investment Portfolio (April 2015) - Sean Ruhmann, Director of Real Assets Research; Tim Bruce, Director of Traditional Research; Matt Ritter, Research Analyst, Real Assets Research; Larissa Davy, Research Associate, Traditional Research - The NEPC research paper provides an overview of US REITs and examines their place in institutional portfolios.
NEPC Client Recognitions We are immensely gratified to consistently achieve your
favorable client satisfaction ratings in relation to our peers. Last year, you ranked NEPC #1 among the 10 largest firms in the investment consulting business, as measured by the Greenwich Quality Index (GQI). We remain the only firm among the 10 largest investment consultancies with rankings in the top three in 10 of the last 11 years, according to Greenwich Associates’ annual survey of over 1,000 large plan sponsors regarding their investment consulting relationships.1
Orange County Employees’ Retirement System has won the Government Finance Officers Association’s Award for Excellence in Government Finance, for its investment fee transparency and management initiatives.
Upcoming Events NEPC’s 20th Annual Client Conference – May 19-20, 2015 in
Boston at the Boston Convention & Exhibition Center (BCEC) Headline Speakers:
Liz Ann Sonders, Senior Vice President, Chair of the Investment Committee, Windhaven Investment Management, Inc.
Don Yaeger, Sports Journalist
Rick Rieder, Chief Investment Officer, Fundamental Fixed Income, BlackRock
Register at www.nepc.com
Professional Staff Updates We are also pleased to announce that Aarish Patell has joined
NEPC as a Research Consultant located in our Boston, MA office. Aarish will be focusing on private markets research.
NEPC has also added two new Research Analysts to our hedge fund research team, Christian Pieri and Victoria Margosian.
1Source: Greenwich Associates, 2014 Evaluations by U.S. Institutional Investors. Greenwich Associates is an independent research firm. Its rankings do not represent an endorsement of NEPC. Past performance is no guarantee of future results.
March 31, 2015
16
Total Fund PerformanceNote: All of the data shown on the following pages is as of March 31, 2015 and reflects the deduction of investment manager fees, unless otherwise noted.
17
March 31, 2015
Market Value 3 Mo Rank FiscalYTD Rank 1 Yr Rank 3 Yrs Rank 5 Yrs Rank 10 Yrs Rank Return Since
_
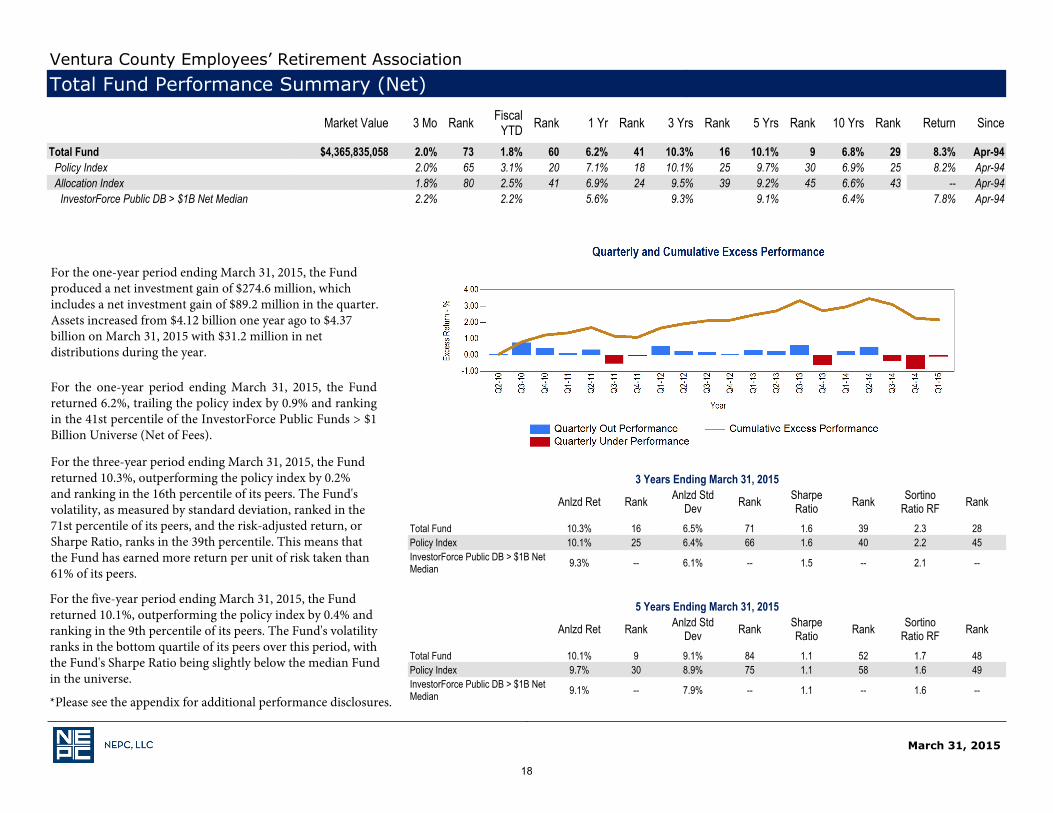
Total Fund $4,365,835,058 2.0% 73 1.8% 60 6.2% 41 10.3% 16 10.1% 9 6.8% 29 8.3% Apr-94Policy Index 2.0% 65 3.1% 20 7.1% 18 10.1% 25 9.7% 30 6.9% 25 8.2% Apr-94Allocation Index 1.8% 80 2.5% 41 6.9% 24 9.5% 39 9.2% 45 6.6% 43 -- Apr-94
InvestorForce Public DB > $1B Net Median 2.2% 2.2% 5.6% 9.3% 9.1% 6.4% 7.8% Apr-94XXXXX
5 Years Ending March 31, 2015
Anlzd Ret Rank Anlzd StdDev Rank Sharpe
Ratio Rank SortinoRatio RF Rank
_
Total Fund 10.1% 9 9.1% 84 1.1 52 1.7 48Policy Index 9.7% 30 8.9% 75 1.1 58 1.6 49InvestorForce Public DB > $1B NetMedian 9.1% -- 7.9% -- 1.1 -- 1.6 --
3 Years Ending March 31, 2015
Anlzd Ret Rank Anlzd StdDev Rank Sharpe
Ratio Rank SortinoRatio RF Rank
_
Total Fund 10.3% 16 6.5% 71 1.6 39 2.3 28Policy Index 10.1% 25 6.4% 66 1.6 40 2.2 45InvestorForce Public DB > $1B NetMedian 9.3% -- 6.1% -- 1.5 -- 2.1 --
XXXXX
Ventura County Employees’ Retirement AssociationTotal Fund Performance Summary (Net)
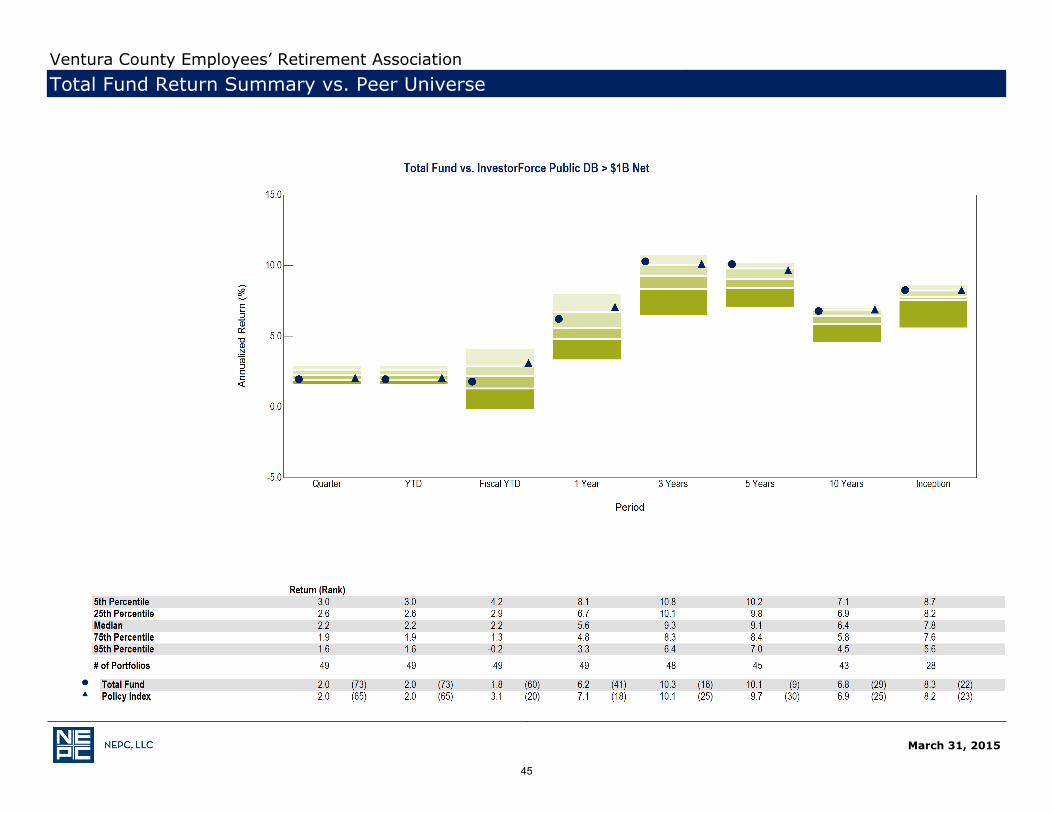
For the one-year period ending March 31, 2015, the Fund produced a net investment gain of $274.6 million, which includes a net investment gain of $89.2 million in the quarter. Assets increased from $4.12 billion one year ago to $4.37 billion on March 31, 2015 with $31.2 million in net distributions during the year.
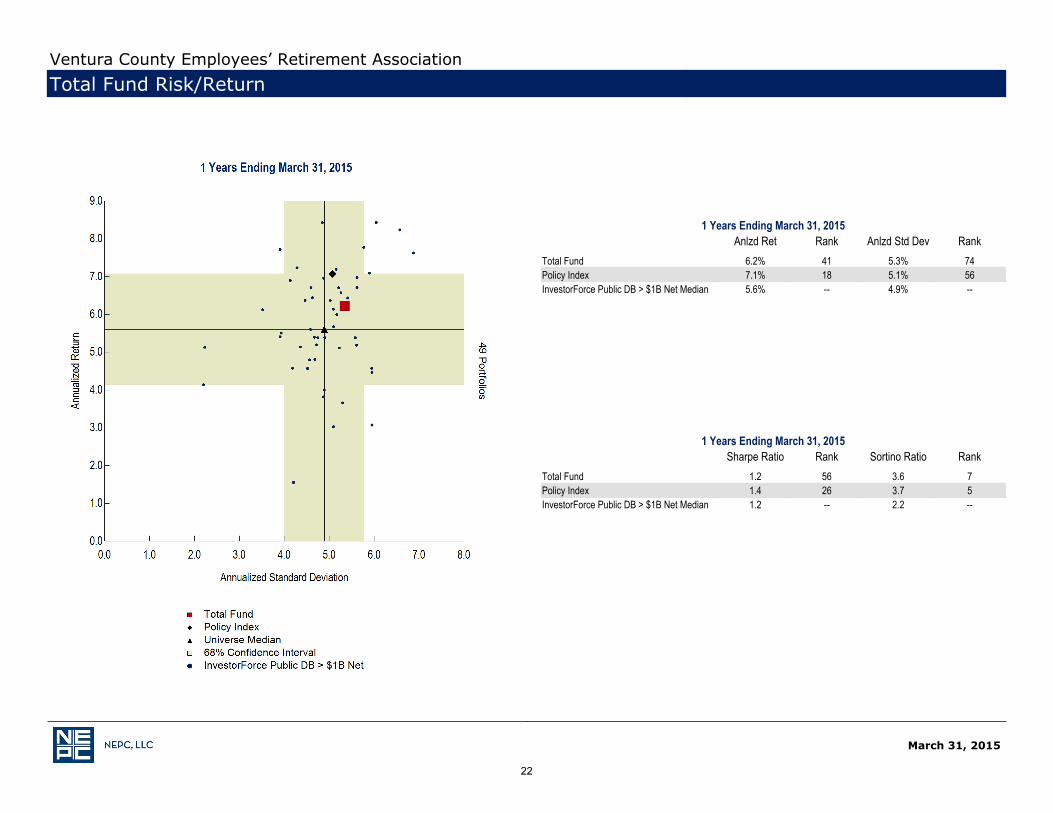
For the one-year period ending March 31, 2015, the Fund returned 6.2%, trailing the policy index by 0.9% and ranking in the 41st percentile of the InvestorForce Public Funds > $1 Billion Universe (Net of Fees).
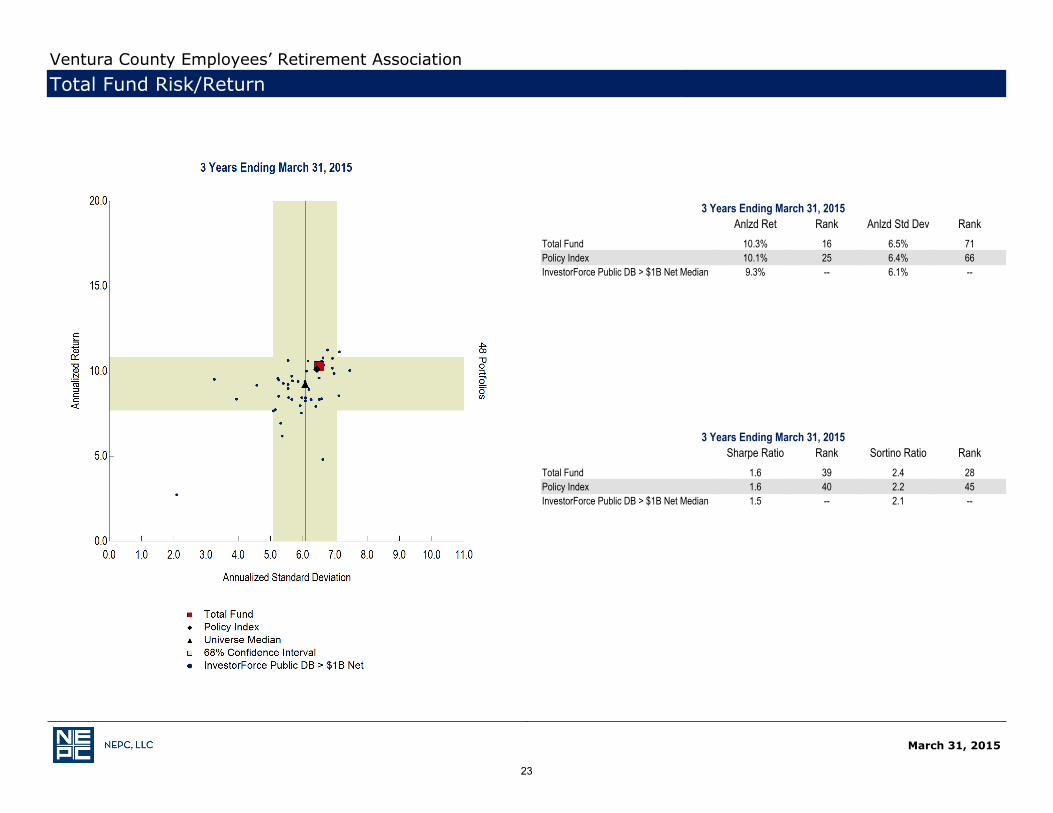
For the three-year period ending March 31, 2015, the Fund returned 10.3%, outperforming the policy index by 0.2% and ranking in the 16th percentile of its peers. The Fund's volatility, as measured by standard deviation, ranked in the 71st percentile of its peers, and the risk-adjusted return, or Sharpe Ratio, ranks in the 39th percentile. This means that the Fund has earned more return per unit of risk taken than 61% of its peers.
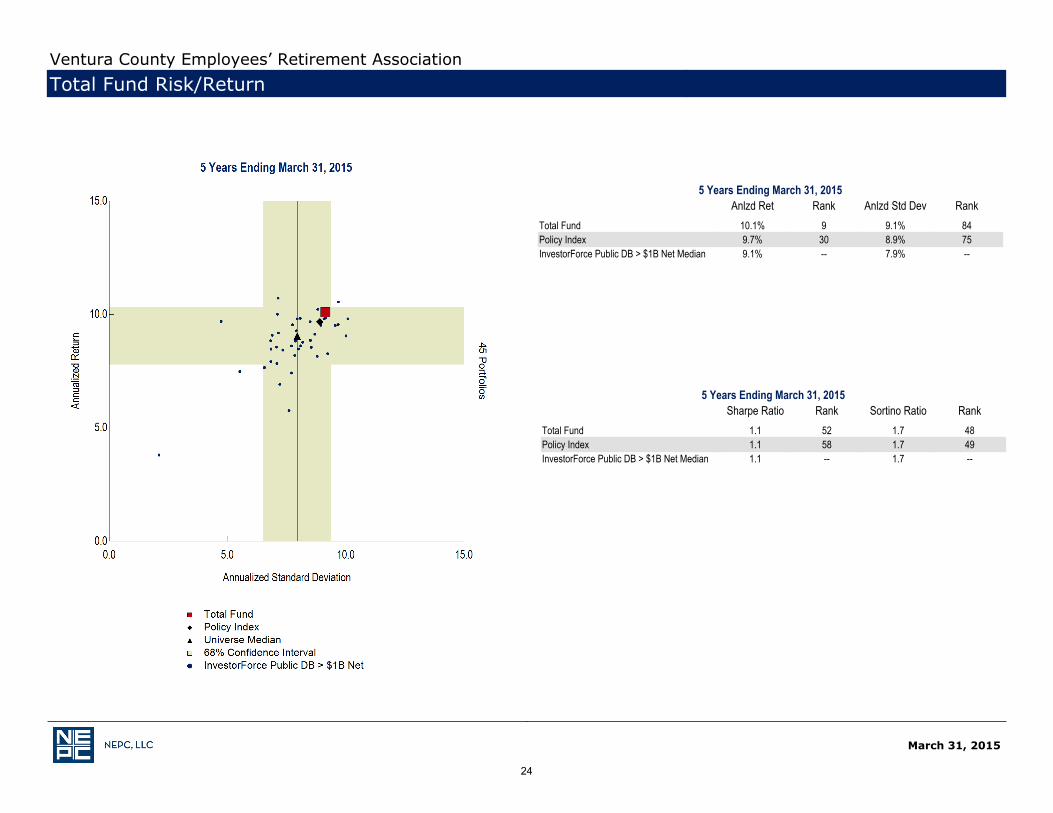
For the five-year period ending March 31, 2015, the Fund returned 10.1%, outperforming the policy index by 0.4% and ranking in the 9th percentile of its peers. The Fund's volatility ranks in the bottom quartile of its peers over this period, with the Fund's Sharpe Ratio being slightly below the median Fund in the universe.
*Please see the appendix for additional performance disclosures.
18
March 31, 2015
Ventura County Employees’ Retirement AssociationTotal Fund Asset Growth Summary
Summary of Cash FlowsSources of Portfolio Growth First Quarter Fiscal Year-To-Date One Year
_
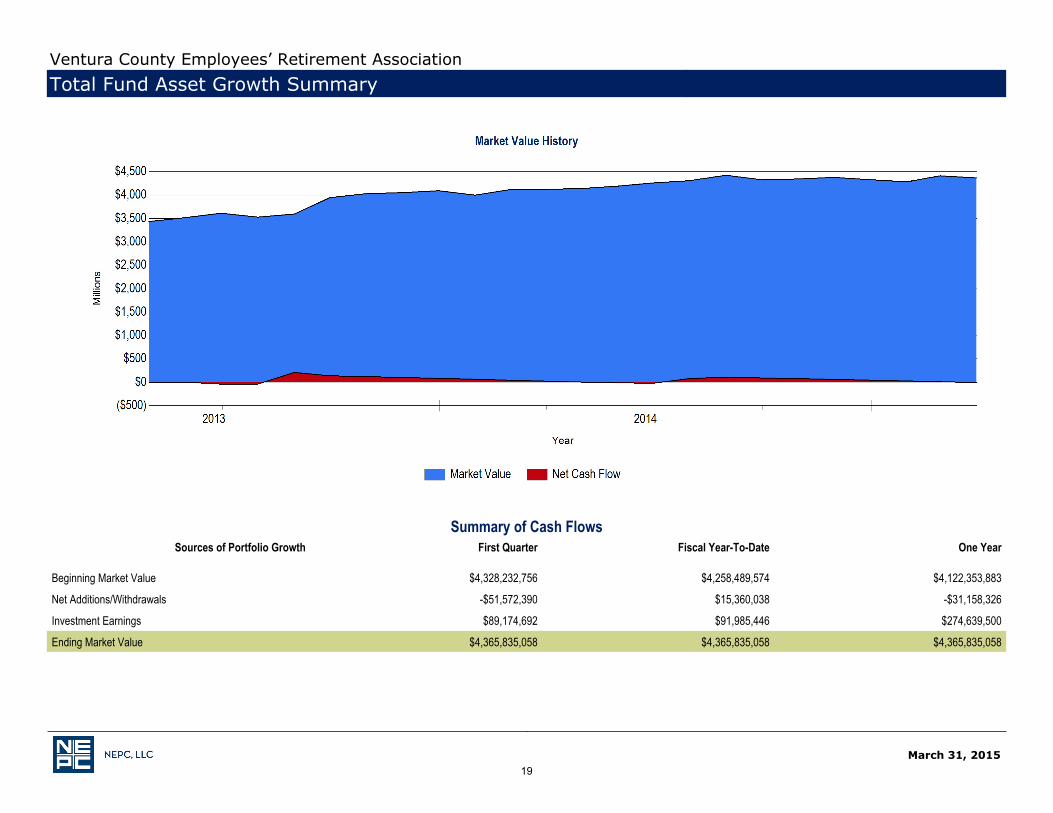
Beginning Market Value $4,328,232,756 $4,258,489,574 $4,122,353,883
Net Additions/Withdrawals -$51,572,390 $15,360,038 -$31,158,326
Investment Earnings $89,174,692 $91,985,446 $274,639,500
Ending Market Value $4,365,835,058 $4,365,835,058 $4,365,835,058_
19
March 31, 2015
Asset Allocation vs. Target
Current Current Policy Difference* Policy Range Within
Range_
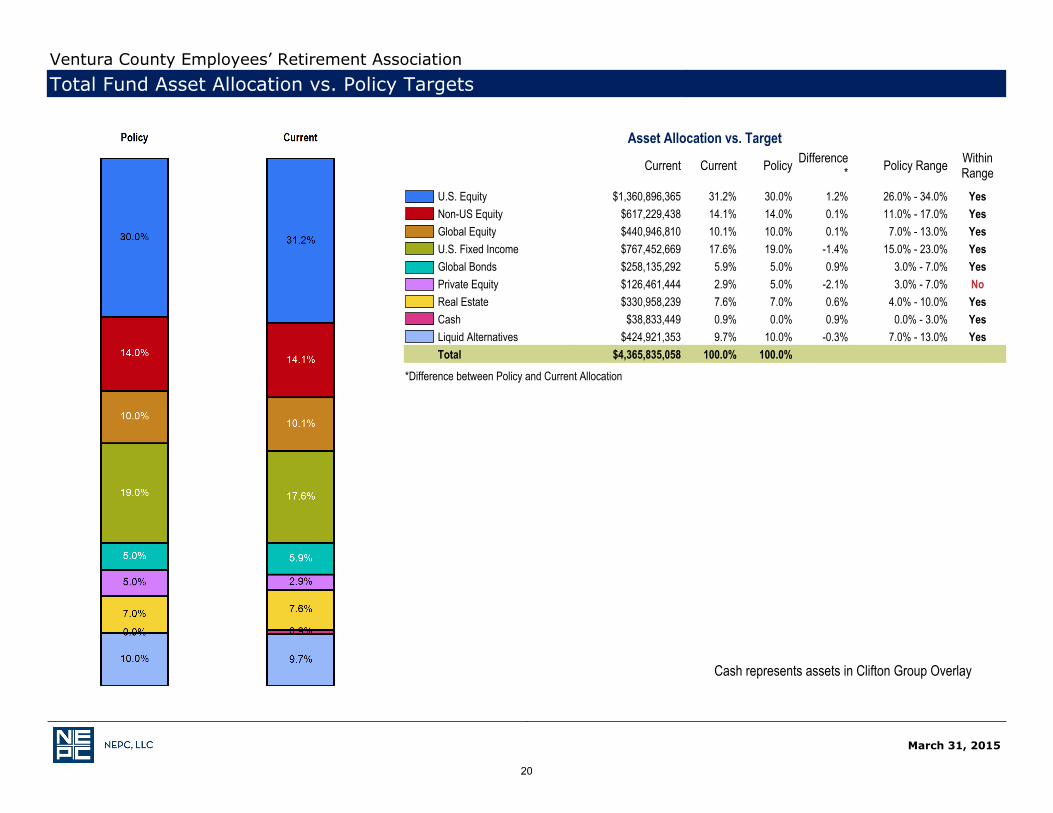
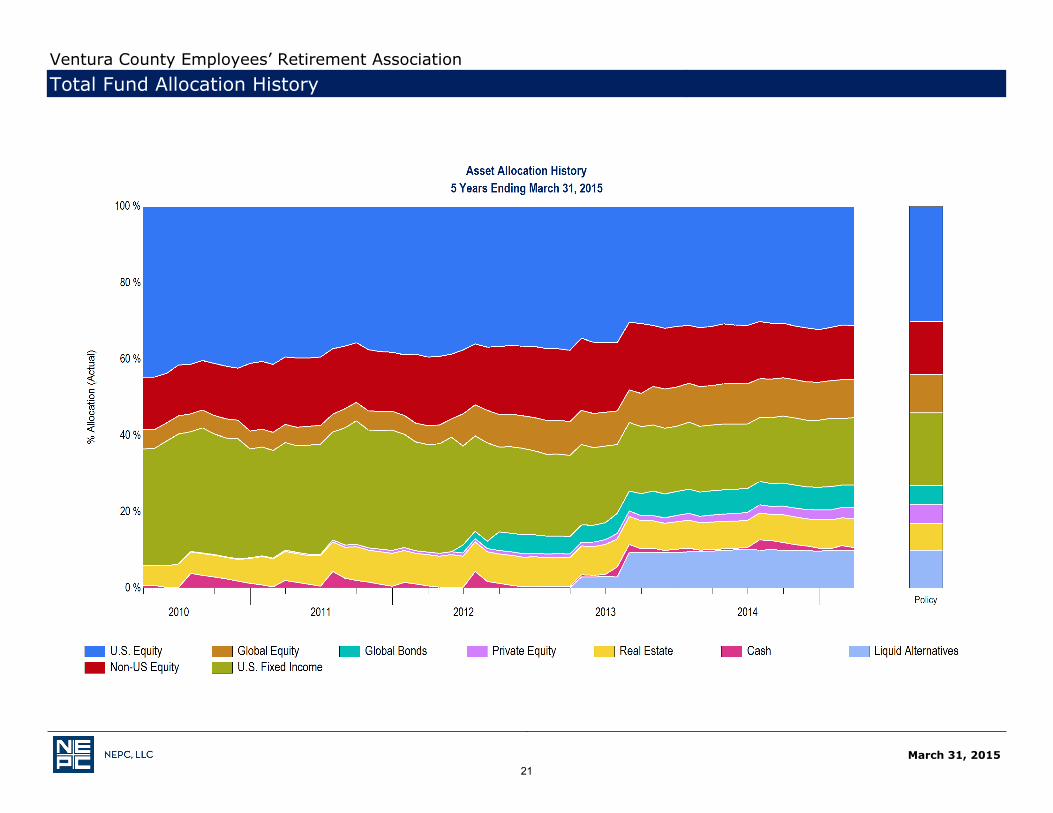
U.S. Equity $1,360,896,365 31.2% 30.0% 1.2% 26.0% - 34.0% YesNon-US Equity $617,229,438 14.1% 14.0% 0.1% 11.0% - 17.0% YesGlobal Equity $440,946,810 10.1% 10.0% 0.1% 7.0% - 13.0% YesU.S. Fixed Income $767,452,669 17.6% 19.0% -1.4% 15.0% - 23.0% YesGlobal Bonds $258,135,292 5.9% 5.0% 0.9% 3.0% - 7.0% YesPrivate Equity $126,461,444 2.9% 5.0% -2.1% 3.0% - 7.0% NoReal Estate $330,958,239 7.6% 7.0% 0.6% 4.0% - 10.0% YesCash $38,833,449 0.9% 0.0% 0.9% 0.0% - 3.0% YesLiquid Alternatives $424,921,353 9.7% 10.0% -0.3% 7.0% - 13.0% YesTotal $4,365,835,058 100.0% 100.0%
XXXXX
*Difference between Policy and Current Allocation
Cash represents assets in Clifton Group Overlay
Ventura County Employees’ Retirement AssociationTotal Fund Asset Allocation vs. Policy Targets
20
March 31, 2015
Ventura County Employees’ Retirement AssociationTotal Fund Allocation History
21
March 31, 2015
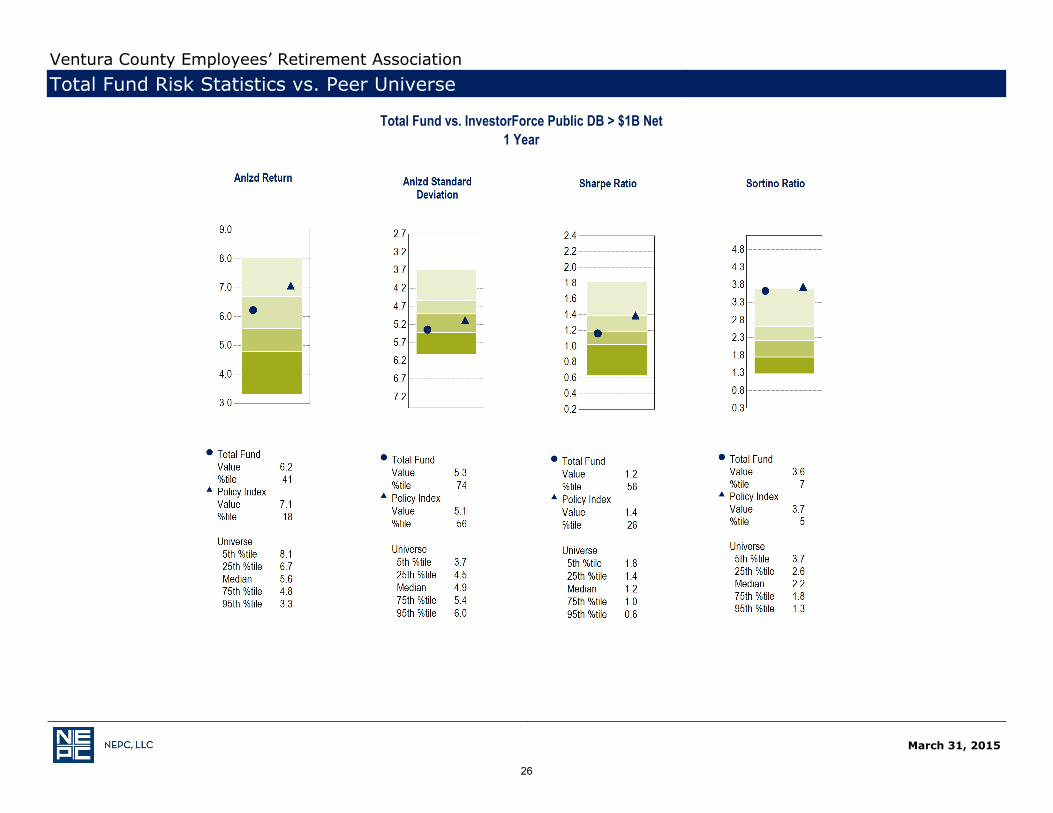
1 Years Ending March 31, 2015 Sharpe Ratio Rank Sortino Ratio Rank
_
Total Fund 1.2 56 3.6 7Policy Index 1.4 26 3.7 5InvestorForce Public DB > $1B Net Median 1.2 -- 2.2 --
XXXXX
Ventura County Employees’ Retirement AssociationTotal Fund Risk/Return
1 Years Ending March 31, 2015 Anlzd Ret Rank Anlzd Std Dev Rank
_
Total Fund 6.2% 41 5.3% 74Policy Index 7.1% 18 5.1% 56InvestorForce Public DB > $1B Net Median 5.6% -- 4.9% --
XXXXX
22
March 31, 2015
Ventura County Employees’ Retirement AssociationTotal Fund Risk/Return
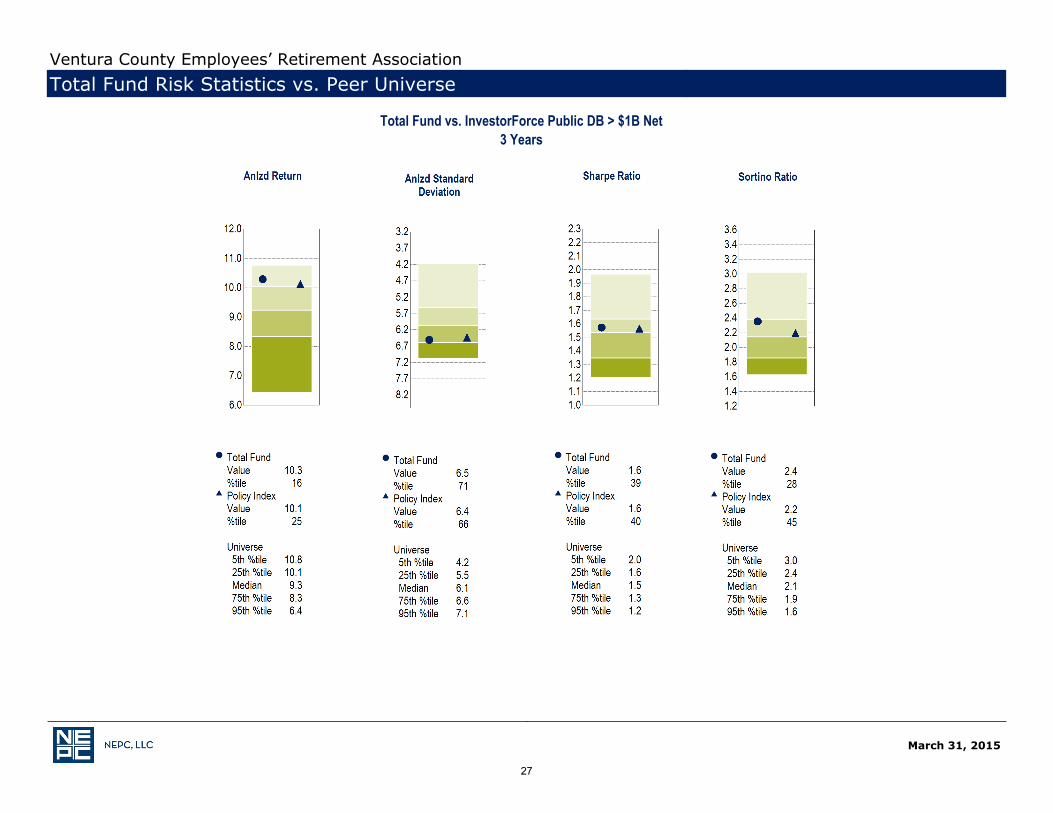
3 Years Ending March 31, 2015 Sharpe Ratio Rank Sortino Ratio Rank
_
Total Fund 1.6 39 2.4 28Policy Index 1.6 40 2.2 45InvestorForce Public DB > $1B Net Median 1.5 -- 2.1 --
XXXXX
3 Years Ending March 31, 2015 Anlzd Ret Rank Anlzd Std Dev Rank
_
Total Fund 10.3% 16 6.5% 71Policy Index 10.1% 25 6.4% 66InvestorForce Public DB > $1B Net Median 9.3% -- 6.1% --
XXXXX
23
March 31, 2015
Ventura County Employees’ Retirement AssociationTotal Fund Risk/Return
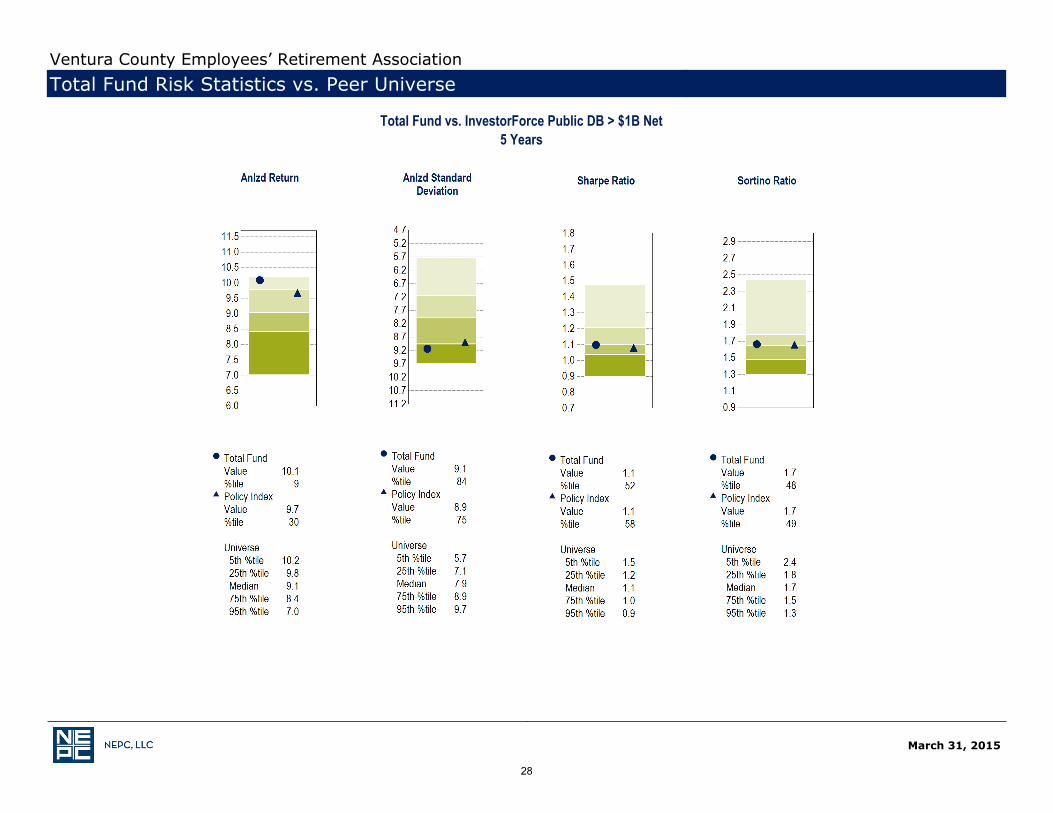
5 Years Ending March 31, 2015 Sharpe Ratio Rank Sortino Ratio Rank
_
Total Fund 1.1 52 1.7 48Policy Index 1.1 58 1.7 49InvestorForce Public DB > $1B Net Median 1.1 -- 1.7 --
XXXXX
5 Years Ending March 31, 2015 Anlzd Ret Rank Anlzd Std Dev Rank
_
Total Fund 10.1% 9 9.1% 84Policy Index 9.7% 30 8.9% 75InvestorForce Public DB > $1B Net Median 9.1% -- 7.9% --
XXXXX
24
March 31, 2015
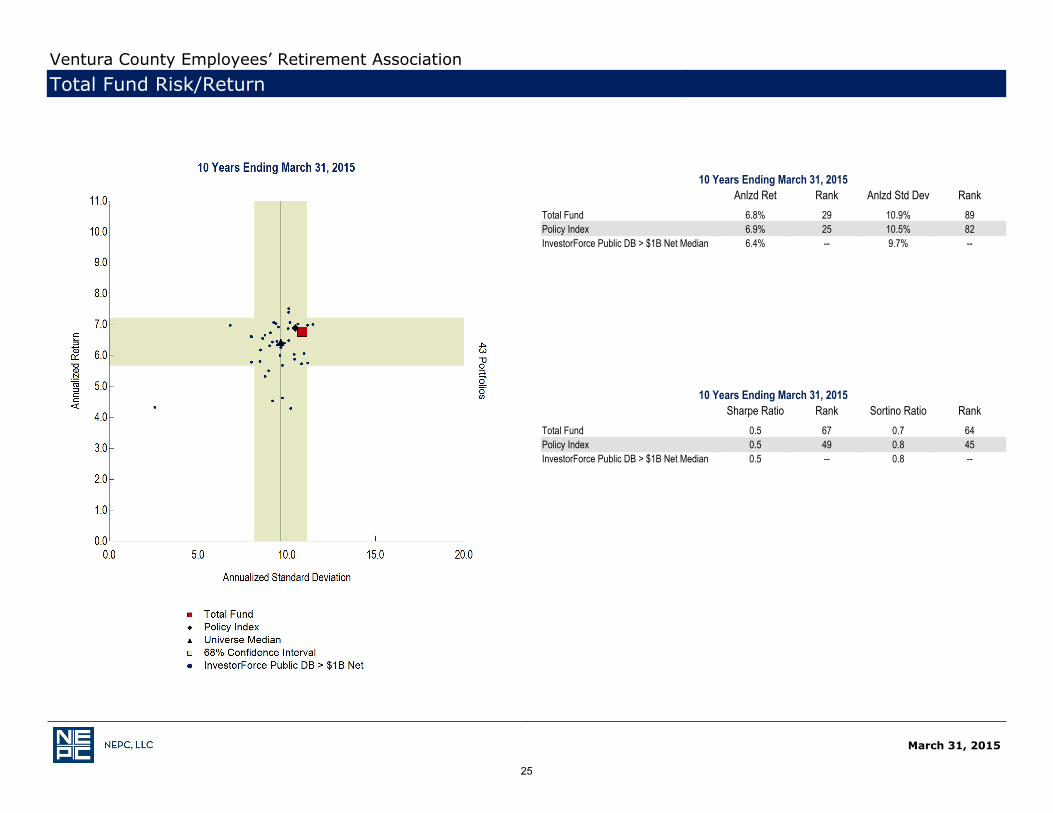
Ventura County Employees’ Retirement AssociationTotal Fund Risk/Return
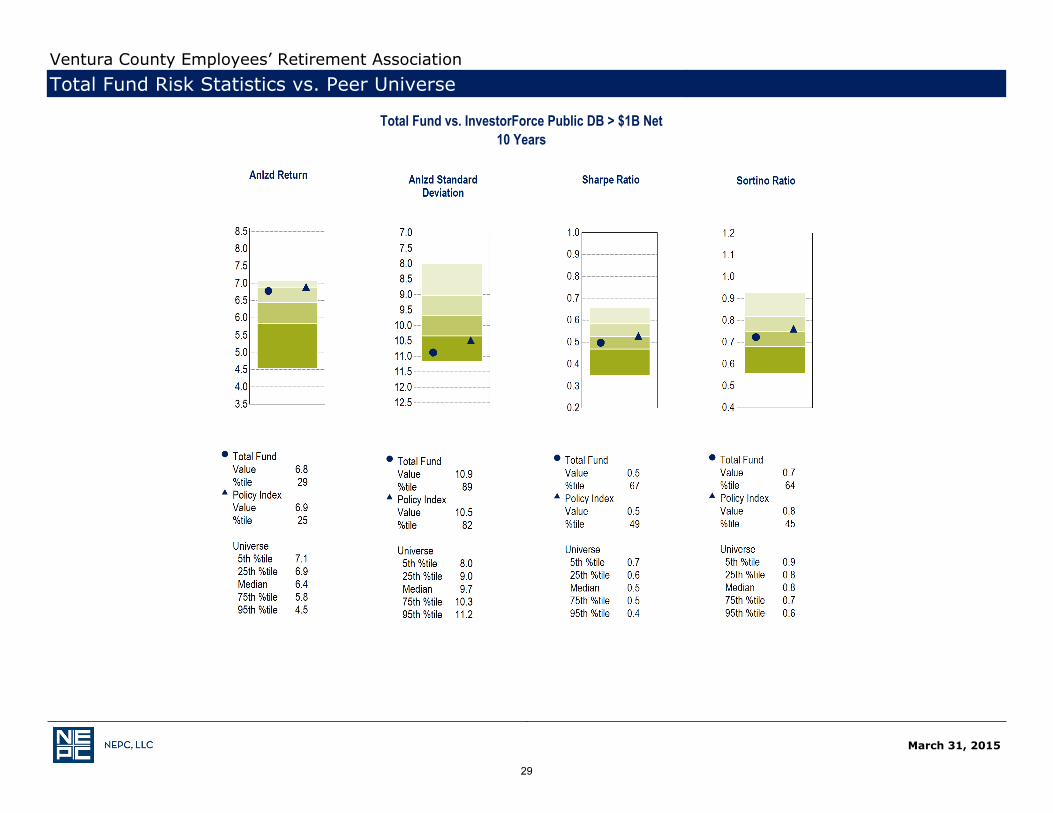
10 Years Ending March 31, 2015 Anlzd Ret Rank Anlzd Std Dev Rank
_
Total Fund 6.8% 29 10.9% 89Policy Index 6.9% 25 10.5% 82InvestorForce Public DB > $1B Net Median 6.4% -- 9.7% --
XXXXX
10 Years Ending March 31, 2015 Sharpe Ratio Rank Sortino Ratio Rank
_
Total Fund 0.5 67 0.7 64Policy Index 0.5 49 0.8 45InvestorForce Public DB > $1B Net Median 0.5 -- 0.8 --
XXXXX
25
March 31, 2015
Ventura County Employees’ Retirement AssociationTotal Fund Risk Statistics vs. Peer Universe
Total Fund vs. InvestorForce Public DB > $1B Net1 Year
26
March 31, 2015
Ventura County Employees’ Retirement AssociationTotal Fund Risk Statistics vs. Peer Universe
Total Fund vs. InvestorForce Public DB > $1B Net3 Years
27
March 31, 2015
Ventura County Employees’ Retirement AssociationTotal Fund Risk Statistics vs. Peer Universe
Total Fund vs. InvestorForce Public DB > $1B Net5 Years
28
March 31, 2015
Ventura County Employees’ Retirement AssociationTotal Fund Risk Statistics vs. Peer Universe
Total Fund vs. InvestorForce Public DB > $1B Net10 Years
29
March 31, 2015
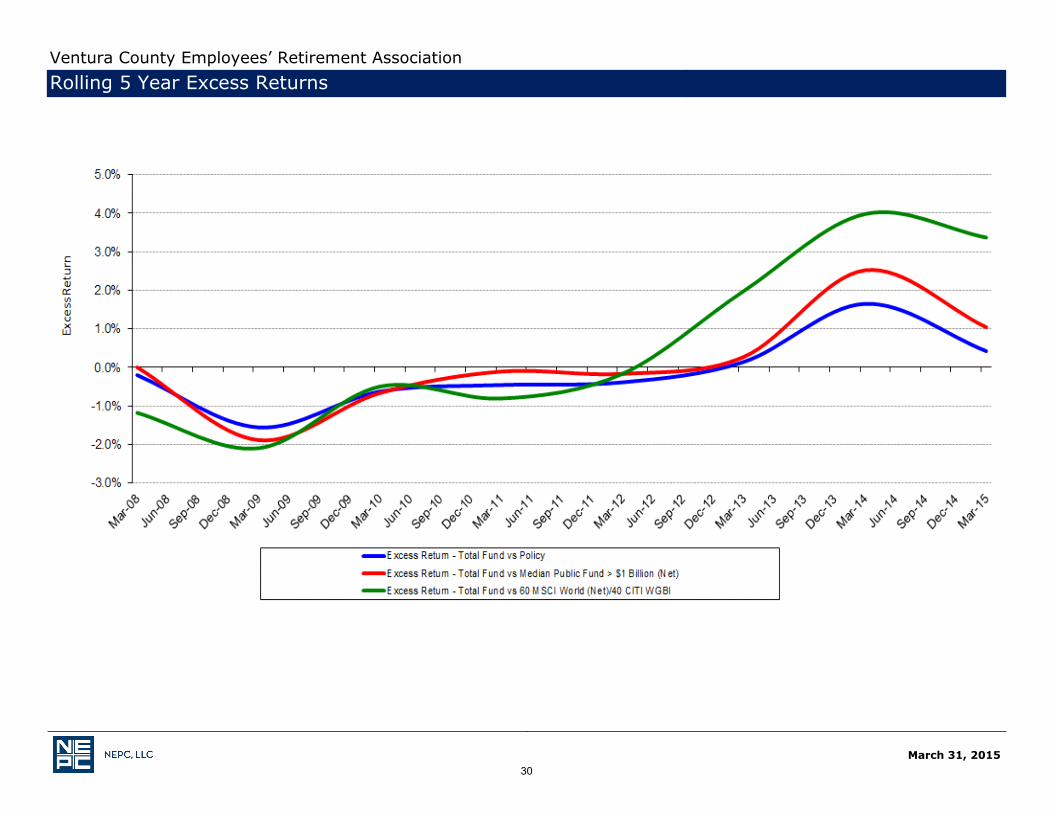
Ventura County Employees’ Retirement Association Rolling 5 Year Excess Returns
30
March 31, 2015
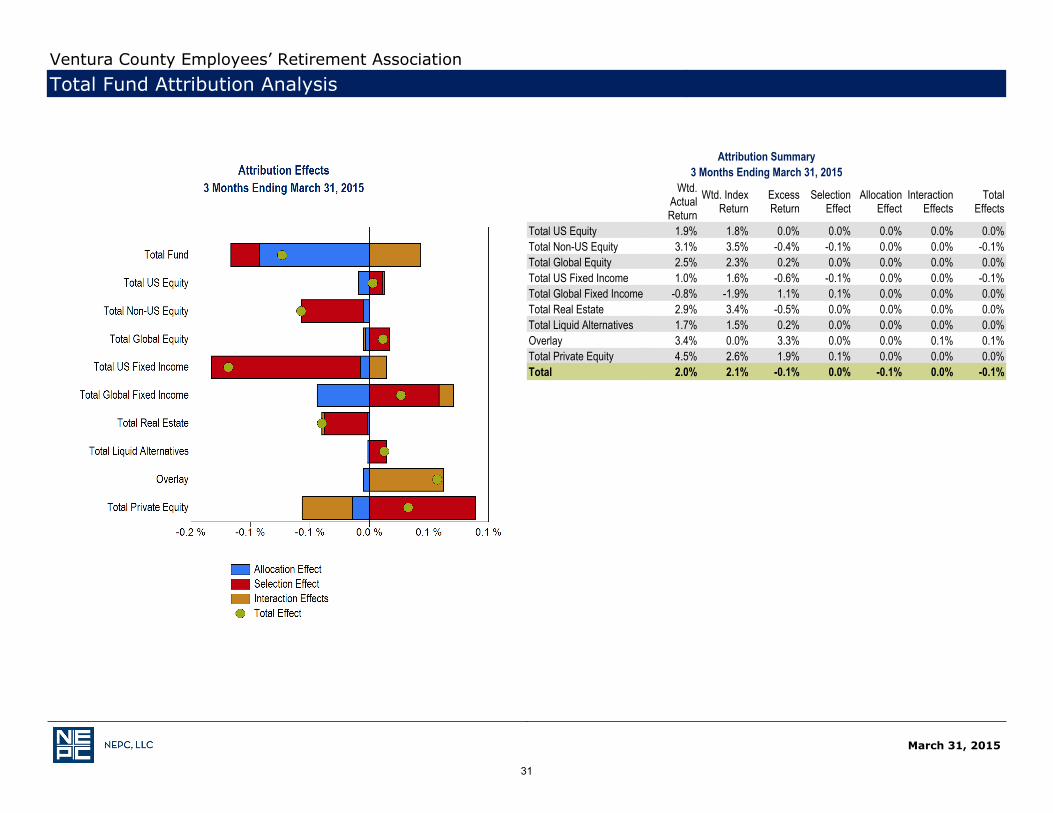
Ventura County Employees’ Retirement AssociationTotal Fund Attribution Analysis
Attribution Summary3 Months Ending March 31, 2015
Wtd.ActualReturn
Wtd. IndexReturn
ExcessReturn
SelectionEffect
AllocationEffect
InteractionEffects
TotalEffects
Total US Equity 1.9% 1.8% 0.0% 0.0% 0.0% 0.0% 0.0%Total Non-US Equity 3.1% 3.5% -0.4% -0.1% 0.0% 0.0% -0.1%Total Global Equity 2.5% 2.3% 0.2% 0.0% 0.0% 0.0% 0.0%Total US Fixed Income 1.0% 1.6% -0.6% -0.1% 0.0% 0.0% -0.1%Total Global Fixed Income -0.8% -1.9% 1.1% 0.1% 0.0% 0.0% 0.0%Total Real Estate 2.9% 3.4% -0.5% 0.0% 0.0% 0.0% 0.0%Total Liquid Alternatives 1.7% 1.5% 0.2% 0.0% 0.0% 0.0% 0.0%Overlay 3.4% 0.0% 3.3% 0.0% 0.0% 0.1% 0.1%Total Private Equity 4.5% 2.6% 1.9% 0.1% 0.0% 0.0% 0.0%Total 2.0% 2.1% -0.1% 0.0% -0.1% 0.0% -0.1%
31
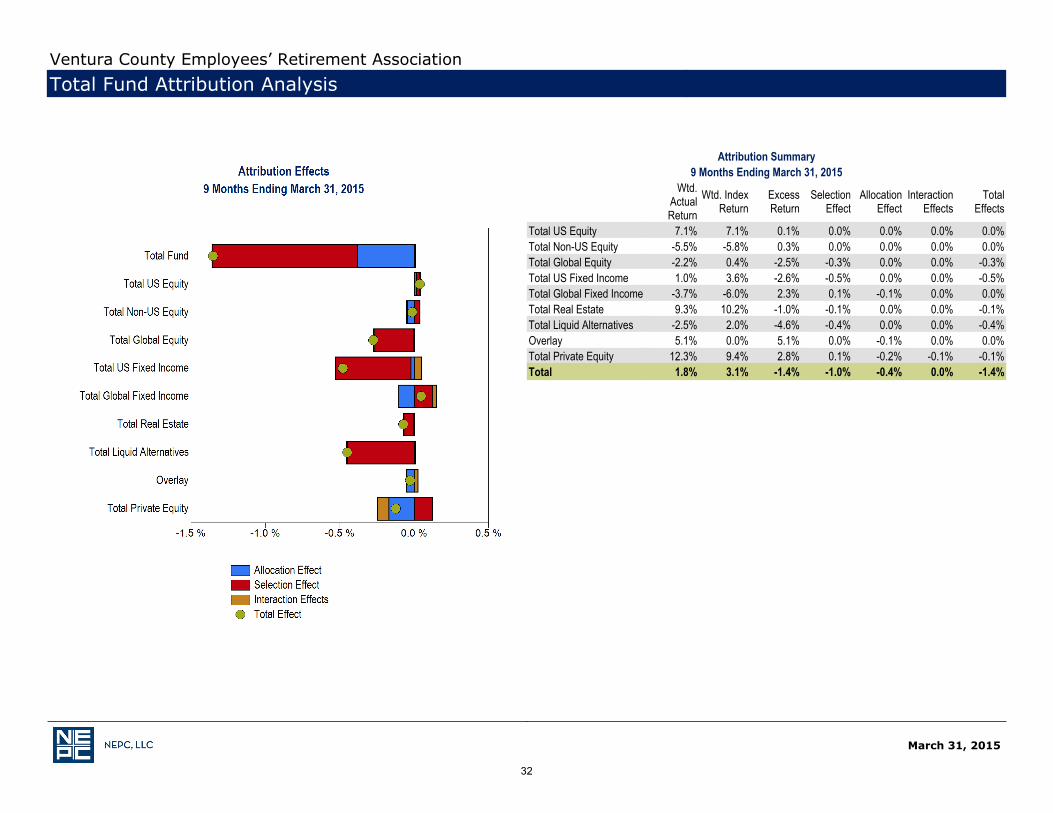
Attribution Summary9 Months Ending March 31, 2015
Wtd.ActualReturn
Wtd. IndexReturn
ExcessReturn
SelectionEffect
AllocationEffect
InteractionEffects
TotalEffects
Total US Equity 7.1% 7.1% 0.1% 0.0% 0.0% 0.0% 0.0%Total Non-US Equity -5.5% -5.8% 0.3% 0.0% 0.0% 0.0% 0.0%Total Global Equity -2.2% 0.4% -2.5% -0.3% 0.0% 0.0% -0.3%Total US Fixed Income 1.0% 3.6% -2.6% -0.5% 0.0% 0.0% -0.5%Total Global Fixed Income -3.7% -6.0% 2.3% 0.1% -0.1% 0.0% 0.0%Total Real Estate 9.3% 10.2% -1.0% -0.1% 0.0% 0.0% -0.1%Total Liquid Alternatives -2.5% 2.0% -4.6% -0.4% 0.0% 0.0% -0.4%Overlay 5.1% 0.0% 5.1% 0.0% -0.1% 0.0% 0.0%Total Private Equity 12.3% 9.4% 2.8% 0.1% -0.2% -0.1% -0.1%Total 1.8% 3.1% -1.4% -1.0% -0.4% 0.0% -1.4%
March 31, 2015
Ventura County Employees’ Retirement AssociationTotal Fund Attribution Analysis
32
March 31, 2015
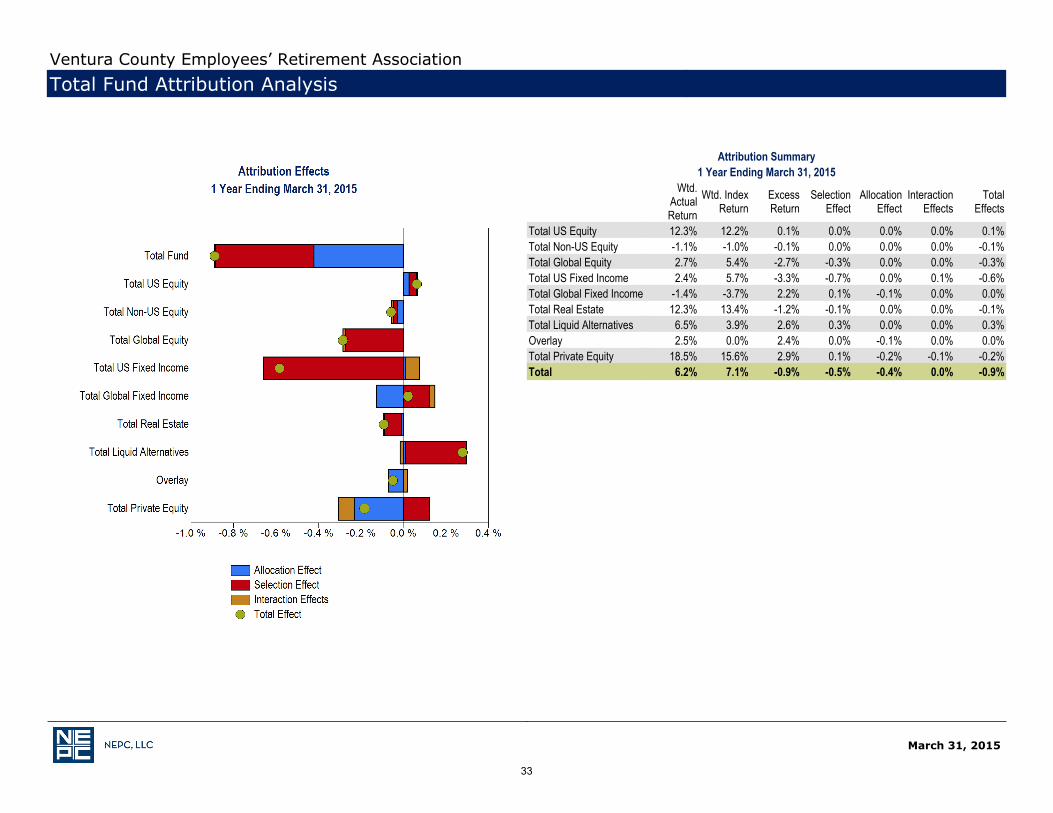
Ventura County Employees’ Retirement AssociationTotal Fund Attribution Analysis
Attribution Summary1 Year Ending March 31, 2015
Wtd.ActualReturn
Wtd. IndexReturn
ExcessReturn
SelectionEffect
AllocationEffect
InteractionEffects
TotalEffects
Total US Equity 12.3% 12.2% 0.1% 0.0% 0.0% 0.0% 0.1%Total Non-US Equity -1.1% -1.0% -0.1% 0.0% 0.0% 0.0% -0.1%Total Global Equity 2.7% 5.4% -2.7% -0.3% 0.0% 0.0% -0.3%Total US Fixed Income 2.4% 5.7% -3.3% -0.7% 0.0% 0.1% -0.6%Total Global Fixed Income -1.4% -3.7% 2.2% 0.1% -0.1% 0.0% 0.0%Total Real Estate 12.3% 13.4% -1.2% -0.1% 0.0% 0.0% -0.1%Total Liquid Alternatives 6.5% 3.9% 2.6% 0.3% 0.0% 0.0% 0.3%Overlay 2.5% 0.0% 2.4% 0.0% -0.1% 0.0% 0.0%Total Private Equity 18.5% 15.6% 2.9% 0.1% -0.2% -0.1% -0.2%Total 6.2% 7.1% -0.9% -0.5% -0.4% 0.0% -0.9%
33
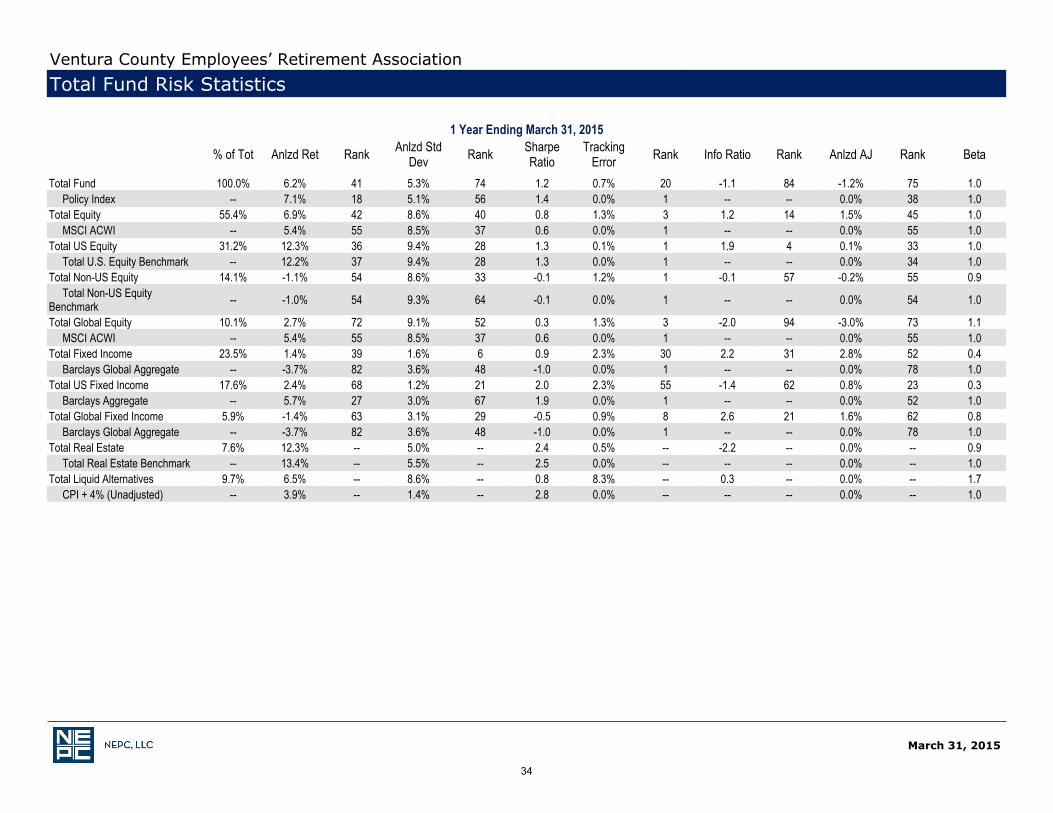
1 Year Ending March 31, 2015
% of Tot Anlzd Ret Rank Anlzd StdDev Rank Sharpe
RatioTracking
Error Rank Info Ratio Rank Anlzd AJ Rank Beta_
Total Fund 100.0% 6.2% 41 5.3% 74 1.2 0.7% 20 -1.1 84 -1.2% 75 1.0 Policy Index -- 7.1% 18 5.1% 56 1.4 0.0% 1 -- -- 0.0% 38 1.0Total Equity 55.4% 6.9% 42 8.6% 40 0.8 1.3% 3 1.2 14 1.5% 45 1.0 MSCI ACWI -- 5.4% 55 8.5% 37 0.6 0.0% 1 -- -- 0.0% 55 1.0Total US Equity 31.2% 12.3% 36 9.4% 28 1.3 0.1% 1 1.9 4 0.1% 33 1.0 Total U.S. Equity Benchmark -- 12.2% 37 9.4% 28 1.3 0.0% 1 -- -- 0.0% 34 1.0Total Non-US Equity 14.1% -1.1% 54 8.6% 33 -0.1 1.2% 1 -0.1 57 -0.2% 55 0.9 Total Non-US EquityBenchmark -- -1.0% 54 9.3% 64 -0.1 0.0% 1 -- -- 0.0% 54 1.0
Total Global Equity 10.1% 2.7% 72 9.1% 52 0.3 1.3% 3 -2.0 94 -3.0% 73 1.1 MSCI ACWI -- 5.4% 55 8.5% 37 0.6 0.0% 1 -- -- 0.0% 55 1.0Total Fixed Income 23.5% 1.4% 39 1.6% 6 0.9 2.3% 30 2.2 31 2.8% 52 0.4 Barclays Global Aggregate -- -3.7% 82 3.6% 48 -1.0 0.0% 1 -- -- 0.0% 78 1.0Total US Fixed Income 17.6% 2.4% 68 1.2% 21 2.0 2.3% 55 -1.4 62 0.8% 23 0.3 Barclays Aggregate -- 5.7% 27 3.0% 67 1.9 0.0% 1 -- -- 0.0% 52 1.0Total Global Fixed Income 5.9% -1.4% 63 3.1% 29 -0.5 0.9% 8 2.6 21 1.6% 62 0.8 Barclays Global Aggregate -- -3.7% 82 3.6% 48 -1.0 0.0% 1 -- -- 0.0% 78 1.0Total Real Estate 7.6% 12.3% -- 5.0% -- 2.4 0.5% -- -2.2 -- 0.0% -- 0.9 Total Real Estate Benchmark -- 13.4% -- 5.5% -- 2.5 0.0% -- -- -- 0.0% -- 1.0Total Liquid Alternatives 9.7% 6.5% -- 8.6% -- 0.8 8.3% -- 0.3 -- 0.0% -- 1.7 CPI + 4% (Unadjusted) -- 3.9% -- 1.4% -- 2.8 0.0% -- -- -- 0.0% -- 1.0
XXXXX
March 31, 2015
Ventura County Employees’ Retirement AssociationTotal Fund Risk Statistics
34

3 Year Ending March 31, 2015
% of Tot Anlzd Ret Rank Anlzd StdDev Rank Sharpe
RatioTracking
Error Rank Info Ratio Rank Anlzd AJ Rank Beta_
Total Fund 100.0% 10.3% 16 6.5% 71 1.6 0.7% 7 0.3 42 0.1% 40 1.0 Policy Index -- 10.1% 25 6.4% 66 1.6 0.0% 1 -- -- 0.0% 49 1.0Total Equity 55.4% -- -- -- -- -- -- -- -- -- -- -- -- MSCI ACWI -- 10.7% 67 10.6% 37 1.0 0.0% 1 -- -- 0.0% 73 1.0Total US Equity 31.2% 16.7% 38 9.8% 17 1.7 0.3% 1 1.0 5 0.3% 31 1.0 Total U.S. Equity Benchmark -- 16.4% 42 9.8% 16 1.7 0.0% 1 -- -- 0.0% 35 1.0Total Non-US Equity 14.1% 6.9% 87 11.6% 20 0.6 1.3% 1 0.4 76 0.9% 84 0.9 Total Non-US EquityBenchmark -- 6.4% 91 12.5% 53 0.5 0.0% 1 -- -- 0.0% 91 1.0
Total Global Equity 10.1% 9.7% 78 10.3% 28 0.9 1.2% 2 -0.8 92 -0.7% 77 1.0 MSCI ACWI -- 10.7% 67 10.6% 37 1.0 0.0% 1 -- -- 0.0% 73 1.0Total Fixed Income 23.5% 3.1% 53 2.4% 7 1.2 2.3% 23 1.4 38 3.1% 53 0.5 Barclays Global Aggregate -- -0.2% 85 3.9% 32 -0.1 0.0% 1 -- -- 0.0% 85 1.0Total US Fixed Income 17.6% 3.4% 52 2.3% 39 1.5 1.9% 43 0.2 55 1.5% 33 0.6 Barclays Aggregate -- 3.1% 57 2.9% 54 1.1 0.0% 1 -- -- 0.0% 81 1.0Total Global Fixed Income 5.9% -- -- -- -- -- -- -- -- -- -- -- -- Barclays Global Aggregate -- -0.2% 85 3.9% 32 -0.1 0.0% 1 -- -- 0.0% 85 1.0Total Real Estate 7.6% 10.5% -- 4.3% -- 2.4 1.0% -- -2.2 -- -0.1% -- 0.8 Total Real Estate Benchmark -- 12.7% -- 5.1% -- 2.5 0.0% -- -- -- 0.0% -- 1.0Total Liquid Alternatives 9.7% -- -- -- -- -- -- -- -- -- -- -- -- CPI + 4% (Unadjusted) -- 5.0% -- 1.2% -- 4.1 0.0% -- -- -- 0.0% -- 1.0
XXXXX
March 31, 2015
Ventura County Employees’ Retirement AssociationTotal Fund Risk Statistics
35
March 31, 2015
Ventura County Employees’ Retirement AssociationTotal Fund Risk Statistics
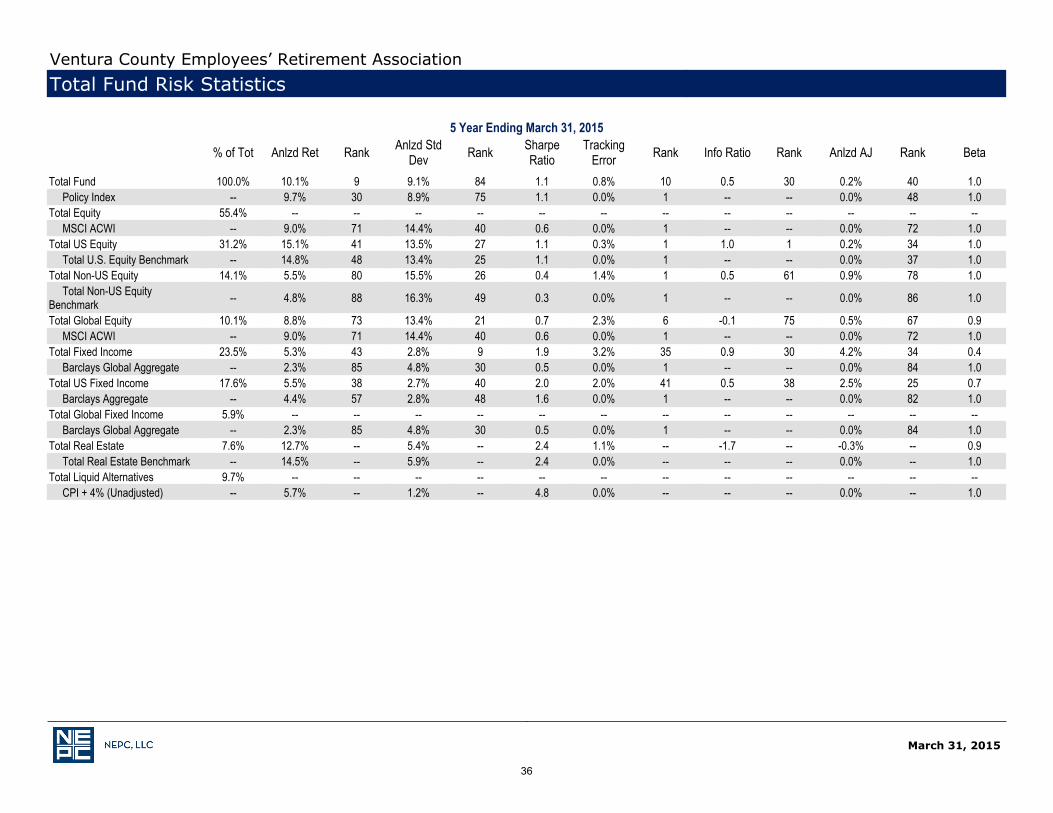
5 Year Ending March 31, 2015
% of Tot Anlzd Ret Rank Anlzd StdDev Rank Sharpe
RatioTracking
Error Rank Info Ratio Rank Anlzd AJ Rank Beta_
Total Fund 100.0% 10.1% 9 9.1% 84 1.1 0.8% 10 0.5 30 0.2% 40 1.0 Policy Index -- 9.7% 30 8.9% 75 1.1 0.0% 1 -- -- 0.0% 48 1.0Total Equity 55.4% -- -- -- -- -- -- -- -- -- -- -- -- MSCI ACWI -- 9.0% 71 14.4% 40 0.6 0.0% 1 -- -- 0.0% 72 1.0Total US Equity 31.2% 15.1% 41 13.5% 27 1.1 0.3% 1 1.0 1 0.2% 34 1.0 Total U.S. Equity Benchmark -- 14.8% 48 13.4% 25 1.1 0.0% 1 -- -- 0.0% 37 1.0Total Non-US Equity 14.1% 5.5% 80 15.5% 26 0.4 1.4% 1 0.5 61 0.9% 78 1.0 Total Non-US EquityBenchmark -- 4.8% 88 16.3% 49 0.3 0.0% 1 -- -- 0.0% 86 1.0
Total Global Equity 10.1% 8.8% 73 13.4% 21 0.7 2.3% 6 -0.1 75 0.5% 67 0.9 MSCI ACWI -- 9.0% 71 14.4% 40 0.6 0.0% 1 -- -- 0.0% 72 1.0Total Fixed Income 23.5% 5.3% 43 2.8% 9 1.9 3.2% 35 0.9 30 4.2% 34 0.4 Barclays Global Aggregate -- 2.3% 85 4.8% 30 0.5 0.0% 1 -- -- 0.0% 84 1.0Total US Fixed Income 17.6% 5.5% 38 2.7% 40 2.0 2.0% 41 0.5 38 2.5% 25 0.7 Barclays Aggregate -- 4.4% 57 2.8% 48 1.6 0.0% 1 -- -- 0.0% 82 1.0Total Global Fixed Income 5.9% -- -- -- -- -- -- -- -- -- -- -- -- Barclays Global Aggregate -- 2.3% 85 4.8% 30 0.5 0.0% 1 -- -- 0.0% 84 1.0Total Real Estate 7.6% 12.7% -- 5.4% -- 2.4 1.1% -- -1.7 -- -0.3% -- 0.9 Total Real Estate Benchmark -- 14.5% -- 5.9% -- 2.4 0.0% -- -- -- 0.0% -- 1.0Total Liquid Alternatives 9.7% -- -- -- -- -- -- -- -- -- -- -- -- CPI + 4% (Unadjusted) -- 5.7% -- 1.2% -- 4.8 0.0% -- -- -- 0.0% -- 1.0
XXXXX
36
March 31, 2015
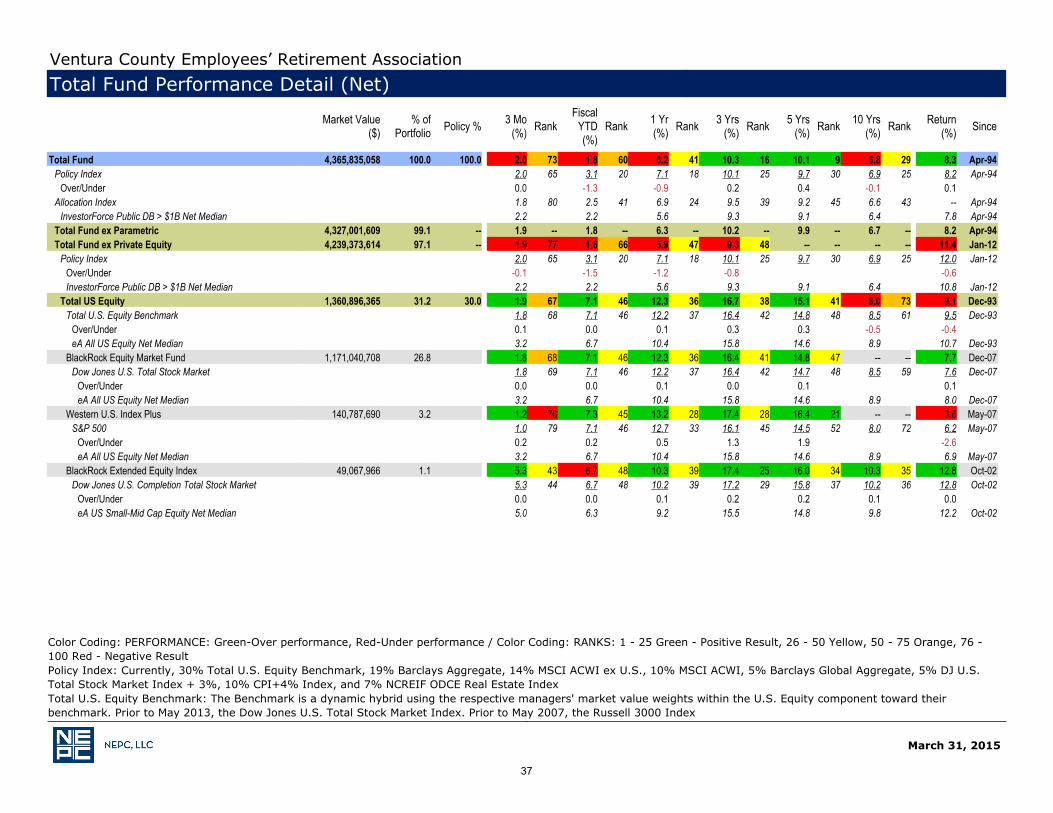
Color Coding: PERFORMANCE: Green-Over performance, Red-Under performance / Color Coding: RANKS: 1 - 25 Green - Positive Result, 26 - 50 Yellow, 50 - 75 Orange, 76 -100 Red - Negative ResultPolicy Index: Currently, 30% Total U.S. Equity Benchmark, 19% Barclays Aggregate, 14% MSCI ACWI ex U.S., 10% MSCI ACWI, 5% Barclays Global Aggregate, 5% DJ U.S.Total Stock Market Index + 3%, 10% CPI+4% Index, and 7% NCREIF ODCE Real Estate IndexTotal U.S. Equity Benchmark: The Benchmark is a dynamic hybrid using the respective managers' market value weights within the U.S. Equity component toward theirbenchmark. Prior to May 2013, the Dow Jones U.S. Total Stock Market Index. Prior to May 2007, the Russell 3000 Index
Ventura County Employees’ Retirement AssociationTotal Fund Performance Detail (Net)
Market Value($)
% ofPortfolio Policy % 3 Mo
(%) RankFiscal
YTD(%)
Rank 1 Yr(%) Rank 3 Yrs
(%) Rank 5 Yrs(%) Rank 10 Yrs
(%) Rank Return(%) Since
_
Total Fund 4,365,835,058 100.0 100.0 2.0 73 1.8 60 6.2 41 10.3 16 10.1 9 6.8 29 8.3 Apr-94Policy Index 2.0 65 3.1 20 7.1 18 10.1 25 9.7 30 6.9 25 8.2 Apr-94
Over/Under 0.0 -1.3 -0.9 0.2 0.4 -0.1 0.1 Allocation Index 1.8 80 2.5 41 6.9 24 9.5 39 9.2 45 6.6 43 -- Apr-94
InvestorForce Public DB > $1B Net Median 2.2 2.2 5.6 9.3 9.1 6.4 7.8 Apr-94Total Fund ex Parametric 4,327,001,609 99.1 -- 1.9 -- 1.8 -- 6.3 -- 10.2 -- 9.9 -- 6.7 -- 8.2 Apr-94Total Fund ex Private Equity 4,239,373,614 97.1 -- 1.9 77 1.6 66 5.9 47 9.3 48 -- -- -- -- 11.4 Jan-12
Policy Index 2.0 65 3.1 20 7.1 18 10.1 25 9.7 30 6.9 25 12.0 Jan-12Over/Under -0.1 -1.5 -1.2 -0.8 -0.6 InvestorForce Public DB > $1B Net Median 2.2 2.2 5.6 9.3 9.1 6.4 10.8 Jan-12
Total US Equity 1,360,896,365 31.2 30.0 1.9 67 7.1 46 12.3 36 16.7 38 15.1 41 8.0 73 9.1 Dec-93Total U.S. Equity Benchmark 1.8 68 7.1 46 12.2 37 16.4 42 14.8 48 8.5 61 9.5 Dec-93
Over/Under 0.1 0.0 0.1 0.3 0.3 -0.5 -0.4 eA All US Equity Net Median 3.2 6.7 10.4 15.8 14.6 8.9 10.7 Dec-93
BlackRock Equity Market Fund 1,171,040,708 26.8 1.8 68 7.1 46 12.3 36 16.4 41 14.8 47 -- -- 7.7 Dec-07Dow Jones U.S. Total Stock Market 1.8 69 7.1 46 12.2 37 16.4 42 14.7 48 8.5 59 7.6 Dec-07
Over/Under 0.0 0.0 0.1 0.0 0.1 0.1 eA All US Equity Net Median 3.2 6.7 10.4 15.8 14.6 8.9 8.0 Dec-07
Western U.S. Index Plus 140,787,690 3.2 1.2 76 7.3 45 13.2 28 17.4 28 16.4 21 -- -- 3.6 May-07S&P 500 1.0 79 7.1 46 12.7 33 16.1 45 14.5 52 8.0 72 6.2 May-07
Over/Under 0.2 0.2 0.5 1.3 1.9 -2.6 eA All US Equity Net Median 3.2 6.7 10.4 15.8 14.6 8.9 6.9 May-07
BlackRock Extended Equity Index 49,067,966 1.1 5.3 43 6.7 48 10.3 39 17.4 25 16.0 34 10.3 35 12.8 Oct-02Dow Jones U.S. Completion Total Stock Market 5.3 44 6.7 48 10.2 39 17.2 29 15.8 37 10.2 36 12.8 Oct-02
Over/Under 0.0 0.0 0.1 0.2 0.2 0.1 0.0 eA US Small-Mid Cap Equity Net Median 5.0 6.3 9.2 15.5 14.8 9.8 12.2 Oct-02
37
March 31, 2015
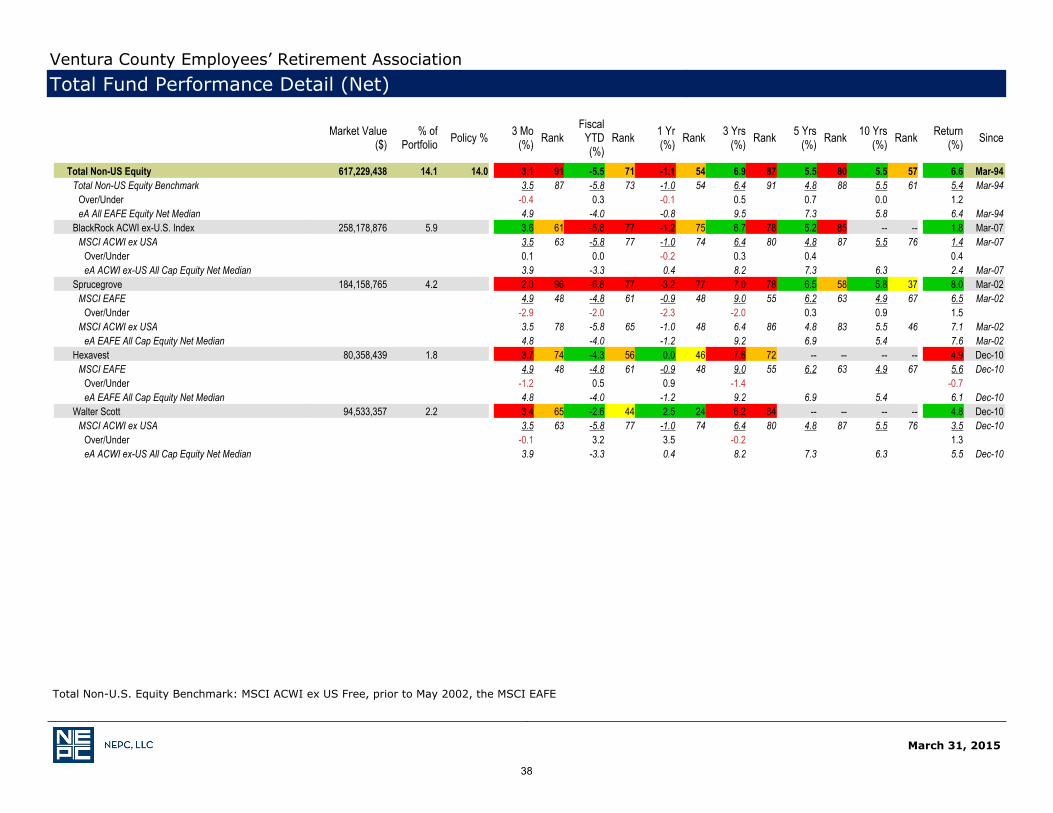
Total Non-U.S. Equity Benchmark: MSCI ACWI ex US Free, prior to May 2002, the MSCI EAFE
Ventura County Employees’ Retirement AssociationTotal Fund Performance Detail (Net)
Market Value($)
% ofPortfolio Policy % 3 Mo
(%) RankFiscal
YTD(%)
Rank 1 Yr(%) Rank 3 Yrs
(%) Rank 5 Yrs(%) Rank 10 Yrs
(%) Rank Return(%) Since
_
Total Non-US Equity 617,229,438 14.1 14.0 3.1 91 -5.5 71 -1.1 54 6.9 87 5.5 80 5.5 57 6.6 Mar-94Total Non-US Equity Benchmark 3.5 87 -5.8 73 -1.0 54 6.4 91 4.8 88 5.5 61 5.4 Mar-94
Over/Under -0.4 0.3 -0.1 0.5 0.7 0.0 1.2 eA All EAFE Equity Net Median 4.9 -4.0 -0.8 9.5 7.3 5.8 6.4 Mar-94
BlackRock ACWI ex-U.S. Index 258,178,876 5.9 3.6 61 -5.8 77 -1.2 75 6.7 78 5.2 85 -- -- 1.8 Mar-07MSCI ACWI ex USA 3.5 63 -5.8 77 -1.0 74 6.4 80 4.8 87 5.5 76 1.4 Mar-07
Over/Under 0.1 0.0 -0.2 0.3 0.4 0.4 eA ACWI ex-US All Cap Equity Net Median 3.9 -3.3 0.4 8.2 7.3 6.3 2.4 Mar-07
Sprucegrove 184,158,765 4.2 2.0 96 -6.8 77 -3.2 77 7.0 78 6.5 58 5.8 37 8.0 Mar-02MSCI EAFE 4.9 48 -4.8 61 -0.9 48 9.0 55 6.2 63 4.9 67 6.5 Mar-02
Over/Under -2.9 -2.0 -2.3 -2.0 0.3 0.9 1.5 MSCI ACWI ex USA 3.5 78 -5.8 65 -1.0 48 6.4 86 4.8 83 5.5 46 7.1 Mar-02
eA EAFE All Cap Equity Net Median 4.8 -4.0 -1.2 9.2 6.9 5.4 7.6 Mar-02Hexavest 80,358,439 1.8 3.7 74 -4.3 56 0.0 46 7.6 72 -- -- -- -- 4.9 Dec-10
MSCI EAFE 4.9 48 -4.8 61 -0.9 48 9.0 55 6.2 63 4.9 67 5.6 Dec-10Over/Under -1.2 0.5 0.9 -1.4 -0.7 eA EAFE All Cap Equity Net Median 4.8 -4.0 -1.2 9.2 6.9 5.4 6.1 Dec-10
Walter Scott 94,533,357 2.2 3.4 65 -2.6 44 2.5 24 6.2 84 -- -- -- -- 4.8 Dec-10MSCI ACWI ex USA 3.5 63 -5.8 77 -1.0 74 6.4 80 4.8 87 5.5 76 3.5 Dec-10
Over/Under -0.1 3.2 3.5 -0.2 1.3 eA ACWI ex-US All Cap Equity Net Median 3.9 -3.3 0.4 8.2 7.3 6.3 5.5 Dec-10
38
March 31, 2015
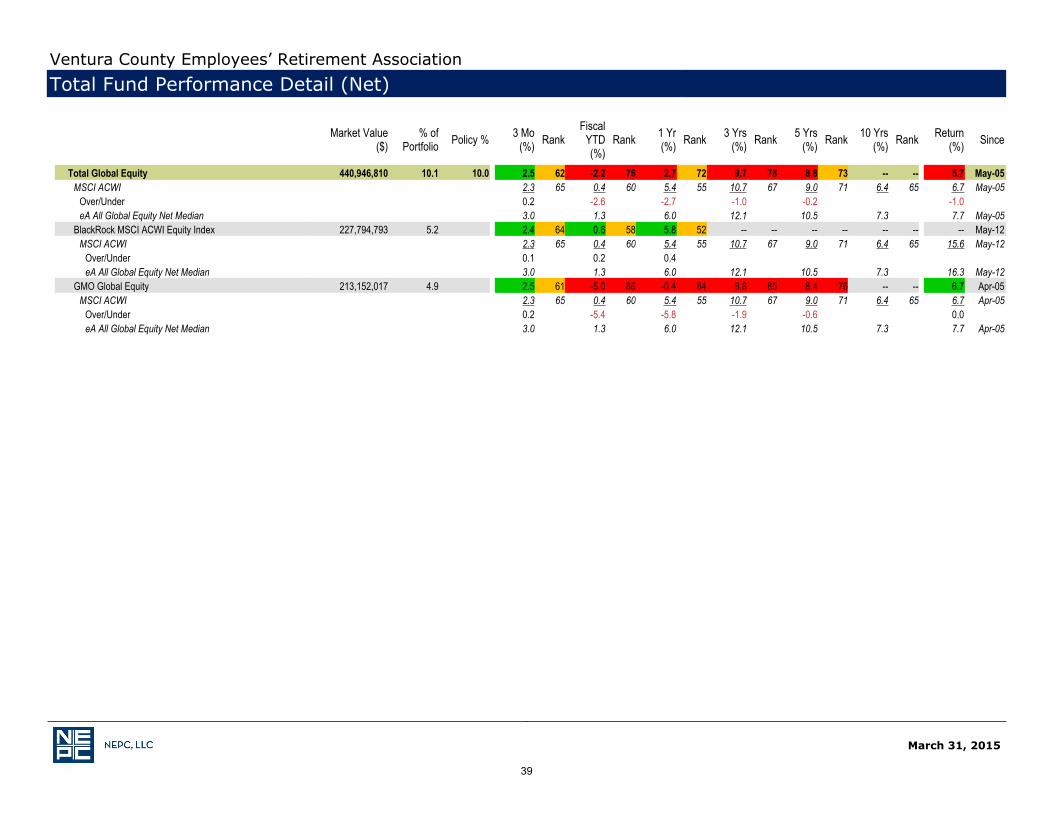
Ventura County Employees’ Retirement AssociationTotal Fund Performance Detail (Net)
Market Value($)
% ofPortfolio Policy % 3 Mo
(%) RankFiscal
YTD(%)
Rank 1 Yr(%) Rank 3 Yrs
(%) Rank 5 Yrs(%) Rank 10 Yrs
(%) Rank Return(%) Since
_
Total Global Equity 440,946,810 10.1 10.0 2.5 62 -2.2 76 2.7 72 9.7 78 8.8 73 -- -- 5.7 May-05MSCI ACWI 2.3 65 0.4 60 5.4 55 10.7 67 9.0 71 6.4 65 6.7 May-05
Over/Under 0.2 -2.6 -2.7 -1.0 -0.2 -1.0 eA All Global Equity Net Median 3.0 1.3 6.0 12.1 10.5 7.3 7.7 May-05
BlackRock MSCI ACWI Equity Index 227,794,793 5.2 2.4 64 0.6 58 5.8 52 -- -- -- -- -- -- -- May-12MSCI ACWI 2.3 65 0.4 60 5.4 55 10.7 67 9.0 71 6.4 65 15.6 May-12
Over/Under 0.1 0.2 0.4 eA All Global Equity Net Median 3.0 1.3 6.0 12.1 10.5 7.3 16.3 May-12
GMO Global Equity 213,152,017 4.9 2.5 61 -5.0 86 -0.4 84 8.8 85 8.4 76 -- -- 6.7 Apr-05MSCI ACWI 2.3 65 0.4 60 5.4 55 10.7 67 9.0 71 6.4 65 6.7 Apr-05
Over/Under 0.2 -5.4 -5.8 -1.9 -0.6 0.0 eA All Global Equity Net Median 3.0 1.3 6.0 12.1 10.5 7.3 7.7 Apr-05
39
March 31, 2015
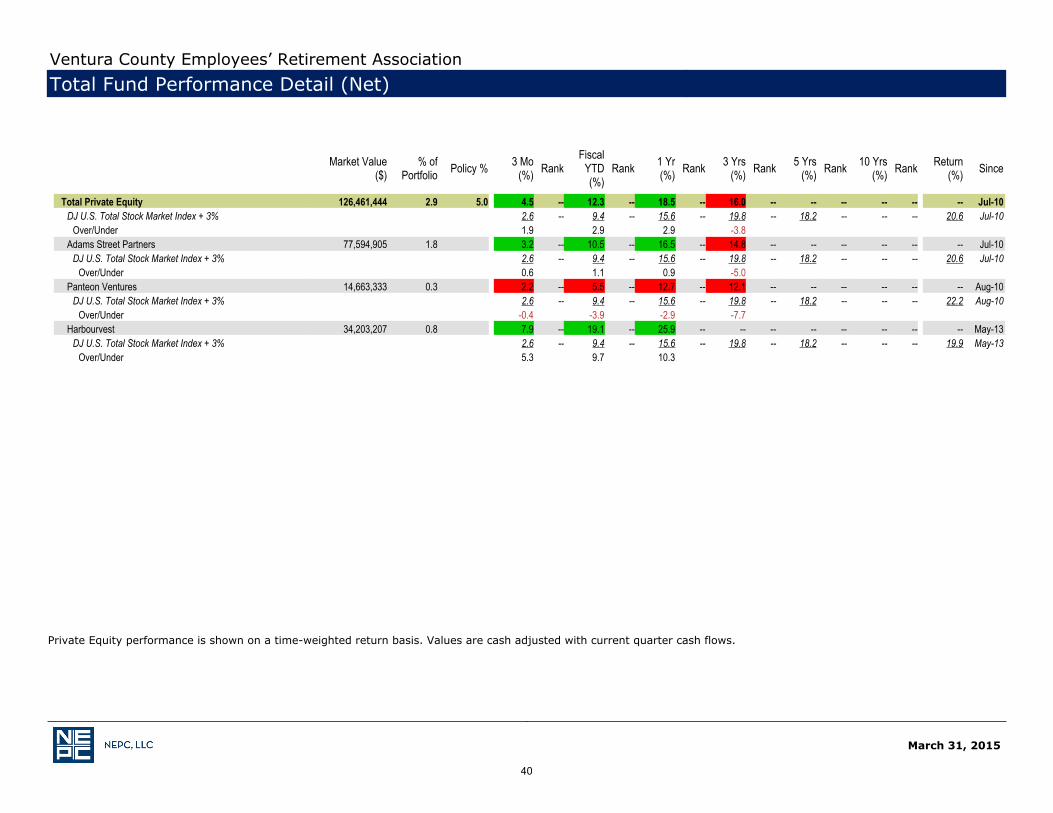
Private Equity performance is shown on a time-weighted return basis. Values are cash adjusted with current quarter cash flows.
Ventura County Employees’ Retirement AssociationTotal Fund Performance Detail (Net)
Market Value($)
% ofPortfolio Policy % 3 Mo
(%) RankFiscal
YTD(%)
Rank 1 Yr(%) Rank 3 Yrs
(%) Rank 5 Yrs(%) Rank 10 Yrs
(%) Rank Return(%) Since
_
Total Private Equity 126,461,444 2.9 5.0 4.5 -- 12.3 -- 18.5 -- 16.0 -- -- -- -- -- -- Jul-10DJ U.S. Total Stock Market Index + 3% 2.6 -- 9.4 -- 15.6 -- 19.8 -- 18.2 -- -- -- 20.6 Jul-10
Over/Under 1.9 2.9 2.9 -3.8 Adams Street Partners 77,594,905 1.8 3.2 -- 10.5 -- 16.5 -- 14.8 -- -- -- -- -- -- Jul-10
DJ U.S. Total Stock Market Index + 3% 2.6 -- 9.4 -- 15.6 -- 19.8 -- 18.2 -- -- -- 20.6 Jul-10Over/Under 0.6 1.1 0.9 -5.0
Panteon Ventures 14,663,333 0.3 2.2 -- 5.5 -- 12.7 -- 12.1 -- -- -- -- -- -- Aug-10DJ U.S. Total Stock Market Index + 3% 2.6 -- 9.4 -- 15.6 -- 19.8 -- 18.2 -- -- -- 22.2 Aug-10
Over/Under -0.4 -3.9 -2.9 -7.7 Harbourvest 34,203,207 0.8 7.9 -- 19.1 -- 25.9 -- -- -- -- -- -- -- -- May-13
DJ U.S. Total Stock Market Index + 3% 2.6 -- 9.4 -- 15.6 -- 19.8 -- 18.2 -- -- -- 19.9 May-13Over/Under 5.3 9.7 10.3
XXXXX
40
March 31, 2015
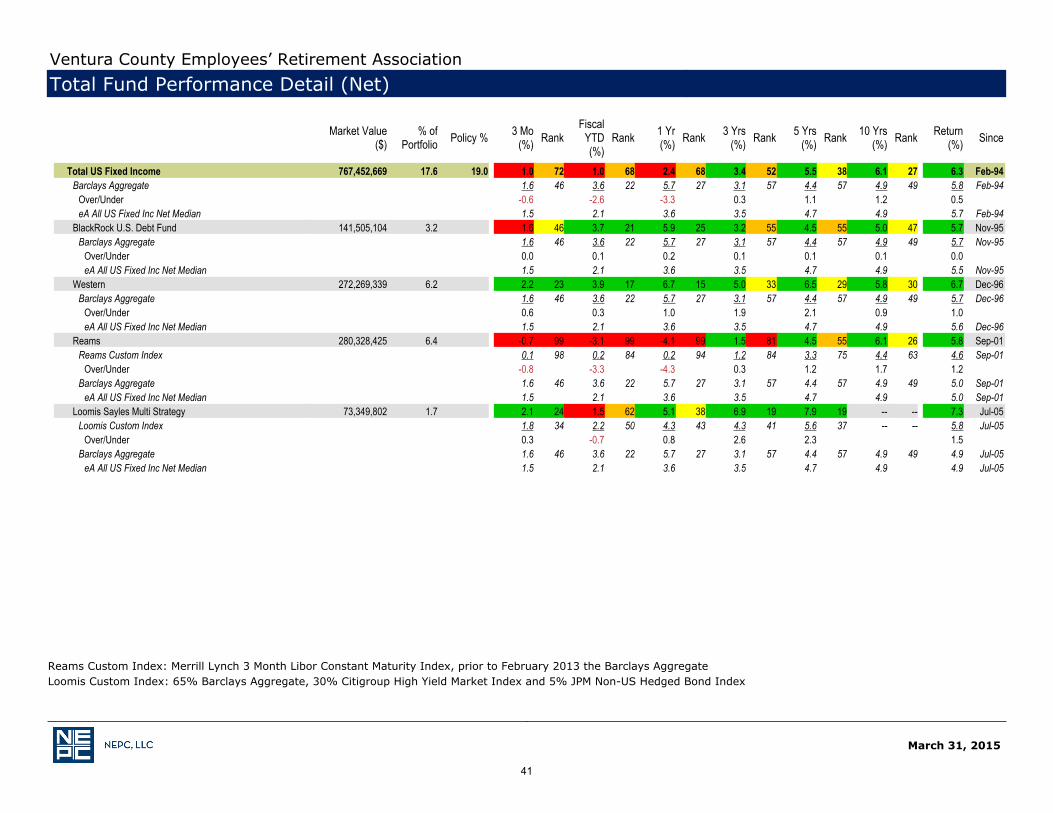
Reams Custom Index: Merrill Lynch 3 Month Libor Constant Maturity Index, prior to February 2013 the Barclays AggregateLoomis Custom Index: 65% Barclays Aggregate, 30% Citigroup High Yield Market Index and 5% JPM Non-US Hedged Bond Index
Ventura County Employees’ Retirement AssociationTotal Fund Performance Detail (Net)
Market Value($)
% ofPortfolio Policy % 3 Mo
(%) RankFiscal
YTD(%)
Rank 1 Yr(%) Rank 3 Yrs
(%) Rank 5 Yrs(%) Rank 10 Yrs
(%) Rank Return(%) Since
_
Total US Fixed Income 767,452,669 17.6 19.0 1.0 72 1.0 68 2.4 68 3.4 52 5.5 38 6.1 27 6.3 Feb-94Barclays Aggregate 1.6 46 3.6 22 5.7 27 3.1 57 4.4 57 4.9 49 5.8 Feb-94
Over/Under -0.6 -2.6 -3.3 0.3 1.1 1.2 0.5 eA All US Fixed Inc Net Median 1.5 2.1 3.6 3.5 4.7 4.9 5.7 Feb-94
BlackRock U.S. Debt Fund 141,505,104 3.2 1.6 46 3.7 21 5.9 25 3.2 55 4.5 55 5.0 47 5.7 Nov-95Barclays Aggregate 1.6 46 3.6 22 5.7 27 3.1 57 4.4 57 4.9 49 5.7 Nov-95
Over/Under 0.0 0.1 0.2 0.1 0.1 0.1 0.0 eA All US Fixed Inc Net Median 1.5 2.1 3.6 3.5 4.7 4.9 5.5 Nov-95
Western 272,269,339 6.2 2.2 23 3.9 17 6.7 15 5.0 33 6.5 29 5.8 30 6.7 Dec-96Barclays Aggregate 1.6 46 3.6 22 5.7 27 3.1 57 4.4 57 4.9 49 5.7 Dec-96
Over/Under 0.6 0.3 1.0 1.9 2.1 0.9 1.0 eA All US Fixed Inc Net Median 1.5 2.1 3.6 3.5 4.7 4.9 5.6 Dec-96
Reams 280,328,425 6.4 -0.7 99 -3.1 99 -4.1 99 1.5 81 4.5 55 6.1 26 5.8 Sep-01Reams Custom Index 0.1 98 0.2 84 0.2 94 1.2 84 3.3 75 4.4 63 4.6 Sep-01
Over/Under -0.8 -3.3 -4.3 0.3 1.2 1.7 1.2 Barclays Aggregate 1.6 46 3.6 22 5.7 27 3.1 57 4.4 57 4.9 49 5.0 Sep-01
eA All US Fixed Inc Net Median 1.5 2.1 3.6 3.5 4.7 4.9 5.0 Sep-01Loomis Sayles Multi Strategy 73,349,802 1.7 2.1 24 1.5 62 5.1 38 6.9 19 7.9 19 -- -- 7.3 Jul-05
Loomis Custom Index 1.8 34 2.2 50 4.3 43 4.3 41 5.6 37 -- -- 5.8 Jul-05Over/Under 0.3 -0.7 0.8 2.6 2.3 1.5
Barclays Aggregate 1.6 46 3.6 22 5.7 27 3.1 57 4.4 57 4.9 49 4.9 Jul-05eA All US Fixed Inc Net Median 1.5 2.1 3.6 3.5 4.7 4.9 4.9 Jul-05
41
March 31, 2015
Ventura County Employees’ Retirement AssociationTotal Fund Performance Detail (Net)
Market Value($)
% ofPortfolio Policy % 3 Mo
(%) RankFiscal
YTD(%)
Rank 1 Yr(%) Rank 3 Yrs
(%) Rank 5 Yrs(%) Rank 10 Yrs
(%) Rank Return(%) Since
_
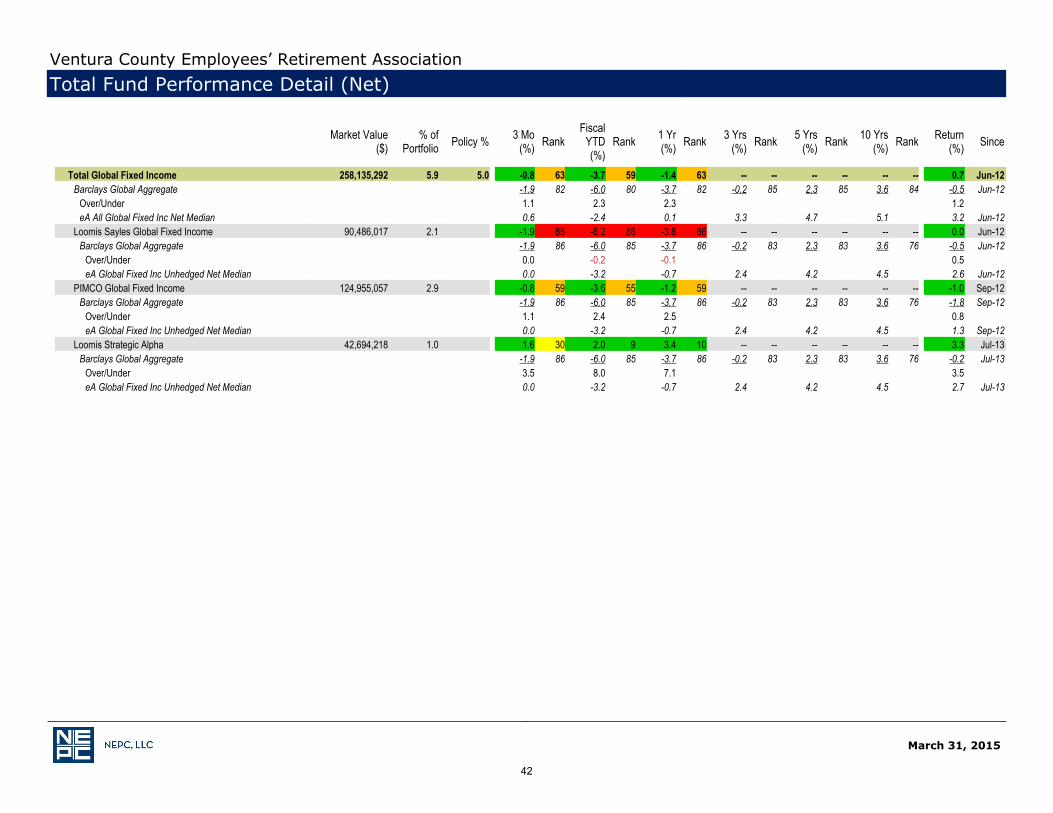
Total Global Fixed Income 258,135,292 5.9 5.0 -0.8 63 -3.7 59 -1.4 63 -- -- -- -- -- -- 0.7 Jun-12Barclays Global Aggregate -1.9 82 -6.0 80 -3.7 82 -0.2 85 2.3 85 3.6 84 -0.5 Jun-12
Over/Under 1.1 2.3 2.3 1.2 eA All Global Fixed Inc Net Median 0.6 -2.4 0.1 3.3 4.7 5.1 3.2 Jun-12
Loomis Sayles Global Fixed Income 90,486,017 2.1 -1.9 85 -6.2 86 -3.8 86 -- -- -- -- -- -- 0.0 Jun-12Barclays Global Aggregate -1.9 86 -6.0 85 -3.7 86 -0.2 83 2.3 83 3.6 76 -0.5 Jun-12
Over/Under 0.0 -0.2 -0.1 0.5 eA Global Fixed Inc Unhedged Net Median 0.0 -3.2 -0.7 2.4 4.2 4.5 2.6 Jun-12
PIMCO Global Fixed Income 124,955,057 2.9 -0.8 59 -3.6 55 -1.2 59 -- -- -- -- -- -- -1.0 Sep-12Barclays Global Aggregate -1.9 86 -6.0 85 -3.7 86 -0.2 83 2.3 83 3.6 76 -1.8 Sep-12
Over/Under 1.1 2.4 2.5 0.8 eA Global Fixed Inc Unhedged Net Median 0.0 -3.2 -0.7 2.4 4.2 4.5 1.3 Sep-12
Loomis Strategic Alpha 42,694,218 1.0 1.6 30 2.0 9 3.4 10 -- -- -- -- -- -- 3.3 Jul-13Barclays Global Aggregate -1.9 86 -6.0 85 -3.7 86 -0.2 83 2.3 83 3.6 76 -0.2 Jul-13
Over/Under 3.5 8.0 7.1 3.5 eA Global Fixed Inc Unhedged Net Median 0.0 -3.2 -0.7 2.4 4.2 4.5 2.7 Jul-13
42
March 31, 2015
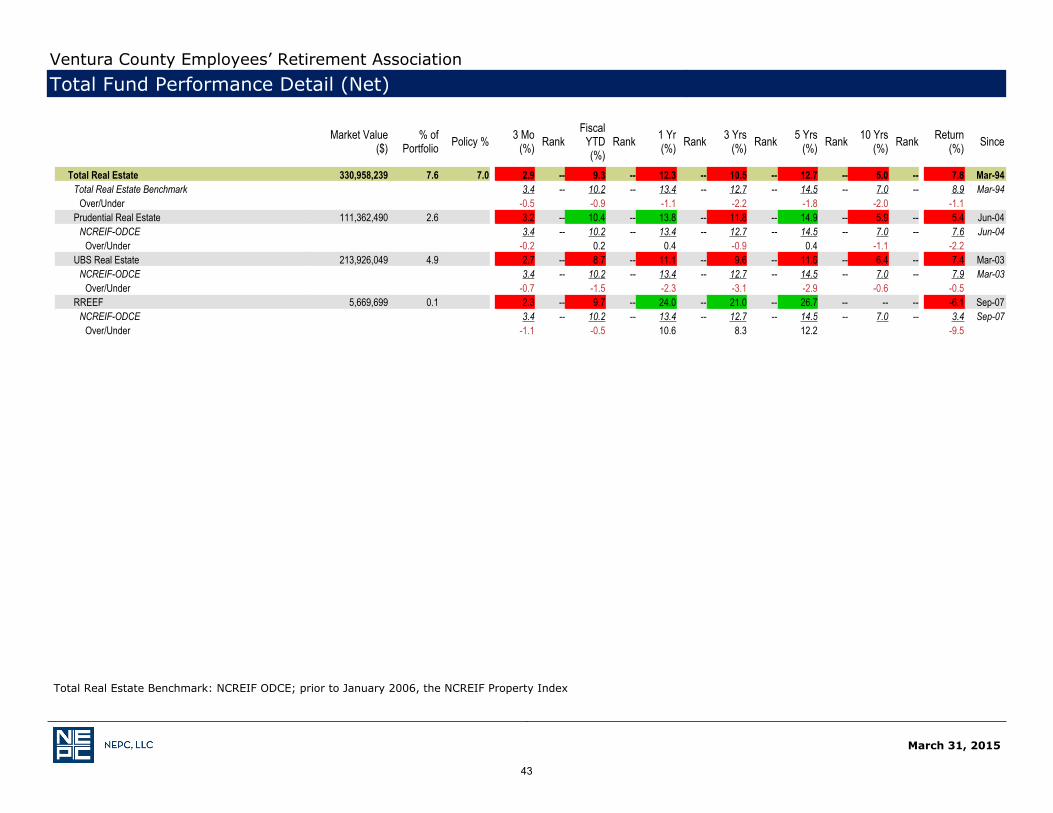
Total Real Estate Benchmark: NCREIF ODCE; prior to January 2006, the NCREIF Property Index
Ventura County Employees’ Retirement AssociationTotal Fund Performance Detail (Net)
Market Value($)
% ofPortfolio Policy % 3 Mo
(%) RankFiscal
YTD(%)
Rank 1 Yr(%) Rank 3 Yrs
(%) Rank 5 Yrs(%) Rank 10 Yrs
(%) Rank Return(%) Since
_
Total Real Estate 330,958,239 7.6 7.0 2.9 -- 9.3 -- 12.3 -- 10.5 -- 12.7 -- 5.0 -- 7.8 Mar-94Total Real Estate Benchmark 3.4 -- 10.2 -- 13.4 -- 12.7 -- 14.5 -- 7.0 -- 8.9 Mar-94
Over/Under -0.5 -0.9 -1.1 -2.2 -1.8 -2.0 -1.1 Prudential Real Estate 111,362,490 2.6 3.2 -- 10.4 -- 13.8 -- 11.8 -- 14.9 -- 5.9 -- 5.4 Jun-04
NCREIF-ODCE 3.4 -- 10.2 -- 13.4 -- 12.7 -- 14.5 -- 7.0 -- 7.6 Jun-04Over/Under -0.2 0.2 0.4 -0.9 0.4 -1.1 -2.2
UBS Real Estate 213,926,049 4.9 2.7 -- 8.7 -- 11.1 -- 9.6 -- 11.6 -- 6.4 -- 7.4 Mar-03NCREIF-ODCE 3.4 -- 10.2 -- 13.4 -- 12.7 -- 14.5 -- 7.0 -- 7.9 Mar-03
Over/Under -0.7 -1.5 -2.3 -3.1 -2.9 -0.6 -0.5 RREEF 5,669,699 0.1 2.3 -- 9.7 -- 24.0 -- 21.0 -- 26.7 -- -- -- -6.1 Sep-07
NCREIF-ODCE 3.4 -- 10.2 -- 13.4 -- 12.7 -- 14.5 -- 7.0 -- 3.4 Sep-07Over/Under -1.1 -0.5 10.6 8.3 12.2 -9.5
43
Market Value($)
% ofPortfolio Policy % 3 Mo
(%) RankFiscal
YTD(%)
Rank 1 Yr(%) Rank 3 Yrs
(%) Rank 5 Yrs(%) Rank 10 Yrs
(%) Rank Return(%) Since
_
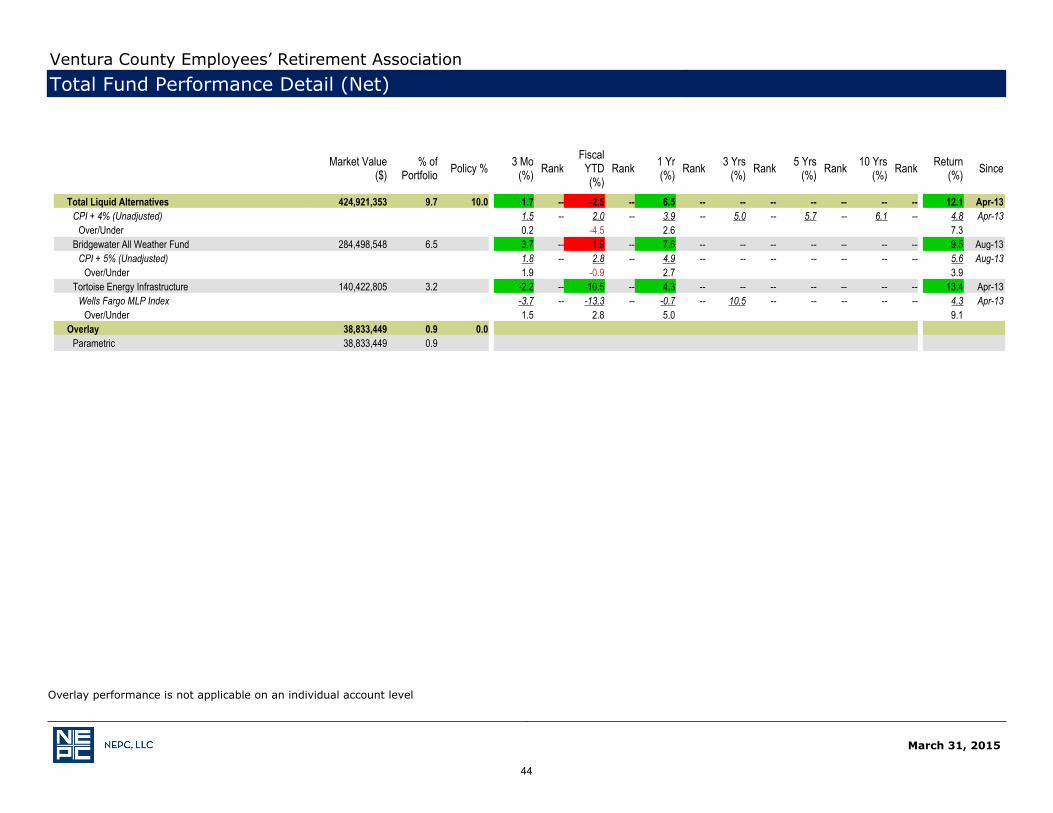
Total Liquid Alternatives 424,921,353 9.7 10.0 1.7 -- -2.5 -- 6.5 -- -- -- -- -- -- -- 12.1 Apr-13CPI + 4% (Unadjusted) 1.5 -- 2.0 -- 3.9 -- 5.0 -- 5.7 -- 6.1 -- 4.8 Apr-13
Over/Under 0.2 -4.5 2.6 7.3 Bridgewater All Weather Fund 284,498,548 6.5 3.7 -- 1.9 -- 7.6 -- -- -- -- -- -- -- 9.5 Aug-13
CPI + 5% (Unadjusted) 1.8 -- 2.8 -- 4.9 -- -- -- -- -- -- -- 5.6 Aug-13Over/Under 1.9 -0.9 2.7 3.9
Tortoise Energy Infrastructure 140,422,805 3.2 -2.2 -- -10.5 -- 4.3 -- -- -- -- -- -- -- 13.4 Apr-13Wells Fargo MLP Index -3.7 -- -13.3 -- -0.7 -- 10.5 -- -- -- -- -- 4.3 Apr-13
Over/Under 1.5 2.8 5.0 9.1 Overlay 38,833,449 0.9 0.0
Parametric 38,833,449 0.9
March 31, 2015
Overlay performance is not applicable on an individual account level
Ventura County Employees’ Retirement AssociationTotal Fund Performance Detail (Net)
44
March 31, 2015
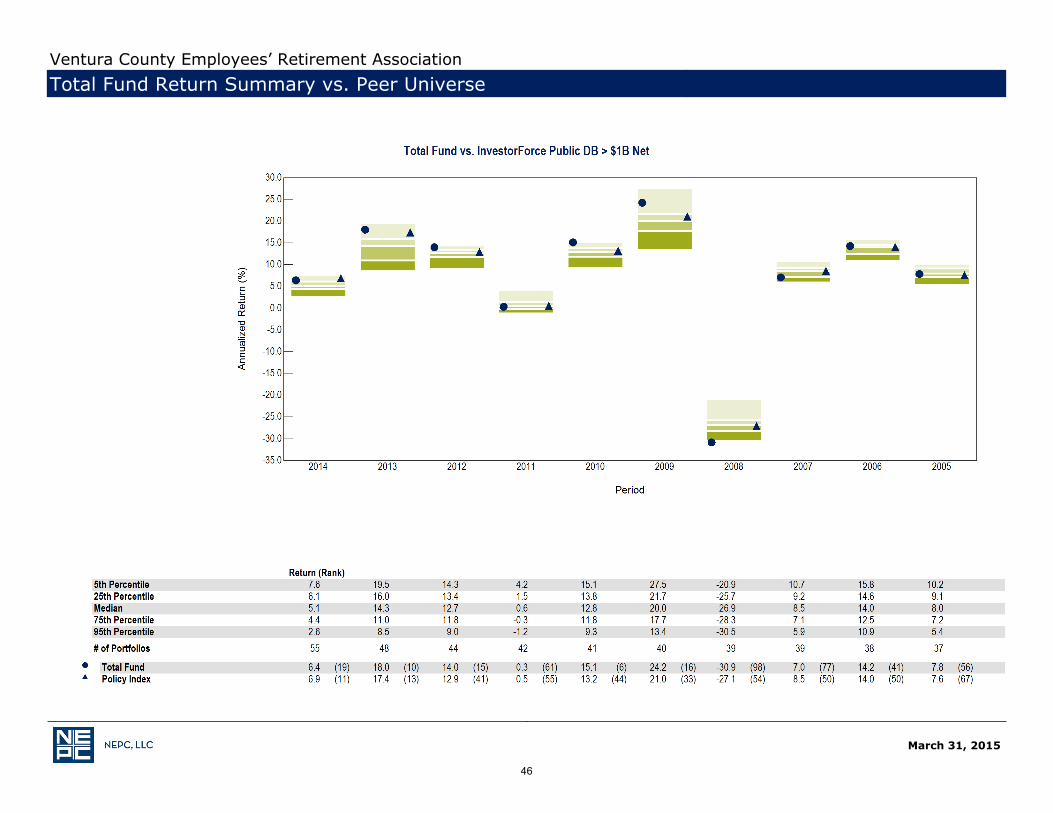
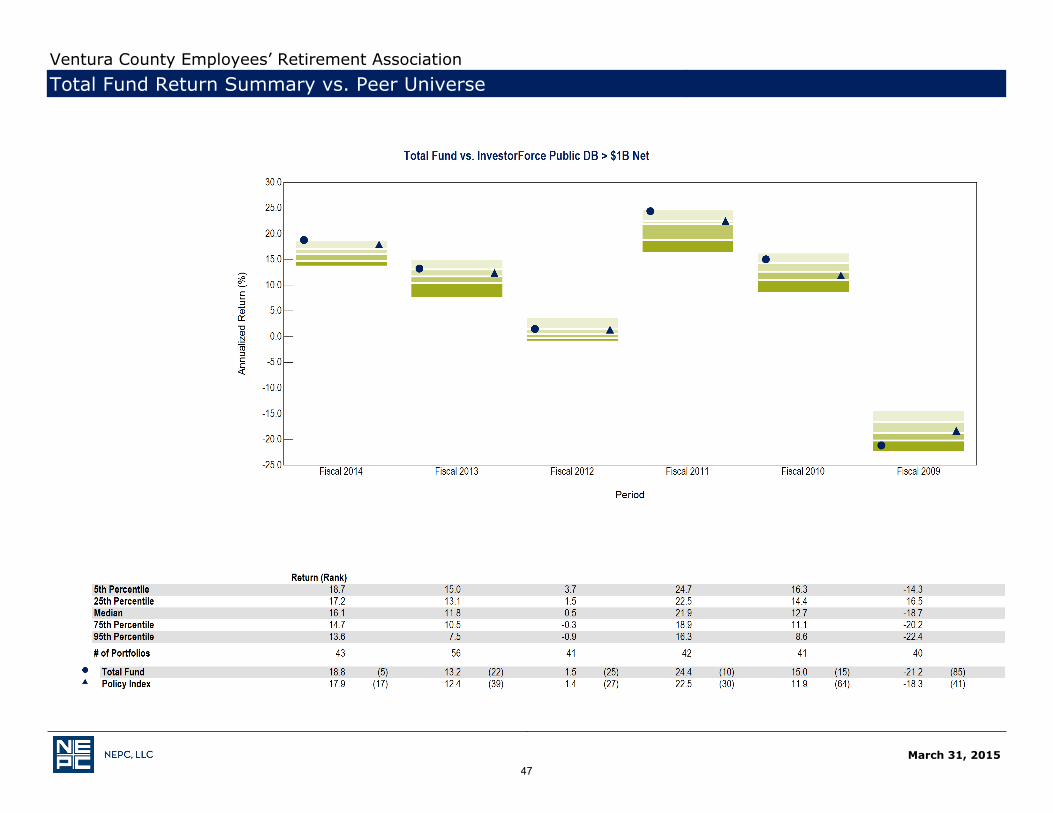
Ventura County Employees’ Retirement AssociationTotal Fund Return Summary vs. Peer Universe
45
March 31, 2015
Ventura County Employees’ Retirement AssociationTotal Fund Return Summary vs. Peer Universe
46
March 31, 2015
Ventura County Employees’ Retirement AssociationTotal Fund Return Summary vs. Peer Universe
47
March 31, 2015
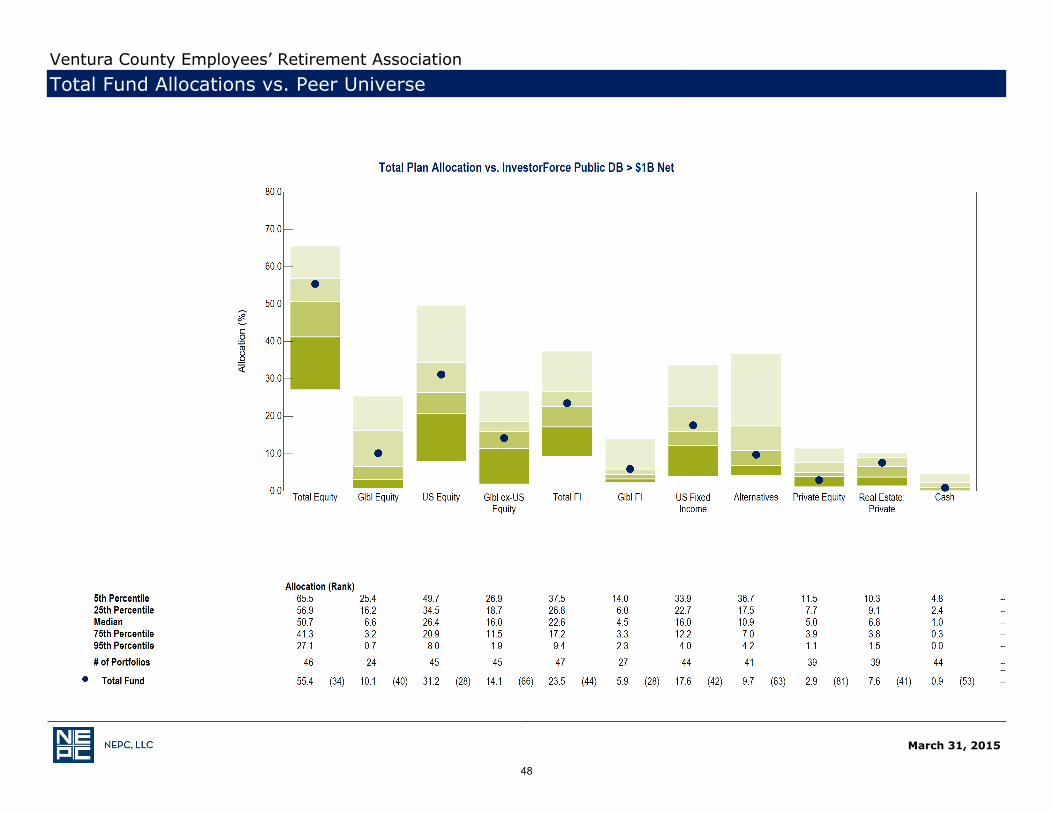
Ventura County Employees’ Retirement AssociationTotal Fund Allocations vs. Peer Universe
48
Manager Due Diligence
49
Investment OptionsPerformance
(Recent Quarter)
Changes/Announcements
(Recent Quarter)
NEPC Due Diligence
Committee Recommendations
Plan Recommendation Comments
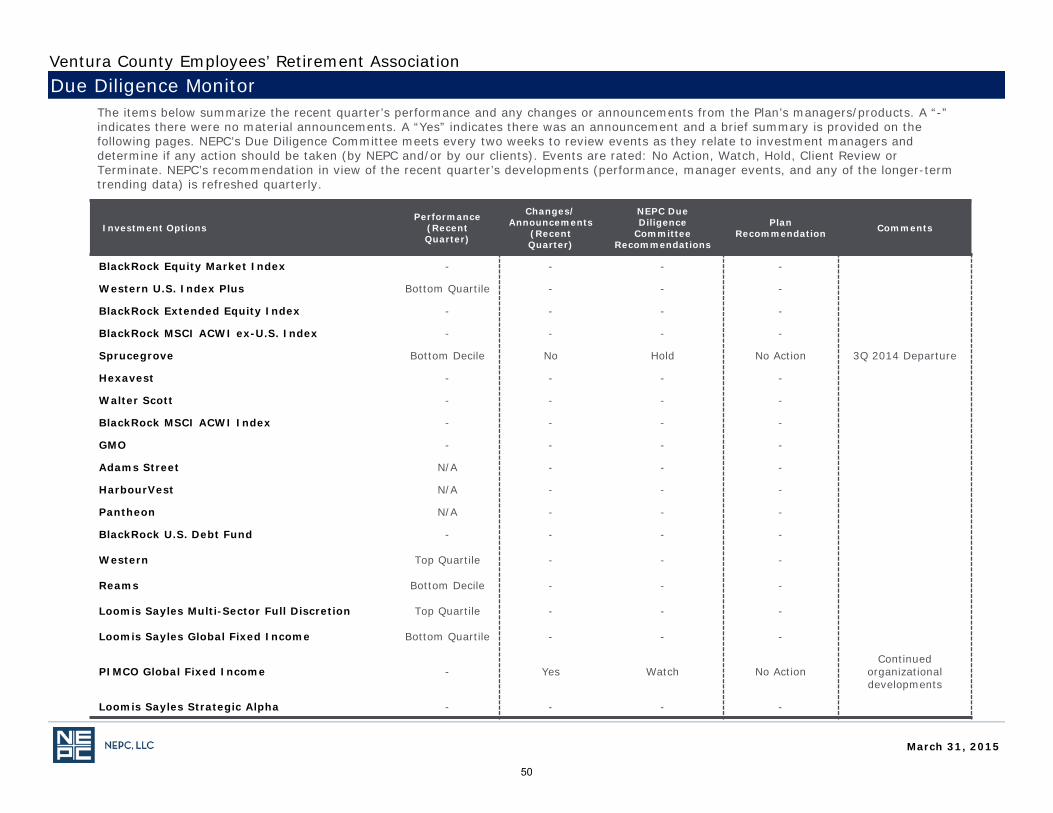
BlackRock Equity Market Index - - - -
Western U.S. Index Plus Bottom Quartile - - -
BlackRock Extended Equity Index - - - -
BlackRock MSCI ACWI ex-U.S. Index - - - -
Sprucegrove Bottom Decile No Hold No Action 3Q 2014 Departure
Hexavest - - - -
Walter Scott - - - -
BlackRock MSCI ACWI Index - - - -
GMO - - - -
Adams Street N/A - - -
HarbourVest N/A - - -
Pantheon N/A - - -
BlackRock U.S. Debt Fund - - - -
Western Top Quartile - - -
Reams Bottom Decile - - -
Loomis Sayles Multi-Sector Full Discretion Top Quartile - - -
Loomis Sayles Global Fixed Income Bottom Quartile - - -
PIMCO Global Fixed Income - Yes Watch No ActionContinued
organizational developments
Loomis Sayles Strategic Alpha - - - -
The items below summarize the recent quarter’s performance and any changes or announcements from the Plan’s managers/products. A “-” indicates there were no material announcements. A “Yes” indicates there was an announcement and a brief summary is provided on the following pages. NEPC’s Due Diligence Committee meets every two weeks to review events as they relate to investment managers and determine if any action should be taken (by NEPC and/or by our clients). Events are rated: No Action, Watch, Hold, Client Review or Terminate. NEPC’s recommendation in view of the recent quarter’s developments (performance, manager events, and any of the longer-term trending data) is refreshed quarterly.
Ventura County Employees’ Retirement AssociationDue Diligence Monitor
March 31, 2015
50
Investment OptionsPerformance
(Recent Quarter)
Changes/Announcements
(Recent Quarter)
NEPC Due Diligence
Committee Recommendations
Plan Recommendation Comments
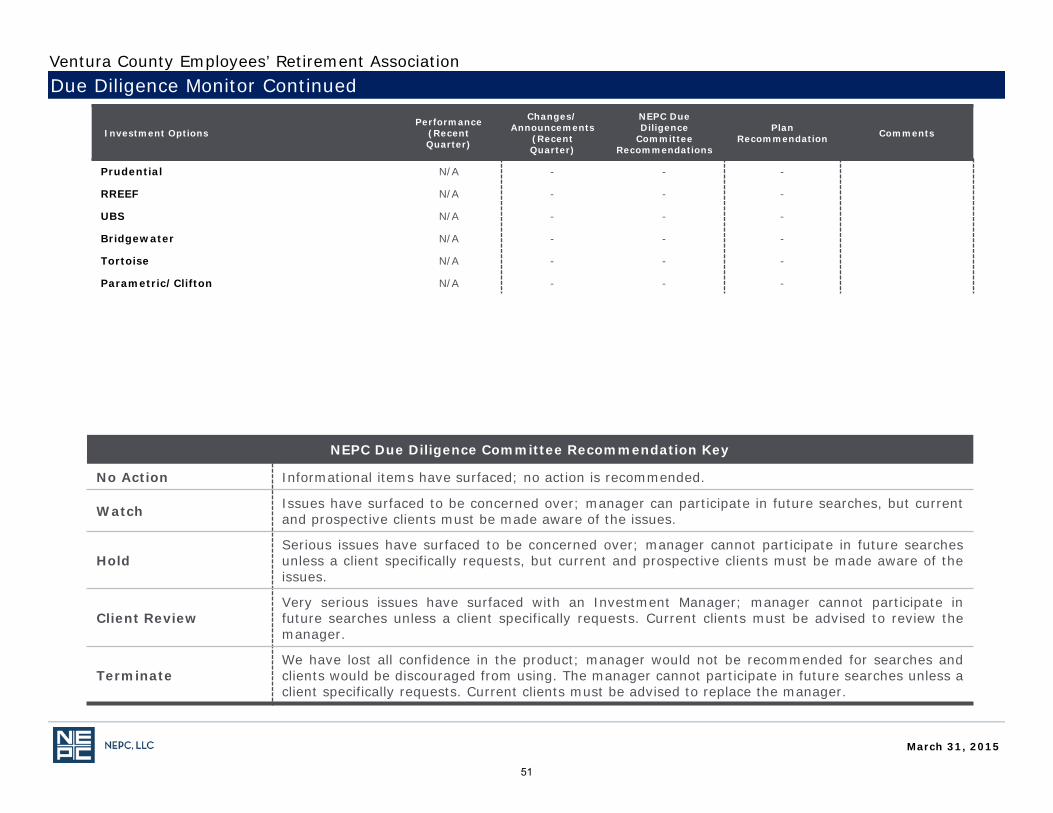
Prudential N/A - - -
RREEF N/A - - -
UBS N/A - - -
Bridgewater N/A - - -
Tortoise N/A - - -
Parametric/Clifton N/A - - -
Due Diligence Monitor ContinuedVentura County Employees’ Retirement Association
NEPC Due Diligence Committee Recommendation Key
No Action Informational items have surfaced; no action is recommended.
Watch Issues have surfaced to be concerned over; manager can participate in future searches, but currentand prospective clients must be made aware of the issues.
Hold Serious issues have surfaced to be concerned over; manager cannot participate in future searchesunless a client specifically requests, but current and prospective clients must be made aware of theissues.
Client Review Very serious issues have surfaced with an Investment Manager; manager cannot participate infuture searches unless a client specifically requests. Current clients must be advised to review themanager.
Terminate We have lost all confidence in the product; manager would not be recommended for searches andclients would be discouraged from using. The manager cannot participate in future searches unless aclient specifically requests. Current clients must be advised to replace the manager.
March 31, 2015
51
Below is a summary of manager changes, announcements and due diligence events since the issuance of our last quarterly report.
Manager Changes/Announcements
Sprucegrove Investment Management Ltd.On September 1, 2014, NEPC was notified that Co-President/Co-Portfolio Manager Peter Ellement resigned from the firm. Sprucegrove did not provide transparency into the exact reason for the departure other than there appeared to be some level of conflict between Mr. Ellement and other members of the firm. Shirley Woo will be joined by Arjun Kumar as the Co-Portfolio Managers on the International Equity Fund going forward. Craig Merrigan will become the sole President of the firm.
NEPC recommends a due diligence status of HOLD for Sprucegrove. We do not recommend any action at this time as a result of Mr. Ellement’s departure.
PIMCONEPC Research placed PIMCO on Client Review in September 2014 following the sudden departure of Founder and CIO Bill Gross. We felt a Client Review status was necessary given that Mr. Gross’ departure was significant from both an investment and business standpoint. Since that time, NEPC Research has conducted an extensive due diligence review in order to gather additional information and ultimately formulate a follow-up recommendation to clients. While outflows continue at PIMCO, particularly from the flagship Total Return strategy, redemptions have slowed and performance has not materially suffered. Additionally, with the exception of a few individuals, PIMCO has retained its leading investment professionals throughout the period. We believe the level of business and investment risk associated with PIMCO as a firm has been reduced considerably as time has passed following the departure of Mr. Gross, although some products continue to exhibit a greater degree of uncertainty. Even with the changes summarized below, NEPC Research will continue to closely monitor PIMCO in the coming months.
As our Due Diligence event process outlines, the Client Review status is reassessed 6-12 months after an event occurs. After conducting analysis on PIMCO at both the firm and individual product level, we have made multiple changes to the Due Diligence status. The changes are summarized below:
• PIMCO Firm DD status will move from Client Review to Watch• Total Return and Unconstrained Bond will maintain Client Review status• All other PIMCO products will be upgraded from Client Review to Watch
In the months following the departure of Bill Gross, NEPC maintained a consistent dialogue with PIMCO executives, senior investmentpersonnel, and staff. These interactions included two onsite meetings in Newport Beach, a conference call and in-person discussion withCEO Doug Hodge, several product-specific updates, and constant ad-hoc conversations with PIMCO representatives. Through theseConversations, we gathered information related to Bill Gross’ departure, specifically, the impact on investment performance, internalworking environment, PIMCO’s approach to managing a high level of redemptions, revenue losses and organizational flexibility,and retention of key professionals. The insight gained from these conversations combined with the actual results in the months after theannouncement provide us with a basis on which to make a recommendation.
Due Diligence CommentaryVentura County Employees’ Retirement Association
March 31, 2015
52
Below is a summary of manager changes, announcements and due diligence events since the issuance of our last quarterly report.
Manager Changes/Announcements
PIMCO (continued)
PIMCO - Firm Status: In the period beginning January 1, 2014 through March 31, 2015, PIMCO total assets under management fell byapproximately $330 billion. Much of the outflows occurred following Bill Gross’s departure and more than half was redeemed from theTotal Return strategy. There are signs that asset flows have stabilized outside of Total Return, with several strategies experiencing netinflows in March 2015. In addition, there is no evidence that PIMCO has made any material organizational changes to adjust for the lossin revenue. We believe that PIMCO has a great deal of financial flexibility in this regard through compensation adjustments, employeeattrition, and overall financial health. One factor that did not go unnoticed in conversations with members of the investment team is the improvement in the workplace environment since Mr. Gross’ departure. By all accounts, it appears the atmosphere is positive and moreconducive to a collegial workplace. While it will take time to see if this new PIMCO environment will yield positive results for clients, it isa step in the right direction. For these reasons we are upgrading PIMCO’s firm due diligence status to Watch from Client Review.
PIMCO strategies excluding Total Return and Unconstrained Bond: The impact of Bill Gross’s departure for a majority of PIMCO strategies is much less significant from an investment standpoint. While outflows did occur across the product platform, redemptions tapered off quickly in the months following the announcement and reversed in some cases. While some strategies may continue to feel a residual impact from the organizational changes, we are comfortable with the investment teams and strategies and see little in terms of product-specific risks going forward. All PIMCO strategies, with the exception of Total Return and Unconstrained Bond, will have their Client Review due diligence status rescinded. These strategies will retain a due diligence status of Watch due to the overall PIMCO Firm rating detailed above.
NEPC recommends a due diligence status of WATCH for PIMCO as a firm and for the Global Fixed Income portfolio in which VCERA currently invests.
Due Diligence CommentaryVentura County Employees’ Retirement Association
March 31, 2015
53
Appendix: Market Environment; Performance Disclosures
54
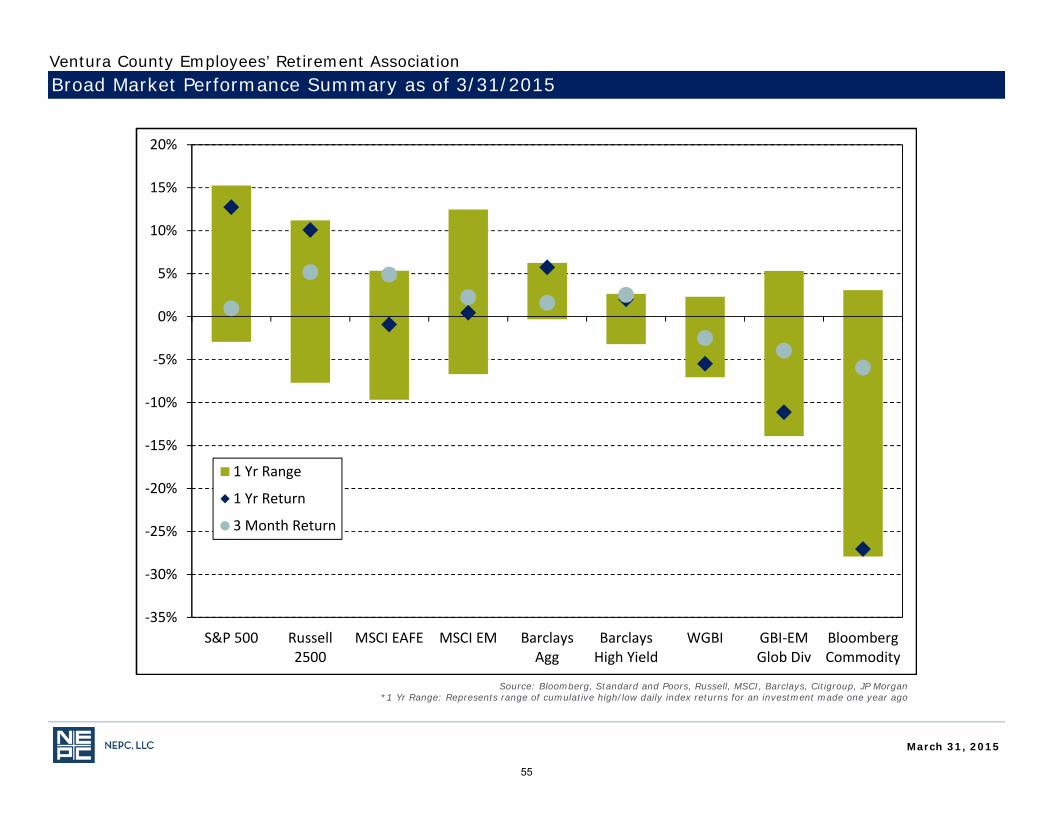
Broad Market Performance Summary as of 3/31/2015
Source: Bloomberg, Standard and Poors, Russell, MSCI, Barclays, Citigroup, JP Morgan *1 Yr Range: Represents range of cumulative high/low daily index returns for an investment made one year ago
‐35%
‐30%
‐25%
‐20%
‐15%
‐10%
‐5%
0%
5%
10%
15%
20%
S&P 500 Russell2500
MSCI EAFE MSCI EM BarclaysAgg
BarclaysHigh Yield
WGBI GBI‐EMGlob Div
BloombergCommodity
1 Yr Range
1 Yr Return
3 Month Return
March 31, 2015
Ventura County Employees’ Retirement Association
55
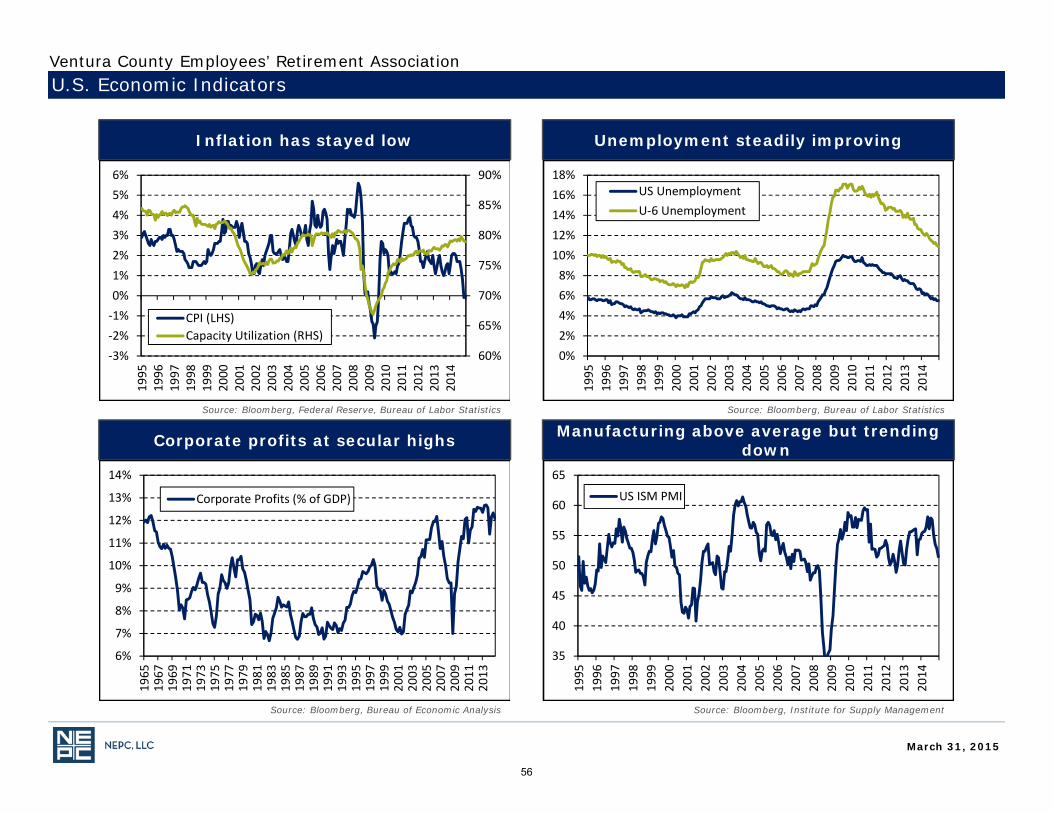
Inflation has stayed low Unemployment steadily improving
Corporate profits at secular highs Manufacturing above average but trending down
U.S. Economic Indicators
Source: Bloomberg, Federal Reserve, Bureau of Labor Statistics Source: Bloomberg, Bureau of Labor Statistics
Source: Bloomberg, Institute for Supply ManagementSource: Bloomberg, Bureau of Economic Analysis
60%
65%
70%
75%
80%
85%
90%
‐3%‐2%‐1%0%1%2%3%4%5%6%
1995
1996
1997
1998
1999
2000
2001
2002
2003
2004
2005
2006
2007
2008
2009
2010
2011
2012
2013
2014
CPI (LHS)Capacity Utilization (RHS)
0%2%4%6%8%
10%12%14%16%18%
1995
1996
1997
1998
1999
2000
2001
2002
2003
2004
2005
2006
2007
2008
2009
2010
2011
2012
2013
2014
US UnemploymentU‐6 Unemployment
6%
7%
8%
9%
10%
11%
12%
13%
14%
1965
1967
1969
1971
1973
1975
1977
1979
1981
1983
1985
1987
1989
1991
1993
1995
1997
1999
2001
2003
2005
2007
2009
2011
2013
Corporate Profits (% of GDP)
35
40
45
50
55
60
65
1995
1996
1997
1998
1999
2000
2001
2002
2003
2004
2005
2006
2007
2008
2009
2010
2011
2012
2013
2014
US ISM PMI
March 31, 2015
Ventura County Employees’ Retirement Association
56
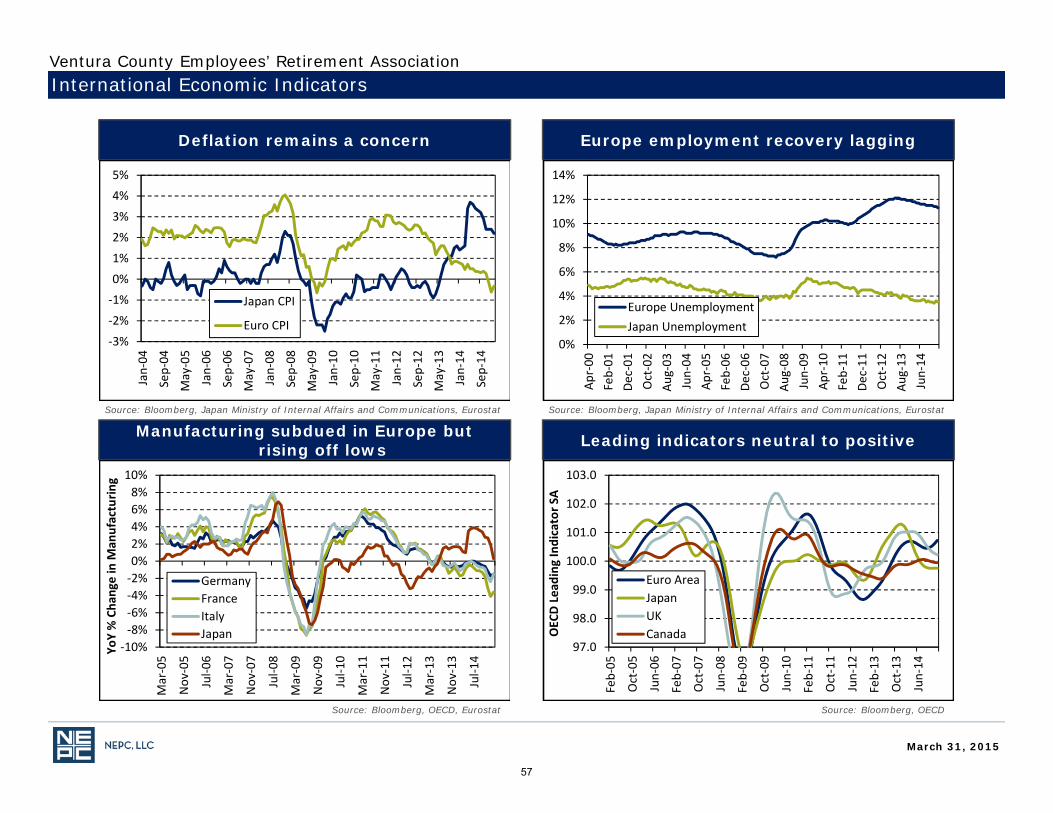
Deflation remains a concern Europe employment recovery lagging
Manufacturing subdued in Europe but rising off lows Leading indicators neutral to positive
International Economic Indicators
Source: Bloomberg, Japan Ministry of Internal Affairs and Communications, Eurostat Source: Bloomberg, Japan Ministry of Internal Affairs and Communications, Eurostat
Source: Bloomberg, OECDSource: Bloomberg, OECD, Eurostat
‐3%
‐2%
‐1%
0%
1%
2%
3%
4%
5%
Jan‐04
Sep‐04
May‐05
Jan‐06
Sep‐06
May‐07
Jan‐08
Sep‐08
May‐09
Jan‐10
Sep‐10
May‐11
Jan‐12
Sep‐12
May‐13
Jan‐14
Sep‐14
Japan CPI
Euro CPI0%
2%
4%
6%
8%
10%
12%
14%
Apr‐00
Feb‐01
Dec‐01
Oct‐02
Aug‐03
Jun‐04
Apr‐05
Feb‐06
Dec‐06
Oct‐07
Aug‐08
Jun‐09
Apr‐10
Feb‐11
Dec‐11
Oct‐12
Aug‐13
Jun‐14
Europe UnemploymentJapan Unemployment
‐10%‐8%‐6%‐4%‐2%0%2%4%6%8%
10%
Mar‐05
Nov
‐05
Jul‐0
6
Mar‐07
Nov
‐07
Jul‐0
8
Mar‐09
Nov
‐09
Jul‐1
0
Mar‐11
Nov
‐11
Jul‐1
2
Mar‐13
Nov
‐13
Jul‐1
4YoY % Cha
nge in M
anufacturin
g
GermanyFranceItalyJapan
97.0
98.0
99.0
100.0
101.0
102.0
103.0
Feb‐05
Oct‐05
Jun‐06
Feb‐07
Oct‐07
Jun‐08
Feb‐09
Oct‐09
Jun‐10
Feb‐11
Oct‐11
Jun‐12
Feb‐13
Oct‐13
Jun‐14
OECD Lead
ing Indicator S
A
Euro AreaJapanUKCanada
March 31, 2015
Ventura County Employees’ Retirement Association
57
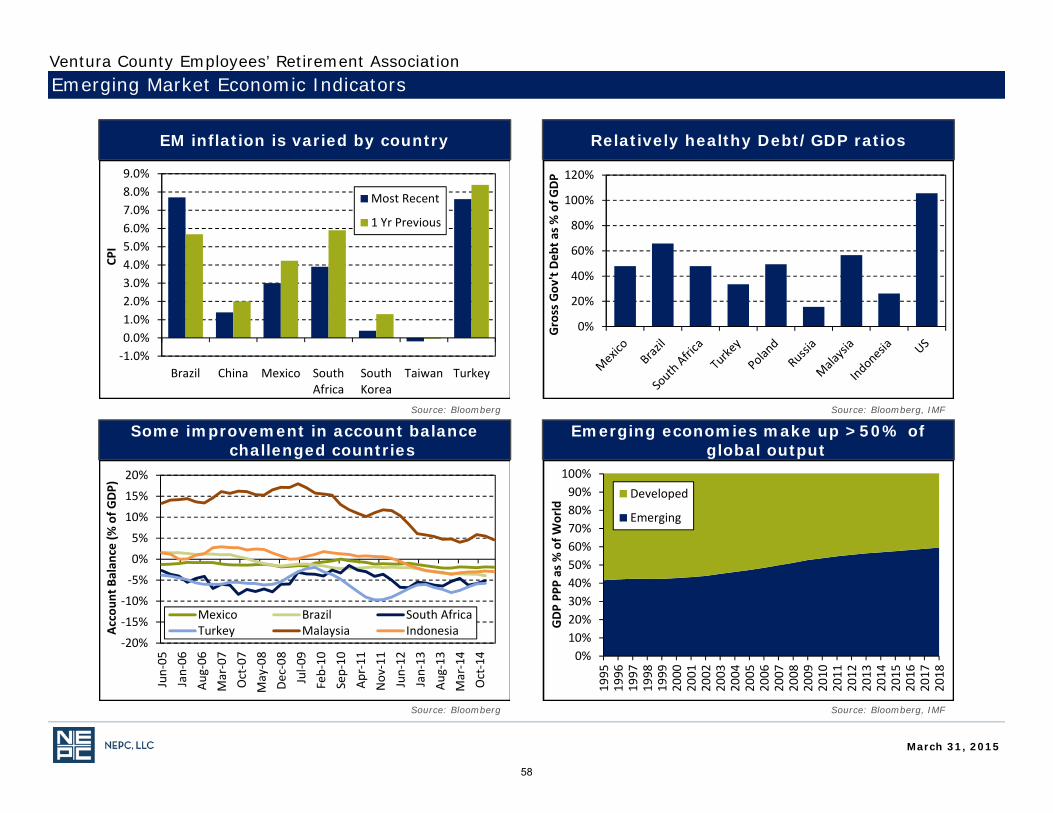
EM inflation is varied by country Relatively healthy Debt/GDP ratios
Some improvement in account balance challenged countries
Emerging economies make up >50% of global output
Emerging Market Economic Indicators
Source: Bloomberg Source: Bloomberg, IMF
Source: Bloomberg, IMFSource: Bloomberg
‐1.0%0.0%1.0%2.0%3.0%4.0%5.0%6.0%7.0%8.0%9.0%
Brazil China Mexico SouthAfrica
SouthKorea
Taiwan Turkey
CPI
Most Recent
1 Yr Previous
0%
20%
40%
60%
80%
100%
120%
Gross Gov
't Deb
t as %
of G
DP
‐20%
‐15%
‐10%
‐5%
0%
5%
10%
15%
20%
Jun‐05
Jan‐06
Aug‐06
Mar‐07
Oct‐07
May‐08
Dec‐08
Jul‐0
9Feb‐10
Sep‐10
Apr‐11
Nov
‐11
Jun‐12
Jan‐13
Aug‐13
Mar‐14
Oct‐14
Accoun
t Balan
ce (%
of G
DP)
Mexico Brazil South AfricaTurkey Malaysia Indonesia
0%10%20%30%40%50%60%70%80%90%
100%
1995
1996
1997
1998
1999
2000
2001
2002
2003
2004
2005
2006
2007
2008
2009
2010
2011
2012
2013
2014
2015
2016
2017
2018
GDP PP
P as % of W
orld
Developed
Emerging
March 31, 2015
Ventura County Employees’ Retirement Association
58
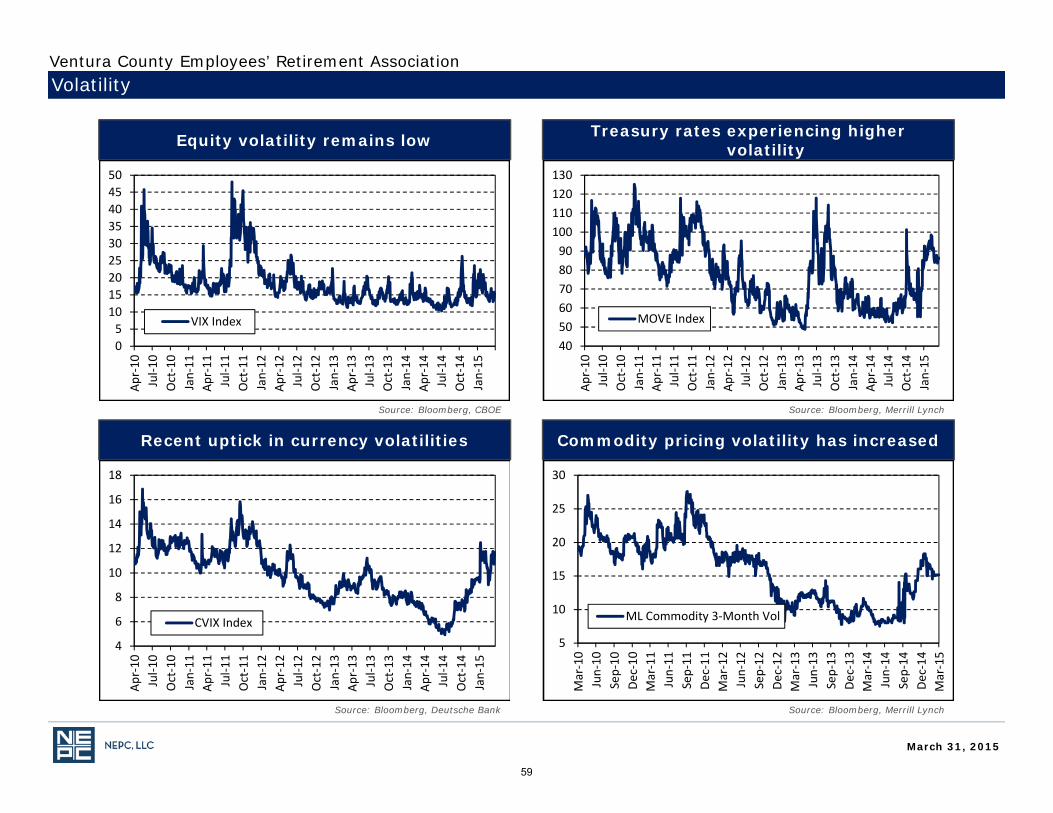
Equity volatility remains low Treasury rates experiencing higher volatility
Recent uptick in currency volatilities Commodity pricing volatility has increased
Volatility
Source: Bloomberg, CBOE Source: Bloomberg, Merrill Lynch
Source: Bloomberg, Merrill LynchSource: Bloomberg, Deutsche Bank
05
101520253035404550
Apr‐10
Jul‐1
0Oct‐10
Jan‐11
Apr‐11
Jul‐1
1Oct‐11
Jan‐12
Apr‐12
Jul‐1
2Oct‐12
Jan‐13
Apr‐13
Jul‐1
3Oct‐13
Jan‐14
Apr‐14
Jul‐1
4Oct‐14
Jan‐15
VIX Index
405060708090
100110120130
Apr‐10
Jul‐1
0Oct‐10
Jan‐11
Apr‐11
Jul‐1
1Oct‐11
Jan‐12
Apr‐12
Jul‐1
2Oct‐12
Jan‐13
Apr‐13
Jul‐1
3Oct‐13
Jan‐14
Apr‐14
Jul‐1
4Oct‐14
Jan‐15
MOVE Index
4
6
8
10
12
14
16
18
Apr‐10
Jul‐1
0Oct‐10
Jan‐11
Apr‐11
Jul‐1
1Oct‐11
Jan‐12
Apr‐12
Jul‐1
2Oct‐12
Jan‐13
Apr‐13
Jul‐1
3Oct‐13
Jan‐14
Apr‐14
Jul‐1
4Oct‐14
Jan‐15
CVIX Index5
10
15
20
25
30
Mar‐10
Jun‐10
Sep‐10
Dec‐10
Mar‐11
Jun‐11
Sep‐11
Dec‐11
Mar‐12
Jun‐12
Sep‐12
Dec‐12
Mar‐13
Jun‐13
Sep‐13
Dec‐13
Mar‐14
Jun‐14
Sep‐14
Dec‐14
Mar‐15
ML Commodity 3‐Month Vol
March 31, 2015
Ventura County Employees’ Retirement Association
59
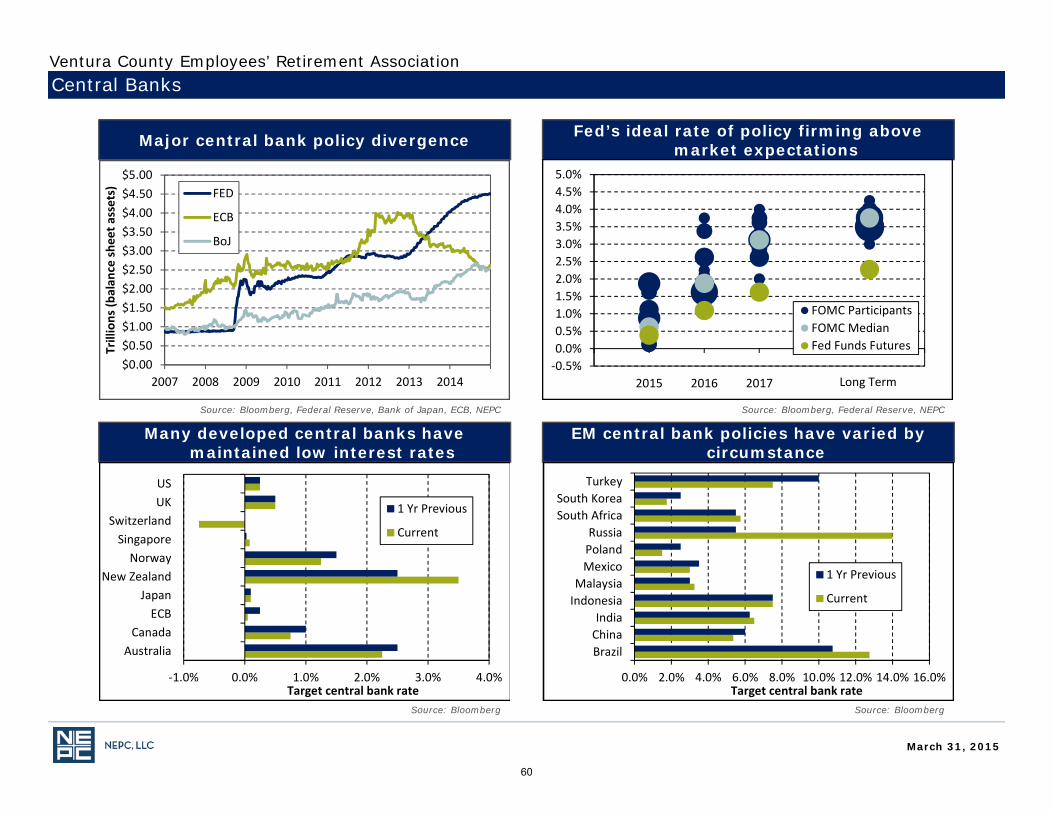
Major central bank policy divergence Fed’s ideal rate of policy firming above market expectations
Many developed central banks have maintained low interest rates
EM central bank policies have varied by circumstance
Central Banks
Source: Bloomberg, Federal Reserve, Bank of Japan, ECB, NEPC Source: Bloomberg, Federal Reserve, NEPC
Source: BloombergSource: Bloomberg
$0.00$0.50$1.00$1.50$2.00$2.50$3.00$3.50$4.00$4.50$5.00
2007 2008 2009 2010 2011 2012 2013 2014
Trillions (b
alan
ce she
et assets) FED
ECB
BoJ
‐0.5%0.0%0.5%1.0%1.5%2.0%2.5%3.0%3.5%4.0%4.5%5.0%
2014 2015 2016 2017 2018 2019 2020
FOMC ParticipantsFOMC MedianFed Funds Futures
Long Term
‐1.0% 0.0% 1.0% 2.0% 3.0% 4.0%
AustraliaCanada
ECBJapan
New ZealandNorway
SingaporeSwitzerland
UKUS
Target central bank rate
1 Yr Previous
Current
0.0% 2.0% 4.0% 6.0% 8.0% 10.0% 12.0% 14.0% 16.0%
BrazilChinaIndia
IndonesiaMalaysiaMexicoPolandRussia
South AfricaSouth Korea
Turkey
Target central bank rate
1 Yr Previous
Current
March 31, 2015
Ventura County Employees’ Retirement Association
60
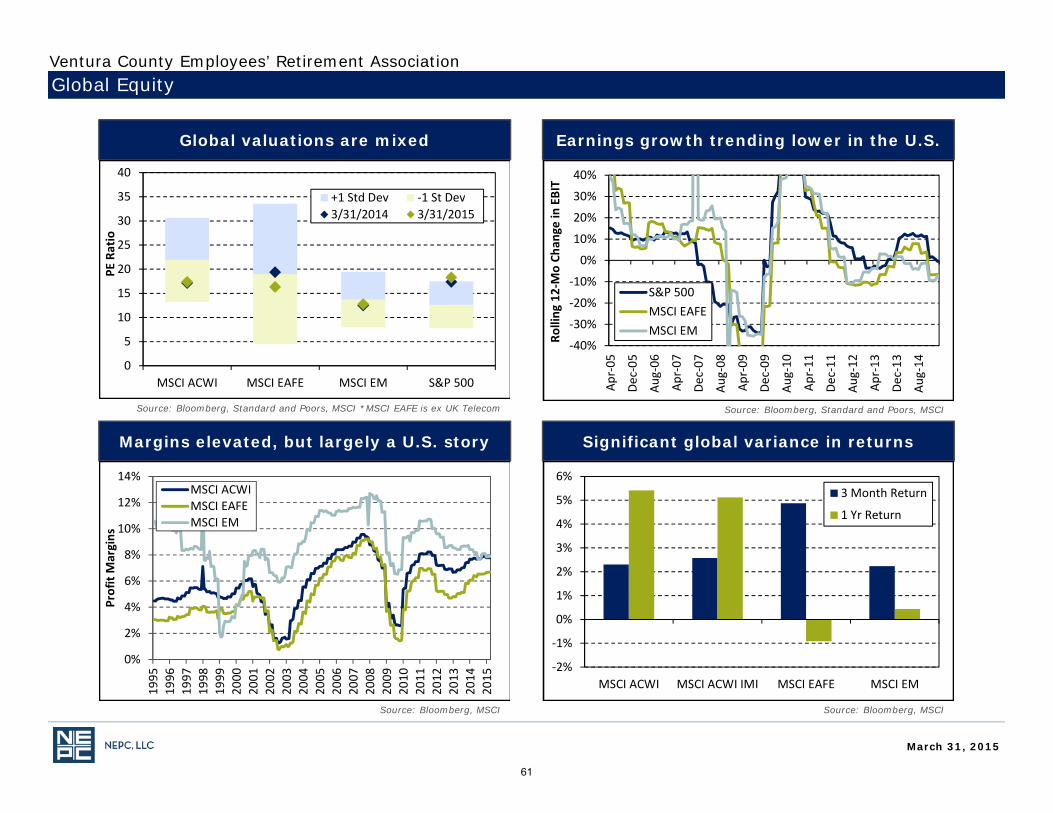
Global valuations are mixed Earnings growth trending lower in the U.S.
Margins elevated, but largely a U.S. story Significant global variance in returns
Global Equity
Source: Bloomberg, Standard and Poors, MSCI *MSCI EAFE is ex UK Telecom Source: Bloomberg, Standard and Poors, MSCI
Source: Bloomberg, MSCISource: Bloomberg, MSCI
0
5
10
15
20
25
30
35
40
MSCI ACWI MSCI EAFE MSCI EM S&P 500
PE Ratio
+1 Std Dev ‐1 St Dev3/31/2014 3/31/2015
‐40%
‐30%
‐20%
‐10%
0%
10%
20%
30%
40%
Apr‐05
Dec‐05
Aug‐06
Apr‐07
Dec‐07
Aug‐08
Apr‐09
Dec‐09
Aug‐10
Apr‐11
Dec‐11
Aug‐12
Apr‐13
Dec‐13
Aug‐14
Rolling
12‐Mo Ch
ange
in EBIT
S&P 500MSCI EAFEMSCI EM
0%
2%
4%
6%
8%
10%
12%
14%
1995
1996
1997
1998
1999
2000
2001
2002
2003
2004
2005
2006
2007
2008
2009
2010
2011
2012
2013
2014
2015
Profit Margins
MSCI ACWIMSCI EAFEMSCI EM
‐2%
‐1%
0%
1%
2%
3%
4%
5%
6%
MSCI ACWI MSCI ACWI IMI MSCI EAFE MSCI EM
3 Month Return
1 Yr Return
March 31, 2015
Ventura County Employees’ Retirement Association
61
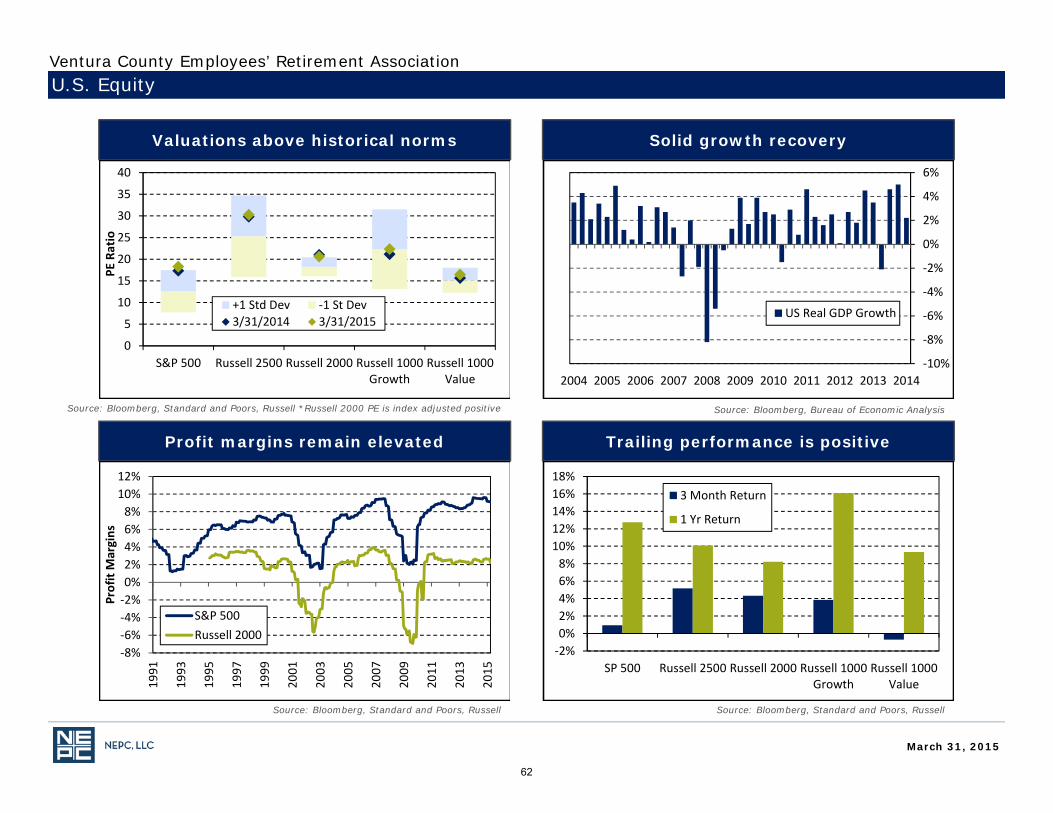
Valuations above historical norms Solid growth recovery
Profit margins remain elevated Trailing performance is positive
U.S. Equity
Source: Bloomberg, Standard and Poors, Russell *Russell 2000 PE is index adjusted positive Source: Bloomberg, Bureau of Economic Analysis
Source: Bloomberg, Standard and Poors, RussellSource: Bloomberg, Standard and Poors, Russell
0
5
10
15
20
25
30
35
40
S&P 500 Russell 2500 Russell 2000 Russell 1000Growth
Russell 1000Value
PE Ratio
+1 Std Dev ‐1 St Dev3/31/2014 3/31/2015
‐10%
‐8%
‐6%
‐4%
‐2%
0%
2%
4%
6%
20142013201220112010200920082007200620052004
US Real GDP Growth
‐8%‐6%‐4%‐2%0%2%4%6%8%
10%12%
1991
1993
1995
1997
1999
2001
2003
2005
2007
2009
2011
2013
2015
Profit Margins
S&P 500Russell 2000
‐2%0%2%4%6%8%
10%12%14%16%18%
SP 500 Russell 2500 Russell 2000 Russell 1000Growth
Russell 1000Value
3 Month Return
1 Yr Return
March 31, 2015
Ventura County Employees’ Retirement Association
62
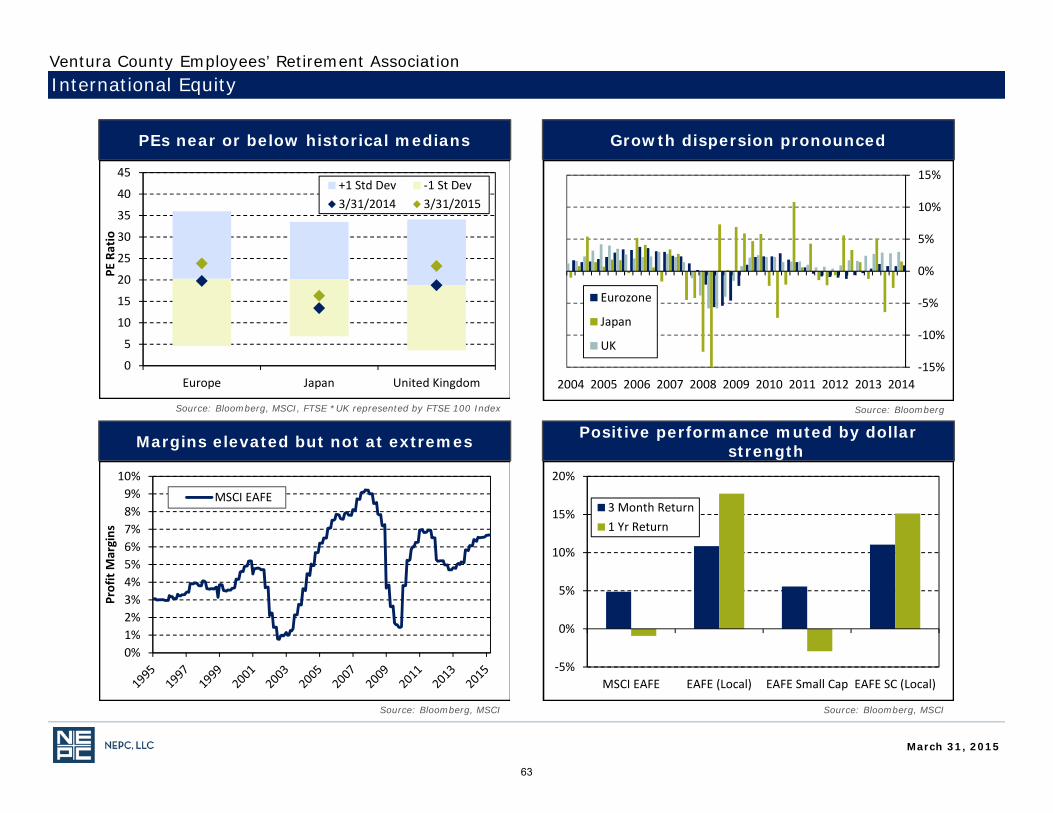
PEs near or below historical medians Growth dispersion pronounced
Margins elevated but not at extremes Positive performance muted by dollar strength
International Equity
Source: Bloomberg, MSCI, FTSE *UK represented by FTSE 100 Index Source: Bloomberg
Source: Bloomberg, MSCISource: Bloomberg, MSCI
0
5
10
15
20
25
30
35
40
45
Europe Japan United Kingdom
PE Ratio
+1 Std Dev ‐1 St Dev3/31/2014 3/31/2015
‐15%
‐10%
‐5%
0%
5%
10%
15%
20142013201220112010200920082007200620052004
Eurozone
Japan
UK
0%1%2%3%4%5%6%7%8%9%
10%
Profit Margins
MSCI EAFE
‐5%
0%
5%
10%
15%
20%
MSCI EAFE EAFE (Local) EAFE Small Cap EAFE SC (Local)
3 Month Return1 Yr Return
March 31, 2015
Ventura County Employees’ Retirement Association
63
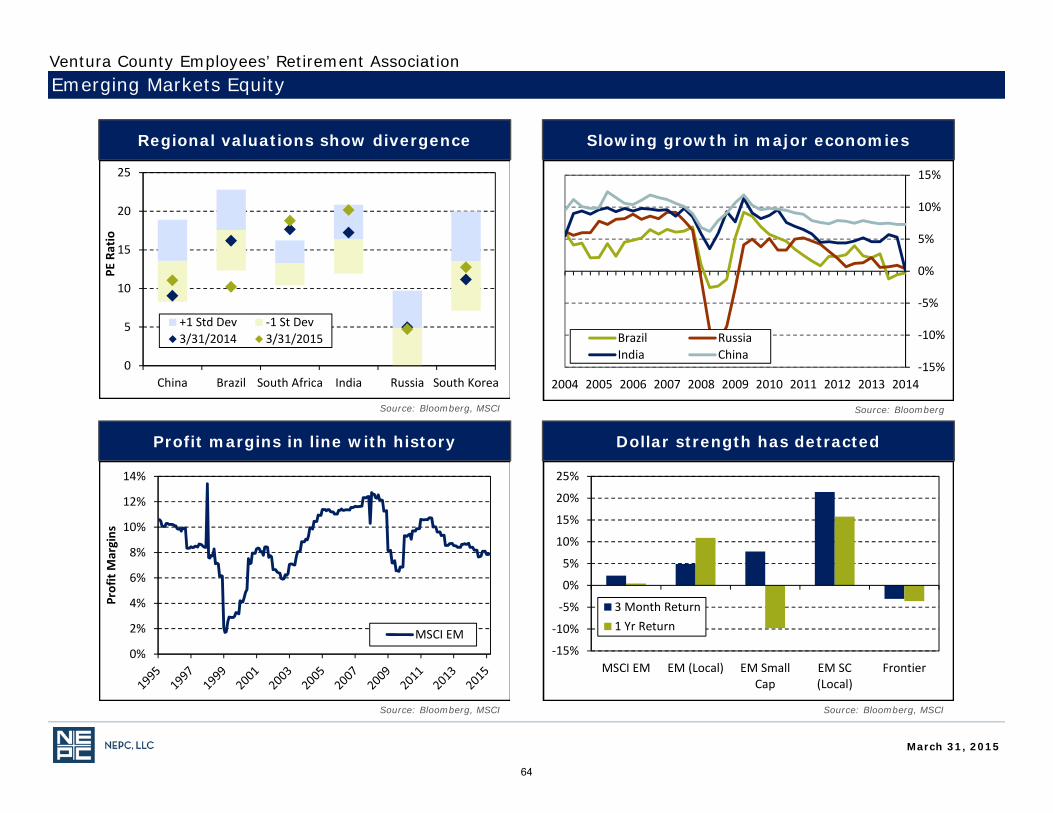
Regional valuations show divergence Slowing growth in major economies
Profit margins in line with history Dollar strength has detracted
Emerging Markets Equity
Source: Bloomberg, MSCI Source: Bloomberg
Source: Bloomberg, MSCISource: Bloomberg, MSCI
0
5
10
15
20
25
China Brazil South Africa India Russia South Korea
PE Ratio
+1 Std Dev ‐1 St Dev3/31/2014 3/31/2015
‐15%
‐10%
‐5%
0%
5%
10%
15%
20142013201220112010200920082007200620052004
Brazil RussiaIndia China
0%
2%
4%
6%
8%
10%
12%
14%
Profit Margins
MSCI EM‐15%
‐10%
‐5%
0%
5%
10%
15%
20%
25%
MSCI EM EM (Local) EM SmallCap
EM SC(Local)
Frontier
3 Month Return1 Yr Return
March 31, 2015
Ventura County Employees’ Retirement Association
64
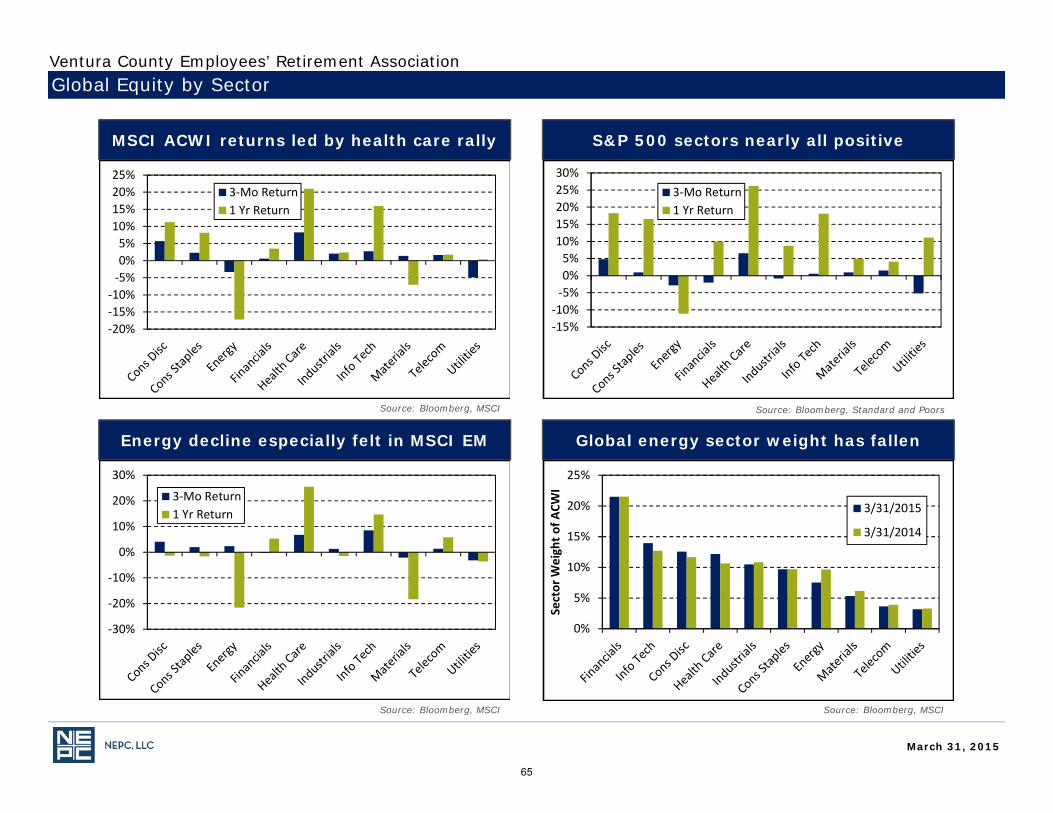
MSCI ACWI returns led by health care rally S&P 500 sectors nearly all positive
Energy decline especially felt in MSCI EM Global energy sector weight has fallen
Global Equity by Sector
Source: Bloomberg, MSCI Source: Bloomberg, Standard and Poors
Source: Bloomberg, MSCISource: Bloomberg, MSCI
‐20%‐15%‐10%‐5%0%5%
10%15%20%25%
3‐Mo Return1 Yr Return
‐15%‐10%‐5%0%5%
10%15%20%25%30%
3‐Mo Return1 Yr Return
‐30%
‐20%
‐10%
0%
10%
20%
30%
3‐Mo Return1 Yr Return
0%
5%
10%
15%
20%
25%
Sector W
eigh
t of A
CWI
3/31/2015
3/31/2014
March 31, 2015
Ventura County Employees’ Retirement Association
65
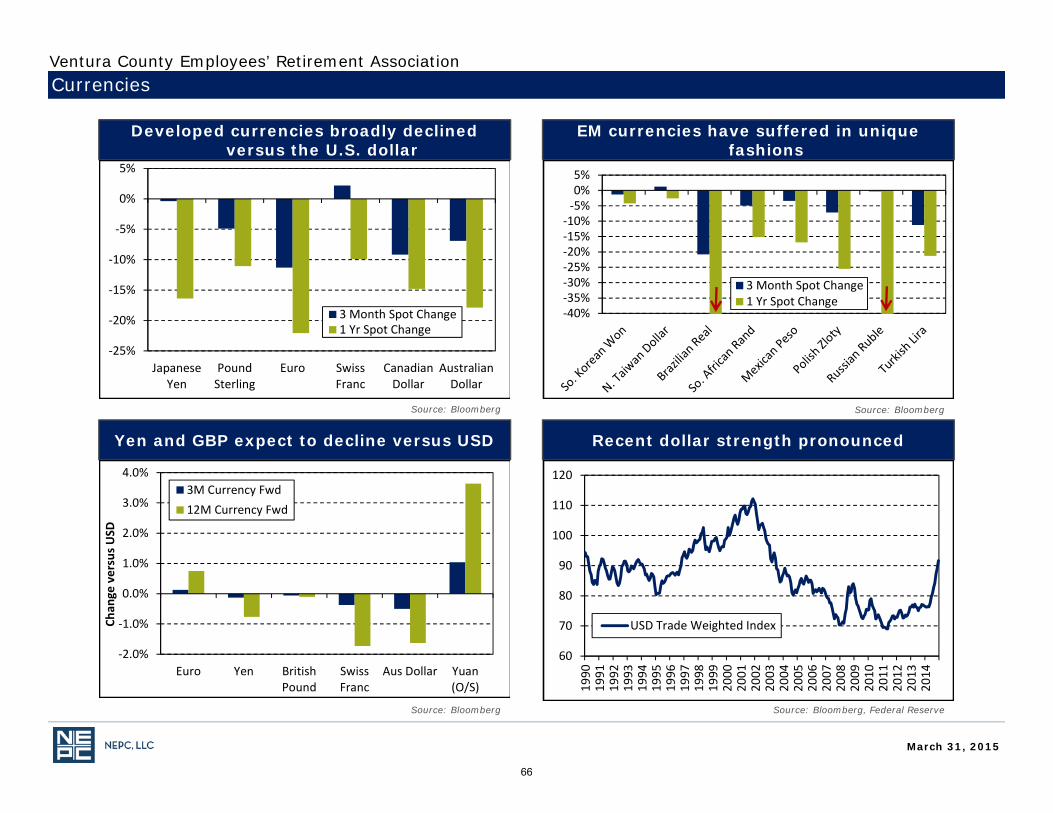
Developed currencies broadly declined versus the U.S. dollar
EM currencies have suffered in unique fashions
Yen and GBP expect to decline versus USD Recent dollar strength pronounced
Currencies
Source: Bloomberg Source: Bloomberg
Source: Bloomberg, Federal ReserveSource: Bloomberg
60
70
80
90
100
110
120
1990
1991
1992
1993
1994
1995
1996
1997
1998
1999
2000
2001
2002
2003
2004
2005
2006
2007
2008
2009
2010
2011
2012
2013
2014
USD Trade Weighted Index
‐25%
‐20%
‐15%
‐10%
‐5%
0%
5%
JapaneseYen
PoundSterling
Euro SwissFranc
CanadianDollar
AustralianDollar
3 Month Spot Change1 Yr Spot Change
‐40%‐35%‐30%‐25%‐20%‐15%‐10%‐5%0%5%
3 Month Spot Change1 Yr Spot Change
‐2.0%
‐1.0%
0.0%
1.0%
2.0%
3.0%
4.0%
Euro Yen BritishPound
SwissFranc
Aus Dollar Yuan(O/S)
Chan
ge versus U
SD
3M Currency Fwd12M Currency Fwd
March 31, 2015
Ventura County Employees’ Retirement Association
66
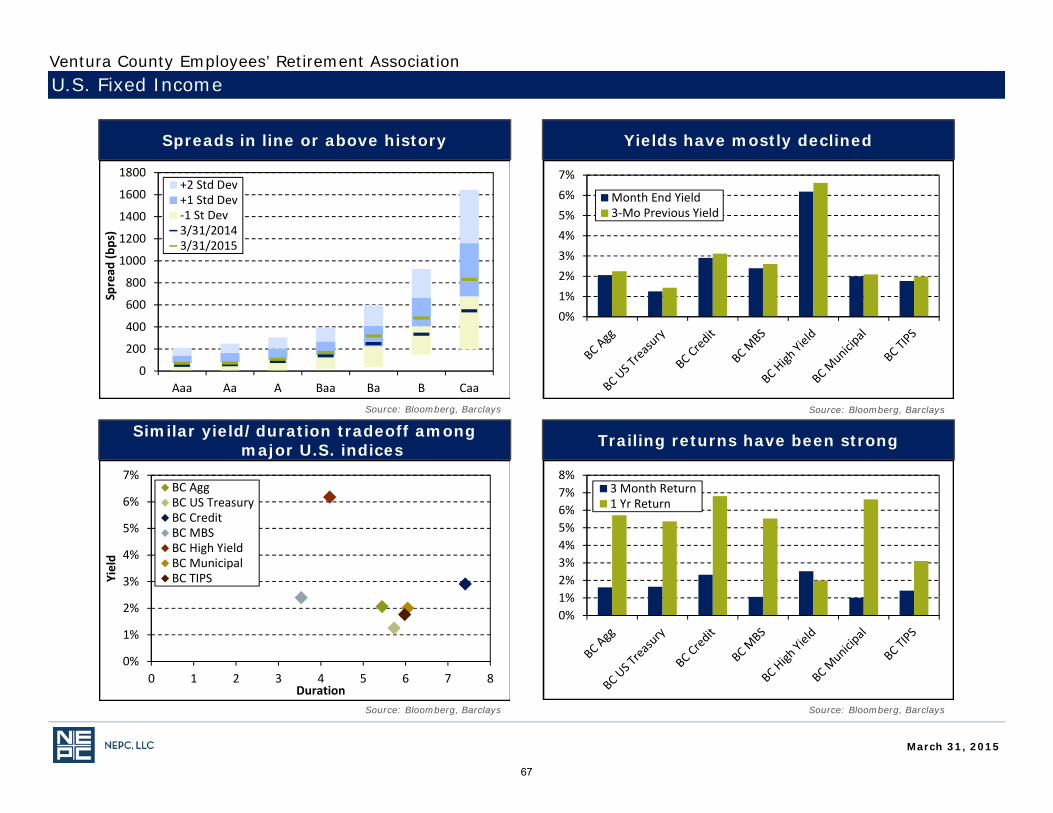
Spreads in line or above history Yields have mostly declined
Similar yield/duration tradeoff among major U.S. indices Trailing returns have been strong
U.S. Fixed Income
Source: Bloomberg, Barclays Source: Bloomberg, Barclays
Source: Bloomberg, BarclaysSource: Bloomberg, Barclays
0
200
400
600
800
1000
1200
1400
1600
1800
Aaa Aa A Baa Ba B Caa
Spread
(bps)
+2 Std Dev+1 Std Dev‐1 St Dev3/31/20143/31/2015
0%1%2%3%4%5%6%7%
Month End Yield3‐Mo Previous Yield
0%
1%
2%
3%
4%
5%
6%
7%
0 1 2 3 4 5 6 7 8
Yield
Duration
BC AggBC US TreasuryBC CreditBC MBSBC High YieldBC MunicipalBC TIPS
0%1%2%3%4%5%6%7%8%
3 Month Return1 Yr Return
March 31, 2015
Ventura County Employees’ Retirement Association
67
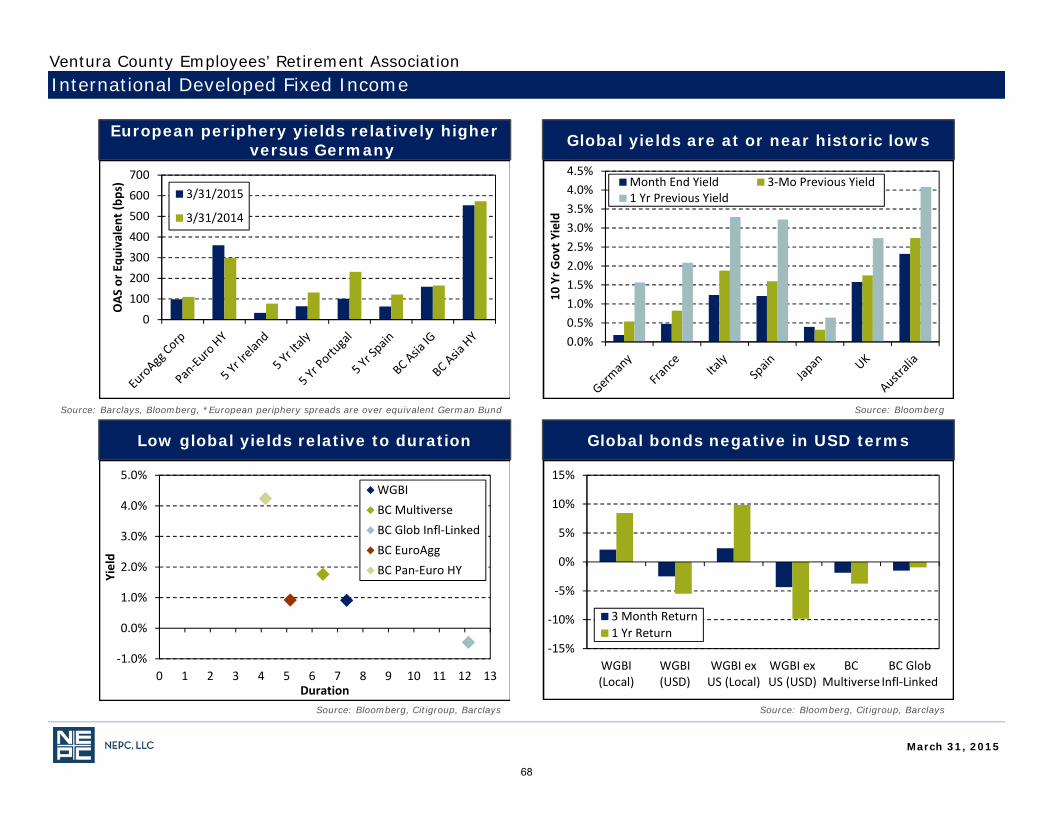
European periphery yields relatively higher versus Germany Global yields are at or near historic lows
Low global yields relative to duration Global bonds negative in USD terms
International Developed Fixed Income
Source: Barclays, Bloomberg, *European periphery spreads are over equivalent German Bund Source: Bloomberg
Source: Bloomberg, Citigroup, BarclaysSource: Bloomberg, Citigroup, Barclays
0
100
200
300400
500
600
700
OAS
or E
quivalen
t (bp
s) 3/31/2015
3/31/2014
0.0%0.5%1.0%1.5%2.0%2.5%3.0%3.5%4.0%4.5%
10 Yr G
ovt Y
ield
Month End Yield 3‐Mo Previous Yield1 Yr Previous Yield
‐1.0%
0.0%
1.0%
2.0%
3.0%
4.0%
5.0%
0 1 2 3 4 5 6 7 8 9 10 11 12 13
Yield
Duration
WGBIBC MultiverseBC Glob Infl‐LinkedBC EuroAggBC Pan‐Euro HY
‐15%
‐10%
‐5%
0%
5%
10%
15%
WGBI(Local)
WGBI(USD)
WGBI exUS (Local)
WGBI exUS (USD)
BCMultiverse
BC GlobInfl‐Linked
3 Month Return1 Yr Return
March 31, 2015
Ventura County Employees’ Retirement Association
68
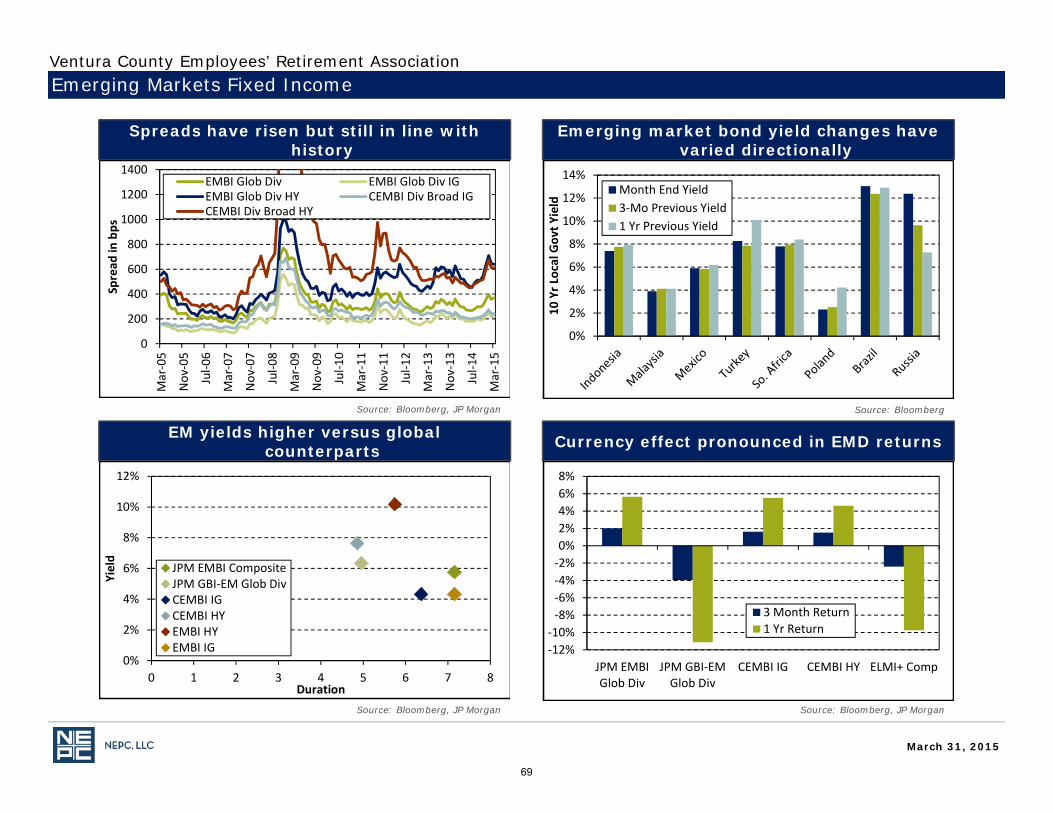
Spreads have risen but still in line with history
Emerging market bond yield changes have varied directionally
EM yields higher versus global counterparts Currency effect pronounced in EMD returns
Emerging Markets Fixed Income
Source: Bloomberg, JP Morgan Source: Bloomberg
Source: Bloomberg, JP MorganSource: Bloomberg, JP Morgan
0
200
400
600
800
1000
1200
1400Mar‐05
Nov‐05
Jul‐0
6
Mar‐07
Nov‐07
Jul‐0
8
Mar‐09
Nov‐09
Jul‐1
0
Mar‐11
Nov‐11
Jul‐1
2
Mar‐13
Nov‐13
Jul‐1
4
Mar‐15
Spread
in bps
EMBI Glob Div EMBI Glob Div IGEMBI Glob Div HY CEMBI Div Broad IGCEMBI Div Broad HY
0%
2%
4%
6%
8%
10%
12%
14%
10 Yr L
ocal Gov
t Yield
Month End Yield3‐Mo Previous Yield1 Yr Previous Yield
0%
2%
4%
6%
8%
10%
12%
0 1 2 3 4 5 6 7 8
Yield
Duration
JPM EMBI CompositeJPM GBI‐EM Glob DivCEMBI IGCEMBI HYEMBI HYEMBI IG ‐12%
‐10%‐8%‐6%‐4%‐2%0%2%4%6%8%
JPM EMBIGlob Div
JPM GBI‐EMGlob Div
CEMBI IG CEMBI HY ELMI+ Comp
3 Month Return1 Yr Return
March 31, 2015
Ventura County Employees’ Retirement Association
69
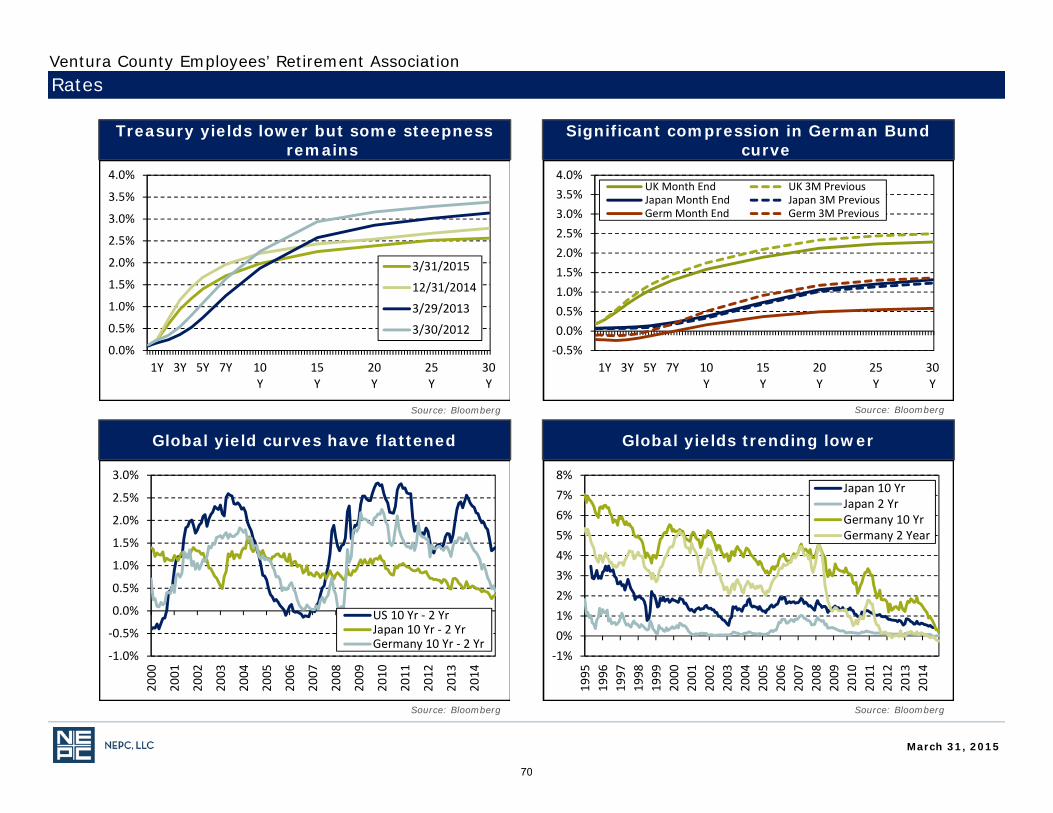
Treasury yields lower but some steepness remains
Significant compression in German Bund curve
Global yield curves have flattened Global yields trending lower
Rates
Source: Bloomberg Source: Bloomberg
Source: BloombergSource: Bloomberg
0.0%
0.5%
1.0%
1.5%
2.0%
2.5%
3.0%
3.5%
4.0%
1Y 3Y 5Y 7Y 10Y
15Y
20Y
25Y
30Y
3/31/2015
12/31/2014
3/29/2013
3/30/2012‐0.5%0.0%0.5%1.0%1.5%2.0%2.5%3.0%3.5%4.0%
1Y 3Y 5Y 7Y 10Y
15Y
20Y
25Y
30Y
UK Month End UK 3M PreviousJapan Month End Japan 3M PreviousGerm Month End Germ 3M Previous
‐1.0%
‐0.5%
0.0%
0.5%
1.0%
1.5%
2.0%
2.5%
3.0%
2000
2001
2002
2003
2004
2005
2006
2007
2008
2009
2010
2011
2012
2013
2014
US 10 Yr ‐ 2 YrJapan 10 Yr ‐ 2 YrGermany 10 Yr ‐ 2 Yr
‐1%0%1%2%3%4%5%6%7%8%
1995
1996
1997
1998
1999
2000
2001
2002
2003
2004
2005
2006
2007
2008
2009
2010
2011
2012
2013
2014
Japan 10 YrJapan 2 YrGermany 10 YrGermany 2 Year
March 31, 2015
Ventura County Employees’ Retirement Association
70
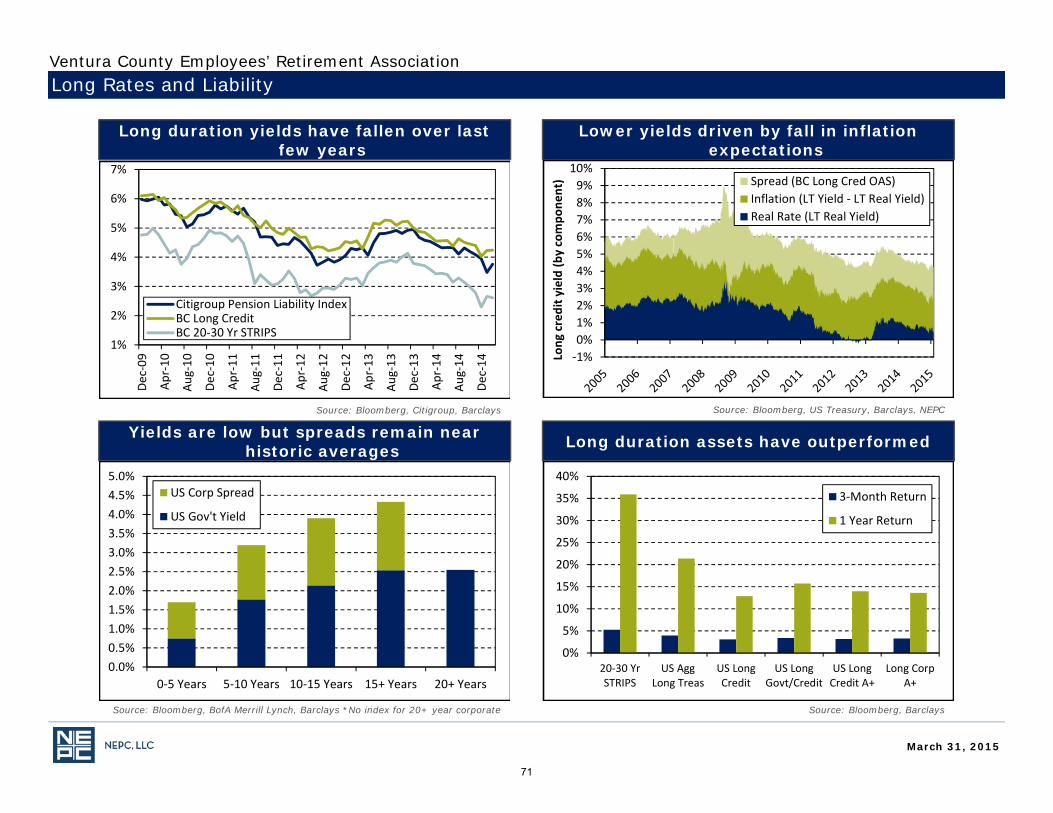
Long duration yields have fallen over last few years
Lower yields driven by fall in inflation expectations
Yields are low but spreads remain near historic averages Long duration assets have outperformed
Long Rates and Liability
Source: Bloomberg, Citigroup, Barclays Source: Bloomberg, US Treasury, Barclays, NEPC
Source: Bloomberg, BarclaysSource: Bloomberg, BofA Merrill Lynch, Barclays *No index for 20+ year corporate
1%
2%
3%
4%
5%
6%
7%
Dec‐09
Apr‐10
Aug‐10
Dec‐10
Apr‐11
Aug‐11
Dec‐11
Apr‐12
Aug‐12
Dec‐12
Apr‐13
Aug‐13
Dec‐13
Apr‐14
Aug‐14
Dec‐14
Citigroup Pension Liability IndexBC Long CreditBC 20‐30 Yr STRIPS
‐1%0%1%2%3%4%5%6%7%8%9%
10%
Long
credit y
ield (b
y compo
nent) Spread (BC Long Cred OAS)
Inflation (LT Yield ‐ LT Real Yield)Real Rate (LT Real Yield)
0.0%0.5%1.0%1.5%2.0%2.5%3.0%3.5%4.0%4.5%5.0%
0‐5 Years 5‐10 Years 10‐15 Years 15+ Years 20+ Years
US Corp Spread
US Gov't Yield
0%
5%
10%
15%
20%
25%
30%
35%
40%
20‐30 YrSTRIPS
US AggLong Treas
US LongCredit
US LongGovt/Credit
US LongCredit A+
Long CorpA+
3‐Month Return
1 Year Return
March 31, 2015
Ventura County Employees’ Retirement Association
71
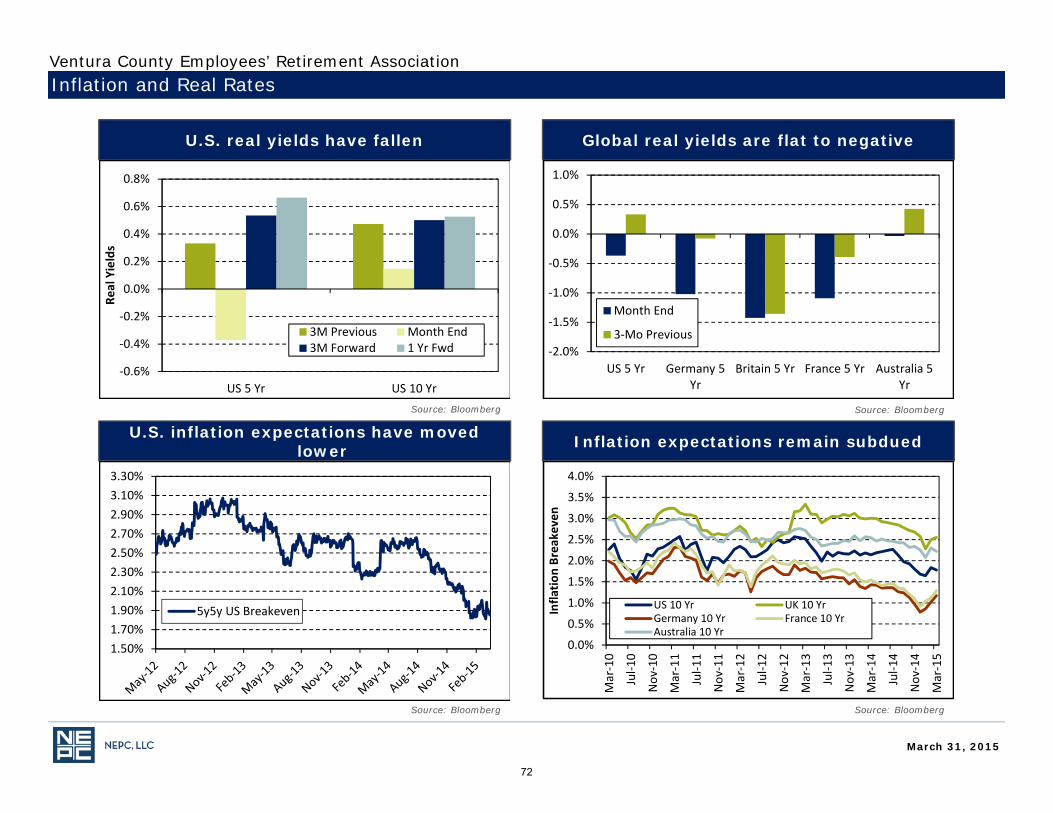
U.S. real yields have fallen Global real yields are flat to negative
U.S. inflation expectations have moved lower Inflation expectations remain subdued
Inflation and Real Rates
Source: Bloomberg Source: Bloomberg
Source: BloombergSource: Bloomberg
‐0.6%
‐0.4%
‐0.2%
0.0%
0.2%
0.4%
0.6%
0.8%
US 5 Yr US 10 Yr
Real Yields
3M Previous Month End3M Forward 1 Yr Fwd ‐2.0%
‐1.5%
‐1.0%
‐0.5%
0.0%
0.5%
1.0%
US 5 Yr Germany 5Yr
Britain 5 Yr France 5 Yr Australia 5Yr
Month End
3‐Mo Previous
1.50%1.70%1.90%2.10%2.30%2.50%2.70%2.90%3.10%3.30%
5y5y US Breakeven
0.0%
0.5%
1.0%
1.5%
2.0%
2.5%
3.0%
3.5%
4.0%
Mar‐10
Jul‐1
0
Nov
‐10
Mar‐11
Jul‐1
1
Nov
‐11
Mar‐12
Jul‐1
2
Nov
‐12
Mar‐13
Jul‐1
3
Nov
‐13
Mar‐14
Jul‐1
4
Nov
‐14
Mar‐15
Infla
tion Breakeven
US 10 Yr UK 10 YrGermany 10 Yr France 10 YrAustralia 10 Yr
March 31, 2015
Ventura County Employees’ Retirement Association
72
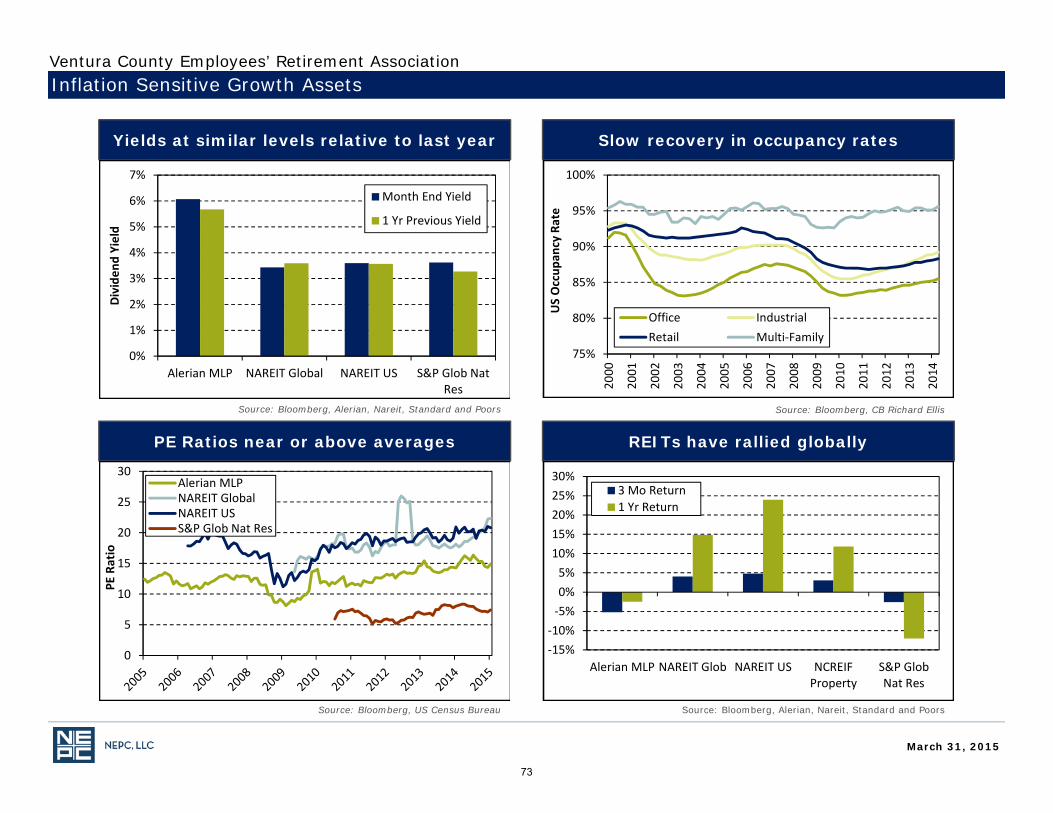
Yields at similar levels relative to last year Slow recovery in occupancy rates
PE Ratios near or above averages REITs have rallied globally
Inflation Sensitive Growth Assets
0
500
1000
1500
2000
2500
1985
1986
1988
1990
1992
1994
1996
1997
1999
2001
2003
2005
2007
2008
2010
2012
2014
Thou
sand
s
US Housing Starts SA
Source: Bloomberg, Alerian, Nareit, Standard and Poors Source: Bloomberg, CB Richard Ellis
Source: Bloomberg, US Census Bureau Source: Bloomberg, Alerian, Nareit, Standard and Poors
0%
1%
2%
3%
4%
5%
6%
7%
Alerian MLP NAREIT Global NAREIT US S&P Glob NatRes
Dividen
d Yield
Month End Yield
1 Yr Previous Yield
75%
80%
85%
90%
95%
100%
2000
2001
2002
2003
2004
2005
2006
2007
2008
2009
2010
2011
2012
2013
2014
US Occup
ancy Rate
Office IndustrialRetail Multi‐Family
0
5
10
15
20
25
30
PE Ratio
Alerian MLPNAREIT GlobalNAREIT USS&P Glob Nat Res
‐15%‐10%‐5%0%5%
10%15%20%25%30%
Alerian MLP NAREIT Glob NAREIT US NCREIFProperty
S&P GlobNat Res
3 Mo Return1 Yr Return
March 31, 2015
Ventura County Employees’ Retirement Association
73
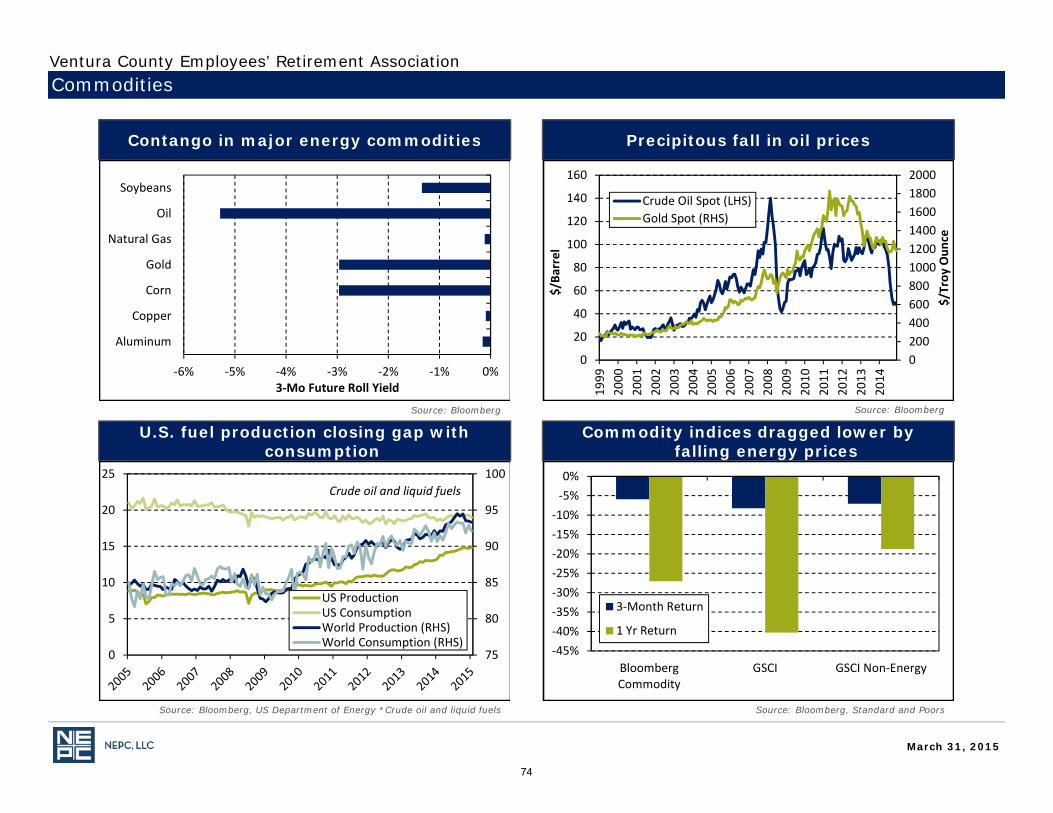
Contango in major energy commodities Precipitous fall in oil prices
U.S. fuel production closing gap with consumption
Commodity indices dragged lower by falling energy prices
Commodities
Source: Bloomberg Source: Bloomberg
Source: Bloomberg, Standard and PoorsSource: Bloomberg, US Department of Energy *Crude oil and liquid fuels
‐6% ‐5% ‐4% ‐3% ‐2% ‐1% 0%
Aluminum
Copper
Corn
Gold
Natural Gas
Oil
Soybeans
3‐Mo Future Roll Yield
0200400600800100012001400160018002000
0
20
40
60
80
100
120
140
160
1999
2000
2001
2002
2003
2004
2005
2006
2007
2008
2009
2010
2011
2012
2013
2014
$/Troy
Oun
ce
$/Ba
rrel
Crude Oil Spot (LHS)Gold Spot (RHS)
75
80
85
90
95
100
0
5
10
15
20
25
US ProductionUS ConsumptionWorld Production (RHS)World Consumption (RHS)
Crude oil and liquid fuels
‐45%‐40%‐35%‐30%‐25%‐20%‐15%‐10%‐5%0%
BloombergCommodity
GSCI GSCI Non‐Energy
3‐Month Return
1 Yr Return
March 31, 2015
Ventura County Employees’ Retirement Association
74
• The client’s custodian bank is NEPC’s preferred data source unless otherwise directed. NEPC reconciles custodian data to manager data. If the custodian cannot provide accurate data, manager data may be used.
• Trailing time period returns are determined by geometrically linking the holding period returns from the first full month after inception to the report date. Rates of return are annualized when the time period is longer than a year. Performance is presented gross and/or net of fees as indicated.
• For managers funded in the middle of a month, the ‘since inception’ return will start with the first full month, although actual inception dates and cash flows are included in all respective Composite calculations.
• This report may contain forward-looking statements that are based on NEPC’s estimates, opinions and beliefs, but NEPC cannot guarantee that any plan will achieve its targeted return or meet other goals.
Reporting Methodology
March 31, 2015
Ventura County Employees’ Retirement Association
75
• Past performance is no guarantee of future results.
• All investments carry some level of risk. Diversification and other asset allocation techniques are not guaranteed to ensure profit or protect against losses.
• Some index returns displayed in this report or used in calculation of a policy, allocation or custom benchmark may not be available from the source or may be preliminary and subject to change.
• NEPC’s source for portfolio pricing, calculation of accruals, and transaction information is the Plan’s custodian bank. Information on market indices and security characteristics is received from other sources external to NEPC. While NEPC has exercised reasonable professional care in preparing this report, we cannot guarantee the accuracy of all source information contained herein.
• This report is provided as a management aid for the client’s internal use only. Performance in this report does not constitute a recommendation by NEPC.
• This report may contain confidential or proprietary information and may not be copied or redistributed to any party not legally entitled to receive it.
Information Disclaimer
March 31, 2015
Ventura County Employees’ Retirement Association
76