Embed Size (px)
Citation preview
Pansuriya Dip* DR. Varun Sheel Department of Computer Science Associate Professor, Space And And Engineering, UVPCE Atmospheric Science Division.GANPAT UNIVERSITY- KHERVA, MAHESANA. Physical Research Laboratory, INDIA.
Abstract: Cluster is the mainly organized into Three Parts High Availability, Load Balancing, High - Performance Now Days the Importance of the High – Performance is Being Increasing too much for the different Kind of Applications Such as Medical Imaging, Scientific Research, Oil and Gas , Bio Science and Data Warehousing etc. High Performance Computing (HPC) allows scientists and engineers to solve complex science, engineering and business problems using applications that require high bandwidth, low latency networking, and very high compute capabilities. HPC is also use for the Weather Research and Forecasting and also for the WRF-CHEM model. WRF-CHEM model is mainly use for the Weather Research and Forecast Modeling plus it is combining with Chemistry Emissions .WRF-CHEM model is use for the build the Chemistry code and for the simulation. Weather Prediction model to Simulate Release and Transport of Constitution. The Main purpose of this Paper is the how to Simulate the WRF-CHEM Model with your HPC, and comparison of the Carbon Monoxide (CO) and Ozone (O3) for the Kedarnath of the 04-06-2013 and 14-06-2013. This shows the value of Co according to different Times and different Heights.
Abbreviate: WRF-CHEM: Weather Research and Forecasting- Chemical Model HPC: High Performance Computing PBS: Portable Batch System
1. INTRODUCTIONWRF model is the numerical weather
prediction model which is used for the atmospheric research as well as operational forecasting. WRF allows researches for the produce simulation of the either real data or idealized atmospheric conditions. WRF-CHEM model is the version of the WRF model that is used for the simulation of the emissions, turbulent mixing, gases, and aerosols.
WRF model was begun in that the time around of the 1990 and developed by the National Center for Atmospheric Research (NCAR) and it is also handled by the University Corporation for Atmospheric Research (UCAR) both are the main developer organization of the WRF-CHEM model. The WRF - CHEM model is built with the WRF model framework and during the run need for selection of the different parameters which are connected the chemistry schemes. It is used for the Idealized Simulation of weather, regional or the climate research. WRF model is working for the Numerical and software development, Data Assimilation, Analysis and the verification. WRF model can be run from the all over the place as we want by setting the Grid on the HPC. The WRF - CHEM model had added chemistry predictions options which are mostly used by scientist of research industries or the personal analysis and for the scientific organization. WRF-CHEM Model
requires the more computational time for the run on the HPC so we have to use the High Performance cluster otherwise there will be the chances of the crashing. For running the WRF-CHEM model need to submit the PBS Script on the cluster and also can run the this model to different nodes by setting the memory and CPU. For the High Effective analysis need to run on the High performance cluster and setting the very low resolution during the setting up on the WPS system. Meteorological and the chemical models are the use for the different physical parameterizations. So these two are the different processes are process as occurred simultaneously in the real atmosphere and also can affect to each other.
In the recent years WRF-CHEM has been developed as a new product as a new generation air quality modeling system and its meteorological and chemical models are the fully coupled “ONLINE”. Its sub models are uses same vertical as well as horizontal coordinates for the physical parameterization and there is no any type of temporal interpolation and it gives chemistry and meteorological processes as the feedback [1]. In this paper, the concentration of the carbon monoxide and ozone in the Kedarnath during the mainly effect of flood occurred in the Jun 14-18 ,2013 was investigated using the WRF-CHEM model it also calculates the concentration of carbon monoxide and ozone during the Jun 04-08 ,2013.
Second section of this paper gives a brief description of the WRF-CHEM model, GDAS DataAnd Emisssions. Third section presents contain the simulation results were carefully compared the two
different simulations which was run for the same resolution. The main conclusion was summarized in The finally.
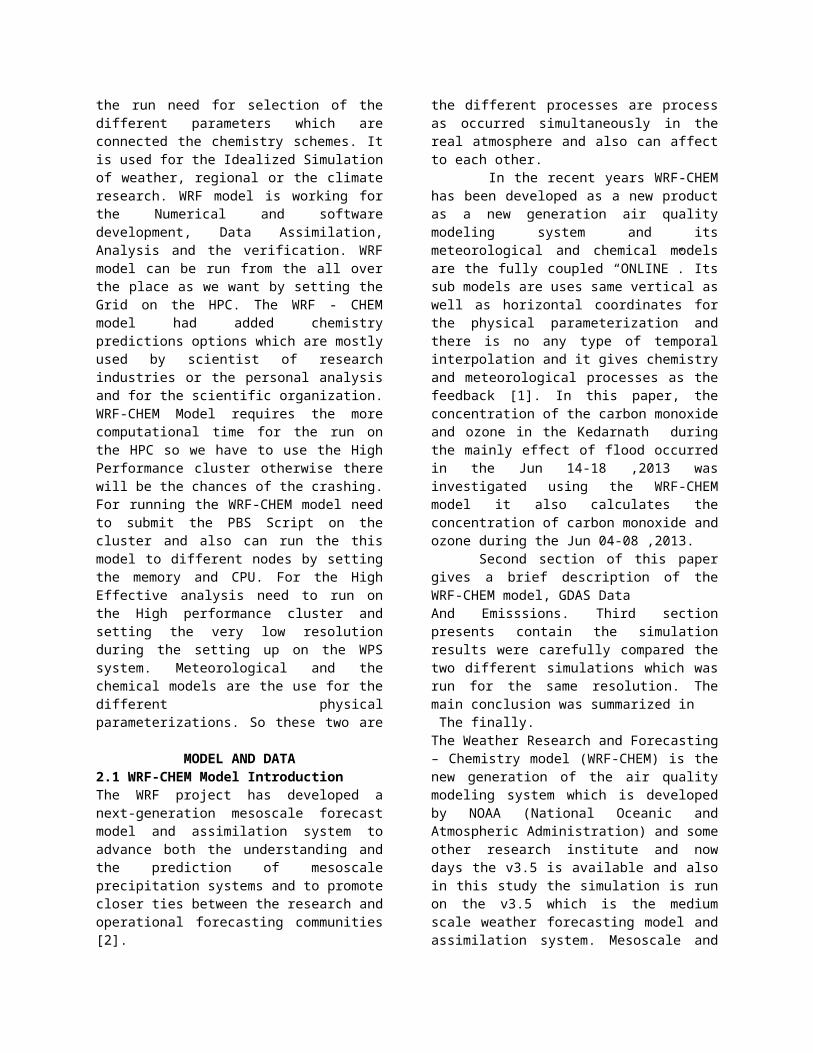
MODEL AND DATA2.1 WRF-CHEM Model IntroductionThe WRF project has developed a next-generation mesoscale forecast model and assimilation system to advance both the understanding and the prediction of mesoscale precipitation systems and to promote closer ties between the research and operational forecasting communities [2].The Weather Research and Forecasting – Chemistry model (WRF-CHEM) is the new generation of the air quality modeling system which is developed by NOAA (National Oceanic and Atmospheric Administration) and some other research institute and now days the v3.5 is available and also in this study the simulation is run on the v3.5 which is the medium scale weather forecasting model and assimilation system. Mesoscale and Microscale Meteorology (MMM) division of the NCAR is supporting the subset of the WRF-CHEM code (V3.5) that includes mainly below parts[3]:
WRF Pre–Processing System (WPS) WRF Data Assimilation (WRF-DA) system which
currently supports 3DVAR 4DVAR,And hybrid data assimilation capabilities of that model.
WRF Solver, which includes chemistry library only. Post –Processing and visualization tool (NC
view ,Vapor, Matlab)
Fig 1. WRF–CHEM Model Architecture[3]
The WRF - CHEM model should need to complete the below process for the successful simulation.
1. Procedure the first WRF model for the particular region as per requirement [or with the nesting grid also available] with the chemistry option is turned off. [Simulate as the simple like WRF Model].
2. Generate the emissions data file for that domain and chemical mechanism and write that into the intermediate file.
3. Convert emissions of into the WRF chemical input files.
4. Then simulate the WRF model for the domain for the chemistry.
For the Advanced Research WRF it need to high performance HPC, list of supported libraries, software and the compiler, scripting language and the post-processing of the netcdf file. Chemistry code is not supported in the older version of WRF V2 it all are separated from WRFV3.02.2 GDAS Data and Emissions.
The main difference between the WRF and the WRF-CHEM model is that in the WRF-CHEM is coming from the emissions part which is added during the simulation of the simple WRF model so this additional data provided by the WPS (dust emission fields), or during the initialization time of the real.exe, or during the WRF solver. The real.exe include the emissions such as the biomass burning, biogenic emissions, GOCART background fields and during the execution time of the WRF solver includes the emission such as Anthropogenic emissions, Volcanic emissions and the some of possible namelist options related to the WRF-CHEM model set during the simulation time in the namelist. input.
For the simulation of the WRF-CHEM model need to GDAS Data (Global Data Assimilation System) for the different resolution and the difference frequency, such as the 3Hour, 6 Hour, 12 hours, daily. It can be downloaded from the http://nomad1.ncep.noaa.gov/ and the for the 6 hour frequency download from the http://nomad1.ncep.noaa.gov/cgi-bin/ftp2u_gdas.sh.The Emissions are useable from the Global_Emissions_v3 that includes the biogenic emissions, carbon density, EDGA, fire data, RETRO, GOCART.
The WRF - CHEM model requires lots of memory for the computations and the nodes for the additional variable settings. For the successful simulation the configuration and compilation process, distributed parallel memory option is also variation in the selection.
3. Modeling Results and Discussion3.1 Model Setting.
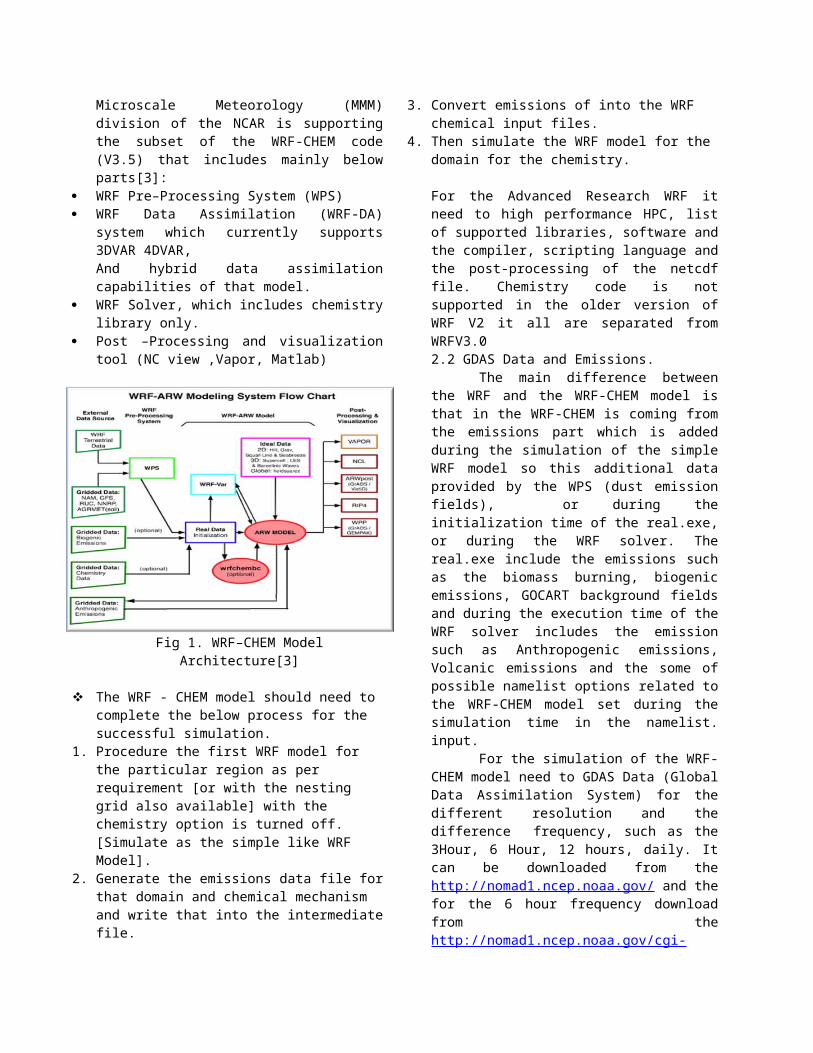
The First Simulation run was conducted for the "2013-06-04_00:00:00" to the "2013-06-08_00:00:00" and the Second Simulation was conducted for the “2013-06-14_00:00:00" to the "2013-06-18_00:00:00". There was only one domain and it was defined using the Lambert projection, which was seen in figure2.
Fig. 2. Domain setting of the model for the simulation.
The Domain covers the some portion of the India and that covers the whole part of Jammu-Kashmir, Himachal Pradesh, Uttarakhand, Nepal, Delhi, Punjab, Haryana. Kedarnath covers in the state of Uttarakhand with center point at 30.7300° N, 79.0700° E. The Meteorological fields and the boundary conditions are from GDAS global reanalysis data with the 0.5° × 0.5° resolution. The domain setting and the configuration of both simulation options are shown in Table 1.
SimulationJune 04 to 08 ,2013
SimulationJune 14 to
18,2013Horizontal Gird
(χ, γ )61,61 61,61
Grid Spacing 25Km 25kmTime Step 100 100
Interval History 180 180
Table 1 Simulation Configuration for WRF-CHEM model
This Simulation was run on the HPC of Physical Research Laboratory, Navrangpura. The basic configuration of that cluster is as Table 2.Application WRF-CHEM V3.5.1Processors Quad Core Quad Socket
AMD Opteron 8360 2.5GHz Processor
Memory 64 GB Per NodeHard Disk Capacity 10 TB HDDOperating System Red Hat Linux
Enterprise 5.2Compiler Intel I fortMessage Passing Interface (MPI)
MPI 3.2.1 Library
Table 2 Configuration of HPC at PRL [4].
For the specific region need to set the PBS script for the each simulation cause of submitting the job on the HPC so both of simulation the PBS script specification is same as Table 3.
Node 3CPUS 5
Memory 9GBTotal No of CPUs for
simulation5*3=15
Total No of Memory for simulation
9*3=27GB
Table 3 Specification for the PBS script[4]
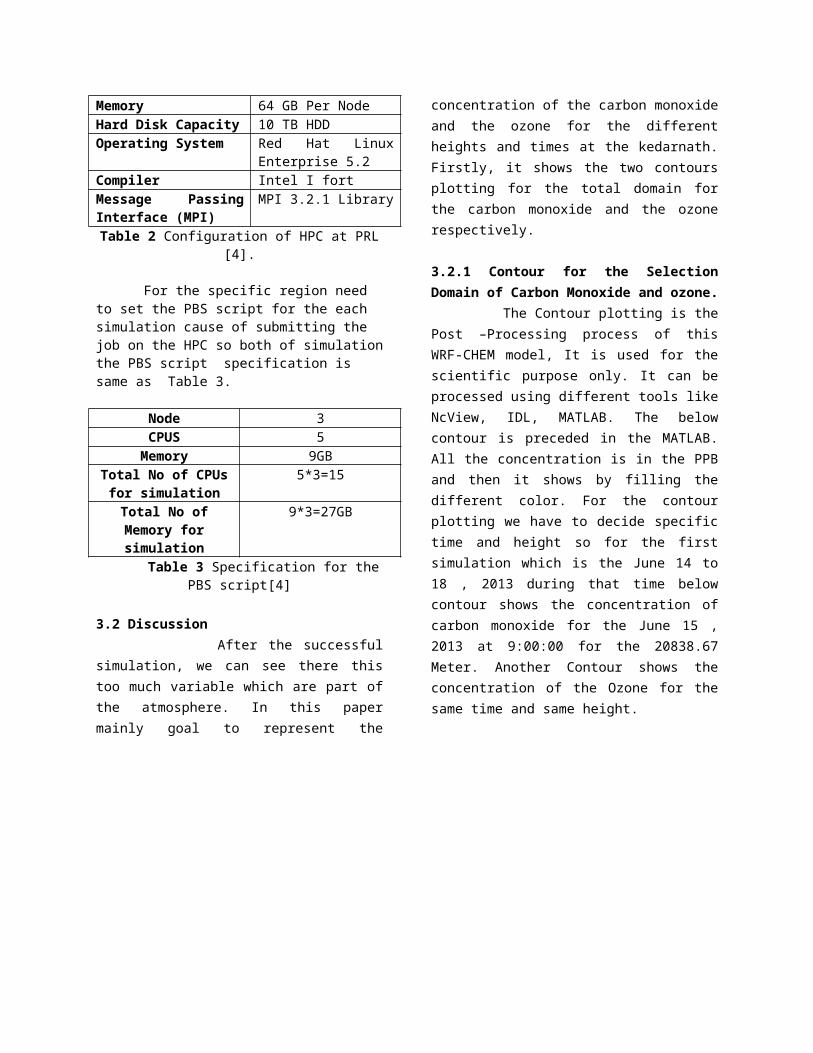
3.2 Discussion After the successful simulation, we can see there this too much variable which are part of the atmosphere. In this paper mainly goal to represent the concentration of the carbon monoxide and the ozone for the different heights and times at the kedarnath. Firstly, it shows the two contours plotting for the total domain for the carbon monoxide and the ozone respectively.
3.2.1 Contour for the Selection Domain of Carbon Monoxide and ozone. The Contour plotting is the Post –Processing process of this WRF-CHEM model, It is used for the scientific purpose only. It can be processed using
different tools like NcView, IDL, MATLAB. The below contour is preceded in the MATLAB. All the concentration is in the PPB and then it shows by filling the different color. For the contour plotting we have to decide specific time and height so for the first simulation which is the June 14 to 18 , 2013 during
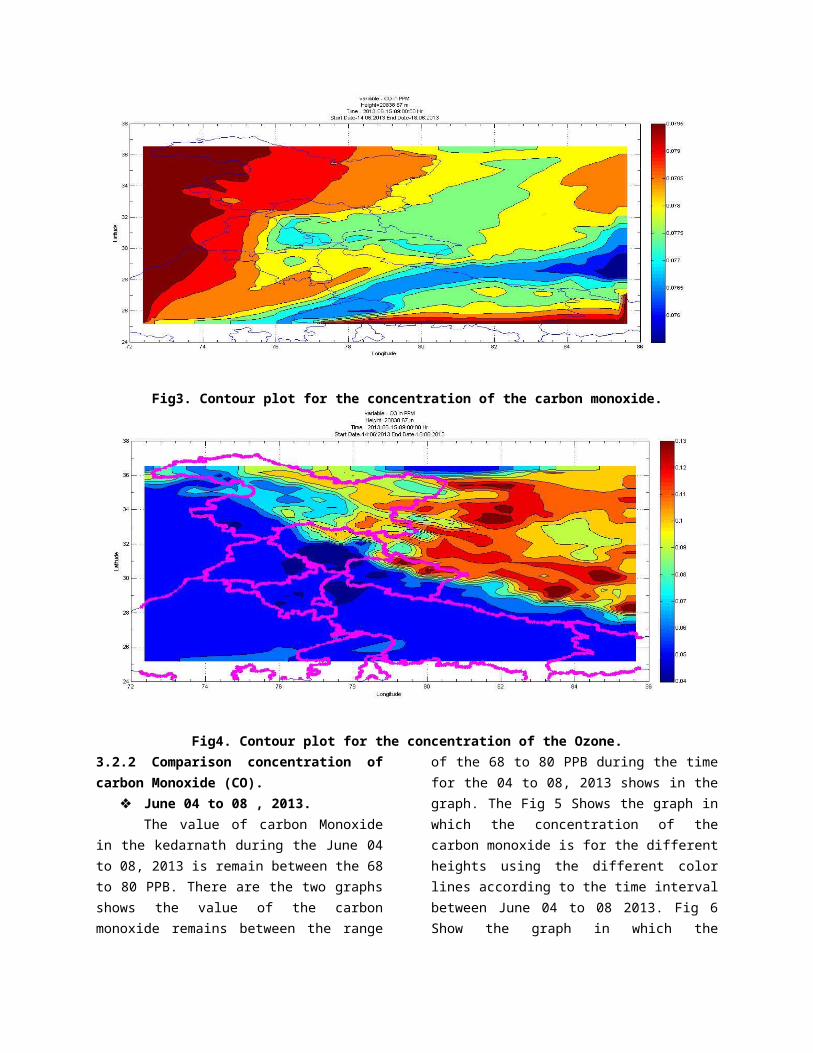
that time below contour shows the concentration of carbon monoxide for the June 15 , 2013 at 9:00:00 for the 20838.67 Meter. Another Contour shows the concentration of the Ozone for the same time and same height.
Fig3. Contour plot for the concentration of the carbon monoxide.
Fig4. Contour plot for the concentration of the Ozone.3.2.2 Comparison concentration of carbon Monoxide (CO).
June 04 to 08 , 2013.The value of carbon Monoxide in the
kedarnath during the June 04 to 08, 2013 is remain between the 68 to 80 PPB. There are the two graphs
shows the value of the carbon monoxide remains between the range of the 68 to 80 PPB during the time for the 04 to 08, 2013 shows in the graph. The Fig 5 Shows the graph in which the concentration of the carbon monoxide is for the different heights using the different color lines according to the time interval
between June 04 to 08 2013. Fig 6 Show the graph in which the concentration of the carbon monoxide for the different heights in the different graphs.
Fig 5. Concentration of CO for the different heights in single graph.
Fig 6. Concentration of the CO for different heights in different graphs.
June 14 to 18 , 2013The concentration of carbon Monoxide
in the kedarnath during the June 14 to 18, 2013 was remained among the 68 to 80 PPB. There are the two graphs shows the value of the carbon monoxide remains between the range of the 68 to 80 PPB during the time for the 14 to 18, 2013 shows
in the graph. The Fig 7 Shows the graph in which the concentration of the carbon monoxide is for the different heights using the different color lines according to the time interval between June 14 to 18, 2013. Fig 8 Show the graph in which the concentration of the carbon monoxide for the different heights in the different graphs.
Fig 7. Concentration of CO for the different heights in single graph.
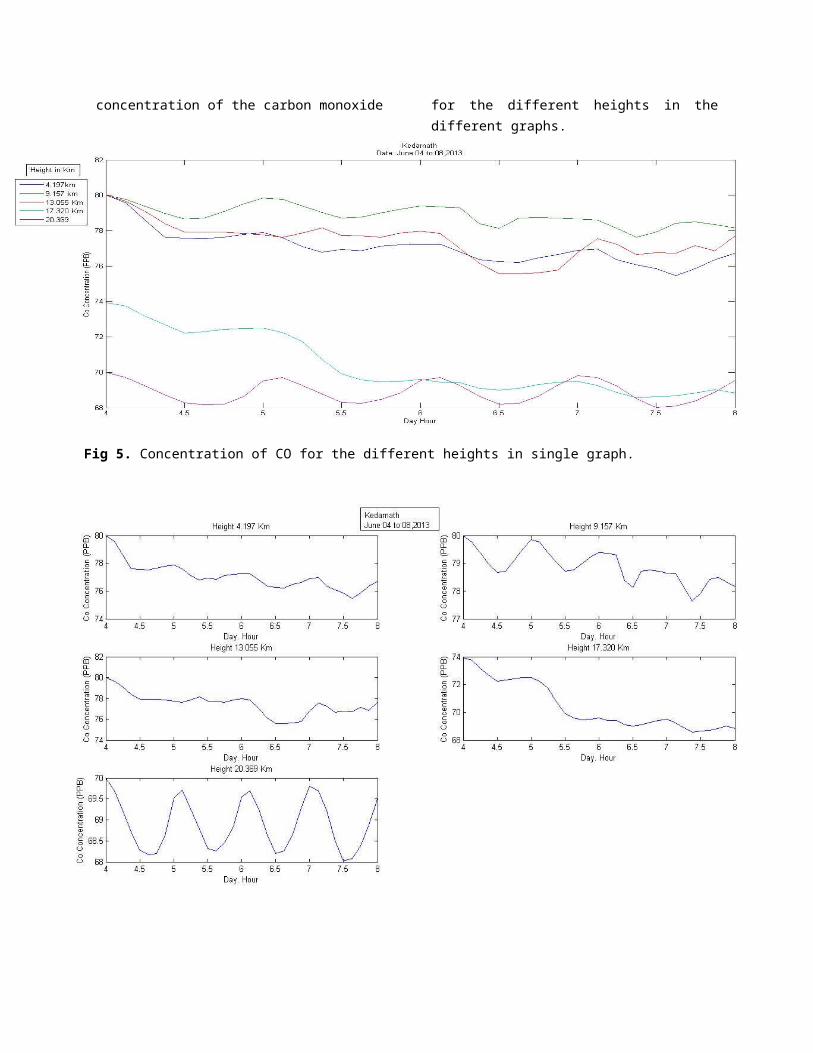
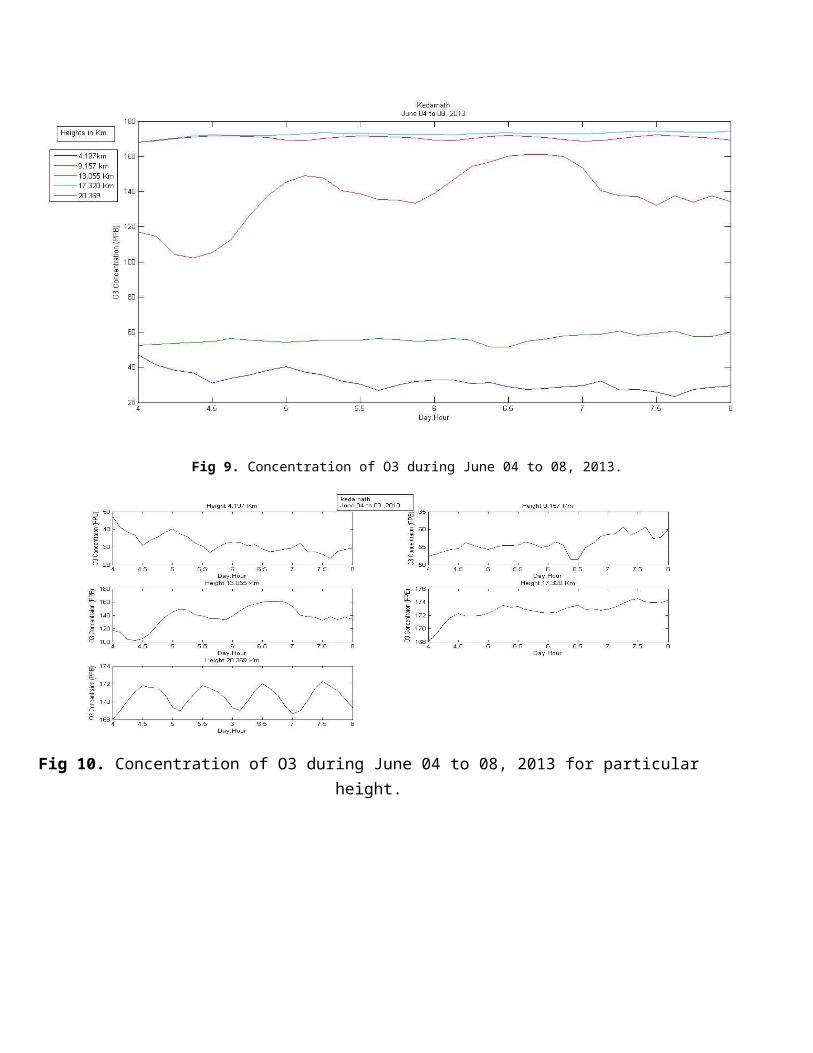
Fig 8. Concentration of the CO for different heights in different graphs.3.2.3 Comparison concentration of the Ozone (O3). The concentration of ozone at Kedarnath during the June 04 to 08, 2013 was remained between 27 to 173 PPB.Fig 9 shows the graph for Kedarnath with the different Heights using colored lines according to the Time and Figure 10 shows the graph for the same place with different heights of each particular height.
The concentration of ozone at Kedarnath during the June 14 to 18, 2013 was remained between 35 to 174 PPB. Fig 11 shows the graph for Kedarnath with the different Heights using colored lines according to the Time and Figure 12 shows the graph for the same place with different heights of each particular height.
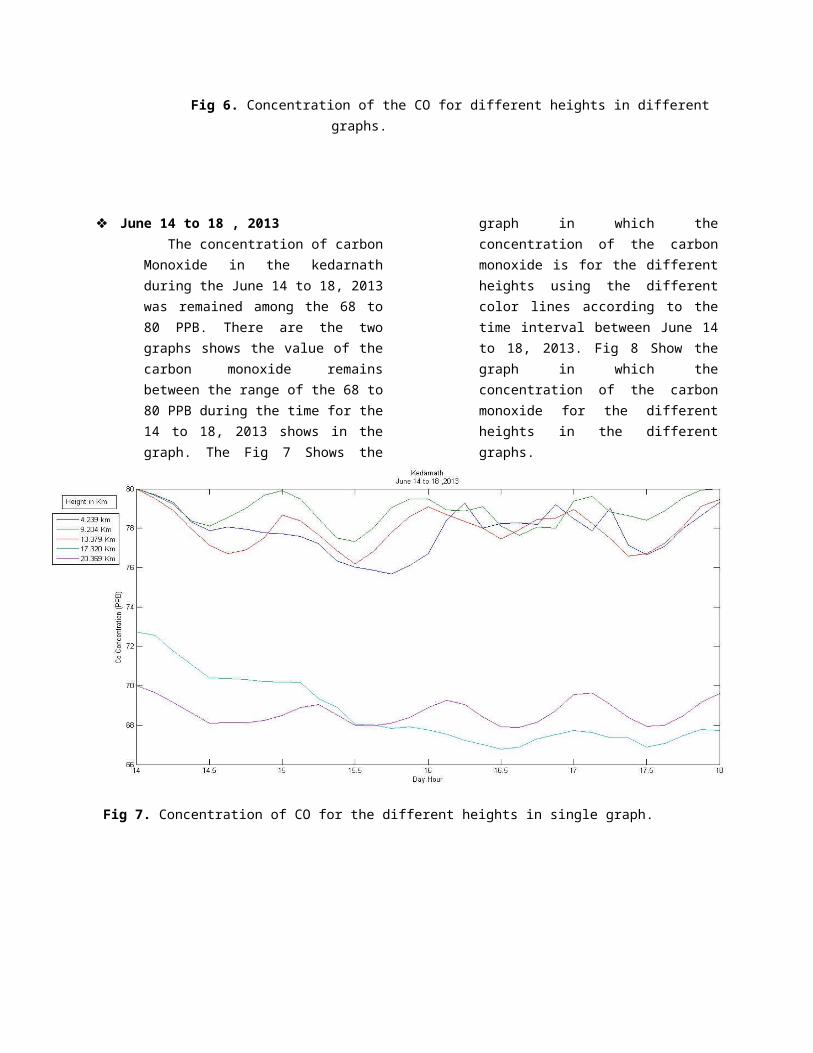
Fig 9. Concentration of O3 during June 04 to 08, 2013.
Fig 10. Concentration of O3 during June 04 to 08, 2013 for particular height.
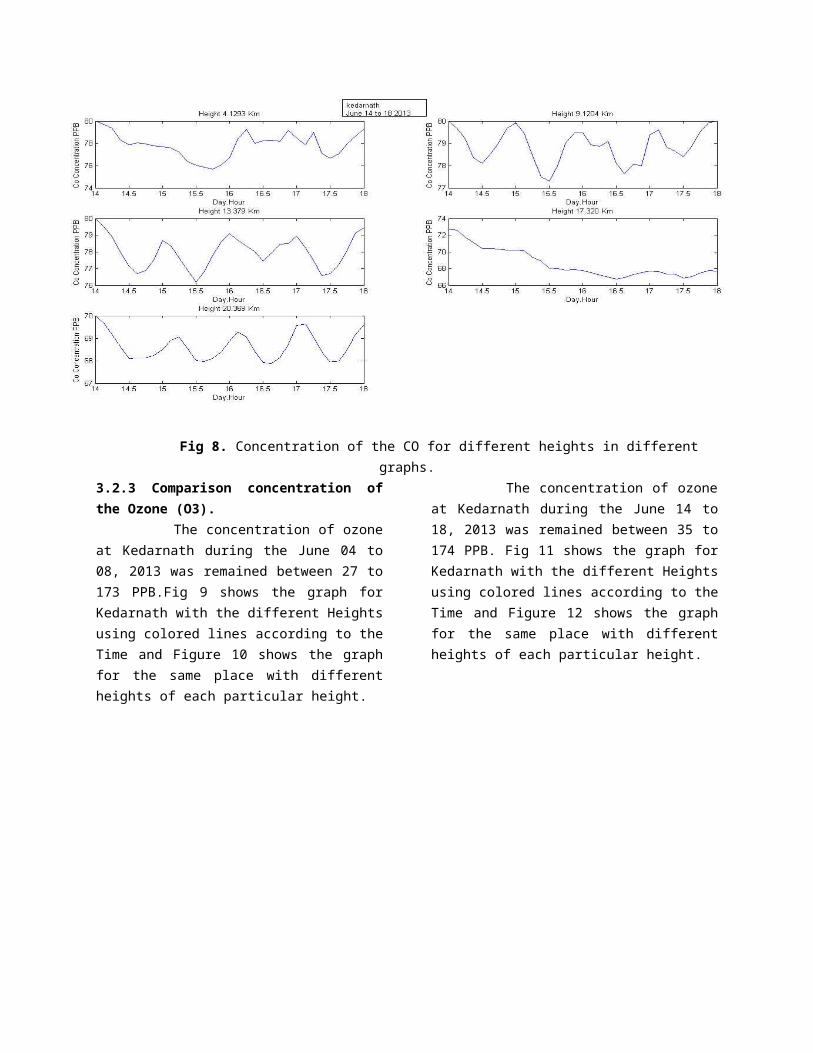
Fig 11. Concentration of O3 during June 14 to 18, 2013.
Fig 12. Concentration of O3 during June 14 to 18, 2013 for Particular Height
4. Conclusion: In This paper a survey gives the details of the WRF-CHEM Model which simulates through the HPC Cluster. WRF-CHEM Model is used by the scientists in the organizations for the weather predictions and the researches, also for the scientific computations on the basis of change in the atmosphere. The WRF - CHEM simulation runs in a distributed parallel environment only on the HPC cluster and giving us better performance with chemistry data. We had completed the simulation for the same grid for the different times and then using the MATLAB tool through PRL I had plotted the
graphs according to the different heights and times. Finally, measure the value of the Carbon Monoxide and Ozone in the kedarnath area in the Uttrakhand. Thus, can easily see the difference in values according to time and height variation.
5. Acknowledgement: A special thanks to Dr. Varun Sheel, who is the Scientist at Atmospheric Science Division at Space Applications Centre in Physical Research laboratory, Ahmedabad for providing his guidance to establish WRF- CHEM model at PRL.
6. References.[1]. THE WEATHER RESEARCH AND FORECAST MODEL:SOFTWARE ARCHITECTURE AND PERFORMANCE J MICHALAKES, J. DUDHIA, D. GILL, T. HENDERSON,J. KLEMP, W. SKAMAROCK, W. WANG [2] Fully coupled ‘‘online’’ chemistry within the WRF model Georg A. Grella,, Steven E. Peckhama, RainerSchmitzc,Stuart A. McKeenb,Gregory Frostb, William C. Skamarockd, Brian Edere
[3] WRF/CEHM Version 3.2 user’s GuideDr. Steven E. PeckhamD r . G e o r g A . G r e l l Dr. StuartA. McKeen
[4] Benchmark of WRF-CHEM Model on HPC Cluster :Shukla Foram P, Dr varun Sheel,
[5] PRL Intranet www.prl.res.in


![[XLS] · Web viewThrissur Damoh Jagatsinghpur Dausa Madurai Banda Murshidabad ARUBA Medak Upper Siang Karbi Anglong Jehanabad Raigarh Mahesana Mewat Srinagar Latehar Davanagere Thiruvananthapuram](https://img.pdfslide.net/doc/110x75/5ae7b5797f8b9a8b2b8ef615/xls-viewthrissur-damoh-jagatsinghpur-dausa-madurai-banda-murshidabad-aruba-medak.jpg)