Embed Size (px)
Citation preview
Visualization and the Big Health Data Storm
Chris WhiteSr. Vice PresidentFEi Systems
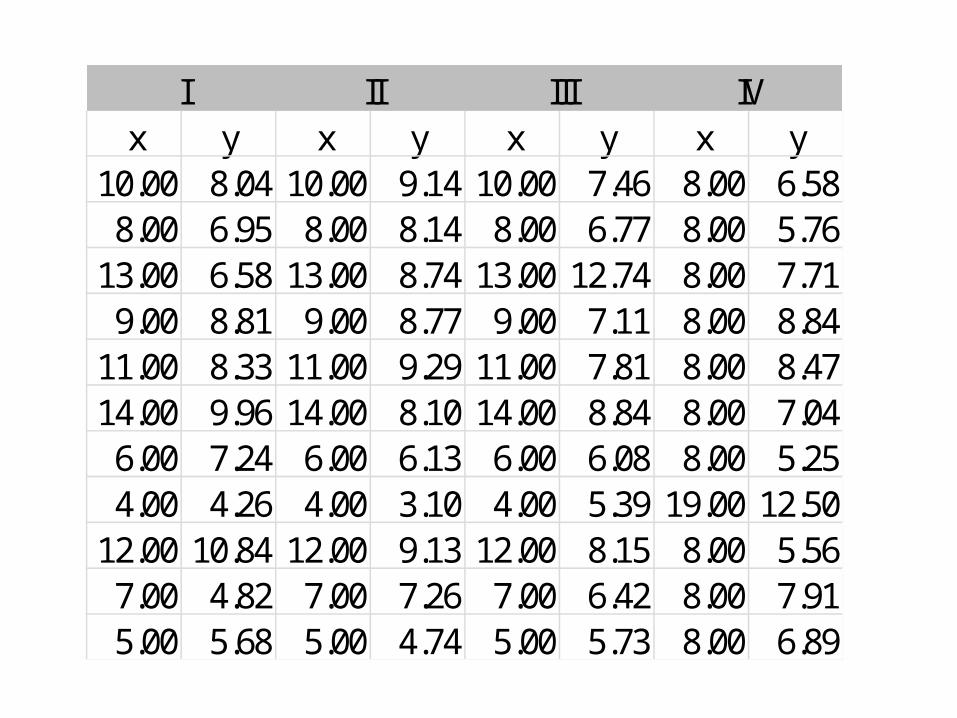
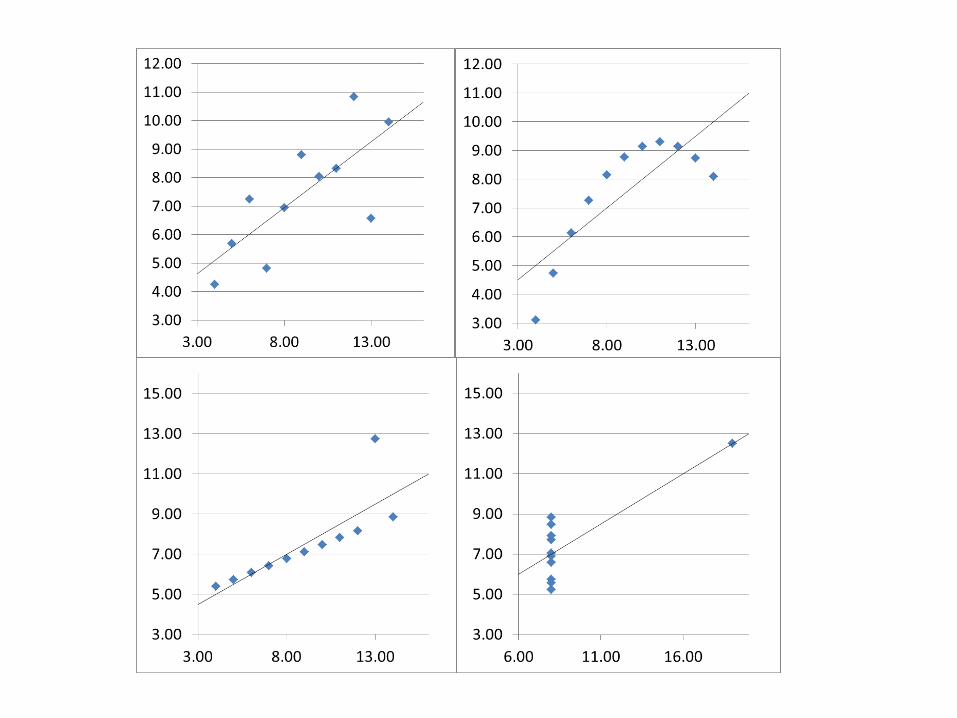
x y x y x y x y10.00 8.04 10.00 9.14 10.00 7.46 8.00 6.58
8.00 6.95 8.00 8.14 8.00 6.77 8.00 5.7613.00 6.58 13.00 8.74 13.00 12.74 8.00 7.71
9.00 8.81 9.00 8.77 9.00 7.11 8.00 8.8411.00 8.33 11.00 9.29 11.00 7.81 8.00 8.4714.00 9.96 14.00 8.10 14.00 8.84 8.00 7.04
6.00 7.24 6.00 6.13 6.00 6.08 8.00 5.254.00 4.26 4.00 3.10 4.00 5.39 19.00 12.50
12.00 10.84 12.00 9.13 12.00 8.15 8.00 5.567.00 4.82 7.00 7.26 7.00 6.42 8.00 7.915.00 5.68 5.00 4.74 5.00 5.73 8.00 6.89
I II III IV
Source: Anscombe’s Quartet
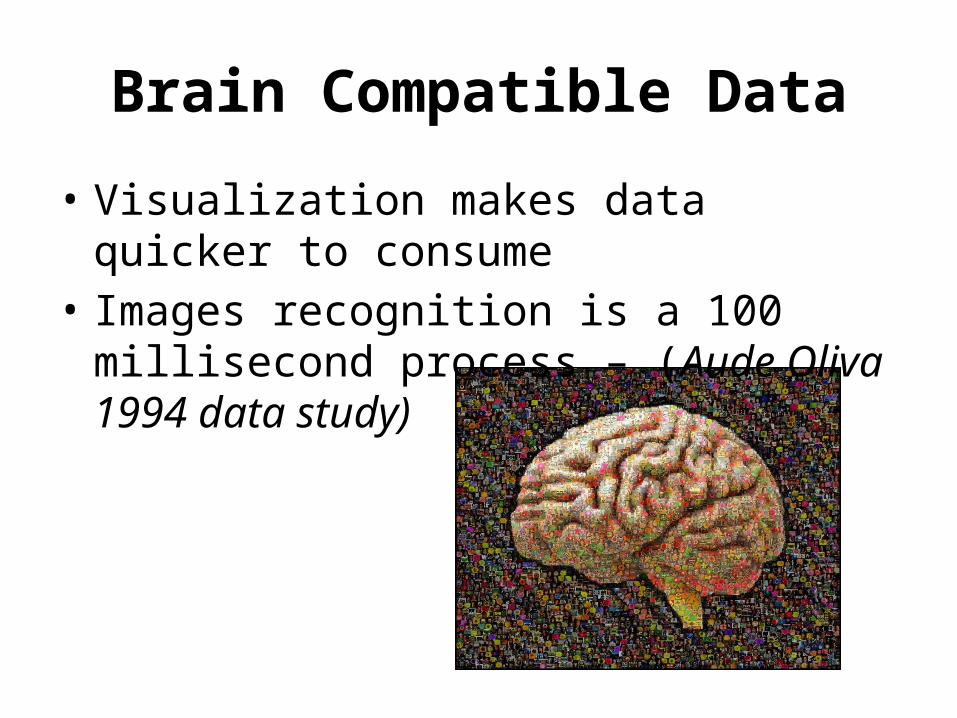
Brain Compatible Data
• Visualization makes data quicker to consume• Images recognition is a 100 millisecond
process – (Aude Oliva 1994 data study)
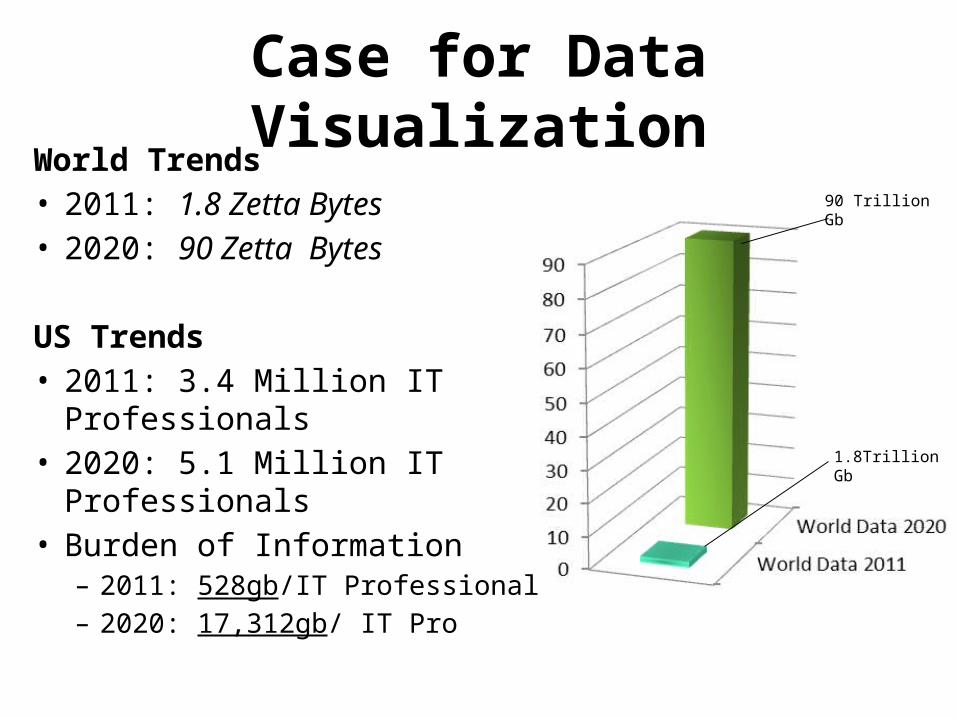
90 Trillion Gb
1.8Trillion Gb
Case for Data VisualizationWorld Trends• 2011: 1.8 Zetta Bytes• 2020: 90 Zetta Bytes
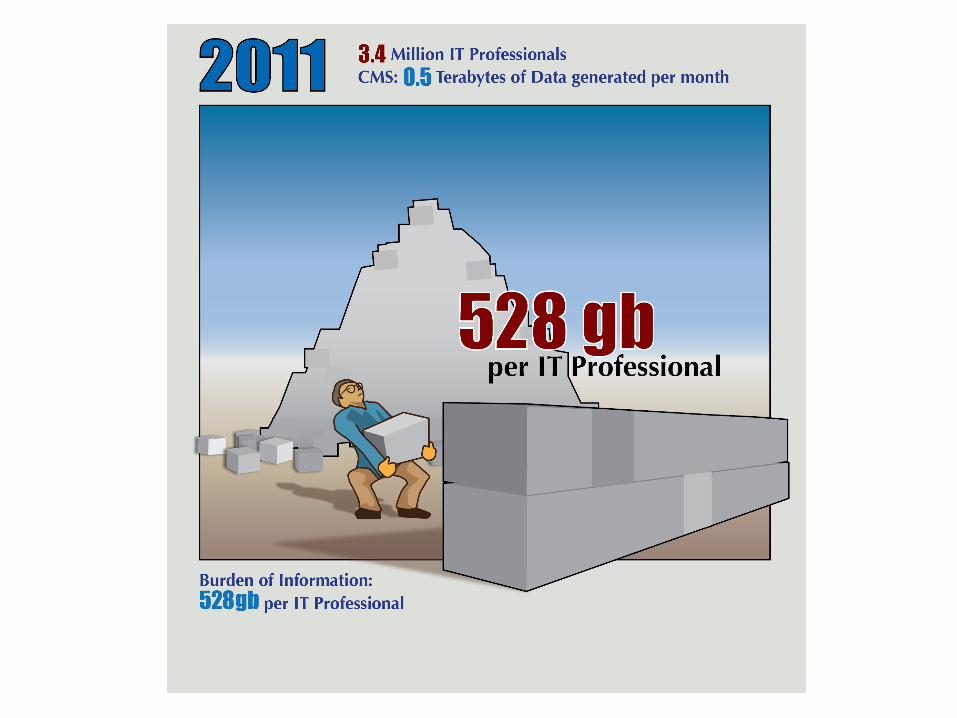
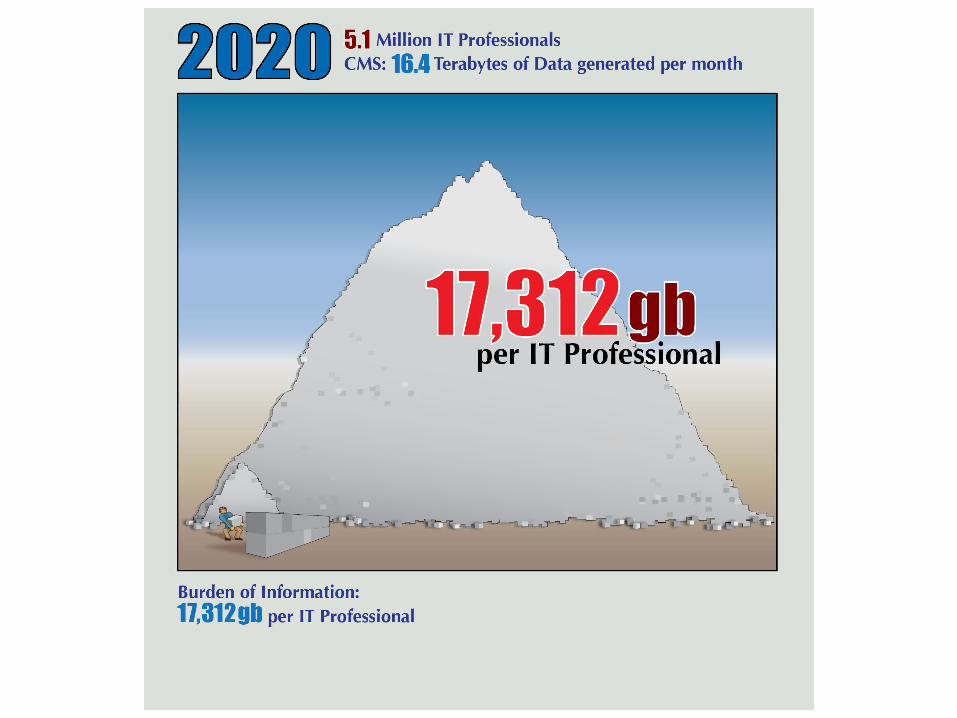
US Trends• 2011: 3.4 Million IT Professionals • 2020: 5.1 Million IT Professionals• Burden of Information
– 2011: 528gb/IT Professional– 2020: 17,312gb/ IT Pro

‘A Plan of the Town of Boston’ 1775
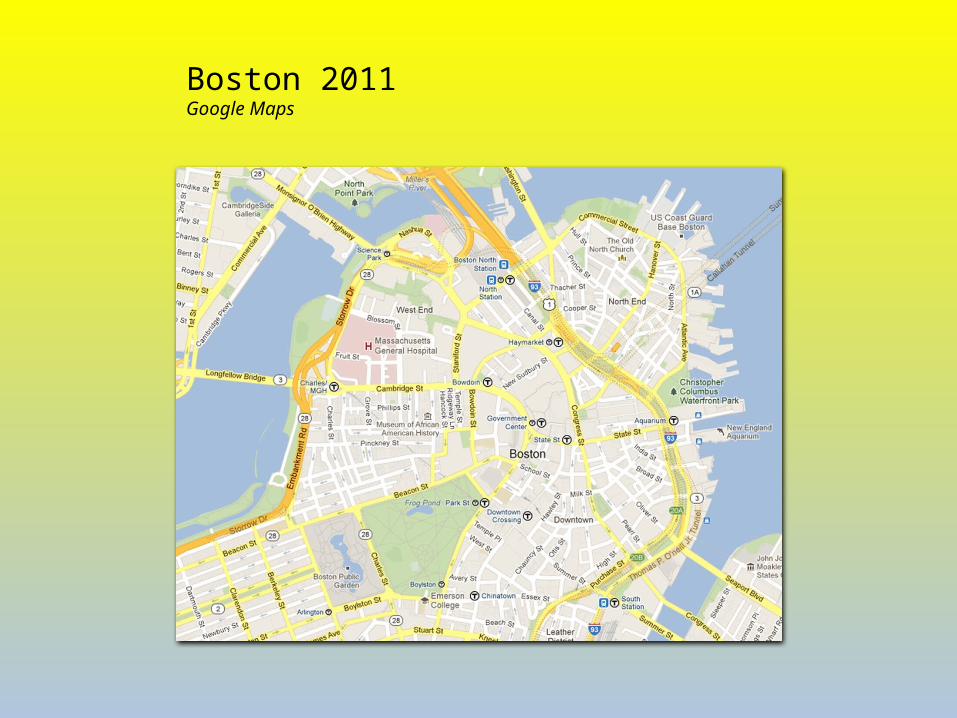
Boston 2011Google Maps
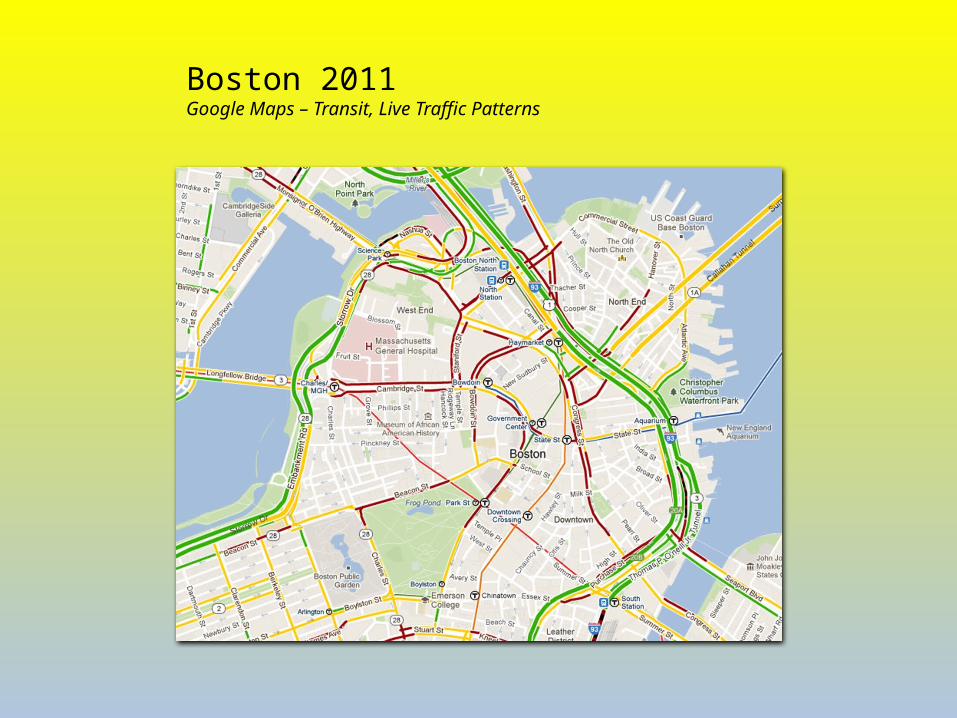
Boston 2011Google Maps – Transit, Live Traffic Patterns
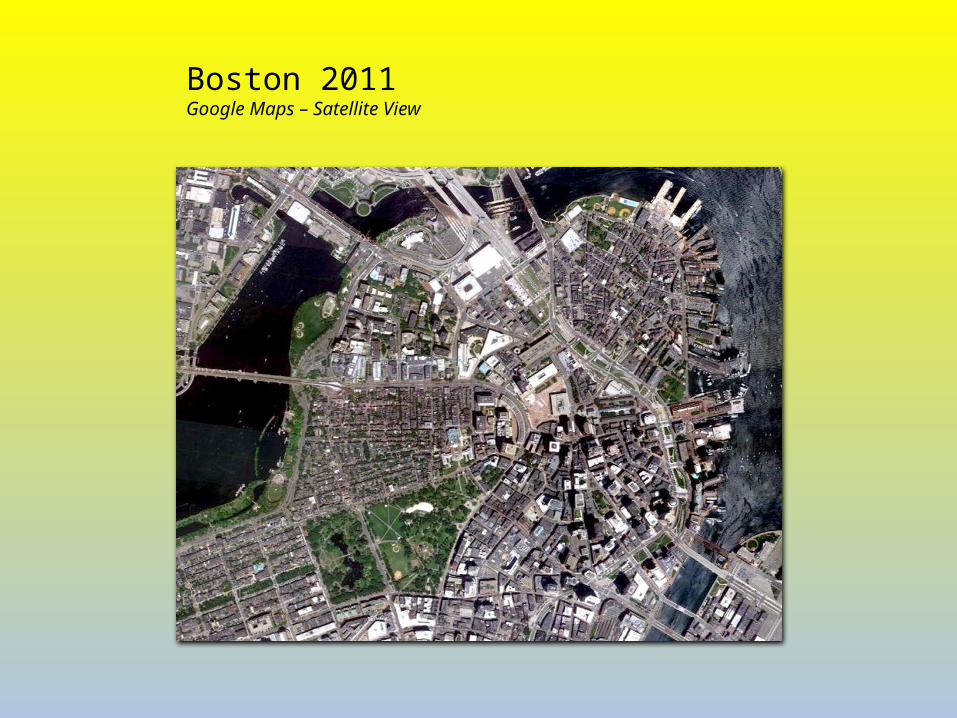
Boston 2011Google Maps – Satellite View
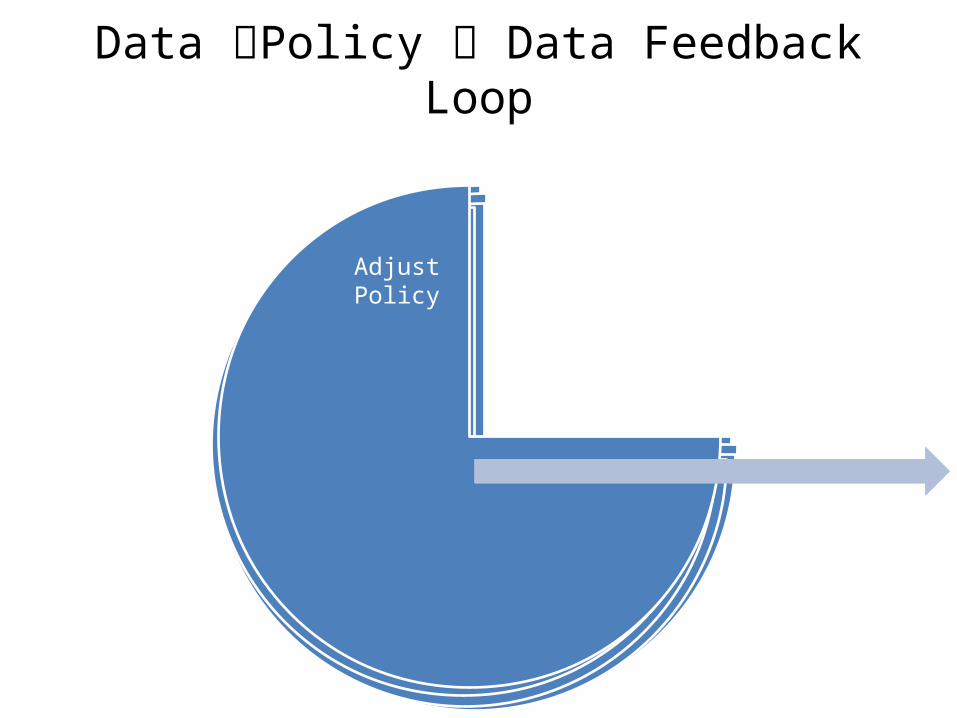
Data Policy Data Feedback Loop
Question
Define Metrics
Identify Source Data
Aggregate Data
Produce Visuals
Identify Trends, Outliers
Adjust Policy

Medicaid-Relevant Examples
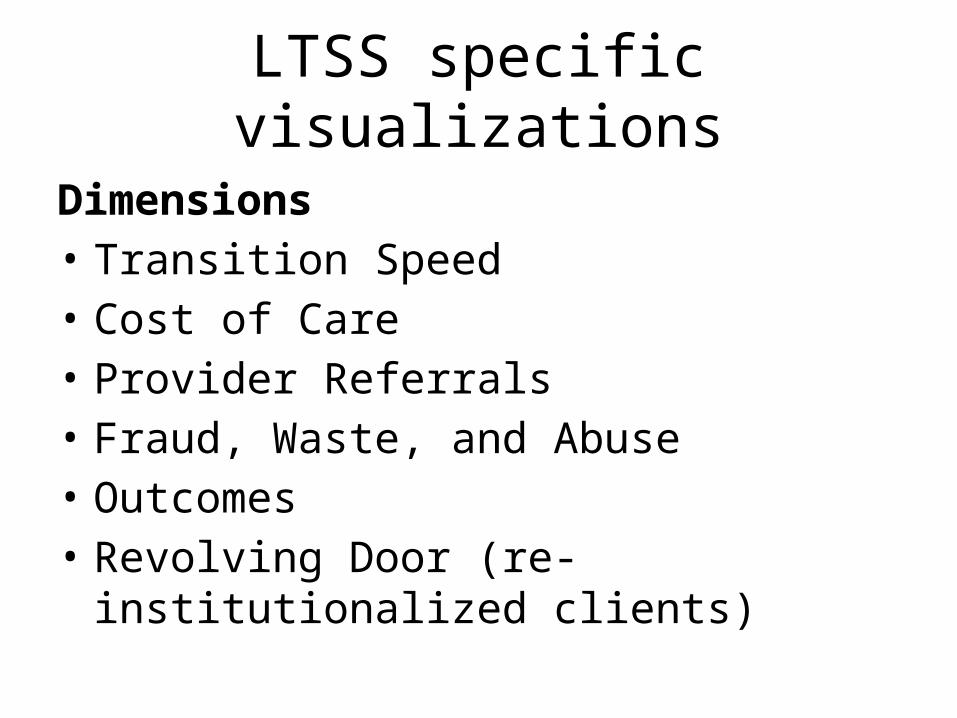
LTSS specific visualizations
Dimensions• Transition Speed• Cost of Care• Provider Referrals • Fraud, Waste, and Abuse• Outcomes• Revolving Door (re-institutionalized clients)

Contact Info
Chris White
(443) 858-9160