Embed Size (px)
Citation preview
nchs
Vital Statisticsof theUnited States, 1994Preprint of Volume II, Mortality, Part A, Section 6
CDCCENTERS FOR DISEASE CONTROL
AND PREVENTION
U.S. DEPARTMENT OF HEALTH AND HUMAN SERVICES
Centers for Disease Control and PreventionNational Center for Health Statistics
From the CENTERS FOR DISEASE CONTROL AND PREVENTION/National Center for Health Statistics
L I F E T A B L E S
Copyright information
All material appearing in this report is in the publicdomain and may be reproduced or copiedwithout permission; citation as to source, however,is appreciated.
Suggested citation
National Center for Health Statistics. Vital statisticsof the United States, 1994, preprint of vol II,mortality, part A sec 6 life tables. Hyattsville,Maryland. 1998.
For a list of reports published by the National Center for HealthStatistics contact:
Data Dissemination BranchNational Center for Health StatisticsCenters for Disease Control and Prevention6525 Belcrest Road, Room 1064Hyattsville, MD 20782-2003(301) 436–8500Internet: www.cdc.gov/nchswww
For sale by the U.S. Government Printing OfficeSuperintendent of Documents, Mail Stop: SSOP, Washington, DC 20402-9328
ISBN 0−16−048039−6
Vital Statisticsof theUnited States, 1994Preprint of Volume II, Mortality, Part A, Section 6
From the CENTERS FOR DISEASE CONTROL AND PREVENTION/National Center for Health Statistics
L I F E T A B L E S
U.S. DEPARTMENT OF HEALTH AND HUMAN SERVICESCenters for Disease Control and PreventionNational Center for Health Statistics
Hyattsville, MarylandMarch 1998
DHHS Publication No. (PHS) 98-1104
NATIONAL CENTER FOR HEALTH STATISTICS
EDWARD J. SONDIK, Ph.D.,Director
JACK R. ANDERSON,Deputy Director
JACK R. ANDERSON,Acting Associate Director for International Statistics
LESTER R. CURTIN, Ph.D.,Acting Associate Director for Research and Methodology
JENNIFER H. MADANS, Ph.D.,Acting Associate Director for Analysis, Epidemiology, and Health Promotion
P. DOUGLAS WILLIAMS, Acting Associate Director for Data Standards, Program Development, and Extramural Programs
EDWARD L. HUNTER,Associate Director for Planning, Budget, and Legislation
JENNIFER H. MADANS, Ph.D.,Acting Associate Director for Vital and Health Statistics Systems
STEPHEN E. NIEBERDING,Associate Director for Management
CHARLES J. ROTHWELL,Associate Director for Data Processing and Services
DIVISION OF VITAL STATISTICS
MARY ANNE FREEDMAN, Director
JAMES A. WEED, Ph.D.,Deputy Director
ROBERT BILGRAD,Special Assistant to the Director
GEORGE A. GAY,Special Assistant for Registration Methods
ROBERT J. ARMSTRONG,Actuarial Advisor
HARRY M. ROSENBERG, Ph.D.,Chief, Mortality Statistics Branch
KENNETH G. KEPPEL,Acting Chief, Reproductive Statistics Branch
RONALD F. CHAMBLEE, Chief, Data Acquisition and Evaluation Branch
NICHOLAS F. PACE,Chief, Systems, Programming, and Statistical Resources Branch
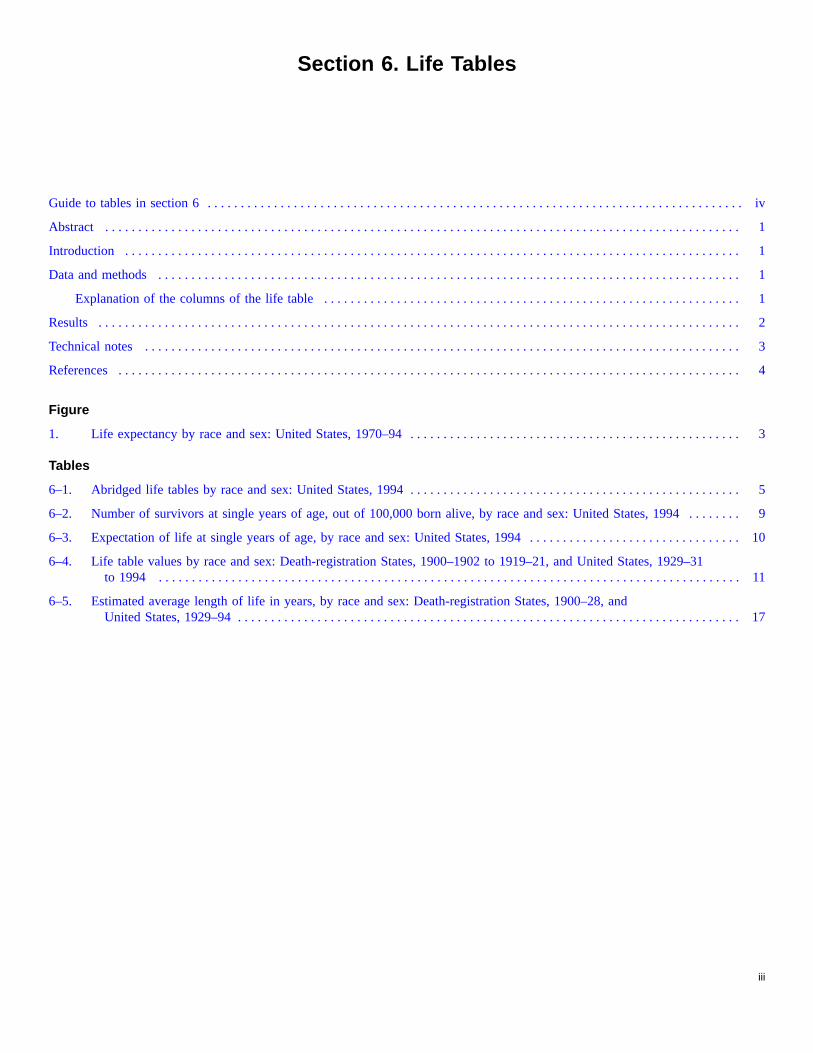
Section 6. Life Tables
Guide to tables in section 6. . . . . . . . . . . . . . . . . . . . . . . . . . . . . . . . . . . . . . . . . . . . . . . . . . . . . . . . . . . . . . . . . . . . . . . . . . . . . . . . . iv
Abstract . . . . . . . . . . . . . . . . . . . . . . . . . . . . . . . . . . . . . . . . . . . . . . . . . . . . . . . . . . . . . . . . . . . . . . . . . . . . . . . . . . . . . . . . . . . . . . . . 1
Introduction . . . . . . . . . . . . . . . . . . . . . . . . . . . . . . . . . . . . . . . . . . . . . . . . . . . . . . . . . . . . . . . . . . . . . . . . . . . . . . . . . . . . . . . . . . . . . 1
Data and methods. . . . . . . . . . . . . . . . . . . . . . . . . . . . . . . . . . . . . . . . . . . . . . . . . . . . . . . . . . . . . . . . . . . . . . . . . . . . . . . . . . . . . . . . 1
Explanation of the columns of the life table. . . . . . . . . . . . . . . . . . . . . . . . . . . . . . . . . . . . . . . . . . . . . . . . . . . . . . . . . . . . . . . 1
Results . . . . . . . . . . . . . . . . . . . . . . . . . . . . . . . . . . . . . . . . . . . . . . . . . . . . . . . . . . . . . . . . . . . . . . . . . . . . . . . . . . . . . . . . . . . . . . . . . 2
Technical notes . . . . . . . . . . . . . . . . . . . . . . . . . . . . . . . . . . . . . . . . . . . . . . . . . . . . . . . . . . . . . . . . . . . . . . . . . . . . . . . . . . . . . . . . . . 3
References . . . . . . . . . . . . . . . . . . . . . . . . . . . . . . . . . . . . . . . . . . . . . . . . . . . . . . . . . . . . . . . . . . . . . . . . . . . . . . . . . . . . . . . . . . . . . . 4
Figure
1. Life expectancy by race and sex: United States, 1970–94. . . . . . . . . . . . . . . . . . . . . . . . . . . . . . . . . . . . . . . . . . . . . . . . . . 3
Tables
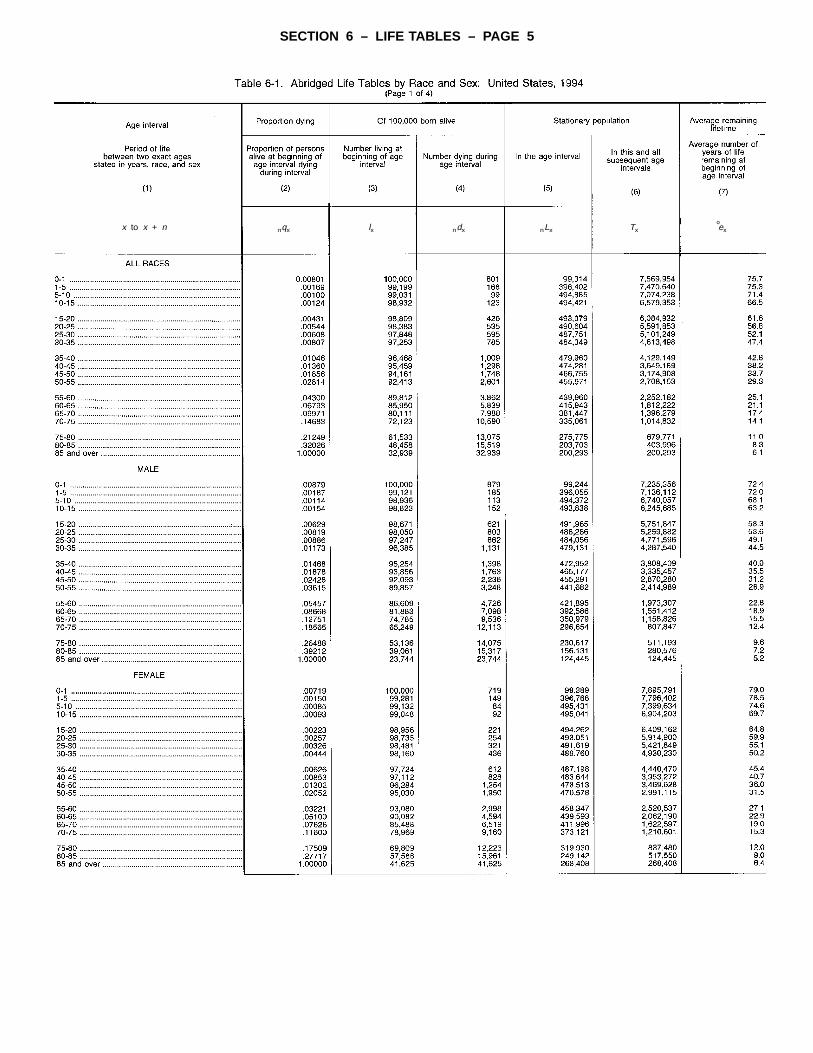
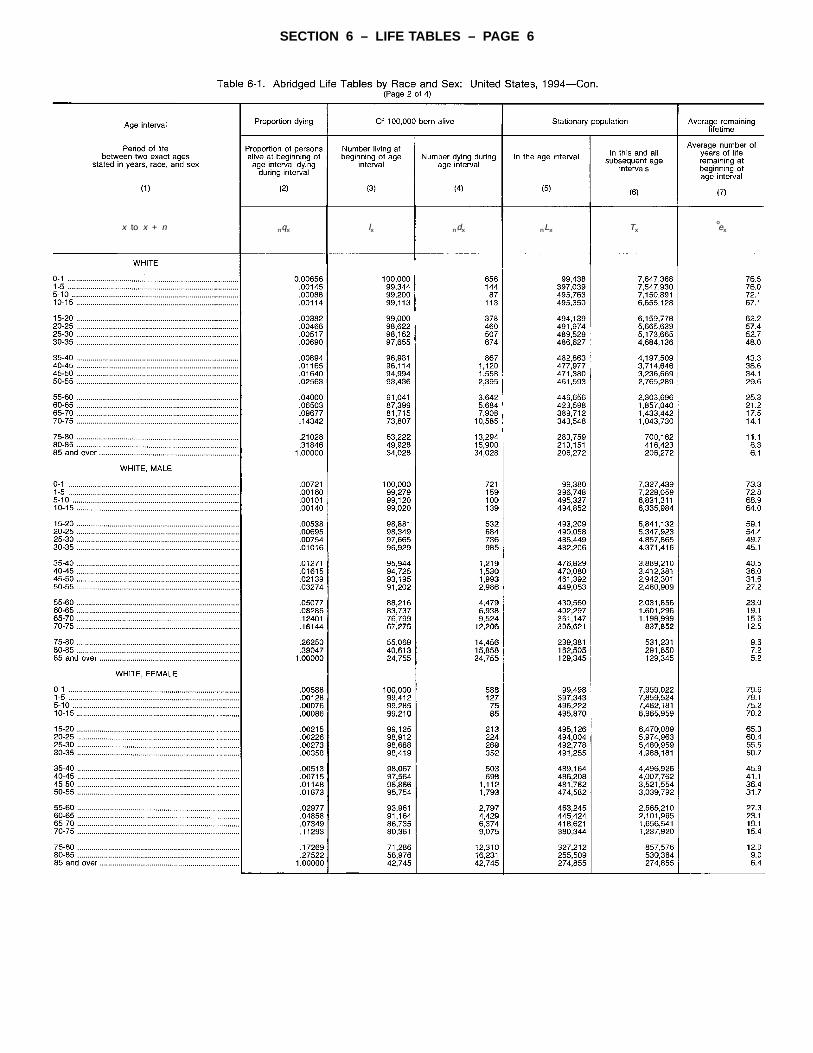
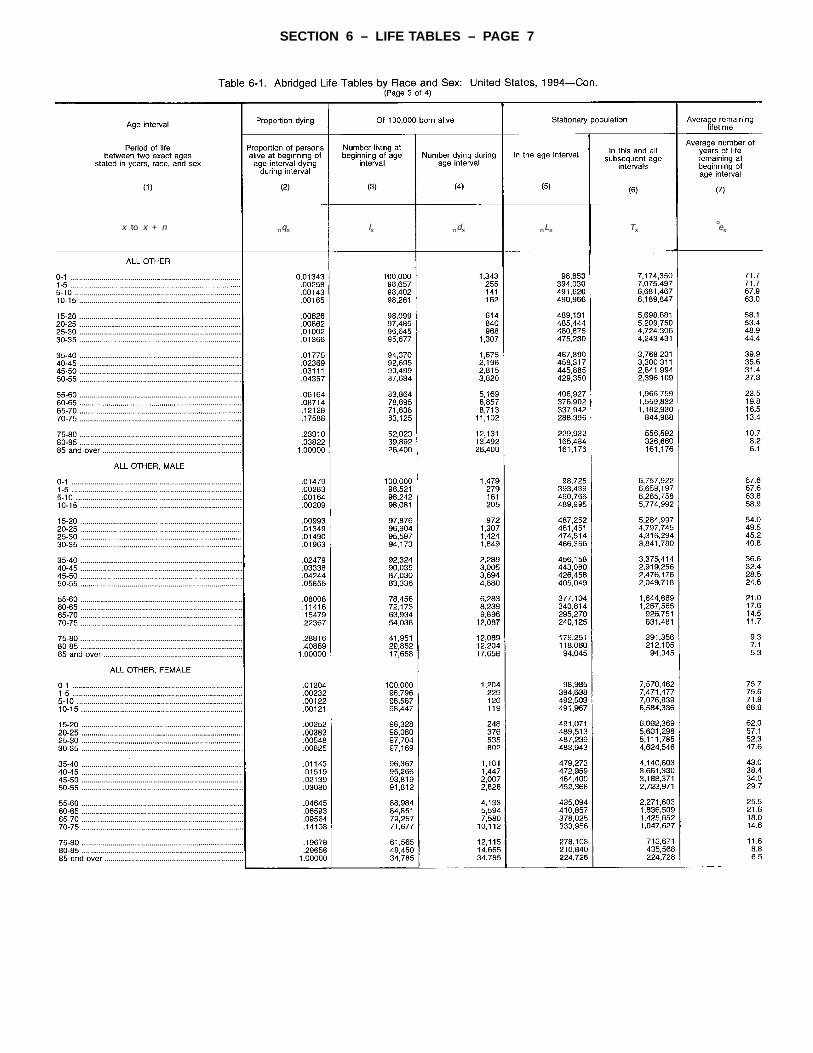
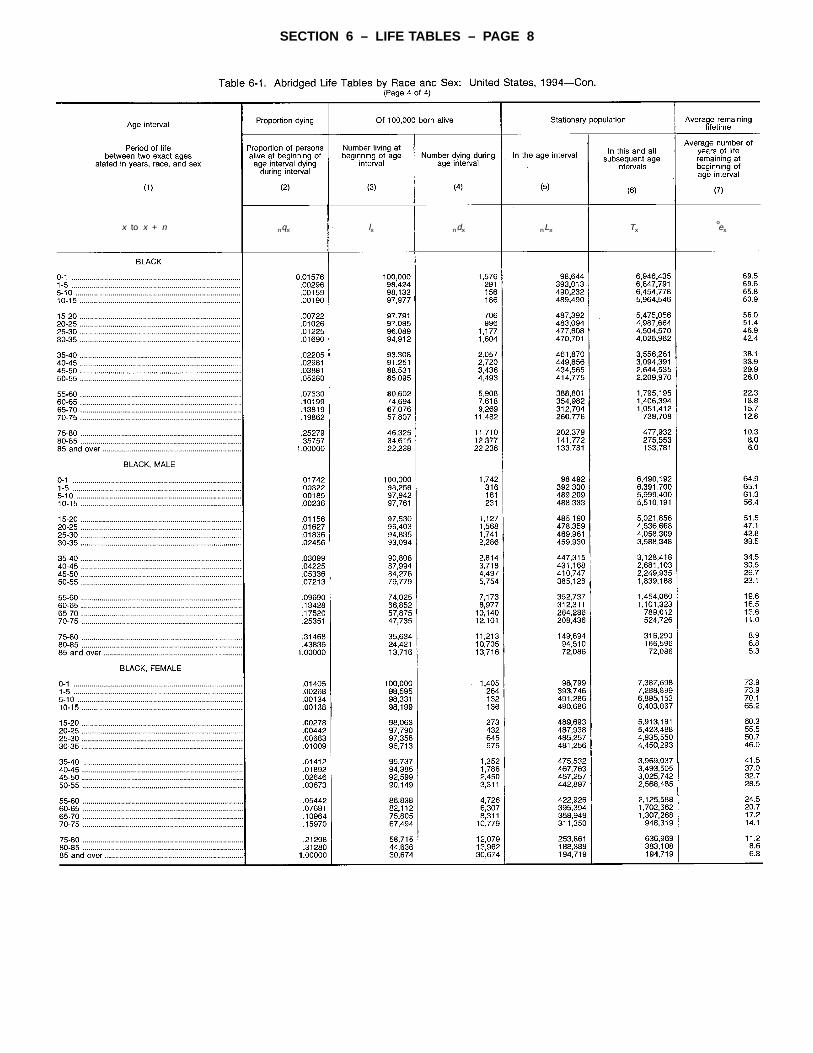
6–1. Abridged life tables by race and sex: United States, 1994. . . . . . . . . . . . . . . . . . . . . . . . . . . . . . . . . . . . . . . . . . . . . . . . . . 5
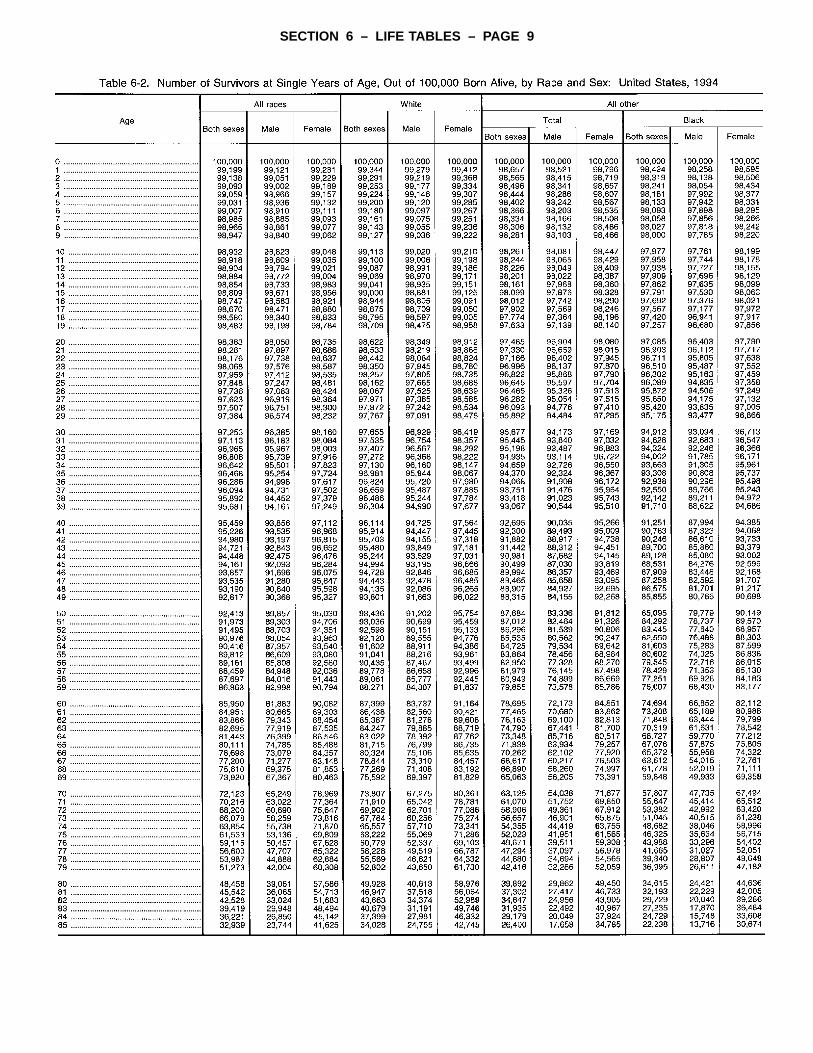
6–2. Number of survivors at single years of age, out of 100,000 born alive, by race and sex: United States, 1994. . . . . . . . 9
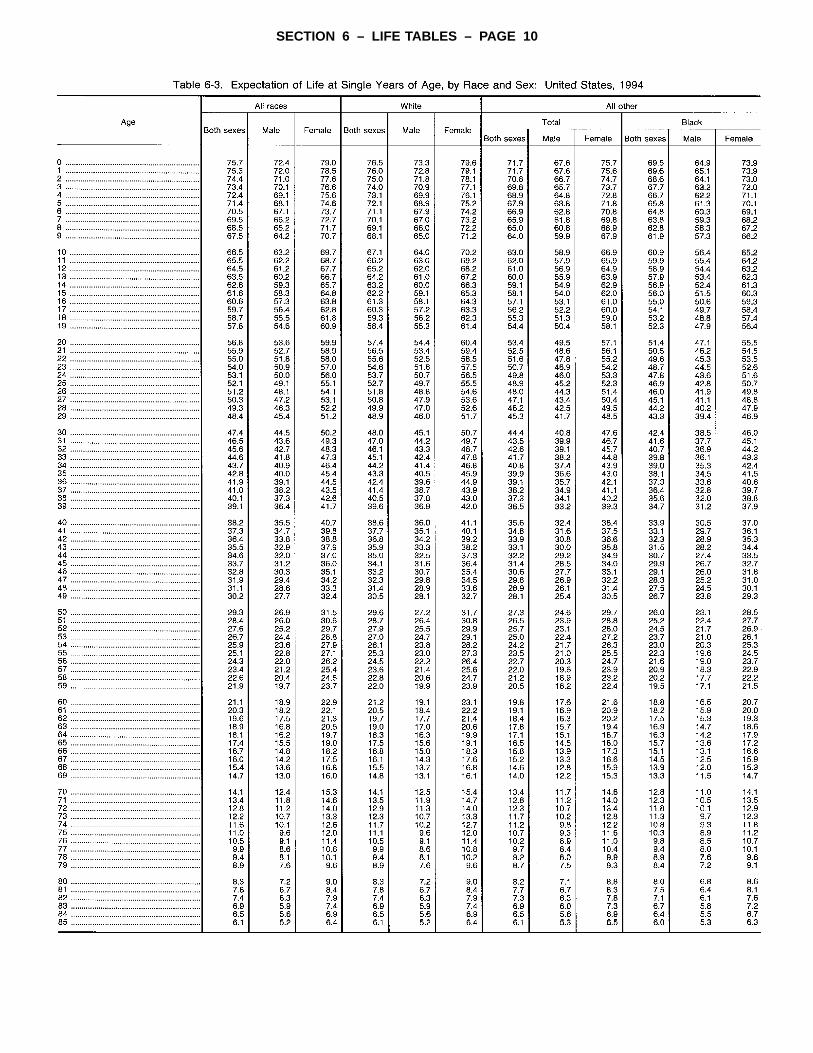
6–3. Expectation of life at single years of age, by race and sex: United States, 1994. . . . . . . . . . . . . . . . . . . . . . . . . . . . . . . . 10
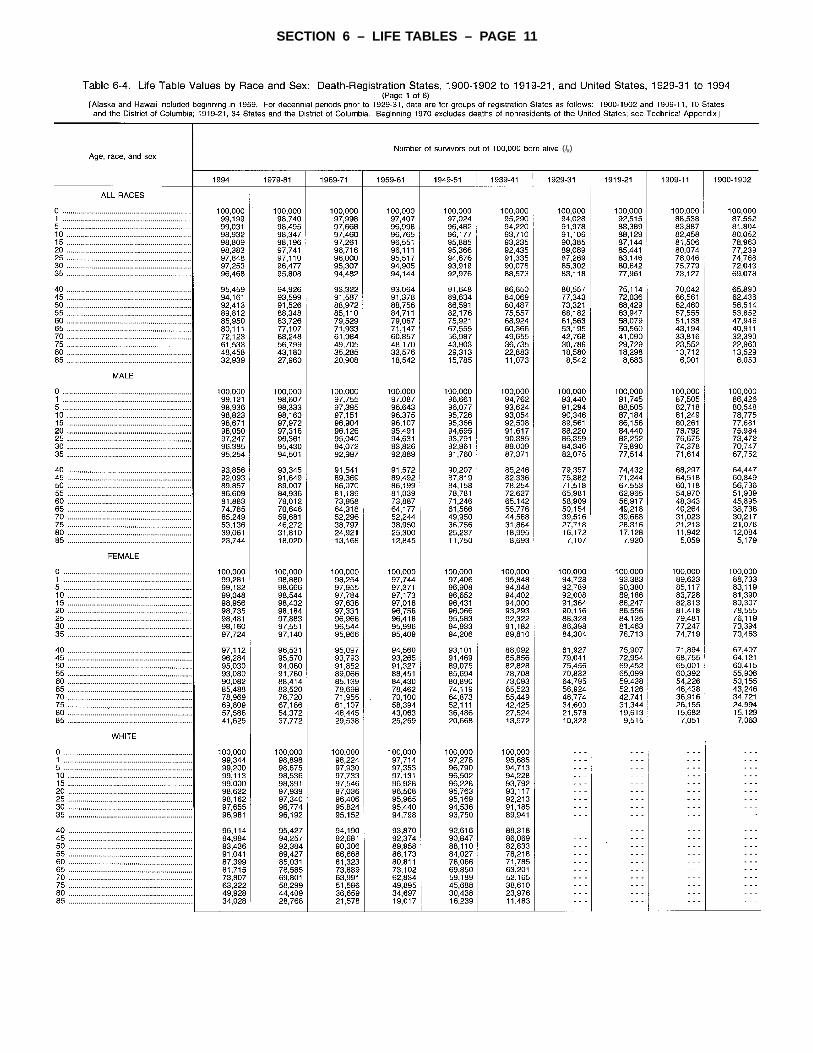
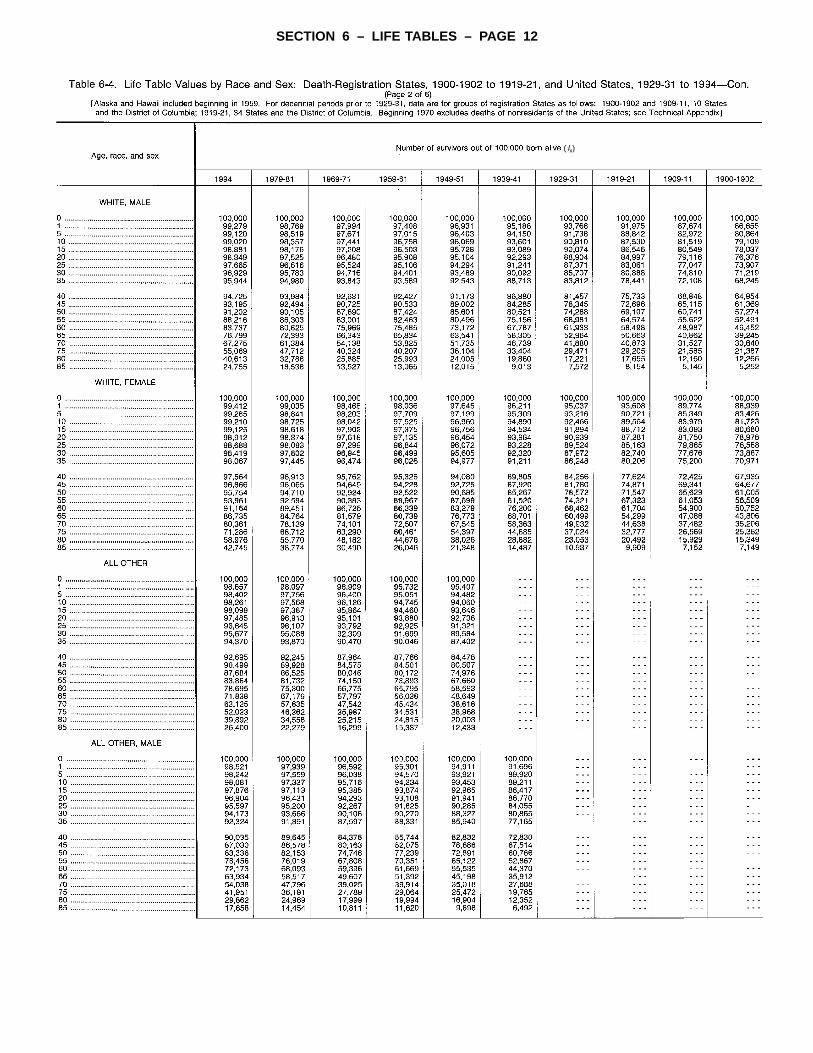
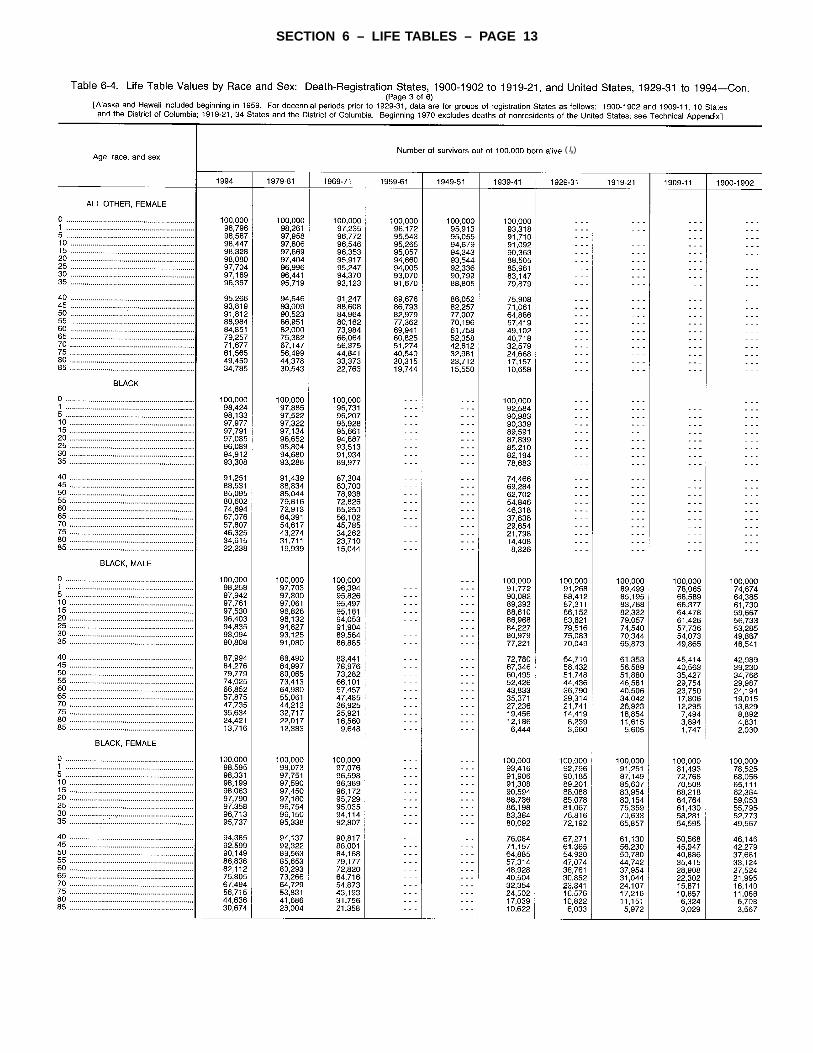
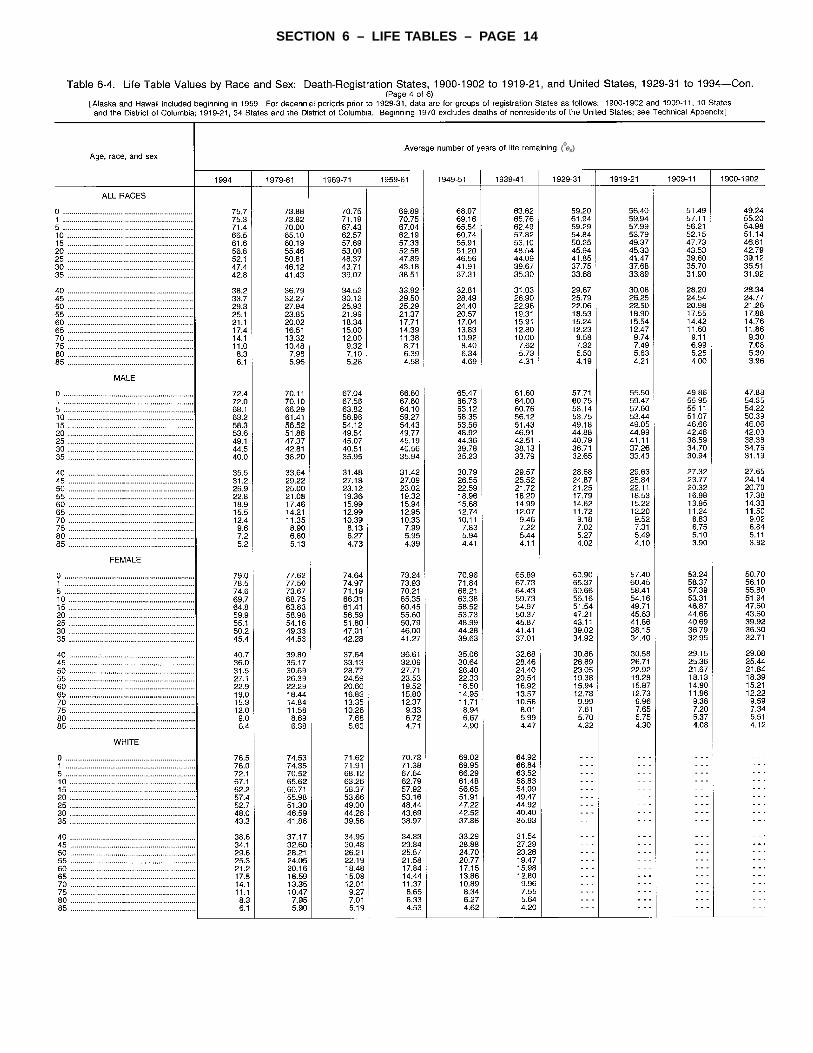
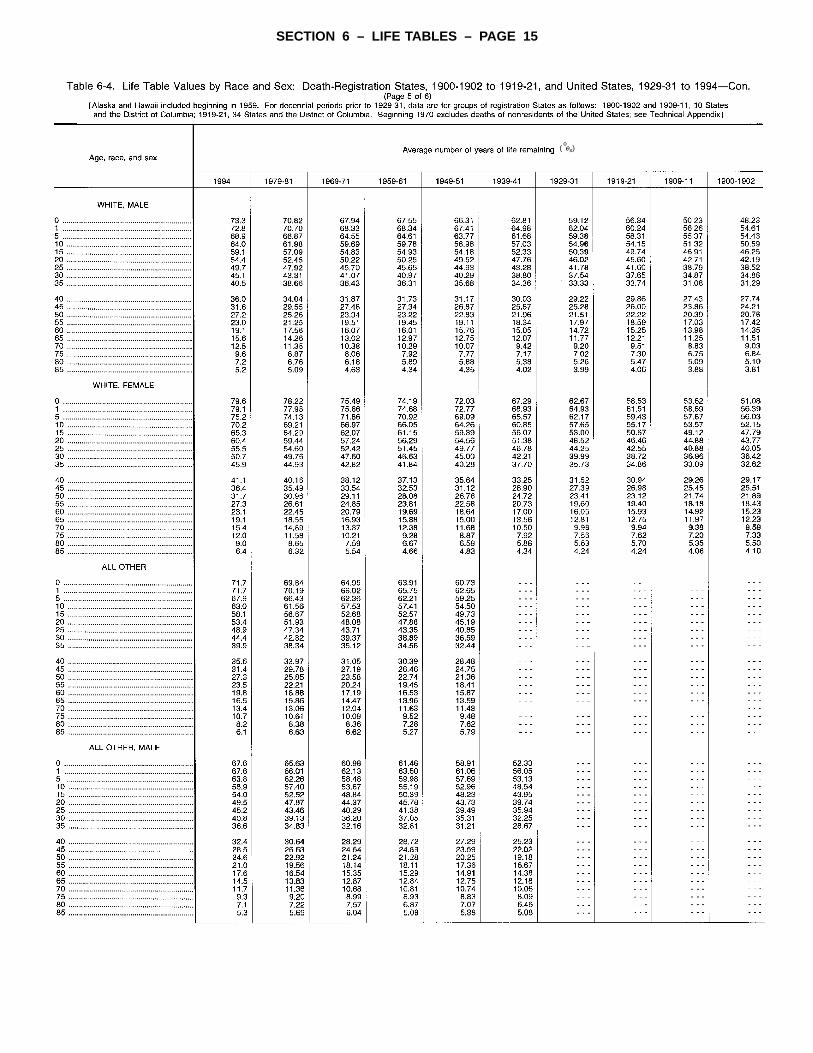
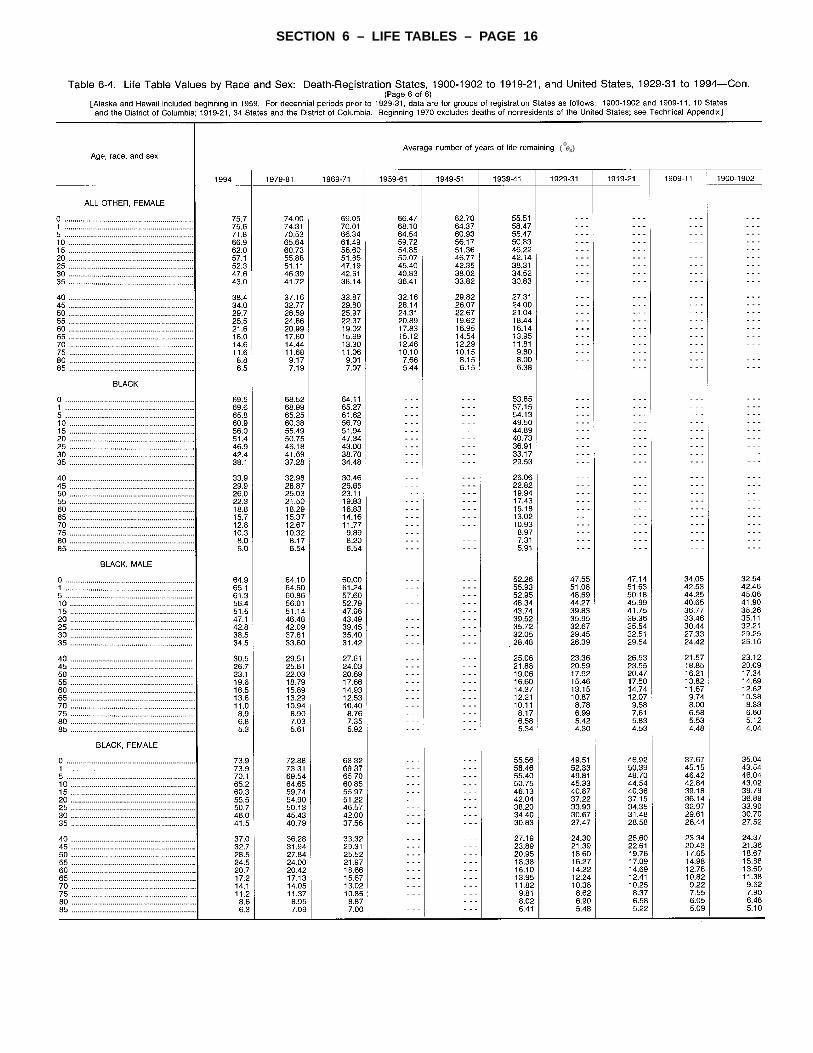
6–4. Life table values by race and sex: Death-registration States, 1900–1902 to 1919–21, and United States, 1929–31to 1994 . . . . . . . . . . . . . . . . . . . . . . . . . . . . . . . . . . . . . . . . . . . . . . . . . . . . . . . . . . . . . . . . . . . . . . . . . . . . . . . . . . . . . . . . 11
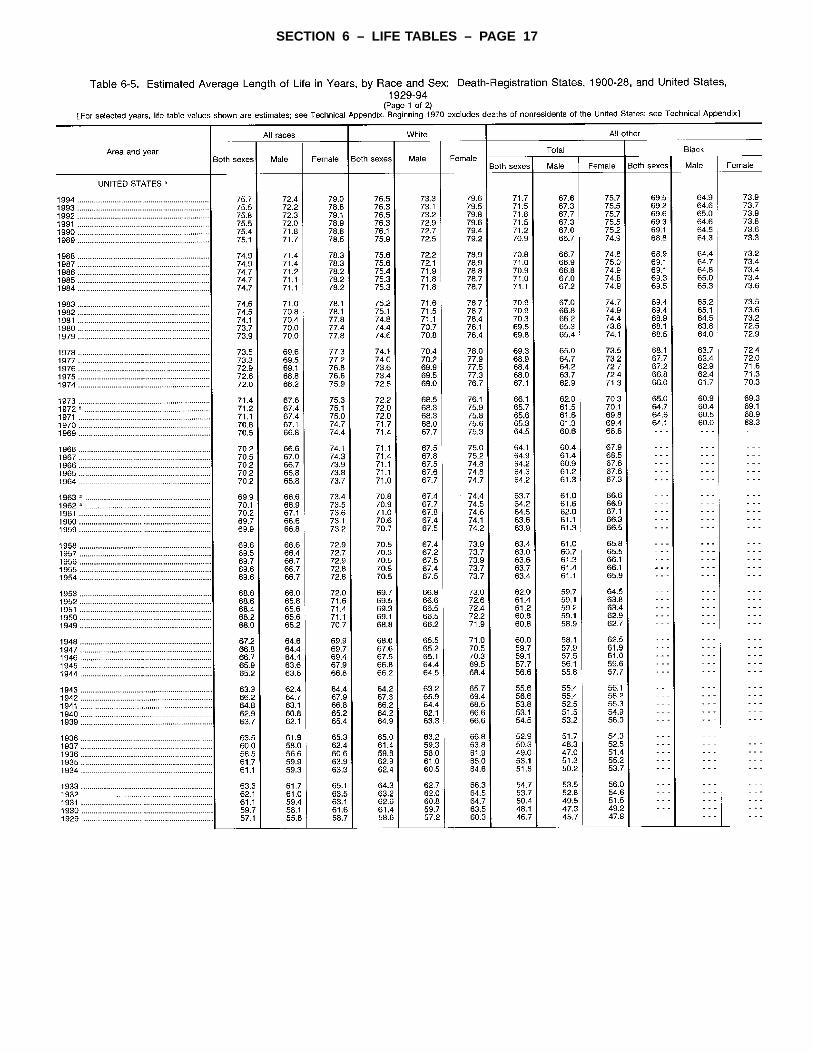
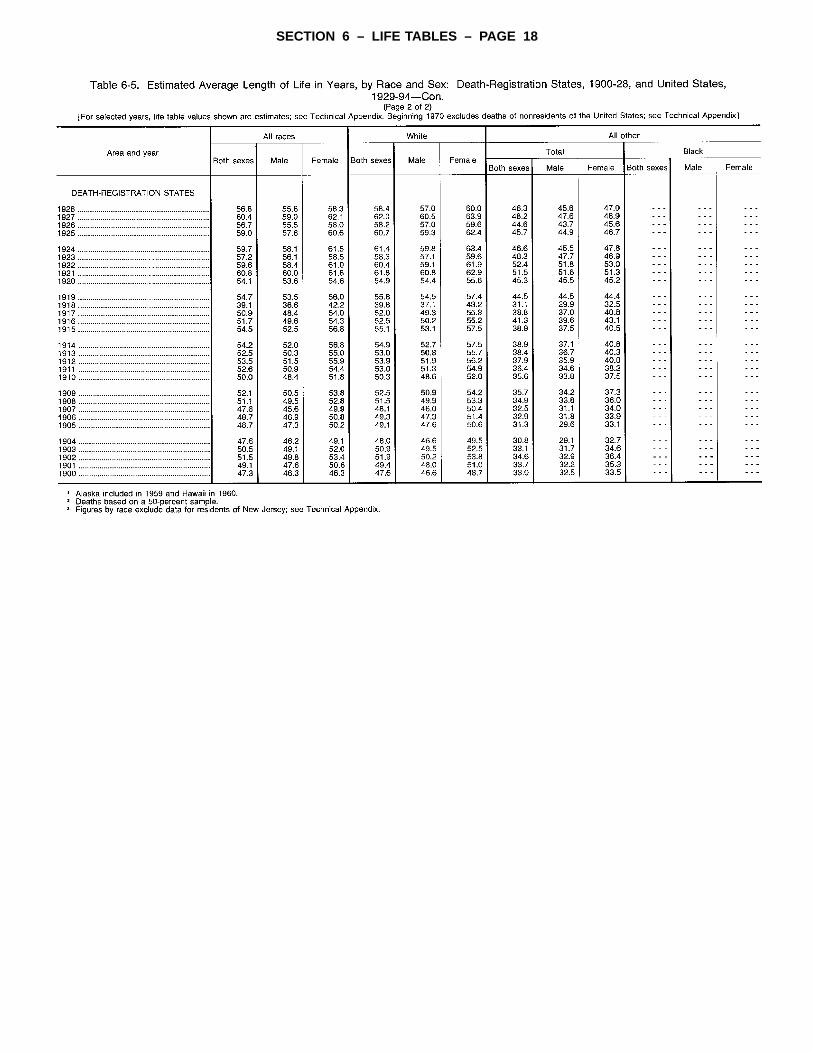
6–5. Estimated average length of life in years, by race and sex: Death-registration States, 1900–28, andUnited States, 1929–94. . . . . . . . . . . . . . . . . . . . . . . . . . . . . . . . . . . . . . . . . . . . . . . . . . . . . . . . . . . . . . . . . . . . . . . . . . . . 17
iii
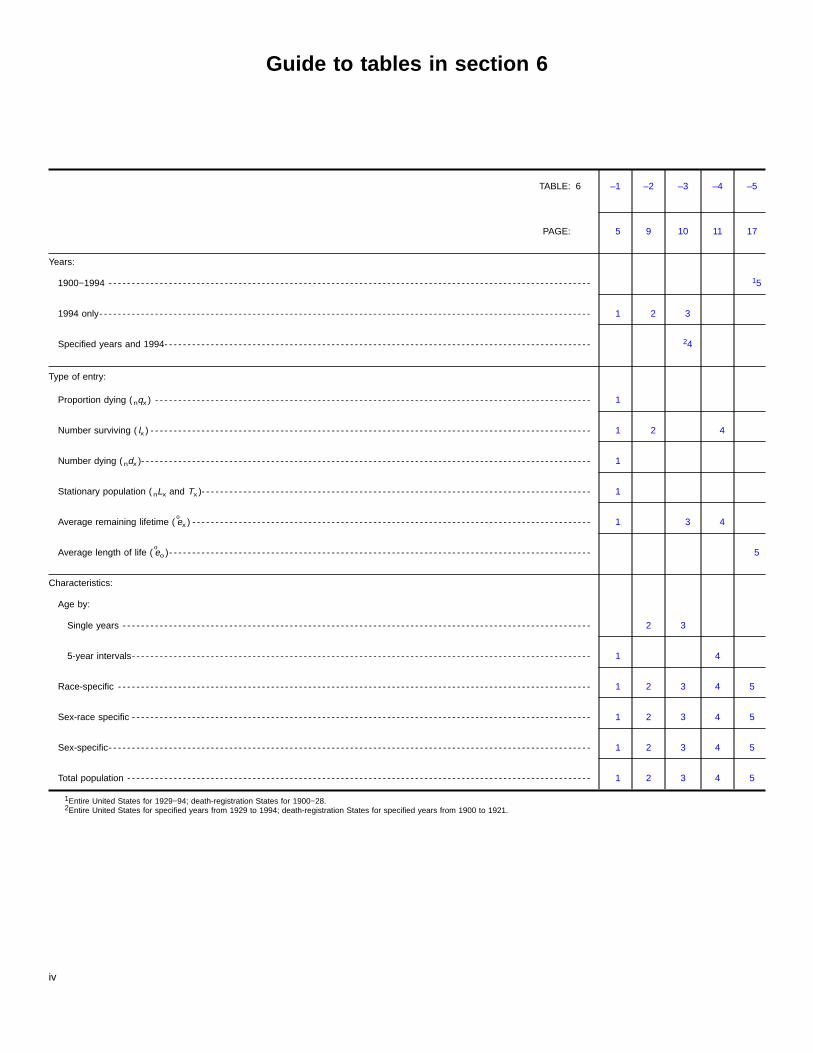
Guide to tables in section 6
TABLE: 6 –1 –2 –3 –4 –5
PAGE: 5 9 10 11 17
Years:
1900−1994 - - - - - - - - - - - - - - - - - - - - - - - - - - - - - - - - - - - - - - - - - - - - - - - - - - - - - - - - - - - - - - - - - - - - - - - - - - - - - - - - - - - - - - - - - - - - - - - - - - - - - - - - 15
1994 only- - - - - - - - - - - - - - - - - - - - - - - - - - - - - - - - - - - - - - - - - - - - - - - - - - - - - - - - - - - - - - - - - - - - - - - - - - - - - - - - - - - - - - - - - - - - - - - - - - - - - - - - - - 1 2 3
Specified years and 1994- - - - - - - - - - - - - - - - - - - - - - - - - - - - - - - - - - - - - - - - - - - - - - - - - - - - - - - - - - - - - - - - - - - - - - - - - - - - - - - - - - - - - - - - - - - - 24
Type of entry:
Proportion dying ( nqx ) - - - - - - - - - - - - - - - - - - - - - - - - - - - - - - - - - - - - - - - - - - - - - - - - - - - - - - - - - - - - - - - - - - - - - - - - - - - - - - - - - - - - - - - - - - - - - - 1
Number surviving ( lx ) - - - - - - - - - - - - - - - - - - - - - - - - - - - - - - - - - - - - - - - - - - - - - - - - - - - - - - - - - - - - - - - - - - - - - - - - - - - - - - - - - - - - - - - - - - - - - - - 1 2 4
Number dying ( ndx )- - - - - - - - - - - - - - - - - - - - - - - - - - - - - - - - - - - - - - - - - - - - - - - - - - - - - - - - - - - - - - - - - - - - - - - - - - - - - - - - - - - - - - - - - - - - - - - - - 1
Stationary population ( nLx and Tx )- - - - - - - - - - - - - - - - - - - - - - - - - - - - - - - - - - - - - - - - - - - - - - - - - - - - - - - - - - - - - - - - - - - - - - - - - - - - - - - - - - - - 1
Average remaining lifetime (oex ) - - - - - - - - - - - - - - - - - - - - - - - - - - - - - - - - - - - - - - - - - - - - - - - - - - - - - - - - - - - - - - - - - - - - - - - - - - - - - - - - - - - - - - 1 3 4
Average length of life (oeo )- - - - - - - - - - - - - - - - - - - - - - - - - - - - - - - - - - - - - - - - - - - - - - - - - - - - - - - - - - - - - - - - - - - - - - - - - - - - - - - - - - - - - - - - - - - 5
Characteristics:
Age by:
Single years - - - - - - - - - - - - - - - - - - - - - - - - - - - - - - - - - - - - - - - - - - - - - - - - - - - - - - - - - - - - - - - - - - - - - - - - - - - - - - - - - - - - - - - - - - - - - - - - - - - - - 2 3
5-year intervals- - - - - - - - - - - - - - - - - - - - - - - - - - - - - - - - - - - - - - - - - - - - - - - - - - - - - - - - - - - - - - - - - - - - - - - - - - - - - - - - - - - - - - - - - - - - - - - - - - - 1 4
Race-specific - - - - - - - - - - - - - - - - - - - - - - - - - - - - - - - - - - - - - - - - - - - - - - - - - - - - - - - - - - - - - - - - - - - - - - - - - - - - - - - - - - - - - - - - - - - - - - - - - - - - - - 1 2 3 4 5
Sex-race specific - - - - - - - - - - - - - - - - - - - - - - - - - - - - - - - - - - - - - - - - - - - - - - - - - - - - - - - - - - - - - - - - - - - - - - - - - - - - - - - - - - - - - - - - - - - - - - - - - - - 1 2 3 4 5
Sex-specific- - - - - - - - - - - - - - - - - - - - - - - - - - - - - - - - - - - - - - - - - - - - - - - - - - - - - - - - - - - - - - - - - - - - - - - - - - - - - - - - - - - - - - - - - - - - - - - - - - - - - - - - 1 2 3 4 5
Total population - - - - - - - - - - - - - - - - - - - - - - - - - - - - - - - - - - - - - - - - - - - - - - - - - - - - - - - - - - - - - - - - - - - - - - - - - - - - - - - - - - - - - - - - - - - - - - - - - - - - 1 2 3 4 5
1Entire United States for 1929−94; death-registration States for 1900−28.2Entire United States for specified years from 1929 to 1994; death-registration States for specified years from 1900 to 1921.
iv
alc-i-e-rt
ora-eau
ndndf
arsat
-
alf
orth
SECTION 6 – LIFE TABLES – PAGE 1
Abstract
The life tables in this report are current abridged life tablfor the United States based on age-specific death rates in 19The data used to prepare these abridged life tables are 1994mortality statistics and July 1, 1994, population estimatePresented are tables showing life expectancy and survivorsby age, race, and sex. In 1994 the overall expectation of lifebirth was 75.7 years, an increase of 0.2 years compared withexpectancy in 1993. Increases in life expectancy from 19931994 were also noted for white males (from 73.1 to 73.3), whfemales (from 79.5 to 79.6), black males (from 64.6 to 64.9and black females (from 73.7 to 73.9).
Introduction
Death rates for a specific period may be summarized bylife table method to obtain measures of comparative longevThere are two types of life tables—the generation or cohort ltable and the current life table.
The generation life table provides a ‘‘longitudinal’’ perspective in that it follows the mortality experience of a particulacohort, all persons born in the year 1900, for example, from tmoment of birth through consecutive ages in successive cadar years. Based on age-specific death rates observed throconsecutive calendar years, the generation life table reflectsmortality experience of an actual cohort from birth until no liveremain in the group. To prepare just a single complete genetion life table requires data over many years. It is not feasibleconstruct generation life tables entirely on the basis of actdata for cohorts born in this century (1). It is necessaryproject data for the incomplete period for cohorts whose lispans are not yet complete (2).
The better-known current life table may, in contrast, bcharacterized as ‘‘cross-sectional.’’ Unlike the generation litable, the current life table does not represent the mortaexperience of an actual cohort. Rather, the current life taconsiders a hypothetical cohort and assumes that it is subjecthe age-specific death rates observed for an actual populaduring a particular period. Thus, for example, a current life tabfor 1994 assumes a hypothetical cohort subject throughout
ndalyng
gee
NOTE: This report was prepared in the Division of Vital Statistics. Robert NAnderson, Mortality Statistics Branch, wrote this report under the genedirection of Harry M. Rosenberg, Chief of the Mortality Statistics BranchThomas D. Dunn provided content review. Charles E. Royer provided compuprogramming support. Registration Methods staff and the Data Acquisition aEvaluation Branch provided consultation to State vital statistics offices regaing collection of the death certificate data on which this report is based. Treport was edited by Demarius V. Miller and typeset by Zung T. N. Le of thPublications Branch, Division of Data Services.
es94.finals.hipatlifetoite),
theity.ife
-rhelen-ughthesra-toualtofe
efelityblet totionleits
lifetime to the age-specific death rates prevailing for the actupopulation in 1994. The current life table may thus be charaterized as rendering a ‘‘snapshot’’ of current mortality experence, and shows the long-range implications of a set of agspecific death rates that prevailed in a given year. In this repothe term ‘‘life table’’ refers only to the current life table and notto the generation life table.
Data and methods
The data used to prepare the abridged U.S. life tables f1994 are final mortality statistics and the July 1, 1994, popultion estimates by age, race, and sex prepared by the U.S. Burof the Census (seeTechnical notes). These life tables areconstructed by reference to a ‘‘standard’’ table (seeTechnicalnotes).
Expectation of life—The most frequently used life tablestatistic is life expectancy (oex), which is the average number ofyears of life remaining for persons who have attained a giveage (x). Life expectancy and other life table values at specifieages in 1994 are shown for the total population and by race asex intable 6–1. In addition, life expectancies at single years oage by race and sex are shown intable 6–3.
Life expectancy at birth for 1994 for the total populationwas 75.7 years. This represents the average number of yethat the members of the life table cohort may expect to livethe time of birth (table 6–1).
Survivors to specified ages—Another way of assessing thelongevity of the life table cohort is by determining the proportion who survive to specified ages. Thelx column provides thedata for computing the proportion. For instance, for the totpopulation 80,111 out of the original 1994 life table cohort o100,000 (or 80.1 percent) were alive at exact age 65 (table 6–2).
Explanation of the columns of the life table
Column 1—Age interval (xto x + n)—This column showsthe age interval between the two exact ages indicated. Finstance, ‘‘20–25’’ means the 5-year interval between the 20and 25th birthdays.
Column 2—Proportion dying (nqx )—This column showsthe proportion of the cohort who are alive at the beginning of aindicated age interval and who will die before reaching the enof that age interval. For example, for males in the age interv20–25 years, the proportion dying is 0.00819: Out of ever1,000 males alive and exactly 20 years of age at the beginniof the period, about 8 will die before reaching their 25thbirthday. In other words, thenqx values represent probabilitiesthat persons who are alive at the beginning of a specific ainterval will die before reaching the beginning of the next ag
.ral.terndrd-hise
nbyoftfert.eyasd3)e.al0eras
7innmp-sas
eethsrescye as.0hee-iodin
ethekrs
.0inyitin
.6snd
SECTION 6 – LIFE TABLES – PAGE 2
interval. The ‘‘proportion dying’’ column forms the basis of thelife table. The life table is so constructed that all other columnare derived from it.
Column 3—Number surviving (lx )—This column shows thenumber of persons, starting with a cohort of 100,000 live birthwho survive to the exact age marking the beginning of each ainterval. Thelx values are computed from thenqx values, whichare successively applied to the remainder of the original 100,0persons still alive at the beginning of each age interval. Thout of 100,000 male babies born alive, 99,121 will complete thfirst year of life and enter the second; 98,936 will begin thsixth year; 98,050 will reach age 20; and 23,744 will live toage 85.
Column 4—Number dying (ndx )—This column shows thenumber dying in each successive age interval out of 100,0live births. Out of 100,000 males born alive, 879 will die in thefirst year of life; 185 in the succeeding 4 years; 803 in th5-year period between exact ages 20 and 25, and 23,744 willafter reaching age 85. Each figure in column 4 is the differenbetween two successive figures in column 3.
Columns 5 and 6—Stationary population (nLx andTx )—Suppose that a group of 100,000 individuals like thaassumed in columns 3 and 4 is born every year and thatproportions dying in each such group in each age intervthroughout the lives of the members are exactly those showncolumn 2. If there were no migration and if the births werevenly distributed over the calendar year, the survivors of thebirths would make up what is called a stationary population—stationary because in such a population the number of persliving in any given age group would never change. Wheindividuals left the group, either by death or by growing oldeand entering the next higher age group, their places wouimmediately be taken by persons entering from the next lowage group. Thus a census taken at any time in such a stationcommunity would always show the same total population anthe same numerical distribution of that population among thvarious age groups. In such a stationary population supporby 100,000 annual births, column 3 shows the numberpersons who, each year, reach the birthday that marksbeginning of the age interval indicated in column 1, and colum4 shows the number of persons who die each year in tindicated age interval.
Column 5 shows the number of persons in the stationapopulation in the indicated age interval. For example, the figugiven for males in the age interval 20–25 years is 488,286. Thmeans that in a stationary population of males supported100,000 annual births and with proportions dying in each agroup always in accordance with column 2, a census takenany date would show 488,286 persons between exact agesand 25 years.
Column 6 shows the total number of persons in thstationary population (column 5) in the indicated age intervand all subsequent age intervals. For example, in the stationpopulation of males referred to in the last illustration, columnshows that there would be at any given moment a total5,259,882 persons who have passed their 20th birthday. Tmale population at all ages 0 and above (the total mapopulation of the stationary community) would be 7,235,356.
s
s,ge
00usee
00
ediece
tthealinese
onsnrlderarydetedofthenhe
ryreisbygeon20
ealary6ofhele
Column 7—Average remaining lifetime (oex )—The averageremaining lifetime (also called expectation of life) at any giveage is the average number of years remaining to be livedthose surviving to that age on the basis of a given setage-specific rates of dying. To arrive at this value, it is firsnecessary to observe that the figures in column 5 of the litable can also be interpreted in terms of a single life table cohowithout introducing the concept of the stationary populationFrom this point of view, each figure in column 5 represents thtotal time (in years) lived between two indicated birthdays ball those reaching the earlier birthday among the survivors ofcohort of 100,000 live births. Thus the figure 488,286 for malein the age interval 20–25 is the total number of years livebetween the 20th and 25th birthdays by the 98,050 (columnwho reached the 20th birthday out of 100,000 males born alivThe corresponding figure 5,259,882 in column 6 is the totnumber of years lived after attaining age 20 by the 98,05reaching that age. This number of years divided by the numbof persons (5,259,882 divided by 98,050) gives 53.6 yearsthe average remaining lifetime of males at age 20.
Results
In 1994 the average expectation of life at birth was 75.years, an increase of 0.2 years compared with life expectancy1993, but slightly lower than the record high of 75.8 years i1992. The increase between 1993 and 1994 represents a resution of a generally upward trend in U.S. life expectancy that habeen observed throughout this century but, most recently, winterrupted by a 0.3-year decline between 1992 and 1993.
The expectation of life at birth for 1994 represents thaverage number of years that a group of infants would live if thinfants were to experience throughout life the age-specific dearates prevailing in 1994. In 1994 life expectancy for femalewas 79.0 years compared with 72.4 years for males; both figurepresent increases over 1993. The difference in life expectanbetween the sexes was 6.6 years in 1994, the same differencin 1993. In contrast to the widening gap from 1900 to 1972 (2years in 1900, 5.5 years in 1950, and 6.5 years in 1960), tdifference in life expectancy between the sexes narrowed btween 1979 and 1988 (7.7 and 7.8 years throughout the perfrom 1972 through 1979, 7.1 years in 1984, and 6.9 years1988) and between 1990 and 1993.
Between 1993 and 1994, life expectancy for the whitpopulation increased from 76.3 years to 76.5 years, equalingrecord high reached in 1992. Life expectancy for the blacpopulation also increased from 69.2 years in 1993 to 69.5 yeain 1994; in 1992 it was 69.6 years. The difference in lifeexpectancy between the white and black populations was 7years in 1994, slightly smaller than the difference of 7.1 years1993. Although the white-black difference in life expectancnarrowed from 7.6 years in 1970 to 5.7 years in 1982,increased to 7.1 years in 1989 before declining to 7.0 years1990 and 1991, and 6.9 years in 1992.
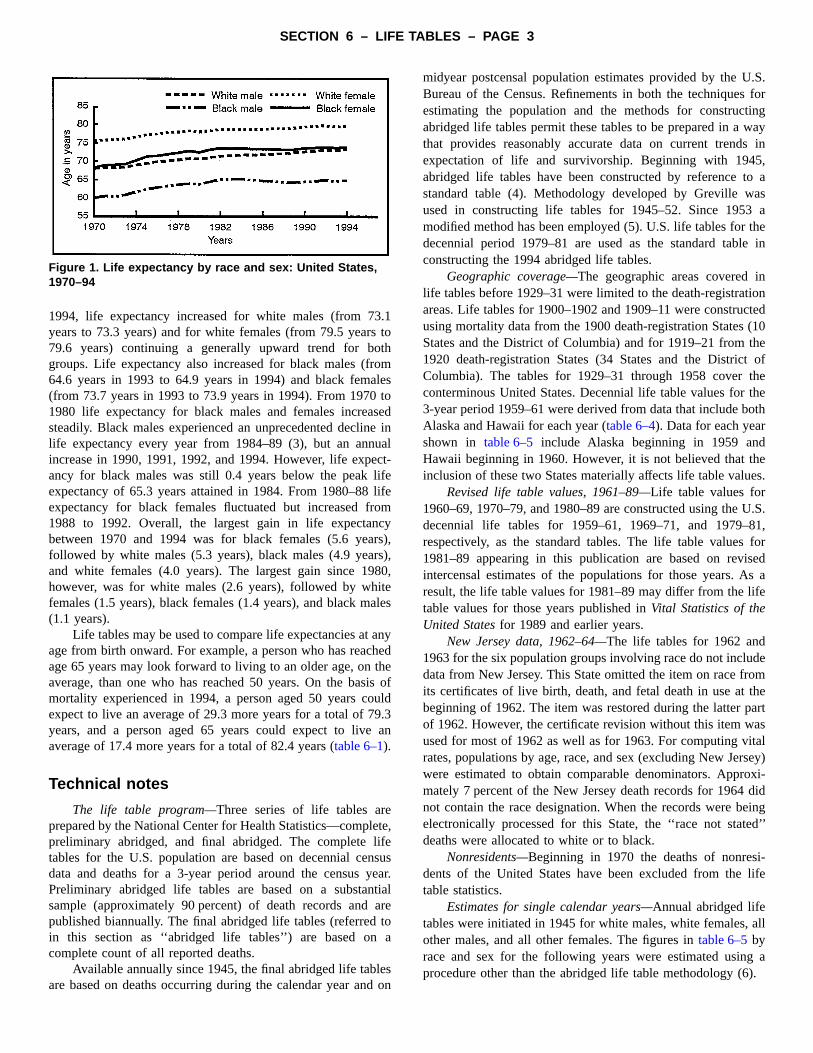
Among the four race-sex groups (figure 1), white femalescontinued to have the highest life expectancy at birth (79years), followed by black females (73.9 years), white male(73.3 years), and black males (64.9 years). Between 1993 a
.S.forgayin,asaein
nted10eofeeth
es.
.S.1,foreda
emertsley)xi-iding’’
ife
ll
a.
Figure 1. Life expectancy by race and sex: United States,1970–94
SECTION 6 – LIFE TABLES – PAGE 3
1994, life expectancy increased for white males (from 73.years to 73.3 years) and for white females (from 79.5 years79.6 years) continuing a generally upward trend for botgroups. Life expectancy also increased for black males (fro64.6 years in 1993 to 64.9 years in 1994) and black femal(from 73.7 years in 1993 to 73.9 years in 1994). From 1970 t1980 life expectancy for black males and females increasesteadily. Black males experienced an unprecedented declinelife expectancy every year from 1984–89 (3), but an annuincrease in 1990, 1991, 1992, and 1994. However, life expecancy for black males was still 0.4 years below the peak lifexpectancy of 65.3 years attained in 1984. From 1980–88 liexpectancy for black females fluctuated but increased fro1988 to 1992. Overall, the largest gain in life expectancbetween 1970 and 1994 was for black females (5.6 yearfollowed by white males (5.3 years), black males (4.9 yearsand white females (4.0 years). The largest gain since 198however, was for white males (2.6 years), followed by whitefemales (1.5 years), black females (1.4 years), and black ma(1.1 years).
Life tables may be used to compare life expectancies at aage from birth onward. For example, a person who has reachage 65 years may look forward to living to an older age, on thaverage, than one who has reached 50 years. On the basismortality experienced in 1994, a person aged 50 years couexpect to live an average of 29.3 more years for a total of 79years, and a person aged 65 years could expect to liveaverage of 17.4 more years for a total of 82.4 years (table 6–1).
Technical notes
The life table program—Three series of life tables areprepared by the National Center for Health Statistics—completpreliminary abridged, and final abridged. The complete lifetables for the U.S. population are based on decennial censdata and deaths for a 3-year period around the census yePreliminary abridged life tables are based on a substantsample (approximately 90 percent) of death records and apublished biannually. The final abridged life tables (referred tin this section as ‘‘abridged life tables’’) are based on acomplete count of all reported deaths.
Available annually since 1945, the final abridged life tableare based on deaths occurring during the calendar year and
1tohmesodinalt-efemys),),0,
les
nyedeofld.3an
e,
usar.ialreo
son
midyear postcensal population estimates provided by the UBureau of the Census. Refinements in both the techniquesestimating the population and the methods for constructinabridged life tables permit these tables to be prepared in a wthat provides reasonably accurate data on current trendsexpectation of life and survivorship. Beginning with 1945abridged life tables have been constructed by reference tostandard table (4). Methodology developed by Greville waused in constructing life tables for 1945–52. Since 1953modified method has been employed (5). U.S. life tables for thdecennial period 1979–81 are used as the standard tableconstructing the 1994 abridged life tables.
Geographic coverage—The geographic areas covered inlife tables before 1929–31 were limited to the death-registratioareas. Life tables for 1900–1902 and 1909–11 were construcusing mortality data from the 1900 death-registration States (States and the District of Columbia) and for 1919–21 from th1920 death-registration States (34 States and the DistrictColumbia). The tables for 1929–31 through 1958 cover thconterminous United States. Decennial life table values for th3-year period 1959–61 were derived from data that include boAlaska and Hawaii for each year (table 6–4). Data for each yearshown in table 6–5 include Alaska beginning in 1959 andHawaii beginning in 1960. However, it is not believed that thinclusion of these two States materially affects life table value
Revised life table values, 1961–89—Life table values for1960–69, 1970–79, and 1980–89 are constructed using the Udecennial life tables for 1959–61, 1969–71, and 1979–8respectively, as the standard tables. The life table values1981–89 appearing in this publication are based on revisintercensal estimates of the populations for those years. Asresult, the life table values for 1981–89 may differ from the lifetable values for those years published inVital Statistics of theUnited Statesfor 1989 and earlier years.
New Jersey data, 1962–64—The life tables for 1962 and1963 for the six population groups involving race do not includdata from New Jersey. This State omitted the item on race froits certificates of live birth, death, and fetal death in use at thbeginning of 1962. The item was restored during the latter paof 1962. However, the certificate revision without this item waused for most of 1962 as well as for 1963. For computing vitarates, populations by age, race, and sex (excluding New Jerswere estimated to obtain comparable denominators. Appromately 7 percent of the New Jersey death records for 1964 dnot contain the race designation. When the records were beelectronically processed for this State, the ‘‘race not stateddeaths were allocated to white or to black.
Nonresidents—Beginning in 1970 the deaths of nonresi-dents of the United States have been excluded from the ltable statistics.
Estimates for single calendar years—Annual abridged lifetables were initiated in 1945 for white males, white females, aother males, and all other females. The figures intable 6–5byrace and sex for the following years were estimated usingprocedure other than the abridged life table methodology (6)
of.S.
,nter
th89.).
dlg-
edr
ecs.ic
SECTION 6 – LIFE TABLES – PAGE 4
Years Race and sex
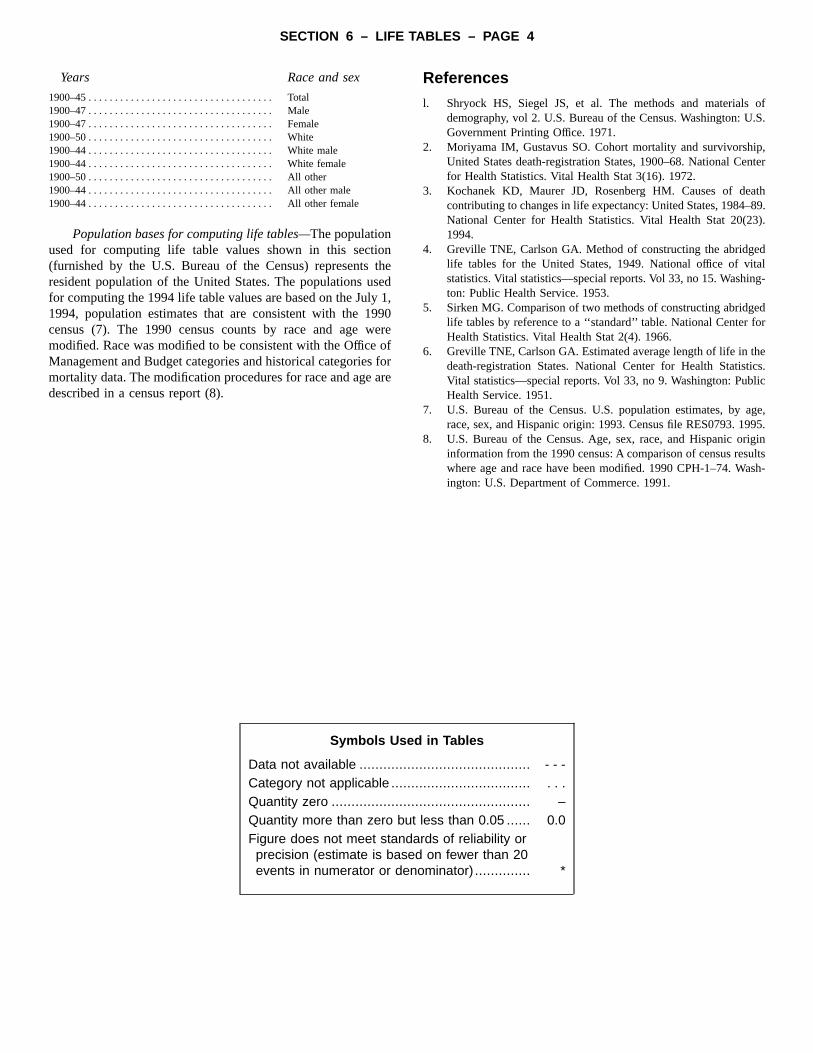
1900–45 . . . . . . . . . . . . . . . . . . . . . . . . . . . . . . . . . . . Total1900–47 . . . . . . . . . . . . . . . . . . . . . . . . . . . . . . . . . . . Male1900–47 . . . . . . . . . . . . . . . . . . . . . . . . . . . . . . . . . . . Female1900–50 . . . . . . . . . . . . . . . . . . . . . . . . . . . . . . . . . . . White1900–44 . . . . . . . . . . . . . . . . . . . . . . . . . . . . . . . . . . . White male1900–44 . . . . . . . . . . . . . . . . . . . . . . . . . . . . . . . . . . . White female1900–50 . . . . . . . . . . . . . . . . . . . . . . . . . . . . . . . . . . . Allother1900–44 . . . . . . . . . . . . . . . . . . . . . . . . . . . . . . . . . . . Allother male1900–44 . . . . . . . . . . . . . . . . . . . . . . . . . . . . . . . . . . . Allother female
Population bases for computing life tables—The populationused for computing life table values shown in this sectio(furnished by the U.S. Bureau of the Census) representsresident population of the United States. The populations usfor computing the 1994 life table values are based on the July1994, population estimates that are consistent with the 19census (7). The 1990 census counts by race and age wmodified. Race was modified to be consistent with the OfficeManagement and Budget categories and historical categoriesmortality data. The modification procedures for race and age adescribed in a census report (8).
ge,95.ginltssh-
Symbols Use
Data not available ...........Category not applicable ...Quantity zero ...................Quantity more than zero bFigure does not meet stanprecision (estimate is basevents in numerator or de
ntheed1,90ereofforre
References
l. Shryock HS, Siegel JS, et al. The methods and materialsdemography, vol 2. U.S. Bureau of the Census. Washington: UGovernment Printing Office. 1971.
2. Moriyama IM, Gustavus SO. Cohort mortality and survivorshipUnited States death-registration States, 1900–68. National Cefor Health Statistics. Vital Health Stat 3(16). 1972.
3. Kochanek KD, Maurer JD, Rosenberg HM. Causes of deacontributing to changes in life expectancy: United States, 1984–National Center for Health Statistics. Vital Health Stat 20(231994.
4. Greville TNE, Carlson GA. Method of constructing the abridgelife tables for the United States, 1949. National office of vitastatistics. Vital statistics—special reports. Vol 33, no 15. Washinton: Public Health Service. 1953.
5. Sirken MG. Comparison of two methods of constructing abridglife tables by reference to a ‘‘standard’’ table. National Center foHealth Statistics. Vital Health Stat 2(4). 1966.
6. Greville TNE, Carlson GA. Estimated average length of life in thdeath-registration States. National Center for Health StatistiVital statistics—special reports. Vol 33, no 9. Washington: PublHealth Service. 1951.
7. U.S. Bureau of the Census. U.S. population estimates, by arace, sex, and Hispanic origin: 1993. Census file RES0793. 19
8. U.S. Bureau of the Census. Age, sex, race, and Hispanic oriinformation from the 1990 census: A comparison of census resuwhere age and race have been modified. 1990 CPH-1–74. Waington: U.S. Department of Commerce. 1991.
d in Tables
................................ - - -
................................ . . ................................ –ut less than 0.05 ...... 0.0dards of reliability ored on fewer than 20nominator) .............. *
x to x + n nqx lx ndx nLx Txoex
SECTION 6 – LIFE TABLES – PAGE 5
x to x + n nqx lx ndx nLx Txoex
SECTION 6 – LIFE TABLES – PAGE 6
x to x + n nqx lx ndx nLx Txoex
SECTION 6 – LIFE TABLES – PAGE 7
x to x + n nqx lx ndx nLx Txoex
SECTION 6 – LIFE TABLES – PAGE 8
SECTION 6 – LIFE TABLES – PAGE 9
SECTION 6 – LIFE TABLES – PAGE 10
(lx)
SECTION 6 – LIFE TABLES – PAGE 11
( lx)
SECTION 6 – LIFE TABLES – PAGE 12
( lx)
SECTION 6 – LIFE TABLES – PAGE 13
(oex)
SECTION 6 – LIFE TABLES – PAGE 14
(oex)
SECTION 6 – LIFE TABLES – PAGE 15
(oex)
SECTION 6 – LIFE TABLES – PAGE 16
SECTION 6 – LIFE TABLES – PAGE 17
SECTION 6 – LIFE TABLES – PAGE 18
This document is hereby certified as an officialFederal document and is fully admissible asevidence in Federal court. Under Federal Ruleof Evidence 902: ‘‘Self-authentication,’’(FED.R.EVID.902), no extrinsic evidence ofauthenticity, that is seal or stamp, is required asa condition for admissibility of this document asevidence in court.
DEPARTMENT OF
HEALTH AND HUMAN SERVICES
Centers for Disease Control and PreventionNational Center for Health Statistics6525 Belcrest RoadHyattsville, Maryland 20782-2003
OFFICIAL BUSINESSPENALTY FOR PRIVATE USE, $300
STANDARD MAIL (A)POSTAGE & FEES PAID
PHS/NCHSPERMIT No. G-281
DHHS Publication No. (PHS) 98-11048-0079 (3/98)