Embed Size (px)
Citation preview

Voice of the American Shareholder Voice of the American Shareholder Quarterly Poll – Wave 5Quarterly Poll – Wave 5
Prepared for:Prepared for:
National Association of National Association of
Investors Corporation (NAIC)Investors Corporation (NAIC)
Final ReportFinal Report
March 18, 2005March 18, 2005

2
Table of Contents
Study Objectives . . . . . . . . . . . . . . . . . . . . . . . . . . . . . . . . . . . . . . . . . . . . . . . . . . . . . 3
Overview of Methodology . . . . . . . . . . . . . . . . . . . . . . . . . . . . . . . . . . . . . . . . . . . . . . 4
Executive Summary . . . . . . . . . . . . . . . . . . . . . . . . . . . . . . . . . . . . . . . . . . . . . . . . . . . 5
Detailed Findings . . . . . . . . . . . . . . . . . . . . . . . . . . . . . . . . . . . . . . . . . . . . . . . . . . . . .19
What Does A Typical Shareholder Look Like, and How do they Behave?. . . . . . . . . . . . . . . . . . . 20
How Do Shareholders Feel about the Economy and Stock Market? . . . . . . . . . . . . . . . . . . . . . . .28
What do Shareholders think about the Current Social Security System? . . . . . . . . . . . . . . . . . . . . 38
How do Shareholders feel about proposed changes to Social Security? . . . . . . . . . . . . . . . . . . . 55
How does the language used influence investors?. . . . . . . . . . . . . . . . . . . . . . . . . . . . . . . . . . . . . 64
What do Shareholders think about Boards of Directors and Sarbanes-Oxley?. . . . . . . . . . . . . . . 75
Demographics . . . . . . . . . . . . . . . . . . . . . . . . . . . . . . . . . . . . . . . . . . . . . . . . . . . . . . . 81
Detailed Methodology . . . . . . . . . . . . . . . . . . . . . . . . . . . . . . . . . . . . . . . . . . . . . . . . . . 86

3
Study Objectives
The National Association of Investors Corporation (NAIC) commissioned Harris Interactive to conduct a series of research studies to better understand the attitudes and behaviors of American investors. This study represents the fifth wave of research conducted for NAIC. The previous waves were conducted in September 2003, January 2004, May 2004, and November 2004.
By regularly reporting on these findings, NAIC expects to capture the voice of the American shareholder.
The survey questions are designed to measure a few key trends in shareholders’ portfolios and investing behavior as well as to understand shareholders’ attitudes and views toward current issues. Specifically, this wave of research focused on the following topics:
Investment profile, goals, strategy, and future plans;
Views toward the stock market;
Perception of the current Social Security system, views toward proposed changes, and impact of these changes on investors; and
Views toward corporate governance issues

4
Overview of Methodology
Sample includes 1,175 shareholders defined as U.S. adults aged 18 or older who currently own individual stocks or stock mutual funds.
A subset of questions about perceptions of the current Social Security system were also asked of non-shareholders, 2,847 U.S. adults aged 18 or older who do not own individual stocks or stock mutual funds.
Questions about proposed changes to Social Security were asked in two ways. About half of respondents were asked about private accounts and roughly half were asked about personal accounts.
To be consistent with President Bush’s use of “personal accounts,” the term personal will be used throughout this report.
Interviewing was conducted between February 15 and 25, 2005.
The interview averaged 10 minutes in length.
All interviewing was conducted online using the Harris Poll Online (HPOL) database consisting of several million members who have agreed to participate in survey research.
5
Executive SummaryExecutive Summary

6
Executive SummaryExecutive Summary
The general public, and specifically shareholders, believe that our current Social Security system is very much or somewhat in a state of crisis and that fundamental changes are needed. They recognize the problem and are not unwilling to sacrifice in order to strengthen the future of the system; however many are not optimistic about the availability of benefits for future generations. And most disagree with President Bush about the best course of action to follow.
Nearly two-thirds believe the current system is very much or somewhat in a state of crisis, and more than half believe that while there are some good things in the current system, fundamental changes are needed.
The top problems cited with the current system are that there will be too few workers in the future to support the number of retirees and that some people who do not need benefits are receiving them.
Specifically, more than half of shareholders cite too few workers in the future as the top problem with the system.
A majority of shareholders think it is somewhat or not at all likely that their children or grandchildren will receive their Social Security benefits.
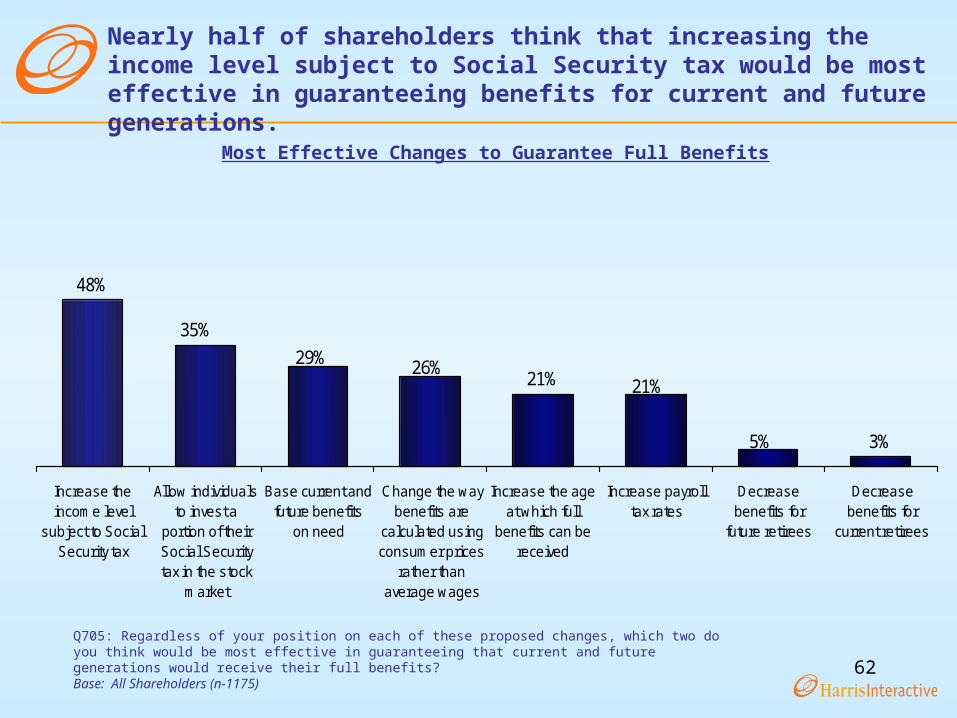
The proposal with the greatest level of support from shareholders (69%) is that the income level subject to Social Security tax should be increased, a finding which holds true even among those with incomes of $75,000 or more. Furthermore, shareholders feel that increasing the income level would be among the most effective changes to make to guarantee that current and future generations receive their benefits.
Many shareholders oppose and fully one-third strongly oppose President Bush’s proposal to reform Social Security.
While language itself (private vs. personal) did not have a significant impact on shareholders’ views, party affiliation (Democrat vs. Republican) did, with Republicans being much more supportive than Democrats of the overall idea of personal or private accounts.

7
Executive SummaryExecutive Summary
Despite such strong disapproval of the President’s plan, shareholders recognize that there may be positive impacts as a result of the creation of personal accounts. Paradoxically, many are not ready to commit their own money. To reap those potential benefits, education would be necessary for those not familiar or comfortable with investing.
Many people are in favor of the idea that people should have the choice to decide how some of their Social Security payroll tax is invested.
Three-quarters of shareholders agree that most people are not knowledgeable enough about investing to benefit from these accounts, however, an even higher proportion (82%) think that if personal accounts are created, the government should provide education about how to invest.
Similar proportions agree that personal accounts would make the stock market accessible to those who would not otherwise have access and over half agree that these accounts will increase the amount of money available to retirees.
Overall, fully one in five shareholders would not invest anything in personal accounts and more than one-third (36%) would choose to invest less than the 33% currently proposed by President Bush.
8
Executive SummaryExecutive Summary
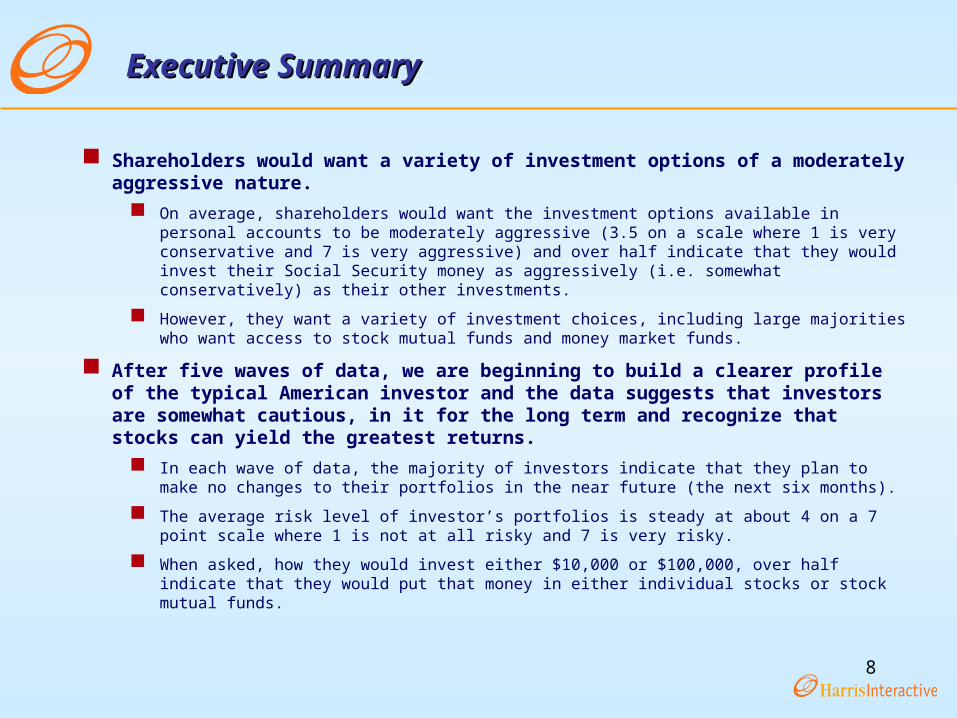
Shareholders would want a variety of investment options of a moderately aggressive nature.
On average, shareholders would want the investment options available in personal accounts to be moderately aggressive (3.5 on a scale where 1 is very conservative and 7 is very aggressive) and over half indicate that they would invest their Social Security money as aggressively (i.e. somewhat conservatively) as their other investments.
However, they want a variety of investment choices, including large majorities who want access to stock mutual funds and money market funds.
After five waves of data, we are beginning to build a clearer profile of the typical American investor and the data suggests that investors are somewhat cautious, in it for the long term and recognize that stocks can yield the greatest returns.
In each wave of data, the majority of investors indicate that they plan to make no changes to their portfolios in the near future (the next six months).
The average risk level of investor’s portfolios is steady at about 4 on a 7 point scale where 1 is not at all risky and 7 is very risky.
When asked, how they would invest either $10,000 or $100,000, over half indicate that they would put that money in either individual stocks or stock mutual funds.

9
Executive SummaryExecutive Summary
However, investors’ overall level of confidence in the economy and stock market are not as strong as in previous waves of research.
The NAIC Investor Confidence Index has declined again to it’s lowest level at +7.8 from a high of +19.3 in January 2004.
There is a great deal of fluctuation in the components that make up the Index and the data shows that investors are increasingly thinking that it’s a good time to move into safer investments, and decreasingly thinking that most stocks are a better bargain now than one year ago.
Belief that the overall direction of the US economy is going in the right direction is comparable to November 2004, with just over half thinking the economy is headed in the right direction, still down considerably from a high of 71% in January 2004.
These data also suggest that men are becoming slightly more cautious and are now more similar to women in their overall attitudes and beliefs, as compared to previous waves.
Men’s views of the economy are consistent since November 2004 while women’s show a slight increase.
Half of men now feel that it’s a good time for new investors to get involved in the stock market, compared with 66% in January 2004. In comparison, the proportion of female shareholders who feel this way has increased since November (50% vs. 45%).
The proportion of men who feel that it’s a good time to move into safer investments has steadily increased from a low of 29% in January 2004 to 40% in February 2005. Women, on the other hand, have remained fairly steady in their belief (range: 40% - 44%) about moving into safer investments.

10
Profile of the typical American ShareholderProfile of the typical American Shareholder
In general, the typical American shareholders’ behaviors and investment portfolio has remained virtually unchanged since January 2004.
Shareholders hold a variety of investments in addition to individual stocks and stock mutual funds, mostly including individual retirement accounts that they control or through their employers.
Shareholders continue to characterize most of their investments as moderately risky.
4 in 10 male shareholders characterize their investments as risky (40%) while less than 3 in 10 female shareholders (27%) do the same.
The majority of shareholders plan to make no changes to their investments in individual stocks (64%) or stock mutual funds (68%) over the next six months.
If they had $10,000 or $100,000 to invest, shareholders would continue to invest nearly half of this money in individual stocks or stock mutual funds. This allocation has remained virtually the same since January 2004.

11
Views toward the economy and stock marketViews toward the economy and stock market
Shareholders’ confidence in the direction of the U.S. economy remains virtually unchanged since November 2004, when confidence declined to its lowest levels in this series of research.
When asked about confidence in the United States economy, 55% of shareholders indicate that they have “a fair amount” or “a great deal” of confidence that it is moving in the right direction – down from 60% in May 2004.
Women (53%) have slightly less confidence than do men (57% a great deal/fair amount)
The NAIC Shareholder Confidence Index has dropped slightly from +9.3 in November 2004 to +7.8 in February 2005.
Currently the NAIC Index is +7.8, down from +19.3 in January 2004. On a scale from -100 to +100 (where zero indicates a neutral attitude towards the stock market), an Index of +7.8 shows trace levels of optimism tempered by concern about the direction of the economy.
Compared to November 2004, there were large fluctuations in the components for confidence in the U.S. economy, -2.5 now down from 6.5 in November, and most stocks being a better bargain now than they were a year ago, 9.2 in November to -0.2 now.

12
Views toward the economy and stock marketViews toward the economy and stock market
As in November 2004, half of shareholders (50%) believe it’s a good time for new investors to get involved in the stock market.
Once again, there has been a decline in the proportion of shareholders who think that most stocks are a better bargain now than they were a year ago (29% now versus 35% then).
Since January 2004, this level of agreement has decreased from nearly 4 in 10 shareholders (43%) to less than 3 in 10 (29%).
Consistent with the previous finding, shareholders continue to agree that it’s a good time to move money into safer, lower risk investments from higher return/higher risk investments, with 42% who now hold this view.
While in January 2004, male and female shareholders disagreed on this point, with 29% of men agreeing versus 40% of females, now they are both at similar levels of agreement (40% of males versus 44% of females).
The proportion who agree that it’s a good time to move money into less risky investments has steadily increased since January 2004.

13
Perceptions of the Current Social Security SystemPerceptions of the Current Social Security System
Overall, about one-quarter of the public is following the Social Security debate extremely or very closely. Shareholders are more likely than non-shareholders to be following the issue this closely.
In general, roughly equal proportions of male and female shareholders are following the issue closely.
Older shareholders, those aged 50 and older, are following it more closely than younger shareholders.
Nearly two-thirds of the public, shareholders and non-shareholders alike, believe that the current Social Security system is very much or somewhat in a state of crisis.
Male shareholders (59%) are less likely than females (66%) to believe that Social Security is in a state of crisis.
Younger shareholders, those aged 35 or less, are more likely to believe there is a crisis than older shareholders.

14
Perceptions of the Current Social Security SystemPerceptions of the Current Social Security System
The majority of shareholders believe that fundamental changes are needed to the Social Security system.
However, nearly 1 in 4 shareholders 35 or less (24%) think that the Social Security system needs to be completely rebuilt.
Shareholders think that the top problem with Social Security is that, in the future, there will be too few workers to support the number of people receiving benefits (56%).
However, albeit not a majority (45%), non-shareholders believe the top problem is that some people who don’t really need benefits are receiving them. This problem ranks as the second top concern for shareholders.
Majorities of the public, regardless of investor status, feel that it is somewhat or not at all likely that their children and grandchildren will receive their Social Security benefits.
Both shareholders and non-shareholders feel that it is unlikely that these Social Security benefits will be available to their children and to their grandchildren. Shareholders are more likely than non-shareholders to believe that they will be available to these two groups.

15
Perceptions of the current Social Security SystemPerceptions of the current Social Security System
The majority of the public, including shareholders (55%) and non-shareholders (63%) are opposed to President Bush’s Social Security plan, with roughly one-third indicating that they strongly oppose his proposal.
More than one third of both male and female shareholders strongly oppose the President’s plan.
Younger shareholders are more likely than older shareholders to support the plan although less than half do so.

16
Views toward changes to Social SecurityViews toward changes to Social Security
Nearly 70% of shareholders agree that the level of income subject to Social Security tax should be increased. Similarly, 70% also agree that people should have a choice as to how their Social Security tax is invested.
7 out of 10 shareholders favor increasing the level of income subject to Social Security tax, regardless of their own level of income. Moreover, half of shareholders agree this is the right move in order to guarantee benefits continue.
Men and women agree as to which types of changes should be made, citing an increase in the level of income subject to Social Security tax as the number one change. However, women are more likely than men to favor letting people decide how to invest their taxes while capping the annual or lifetime amount of money one could invest in a personal Social Security account.
Shareholders generally agree that the government should manage personal account investments and that private/personal accounts will increase the amount of money available to retirees in the long-run. However, shareholders also agree that managing a system of private/personal accounts will cost more than administering the current system.
Despite the notion that personal accounts will cost more than administering the current system, shareholders generally support the creation of personal accounts. Subsequently, shareholders are in agreement that the cost to manage such a personal account system should rest equally with the individual account owner as well as the government.
Large majorities (76%) feel that most people are not knowledgeable enough about how to invest to benefit from these accounts and even more (82%) feel that the government should provide education to the public concerning investment options, if personal accounts are created.

17
Impact of Proposed Changes on InvestorsImpact of Proposed Changes on Investors
The majority of shareholders would choose to invest less than the 33% of Social Security tax President Bush’s proposal would allow.
Shareholders generally agree that the portions of one’s Social Security tax that are to be invested in personal accounts should be invested in a rather conservative fashion. Men and women also agreed that personal investments should be made in a conservative manner.
Consistent with the findings that shareholder’s investments are moderately risky and would want somewhat more conservative choices, 60% of shareholders would invest their Social Security tax as aggressively as their other investments.
Nearly 70% of shareholders would like the option to choose from stock mutual funds in which their Social Security tax would be invested through a private/personal account. Further, nearly 60% would like the opportunity to invest their personal account holdings in money market funds.

18
Corporate GovernanceCorporate Governance
Nearly three-quarters of shareholders believe Boards of Directors are generally ineffective in overseeing companies they govern.
Further, as a consequence of recent corporate scandals, nearly 80% of shareholders believe directors will research companies more thoroughly before taking on the responsibility of joining a corporate board.
Just over 60% of shareholders believe that the financial and accounting regulations governing publicly held companies are too lenient.
Shareholders view Sarbanes-Oxley with mixed feelings, recognizing the necessary balance of protecting shareholder interests while allowing companies the freedom to run the business.
Most shareholders feel that the recent Sarbanes-Oxley legislation is in the best interest of investors as well as corporations yet half think too much regulation makes the cost of doing business too high.
However, for many shareholders Sarbanes-Oxley has not had its intended effect of increasing confidence in public statements. Nearly 92% of shareholders feel their confidence in public statements made by companies has stayed the same or decreased since the passage of Sarbanes-Oxley.

19
Detailed FindingsDetailed Findings

20
What Does the Typical American Shareholder Look What Does the Typical American Shareholder Look Like, and How Do They Behave?Like, and How Do They Behave?

21
Since November 2004, shareholders have increased the amount they have invested in both individual stocks and stock mutual funds.
Total Amount Invested in Individual Stocks and Stock Mutual Funds
Q1440: You mentioned that you have the following investments. About how much do you have invested in the following…?Base: All Shareholders
Individual Stocks (%) Stock Mutual Funds (%)
Jan ‘04 May ‘04 Nov ’04 Feb ‘05 Jan ‘04 May ‘04 Nov ‘04 Feb ‘05
Less than $5,000 41 41 36 42 30 32 25 30
$5,000 - $9,999 10 9 12 9 8 10 6 5
$10,000 - $49,999 20 28 20 25 29 31 25 32
$50,000 - $99,999 9 7 6 7 9 11 13 14
More than $100,000
19 15 13 17 24 16 15 18
MEAN $108,900 $64,200 $63,400 $156,200 $84,100 $56,300 $67,900 $94,400
MEDIAN $7,000 $8,350 $5,700 $8,700 $19,000 $14,640 $16,160 $17,400

22
Q430: Please indicate which types of investments or investment accounts you personally have. Do you currently have . . .?Base: All shareholders
Jan ‘04 May ‘04 Nov ‘04 Feb ‘05
% % % %
Individual stocks (not including stock options or restricted stocks from the company that I work for)
71 67 66 67
Stock mutual funds 67 70 69 72
Individual retirement account that I control (i.e., IRA, KEOGH, SEP)
56 51 52 59
Individual retirement accounts through my employer (i.e., 401(k) retirement savings plan or 403(b) retirement savings plan, or profit sharing plan)
52 52 50 51
Bonds or bond funds 33 35 35 37
Stock options or restricted stocks from the company that I work for
15 17 12 12
Other type of investment not mentioned 21 21 25 25
In addition to individual stocks and stock mutual funds, most shareholders also have various other types of investments.
Types of Investments Owned

23Q510: Again thinking about your investment portfolio, over the next six months, do you plan to increase, decrease or make no change in your investments in each of the following? Base: All shareholders
As in November 2004, the majority of shareholders plan to make no changes to their investments over the next six months.
Plans for Investments Over The Next Six Months
Increase (%) Make No Change (%) Decrease (%)
2004 2005 2004 2005 2004 2005
Jan May Nov Feb Jan May Nov Feb Jan May Nov Feb
Individual stocks 34 26 29 28 62 67 63 64 5 7 8 8
Stock mutual funds 31 24 24 28 64 71 69 68 5 5 7 4
Individual bonds 6 8 8 8 89 88 85 87 5 3 6 5
Bond mutual funds 10 11 11 11 84 84 83 85 5 5 6 3
Cash 39 38 38 35 52 54 52 55 9 8 10 10
Alternative investments
8 5 7 8 90 92 89 88 2 2 4 4
Other investments not mentioned
15 16 15 15 83 81 81 82 2 3 3 3

24Q510: Again thinking about your investment portfolio, over the next six months, do you plan to increase, decrease or make no change in your investments in each of the following? Base: All shareholders (n=1175; Male=674; Female=501)
Nearly one-third of male shareholders plan to increase their investments in stock mutual funds over the next six months, compared to just one-quarter of women.
Plan to Increase Investments Over The Next Six Months
Increase (%)
Total Male Female
Individual stocks 28 27 29
Stock mutual funds 28 31 24
Individual bonds 8 7 8
Bond mutual funds 11 12 10
Cash 35 35 35
Alternative investments (such as hedge funds, private equity and managed futures)
8 9 6
Other investments not mentioned
15 16 14

25
Whether they have $10,000 or $100,000 to invest, shareholders would continue to invest nearly half in stock mutual funds and individual stocks.
Percentage Allocated to Each Investment
Have $10,000 to Invest
Total (Mean)
Have $100,000 to Invest
Total (Mean)
Jan ‘04 May ‘04 Feb ‘05 Jan ‘04 May ‘04 Feb ‘05
Individual stocks 32 26 26 27 25 24
Stock mutual funds 26 27 27 27 27 28
Cash 14 16 14 13 15 14
Bond mutual funds 10 10 10 9 10 10
Individual bonds 6 5 6 6 6 7
Alternative investments 3 3 4 5 5 5
Other investments 7 11 12 13 13 12
Q515: If you had $10,000/$100,000 to invest, how much would you invest in each of the following? Base: All shareholdersNote: For this question, half of all respondents were asked to allocate $10,000 across the investments listed above and the other half were asked to allocate $100,000 across the investments listed above.

26
Q505: Investment risk is typically defined as a greater likelihood that your portfolio may lose value but is often associated with higher returns. On a scale from 1 to 7, in which “1” represents “not risky at all” and a “7” represents “very risky”, how would you characterize most of your investments?Base: All shareholders
Risk Level of Current Investments
36%
33%
38%
32%30%
35%
28%
37%
34%
31%
34%34%32%
34%
30%
Very Risky (5, 6, 7 Net) Moderately Risky (4) Not Risky (1, 2, 3 Net)
Sept '03 Jan '04 May '04 Nov '04 Feb '05
Sept ‘03 Jan ’04 May ’04 Nov ’04 Feb ‘05MEAN = 4.0 4.1 3.9 3.9 3.9
Shareholders continue to characterize their investments as moderately risky.

27Q505: How would you characterize most of your investments on a scale from “not risky at all” to “very risky”? Base: All shareholders
Sept ’03 Jan ’04 May ’04 Nov ‘04 Feb ‘05
% % % % %
Very Risky (5, 6, 7) (Net) 36 38 35 34 34
Men 42 45 41 43 40
Women 27 28 27 24 27
Moderately Risky (4) 30 32 28 31 32
Men 29 28 26 28 30
Women 31 38 32 35 35
Not Risky at All (1, 2, 3) (Net)
33 30 37 34 34
Men 28 27 33 29 30
Women 41 33 41 41 39
Mean 4.0 4.1 3.9 3.9 3.9
Men 4.2 4.2 4.0 4.2 4.1
Women 3.7 3.9 3.8 3.6 3.7
Risk Level of Current Investments By Gender
Four in ten male shareholders characterize their investments as risky while less than 3 in 10 female shareholders do the same.

28
How Do Shareholders Feel about the How Do Shareholders Feel about the Economy and Stock Market?Economy and Stock Market?

29
Confidence in the U.S. economy remains at similar levels as in November 2004.
Q410: How much confidence do you have that the United States’ economy is generally moving in the right direction?Base: All shareholders
57%
43%
71%
29%
60%
40%
54%
46%
55%
45%
A Great Deal/A Fair Amount (Net) Not Much/None At All (Net)
Sept '03 Jan '04 May '04 Nov '04 Feb '05
Confidence in the U.S. Economy
30
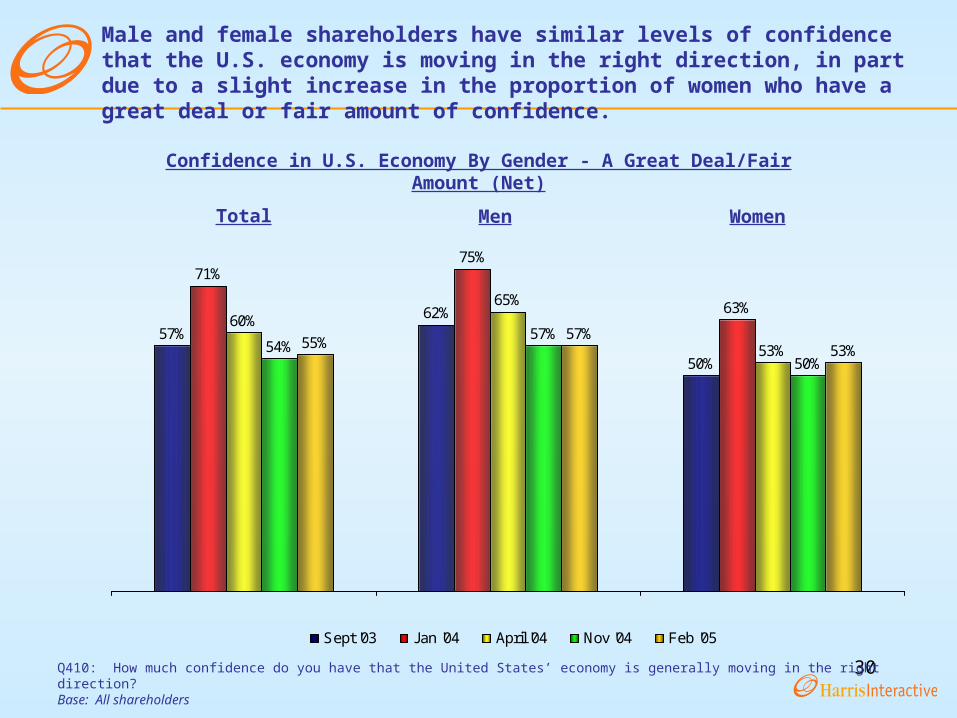
Male and female shareholders have similar levels of confidence that the U.S. economy is moving in the right direction, in part due to a slight increase in the proportion of women who have a great deal or fair amount of confidence.
Q410: How much confidence do you have that the United States’ economy is generally moving in the right direction?Base: All shareholders
Confidence in U.S. Economy By Gender - A Great Deal/Fair Amount (Net)
Men Women
57%62%
50%
71%75%
63%60%
65%
53%57%
50%55%
57%53%54%
Sept '03 Jan '04 April '04 Nov '04 Feb '05
Total

31
Feb 2005NAIC INDEX
+7.8
The NAIC Index of Investor Confidence has consistently declined since January 2004, reaching a low of +7.8.
February 2005Component Scores for Each Item
Included in NAIC Index
Note: The NAIC Index was calculated based on 7 components that reflect shareholder confidence in the economy and stock market and is rated on a scale from -100 to +100 where 0 is the midpoint. A more detailed explanation of the Index is found in the Detailed Methodology.
19.310.9 9.3 7.8
-100
-80
-60
-40
-20
0
20
40
60
80
100
Jan'04
May'04
Nov'04
Feb'05
Question Positive Neutral NegativeComponent
Scores
Q410 9.7 78.1 12.2 -2.5
Q511a1 27.5 64.4 8.0 19.5
Q511a2 27.9 67.6 4.4 23.5
Q505 34.2 31.8 34.0 0.2
Q502a1 25.9 32.3 41.8 -16.0
Q502a2 29.3 41.3 29.4 -0.2
Q502a3 50.1 29.9 20.0 30.1
= 54.6
NAIC
Index = +7.8

32
The NAIC Index of Investor Confidence has declined steadily for men since January 2004, reaching 8.6 in February 2005. The Index for women reached its lowest point of 3.4 in November 2004 and increased to 6.9 in February 2005.
Note: The NAIC Index was calculated based on 7 components that reflect shareholder confidence in the economy and stock market and is rated on a scale from -100 to +100 where 0 is the midpoint. A more detailed explanation of the Index is found in the Detailed Methodology.
24.319.8
13.98.6
-100
-80
-60
-40
-20
0
20
40
60
80
100
Jan '04 May'04
Nov'04
Feb'05
13.47.3 3.4 6.9
-100
-80
-60
-40
-20
0
20
40
60
80
100
Jan'04
May'04
Nov'04
Feb'05
FemaleMale
33
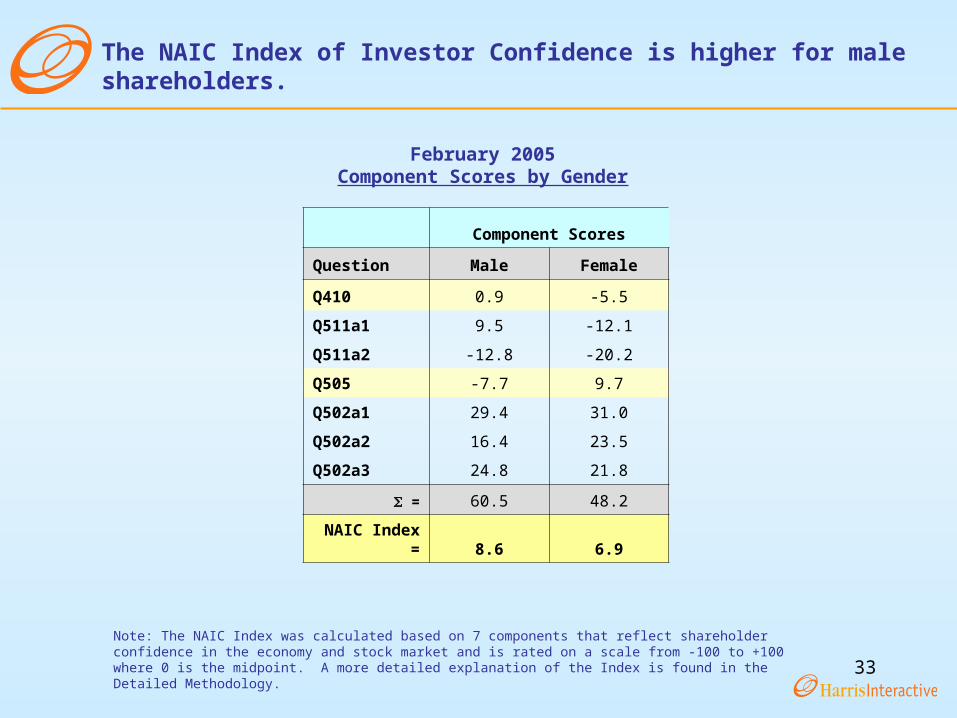
Note: The NAIC Index was calculated based on 7 components that reflect shareholder confidence in the economy and stock market and is rated on a scale from -100 to +100 where 0 is the midpoint. A more detailed explanation of the Index is found in the Detailed Methodology.
Component Scores
Question Male Female
Q410 0.9 -5.5
Q511a1 9.5 -12.1
Q511a2 -12.8 -20.2
Q505 -7.7 9.7
Q502a1 29.4 31.0
Q502a2 16.4 23.5
Q502a3 24.8 21.8
= 60.5 48.2
NAIC Index = 8.6 6.9
February 2005Component Scores by Gender
The NAIC Index of Investor Confidence is higher for male shareholders.
34
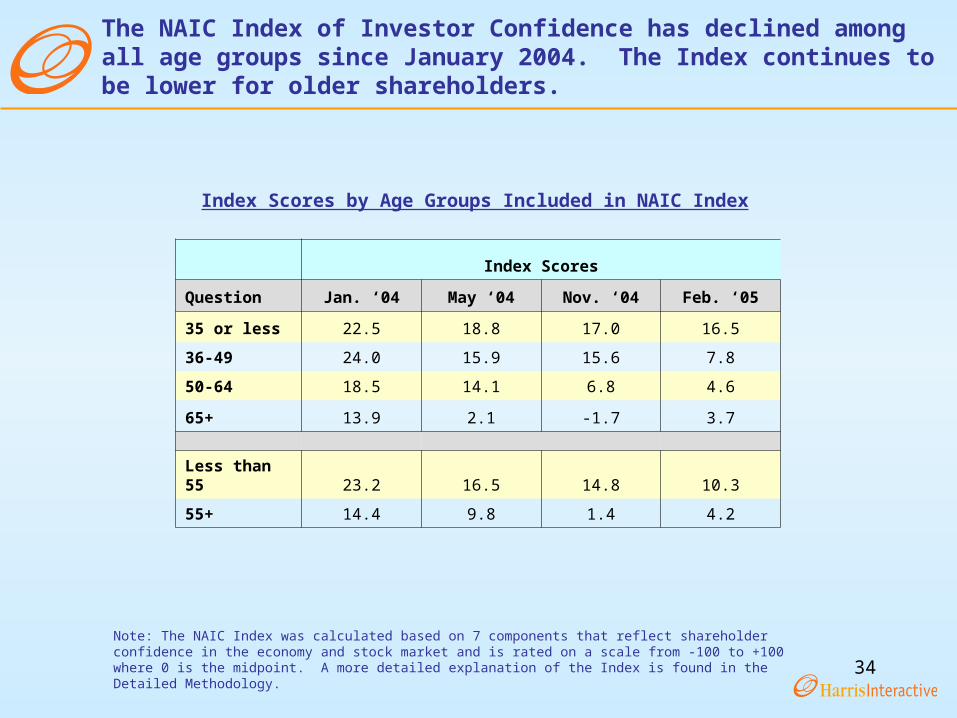
Note: The NAIC Index was calculated based on 7 components that reflect shareholder confidence in the economy and stock market and is rated on a scale from -100 to +100 where 0 is the midpoint. A more detailed explanation of the Index is found in the Detailed Methodology.
Index Scores
Question Jan. ‘04 May ‘04 Nov. ‘04 Feb. ‘05
35 or less 22.5 18.8 17.0 16.5
36-49 24.0 15.9 15.6 7.8
50-64 18.5 14.1 6.8 4.6
65+ 13.9 2.1 -1.7 3.7
Less than 55 23.2 16.5 14.8 10.3
55+ 14.4 9.8 1.4 4.2
Index Scores by Age Groups Included in NAIC Index
The NAIC Index of Investor Confidence has declined among all age groups since January 2004. The Index continues to be lower for older shareholders.

35
Note: The NAIC Index was calculated based on 7 components that reflect shareholder confidence in the economy and stock market and is rated on a scale from -100 to +100 where 0 is the midpoint. A more detailed explanation of the Index is found in the Detailed Methodology.
Component Scores
Question 35 or less 36-49 50-64 65+ Less than 55 55+
Q410 -3.4 -7.1 -0.5 4.6 -4.7 2.8
Q511a1 16.1 13.1 -8.2 -21.2 10.5 -15.5
Q511a2 -4.2 -14.3 -23.3 -20.7 -11.2 -23.1
Q505 -4.0 -9.8 1.2 13.9 -6.5 9.5
Q502a1 49.1 25.3 25.0 24.0 32.4 26.7
Q502a2 29.2 19.6 16.4 13.7 22.9 14.4
Q502a3 32.8 28.2 21.5 11.4 29.1 15.1
= 115.6 54.9 32.1 25.6 72.4 29.7
NAIC Index = 16.5 7.8 4.6 3.7 10.3 4.2
February 2005Component Scores by Age Groups Included in NAIC Index
The NAIC Index of Investor Confidence declines with age.

36Q501: How strongly do you agree or disagree with each of the following statements? Base: All shareholders
Half of shareholders agree that it’s a good time for new investors to get involved in the stock market.
62%
24%
15%
51%
25% 23%
50%
27% 24%
50%
30%
20%
Strongly/ Somewhat Agree Neither agree nor disagree Strongly/ Somewhat Disagree
Jan. '04 May '04 Nov '04 Feb '05
“It’s a good time for new investors to get involved in the stock market.”

37
For the first time, women are as likely as men to think it is a good time for new investors to get involved in the stock market.
Q502: How strongly do you agree or disagree with each of the following statements?Base: All shareholders
62%66%
56%51%
56%
44%
54%
45%50% 50% 50%50%
Total Men Women
Jan. '04 April '04 Nov '04 Feb '05
% Strongly/Somewhat Agree:“It’s a good time for new investors to get involved in the stock market.”

38
Since January 2004, fewer shareholders agree that most stocks are a better bargain now than they were a year ago.
43%
26%31%
41%
26%33%35% 38%
26%29%
41%
29%
Strongly/ Somewhat Agree Neither agree nor disagree Strongly/ Somewhat Disagree
Jan. '04 May '04 Nov '04 Feb' 05
“Most stocks are a better bargain now than they were one year ago.”
Q502: How strongly do you agree or disagree with each of the following statements?Base: All shareholders

39
Slightly more female shareholders agree that stocks are a better bargain now than they were a year ago.
43%
26%31%
41%
26%33%35% 38%
26%29% 26%33%
Total Men Women
Jan. '04 May '04 Nov '04 Feb' 05
%Strongly/Somewhat Agree:“Most stocks are a better bargain now than they were one year ago.”
Q502: How strongly do you agree or disagree with each of the following statements?Base: All shareholders

40Q501: How strongly do you agree or disagree with each of the following statements? Base: All shareholders
Since January 2004, the proportion of shareholders who agree that it’s a good time to move money into safer investments has steadily increased, with 42% of shareholders now holding this belief.
34% 32%35%37%
32% 30%
40%36%
24%
42%
32%26%
Strongly/ Somewhat Agree Neither agree nor disagree Strongly/ Somewhat Disagree
Jan. '04 May '04 Nov '04 Feb '05
“It’s a good time to move money into safer, lower risk investments from higher return/higher risk investments.”

41
While about 4 in 10 female shareholders have agreed since January 2004 that it’s a good time to move money into lower risk investments, the proportion of men who feel this way has steadily increased.
34%29%
40%37%
33%
44%40% 39% 41%42% 40%
44%
Total Men Women
Jan. '04 April '04 Nov '04 Feb '05
% Strongly/Somewhat Agree:“It’s a good time to move money into safer, lower risk investments
from higher return/higher risk investments.”
Q502: How strongly do you agree or disagree with each of the following statements?Base: All shareholders

42
What do Shareholders think aboutWhat do Shareholders think about the Current Social Security System?the Current Social Security System?

43Q600: How closely would you say you have been following the Social Security Issue in the news?Base: All Adults
Shareholders are following the Social Security issue more closely than non-shareholders yet fully 4 out of 10 investors are following it only somewhat closely.
9%
17% 19%
41%
15%14%20% 20%
38%
8%7%
16% 18%
43%
17%
Extremely closely Very closely Closely Somewhatclosely
Not at all closely
Total (n=4077) Shareholders (n=1175) Non-Shareholders (n=2847)
How Closely Follow Social Security Issue
Total Shareholders Non-ShareholdersExtremely/Very closely 26 34 22Somewhat/Not at all closely 56 46 60

44Q600: How closely would you say you have been following the Social Security Issue in the news?Base: All Shareholders
One-third of both male and female shareholders are following the Social Security issue extremely or very closely.
14%20% 20%
38%
8%12%
22% 23%
36%
6%
16% 17% 17%
40%
11%
Extremely closely Very closely Closely Somewhat closely Not at all closely
Total (n=1175) Male (n=674) Female (n=501)
How Closely Follow Social Security Issue By Gender
Total Male FemaleExtremely/Very closely 34 34 33Somewhat/Not at all closely 46 42 51

45Q600: How closely would you say you have been following the Social Security Issue in the news?Base: All Shareholders
How Closely Follow Social Security Issue By Age
Older shareholders are following the Social Security issue more closely than younger shareholders.
14%20%
38%
8%8%
17%
43%
13%9%
19%18%22%
5% 3%
20%19%
12%
40%
20%
34%
20%
33%
20% 23%21%
Extremely closely Very closely Closely Somewhat closely Not at all closely
Total (n=1175) 35 or less (n= 136) 36-49 (n= 251) 50-64 (n= 429) 65+ (n= 359)
Total 35 or less 36-49 50-64 65+Extremely/Very closely 34 25 28 41 41Somewhat/Not at all closely 46 56 52 39 36

46Q601: To what degree do you believe that the Social Security system, as we know it, is in a state of crisis?Base: All Adults
More than 6 in 10 shareholders believe that the Social Security system is very much or somewhat in a state of crisis.
32% 32%24%
12%
33% 33%
23%
11%14%
24%32%
29%
Very much Somewhat A little Not at all
Total (n=4077) Shareholders (n=1175) Non-Shareholders (n=2847)
Belief That Social Security is in a State of Crisis
Total Shareholders Non-ShareholdersVery much/Somewhat 65 62 66A little/Not at all 35 38 34

47Q601: To what degree do you believe that the Social Security system, as we know it, is in a state of crisis?Base: All Shareholders
Male shareholders are less likely than female shareholders to believe that the Social Security system is in a state of crisis.
29%32%
24%
14%
28% 31%24%
17%
31%35%
25%
10%
Very much Somewhat A little Not at all
Total (n=1175) Male (n=674) Female (n=501)
Belief that Social Security is in a State of Crisis By Gender
Total Male FemaleVery much/Somewhat 62 59 66A little/Not at all 38 41 34

48Q601: To what degree do you believe that the Social Security system, as we know it, is in a state of crisis?Base: All shareholders
A belief that Social Security is in a state of crisis declines with age, which is possibly related to one’s belief about the availability of their benefits.
29%32%
24%
14%
37%34%
19%
10%
33% 33%
21%
13%
27%32%
27%
13%
20%
31% 30%
19%
Very much Somewhat A little Not at all
Total (n=1175) 35 or less (n= 136) 36-49 (n= 251) 50-64 (n= 429) 65+ (n= 359)
Total 35 or less 36-49 50-64 65+Very much/Somewhat 62 71 66 59 51A little/Not at all 38 29 34 41 49
Belief That Social Security is in a State of Crisis By Age

49Q603: Thinking of what you have read and heard about the President’s Social Security plan, how much do you support or oppose his plan for social security reform?Base: All Adults
The majority of shareholders and non-shareholders oppose President Bush’s Social Security plan including roughly one-third of each group who strongly opposes his plan.
Support for President Bush’s Social Security Plan
10%
30% 28%33%
14%
31%
22%
34%
8%
29% 31% 32%
Strongly Support Somewhat Support Somewhat Oppose Strongly Oppose
Total (n=4077) Shareholders (n=1175) Non-Shareholders (n=2847)
Total Shareholders Non-ShareholdersStrongly/Somewhat Support 39 45 37Strongly/Somewhat Oppose 61 55 63

50Q603: Thinking of what you have read and heard about the President’s Social Security plan, how much do you support or oppose his plan for social security reform?Base: All Shareholders
Male and female shareholders feel similarly about President Bush’s Social Security plan with roughly one-third strongly opposing it.
Support for President Bush’s Social Security Plan
14%
31%
22%
34%
15%
31%
21%
33%
13%
30%23%
35%
Strongly Support Somewhat Support Somewhat Oppose Strongly Oppose
Total (n=1175) Male (n=674) Female (n=501)
Total Male FemaleStrongly/Somewhat Support 45 46 42Strongly/Somewhat Oppose 55 54 58
51
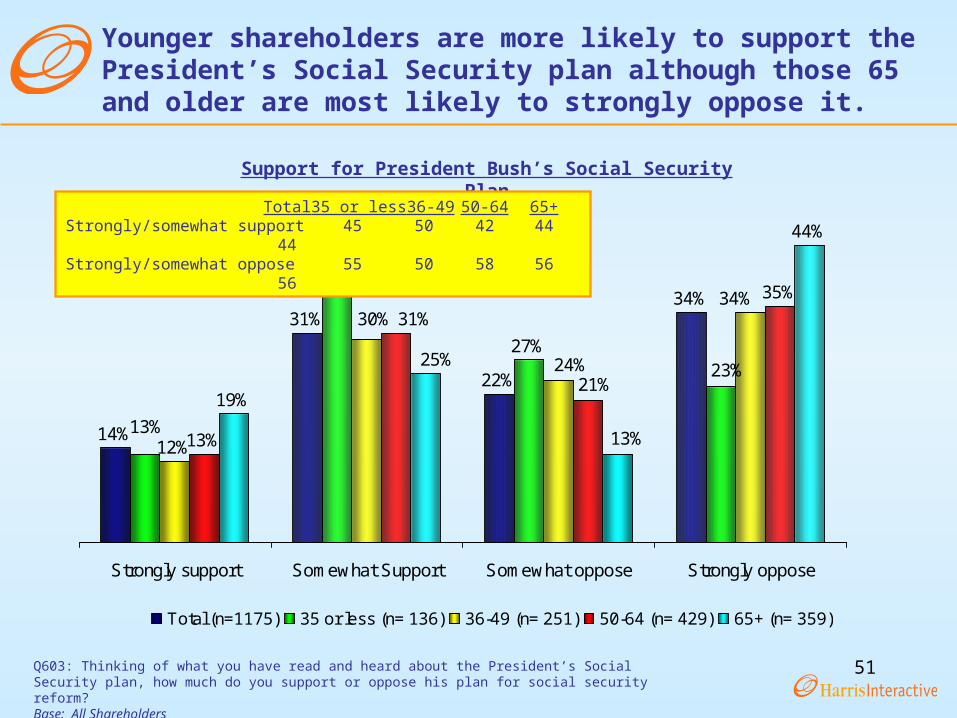
14%
31%
22%
34%37%
27%
12%13%
35%
19%
44%
13%
23%
34%30%
24%
31%
21%
13%
25%
Strongly support Somewhat Support Somewhat oppose Strongly oppose
Total (n=1175) 35 or less (n= 136) 36-49 (n= 251) 50-64 (n= 429) 65+ (n= 359)
Support for President Bush’s Social Security Plan
Q603: Thinking of what you have read and heard about the President’s Social Security plan, how much do you support or oppose his plan for social security reform?Base: All Shareholders
Younger shareholders are more likely to support the President’s Social Security plan although those 65 and older are most likely to strongly oppose it.
Total 35 or less 36-49 50-64 65+Strongly/somewhat support 45 50 42 44 44Strongly/somewhat oppose 55 50 58 56 56

52
The majority of shareholders and non-shareholders feel that some fundamental changes to the Social Security system are needed.
Overall View of Social Security System
14%
30%
12%
34%
54%
14%
58%
57%
28%
The Social Securitysystem has so muchwrong with it that weneed to completely
rebuild it
Social Security workspretty well and only minorchanges are necessaryto make it work better
There are some goodthings in our social
security system but somefundamental changes are
needed
Total (n=4077) Shareholders (n=1175) Non-Shareholders (n=2847)
Q605: Which of the following comes closest to expressing your overall view of the Social Security system?Base: All Adults (n=4077)

53
12%
34%
24%
15%
60%
12%
57%
8%
42%
51%
4%
48%
54%
31%
48%
The Social Securitysystem has so muchwrong with it that weneed to completely
rebuild it
Social Security workspretty well and onlyminor changes are
necessary to make itwork better
There are some goodthings in our socialsecurity system butsome fundamental
changes are needed
Total (n= 1175) 35 or less (n= 136) 36-49 (n= 251) 50-64 (n= 429) 65+ (n= 359)
Overall View of Social Security System
Q605: Which of the following comes closest to expressing your overall view of the Social Security system?Base: All Shareholders
About 1 in 4 shareholders 35 or less believe the Social Security system has so much wrong with it that it needs to be completely rebuilt.

54Q610: Which of the following do you think are the top two problems with the Social Security system?Base: Total (n=4077) Shareholders (n=1175); Non-Shareholders (n=2847)
More than half of shareholders think that in the future, there will be too few workers to support the number of people receiving benefits.
Top Problems with the Social Security System
Total ShareholdersNon-
Shareholders
% % %
In the future, there will be too few workers to support the number of people receiving benefits
45 56 41
Some people who don’t really need benefits are receiving them
42 37 45
There is not enough money collected in taxes to pay future benefits/retirees
38 40 36
People are receiving more in benefits than they contributed because they are living longer
33 38 30
There is not enough money collected in taxes to pay current benefits/retirees
9 8 10

55
Mean Percentage of Retirement Income From Various Sources
Social
Security
Individual
Retirement Plan Provided By
Employer
Other
Retirement
Plan
Individual
Account
That I
Control
Earnings
From
Continued
Employment
Other
Income or
Investments
% % % % % %
Total 31 17 14 11 15 12
Shareholders 24 18 15 16 11 17
Non-Shareholders
35 17 13 9 17 10
Q615: Approximately what percent of your retirement income does or do you expect each of the following to provide?Base: All shareholders (n=1175)
Shareholders and non-shareholders have similar ideas as to what percent of their retirement income various plans do or will provide although non-shareholders expect more to come from Social Security.

56Q621: How likely do you think it is that Social Security benefits will be available to the following groups?Base: All Adults (n=4077); All Shareholders (n= 1175); All Non-shareholders (n= 2847)
While half of shareholders and nearly 4 in 10 non-shareholders think they will receive Social Security benefits, both investors and non-investors think it is less likely that their children and grandchildren will receive them.
Likelihood of Groups Receiving Benefits % Extremely/Very Likely
42%
52%
38%
17%
23%
14%
9%
11%
8%
Total
Shareholders
Non-Shareholders
Me My Children My Grandchildren

57
A large majority of shareholders and non-shareholders do not think it is likely that their children and grandchildren will receive benefits.
% Somewhat/Not at all LikelyLikelihood of Receiving Benefits
33%
26%
35%
61%
54%
65%
77%
71%
79%
Total
Shareholders
Non-Shareholders
Me My Children My Grandchildren
Q621: How likely do you think it is that Social Security benefits will be available to the following groups?Base: All Adults (n=4077); All Shareholders (n= 1175); All Non-shareholders (n= 2847)

58
Most shareholders and non-shareholders anticipate retiring and drawing on Social Security benefits in their 60s.
Total ShareholdersNon-
Shareholders
% % %
18-49 4 3 4
50-59 16 19 14
60-69 64 62 65
70-79 14 14 14
80+ 2 2 3
Mean 63.1 62.8 63.3
Q625: At what age do you plan to retire?Q630: At what age do you plan to start drawing on your Social Security benefits?Base: Total (n= 4077); All Shareholders (n=1175); All Non-Shareholders (n= 2847)
Likely Age of Retirement
Total ShareholdersNon-
Shareholders
% % %
18-49 3 1 4
50-59 5 2 5
60-69 79 85 77
70-79 12 10 12
80+ 2 2 2
Mean 64.2 63.9 65.0
Likely Age to Start Drawing on Social Security Benefits

59
How do Shareholders Feel About How do Shareholders Feel About Proposed Changes to Social Security?Proposed Changes to Social Security?

60Q701: There have been several changes suggested to the current Social Security program. Please indicate the degree to whichyou favor or oppose each of the following.Base: All Shareholders (n=1,175)
Level of Support for Proposed Changes to Social Security
Strongly/Somewhat
Favor
Strongly Favor
Somewhat Favor
Strongly/Somewhat
Oppose
Somewhat Oppose
Strongly Oppose
Increase the income level subject to Social Security tax
% 69 29 41 31 19 12
Change the way benefits are calculated using consumer prices rather than average wages
% 60 9 51 40 27 14
Allow individuals to invest a portion of their tax in the stock market
% 52 20 32 48 20 28
Base current and future benefits on need
% 51 10 41 49 28 21
Increase the age at which benefits can be received
% 40 6 33 60 33 27
Increase payroll tax rates % 37 4 33 63 33 30
Decrease benefits for future retirees
% 11 1 10 89 42 46
Decrease benefits for current retirees
% 8 2 7 92 25 67
Nearly 7 in 10 shareholders would strongly or somewhat favor increasing the income level subject to Social Security tax. There is little support for reducing benefits for current or future retirees.

61Q701: There have been several changes suggested to the current Social Security program. Please indicate the degree to whichyou favor or oppose each of the following.Base: All Shareholders (n=1,175)
Level of Support for Proposed Changes to Social Security by Income
Total Shareholders
Less than $50K
$50K-$75K
More than $75K
Increase the income level subject to Social Security tax
% 69 74 68 66
Change the way benefits are calculated using consumer prices rather than average wages
% 60 58 59 61
Allow individuals to invest a portion of their tax in the stock market
% 52 51 53 55
Base current and future benefits on need
% 51 54 52 47
Increase the age at which benefits can be received
% 40 42 44 36
Increase payroll tax rates % 37 39 32 38
Decrease benefits for future retirees % 11 10 15 12
Decrease benefits for current retirees % 8 6 10 8
Those with lower incomes are most likely to agree with increasing the income level subject to Social Security tax though even those with the highest incomes show a good deal of support for this.
62
Q705: Regardless of your position on each of these proposed changes, which two do you think would be most effective in guaranteeing that current and future generations would receive their full benefits?Base: All Shareholders (n-1175)
Nearly half of shareholders think that increasing the income level subject to Social Security tax would be most effective in guaranteeing benefits for current and future generations.
48%
21%
3%
29% 26%21%
5%
35%
Increase theincome level
subject to SocialSecurity tax
Allow individualsto invest a
portion of theirSocial Securitytax in the stock
market
Base current andfuture benefits
on need
Change the waybenefits are
calculated usingconsumer prices
rather thanaverage wages
Increase the ageat which full
benefits can bereceived
Increase payrolltax rates
Decreasebenefits for
future retirees
Decreasebenefits for
current retirees
Most Effective Changes to Guarantee Full Benefits

63Q705: Regardless of your position on each of these proposed changes, which two do you think would be most effective inguaranteeing that current and future generations would receive their full benefits?Base: All Shareholders (n=1,175) Male (n=674); Female (n=501)
Total Male Female
% % %
Increase the income level subject to Social Security tax
48 48 49
Allow individuals to invest a portion of their Social Security tax in the stock market
35 35 35
Base current and future benefits on need 29 28 30
Change the way benefits are calculated using consumer prices rather than average wages
26 23 31
Increase the age at which full benefits can be received
21 19 24
Increase payroll tax rates 21 21 21
Decrease benefits for future retirees 5 7 2
Decrease benefits for current retirees 3 4 1
Most Effective Changes to Guarantee Full Benefits By Gender
Male and female shareholders agree on which proposed changes would be most effective in guaranteeing benefits.
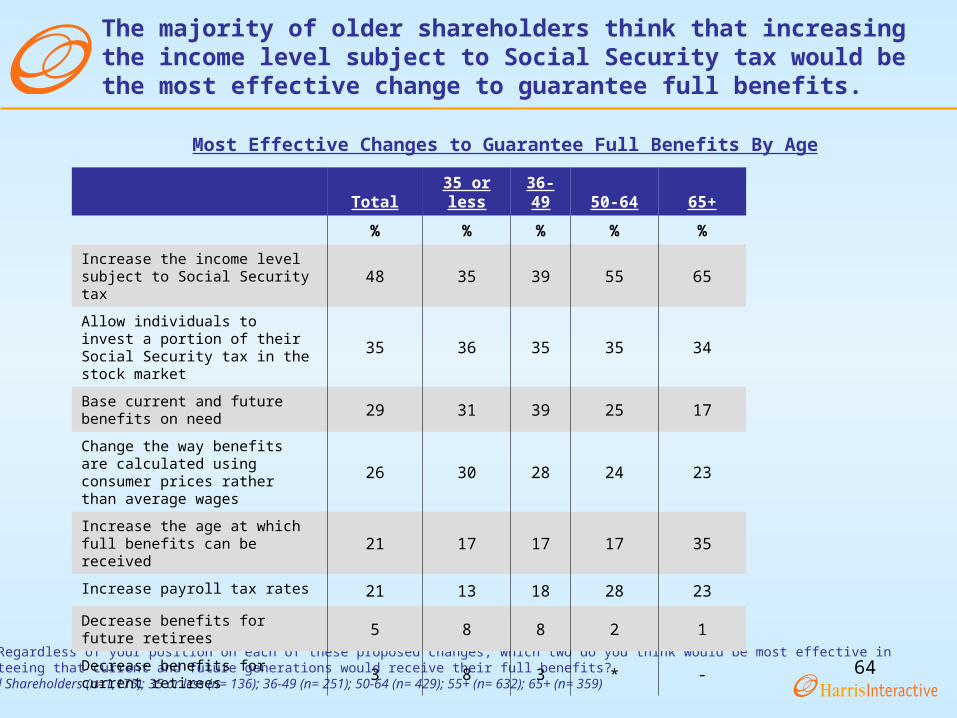
64Q705: Regardless of your position on each of these proposed changes, which two do you think would be most effective inguaranteeing that current and future generations would receive their full benefits?Base: All Shareholders (n=1,175); 35 or less (n= 136); 36-49 (n= 251); 50-64 (n= 429); 55+ (n= 632); 65+ (n= 359)
Total35 or less
36-49 50-64 65+
% % % % %
Increase the income level subject to Social Security tax
48 35 39 55 65
Allow individuals to invest a portion of their Social Security tax in the stock market
35 36 35 35 34
Base current and future benefits on need
29 31 39 25 17
Change the way benefits are calculated using consumer prices rather than average wages
26 30 28 24 23
Increase the age at which full benefits can be received
21 17 17 17 35
Increase payroll tax rates 21 13 18 28 23
Decrease benefits for future retirees 5 8 8 2 1
Decrease benefits for current retirees
3 8 3 * -
Most Effective Changes to Guarantee Full Benefits By Age
The majority of older shareholders think that increasing the income level subject to Social Security tax would be the most effective change to guarantee full benefits.

65
Q716: Please indicate the degree to which you favor or oppose each of the following statements about private/personal accounts.Base: All shareholders (n=1175)
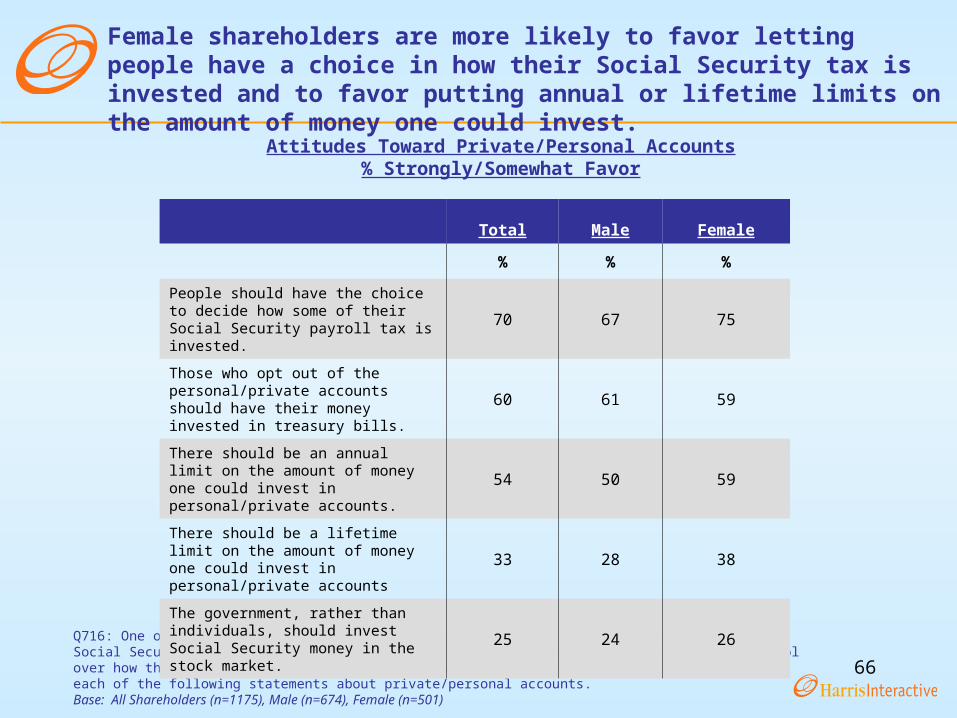
7 out of 10 shareholders believe that people should have a choice in deciding how their Social Security payroll tax is invested.
Attitudes Toward Private/Personal Accounts% Strongly/Somewhat Favor
Strongly/Somewhat
Favor
Strongly Favor
SomewhatFavor
Strongly/Somewhat
Oppose
SomewhatOppose
Strongly Oppose
% % % % % %
People should have the choice to decide how some of their Social Security payroll tax is invested.
70 30 40 30 14 15
Those who opt out of the personal/private accounts should have their money invested in treasury bills.
60 9 51 40 25 15
There should be an annual limit on the amount of money one could invest in personal/private accounts.
54 20 34 46 24 22
There should be a lifetime limit on the amount of money one could invest in personal/private accounts
33 10 23 67 34 33
The government, rather than individuals, should invest Social Security money in the stock market.
25 6 19 75 30 45
66
Q716: One of the proposals being made is to allow workers to invest a portion of their Social Security tax in private/personal accounts through which they would have some control over how that money is invested. Please indicate the degree to which you favor or oppose each of the following statements about private/personal accounts.Base: All Shareholders (n=1175), Male (n=674), Female (n=501)
Female shareholders are more likely to favor letting people have a choice in how their Social Security tax is invested and to favor putting annual or lifetime limits on the amount of money one could invest.
Attitudes Toward Private/Personal Accounts% Strongly/Somewhat Favor
Total Male Female
% % %
People should have the choice to decide how some of their Social Security payroll tax is invested.
70 67 75
Those who opt out of the personal/private accounts should have their money invested in treasury bills.
60 61 59
There should be an annual limit on the amount of money one could invest in personal/private accounts.
54 50 59
There should be a lifetime limit on the amount of money one could invest in personal/private accounts
33 28 38
The government, rather than individuals, should invest Social Security money in the stock market.
25 24 26

67
How Does the Language Used Influence How Does the Language Used Influence Investors?Investors?

68Q716: Please indicate the degree to which you favor or oppose each of the following statements about private/personal accounts.Base: All Shareholders (n=1175), Private accounts (n=614), Personal accounts (n=561)
The language used to describe the accounts did not impact shareholders’ level of support for various proposals under consideration.
Level of Support for Proposed Changes By Type of AccountStrongly/Somewhat Favor
Total Private Personal
% % %
People should have the choice to decide how some of their Social Security payroll tax is invested.
70 71 70
Those who opt out of the personal/private accounts should have their money invested in treasury bills.
60 61 59
There should be an annual limit on the amount of money one could invest in personal/private accounts.
54 55 53
There should be a lifetime limit on the amount of money one could invest in personal/private accounts
33 33 32
The government, rather than individuals, should invest Social Security money in the stock market.
25 28 21

69
Q716: Please indicate the degree to which you favor or oppose each of the following statements about private/personal accounts.Base: All Qualified Respondents (n=1175), Total Republican (n= 470); Total Democrat (n= 368)Private accounts (n=614), Personal accounts (n=561); Democrat Private (n=184); Democrat Personal (n= 184); Republican Private (n= 243); Republican Personal (n= 227)
Level of Support for Proposed Changes By Party Affiliation and Type of Account% Strongly/Somewhat Favor
Democrat Republican
Total Private Personal Total Private Personal
% % % % % %
People should have the choice to decide how some of their Social Security payroll tax is invested.
54 54 53 85 86 85
Those who opt out of the personal/private accounts should have their money invested in treasury bills.
55 54 56 65 68 63
There should be an annual limit on the amount of money one could invest in personal/private accounts.
56 58 54 54 57 52
There should be a lifetime limit on the amount of money one could invest in personal/private accounts
40 43 38 28 28 27
The government, rather than individuals, should invest Social Security money in the stock market.
27 30 24 25 27 23
Republicans are much more likely to agree that people should have the choice to decide how some of their Social Security payroll tax is invested.

70Q721: Please indicate the degree to which you agree or disagree with the following statements.Base: All Shareholders (n=1,175); Private accounts (614); Personal account (561)
Total Private Personal
% % %
If private/personal accounts are created, the government should provide education about how to invest to the American people
82 81 83
Private/personal accounts will give some people access to the stock market who wouldn't otherwise have access
78 76 80
Most people are not knowledgeable enough about how to invest to benefit from private/personal accounts
76 75 78
Tracking private/personal accounts will cost more than administering the current system and reduce the amount of earnings from equity investments
62 61 63
Private/personal accounts may help make more money available to retirees but cost to cover difference in benefits is expected to be so great, the government will go deeper into debt
58 55 61
Private/personal accounts will increase the amount of money available to retirees
55 55 54
Attitudes Toward Private/Personal Accounts By Type of Account% Strongly/Somewhat Agree
The vast majority of shareholders believe that government should provide education to the public if private/personal accounts are created.
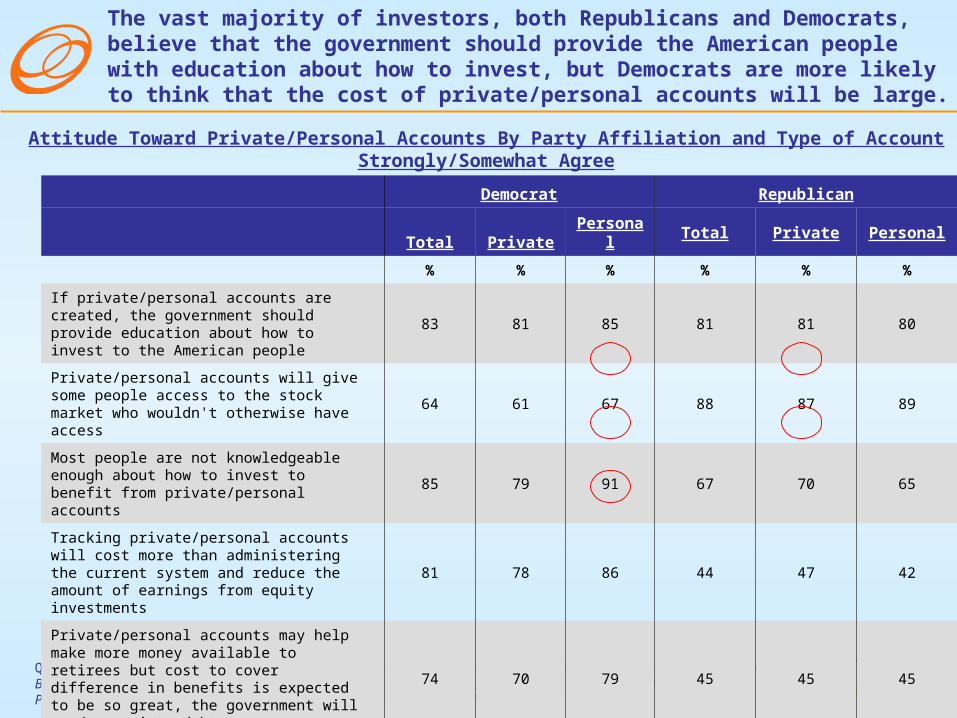
71Q721: Please indicate the degree to which you agree or disagree with the following statements.Base: All Shareholders (n=1,175); Democrats (n= 368); Republicans (n= 470); Democrat Private (n= 184); Democrat Personal (n= 184) Republican Private (n= 243); Republican Personal (n= 227)
Democrat Republican
Total Private Personal Total Private Personal
% % % % % %
If private/personal accounts are created, the government should provide education about how to invest to the American people
83 81 85 81 81 80
Private/personal accounts will give some people access to the stock market who wouldn't otherwise have access
64 61 67 88 87 89
Most people are not knowledgeable enough about how to invest to benefit from private/personal accounts
85 79 91 67 70 65
Tracking private/personal accounts will cost more than administering the current system and reduce the amount of earnings from equity investments
81 78 86 44 47 42
Private/personal accounts may help make more money available to retirees but cost to cover difference in benefits is expected to be so great, the government will go deeper into debt
74 70 79 45 45 45
Private/personal accounts will increase the amount of money available to retirees
29 30 28 81 81 80
Attitude Toward Private/Personal Accounts By Party Affiliation and Type of AccountStrongly/Somewhat Agree
The vast majority of investors, both Republicans and Democrats, believe that the government should provide the American people with education about how to invest, but Democrats are more likely to think that the cost of private/personal accounts will be large.

72
23%
34%
43%
22%
35%
44%
24%
33%
43%
Government Individual Taxpayers Both
Total Private Personal
Who Should Pay Mutual Fund Fees
Q726: Who do you think should pay for the following in a system that includes private/personal accounts?Base: All Shareholders (n=1,175); Private accounts (n= 614); Personal accounts (n= 561)
The plurality of shareholders think that the cost of mutual fund fees should be shared between the government and taxpayers.

73
31%
24%
44%
27% 27%
45%
21%
43%
35%
Government Individual Taxpayers Both
Total Private Personal
Who Should Pay Fees Necessary to Track Accounts
Q726: Who do you think should pay for the following in a system that includes private/personal accounts?Base: All Shareholders (n=1,175); Private accounts (n= 614); Personal accounts (n= 561)
Similarly, shareholders think that both the government and individual taxpayers should pay the fees necessary to track accounts.

74
Q800: One proposal would allow workers to invest 33% of their Social Security tax into a private/personal account. Regardless of what the proposal may call for, what percentage of your Social Security taxes, if any, would you be willing to contribute to a private/personal account?Base: All Shareholders (n=1,175); Democrats (n= 368); Republicans (n= 470); Democrat Private (n= 184); Democrat Personal (n= 184) Republican Private (n= 243); Republican Personal (n= 227)
Percent of Social Security Taxes Willing to Contribute to Private/Personal Account
Democrat Republican
Total Private Personal Total Private Personal
% % % % % %
0 38 34 41 8 9 7
1-32% 37 42 32 38 37 38
33% 9 10 7 15 16 13
34% or more 16 14 20 40 37 42
Mean 19 18 21 37 37 37
Median 10 10 10 33 33 33
Democratic shareholders are willing to contribute much less to private/personal accounts than Republican shareholders.

75
Total Private Personal
% % %
Very Aggressive (5, 6, 7) (Net)
25 22 29
Moderately Aggressive (4) 32 34 29
Very Conservative (1, 2, 3) (Net)
43 44 41
MEAN 3.5 3.4 3.7
Risk Level of Investments
Shareholders think that investment options that would be available in a Social Security system with private/personal accounts should be conservative.
Q805: On a scale from “very conservative” to “very aggressive”, how aggressive should the investment options be that would be available in a Social Security system with private/personal accounts?Base: All shareholders (n=1,175); Private (n= 614); Personal (n= 561)
76
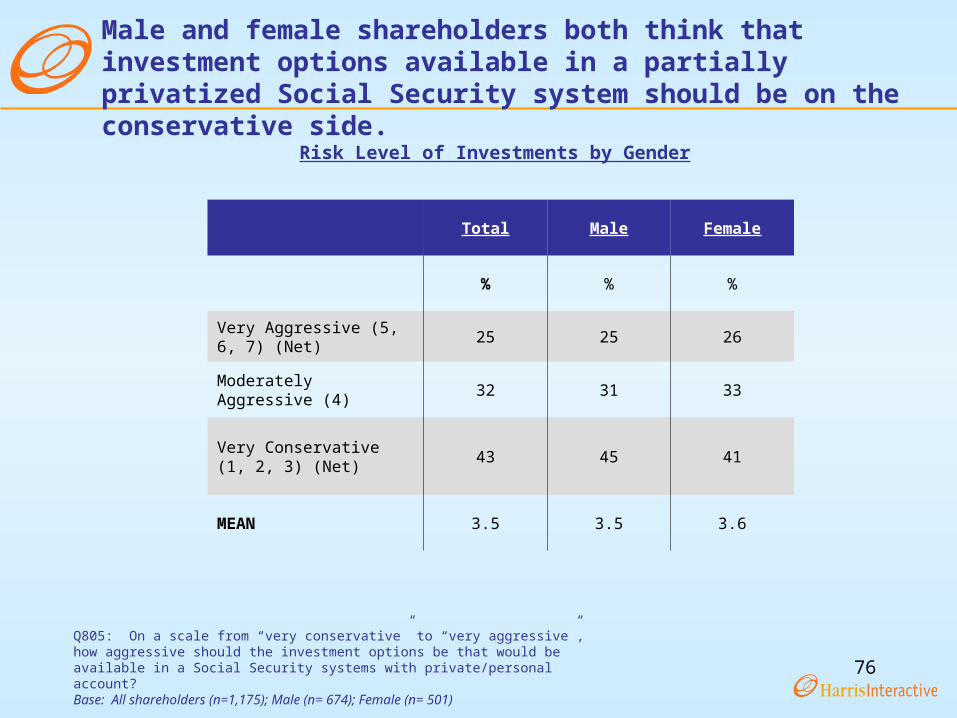
Total Male Female
% % %
Very Aggressive (5, 6, 7) (Net)
25 25 26
Moderately Aggressive (4) 32 31 33
Very Conservative (1, 2, 3) (Net)
43 45 41
MEAN 3.5 3.5 3.6
Risk Level of Investments by Gender
Male and female shareholders both think that investment options available in a partially privatized Social Security system should be on the conservative side.
Q805: On a scale from “very conservative” to “very aggressive”, how aggressive should the investment options be that would be available in a Social Security systems with private/personal account?Base: All shareholders (n=1,175); Male (n= 674); Female (n= 501)
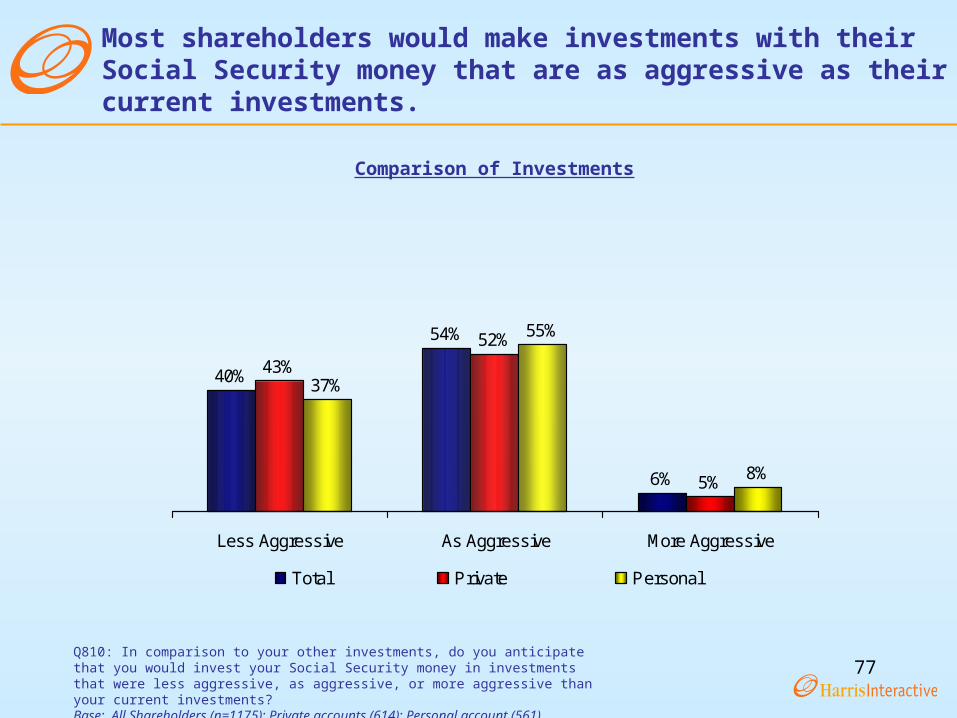
77Q810: In comparison to your other investments, do you anticipate that you would invest your Social Security money in investments that were less aggressive, as aggressive, or more aggressive than your current investments?Base: All Shareholders (n=1175); Private accounts (614); Personal account (561)
Most shareholders would make investments with their Social Security money that are as aggressive as their current investments.
40%
54%
6%
43%
52%
5%
37%
55%
8%
Less Aggressive As Aggressive More Aggressive
Total Private Personal
Comparison of Investments
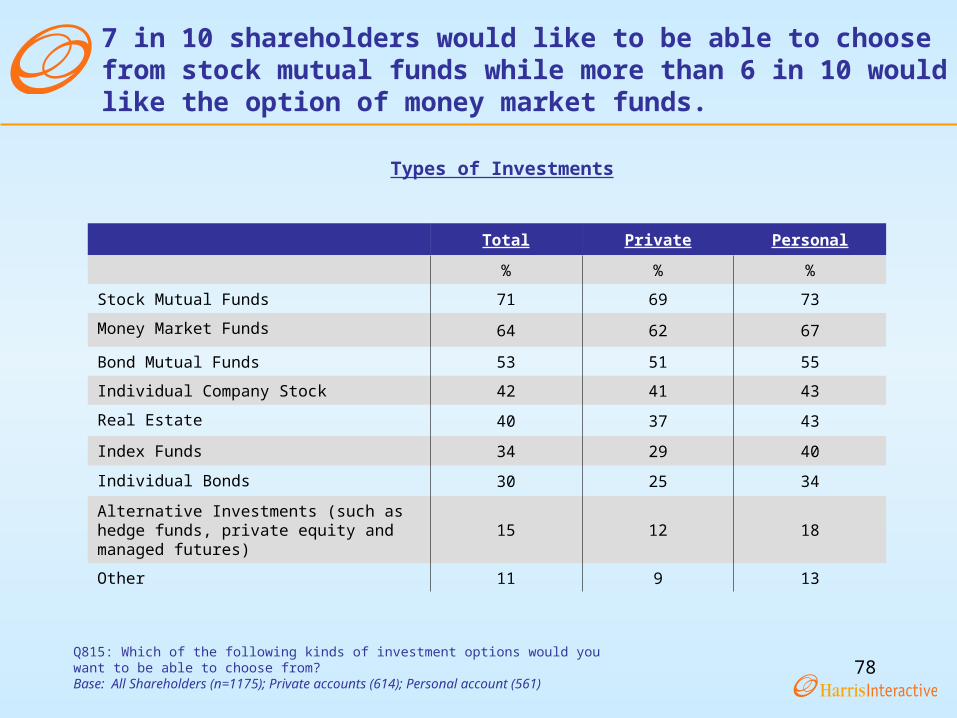
78Q815: Which of the following kinds of investment options would you want to be able to choose from?Base: All Shareholders (n=1175); Private accounts (614); Personal account (561)
7 in 10 shareholders would like to be able to choose from stock mutual funds while more than 6 in 10 would like the option of money market funds.
Total Private Personal
% % %
Stock Mutual Funds 71 69 73
Money Market Funds 64 62 67
Bond Mutual Funds 53 51 55
Individual Company Stock 42 41 43
Real Estate 40 37 43
Index Funds 34 29 40
Individual Bonds 30 25 34
Alternative Investments (such as hedge funds, private equity and managed futures)
15 12 18
Other 11 9 13
Types of Investments

79
What do Shareholders think about Boards What do Shareholders think about Boards of Directors and Sarbanes-Oxley?of Directors and Sarbanes-Oxley?

80Q905: How effective do you think Boards of Directors are in overseeing the companies they govern?Base: All Shareholders (n= 1175)
Three-quarters of shareholders think Boards of Directors are somewhat or not at all effective in overseeing the companies they govern.
Effectiveness of Board of Directors
1%7%
18%
54%
20%
Extremelyeffective
Very effective Effective Somewhateffective
Not at all effective
8%
74%

81Q911: How much do you agree or disagree with the following statements about how this case may influence other board members in the future?Base: All Shareholders (n= 1175)
Strongly/
Somewhat Agree
Strongly Agree
Somewhat Agree
Strongly/
Somewhat
Disagree
Somewhat
DisagreeStrongly Disagree
Potential directors will research the companies for which they might serve more carefully than in the past
% 80 23 57 20 14 6
Corporate board members will take their responsibilities more seriously than in the past
% 76 24 52 24 19 5
It will have no impact on the behavior of corporate board members
% 46 13 33 54 38 16
Qualified people will be discouraged from wanting to serve as a corporate board member
% 36 6 31 64 43 21
Influence of Worldcom Case on Board Members
In the wake of the WorldCom case, 8 in 10 shareholders think that directors will more carefully research companies for which they might serve and three-quarters think that board members will take their responsibility more seriously. However, majorities do not think this case will have much impact on board member’s behavior.

82Q915: Do you think that the financial and accounting regulations governing publicly held companies are too lenient, about right, or too strict?Base: All Shareholders (n= 1175)
63%
33%
3%
Too Lenient About Right Too Strict
Level of Financial and Accounting Regulation
Nearly two-thirds of shareholders think that the financial and accounting regulations governing publicly held companies are too lenient.
83
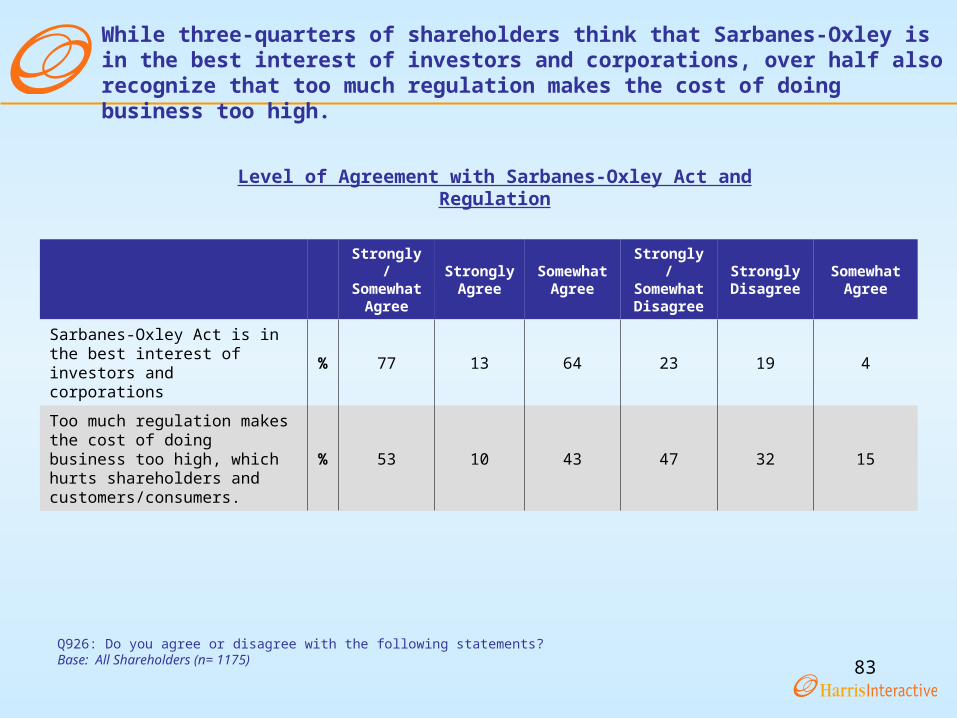
Strongly/Somewhat
Agree
StronglyAgree
SomewhatAgree
Strongly/SomewhatDisagree
StronglyDisagree
SomewhatAgree
Sarbanes-Oxley Act is in the best interest of investors and corporations
% 77 13 64 23 19 4
Too much regulation makes the cost of doing business too high, which hurts shareholders and customers/consumers.
% 53 10 43 47 32 15
Q926: Do you agree or disagree with the following statements?Base: All Shareholders (n= 1175)
While three-quarters of shareholders think that Sarbanes-Oxley is in the best interest of investors and corporations, over half also recognize that too much regulation makes the cost of doing business too high.
Level of Agreement with Sarbanes-Oxley Act and Regulation

84
15%
8%
77%
Increased Decreased Stayed the Same
Effect of Sarbanes-Oxley on Confidence in Public Statements from Companies
Q930: Since Sarbanes-Oxley, has your level of confidence in public statements that companies make increased, decreased, or stayed the same?Base: All Shareholders (n= 1175)
The majority of shareholders feel that their confidence in the public statements that companies make has stayed the same since Sarbanes-Oxley.

85
DemographicsDemographics

86
Shareholder DemographicsShareholder Demographics
GenderTotal
%
Male 57
Female 43
GenderTotal
%
Male 57
Female 43
Age
Total
%
35 years old or less 2236-49 2950-64 2765+ 23
MEAN 49.6MEDIAN 49
Age
Total
%
35 years old or less 2236-49 2950-64 2765+ 23
MEAN 49.6MEDIAN 49
Marital Status
Total
%
Single, never married 20
Married 61Divorced 7Separated 2Widowed 5Living with partner 5
Marital Status
Total
%
Single, never married 20
Married 61Divorced 7Separated 2Widowed 5Living with partner 5Children in Household Under 18
Total
%
0 751 142 83+ 3MEAN 0.4
Children in Household Under 18
Total
%
0 751 142 83+ 3MEAN 0.4
Race/Ethnicity
Total
%White 81Black/African-American 6
Asian or Pacific Islander 2Native American or Alaskan Native *Mixed racial background *Other race *Hispanic 7Decline to answer 3
Race/Ethnicity
Total
%White 81Black/African-American 6
Asian or Pacific Islander 2Native American or Alaskan Native *Mixed racial background *Other race *Hispanic 7Decline to answer 3

87
Shareholder Demographics (Cont’d)Shareholder Demographics (Cont’d)
Education
Total%
High school graduate or less 33Some college 26College (e.g., B.A., B.S.) 30Graduate school (e.g., M.S., M.D., Ph.D.) 11
Education
Total%
High school graduate or less 33Some college 26College (e.g., B.A., B.S.) 30Graduate school (e.g., M.S., M.D., Ph.D.) 11
Party Identification
Total
%
Republican 38Democrat 33Independent 29
Party Identification
Total
%
Republican 38Democrat 33Independent 29
Political Philosophy
Total
%
Conservative 33Moderate 48Liberal 18
Political Philosophy
Total
%
Conservative 33Moderate 48Liberal 18
Employment
Total%
Employed (net) 63Employed full-time 43
Employed part-time 10Self-employed 12
Not employed, but looking for work 4Not employed and not looking for work 2Retired 27Student 7Homemaker 6
Employment
Total%
Employed (net) 63Employed full-time 43
Employed part-time 10Self-employed 12
Not employed, but looking for work 4Not employed and not looking for work 2Retired 27Student 7Homemaker 6
88
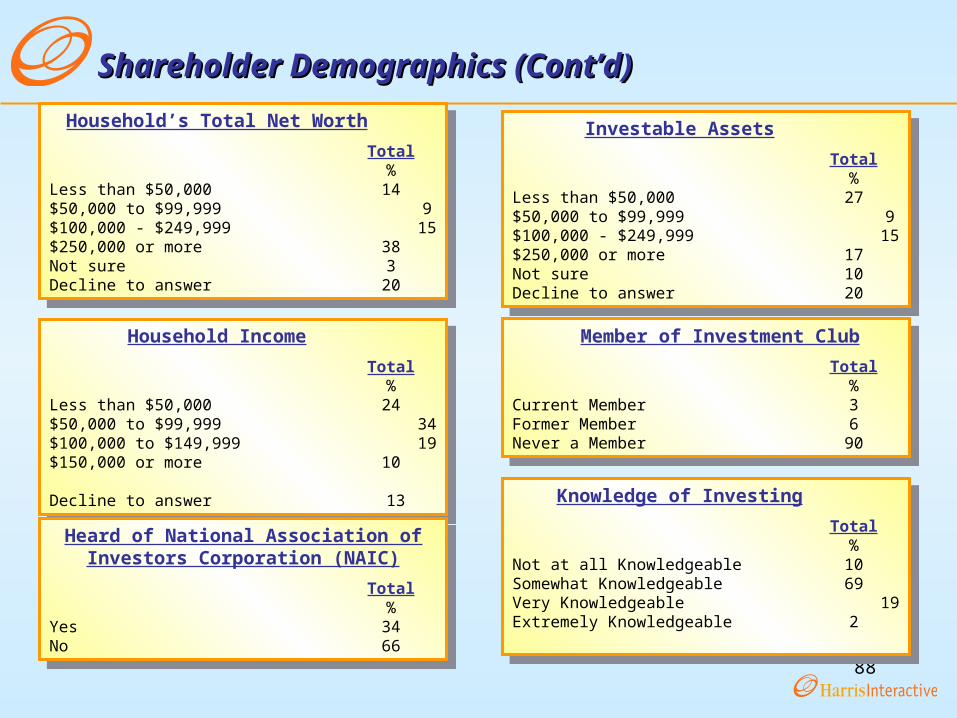
Shareholder Demographics (Cont’d)Shareholder Demographics (Cont’d)
Household’s Total Net Worth
Total%
Less than $50,000 14$50,000 to $99,999 9$100,000 - $249,999 15$250,000 or more 38Not sure 3Decline to answer 20
Household’s Total Net Worth
Total%
Less than $50,000 14$50,000 to $99,999 9$100,000 - $249,999 15$250,000 or more 38Not sure 3Decline to answer 20
Investable Assets
Total%
Less than $50,000 27$50,000 to $99,999 9$100,000 - $249,999 15$250,000 or more 17Not sure 10Decline to answer 20
Investable Assets
Total%
Less than $50,000 27$50,000 to $99,999 9$100,000 - $249,999 15$250,000 or more 17Not sure 10Decline to answer 20
Household Income
Total%
Less than $50,000 24$50,000 to $99,999 34$100,000 to $149,999 19$150,000 or more 10
Decline to answer 13
Household Income
Total%
Less than $50,000 24$50,000 to $99,999 34$100,000 to $149,999 19$150,000 or more 10
Decline to answer 13
Member of Investment Club
Total%
Current Member 3Former Member 6Never a Member 90
Member of Investment Club
Total%
Current Member 3Former Member 6Never a Member 90
Heard of National Association of Investors Corporation (NAIC)
Total%
Yes 34No 66
Heard of National Association of Investors Corporation (NAIC)
Total%
Yes 34No 66
Knowledge of Investing
Total%
Not at all Knowledgeable 10Somewhat Knowledgeable 69Very Knowledgeable 19Extremely Knowledgeable 2
Knowledge of Investing
Total%
Not at all Knowledgeable 10Somewhat Knowledgeable 69Very Knowledgeable 19Extremely Knowledgeable 2

89
Shareholder Demographics (Cont’d)Shareholder Demographics (Cont’d)
Region
Total%
East 23Midwest 22South 31West 23
Region
Total%
East 23Midwest 22South 31West 23
Size of Place
Total
%Central counties of metro areas of 1 million or more 49Fringe counties of metro areas of 1 million or more 4Counties in metro areas of 250,000 to 1 million 25Counties in metro areas of fewer than 250,000 8Urban population of 20,000 or more, adjacent to metro area 3Urban population of 20,000 or more, not adjacent to metro area 2Urban population of 2,500-19,999, adjacent to metro area 4Urban population of 2,500-19,999, not adjacent to metro area 2Completely rural or less than 2,500 urban population, adjacent to metro area 1Completely rural or less than 2,500 urban population, not adjacent to metro area *NA 1

90
Detailed MethodologyDetailed Methodology

91
Detailed Methodology
The Voice of the American Shareholder Quarterly Poll Wave 5 was conducted by Harris Interactive on behalf of the National Association of Investors Corporation (NAIC). Interviewing was conducted between February 15 and February 25, 2005 among a nationally representative sample of 1,175 U.S. adults aged 18 and older who currently have investments in individual stocks or stock mutual funds. The length of the questionnaire was 10 minutes in length, not including the demographics.
SAMPLE SELECTION
Harris Interactive maintains the Harris Poll Online database (HPOL) comprised of several million respondents who have agreed to participate in survey research. The HPOL database was used as the sample source for this study. E-mail addresses for respondents in the database have been obtained from over 100 sources, including the HPOL registration site, Yahoo!, HPOL banner advertisements, and MSN/Hotmail.
Qualified respondents for this study were U.S. adults age 18+ who identified themselves as currently having investments in individual stocks or stock mutual funds in response to the question “Please indicate which types of investments or investment accounts you personally have.”
ONLINE INTERVIEWING PROCEDURES
Interviews were conducted using a self-administered, online questionnaire, via proprietary, web-assisted interviewing software. The HPOL interviewing system permitted online data entry of interviews by the respondents. Questionnaires were programmed into the system with the following checks: 1. Question and response series2. Skip pattern3. Question rotation4. Range checks5. Mathematical checks6. Consistency checks7. Special edit procedures

92
Detailed Methodology (cont’d)
ONLINE INTERVIEWING PROCEDURES (cont’d)
To maintain the reliability and integrity in the sample, each invitation contained a password that is uniquely assigned to that e-mail address. A respondent was required to enter the password at the beginning of the survey to gain access into the survey. Password protection ensured that a respondent completed the survey only one time.
To increase the number of respondents in the survey and to improve overall response rates, up to two additional reminder invitations are typically mailed at 2-4 day intervals to those respondents who have not yet participated in the survey. For this study, one reminder was sent to potential respondents.
To increase the number of respondents in the survey and to improve overall response rates, respondents were provided with a summary of some of the survey responses. This too was done via the Internet. Respondents were sent an email that provided them access to a web site that contained the survey findings. As with the survey itself, this was a password protected site that was accessible for a limited period (1-2 weeks).
All data were then tabulated, checked for internal consistency and processed by computer. A series of computer-generated tables were produced for each of the key sample groups that showed the results of each survey question, both by the total number of respondents and by the key subgroups.

93
Detailed Methodology (cont’d)
WEIGHTING
Completed interviews were weighted to figures obtained from the Current Population Survey (CPS). Harris used several demographic variables (e.g., sex, age, education, race and ethnicity and income) to generalize survey results to the population at large. In addition, Harris Interactive applied a proprietary technique to the data called "propensity weighting" that essentially balanced all the characteristics (e.g., demographic, attitudinal, and behavioral) of online respondents. It is no surprise that certain kinds of people have a greater or lesser likelihood to be online and therefore to reply to our surveys. To account for this, Harris gave each individual a “propensity weight” which corresponded to their likelihood to be online. This ensured that the sample represented the general shareholder population at large and was not skewed toward more active online users or survey takers. In addition, people who had a lesser likelihood to be online acted as a proxy for those who are not online at all. Typical propensity weights that were used included measures of activity (our online respondents do more things), knowledge (our online samples are better informed), and attitudes (our online samples are more skeptical or cynical).

94
Detailed Methodology (cont’d)
WEIGHTING (CONT’D)
It is also worth mentioning that Harris conducts parallel telephone and online research on a regular basis through The Harris Poll, our monthly omnibus survey. By conducting this research, Harris is able to track results to make comparisons between data collected online and by phone, closely examine the biases and most importantly, develop strategies for correcting these biases. In fact, Harris has an internal department that is entirely focused on conducting this “research on research.”
EDITING AND CLEANING THE DATA
The data-processing staff performed machine edits and additional cleaning for the entire data set. Our edit programs acted as a verification of the skip instructions and other data checks that were written into the online program. The edit programs listed any errors by case number, question number and type. These were then resolved by senior personnel, who inspected the original file and made appropriate corrections. Complete records were kept of all such procedures.
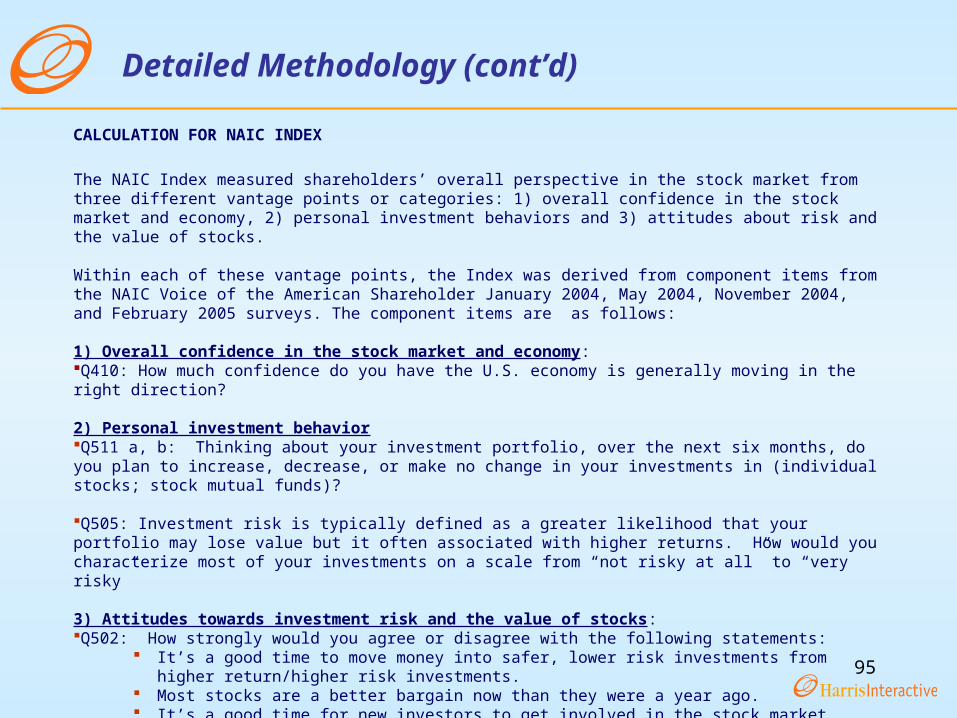
95
Detailed Methodology (cont’d)
CALCULATION FOR NAIC INDEX
The NAIC Index measured shareholders’ overall perspective in the stock market from three different vantage points or categories: 1) overall confidence in the stock market and economy, 2) personal investment behaviors and 3) attitudes about risk and the value of stocks.
Within each of these vantage points, the Index was derived from component items from the NAIC Voice of the American Shareholder January 2004, May 2004, November 2004, and February 2005 surveys. The component items are as follows:
1) Overall confidence in the stock market and economy:Q410: How much confidence do you have the U.S. economy is generally moving in the right direction?
2) Personal investment behaviorQ511 a, b: Thinking about your investment portfolio, over the next six months, do you plan to increase, decrease, or make no change in your investments in (individual stocks; stock mutual funds)?
Q505: Investment risk is typically defined as a greater likelihood that your portfolio may lose value but it often associated with higher returns. How would you characterize most of your investments on a scale from “not risky at all” to “very risky”
3) Attitudes towards investment risk and the value of stocks:Q502: How strongly would you agree or disagree with the following statements:
It’s a good time to move money into safer, lower risk investments from higher return/higher risk investments.
Most stocks are a better bargain now than they were a year ago. It’s a good time for new investors to get involved in the stock market.

96
Detailed Methodology (cont’d)
CALCULATION FOR NAIC INDEX – (cont’d)
For each component item within the three overall categories, a ‘component score’ was calculated by taking the difference of the percentage of positive responses and the percentage of negative responses.
For example, in February 2005, Q410: “How much confidence do you have that the United States’ economy is generally moving in the right direction?”
14% responded that they have a great deal of confidence in the direction of the economy, 77% responded that they had a fair amount or not much confidence and 9% indicated they had no confidence at all.
This yielded a component score of 14% - 9% = 5.0%
To calculate the NAIC Shareholder Index, we then took the mean of the 7 component scores.

97
Detailed Methodology (cont’d)
CALCULATION FOR NAIC INDEX – (cont’d)
The following table shows the component scores for each item used in calculating the Index for September 2003, January 2004, May 2004, November 2004, and February 2005.
Please note that since the three statements that make up Q502 were not asked in the September 2003 survey, the scores below should only be used to get a general sense of how the scores have changed on the other items that were repeated between September 2003 and November 2004.
Component Scores
Component Item Sept. ‘03 Jan. ‘04 May ‘04 Nov. ‘04 Feb. ‘05
Confidence that US economy is moving in right direction 5.9 15.2 10.6 6.5 -2.5
Increase, decrease, or make no change in individual stock investments, next 6 months 24.0 27.3 18.6 20.8 19.5
Increase, decrease, or make no change in stock mutual funds, next 6 months 21.8 25.8 19.3 17.5 23.5
How would you characterize most of your investments (1=not risky, 7=very risky) -- 7.0 -1.1 0.0 0.2
Good time to move money into safer, lower risk investments -- 3.3 -6.7 -15.5 -16.0
Most stocks are a better bargain now than they were a year ago -- 9.8 7.7 9.2 -0.2
Good time for new investors to get involved in the market -- 47.0 27.6 26.3 30.1
Index Score -- 19.3 10.9 9.3 7.8

98
Detailed Methodology (cont’d)
CALCULATION FOR NAIC INDEX – (cont’d)
Validating the Index
In order to measure the validity of the NAIC Index, an investment allocation exercise question was included in the January 2004, May 2004, and February 2005 surveys. The purpose of this question was to be able to link the “attitudinal” nature of the NAIC Index to observable behavior in future waves of this research.
The question (Q515) asked: “If you had ($10,000/$100,000) to invest, how much would you invest in each of the following?
Individual stocks Stock mutual funds Individual bonds Bond mutual funds Cash Alternative Investments
This question was structured so that half of all shareholders interviewed were shown $10,000 in the question and the other half were shown $100,000.
The idea was that changes in shareholder confidence, as measured by the Index, should be reflected in changes in portfolio allocation. As confidence improves, we would expect that shareholders would become growth-oriented and conversely as confidence weakens, we would expect that shareholders would allocate money towards safer investments.