Embed Size (px)
Citation preview

ww
w.traders-journal.com
MIC
A (P) 352/05/2005
www.traders-journal.com MICA (P) 352/05/2005
ASIA PACIFIC’S PREEMINENT TRADING MAGAZINE
S$8.80 / A$13.80 / HK$68 / RM$19.80
ASIA PA
CIFIC
’S PREEM
INEN
T TRA
DIN
G M
AG
AZIN
EN
ovember / D
ecember 2005
Volume 1 Issue 3
The Mysteries of the TrendUsing the Opening Price
Trading Tools:Understand OptionsWave PrincipleTrending or RangingTLB vs. RSIGann Theory
The Mysteries of the Trend
HowHowTo Invest ?To Invest ?To Cope withStress ?To Cope withStress ?
Using the Opening Price
Trading Tools:Understand OptionsWave PrincipleTrending or RangingTLB vs. RSIGann Theory
The Thought
DEMONS of TradersDEMONS
SSSSSprprprprpread ead ead ead ead AndAndAndAndAndPPPPPairairairairairs s s s s TTTTTrrrrradingadingadingadingading
W
Ron Schelling, private trader, shows how a blend between thetechnical and the fundamental approach is the best way tosuccessfully execute a pairs trading strategy.
32 traders journal
Historically, spread and pairs traders havebeen divided into two primary groups:
1.) the fundamental approach2.) the technical approach
hile each of theseapproaches hascertain advantagesover the other,neither fully
captures the breadth of informationavailable in the marketplace.
Spread and Pairs trading is inextricablytied to correlation, but the methodologyby which correlated stocks are matcheddiffers greatly from one approach to theother. In both cases the trader is attemptingto identify a pair of stocks, futures or Forexthat has diverged from its historicalaverage and is likely to revert back to thatmean relationship.
This market-neutral approach to tradinghas been gaining in popularity as retailtraders and professional portfoliomanagers alike seek to capture gainsindependent of the turbulence usuallyfound in the market.
The fundamental approach, usuallyfavored by large institutions placingsizeable block trades, capitalizes onextensive company research that seeks todetermine a proper valuation for a givenstock. Once this analysis is complete, thepairs trader creates a trade by buying themost undervalued stock within an industryand shorting the most overvalued. He or
she now waits for the fundamentals to play out and the relative performance to shift.
The technical approach, really a specialized version of statistical arbitrage, relies ontechnical factors like Bollinger Bands, the Relative Strength Index, or various movingaverages to determine an appropriate matching of equities to be traded. These factorsare sometimes built into complex ‘black box’ models that remove the human elementfrom this type of trading program.
How to find Spreads or Pairs ?
In contrast to many other strategies, pairs trading requires neither high school nor aquantitative analysis degree; traders of all experience levels can execute the strategysuccessfully. If one considers a pair graphically, the technical and fundamental factorsthat come into play will become obvious.
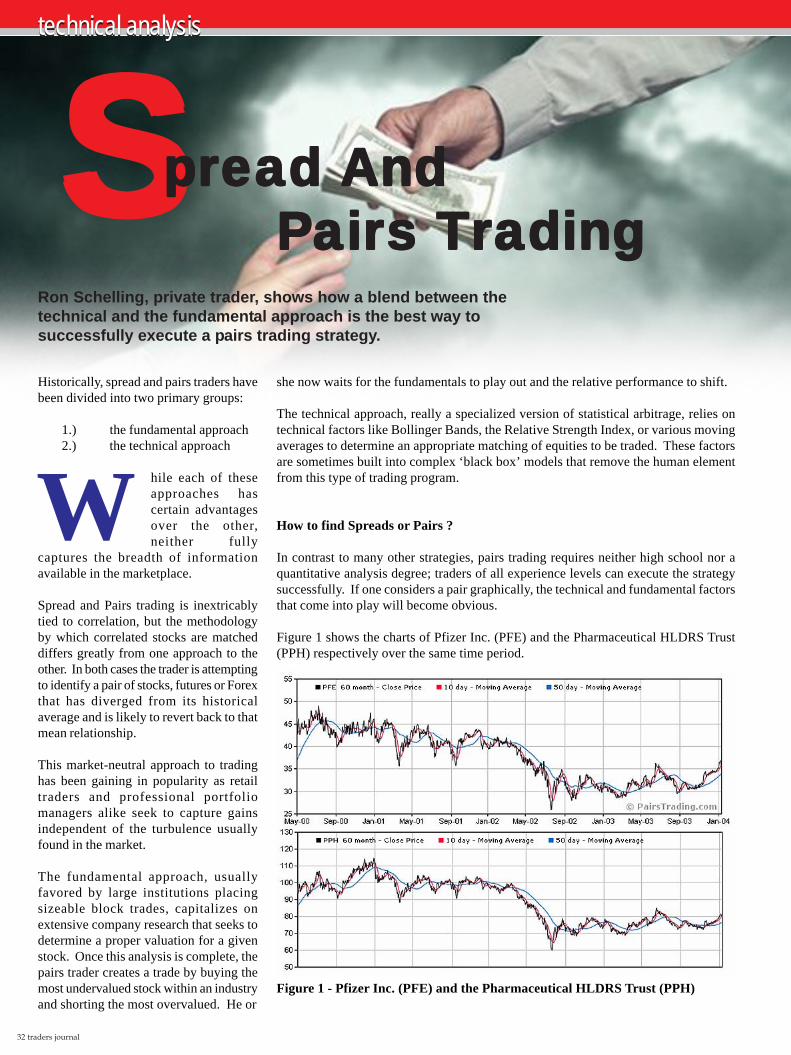
Figure 1 shows the charts of Pfizer Inc. (PFE) and the Pharmaceutical HLDRS Trust(PPH) respectively over the same time period.
Figure 1 - Pfizer Inc. (PFE) and the Pharmaceutical HLDRS Trust (PPH)
technical analysistechnical analysis
traders journal 33
An initial examination of the two charts reveals that there is a great deal of similarity inthe price action of the stock and its corresponding ETF (to be considered as a stock forthe remainder of this example).
From the graph alone, however, it is impossible to determine how closely related theseprice movements mirror one another. Without further analysis, a trader might decidethat these stocks are likely to have a high statistical correlation to each other, but he hasno basis upon which to turn this assumption into a potentially profitable tradingopportunity.
A simple correlation analysis will provide support for this assumption, but provideslittle additional information about the pair.
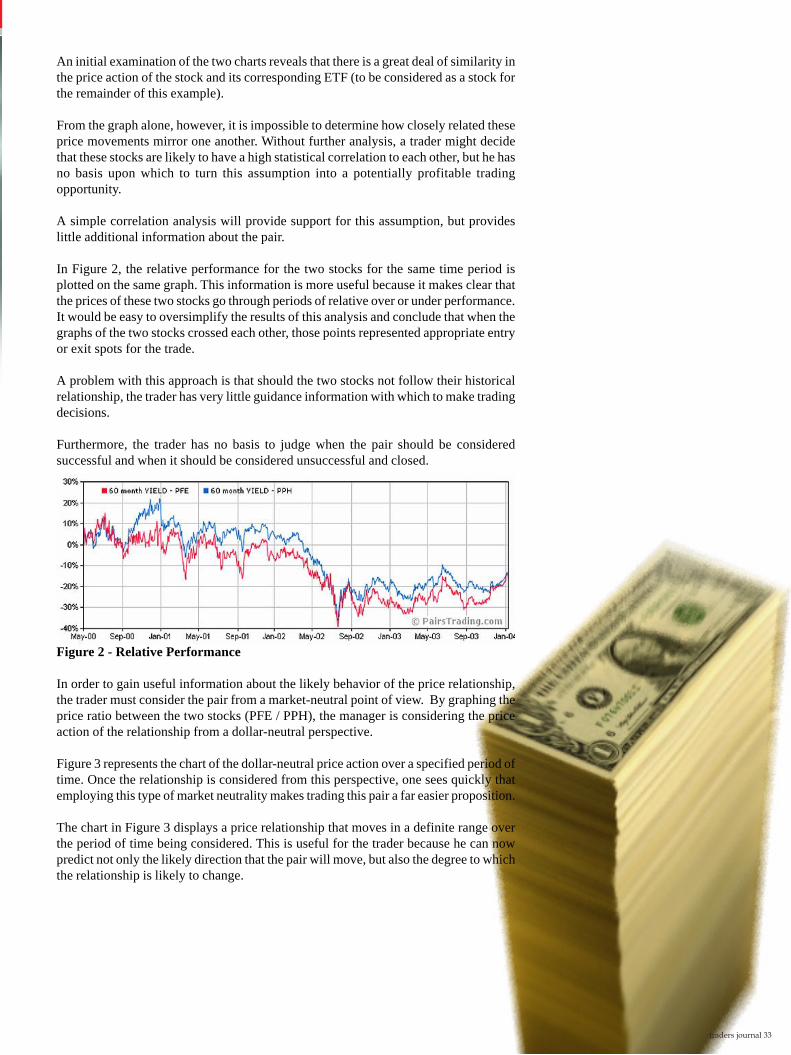
In Figure 2, the relative performance for the two stocks for the same time period isplotted on the same graph. This information is more useful because it makes clear thatthe prices of these two stocks go through periods of relative over or under performance.It would be easy to oversimplify the results of this analysis and conclude that when thegraphs of the two stocks crossed each other, those points represented appropriate entryor exit spots for the trade.
A problem with this approach is that should the two stocks not follow their historicalrelationship, the trader has very little guidance information with which to make tradingdecisions.
Furthermore, the trader has no basis to judge when the pair should be consideredsuccessful and when it should be considered unsuccessful and closed.
Figure 2 - Relative Performance
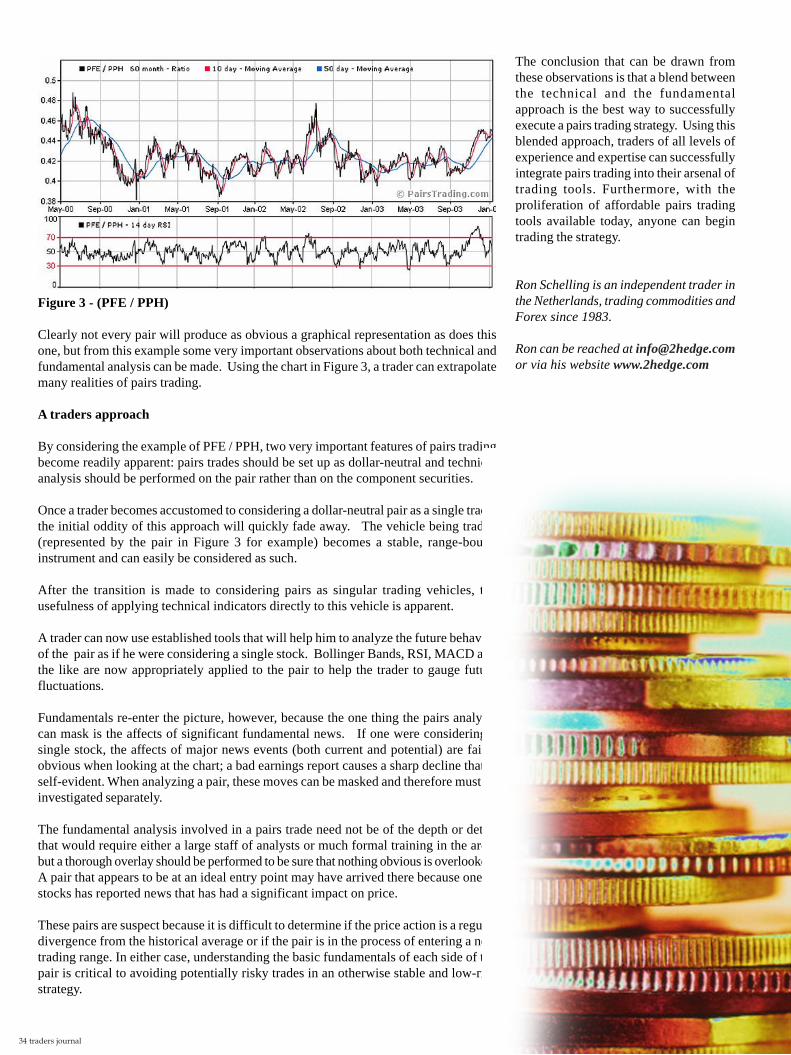
In order to gain useful information about the likely behavior of the price relationship,the trader must consider the pair from a market-neutral point of view. By graphing theprice ratio between the two stocks (PFE / PPH), the manager is considering the priceaction of the relationship from a dollar-neutral perspective.
Figure 3 represents the chart of the dollar-neutral price action over a specified period oftime. Once the relationship is considered from this perspective, one sees quickly thatemploying this type of market neutrality makes trading this pair a far easier proposition.
The chart in Figure 3 displays a price relationship that moves in a definite range overthe period of time being considered. This is useful for the trader because he can nowpredict not only the likely direction that the pair will move, but also the degree to whichthe relationship is likely to change.
34 traders journal
Figure 3 - (PFE / PPH)
Clearly not every pair will produce as obvious a graphical representation as does thisone, but from this example some very important observations about both technical andfundamental analysis can be made. Using the chart in Figure 3, a trader can extrapolatemany realities of pairs trading.
A traders approach
By considering the example of PFE / PPH, two very important features of pairs tradingbecome readily apparent: pairs trades should be set up as dollar-neutral and technicalanalysis should be performed on the pair rather than on the component securities.
Once a trader becomes accustomed to considering a dollar-neutral pair as a single trade,the initial oddity of this approach will quickly fade away. The vehicle being traded(represented by the pair in Figure 3 for example) becomes a stable, range-boundinstrument and can easily be considered as such.
After the transition is made to considering pairs as singular trading vehicles, theusefulness of applying technical indicators directly to this vehicle is apparent.
A trader can now use established tools that will help him to analyze the future behaviorof the pair as if he were considering a single stock. Bollinger Bands, RSI, MACD andthe like are now appropriately applied to the pair to help the trader to gauge futurefluctuations.
Fundamentals re-enter the picture, however, because the one thing the pairs analysiscan mask is the affects of significant fundamental news. If one were considering asingle stock, the affects of major news events (both current and potential) are fairlyobvious when looking at the chart; a bad earnings report causes a sharp decline that isself-evident. When analyzing a pair, these moves can be masked and therefore must beinvestigated separately.
The fundamental analysis involved in a pairs trade need not be of the depth or detailthat would require either a large staff of analysts or much formal training in the area,but a thorough overlay should be performed to be sure that nothing obvious is overlooked.A pair that appears to be at an ideal entry point may have arrived there because one ofstocks has reported news that has had a significant impact on price.
These pairs are suspect because it is difficult to determine if the price action is a regulardivergence from the historical average or if the pair is in the process of entering a newtrading range. In either case, understanding the basic fundamentals of each side of thepair is critical to avoiding potentially risky trades in an otherwise stable and low-riskstrategy.
The conclusion that can be drawn fromthese observations is that a blend betweenthe technical and the fundamentalapproach is the best way to successfullyexecute a pairs trading strategy. Using thisblended approach, traders of all levels ofexperience and expertise can successfullyintegrate pairs trading into their arsenal oftrading tools. Furthermore, with theproliferation of affordable pairs tradingtools available today, anyone can begintrading the strategy.
Ron Schelling is an independent trader inthe Netherlands, trading commodities andForex since 1983.
Ron can be reached at [email protected] via his website www.2hedge.com

www.traders-journal.comtraders journal 9