Embed Size (px)
Citation preview

V
olu
me
36
Nu
mb
er 1
1, 7
85
–8
40
LC
GC
NO
RT
H A
ME
RIC
A
No
ve
mb
er 2
018
Volume 36 Number 11 November 2018
www.chromatographyonline.com
The Analytical Toolbox for Biopharmaceutical Characterization
Understanding Stationary-Phase
Selectivity for GC
INSTRUMENT
CONSIDERATIONS IN
THE TRANSFER OF
CHROMATOGRAPHIC
METHODS
ES39215_LCGC1118_CV1.pgs 11.05.2018 14:54 UBM blackyellowmagentacyan

Feel good in your method development?
Feel Better with UsTrust our analytical products in every stage of your drug
product development. Whether you’re working on bioanalytical
/&�06��IRUPXODWLRQ��RU�¿QDO�TXDOLW\�FRQWURO�DQG�UHOHDVH��ZH�
have the expertise you need.
)HHO�EHWWHU�ZLWK�IXOO�ZRUNÀRZ�VROXWLRQV�DW
SigmaAldrich.com/feel-better
The life science business of Merck KGaA, Darmstadt, Germany
operates as MilliporeSigma in the U.S. and Canada.
j������0HUFN�.*D$��'DUPVWDGW��*HUPDQ\�DQG�RU�LWV�DɡOLDWHV��$OO�5LJKWV�5HVHUYHG��0LOOLSRUH6LJPD�DQG�WKH�YLEUDQW�0�DUH�WUDGHPDUNV�RI�0HUFN�.*D$��'DUPVWDGW��*HUPDQ\�RU�LWV�DɡOLDWHV��$OO�RWKHU�WUDGHPDUNV�DUH�WKH�SURSHUW\�RI�WKHLU�UHVSHFWLYH�RZQHUV��'HWDLOHG�LQIRUPDWLRQ�RQ�WUDGHPDUNV�LV�DYDLODEOH�YLD�SXEOLFO\�DFFHVVLEOH�UHVRXUFHV����
2018-14251

www.shodexHPLC.com
SUGAR SH1011 8C- Separates via a combination of
ligand exchange and size
exclusion chromatography
- Save money and time with simple
aqueous eluents
SUGAR SH1011 8C- New 8.0 x 100 mm size
- Analyze sugars, organic
acids, and alcohols in under
5 min
- Ideal for fermentation
monitoring and food samples
Rapid Sugar Series : SH1011 8C
6DPSOH�����/��������Z�Y��HDFK
1. Maltotriose
2. Maltose
3. Glucose
���/DFWLF�$FLG
5. Glycerol
6. Acetic Acid
7. Ethanol

788 LCGC NORTH AMERICA VOLUME 36 NUMBER 11 NOVEMBER 2018 WWW.CHROMATOGRAPHYONLINE.COM
485F US Highway One South, Suite 210 Iselin, NJ 08830
(732) 596-0276 • Fax: (732) 647-1235
UBM Americas (www.ubmlifesciences.com) is a leading worldwide media com-pany providing integrated marketing solutions for the Fashion, Life Sciences and Powersports industries. UBM Americas serves business professionals and consumers in these industries with its portfolio of 91 events, 67 publications and directories, 150 electronic publications and Web sites, as well as educational and direct market-ing products and services. Market leading brands and a commitment to delivering innovative, quality products and services enables UBM Americas to “Connect Our Customers With Theirs.” UBM Americas has approximately 1000 employees and currently operates from multiple offices in North America and Europe.
© 2018 UBM All rights reserved. No part of this publication may be reproduced or trans-
mitted in any form or by any means, electronic or mechanical including by photocopy,
recording, or information storage and retrieval without permission in writing from the
publisher. Authorization to photocopy items for internal/educational or personal use,
or the internal/educational or personal use of specifi c clients is granted by UBM for
libraries and other users registered with the Copyright Clearance Center, 222 Rosewood
Dr. Danvers, MA 01923, 978-750-8400 fax 978-646-8700 or visit http://www.copyright.
com online. For uses beyond those listed above, please direct your written request to
Permission Dept. fax 732-647-1104 or email: [email protected]
UBM Americas provides certain customer contact data (such as customer’s name, ad-
dresses, phone numbers, and e-mail addresses) to third parties who wish to promote
relevant products, services, and other opportunities that may be of interest to you. If you
do not want UBM Americas to make your contact information available to third parties
for marketing purposes, simply call toll-free 866-529-2922 between the hours of 7:30
a.m. and 5 p.m. CST and a customer service representative will assist you in removing
your name from UBM Americas lists. Outside the U.S., please phone 218-740-6477.
LCGC North America does not verify any claims or other information appearing in any
of the advertisements contained in the publication, and cannot take responsibility for
any losses or other damages incurred by readers in reliance of such content.
To subscribe, call toll-free 888-527-7008. Outside the U.S. call 218-740-6477.
MANUSCRIPTS: For manuscript preparation guidelines, see chromatographyon-
line.com/lcgc-author-guidelines, or call The Editor, (732) 596-0276. LCGC welcomes
unsolicited articles, manuscripts, photographs, illustrations, and other materials
but cannot be held responsible for their safekeeping or return. Every precaution is
taken to ensure accuracy, but LCGC cannot accept responsibility for the accuracy
of information supplied herein or for any opinion expressed.
SUBSCRIPTIONS: For subscription and circulation information: LCGC, P.O. Box
6168, Duluth, MN 55806-6168, or call (888) 527-7008 (7:00 a.m.–6:00 p.m. central
time). International customers should call +1-218-740-6477. Delivery of LCGC out-
side the United States is 14 days after printing. For single and back issues, call (800)
598-6008 or (218) 740-6480. (LCGC Europe and LCGC Asia Pacific are available free
of charge to users and specifiers of chromatographic equipment in Western Europe
and Asia and Australia, respectively.)
CHANGE OF ADDRESS: Send change of address to LCGC, P.O. Box 6168, Duluth,
MN 55806-6168; alternately, send change via e-mail to [email protected] or go to the
following URLs:
• Print: http://ubmsubs.ubm.com/?pubid=LCGC
• Digital: http://ubmsubs.ubm.com/?pubid=LCGC&V=DIGI
Allow four to six weeks for change. PUBLICATIONS MAIL AGREEMENT
No. 40612608. Return all undeliverable Canadian addresses to:
IMEX Global Solutions, P.O. Box 25542, London, ON, N6C 6B2,
CANADA. Canadian GST number: R-124213133RT001.
C.A.S.T. DATA AND LIST INFORMATION: Contact Melissa Stillwell,
tel. (218) 740-6831, e-mail [email protected].
REPRINTS: Reprints of all articles in this issue and past issues of this publication
are available (500 minimum). Licensing and Reuse of Content: Contact
our official partner, Wright’s Media, about available usages, license
fees, and award seal artwork at [email protected] for more
information. Please note that Wright’s Media is the only authorized
company that we’ve partnered with for Advanstar UBM materials.
INTERNATIONAL LICENSING: Contact Jillyn Frommer, tel.
(732) 346-3007, fax 732-647-1104, or e-mail [email protected].
50
% Recycled Paper 1
0-2
0%
Post Consumer W
as
te
Michael J. Tessalone
Vice President/Group Publisher [email protected]
Edward Fantuzzi
Publisher [email protected]
Stephanie Shaffer
Sales Manager [email protected]
Brianne Molnar
Sales Manager [email protected]
Michael Kushner
Senior Director, Digital [email protected]
Kristen Moore
Webcast Operations Manager [email protected]
Vania Oliveira
Project Manager [email protected]
Sabina Advani
Digital Production Manager [email protected]
Kaylynn Chiarello-Ebner
Managing Editor, Special Projects [email protected]
Brianne Pangaro
Marketing [email protected]
Melissa Stillwell
C.A.S.T. Data and List Information [email protected]
Laura Bush
Editorial Director [email protected]
John Chasse
Managing Editor [email protected]
Jerome Workman, Jr.
Senior Technical Editor [email protected]
Cindy Delonas
Associate Editor [email protected]
Dan Ward
Art Director [email protected]
Rajesh Thangappan
Graphic Designer [email protected]
Wright’s Media
Reprints [email protected]
Jillyn Frommer
Permissions [email protected]
Jesse Singer
Production Manager [email protected]
Wendy Bong
Audience Development Manager [email protected]
Morgan Hight
Audience Support Analyst [email protected]
Thomas W. Ehardt
Executive Vice-President,Senior Managing Director UBM Life Sciences [email protected]
Dave Esola
VP & General ManagerUBM Life Sciences [email protected]
Chro
mato
gra
phy
Find what you are looking for!
MACHEREY-NAGEL
Manufacturer of premium
chromatography media
www.mn-net.com
� CHROMABOND® columns with classical and
innovative SPE phases
� Original NUCLEOSIL®, professional NUCLEODUR®
and highly efficient NUCLEOSHELL® HPLC columns
� Robust TLC glass plates, economical aluminum and
polyester sheets

790 LCGC NORTH AMERICA VOLUME 36 NUMBER 11 NOVEMBER 2018 WWW.CHROMATOGRAPHYONLINE.COM
Volume 36 Number 11 November 2018
www.chromatographyonline.com
The Analytical Toolbox for Biopharmaceutical Characterization
Understanding Stationary-Phase
Selectivity for GC
INSTRUMENT
CONSIDERATIONS IN
THE TRANSFER OF
CHROMATOGRAPHIC
METHODS
C O N T E N T S
LCGC North America (ISSN 1527-5949 print) (ISSN 1939-1889 digital) is published monthly by UBM LLC, 131 West First Street, Duluth, MN 55802-2065, and is distributed free of charge to users and specifi ers of chromatographic equipment in the United States and Canada. Single copies (prepaid only, including postage and handling): $15.50 in the United States, $17.50 in all other countries; back issues: $23 in the United States, $27 in all other countries. LCGC is available on a paid subscription basis to nonqualifi ed readers in the United States and its possessions at the rate of: 1 year (13 issues), $74.95; 2 years (26 issues), $134.50; in Canada and Mexico: 1 year (13 issues), $95; 2 years (26 issues), $150; in all other countries: 1 year (13 issues), $140; 2 years (26 issues), $250. Periodicals postage paid at Duluth, MN 55806 and at additional mailing offi ces. POSTMASTER: Please send address changes to LCGC, P.O. Box 6168, Duluth, MN 55806-6168. PUBLICATIONS MAIL AGREEMENT NO. 40612608, Return Undeliverable Canadian Addresses to: IMEX Global Solutions, P. O. Box 25542, London, ON N6C 6B2, CANADA Canadian GST number: R-124213133RT001. Printed in the USA.
COLUMNS
796 LC TROUBLESHOOTINGMixing and Mixers in Liquid Chromatography—Why, When, and How Much?
Part II, Injections
Dwight R. Stoll
What happens when we inject a sample into the mobile-phase stream? Many LC practitioners are surprised to learn just how serious the effect of the injected sample solvent can be.
802 SAMPLE PREP PERSPECTIVESA Look Back and A Look Forward—An Annual Check-up on the State of
Sample Preparation
Douglas E. Raynie
We assess the state of the field, first looking back at developments presented at conferences this year, reader questions, and the passing of a pioneer in solid-phase extraction. Then, we look to the future of sample preparation.
806 GC CONNECTIONSStationary Phase Selectivity: The Chemistry Behind the Separation
Nicholas H. Snow
Here, we focus on selectivity: its definition, its importance for generating separations and resolution; and its role in column polarity.
814 FOCUS ON BIOPHARMACEUTICAL ANALYSISAnalytical Characterization of Biotherapeutic Products, Part II:
The Analytical Toolbox
Anurag S. Rathore, Ira S. Krull, and Srishti Joshi
The analytical techniques used for characterizing biotherapeutics have evolved. We review the utility of the traditional tools and discuss the new, orthogonal techniques that are increasingly being used.
838 THE ESSENTIALSHPLC Column Maintenance: Tips for Extending HPLC Column Lifetime
Follow these tips to protect your columns and extend their useful lifetime.
PEER-REVIEWED ARTICLES
824 Instrument Considerations in the Transfer of Chromatographic Methods,
Part II: System Considerations
Thomas E. Wheat
Scientists executing a method transfer often do not have access to the originating system. Thus, alternative approaches to matching chromatographic results must be considered.
830 Chromatography Fundamentals, Part V:
Theoretical Plates: Significance, Properties, and Uses
Howard G. Barth
The number of theoretical plates forms the basis of chromatographic theory, and is a key parameter used in all modes of chromatography for measuring column efficiency. Fortunately, it’s easy to measure.
COVER DESIGN BY Dan Ward
Cover image courtesy of Ioana Davies (Drutu) /
stock.adobe.com
DEPARTMENTS
794 Peaks of Interest
836 Products & Resources
837 Ad Index

VICI Metronics Dynacalibrators® facilitate
accuracy of analytical data from air pollution
monitoring, industrial hygiene surveys, odor
surveys, and other instruments measuring
gas concentration.
In the lab or in the field, all models support
calibrations traceable to NIST standards for
almost any gas analyzer.
The convenient design of our Dynacal®
permeation devices helps to generate and
deliver precise concentrations from ppb to
high ppm, for hundreds of different
compound options.
Base configurations can be customized for
dilution gas and carrier gas flow capacities.
• Dynacal® permeation devices as trace
gas source
• Dependable, accurate and replicable
calibrations
• Proprietary temperature control system,
chamber temperature 0.01˚ C accuracy
• Front panel access to permeation
chamber
• Plumbing and flow configurations
• Manual and automated versions
• CE-Certified
Metronics
®
Setup
Tubes
Auto
Manual
Timed
Graph
Status
Set Point Actual Deviation
Temp. 1
Temp. 2
Flow 1
Flow 2
Flow dil.
Valve 1
Valve 2
deg. C
deg. C
cc/min.
cc/min.
L/min.
Equilibration Time
46.0
58.0
100.0
100.0
1.0
INLINE
INLINE
38.0
0.0
0.0
0.0
0.0
INLINE
INLINE
-8.0
-58.0
-100.0
-100.0
-1.0
0
0
min:sec10:00
PPB: Mode: Manual- - - -
For Sales inquiresin U.S. :[email protected]

792 LCGC NORTH AMERICA VOLUME 36 NUMBER 11 NOVEMBER 2018 WWW.CHROMATOGRAPHYONLINE.COM
Editorial Advisory Board• Kevin D. Altria – GlaxoSmithKline, Ware, United Kingdom• Jared L. Anderson – Iowa State University, Ames, Iowa • Daniel W. Armstrong – University of Texas, Arlington, Texas • David S. Bell – Restek, Bellefonte, Pennsylvania• Dennis D. Blevins – Agilent Technologies, Wilmington, Delaware• Zachary S. Breitbach – AbbVie Inc., North Chicago, Illinois• Deirdre Cabooter – Department of Pharmaceutical and Pharmacological
Sciences, KU Leuven (University of Leuven), Belgium• Peter Carr – Department of Chemistry,
University of Minnesota, Minneapolis, Minnesota• Jean-Pierre Chervet – Antec Scientific, Zoeterwoude, The Netherlands• André de Villiers – Stellenbosch University, Stellenbosch, South Africa• John W. Dolan – LC Resources, McMinnville, Oregon• Michael W. Dong – MWD Consulting, Norwalk, Connecticut• Anthony F. Fell – School of Pharmacy,
University of Bradford, Bradford, United Kingdom• Francesco Gasparrini – Dipartimento di Studi di Chimica e Tecnologia
delle Sostanze Biologicamente Attive, Università “La Sapienza,” Rome, Italy• Joseph L. Glajch – Momenta Pharmaceuticals, Cambridge, Massachusetts• Davy Guillarme – University of Geneva,
University of Lausanne, Geneva, Switzerland• Richard Hartwick – PharmAssist Analytical Laboratory, Inc.,
South New Berlin, New York• Milton T.W. Hearn – Center for Bioprocess Technology,
Monash University, Clayton, Victoria, Australia• Emily Hilder – University of South Australia, Adelaide, Australia• John V. Hinshaw – Serveron Corporation, Beaverton, Oregon• Kiyokatsu Jinno – School of Materials Science,
Toyohashi University of Technology, Toyohashi, Japan• Ira S. Krull – Professor Emeritus, Department of Chemistry and
Chemical Biology, Northeastern University, Boston, Massachusetts
• Ronald E. Majors – Analytical consultant, West Chester, Pennsylvania• Debby Mangelings – Department of Analytical Chemistry and
Pharmaceutical Technology, Vrije Universiteit Brussel, Brussels, Belgium• R.D. McDowall – McDowall Consulting, Bromley, United Kingdom• Michael D. McGinley – Phenomenex, Inc., Torrance, California• Victoria A. McGuffin – Department of Chemistry,
Michigan State University, East Lansing, Michigan• Mary Ellen McNally – FMC Agricultural Solutions, Newark, Delaware• Imre Molnár – Molnar Research Institute, Berlin, Germany• Glenn I. Ouchi – Brego Research, San Jose, California• Colin Poole – Department of Chemistry,
Wayne State University, Detroit, Michigan• Douglas E. Raynie – Department of Chemistry and Biochemistry,
South Dakota State University, Brookings, South Dakota• Fred E. Regnier – Department of Chemistry, Purdue University,
West Lafayette, Indiana• Koen Sandra – Research Institute for Chromatography, Kortrijk, Belgium• Pat Sandra – Research Institute for Chromatography, Kortrijk, Belgium• Peter Schoenmakers – Department of Chemical Engineering,
University of Amsterdam, Amsterdam, The Netherlands• Kevin Schug – University of Texas, Arlington, Texas• Dwight Stoll – Gustavus Adolphus College, St. Peter, Minnesota• Michael E. Swartz – Stealth Biotherapeutics, Newton, Massachusetts • Caroline West – University of Orléans, France • Thomas Wheat – Chromatographic Consulting, LLC, Hopedale, Massachusetts• Taylor Zhang – Genentech, South San Francisco, California
CONSULTING EDITORS: Jason Anspach – Phenomenex, Inc.; David Henderson – Trinity College; Tom Jupille – LC Resources; Sam Margolis – The National Institute of Standards and Technology; Joy R. Miksic – Bioanalytical Solutions LLC
Pure Chromatography
ADVANTAGESee What It Can Do for You and Your Lab
Sign up today to access Restek’s years of chromatography knowledge at
www.restek.com/advantage

What can we do for you?
www.gerstel.com
(800) 413-8160sa les@gers te lus .com
Thin Film SPME
TICs of a wine using SPME (top) and TF-SPME (bottom).
Taking SPME to the next level
Solvent free extraction/concentration
Larger surface and phase volume
Improved recovery and sensitivity
Wide polarity range, lowest LODs
Headspace or immersion mode
Efficient batch-wise extraction
Welcome to the next level of SPME
SPME
TF-SPME
Insert
Extract
Desorb and Analyze
1
2
3
NEW

794 LCGC NORTH AMERICA VOLUME 36 NUMBER 11 NOVEMBER 2018 WWW.CHROMATOGRAPHYONLINE.COM
PEAKS of Interest
Shimadzu Celebrates
50th Anniversary
Shimadzu has celebrated 50 years of
business in Europe, with 300 guests
attending an event in Duisburg, Germany
to commemorate the anniversary. The
“Magic Moments Night” took place at
the Mercator Hall, and featured music,
show acts, dinner, speeches, greeting
notes, and a “Walk of History.” The
musical part of the evening was
covered by members of the Duisburg
Philharmonic Orchestra. The show
act performed by “Physikanten & Co”
combined entertainment and science.
Giant vortex rings flew 20–30 m across
the hall, and, in a rapid sequence of
experiments, the fascinating aspects of
carbon dioxide were explored. For the
“Walk of History.” Shimadzu collected
historic advertisements, brochures, and
photographs from exhibitions covering
50 years of corporate history in Europe.
Shimadzu’s Japanese-based Super-
visory and Executive Board flew in from
Japan to attend the party with the Euro-
pean Shimadzu team, as well as Shimad-
zu’s distributors and subsidiaries. The
evening’s program was hosted by Ger-
man television journalist Asli Sevindim.
Waters Opens Food and Water
Center in Singapore
Waters Corporation (Milford, Massachu-
setts) has opened a new International
Food and Water Research Centre (IFWRC)
in Singapore to address the growing chal-
lenges of food and water security and
safety. The center will be led by a scien-
tific advisory panel that will identify mean-
ingful, innovative projects by working with
academic and industrial leaders.
Important research areas such as food
fraud discovery, water contamination
research, food quality enhancement, and
new ingredient and formulation studies
will be prioritized as the research center
seeks to find solutions to food and water
supply challenges around the world.
Researchers will gain access to
IFWRC’s state-of-the-art facilities outfit-
ted with analytical instrumentation from
Waters. In addition, the laboratory will
be staffed with scientists and researchers
who will work closely with project owners
throughout implementation. ◾
CHROMATOGRAPHY
MARKET PROFILE
Chinese Laboratories Share Views in SurveyFor high performance liquid chroma-
tography (HPLC), ultrahigh-pressure LC
(UHPLC), and LC–mass spectrometry
(LC–MS) technologies, China has con-
tinued to provide solid growth opportu-
nities, as a result of the country’s invest-
ments in the pharmaceutical industry, as well as agriculture and food testing. Major
instrument manufacturers including Agilent, Shimadzu, Thermo Fisher Scientific,
and Waters have established a stronghold in the market, and continue to per-
form well. As the market continues to evolve, Chinese HPLC users are expressing
their preferences, gravitating to only a few manufacturers. Some Chinese users
maintain a strong allegiance to indigenous HPLC suppliers. However, they also
recognize that the quality, reliability, and performance from the international HPLC
manufacturers are unrivaled, swaying purchase decisions in favor of global brands.
Top-Down Analytics (TDA) recently surveyed over 200 Chinese HPLC, UHPLC,
and LC–MS users who provided opinions about their instrument and consumables
suppliers. Approximately 30% of the respondents were from pharmaceutical and
biotechnology laboratories. Agriculture, food and beverage, and government labo-
ratories each represented about a fifth of the responses, and LC users from chemical
laboratories accounted for about 14% of the survey participants.
When asked to compare domestic or Chinese LC manufacturers with global
brands, some respondents were quite candid, indicating that the Chinese brands
were improving, but still far from catching up to the quality of the international sup-
pliers. For columns and other consumables, many Chinese laboratories prefer to use
local distributors.
The use of UHPLC continues to increase in popularity, keeping pace with North
American and European trends. The overall market for HPLC, UHPLC, and LC–MS in
China represents a significant share of the overall market, accounting for about 11%
of the worldwide analytical instrument industry. In 2017, TDA estimates there were
about 7000 combined HPLC and LC–MS installations in China. Growth is expected
to remain quite robust for the next few years, as a result of continued expansion of
life science research laboratories and applied markets.
Market size and growth estimates were adopted from TDA’s Industry Data, a
database of technology market profiles and benchmarks, and the 2018 Instrument
Industry Outlook report from independent market research firm Top-Down Analytics
(TDA). Survey data was extracted from TDA’s report, “A Liquid Chromatography
Survey in China: Chinese Scientists Share Their Preferences.” For more information,
contact Glenn Cudiamat, general manager, at (888) 953-5655 or glenn.cudiamat@
tdaresearch.com. Glenn is a market research expert who has been covering the
analytical instrumentation industry for more than two decades.
Sector distribution of Chinese HPLC and LC–MS survey respondents (n = 223).

wyatt.com
© 2018 Wyatt Technology. All rights reserved. All trademarks and registered trademarks are properties of their respective holders.
Triple detection is a whole new ballgame. Our detectors
for multi-angle light scattering, refractive index and
differential viscosity represent the leading technology
in their categories. When our three instruments are
combined, they create an all-new level of capability
that dramatically expands your characterization
capabilities. It’s an example of the whole exceeding
the sum of its parts. Now, you can do more, see more,
and know more. Simultaneously.
Learn how triple detection can help your research team
hit it out of the park at wyatt.com/Triple
Triple detection combines the power
of three—or more—instruments
to determine absolute molecular
weights, sizes and viscosities.
7
4
1
0 .2 3
65
98
TAB ESC DEL
ENTER
DAWNHELEOS-II
7
4
1
0 .2 3
65
98
TAB ESC DEL
ENTER
OptilabT-rEX
0 .
1 2 3
4 5 6
7 8 9
TAB ESC DEL
OK

796 LCGC NORTH AMERICA VOLUME 36 NUMBER 11 NOVEMBER 2018 WWW.CHROMATOGRAPHYONLINE.COM
LC TROUBLESHOOTING
Dwight R. Stoll
In the previous installment of “LC Trou-
bleshooting” (1), I reviewed the basic
working principles behind the two most
commonly used LC pump designs in use
today: so-called low- and high-pressure
mixing systems. I then discussed why
using a mobile-phase mixer between the
fluid convergence point at the pump and
the sample injector is needed in both
cases, albeit for different reasons. Finally,
I showed the effect of using mixers with
different volumes for different separation
conditions, and discussed some of the
advantages and disadvantages associ-
ated with changing mixer volumes.
This month, I am continuing with the
theme of mixing and mixers, but this time
focusing on what happens when we inject
a sample into the mobile-phase stream,
particularly in cases where there is a mis-
match between the compositions of the
two fluids. This mismatch most commonly
exists as a difference in solvent composi-
tion (for example, injecting an analyte dis-
solved in 100% acetonitrile into a mobile
phase of 20/80 acetonitrile/water) between
the sample and mobile phase. However,
there certainly are situations where differ-
ences in the pH or buffer composition of
the two fluids can also be very important.
It is most certainly true that there are
many analytical situations where the effect
of the injected solvent is practically negli-
gible; for example, injecting 1 μL of sam-
ple into a 150 mm x 4.6 mm i.d. column
that has a volume of about 1.5 mL. However,
I also think many practitioners of LC are sur-
prised to learn just how serious the effect
of the injected sample solvent can be, most
commonly when they observe bad results. I
am hopeful that this installment will shed a
little more light on these issues, and particu-
larly address the question of whether or not
mixing is needed after the injector.
Combining Fluids in LC
Systems—Where and How?
Three of the different ways that fluids are
brought together in LC systems are illus-
trated schematically in Figure 1. The first
two represent the ways fluids are brought
together in either high-pressure or low-
pressure mixing pump systems. Although
I discussed the differences between
these designs in detail in the previous
installment of “LC Troubleshooting,” the
differences are actually quite relevant
to the topic of sample injection, and so
worth repeating here. In short, the major
fundamental difference between the two
approaches (Figure 1A and 1B) is that, in
the first case, the two fluid streams con-
verge in a kind of parallel fashion, so that
the two fluids are always in close contact,
whereas in the second case, small packets
of each fluid are introduced into a single
fluid path in a kind of serial fashion.
The third scenario of Figure 1 illustrates
the way that a sample is introduced into
the mobile-phase stream for nearly all
injectors in use in LC today. This is con-
ceptually similar to the way that fluids are
combined in the case of a low-pressure
mixing pump; that is, volumes of the flu-
ids are introduced to a single flow path in
a serial fashion, or “end to end.” In the
case of a typical sample injection, the
consequence of this is quite striking. If
we assume that a 10 μL portion of sam-
ple is injected into a 120 μm (0.005”) i.d.
tube leading to the LC column; by dividing
the sample volume by the cross-sectional
area of the tube, we find that the sample
could occupy as much as a 90 cm length
of this tubing, bracketed on both ends
by mobile phase. Given the degree of
physical separation of the middle of the
sample plug from the closest mobile
phase fluid (in this case 45 cm), and the
relatively short time it takes for the sample
to reach the column under typical condi-
tions (a few seconds), there is absolutely
no way that the two fluids will actually
mix before the sample reaches the col-
umn. And so, this then leads to the ques-
tion, “Under what circumstances should
a physical mixer be deployed to ensure
that the sample mixes with the mobile
phase before reaching the column?”
Does it Really Matter If the Sample is
Mixed with the Mobile Phase?
As with many things, the answer here is
“It depends.” In my thinking about this,
I divide different situations into two cat-
Is a mixer needed between the injector and column in HPLC?
Mixing and Mixers in Liquid Chromatography– Why, When, and How Much? Part II, Injections
Ico
n i
ma
ge
: J
oe
Zu
gc
ic,
Zu
gc
ic P
ho
tog
rap
he
rs,
Inc
.

© 2018 Hamilton Company. All rights reserved.
Your sample depends on it
More than 50 years of precision liquid
handling experience. Proven accuracy.
Continuous research and development.
Choose an autosampler syringe from
Hamilton Company and be confident
in your results.
Hamilton offers a line of syringes
designed to work with a wide range
of the most popular autosamplers
from Agilent, CTC PAL, Spark Holland,
and more. Each syringe is expertly
handcrafted to maximize sample
integrity, process efficiency, and
new long-life syringe technology.
For more information, visit
www.hamiltoncompany.com/autosampler
or call toll free 1-888-525-2123.

798 LCGC NORTH AMERICA VOLUME 36 NUMBER 11 NOVEMBER 2018 WWW.CHROMATOGRAPHYONLINE.COM
egories: conditions that favor focusing of
the analyte at the column inlet, and those
that do not. This is most effectively under-
stood by way of example. Figure 2 shows
the chromatograms obtained when a sim-
ple mixture of alkylphenones is injected
into a reversed-phase column followed
by solvent gradient elution, but with two
different injection conditions. Clearly, the
first case (A) yields a very nice separation,
whereas in the second case (B), the five
compounds are not well separated and
the peak shapes are terrible. The difference
here is that, in Case A, the analytes are dis-
solved in a 30/70 acetonitrile/water mixture,
and, in Case B, a 70/30 acetonitrile/water
mixture. The solvent gradient starts at 50%
acetonitrile, and runs to 90% acetonitrile
at the end of the gradient. We explain this
result by recognizing that, in Case A, the
analytes are dissolved in solvent that con-
tains less acetonitrile than the mobile phase
itself (50%) at the beginning of the analysis.
Under these conditions, the analytes will be
well retained by the stationary phase, have
a low velocity, and are effectively “stuck”at
the column inlet. We say that they are
“focused” or “compressed”into a narrow
band, and that this narrow width estab-
lishes a kind of initial condition from which
the rest of the separation (and subsequent
peak broadening) develops. This effect has
been known for decades (2), but also con-
tinues to be a subject of active research (3,4).
On the other hand, in case B, the sample
contains more acetonitrile than the mobile
phase at the starting point of the analysis.
Under these conditions, the analytes will
be poorly retained, have a high velocity
approaching the mobile phase velocity, and
are spread out across a large fraction of the
column bed. This, too, establishes a kind of
initial condition for the analyte bands, but,
in contrast to case A, one that involves very
broad peaks, from which the separation
cannot recover because the peaks will only
get broader as the separation develops.
So, to answer the question that heads
this section, I would say that, generally
speaking, if the injection conditions favor
focusing of the analytes at the column inlet,
as is the case in Figure 2A, then no actual
mixing of the sample and mobile phase is
needed to obtain good results. Indeed,
the chromatogram in Figure 2A is convinc-
ing evidence for this. Of course, there are
always exceptions (see the section later
about viscous fingering); however, this
view should be pretty broadly applicable.
On the other hand, if the injection condi-
tions are not favorable for focusing, as in
Figure 2B, then this can be a real problem,
FIGURE 1: Idealized representation of the different ways two fl uids converge under different circumstances in LC systems: (A) convergence in a binary high-pressure mix-ing pump, (B) convergence at the outlet of a solvent proportioning valve in a low-pres-sure mixing pump, and (C) convergence when a sample is injected into a mobile phase stream that will carry the sample to the LC column.
FIGURE 2: Comparison of chromatograms obtained from injection of samples in (A 30/70
acetonitrile/water, or (B) 70/30 acetonitrile/water. Conditions: column, 50 mm x 2.1 mm i.d.
C18; injection volume, 40 μL; gradient elution from 50-90% acetonitrile from 0–15 s, with water as the aqueous phase; fl ow rate, 2.5 mL/min.; analytes are alkylphenone homologs from ace-tophenone to hexanophenone.
A(a)
(b)
(c)
B
Tube i.d. ~170 μm
Tube i.d. ~120 μm
~90 cmFor 10 μL injected
1500
1000
500
Ab
sorb
an
ce (
mA
U,2
54
nm
)
0
1500
1000
500
0
0 0.1 0.2 0.3 0.4 0.5
0 0.1 0.2
Time (min)
0.3 0.4 0.5
(a)
(b)

WWW.CHROMATOGRAPHYONLINE.COM NOVEMBER 2018 LCGC NORTH AMERICA VOLUME 36 NUMBER 11 799
and solving the problem may or may not
require a physical mixer, depending on
how the solution is implemented.
Dealing with Situations Involving
Unfavorable Solvent Mismatch
In my laboratory, we have studied the
effect of the composition and volume of
the injected sample on separation per-
formance (for example, as in Figure 2)
extensively. When I discuss this work with
people, the two things I hear most com-
monly are that: 1) extensive mixing of the
sample with the mobile phase is needed
to achieve good results as in Figure 2A;
and 2), it is physical differences between
the sample and mobile phase (for exam-
ple, viscosity) that are the root cause of
poor results (as in Figure 2B). Here, I’d like
to discuss a few results that I think shed
some light on these issues.
Viscous fingering is a physical phe-
nomenon that can develop when a less
viscous fluid (for example, acetonitrile)
is injected into a more viscous one (for
example, water) that flows into a porous
medium. In this situation, local flow insta-
bilities can develop that produce “fin-
gers” of the injected fluid that appear
to reach into the adjacent fluid (in the
chromatographic context, the mobile
phase). This effect has been known in
preparative chromatography for some
time, but more recently was also visu-
ally demonstrated under analytical scale
chromatography conditions by Samuels-
son, Fornstedt, and coworkers (5). This,
and related work, provides compelling
evidence that viscous fingering can
occur in analytical chromatography col-
umns and probably leads to effects on
chromatographic efficiency (that is, plate
number, or plate height) that cannot be
accounted for using simple plate models
of chromatography.
In our own work, we have adapted a
simple plate model of liquid chroma-
tography that enables us to simulate the
effects of sample solvent composition and
volume on chromatographic peak shape
and efficiency (4,6). To summarize a great
deal of work in this direction, I would say
that, by using this simple plate model, we
can account for a large majority of the
effects of sample solvent composition
and volume on peaks that we observe
in real experiments without invoking the
effects of more complex processes, such
as viscous fingering (for example, we have
been able to faithfully predict results like
those shown in Figure 2 [4]). Neverthe-
less, there are some differences between
simulation and experimental results that
we cannot account for, and it possible
that the viscous fingering could explain
some of these differences. Clearly, more
work on this is needed to more fully
understand these effects.
Our work on this topic has yielded
some experimental results that are
instructive here. First, the peaks shown in
Figure 3 were obtained from experiments

800 LCGC NORTH AMERICA VOLUME 36 NUMBER 11 NOVEMBER 2018 WWW.CHROMATOGRAPHYONLINE.COM
aimed at understanding the shape of the
injected sample plug injected into the
second dimension column in two-dimen-
sional liquid chromatography. In this case,
the mobile phase was 50/50 acetonitrile/
water, and the sample was the same solu-
tion but spiked with 10 μg/mL of uracil,
which is used to trace the concentration
profile by UV absorbance detection.
In other words, the uracil is a proxy for
other sample solvent components, such
as acetonitrile. These experiments are
done without a column installed, such
that the profile we observe is essentially
the sample profile as it would enter the
LC column. The point I want to empha-
size here is that, even with a relatively
small injection volume of 13 μL, there is a
point in the center of the profile where the
fluid that is detected is essentially pure
sample. In other words, there is very
little mixing between the center of
the sample plug and the surrounding
mobile phase. I think this is relatively
easy to understand when we imagine
what happens inside the system using
the illustration in the third case of Fig-
ure 1. The practical consequence of
this, then, is that if we have analytes
dissolved in a sample with a high con-
centration of acetonitrile and we inject
this into a mobile phase with a much
lower concentration of acetonitrile,
there will be a point where the sample
solvent acts as the mobile phase inside
the column because there is insufficient
mixing with the surrounding mobile
phase. This brings us back to the ques-
tion, “Should we install a mixer between
the injector and the column?” The main
problem with installing a simple mixer
(think spinning stir-bar) in this context is
that effective mixing of the sample will
require a relatively large volume mixer,
which will both effectively increase the
volume of the injected sample, and add
gradient delay volume to the system. If
neither of these issues is detrimental for
the analysis at hand, then adding such
a mixer could be a good solution to the
problem. In our own work on the sample
solvent problem in the context of 2D-LC
where analysis time is a precious resource,
we have developed an approach referred
to as active solvent modulation (ASM) that
works quite well (7).
The last bit of data I’d like to discuss
here actually comes from our work on
ASM, where an injected sample is mixed
with the mobile phase stream in more of
a parallel fashion (that is, like converging
streams in Figure 1A) than the more typ-
ical serial fashion (as in Figure 1C). Fig-
ure 4 shows a comparison of the sample
plug profiles observed when the injected
sample is brought together with mobile
phase in a serial fashion (black traces), or
in a parallel fashion (red traces). In these
cases, the mobile phase was 50/50 aceto-
nitrile/water, and the injected sample was
acetonitrile (4A), or 2-propanol (4B), each
containing 0.1% acetone as a tracer that
is observed by UV absorbance detec-
tion. There are two main points I’d
like to make about these results. First,
here, as in Figure 3, we see that in
the case of serial sample introduction
there is little mixing of the sample with
the surrounding mobile phases. On
the other hand, when the sample and
mobile phase are brought together in
a parallel fashion, the mixing is very
effective, as indicated by the lowered
concentration of acetone detected
during introduction of the sample
plug. Note that the profile is wider in
time because the effective volume of
the sample plug is increased as it is
mixed with mobile phase. The differ-
ences in the extent of dilution of the
acetone (as indicated by the different
peak heights) are related to the differ-
ent viscosities of the two samples. Sec-
ond, there are not obvious differences
in the sample plug profiles observed
for the two sample solvents injected,
even though their viscosities vary by a
factor of about seven.
FIGURE 3: Comparison of sample plug profi les obtained from injections of either 13 or 40 μL of
sample from a conventional fi xed loop injector. The mobile phase was 50/50 acetonitrile water, pumped at 2.5 mL/min., and the sample was the same solvent spiked with uracil at 10 μg/mL. The injector was connected directly to the detector with a short length of 75 μm i.d. tubing. Adapted with permission from ref. (4).
700
600
500
400
300
200
100
0
700
600
500
400
300
200
100
Ab
sorb
an
ce (
mA
U, 254 n
m)
00 1 2 3
0 1 2 3
Time (s)
(b) 40 μL
(a) 13 μL

WWW.CHROMATOGRAPHYONLINE.COM NOVEMBER 2018 LCGC NORTH AMERICA VOLUME 36 NUMBER 11 801
Summary
When possible, it is desirable to match the sample solvent to the
mobile-phase composition used in a LC method, and use an injec-
tion volume that is small relative to the volume of the LC column
itself to minimize the effects of the injected sample on separation
performance. However, there are some situations where this is not
possible because of limitations on analyte solubility, or the need to
inject large volumes to improve detection sensitivity. In these situa-
tions, it is helpful to have a detailed understanding of what happens
during the injection process. In situations where the relationship
between the properties of the sample solvent and the mobile phase
favor analyte focusing, most likely a mixer is not needed between
the injection point and the LC column. However, if the situation
does not favor analyte focusing, this can lead to very bad results
(see for example, Figure 2B), and in these cases installing a mixer, or
using an alternate means of sample injection may be helpful.
Acknowledgements
I want to thank Gustavus Adolphus College student Hayley
Lhotka for collecting the data shown in Figure 4.
References
(1) D.R. Stoll, LCGC North Amer. 36(10),746–751 (2018).
(2) L.R. Snyder and D.L. Saunders, J.Chromatogr. Sci. 7, 195–208 (1969). doi:10.1093/chromsci/7.4.195.
(3) S.R. Groskreutz and S.G. Weber, J. Chromatogr. A 1409, 116–124 (2015). doi:10.1016/j.chroma.2015.07.038.
(4) D.R. Stoll, R.W. Sajulga, B.N. Voigt, E.J. Larson, L.N. Jeong, and S.C. Rutan, J. Chromatogr. A. 1523, 162–172 (2017). doi:10.1016/j.chroma.2017.07.041.
(5) J. Samuelsson, R.A. Shalliker, and T. Fornstedt, Microchem. J. 130, 102–107 (2017). doi:10.1016/j.microc.2016.08.007.
(6) L.N. Jeong, R. Sajulga, S.G. Forte, D.R. Stoll and S.C. Rutan, J. Chromatogr. A 1457, 41–49 (2016). doi:10.1016/j.chroma.2016.06.016.
(7) D.R. Stoll, K. Shoykhet, P. Petersson, and S. Buckenmaier, Anal. Chem. 89, 9260–9267 (2017). doi:10.1021/acs.analchem.7b02046.
Dwight R. Stollis the editor of “LC Troubleshooting.” Stoll is a profes-sor and co-chair of chemistry at Gustavus Adolphus College in St. Peter, Minnesota. His primary research focus is the development of 2D-LC for both targeted
and untargeted analyses. He has authored or coauthored more than 50 peer-reviewed publications and three book chapters in separation science and more than 100 conference presentations. He is also a member of LCGC’s editorial advisory board. Direct correspondence to: [email protected]
FIGURE 4: Comparison of sample plug profi les for injections of ei-
ther (A) acetonitrile or (B) 2-propanol into a 50/50 acetonitrile/water mobile phase. Both samples contained 0.1% acetone (v/v). The ASM injection loop volume was 40 μL, and the injection valve was connect-ed directly to the detector using a short length of 120 μm i.d. tubing.
ABOUT THE COLUMN EDITOR
90
80
70
60
50
40
30
20
10
120
100
80
60
40
20
00 5
00 5 10
Sample introduced serially
(a) Sample in acetonitrile
(b) Sample in PrOH
Time (s)
Ab
sorb
an
ce (
mA
U,
22
0 n
m)
Sample introduced in parallel
15 20
10 15 20
( Reliably Sensitive )
Glyphosate Analysis in Food
The Experts for 30 Years
www.pickeringlabs.com
CATALYST FOR SUCCESS
PINNACLE PCX

802 LCGC NORTH AMERICA VOLUME 36 NUMBER 11 NOVEMBER 2018 WWW.CHROMATOGRAPHYONLINE.COM
Ico
n i
ma
ge
: J
oe
Zu
gc
ic,
Zu
gc
ic P
ho
tog
rap
he
rs,
Inc
.
SAMPLE PREP
PERSPECTIVES
Since I took responsibility for this col-
umn, I’ve tried to focus on techniques,
with a balance of theory, applications, and
operational aspects. I’ve aimed to provide
a balance that will be of interest to both
the bench chemist and the laboratory
supervisor, at all levels of education and
background. Occasionally, trends related
to sample preparation are reported. This
month, the final installment of the year will
take a slightly different approach. Three
vignettes are presented, either looking
back at important, but overlooked, devel-
opments, or prognosticating the future.
The Total Youden Blank
In our previous column (1), we discussed
the role of sample blanks in chemical anal-
ysis, and provided an overview of various
types of blanks. One concerned reader
sent an email to comment on an often
overlooked, but highly important, type of
blank, the total Youden blank. From the
mid-1940s to the early 1970s, W. J. Youden
presented research on the application
of multivariate analysis to data sets from
chemical determinations (2–6). The cali-
brations and methods presented deter-
mine, among other uses, constant errors
with proposed calculations to confront
proportional errors. These methods use a
fractional factorial design to minimize the
number of analyses in assaying several
factors. In single laboratory validations,
the susceptibility of analytical methods to
small changes in parameters is examined.
For example, in sample preparation, we
have several optimization parameters of
varying importance, as illustrated in Table
I (7). This list of optimization parameters
is not exhaustive, but limited to the major
influences. Other extraction methods, and
each step in an analytical procedure, will
contribute different, and additional, opti-
mization parameters. Evaluating each of
these in a one-at-a-time approach would
be prohibitive. When analytical signals are
due solely to the presence of analyte, with
no matrix-based interference, the signal
from the analyte [SA] can be modeled as
[SA] = K + [αA]CA, where K is the Youden
blank or “true sample blank,” [αA] is the
slope of the calibration curve (or analytical
sensitivity), and CA is the analyte amount
(either concentration or weight). Several
reviews or tutorials, such as those in refer-
ences 7–10, provide more detailed treat-
ments of the Youden method.
In Memory of Patrick D. McDonald
and Recent Advances in Solid-
Phase Extraction Symposium
One of the pioneers in the development
of solid-phase extraction (SPE), Patrick
D. McDonald, passed in August 2017. Dr.
McDonald (Figure 1) was hired by Waters
and Associates in 1974, initially to develop
preparative liquid chromatography (LC)
instruments. Later, he was charged to “find
new, faster, more convenient ways to per-
form traditional sample preparation oper-
ations (11).” While others had used adsor-
bents in sample clean-up procedures, his
team went from proposing the use of LC
technology in a June 1977 internal memo to
Douglas E. Raynie
As this is the final “Sample Prep Perspectives” column of the year, it is fitting to assess the state of the field by taking
a look back and a look forward. Specifically, we’ll start by addressing a reader’s email, then look at the state of sample
preparation at two recent conferences. In the August issue, we looked at the role of blanks (samples lacking the analyte of
interest used to determine or track the source of contamination or sample degredation and taken through the analytical
process) in understanding the sample analysis process. One reader suggested that it is appropriate to address the total
Youden blank, an often overlooked and perhaps the most true blank. The total Youden blank completely eliminates the
constant error component arising from any source of bias involved in the measurement. In August 2017, we lost Dr. Patrick
McDonald. McDonald was a Research Fellow at Waters Corporation and one of the pioneers in the development of solid-
phase extraction. At the Fall National Meeting of the American Chemical Society, a symposium was held in his memory.
We’ll review the symposium and McDonald’s contributions to get an up-to-date snapshot of the field of SPE. Finally, at this
summer’s ExTech (International Symposium on Extraction Technologies), an expert panel offered their views on the future
of sample preparation. A summary of this panel discussion is presented.
A Look Back and A Look Forward—An Annual Check-up on the State of Sample Preparation

Minimize complexity. Magnify your focus.
Milli-Q® IQ 7003/7005Integrated Ultrapure and Pure Water System
• Simple and intuitive Q-POD® and
E-POD® dispensers
• Touchscreen display for unparalleled
ease of use
• (ɞRUWOHVV�GDWD�PDQDJHPHQW�DQG�
ensured traceability
• Compact and versatile to
optimize lab space
7R�ɟQG�RXW�PRUH��YLVLW��
EMDMillipore.com/labwater
The life science business of Merck
.*D$��'DUPVWDGW���*HUPDQ\�RSHUDWHV�DV�
MilliporeSigma in the U.S. and Canada.
0LOOLSRUH6LJPD��WKH�YLEUDQW�0��0LOOL�4��(�32'�DQG�4�32'�
DUH�WUDGHPDUNV�RI�0HUFN�.*D$��'DUPVWDGW��*HUPDQ\�RU�
LWV�DɡOLDWHV��$OO�RWKHU�WUDGHPDUNV�DUH�WKH�SURSHUW\�RI�WKHLU�
respective owners. Detailed information on trademarks
is available via publicly accessible resources.
j������0HUFN�.*D$��'DUPVWDGW��*HUPDQ\�DQG�RU
LWV�DɡOLDWHV��$OO�5LJKWV�5HVHUYHG�

804 LCGC NORTH AMERICA VOLUME 36 NUMBER 11 NOVEMBER 2018 WWW.CHROMATOGRAPHYONLINE.COM
shipping the first “Sample Enrichment and
Purification” (SEP–PAK) product in January
1978. SEP–PAK featured a heat-shrinkable
polyethylene body, triaxial compression
technology, and preparative LC C18-silica
particles. Figure 2 shows the cover of the
original February 1978 marketing brochure
for SEP–PAK cartridges. Note that these
questions concerning the cost, time, and
interferences of sample preparation still res-
onate today, though it is hoped that sam-
ple preparation advances have significantly
improved over the decades and the current
situation reflects the simultaneous advances
in analysis techniques! As SEP–PAK car-
tridges became accepted and other manu-
facturers developed other approaches, J.T.
Baker’s term, solid-phase extraction (SPE),
came to represent the technique.
McDonald also edited Waters’s “Sol-
id-Phase Extraction Applications Guide
and Bibliography.” By the sixth edition in
1995, over 3000 applications were com-
piled. In 1996, he and his team devel-
oped and patented the Waters Oasis
HLB copolymer (12). This sorbent is a
hydrophilic–lipophilic balance copoly-
mer. The water-wettable sorbent retains
analytes over a wide polarity range and
is stable from pH 1 to 14.
In memory of McDonald, a symposium
on recent advances in SPE was held at the
256th National Meeting of the American
Chemistry Society at Boston in August,
organized by Tom Walter, a corporate
fellow at Waters and former associate of
McDonald. The nine invited oral presenta-
tions, listed in Table II, can be considered
an assessment of the current state of the
field. In particular, small-scale biological
samples, matrix removal, and magnetic
sorbent particles are all driving present
research in SPE. This column and peer-re-
viewed analytical chemistry journals review
the current state of SPE periodically.
Views on Future Developments
in Sample Preparation
Last spring, our sister publication fea-
tured an interview conducted by editors
of LCGC with panelists from compa-
nies that exhibited at Analytica 2018
(13). The topic was to assess the trends
and developments in the chromatogra-
phy sector. Specifically, representatives
from Biotage (Paul Roberts), CEM (Alicia
Stell), Eprep (Peter Dawes), Gerstel (Oli-
ver Lerch), Phenomenex (Matt Brusius),
and UCT (Danielle Mackowsky) were
asked their opinions on emerging sam-
ple preparation trends, important recent
developments, obstacles to continued
sample preparation developments, and
the biggest accomplishments in the past
year. While each of the six panelists pro-
vided perspectives from their viewpoints,
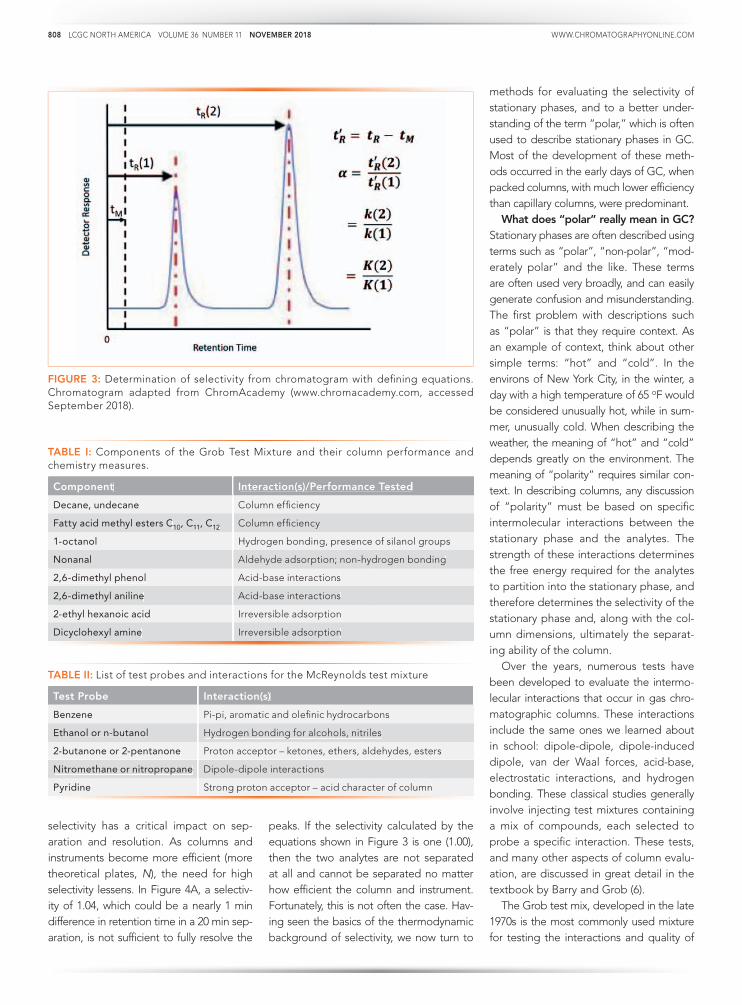
TABLE I: Potential factors to be exam-ined in the robustness testing of com-mon sample preparation techniques (from reference 7)
Sample Preparation Technique
Factors
Solid-PhaseExtraction
Sorbent type
Sorbent manufacturer
Sorbent mass
Sample massor volume
Wash solvent
Elution solvent
Evaporationtemperature
Sample pH
Buffer pH
Matrix Solid-PhaseDispersion
Sorbent type
Sorbent manufacturer
Sorbent mass
Sample pH
Buffer pH
Sonication time
Evaporationtemperature
Wash solvent
Elution solvent
Sample massor volume
TABLE II:TT Papers presented at “Recent Advances in Solid Phase Extraction: Symposium inhonor of Patrick D. McDonald,” held at the Fall 2018 National ACS Meeting
Harnessing the Power of Solid-Phase Extraction for Peptide Bioanalysis. M. Lame (Waters)
Solid-Phase Extraction (SPE) in Bioanalytical Method Development for Therapeutic Peptides. K. Lee (Waters)
Development, Validation and Application of a Cation-exchange, Solid-Phase Extraction forthe Determination of Nanoparticle-released Drug Concentrations in Plasma. C. Holliman, W. Song, J. Tweed, Z. Gu (Pfi zer)
Recent Advances in Solid-Phase Extraction for Biological Sam-ples–Fulfi lling the Promise of SPE. J. Danaceau (Waters)
New Developments in SPME. J. B. Pawliszyn (University of Waterloo)
Effective Simplifi ed SPE for Modern Multiresidue Analysis: Recent Developments for Pass-through, Dispersive, and Retention/Elution SPE. M.S. Young, K. Tran (Waters)
Lipid Selective SPE Materials Simplify Sample Preparation and Improve Results. D. Lucas, B.E. Richter, L. Zhao (Agilent Technologies)
Variability of Solute-Sorbent Binding Constants in SPE Materials. D.E. Raynie, S. Pandey, S. Subedi, D. Lucas, B.E. Richter (South Dakota State University)
Porphyrin-based Magnetic Nanocomposites for Effi cient Extraction of Polycyclic Aromatic Hydrocarbons from Water Samples. J. Yu, S. Zhu (China University of Geosciences)
FIGURE 1: Dr. Patrick D. McDonald (1944-2017), Research Fellow at Waters and Associ-ates and inventor of SEP-PAK, Oasis, and oth-er leading advances in SPE. (Photo courtesy of Tom Walter, Waters.).
WWW.CHROMATOGRAPHYONLINE.COM NOVEMBER 2018 LCGC NORTH AMERICA VOLUME 36 NUMBER 11 805
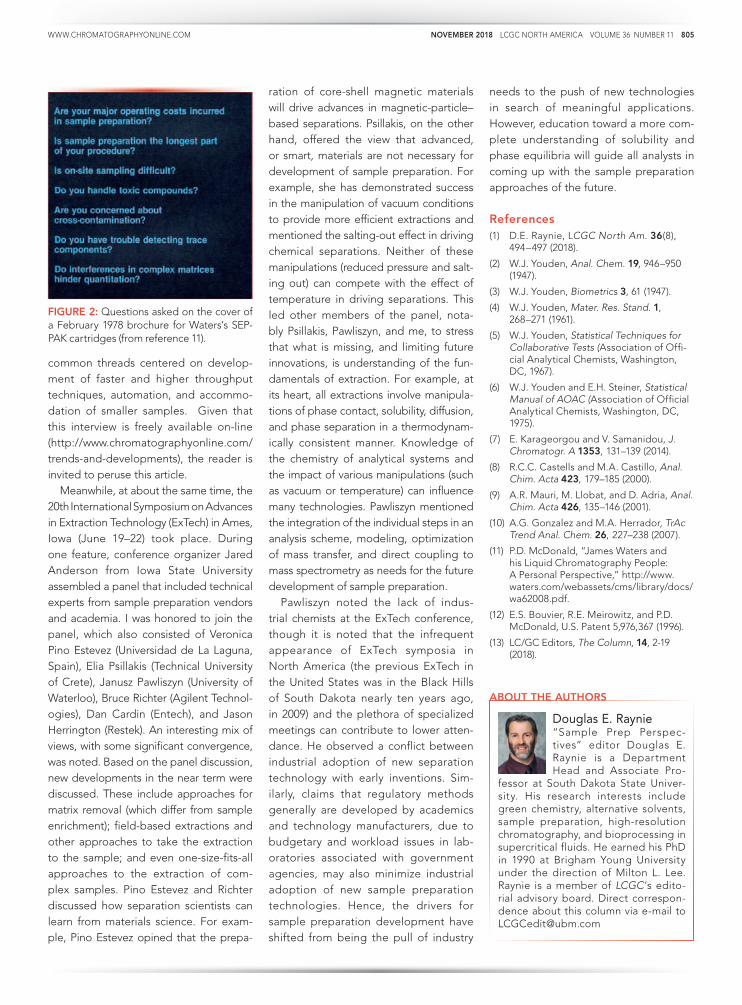
common threads centered on develop-
ment of faster and higher throughput
techniques, automation, and accommo-
dation of smaller samples. Given that
this interview is freely available on-line
(http://www.chromatographyonline.com/
trends-and-developments), the reader is
invited to peruse this article.
Meanwhile, at about the same time, the
20th International Symposium on Advances
in Extraction Technology (ExTech) in Ames,
Iowa (June 19–22) took place. During
one feature, conference organizer Jared
Anderson from Iowa State University
assembled a panel that included technical
experts from sample preparation vendors
and academia. I was honored to join the
panel, which also consisted of Veronica
Pino Estevez (Universidad de La Laguna,
Spain), Elia Psillakis (Technical University
of Crete), Janusz Pawliszyn (University of
Waterloo), Bruce Richter (Agilent Technol-
ogies), Dan Cardin (Entech), and Jason
Herrington (Restek). An interesting mix of
views, with some significant convergence,
was noted. Based on the panel discussion,
new developments in the near term were
discussed. These include approaches for
matrix removal (which differ from sample
enrichment); field-based extractions and
other approaches to take the extraction
to the sample; and even one-size-fits-all
approaches to the extraction of com-
plex samples. Pino Estevez and Richter
discussed how separation scientists can
learn from materials science. For exam-
ple, Pino Estevez opined that the prepa-
ration of core-shell magnetic materials
will drive advances in magnetic-particle–
based separations. Psillakis, on the other
hand, offered the view that advanced,
or smart, materials are not necessary for
development of sample preparation. For
example, she has demonstrated success
in the manipulation of vacuum conditions
to provide more efficient extractions and
mentioned the salting-out effect in driving
chemical separations. Neither of these
manipulations (reduced pressure and salt-
ing out) can compete with the effect of
temperature in driving separations. This
led other members of the panel, nota-
bly Psillakis, Pawliszyn, and me, to stress
that what is missing, and limiting future
innovations, is understanding of the fun-
damentals of extraction. For example, at
its heart, all extractions involve manipula-
tions of phase contact, solubility, diffusion,
and phase separation in a thermodynam-
ically consistent manner. Knowledge of
the chemistry of analytical systems and
the impact of various manipulations (such
as vacuum or temperature) can influence
many technologies. Pawliszyn mentioned
the integration of the individual steps in an
analysis scheme, modeling, optimization
of mass transfer, and direct coupling to
mass spectrometry as needs for the future
development of sample preparation.
Pawliszyn noted the lack of indus-
trial chemists at the ExTech conference,
though it is noted that the infrequent
appearance of ExTech symposia in
North America (the previous ExTech in
the United States was in the Black Hills
of South Dakota nearly ten years ago,
in 2009) and the plethora of specialized
meetings can contribute to lower atten-
dance. He observed a conflict between
industrial adoption of new separation
technology with early inventions. Sim-
ilarly, claims that regulatory methods
generally are developed by academics
and technology manufacturers, due to
budgetary and workload issues in lab-
oratories associated with government
agencies, may also minimize industrial
adoption of new sample preparation
technologies. Hence, the drivers for
sample preparation development have
shifted from being the pull of industry
needs to the push of new technologies
in search of meaningful applications.
However, education toward a more com-
plete understanding of solubility and
phase equilibria will guide all analysts in
coming up with the sample preparation
approaches of the future.
References
(1) D.E. Raynie, LCGC North Am. 36(8), 494–497 (2018).
(2) W.J. Youden, Anal. Chem. 19, 946–950 (1947).
(3) W.J. Youden, Biometrics 3, 61 (1947).
(4) W.J. Youden, Mater. Res. Stand. 1, 268–271 (1961).
(5) W.J. Youden, Statistical Techniques for Collaborative Tests (Association of Offi-cial Analytical Chemists, Washington, DC, 1967).
(6) W.J. Youden and E.H. Steiner, Statistical Manual of AOAC (Association of Official Analytical Chemists, Washington, DC, 1975).
(7) E. Karageorgou and V. Samanidou, J. Chromatogr. A 1353, 131–139 (2014).
(8) R.C.C. Castells and M.A. Castillo, Anal. Chim. Acta 423, 179–185 (2000).
(9) A.R. Mauri, M. Llobat, and D. Adria, Anal. Chim. Acta 426, 135–146 (2001).
(10) A.G. Gonzalez and M.A. Herrador, TrAc Trend Anal. Chem. 26, 227–238 (2007).
(11) P.D. McDonald, “James Waters and his Liquid Chromatography People: A Personal Perspective,” http://www.waters.com/webassets/cms/library/docs/wa62008.pdf.
(12) E.S. Bouvier, R.E. Meirowitz, and P.D. McDonald, U.S. Patent 5,976,367 (1996).
(13) LC/GC Editors, The Column, 14, 2-19 (2018).
FIGURE 2: Questions asked on the cover of a February 1978 brochure for Waters’s SEP-PAK cartridges (from reference 11).
Douglas E. Raynie“Sample Prep Perspec-tives” editor Douglas E. Raynie is a Department Head and Associate Pro-
fessor at South Dakota State Univer-sity. His research interests include green chemistry, alternative solvents, sample preparation, high-resolution chromatography, and bioprocessing in supercritical fluids. He earned his PhD in 1990 at Brigham Young University under the direction of Milton L. Lee. Raynie is a member of LCGC ’s edito-rial advisory board. Direct correspon-dence about this column via e-mail to [email protected]
ABOUT THE AUTHORS

806 LCGC NORTH AMERICA VOLUME 36 NUMBER 11 NOVEMBER 2018 WWW.CHROMATOGRAPHYONLINE.COM
GC
CONNECTIONS
Nicholas H. Snow
Why does a puddle evaporate?
The next time it rains, observe
the puddles of water on the sidewalk or
street after the storm is over. As we know,
the water evaporates at the air tempera-
ture, say 25 oC, yet the boiling point of
water is 100 oC, and the water still evapo-
rates. This is due to the vapor pressure of
water. Water will continue to evaporate
until the air above the puddle becomes
saturated (100% relative humidity). This
relationship can be expressed chemically
by the following equations:
H2O(l)�H2O(g) Kp=PH2O [1]
The vapor pressure of the water is repre-
sented as PH2O, and Kp is the pressure-based
equilibrium constant for the evaporation
process. Figure 1 shows a stylized puddle.
Figure 1A shows some water molecules,
represented by dots, evaporating on a calm
(no wind) day. Figure 1B shows the same
puddle, but with the wind blowing. In which
situation does the water evaporate faster?
On the calm day, there is no wind to carry
the evaporated water molecules away, so
the air above the puddle becomes more
saturated and evaporation slows down.
On the windy day, the wind carries water
molecules away, so the air above the pud-
dle does not approach saturation and the
water evaporates more quickly. In both
cases, the system (surface, puddle and
air above it) is driving toward equilibrium,
saturation of the air above the puddle. A
puddle evaporates faster on a windy day.
Why does rubbing alcohol evaporate
faster than water? Try a simple experi-
ment. Rub a small amount of water on your
arm. As we know, when the water evapo-
rates, energy transfers from your arm to the
water, evaporating the water and making
your arm feel cool. Try again with rubbing
alcohol. The alcohol evaporates faster, and
your arm feels cooler. This difference arises
from differences in the heat of vaporization
and vapor pressure of water and rubbing
alcohol. This is an example of selectivity.
The ability of the water (H2O) or alco-
hol (Alc) to evaporate is governed by
simple chemical equations:
H2O(l) � H2O(g) Kc = [H2O(g)]
Alc(l) � Alc(g) Kc = [Alc(g)] [2]
In this case, the rubbing alcohol mix-
ture is considered a single substance, as it
evaporates as an azeotrope. Rubbing alco-
hol evaporates faster than water, due to
its higher liquid-vapor partition coefficient,
thus its higher vapor pressure.
Taking this further into chromatogra-
phy, all separations are also governed by
a similar phase equilibrium. Equation 3
represents the partitioning of an analyte
(A) from the mobile phase, the phase in
which it enters the column after the injec-
tion, into the stationary phase:
A (mp) ⇔ A (sp) Kc =
[A(sp)][A(mp)] [3]
Kc is the partition coefficient for the pro-
cess of sorption from the mobile phase
into the stationary phase. A(mp) refers to
an analyte dissolved in or moving in the
mobile phase, and A(sp) refers to an ana-
lyte dissolved in or sorbed on a station-
ary phase. A higher Kc indicates stron-
ger analyte attraction to the stationary
phase, leading to longer retention times.
Figure 2 shows this relationship applied
to a column with flowing mobile phase.
Note how this figure looks very much like
the puddle with the wind blowing shown in
Figure 1B. A column in gas chromatography
“The column is the heart of the separation.” Perhaps more accurately, the column is where the chemistry that generates
a separation happens. For chemists and non-chemists alike, the chemistry that drives the utility of a column to solve a
separation problem can be complex and confusing. Selectivity describes the ability of a column to effect a separation. This
installment of “GC Connections” focuses on selectivity, its definition, and its importance for generating separations and
resolution. We will also see how selectivity is the concept that underlies the idea of column polarity. We begin by asking two
simple questions about common observations, then extend these observations into a capillary GC column, and conclude
with an introduction to methods for evaluating the quality, selectivity, and polarity of a stationary phase or column.
Stationary Phase Selectivity: The Chemistry Behind the Separation
Ico
n i
ma
ge
: J
oe
Zu
gc
ic,
Zu
gc
ic P
ho
tog
rap
he
rs,
Inc
.

ADDITIONAL
15%DISCOUNTWITH THIS COUPON
Coupon Code: LCGC 1815 Expires: 12-31-2018
Cornerstone 5x7 PC tip-in_08-2018.indd 1 8/2/18 1:34 PM

NEWEasy-to-Use Website for Small and Medium LaboratoriesEasy-to-Use Website
Low Prices, Every Day
Innovative Brands Not Offered by “Big Box” Dealers
Great Values
General Laboratory Supplies & Equipment, PLUS:
Chromatography Supplies
Life Science Equipment
HPLC Solvent Disposal Systems
CHECK IT OUT!www.CornerstoneScientifi c.com
Cornerstone 5x7 PC tip-in_08-2018.indd 2 8/2/18 1:34 PM

WWW.CHROMATOGRAPHYONLINE.COM NOVEMBER 2018 LCGC NORTH AMERICA VOLUME 36 NUMBER 11 807
behaves in a manner very similar to a pud-
dle on a windy day, with the analyte being
analogous to the puddle, the stationary
phase being analogous to the surface and
the mobile phase being analogous to the
wind. Like the rubbing alcohol versus water
example, if the puddle were a mixture of
two liquids, they would evaporate at differ-
ent rates, based on their vapor pressures.
In the column, if there are two analytes
they will move at different rates, based on
the difference in their partition coefficients
and the resulting vapor pressures above the
surface. For two analytes to be separated
on a column, the difference in partition
coefficient gives rise to selectivity, which
gives rise to the separation.
How is selectivity determined and
where does it come from? Figure 3 shows
the calculation of selectivity from a chro-
matogram, with the relevant equations. It
is simply the ratio of the adjusted retention
times (t’R, the difference between the reten-
tion time, tR and the gas hold up time tM) of
two peaks in the chromatogram. It is also
the ratio of the retention factors (k) and the
partition coefficients (Kc). Detailed descrip-
tions of the basic theory behind these rela-
tionships can be found in most basic text-
books on GC (1–3). Ultimately, selectivity
comes from thermodynamics. From Gen-
eral Chemistry, the Gibbs Equation relates
the partition coefficient to the standard free
energy (4).
6Go= -RT lnKc [4]
If two analytes are present, as seen in Fig-
ure 3, this equation becomes:
∆(∆G°) = –RT In and α = = e K
2
K1
K2
K1
-∆(∆G°)
RT
[5]
A more detailed description of the ther-
modynamic relationships involved in gas
chromatography can be found elsewhere
(5). Selectivity comes from the difference in
free energy change for the partitioning of
the analyte(s) from the mobile phase into
the stationary phase, as seen in Equation 3.
We have now seen the fundamental and
thermodynamic basis of selectivity. Next, we
discuss the impact of selectivity on the sep-
aration and resolution.
How does selectivity impact the sepa-
ration and resolution? The first goal of any
chromatographic method development is
to optimize the resolution. Looking again
at the chromatogram in Figure 3, the res-
olution may be calculated as the difference
between the two retention times divided by
the average of the two peak widths:
Rs=
2(tR(2)–t
R(1))
W1+W
2
[6]
If Rs is greater than 1.5, the peaks are
baseline separated. To understand the role
of selectivity in resolution, the fundamental
principles behind resolution in chromatog-
raphy can be considered using the follow-
ing equation:
Rs=
k
1+k
α-1α
√N4
[7]
Resolution is obtained from three basic
principles:
• retention factor (k), which is a measure
of how long the analyte is in the col-
umn. Too small k (< 2), and there is
not enough contact with the stationary
phase for the most effective chromatog-
raphy. Too large k (> 10), and there is a
diminishing return with longer time.
• theoretical plates (N), the measure of
column efficiency. The more theoretical
plates, the better the resolution.
• selectivity (α), the separating power of
the stationary phase based on differ-
ences in the strength of intermolecu-
lar interactions between the stationary
phase and analyte molecules.
Figure 4 shows two chromatograms with
equal selectivity. In Figure 4A, an example
from HPLC, the column has 18,285 theoret-
ical plates and in Figure 4B, in an example
from capillary GC, the column has 120,000
theoretical plates. With k being equal, a
dramatic effect on resolution is seen. Note
that, while the peak maxima are equally
spaced in the two chromatograms, the
peaks are broader in Figure 4A, reducing
the resolution. In classical packed column
GC and in HPLC, with lower N, adjusting
the selectivity is critical to obtaining nearly
all separations. In today’s capillary GC,
selectivity, with high N, is less important
but still must be considered.
The lower the separation efficiency (low
N), the higher the selectivity needed to
achieve separation. In most applications,
FIGURE 1: A) Water evaporating from a puddle in still air. Evaporated water molecules are represented as dots. B) Water evaporating from a puddle with blowing wind. In still air, the water stays above the puddle. In wind, the water is carried away.
FIGURE 2: Analytes partitioning into the stationary phase in a capillary column. Below the normal boiling point most of the molecules (represented here as dots) will partition into the stationary phase. The few dots in the mobile phase are moved along the col-umn by the fl owing mobile phase.
(a) (b)
808 LCGC NORTH AMERICA VOLUME 36 NUMBER 11 NOVEMBER 2018 WWW.CHROMATOGRAPHYONLINE.COM
selectivity has a critical impact on sep-
aration and resolution. As columns and
instruments become more efficient (more
theoretical plates, N), the need for high
selectivity lessens. In Figure 4A, a selectiv-
ity of 1.04, which could be a nearly 1 min
difference in retention time in a 20 min sep-
aration, is not sufficient to fully resolve the
peaks. If the selectivity calculated by the
equations shown in Figure 3 is one (1.00),
then the two analytes are not separated
at all and cannot be separated no matter
how efficient the column and instrument.
Fortunately, this is not often the case. Hav-
ing seen the basics of the thermodynamic
background of selectivity, we now turn to
methods for evaluating the selectivity of
stationary phases, and to a better under-
standing of the term “polar,” which is often
used to describe stationary phases in GC.
Most of the development of these meth-
ods occurred in the early days of GC, when
packed columns, with much lower efficiency
than capillary columns, were predominant.
What does “polar” really mean in GC?
Stationary phases are often described using
terms such as “polar”, “non-polar”, “mod-
erately polar” and the like. These terms
are often used very broadly, and can easily
generate confusion and misunderstanding.
The first problem with descriptions such
as “polar” is that they require context. As
an example of context, think about other
simple terms: “hot” and “cold”. In the
environs of New York City, in the winter, a
day with a high temperature of 65 oF would
be considered unusually hot, while in sum-
mer, unusually cold. When describing the
weather, the meaning of “hot” and “cold”
depends greatly on the environment. The
meaning of “polarity” requires similar con-
text. In describing columns, any discussion
of “polarity” must be based on specific
intermolecular interactions between the
stationary phase and the analytes. The
strength of these interactions determines
the free energy required for the analytes
to partition into the stationary phase, and
therefore determines the selectivity of the
stationary phase and, along with the col-
umn dimensions, ultimately the separat-
ing ability of the column.
Over the years, numerous tests have
been developed to evaluate the intermo-
lecular interactions that occur in gas chro-
matographic columns. These interactions
include the same ones we learned about
in school: dipole-dipole, dipole-induced
dipole, van der Waal forces, acid-base,
electrostatic interactions, and hydrogen
bonding. These classical studies generally
involve injecting test mixtures containing
a mix of compounds, each selected to
probe a specific interaction. These tests,
and many other aspects of column evalu-
ation, are discussed in great detail in the
textbook by Barry and Grob (6).
The Grob test mix, developed in the late
1970s is the most commonly used mixture
for testing the interactions and quality of
FIGURE 3: Determination of selectivity from chromatogram with defi ning equations. Chromatogram adapted from ChromAcademy (www.chromacademy.com, accessed September 2018).
TABLE II: List of test probes and interactions for the McReynolds test mixture
Test Probe Interaction(s)
Benzene Pi-pi, aromatic and olefi nic hydrocarbons
Ethanol or n-butanol Hydrogen bonding for alcohols, nitriles
2-butanone or 2-pentanone Proton acceptor – ketones, ethers, aldehydes, esters
Nitromethane or nitropropane Dipole-dipole interactions
Pyridine Strong proton acceptor – acid character of column
TABLE I: Components of the Grob Test Mixture and their column performance andchemistry measures.
Component Interaction(s)/Performance Tested
Decane, undecane Column effi ciency
Fatty acid methyl esters C10
, C11
, C12
Column effi ciency
1-octanol Hydrogen bonding, presence of silanol groups
Nonanal Aldehyde adsorption; non-hydrogen bonding
2,6-dimethyl phenol Acid-base interactions
2,6-dimethyl aniline Acid-base interactions
2-ethyl hexanoic acid Irreversible adsorption
Dicyclohexyl amine Irreversible adsorption

WWW.CHROMATOGRAPHYONLINE.COM NOVEMBER 2018 LCGC NORTH AMERICA VOLUME 36 NUMBER 11 809
capillary columns (7,8). Every time you purchase a column, you are
provided with a column test mixture chromatogram that either uses
the Grob test mix, or is based on the principles described in the
original papers. Figure 5 shows a typical chromatogram of a column
test mix run on a commercially available column, with the test mix
components identified. There are several quality tests resulting from
this analysis, including reactivity and sensitivity to several intermo-
lecular interactions, column efficiency, and overall separating power.
The most important selectivity calculation is the spacing of the fatty
acid methyl ester peaks. This spacing must be even as each meth-
ylene unit (-CH2-) is added, indicating proper selectivity. The resolu-
tion of adjacent peaks, which also results from selectivity is tested, as
is the retention time and peak shape of each component, which is
determined by the specific intermolecular interactions between that
component and the column wall or stationary phase.
Table I lists the Grob test mix components with the specific
intermolecular interactions they probe. Comparing Table I to the
chromatogram shown in Figure 5, basic performance tests such
as the spacing and shape of the hydrocarbon and fatty acid peaks
indicate a properly installed generally well-performing column.
The acceptable shapes of the alcohol, phenol, aldehyde, and
aniline indicate a column that should perform well for weaker
acids and bases. The very poor shapes of the hexanoic acid and
dicyclohexylamine indicate that this column is likely to adsorb
stronger acids and bases. The Grob test mix thus provides an
excellent snapshot for the quality and performance of a column.
Most column manufacturers use their own variation of the Grob
test mix to demonstrate column quality and performance.
In order to discuss most measures of intermolecular inter-
actions with proper context, retention time data must be cor-
rected to account for differences in column dimensions, includ-
ing length, inside diameter, and stationary phase film thickness.
The classical means for this is calculating the Kovats Retention
Index for each analyte using Equation 8 (9):
I =100 +100x
log (t’R)u – log (t’
R)x
log (t’R)x+1
– log (t’R)x
[8]
The subscript u refers to the analyte. The subscript x refers to
the number of carbon atoms in the normal alkane eluting immedi-
ately prior to the analyte. The subscript x+1 refers to the number
of carbon atoms in the normal alkane eluting immediately follow-
ing the analyte. For example, an analyte eluting between hexane
(C6) and heptane (C7) might have a Kovats Retention Index of 650.
An example calculation is shown in Figure 6. In theory, the Kovats
Retention Index is linearly related to the free energy change for
the sorption process into the stationary phase, as described in
Equation 5, and it accounts for differences in the column dimen-
sions. The Kovats Retention Index of an analyte is a constant for
a given stationary phase and temperature and is independent of
column length, internal diameter and film thickness.
In the 1960s, based on Kovats Retention Indexes, two systems
for assessing stationary phase polarity, or really the strength of
a stationary phase for separating various classes of compounds
were developed by Rorhschneider and McReynolds (10,11).
These are used in column evaluation and are most commonly
termed McReynolds Constants. The experiment is simple. A test
FIGURE 4: Comparison of chromatograms with α = 1.04, con-stant k and differing N. Adapted from ChromAcademy (www.chromacademy.com, accessed September 2018).
Rs = 1.3, α = 1.04, N = 18285 (Peak*)
Rs = 3.0, α = 1.04,
N = 120,000 (Peak*)
α = 1.04
α = 1.04
(b)
(a)
� � �������������� ���������
������������������ ������� ���
� � ���������������������������
� ��������!��� ������∀�����
� � � ������#�����������������
��������������
����������������
����������������
�
�

810 LCGC NORTH AMERICA VOLUME 36 NUMBER 11 NOVEMBER 2018 WWW.CHROMATOGRAPHYONLINE.COM
mixture is injected under isothermal con-
ditions, and the Kovats Retention Index of
each analyte is determined and compared
to the retention index of that test analyte
on a standard non-polar stationary phase.
The McReynolds constant for that analyte
on that column at the given temperature
is the difference between the measured
retention index and the standard reten-
tion index. A list of the five most com-
mon test probes with the interactions
they were proposed to probe is given in
Table II and some constants for common
stationary phases are given in Table III
(12,13). Table III also includes Mondello
polarity numbers, described below.
McReynolds constants can be used to
estimate the ability of a stationary phase
to separate analytes of various compound
classes. For example, a high McReynolds
constant for benzene indicates a stationary
phase with strong pi-pi interactions and
ability to separate aromatic analytes. If the
McReynolds constants are high for all of the
test probes, the stationary phase may be
accurately described as “polar”. Note that
a column may have a high constant for one
test probe, but a lower constant for another,
indicating different degrees of “polarity”
depending on the analyte. McReynolds
constants provide the necessary context
for describing whether a stationary phase
is “polar”. In general, as the McReynolds
constants increase, the stationary phase
may be described as more polar.
This discussion leads to the final ques-
tion: How polar is my column? This
topic has seen renewed interest with
the advent of ionic liquids as station-
ary phases for capillary GC in the mid-
2000s (14,15). An ionic liquid is a molten
organic salt that is in the liquid phase at
or near room temperature. As station-
ary phases, ionic liquids are considered
highly polar, plus they have low vapor
pressure and do not decompose at the
temperatures normally employed in GC.
They seem to extend the polarity range
of stationary phases available in capillary
GC. An interesting difference between
ionic liquid stationary phases and most
traditional capillary GC stationary phases
is that the ionic liquids are liquid salts,
whereas the traditional stationary phases
are liquid polymers. At a molecular level,
the actual partitioning process may be
different for ionic liquid columns than for
traditional polymeric columns. This pos-
sibility merits further research.
In 2011, while evaluating the new ionic
liquid stationary phases, Mondello devel-
FIGURE 5: Chromatogram of a column test mixture. 1) decane, 2) 1-octanol, 3) undec-ane, 4) 2,6-dimethyl phenol, 5) nonanal, 6) 2-ethyl hexanoic acid, 7) 2,6-dimethyl aniline, 8) methyl decanoate, 9) methyl undecanoate, 10) dicyclohexylamine, 11) methyl laurate. column: 5% phenyl polydimenthyl siloxane, 30 m x 0.25 mm x 0.25 μm. Temperature Program: 70 oC/1 min, 5 oC/min to 250 oC.
1 23
5
6
12 14
Retention Time (min)
18 20 22 2416108
7
8 9
10
11
4
TABLE III: McReynolds constants and polarity numbers of selected stationary phases. Data from references 12, 13 and 16.
Stationary Phase Name X’ Y’ Z’ U’ S’ TotalPolarity Number
Squalane 0 0 0 0 0 0 0
Polydimethyl siloxane (DB-1, SPB-1, ZB-1, Rtx-1, etc.) 16 55 44 65 42 222 5
5% Phenyl polydimethyl siloxane (DB-5, SPB-5, ZB-5, Rtx-5, etc.) 33 72 66 99 67 337 8
50% phenyl polydimethyl siloxane (DB-17, SPB-50, Rtx-50, ZB-50, etc.) 119 158 162 243 202 884 20
Polyethylene glycol (WAX) 322 536 368 572 510 2,308 52
1,12-di(tripropylphosphonium) dodecane bis(trifluoro-
methanesulfonyl)amide (SLB-IL-59)338 505 549 649 583 2,624 59
1,9-di(3-vinylimidazolium)nonane bis(trifl uoromethanesulfonyl)imide (SLB-IL-100) 602 853 884 1017 1081 4,437 100
X’ = benzene
Y’ = n-butanol
Z’ = 2-pentanone
U’ = nitropropane
S’ = pyridine

WWW.CHROMATOGRAPHYONLINE.COM NOVEMBER 2018 LCGC NORTH AMERICA VOLUME 36 NUMBER 11 811
oped a straightforward overall column
polarity scale, based on McReynolds
constants (16). These values for some sta-
tionary phases are included in Table III. To
determine the polarity number, the five
McReynolds constants are totaled, and
then the ratio of this total to the total for a
highly polar ionic liquid column (SLB-IL100)
is expressed with the SLB-IL100 column
having the value 100. Squalane is the
standard non-polar stationary phase for
McReynolds constant determination (all
McReynolds constants and polarity num-
ber are zero), but in practice, it is rarely
used with capillary columns. The classical
non-polar phases, polydimethyl siloxane
and 5% phenyl polydimethyl siloxane
have very low polarity numbers, so they
are accurately described as non-polar.
50% phenyl polydimethyl siloxane sta-
tionary phase, long considered moder-
ately polar shows a polarity number of
20, while polyethylene glycol phase, tradi-
tionally considered among the most polar
capillary column stationary phases, only
reaches a polarity number of 52.
Broad descriptions of polarity and
polarity numbers are useful but with cau-
tion. In Table III, the n-butanol McReyn-
olds constant is higher for polyethylene
glycol then for SLB-IL-59, yet the over-
all polarity number is lower. SLB-IL-59 is
an overall more polar stationary phase,
yet polyethylene glycol is likely to more
strongly retain polar alcohols. Results such
as this and the advent of ionic liquid col-
umns are leading to new thinking about
column polarity and how it is described.
Conclusions
The ability of a stationary phase to per-
form a separation is based on selectivity,
the difference in the strength of intermo-
lecular interaction between each analyte
and the stationary phase. Selectivity derives
from the partitioning process for the ana-
lytes between the mobile and stationary
phases and it plays a key role in the abil-
ity to achieve desired resolution. Column
quality and polarity are also determined by
the intermolecular interactions that occur
between compound classes of interest and
the stationary phase. Methods including the
Grob test mix, McReynolds constants and
polarity numbers provide the tools to ana-
lyze these interactions and to better under-
stand the chemistry behind the separation.
References
(1) H.M. McNair and J.M. Miller, Basic Gas Chromatography, (John Wiley and Sons, New York, 2nd ed., 2009).
(2) C.M. Poole, Ed., Gas Chromatography (Elsevier, Amsterdam, 2012).
(3) R.L. Grob, Ed., Modern Practice of Gas Chromatography (John Wiley and Sons, New York, 4th ed., 2004).
(4) N. Tro, Chemistry: A Molecular Approach, (Pearson, New York, 4th Ed., 2016) Chapter 18.
(5) N.H. Snow, J. Chem. Educ. 73(7), 592–597 (1996).
(6) E.F. Barry and R.L. Grob, Columns for Gas Chromatography Performance and Selection (John Wiley and Sons, New York, 2007).
(7) K. Grob, Jr., G. Grob, and K.J. Grob, Chro-matogr. 156, 1–20 (1978).
(8) K. Grob, Jr., G. Grob, and K.J. Grob, Chro-matogr. 219, 13–20 (1981).
(9) E. Kovats, Helv. Chim. Acta 41, 1915–1932 (1958).
(10) L. Rohrschneider, J. Chromatogr. 22, 6–22 (1966).
(11) W.O. McReynolds, J. Chromatogr. Sci. 8, 685–691 (1970).
(12) “Technical Bulletin 880: The Retention Index System in Gas Chromatography: McReynolds Constants”, Sigma-Aldrich, https://www.sigmaaldrich.com/Graphics/Supelco/objects/7800/7741.pdf (Accessed September, 2018).
(13) E.F. Barry and R.L. Grob, Columns for Gas Chromatography Performance and Selection (John Wiley and Sons, New York, 2007), pp. 32–44.
(14) C. Yao and J.L. Anderson, J. Chromatogr. A 1216 1658–1712 (2009).
(15) “Introduction to Ionic Liquid Columns” https://www.sigmaaldrich.com/content/dam/sigma-aldrich/docs/Supelco/Posters/1/ionic_liquid_gc_columns.pdf (Accessed September, 2018).
(16) C. Ragonese, D. Sciarrone, P.Q. Tranchida, P. Dugo, G. Dugo, and L. Mondello, Anal. Chem. 83 7947–7954 (2011).
FIGURE 6: Chromatogram and calculation of Kovats retention index. Adapted from ChromAcademy (www.chromacademy.com, accessed September 2018).
Nicholas H. Snowis the Founding Endowed Professor in the Depart-ment of Chemistry and Biochemistry at Seton Hall
University. He is also the university’s Director of Research and Adjunct Pro-fessor of Medical Science. During his 30 years as a chromatographer, he has published more than 60 refereed arti-cles and book chapters and has given more than 200 presentations and short courses. He is interested in the funda-mentals and applications of separation science, especially gas chromatography, sampling, and sample preparation for chemical analysis. His research group is very active, with ongoing projects using GC, GC–MS, two-dimensional GC, and extraction methods including head-space, liquid–liquid extraction, and sol-id-phase microextraction.
John V. Hinshaw“GC Connections” editor John V. Hinshaw is a Senior Scientist at Serveron Cor-poration in Beaver ton,
Oregon, and a member of LCGC’s editorial advisory board. Direct corre-spondence about this column to the author via e-mail: [email protected]
ABOUT THE COLUMN EDITOR
ABOUT THE AUTHOR

Experience the New Proficiency Testing PortalEnsuring trust and confidence through accurate results every time!
After serving thousands of customers and their 400,000 PT samples over 20 years, we are redefining what PT can do for you.
Discover the next generation of proficiency testing
User friendly data entry * Graphical Reports * Trend data with "MyStats" Over 20 new and improved features to enhance your data entry experience!
We provide you with the essential performance data and premium grade testing components that help you build a valuable quality control asset.
Powerful PT web service provided by QuoData QuoData contributes its long-term experience in the field of analytical quality assurance, PT and web services to make the new portal stand out.
Get more out of your proficiency testing with our new PT portal.
To connect to the new portal: MilliporeSigma-pt.com
Explore more at SigmaAldrich.com/PT
Contact: [email protected]
The life science business of Merck KGaA, Darmstadt, Germany operates as MilliporeSigma in the U.S. and Canada.
© 2018 Merck KGaA, Darmstadt, Germany and/or its affiliates. All Rights Reserved. MilliporeSigma and the vibrant M are trademarks of Merck KGaA, Darmstadt, Germany or its affiliates. All other trademarks are the property of their respective owners. Detailed information on trademarks is available via publicly accessible resources.
Lit. No. MS_AD2982EN Ver. 1.0 2018-12840 10/2018

Lit. No. MS_AD2967EN 2018-17066 10/2018
The life science business of Merck KGaA, Darmstadt, Germany operates as MilliporeSigma in the U.S. and Canada.
© 2018 Merck KGaA, Darmstadt, Germany and/or its affiliates. All Rights Reserved. MilliporeSigma and the vibrant M are trademarks of Merck KGaA, Darmstadt, Germany or its affiliates. All other trademarks are the property of their respective owners. Detailed informationon trademarks is available via publicly accessible resources.
Brighter
StandardsResults are only as accurate as your reference
We manufacture and fully certify our CRMs to the highest industry standards:
ł Four production sites doubly accredited toISO 17034/Guide 34 and ISO/IEC 17025
ł��8VH�RI�YDOLGDWHG�RU�TXDOL¿HG�WHVWLQJ�PHWKRGV
ł��&HUWL¿FDWH�RI�$QDO\VLV��LQFOXGLQJ�XQFHUWDLQWLHV�and traceability to meet regulatory requirements
ł Real-time assessment of stabilityand setting of expiry datesand storage conditionsbasHG�RQ�VFLHQWL¿F�GDWD
Because results are onlyas accurate as yourUHIHUHQFH��WUXVW�XV�ZLWKyour quality and accuracy.
For more informationSigmaAldrich.com/standards

Ico
n I
ma
ge
: (C
olu
mn
s) J
oe
Zu
gc
ic/Z
ug
cic
Ph
oto
gra
ph
ers
, In
c.
814 LCGC NORTH AMERICA VOLUME 36 NUMBER 11 NOVEMBER 2018 WWW.CHROMATOGRAPHYONLINE.COM
FOCUS
ON
BIOPHARMACEUTICAL
ANALYSIS
Anurag S. Rathore, Ira S. Krull, and Srishti Joshi
With increasing importance being
attached to structural attributes of
biotherapeutics and subsequent biosimilars,
the analytical techniques used for charac-
terizing these attributes have also evolved.
There is an ever-increasing interest in attain-
ing a higher structural resolution of these
products (1,2). In view of the complexity
exhibited by biopharmaceutical products, it
has become the norm to use a multitude of
orthogonal, high-resolution tools for charac-
terization. These tools are carefully chosen
such that the platform covers all the critical
structural, physicochemical, immunochemi-
cal, and biologically relevant characteristics of
the molecule (3–5). Attributes to be covered
in biotherapeutic characterization, as per
World Health Organization (WHO) guide-
lines to evaluate quality, safety and efficacy
(2), are listed in Table I. This review focuses
on the utility of the traditional characteriza-
tion tools and covers the new generation of
analytical hardware that is increasingly being
used orthogonally to the traditional toolbox.
Tools for Analytical
Characterization
Cost-effectiveness and relative ease of
use have made Poly-Acrylamide Gel
Electrophoresis (PAGE) one of the most
commonly used techniques for protein
analysis. In the case of biotherapeutic
characterization, PAGE is typically used to
estimate the size and isoelectric point of
the molecule. It serves both as a detecting
as well as resolving technique, and relies
on the property of charged molecules to
migrate in an electric field. Proteins are
resolved on a polyacrylamide matrix, either
in their native form (non-denaturing PAGE)
or in reduced form (SDS-PAGE). A combi-
nation of the two can also be employed
for resolving complex molecules such as
monoclonal antibodies (mAbs), where sep-
aration from other proteins is attained in a
non-denaturing first dimension followed by
a denaturing second dimension resolution
(2D-PAGE). Iso-Electric Focusing (IEF), which
resolves molecules based on their iso-elec-
tric point is also a commonly used platform
for 2D-PAGE and provides higher resolution,
either in the first or the second dimension
when compared with 2-D separation based
only on size. Using Trastuzumab as an
example, 2D-PAGE has also been shown to
be a quick and easy method for qualitative
evaluation of charge heterogeneity, stability
and post-translational modifications. (6).
An interesting recent introduction in the 2D
platform has been of 2D-Difference Gel Elec-
trophoresis (2D- DIGE). Proteins are directly
labelled with fluorescent dyes (CyDyes),
pooled and separated on a 2D-PAGE. The
dye binds covalently to ε-amino groups
of lysine residues in proteins, allowing for
accurate quantification of spots. The gels
are scanned using an instrument capable
of detecting different CyDye independently.
2D-DIGE can further be coupled with mass
spectrometry for protein identification (7).
A major advantage of PAGE is its versa-
tility. Gel matrix can be easily modified to
achieve a specific resolution. Gradient gels
(pH gradient) are routinely used to ascer-
tain the isoelectric point. Moreover, PAGE
can be coupled with Mass Spectrometry
for identification on specific gel bands (first
dimension) or spots (second dimension) (8, 9).
High resolution, varied choice of phase
and robustness have made High Performace
Liquid Chromatography (HPLC) a corner-
stone of biopharmaceutical analysis. It is
ubiquitously used for analysis of proteins,
nucleic acids, or small molecules in com-
plex mixtures. Typical separation is achieved
by using a liquid mobile phase and a solid
stationary phase. Diversity in solid phase
chemistry and choice of mobile phase
allows the analyst to fine-tune the type of
interactions allowed between the analyte
and the stationary phase. This yields unpar-
alleled selectivity between a biotherapeutic
and related variants and impurities, which
otherwise may have near identical physi-
cochemical properties. Some of the com-
monly used modalities of HPLC include:
• Ion Exchange (IEX) Chromatography
is used to separate molecules based
on their total charge. It enables the
separation of molecules based on
their charge. The strength of binding
is determined by the affinity of the
In the first part of this series, we discussed the various quality attributes that are pertinent to a biotherapeutic. In this
issue, we will present the current and evolving practices that are being used for analysis of these attributes.
Analytical Characterization of Biotherapeutic Products Part II: The Analytical Toolbox

FOCUSED ON
PRODUCTIVITY
Parker offers a comprehensive range of gas generation solutions. Parker gas generators
deliver convenience, stability, reliability, performance and cost benefits enabling you to
focus on science. Unlike cylinders, which can run out mid-process, gas generators are
able to produce gas continuously with very little maintenance required.
labgasgenerators.com
800.343.4048
PERFORMANCE
SAFETY
EFFICIENCY
PROFITABILITY

816 LCGC NORTH AMERICA VOLUME 36 NUMBER 11 NOVEMBER 2018 WWW.CHROMATOGRAPHYONLINE.COM
proteins to the “Ion-Exchanger” linked
to the resin (stationary phase). Cat-
ionic exchangers possessing negative
charge bind positively charged entities,
whereas anionic exchangers bind neg-
atively charged entities. Furthermore,
ion-exchangers can be weak or strong
depending upon the range of pH within
which they can sustain their charge. This
influences the range and type (strong/
weak) of binding that can be achieved
(10). Elution is typically achieved by either
altering the pH of the mobile phase or
increasing the ionic concentration of the
mobile phase (salt gradient IEX). A com-
monly used application involves sep-
aration of charged variants, which are
similar in size but differ in charge, using
cation exchange HPLC (11).
• Size Exclusion Chromatography (SEC)
enables separation of molecules based
on their size. The stationary phase con-
sists of a gel containing beads of a
specific pore distribution. The choice
of pore distribution allows the user to
achieve separation of species in the
desired range of size. In the case of
biotherapeutics, a popular application
is the resolution of size based hetero-
geneities, especially aggregates (12).
Co-eluting host cell proteins can also
be resolved using SEC (9).
• Hydrophobic Interaction Chroma-
tography (HIC) separates molecules
based on their hydrophobicity and
their charge. It is a relatively gentle
separation technique as the chosen
conditions are minimally denaturing
and as a result do not significantly
affect the biological activity of the
protein. Traditionally used as a pol-
ishing step in monoclonal antibody
purification, it has also been used
to characterize drug distribution in
antibody-drug conjugates (ADCs) by
exploiting the hydrophobicity of the
conjugated small molecule (13).
• Reverse Phase (RP) Chromatography
exploits reversible adsorption of bio-
molecules based on their hydrophobic-
ity under conditions where the stationary
TTABLE I: ,,, Techniques used for analytical characterization as mentioned in WHO and ICH Q6b guidelines. CD - Circular Dichroism,-DSC - Dynamic Light Scattering, FTIR - Fourier Transform Infra-Red Spectrometry, LC - Liquid Chromatography, MS - Mass Spec--trometry, NMR - Nuclear Magnetic Resonance, Cryo-EM - Cryo Electron Microscopy, IEX - Ion Exchange Chromatography, CE - Cap-
illary Electrophoresis, IEF - Isoelectric Focusing, RP-HPLC - Reverse Phase High Performance Liquid Chromatography, SEC - Size Exclusion Chromatography, UV - Ultraviolet, MALS - Multi Angle Light Scattering, FFF - Field Flow Fractionation, AUC - Analytical
----Ultracentrifugation, SDS-PAGE - Sodium Dodecyl Sulfate Poly Acrylamide Gel Electrophoresis, TEM - Transmission Electron Micros-copy, ELISA- Enzyme Linked Immunosorbent Assay, SPR - Surface Plasmon Resonance, ITC - Isothermal Titration Calorimetry, BLI --- Bio-Layer Interferometry.
Type Attributes
WHO (2013) ICH Q6b (1999) OTHERS
Phys-iochemical character-ization
Primary structure
Amino-acid sequence, Molecular weight, extinc-tion-coeffi cient, disulfi de linkage, N-terminal
methionine, signal/leader sequence, N-/C-termi-nal modifi cations, C-terminal processing, N-ter-minal pyroglutamate, deamidation, oxidation, isomerization, fragmentation, disulfi de bond
mismatch, N-/O-linked oligosaccharide, glyco-sylation, aggregation, C-terminal lysine presence
HPLC, MS (ESI, MAL-DI-TOF), MS/MS
HPLC (SEC, RP,IEX, Affi nity), MS,SEC, SDS-PAGE,
IEF, UV-VISspectroscopy,
Western Blot, CE
MALS,DSC
Glycan structure
Glycan content, glycan structure, glycan pattern,glycosylation site, glycan charge pattern
HPLC, Electropho-resis, MS, MS/MS, UV-FLD, CE, IEF
CE-MS
Higher Order Structure
secondary structure, tertiary struc-ture, quarternary structure
X-ray crystallography, NMR, CD, FTIR, Fluo-
rescence, DSC, protonnuclear magnetic
resonance (IH-NMR), Hydrogen-Deuteri-um exchange MS
CD, NMR
Cryo-EM,Raman
spectros-copy
Biologicalcharacter-ization
Effector function, complement bind-ing and activation, potency
ADCC, CDC, Apopto-sis assay, Fc-y receptor binding, Neonatal Fc
receptor binding
Animal-basedbiological assays, cell culture-basedassays, biochem-
ical assays
SPR, BLI,ITC
Immu-nochemicalcharacter-ization
Product related
Affi nity, avidity, immunoreactivity, epitope char-acterization, glycosylation/ PEGylation profi le
Cell-based assaysBinding as-
say, westernblot, ELISA
SPR, BLI,ITC
Impurities, contam-inants
Fragmentation, amino acid modifi cation, Higher molecular weight species, particles
HPLC, Electrophore-sis, MS, CE, SEC, FFF, AUC, Fluorescence,
Light scattering
HPLC, SEC-HPLC, SDS-PAGE, peptide mapping,
CE, MS, CD
MALS, SEC, MFI

WWW.CHROMATOGRAPHYONLINE.COM NOVEMBER 2018 LCGC NORTH AMERICA VOLUME 36 NUMBER 11 817
phase is more hydrophobic than the
mobile phase. It is quite similar to HIC
in principle, however, the RPC medium
is much more hydrophobic than in HIC
and elution is achieved by the use of
non-polar, organic solvents. This makes
it a very desirable technique for cou-
pling with MS for peptide mapping and
other comparability studies. Coupled
with mass spectrometry, the reverse
phase has been extensively used in pri-
mary structure characterization of bio-
therapeutics as well as in comparability
studies of biosimilars (14).
High Performance Capillary Electropho-
resis (CE) is another technique increasingly
being applied in conjunction with MS for
charge variant characterization, isoelectric
focusing and biosimilarity assessment. Mol-
ecules are separated across a fine capillary
with the internal diameter as small as 50 μM
via application of high voltage (~30 kV). This
miniaturized format requires minimal sample
with flow rates in the range of nL/min, mak-
ing it a cost-effective technique. CE coupled
with nano-ESI-MS has been shown to be
particularly useful for N-Glycan analysis of
monoclonal antibodies as well as for detec-
tion of charge variants (15). The availability
of various CE modes such as capillary zone
electrophoresis, capillary gel electrophore-
sis, capillary isoelectric focusing and micel-
lar electrokinetic chromatography allows
for characterization of different attributes
such as intact mass, reduced mass, charge
variants, as well as glycosylation pattern. CE
coupled with MS is increasingly being used
as a complementary platform to traditional
LC-MS for biotherapeutic characterization
(16). Innovative integration of CE with MS,
such as in ZipChip has reduced the analysis
time to under three minutes and bypassed
issues of individual component integra-
tion and capillary damage due to handling.
Demonstrated applications include glyco-
sylation profiling of mAb directly from cell
culture with sample volume requirement of
under fifty microliters (17). The technique
shows much promise in monitoring batch to
batch variation in manufacturing as well as in
biocomparability exercise.
X-ray crystallography is considered the
gold standard for protein structural stud-
ies. It works on the principle of X-ray dif-
fraction. The angle and the intensity of the
diffracted beam from a crystal are used to
construct a 3-dimensional image of the
molecular structure. However, applica-
tion of this technique for characterization
and biocomparability is challenging as the
protein of interest has to be purified and
crystallized, which may not be possible for
biotherapeutics due to the presence of
inherent heterogeneity in the form of sev-
eral post-translational modifications (PTMs).
Although the data obtained is a direct mea-
surement of the crystal structure, the tech-
nique itself is too cumbersome to be used
as a routine analytical technique for biosim-
ilar characterization and comparability (18).
Nuclear Magnetic Resonance (NMR)
exploits the magnetic properties of specific

818 LCGC NORTH AMERICA VOLUME 36 NUMBER 11 NOVEMBER 2018 WWW.CHROMATOGRAPHYONLINE.COM
atomic nuclei. Although a gold standard for
protein structural studies, its routine applica-
tion in the biotherapeutic industry has been
limited due to several factors, including the
large size of protein biopharmaceuticals, the
relatively low sensitivity of the NMR signals,
and the low natural abundance of active
nuclei. However, in instances where biother-
apeutics of small molecular size are being
characterized, NMR might be utilized to gain
in-depth HOS information (18).
It should be noted that although both
X-ray crystallography and NMR provide
structural details at a near-atomic level, the
techniques differ in their principle, informa-
tion and bottlenecks. X-ray crystallography
requires the formation of the uniform crystal
lattice and utilizes very high energy X-rays
for deflection by the surrounding electron
clouds, NMR is based on the absorption of
electromagnetic radiation in the radio-fre-
quency (RF) range. In NMR, proteins are
analysed in solution and the final image is
a compilation of a number of low energy
states of the protein in different orientations
as compared to single instance images of
X-ray crystallography. Both the techniques
require high concentration, homogenous
sample preparations. With respect to pro-
tein size, NMR is more limiting. Proteins with
a size larger than 40 kDa exhibit a slower
molecular tumbling in solution leading to
spectral overlap and peak broadening. In
terms of information obtained, NMR can
unravel information on structural dynamics
and flexibility more readily than x-ray crys-
tallography which requires time-resolved
experiments to capture structural changes
due to biochemical reactions (19, 20)
Transmission Electron Microscopy (TEM)
is a microscopy technique in which a beam
of electrons is transmitted through a spec-
imen to form an image. Due to the much
smaller wavelength of electrons as com-
pared to light, the resolution of the image is
greater by orders of magnitude with details
up to atomic level, and hence TEM finds
use in the characterization of biotherapeu-
tic aggregates (21). Recent developments
in achieving greater resolution, especially
in Cryo-TEM, have enabled researchers to
observe protein complexes such as mAbs
in their native formulation (without crys-
tallization) (22). The technique is currently
underutilized in the field of biotherapeutics
but has significant potential to grow.
Circular Dichroism (CD) Spectroscopy
is based on the difference observed in the
absorption of left and right-handed circularly
polarized light of a molecule in the presence
of light absorbing chiral groups. This prop-
erty of biomolecules is frequently utilized in
the examination of the secondary structure
of the proteins and is employed for assessing
HOS comparability. Using thermal denatur-
ation, information about molecule stability
as well as folding and unfolding mechanisms
can be elucidated. An application of CD
in the aggregate characterization of mAbs
has also been demonstrated (23, 24).
Fourier Transform Infrared Spectros-
copy (FTIR) is a spectroscopic technique
that monitors the characteristic infrared
absorption of molecules and translates it
into structural information. Similar to CD, it
gives structural information about the sec-
ondary structure of the protein, mainly the
alpha helices and beta sheet. It serves as an
orthogonal technique to CD in characteriza-
tion and biocomparability studies (25).
Although both CD and FTIR can provide
information with regards to components
of the secondary structure of a molecule,
it is only through higher resolution visual-
ization techniques such as CryoTEM, X-ray
crystallography and NMR that the spe-
cific arrangement of these components in
space can be unravelled.
Dynamic Light Scattering (DLS) is com-
monly used to determine the size distribu-
TTABLE II: - Publications per technique since 2010 for biotherapeutics (Google Schol-,ar) LC - Liquid Chromatography, CE - Capillary Electrophoresis, TOF - Time of fl ight,-Q-TOF- Quadruple-time of fl ight, MALDI - Matrix Assisted Laser Desorption ioniza-
tion, TRIPLE-QUAD - Triple Quadrupole, CD - Circular Dichroism, DSC - Dynamic Light Scattering, FTIR - Fourier Transform Infra-Red Spectrometry, NMR - Nuclear Magnetic
Resonance, HDX-MS - Hydrogen/Deuterium exchange-Mass spectrometry, CRYO-TEM - F - Cryo-Transmission Electron Microscopy, TEM - Transmission Electron Microscopy, FFF-- Field Flow Fractionation, SPR - Surface Plasmon Resonance, ITC - Isothermal TitrationCalorimetry. The publication data were generated using Google Scholar for papersfrom 2010-2018 (excluding citations and patents). Search word combination used was
“““““““““““““““ ””””””””””””“technique name” “biopharmaceutical” and “technique name” “biopharmaceutical”and “monoclonal antibody”.
Tool Category
2010-2017 Biopharmaceuticals Monoclonal antibodies
HPLC 7440 1600
CE 1880 1040
HPCE 109 44
ESI-TOF 2140 703
Q-TOF 559 441
MALDI-TOF 2630 835
ORBITRAP 882 603
TRIPLE-QUAD 39 251
HDX-MS 406 665
CD 1750 781
DSC 1670 847
FTIR 1720 362
DLS 4330 1080
NMR 3550 796
CRYO-TEM 144 24
TEM 3760 650
FFF 550 307
SPR 2060 997
ITC 505 156

WWW.CHROMATOGRAPHYONLINE.COM NOVEMBER 2018 LCGC NORTH AMERICA VOLUME 36 NUMBER 11 819
tion profile of small particles in biothera-
peutic formulations. The particle size profile
is determined by measuring the random
changes in the intensity of light scattered
from the sample solution. It is often used in
conjunction with SEC and analytical ultracen-
trifugation for aggregate studies. An interest-
ing application of High-throughput platform
in DLS (HT-DLS) has been in screening stud-
ies to quantify viscosity of mAb formulations
(26). Using automated HT-DLS, effects of buf-
fer conditions and temperature on aggre-
gate formation have also been reported (27)
Raman Spectroscopy is used to observe
vibrational, rotational, and other low-fre-
quency modes in a system, generally applied
to study the secondary structure of proteins
by studying the Amide I band between 1600
and 1700 cm−1. An advantage that Raman
spectroscopy offers over other secondary
structure characterizing techniques is its
low susceptibility to water interference as it
detects scattered light and water is inefficient
at scattering in this part of the spectrum (28).
In a recent study, Raman Optical Activity
(ROA) was evaluated as a means to detect
early thermal instability in mAb samples kept
at 50 °C for a month. Significant structural
changes could be observed at one week of
stress. This provides an advantage over SEC
in monitoring aggregation as ROA would
provide information about subtle differences
in tertiary structure whereas Raman/ROA
spectra can elucidate on changes at the
secondary structure level (29). Another inter-
esting recent application of Raman spectros-
copy has been in drug identification, spe-
cifically in the identification of monoclonal
antibodies by exploiting subtle differences
in vibrational modes of the antibodies (30).
It would be interesting to see if this applica-
tion can be further modified to distinguish
between biosimilars and innovator product.
Analytical Ultracentrifugation (AUC) is
a versatile tool for quantitative analysis of
macromolecules in solution. It employs the
principle of centrifugal acceleration to sep-
arate particles based on their size and mass.
Two types of hydrodynamic analyses, namely
sedimentation velocity and sedimentation
equilibrium, are able to make distinctions
in formulation components based on shape
and mass or mass alone, respectively. Sed-
imentation velocity is a mode of choice for
aggregate analysis because it causes physi-
cal separation of molecular species of differ-
ent mass or shape. This is a matrix-free tech-
nique as no column or gel matrix is required
for size fractionation to occur (31). AUC-Sed-
imentation Velocity (AUC-SV) is often used
to quantify high molecular weight species
present in biopharmaceuticals (32).
Multiple Angle Light Scattering (MALS) is
typically used in line with a resolving tech-
nique such as SEC to determine the size of
the different molecular species as they pass
through the MALS detector. It adds a quanti-
tative measure of analysis to techniques like
SEC. As the sample passes through the laser
beam, light is scattered at multiple angles
and the detector collects this data to approx-
imate the sample size (33). It has been used
www.tosohbioscience.com
Tosoh Bioscience and TSKgel and are registered trademarks of Tosoh Corporation.
Accurate results every time!Contact us: 800-366-4875, option #4
New multiple pore size columnsfor extended linear separation range
TSKgel® SuperMultiporeGPC/SEC columns
Individual particles with broad pore size distribution
Semi-micro columns
• Each particle has a linear calibration curve – no infl ection point
• No chromatogram distortion for more accurate molecular weight distributions
• Small particle size (3 to 6 μm) and smaller column dimensions (4.6 mm ID × 15 cm L)
• Higher throughput, higher resolution, reduced solvent consumption
SuperMultipore columns
Pure packings
with multi-pore size distribution
(TSKgel SuperMultiporeHZ column)
Multiple Pore Sizes
101
102
103
104
105
106
107
108
1.5 2.5 3.5 4.5 5.5 6.5
Retention time (minutes)
Log
mo
lar
ma
ss
TSKgel SuperMultiporeHZ-N
TSKgel SuperMultiporeHZ-M
TSKgel SuperMultiporeHZ-H
- 20
0
20
40
60
80 TSKgel SuperMultipore HZ-M
Competitive mixed bed column
100
6 8 10 12 14 16 18 20
-10
10
30
50
70
90
10 20
Retention time (minutes)
De
tec
tor
resp
on
se (
mV
)
30 40
Conventional columns ×4
TSKgel SuperMultiporeHZ-N ×4
TSKgel® SuperMultiporeGPC/SEC columnsTSKgel® SuperMultiporeGPC/SEC columnsTSKgel® SuperMultiporeGPC/SEC columnsTSKgel® SuperMultiporeGPC/SEC columns

820 LCGC NORTH AMERICA VOLUME 36 NUMBER 11 NOVEMBER 2018 WWW.CHROMATOGRAPHYONLINE.COM
to monitor the formation of soluble, HMWS
so as to better quantify and model non-na-
tive aggregation kinetics in α chymotrypsino-
gen (34). Composition-Gradient Multi-Angle
Light Scattering (CG-MALS), a variation on
MALS, employs a series of unfractionated
samples of different composition or concen-
tration in order to characterize a wide range
of macromolecular interactions. CG-MALS, a
complementary technique to AUC and DLS,
has been used to characterize self-associa-
tion in model mAb molecule (35). Although
not yet commonly used, CG-MALS could
be used orthogonally to Surface Plasmon
Resonance (SPR) to study receptor bind-
ing kinetics in biotherapeutics. Unlike SPR,
CG-MALS would not require binding of
the receptor to any chip and hence would
be a truly label-free technique to quantify
interactions, similar to Isothermal Titration
Calorimetry (ITC). Although the latter is
more suited to study the thermodynamic
parameters of an interaction.
Field Flow Fractionation (FFF) is a unique
separation technique used for analysis of
aggregates. Samples are pumped into a
narrow tube perpendicular to the flow and
separation occurs due to the difference
in mobility of the species in the mixture
under the field applied. Depending upon
the properties of the species in the sample
mixture, different flows such as electrical,
magnetic, thermal-gradient, gravitational
or centrifugal can be applied. FFF serves
as a complementary technique to DLS and
MALS for determining the presence of
sub-micron particles in the sample (36).
Fluorescence spectrometry is based on
the principle that certain molecules called
fluorophores emit light upon excitation by
an external source such as an incandescent
lamp or a laser which produces a spectrum.
This technique is helpful in exploring HOS
of a protein (to an extent), mainly the tertiary
structure via the intrinsic fluorescence of the
protein. Changes in the local environment
of tryptophan, the strongest intrinsic fluo-
rophore, are reflected in the emission spec-
tra of the molecule and are a measure of
change in the protein tertiary structure (37).
In cases where a biomolecule does not have
an intrinsic fluorophore, extrinsic fluorophore
dyes such as Thioflavin-T (ThT) or 1-anili-
no-8-naphthale-nesulfonate (ANS) can be
used to induce fluorescence. Fluorescence is
routinely used in thermal stability studies of
biotherapeutics, especially monoclonal anti-
bodies (38). At best, it is an indirect measure
of changes in a protein’s tertiary structure and
does not provide information about position
and the specific nature of these changes.
Micro-Flow Imaging (MFI) is an up and
coming technique that combines digital
microscopy with microfluidics to capture
and quantify sub-visible particles in the
range of 1 to 300 μm in a solution. It can
provide information about particle size,
concentration and morphology (39). How-
ever, rather than protein characterization, it
is more suited for profiling and classifying
the particulate size in a given formulation.
Mass Spectrometry (MS) is a powerful
and data-intensive technique for deter-
mining protein mass (intact, fragmented
and reduced), sequence, and for probing
and quantifying protein modifications.
MS involves ionization of the sample
fragments followed by their separation
based on their mass to charge ratio (m/z).
By accelerating the ionized particles and
subjecting them to an electric or magnetic
field, the ions get deflected depending on
the mass and charge that they carry. Ions
are detected by an electron multiplier and
the results are displayed as a spectrum of
the relative abundance of different ions
based on the m/z ratio.
Analytical capability of an MS platform is
defined by the kind of ionization source and
the type of mass analyser being used. Exam-
ples of ionization sources include fast atom
bombardment (FAB), chemical ionization
(CI), atmospheric-pressure chemical ioniza-
tion (APCI), electrospray ionization (ESI), and
matrix-assisted laser desorption/ionization
(MALDI). Examples of mass analyzers include
Time-of-flight (TOF), quadrupole mass filter,
and ion-traps. Some of the popular combi-
nations of the two are ESI-TOF, MALDI-TOF
and ESI-Q-TOF (Table II).
MS is usually coupled with LC or CE as
the first dimension of separation. Charac-
terization of complex molecules such as
monoclonal antibodies requires mapping
of the different fragmentation patterns in
MS such as Electron Transfer Dissociation
(ETD) and Collision-Induced Dissociation
(CID) along with the use of different pro-
teases make it possible to map disulphide
links present and the different glycans
attached to the protein (18,40).
Another useful application of MS, when
coupled with Hydrogen/Deuterium
exchange (HDX) is in elucidating protein
conformational dynamics and protein inter-
actions. In the biopharmaceutical industry,
HDX-MS has established itself in the analysis
of protein-small molecule interactions, char-
acterization of bio-therapeutics/biosimilars,
and epitope mapping of biotherapeutics.
The technique relies on isotope labelling to
probe the rate at which protein backbone
amide hydrogens undergo exchange. MS
is then used to monitor the mass-shift as a
result of incorporation of deuterium in the
protein. The rate of exchange provides infor-
mation regarding the conformational mobil-
ity, hydrogen bonding strength, and solvent
accessibility in protein structure (41,42)
Differential Scanning Calorimetry (DSC)
is a versatile technique that measures the
quantity of heat radiated or absorbed by
the sample on the basis of a temperature
difference between the sample and the
reference material. It is used to determine
equilibrium thermodynamic stability and
folding mechanism of proteins and finds
routine use in thermal stability characteriza-
tion of biotherapeutics (43).
Tools for Functional Characterization:
Enzyme-linked Immunosorbent Assay
(ELISA) is a popular diagnostic technique
used to assess the immunogenicity of a ther-
apeutic product. In a typical assay, a ligand,
typically an antigen, is non-specifically or spe-
cifically bound to the polystyrene well of a 96
well microtiter plate. Enzyme-linked antibod-
ies are used for colorimetric detection of a
positive interaction upon addition of the
enzyme substrate. ELISA has several appli-
cations in biotherapeutic characterization. A
common application of this assay format is in
Host Cell Protein analysis where polyclonal
antibodies raised to the host cell are used
to detect the presence of HCPs in the sam-
ple (44). However, with high specificity tech-
niques such as MS (detection) and Surface
plasmon resonance (interaction) becom-
ing affordable and routine, ELISA can only
be used for a precursor technique for quick
estimation with limited confidence prior to

WWW.CHROMATOGRAPHYONLINE.COM NOVEMBER 2018 LCGC NORTH AMERICA VOLUME 36 NUMBER 11 821
employing tools with much higher specificity.
Surface Plasmon Resonance (SPR)
(interaction) is a label-free technique
that allows for real-time detection of
biomolecular interactions. The SPR phe-
nomenon occurs when polarized light
strikes an electrically conducting surface
at the interface between two media. In
response, plasmons are produced, which
are electron charged density waves.
These waves reduce the intensity of
reflected light at a specific angle known
as the resonance angle, in proportion to
the mass on a sensor surface. SPR allows
for real-time monitoring of both associ-
ation and dissociation of an interaction,
generating reproducible kinetic data.
Due to its sensitivity, ease of use and
automated data analysis, it is widely used
to study the ligand-receptor kinetics of
monoclonal antibodies (14)
Bio-Layer Interferometry (BLI) is a label-
free, optical analytical technique that ana-
lyzes the interference pattern of white light
reflected from two surfaces: a layer of
immobilized protein on the biosensor tip
and an internal reference layer. Changes
occurring in the number of molecules
bound to the biosensor tip is reflected as a
shift in the interference pattern. Similar to
SPR, binding kinetics can be determined
by this technique. Because of its robust-
ness and ease of implementation, BLI is
gaining application as a complementary
technique to SPR for studying and com-
paring biotherapeutic binding kinetics (44).
Isothermal Titration Calorimetry (ITC) is a
physical technique used to determine the
thermodynamic parameters of interactions
in a solution. It measures the heat released
or absorbed by mixing the two interactants
via titration. It is widely considered an abso-
lute and direct measurement of interaction.
Thermodynamic parameters of an interac-
tion can be assessed via this technique and
it is fast gaining importance as an orthog-
onal technique to SPR for ligand binding
studies in biocomparability (45).
Summary
With the increase in complexity of the bio-
therapeutics undergoing manufacturing, the
need for in-depth analytical characterization
has also increased. As protein molecules,
even minute changes in the structure of the
biotherapeutic can confer altered functional-
ity, sometimes leading to immunogenic reac-
tions in the patients. In view of our depen-
dency for production of these molecules
on biological machinery, the formation of
numerous altered conformations of the mol-
ecule is unavoidable. However, significant
advancements have been made in analytical
methodology increasing our ability to char-
acterize a biotherapeutic. This is highlighted
by the increase in the number of technique
rich publications on analysis of biotherapeu-
tics since 2010 and the introduction of the
US-FDA BPCI Act 2009 (Table II).
Our understanding of the relevance of the
different measured attributes with respect to
the safety and efficacy of a biotherapeutic
has been improving with time and experi-
• Over 5,000 impurity, API and excipient pharmaceutical reference standards
• &RPSUHKHQVLYH�&HUWL¿FDWH�RI�$QDO\VLV
• Expert technical support
• 5 years of manufacturing excellence
lgcstandards.com/mikromol [email protected]
A global leader in the production and distribution of pharmaceutical reference standards

822 LCGC NORTH AMERICA VOLUME 36 NUMBER 11 NOVEMBER 2018 WWW.CHROMATOGRAPHYONLINE.COM
ence. Some recently evolving techniques
such as CG-MALS for macromolecular
interactions and intrinsic Förster resonance
energy transfer (iFRET) for in vivo target pro-
tein detection are yet to find their place in
the biotherapeutic characterization toolbox
while other well-established techniques such
as Raman spectroscopy are being increas-
ingly used for novel applications such as
drug identification. A desirable direction for
technological advancements would be the
increasing throughput of techniques such
as LC by parallelization (9). Short analysis
time and micro- and nanoplatforms with
minimal sample consumption would help
cut down the cost of analysis associated
with limited and expensive samples such as
monoclonal antibodies.
Despite these advancements, we are yet
to reach a point where a product such as a
complex biotherapeutic, can be completely
fingerprinted in a manner similar to a phar-
maceutical (small molecule) product. More-
over, each technique comes with its unique
limitations and pitfalls. This ensures that the
topic of analytical characterization of bio-
therapeutics will continue to be an area of
research in the time to come.
References
(1) ICH Expert Working Group, Specif. Test Proced. Accept. Critreia Biotechnol. Prod. (March), 1–20 (1999).
(2) WHO, Guidelines on the Quality, Safety and Efficacy of Biotherapeutic Protein Products Prepared by Recombinant DNA Technology, WHO Technical Report Series 814, 91 (2013)
(3) L.A. Bui, S. Hurst, G.L. Finch, B. Ingram, I.A. Jacobs, C.F. Kirchhoff, C.K. Ng, and A.M. Ryan, Drug Discov. Today 20(S1), 3–15 (2015).
(4) A.S. Rathore, Trends Biotechnol. 27(12), 698–705 (2009).
(5) A. AL-Sabbagh, E. Olech, J.E. McClellan, and C.F. Kirchhoff, Semin. Arthritis Rheum. 45(5), S11–S18 (2016).
(6) D. Nebija, C. Noe, E. Urban, and B. Lach-mann, Int. J. Mol. Sci. 15(12), 6399–6411 (2014).
(7) R. Diez, M. Herbstreith, C. Osorio, and O. Alzate, 2-D Fluorescence Difference Gel Electrophoresis (DIGE) in Neuroproteomics Neuroproteomics (CRC Press/Taylor & Francis, 2010). at <http://www.ncbi.nlm.nih.gov/pubmed/21882449>.
(8) C. Reichel and M. Thevis, Bioanalysis 5(5), 587–602 (2013).
(9) S. Fekete, D. Guillarme, P. Sandra, and K. Sandra, Anal. Chem. 88(1), 480–507 (2016).
(10) J. R. Auclair, A. S. Rathore Chitra, and I. S. Krull, LCGC North Am. 36(1), 26–36 (2018).
(11) S.K. Singh, G. Narula, and A.S. Rathore, Electrophoresis 37(17–18), 2338–2346 (2016).
(12) A. Singla, R. Bansal, V. Joshi, and A.S. Rathore, AAPS J. 18(3), 689–702 (2016).
(13) A. Wakankar, Y. Chen, Y. Gokarn, and F.S. Jacobson, MAbs 3(2), 164–175 (2011).
(14) N. Nupur, N. Chhabra, R. Dash, and A.S. Rathore, MAbs 10(1), 143–158 (2018).
(15) K. Wooding, W. Peng, and Y. Mechref, Curr. Pharm. Biotechnol. 17(9), 788–801 (2016).
(16) M. Han, B. M. Rock, J. T. Pearson, Y. Wang, and D. A. Rock, Therapeutic Monoclonal Antibody Intact Mass Analysis by Capillary Electrophoresis–Mass Spectrometryin Cap-ill. Electrophor. Spectrom., 13–34 (Springer International Publishing, Cham, 2016). doi:10.1007/978-3-319-46240-0_3.
(17) S.A. Berkowitz, J.R. Engen, J.R. Mazzeo, and G.B. Jones, Nat. Rev. Drug Discov. 11(7), 527–540 (2012).
(18) S.A. Berkowitz, Analytical Characterizationin Biosimilar Drug Prod. Dev., 15–82 (2017). doi:10.1201/9781315119878-3.
(19) B. Carragher, A. Schneemann, J.J. Sung, S.K. Mulligan, J.A. Speir, K. On, and C.S. Potter, Microsc. Microanal. 21(33), 2014–2015 (2015).
(20) J. T. Yang, C.-S. C. Wu, and H. M. Martinez, Methods Enzymol. 130, 208–269 (1986). doi:10.1016/0076-6879(86)30013-2.
(21) V. Joshi, T. Shivach, N. Yadav, and A.S. Rathore, Anal. Chem. 86(23), 11606–11613 (2014).
(22) L.R. Tsuruta, M. Lopes dos Santos, and A.M. Moro, Biotechnol. Prog. 31(5), 1139–1149 (2015).
(23) F. He, G. W. Becker, J. R. Litowski, O. L. Narhi, D. N. Brems, V. I. Razinkov, Anal. Bio-chem. 399(1), 141–143 (2010).
(24) L. Aileen, A. Seneviratne, G. Ratnaswamy, and J. Park, Pharm. Technol. 38(10), 32–39 (2015).
(25) R.J. Falconer, D. Jackson-Matthews, and S.M. Mahler, J. Chem. Technol. Biotechnol. 86(7), 915–922 (2011).
(26) G. Thiagarajan, E. Widjaja, J.H. Heo, J.K. Cheung, B. Wabuyele, X. Mou, and M. Sha-meem, J. Raman Spectrosc. 46(6), 531–536 (2015).
(27) S.K. Paidi, S. Soumik, R. Strouse, J.B. McGivney, C. Larkin, I. Barman, Anal. Chem. 88(8), 4361–4368 (2016).
(28) T. Arakawa, J.S. Philo, D. Ejima, K. Tsumoto, and F. Arisaka, Bioprocess Int. 4, 42–43 (2006).
(29) L. Wafer, M. Kloczewiak, and Y. Luo, AAPS J. 18(4), 849–860 (2016).
(30) A. Oliva, M. Llabrés, and J.B. Fariña, J. Pharm. Biomed. Anal. 25(5–6), 833–841 (2001).
(31) Y. Li, W. F. Weiss, and C. J. Roberts, J. Pharm. Sci. 98(11), 3997–4016 (2009).
(32) R. Esfandiary et al., J. Pharm. Sci. 102(9), 3089–3099 (2013).
(33) J. Liu, T. Eris, C. Li, S. Cao, and S. Kuhns, Bio-Drugs 30(4), 321–38 (2016).
(34) P. Garidel, M. Hegyi, S. Bassarab, and M. Weichel, Biotechnol. J. 3(9–10), 1201–1211 (2008).
(35) M. Weichel, S. Bassarab, and P. Garidel, Bioprocess Int. (5), 42–52 (2008). at <http://www.bioprocessintl.com/manufacturing/monoclonal-antibodies/probing-ther-mal-stability-of-mabs-by-intrinsic-trypto-phan-fluorescence-182648/>.
(36) M.K. Joubert, Q. Luo, Y. Nashed-Samuel, J. Wypych, and L.O. Narhi, J. Biol. Chem. 286(28), 25118–33 (2011).
(37) A. Guttman, LCGC North Am. 30(5), 412–421 (2012).
(38) C.M. Johnson, Arch. Biochem. Biophys. 531(1–2), 100–109 (2013).
(39) D.G. Bracewell, R. Francis, and C.M. Smales, Biotechnol. Bioeng. 112(9), 1727–1737 (2015).
(40) U. Sinha-Datta, S. Khan, and D. Wadga-onkar, Biosimilars 5, 83–91 (2015).
(41) C.A. Challener, BioPharm Int. 28(1) (2015).
(42) T.K. Dam, M. Torres, C.F. Brewer, and A. Casadevall, J. Biol. Chem. 283(46), 31366–70 (2008).
(43) M.G. Petroff, H. Bao, J.P. Welsh, M. van Beuningen-de Vaan, J.M. Pollard, J.D. Roush, S. Kandula, P. Machielsen, N. Tugcu, and T. O. Linden, Biotechnol. Bioeng. 113(6), 1273–1283 (2016).
(44) V. Kamat and A. Rafique, Anal Biochem. 536, 16-31 (2017)
(45) S. Perspicace, A.C. Rufer, R. Thoma, F. Muller, M. Hennig, S. Ceccarelli, T. Schulz-Gasch and J. Seelig, FEBS Open Bio. 3, 204-211 (2013)
Anurag S. Rathoreis a professor in the Depart-ment of Chemical Engineer-ing at the Indian Institute of Technology in Delhi, India.
Ira S. Krullis a Professor Emeritus with the Department of Chemis-try and Chemical Biology at Northeastern University in
Boston, Massachusetts, and a member of LCGC’s editorial advisory board.
Srishti Joshiis a post-doctoral research fellow in the Bioseparations and Bioprocessing Lab, under the tutelage of Pro-
fessor Anurag. S. Rathore, Department of Chemical Engineering, Indian Insti-tute of Technology, Delhi.
ABOUT THE AUTHORS

Join thousands of chemists and scientists from around the world at Pittcon, the
leading annual conference and exposition for laboratory science. This all-in-one event
ŅýåųŸ� ±� ĘĜčĘěϱĬĜÆåų� ƋåÏĘĺĜϱĬ� ŞųŅčų±ĵØ� ŸĩĜĬĬěÆƚĜĬÚĜĺč� ŸĘŅųƋ� ÏŅƚųŸåŸ� ±ĺÚ� ±� ÚƼĺ±ĵĜÏ�
ĵ±ųĩåƋŞĬ±Ïå�Ņü� ƋĘå� Ĭ±ƋåŸƋ�ŸÏĜåĺƋĜĀÏ� ĜĺŸƋųƚĵåĺƋ±ƋĜŅĺ�±ĺÚ�ŸåųƴĜÏåŸţ��Ƌ±ųƋ�ÏŅĬĬ±ÆŅų±ƋĜĺč�
ƵĜƋĘ�ĜĺÚĜƴĜÚƚ±ĬŸ�Ĝĺ�±�ƴ±ųĜåƋƼ�Ņü�ŸÏĜåĺƋĜĀÏ�ÚĜŸÏĜŞĬĜĺåŸ�±ĺÚ�ĀĺÚ�ŸŅĬƚƋĜŅĺŸ�ƋŅ�ƼŅƚų�čųå±ƋåŸƋ�
laboratory challenges at Pittcon 2019.
Pennsylvania Convention Center | Philadelphia, PA | March 17 - 21 | www.pittcon.org
The Visible DifferenceIn Laboratory Science Expositions

824 LCGC NORTH AMERICA VOLUME 36 NUMBER 11 NOVEMBER 2018 WWW.CHROMATOGRAPHYONLINE.COM
Transferring chromatographic meth-
ods among users and laborato-
ries is a common and important activity
that has often proven more difficult than
expected. This is the second installment
of a three-part discussion focused on the
most rigorous method transfer leading
to the duplication of results of the estab-
lished methods. The first installment (1)
described the aspects of the method
that specifically affect the transfer of the
method. In the future, the final part of this
series will consider the details of aligning
individual instrument modules. In this part,
we address the chromatographic systems
and how they may be characterized and
compared for use in the transfer. It is gen-
erally assumed that modern instrumenta-
tion delivers the volumes, temperatures,
and so on that are programmed in the
control software. That is generally true for
well-maintained systems. There are, how-
ever, subtle differences in the exact deliv-
ery and conditioning of flow that can have
significant effects on the chromatographic
results. Such details occur in all the system
modules. We discuss here the characteriza-
tion of the systems to identify these opera-
tional differences.
General Considerations
The chromatographic instrument itself is
often the largest contributor to inconsis-
tencies in the transfer of methods. The
common principle applied for all other
considerations, “Use exactly what was used
in the originator’s laboratory,” is desirable
here. It is, however, very often impossible
to maintain that consistency. The instru-
ments used in various laboratories are
often different models or brands, and it
is not usually financially sensible to pur-
chase chromatography instruments for
each specific new method to be imple-
mented. Furthermore, the usable life-
time of a method is often much longer
than that of an instrument. Duplicating
instruments, therefore, may not be pos-
sible to begin and execute a method
transfer. We must, then, consider the
differences among instruments that can
affect method transfer. The transfer of a
method from one instrument to another
may require some adjustment of the
method. Many laboratories adhere to
the guidelines found in Chapter 621 of
the current United States Pharmaco-
peia. The currently applicable chapter
specifically states:
Adjustments to the specified chro-
matographic system may be nec-
essary in order to meet system suit-
ability requirements. Adjustments to
chromatographic systems performed
in order to comply with system suit-
ability requirements are not to be
made in order to compensate for col-
umn failure or system malfunctions.
Adjustments are permitted only when
. . . adjustments or column change
yields a chromatogram that meets all
the system suitability requirements
specified in the official procedure (2).
These guidelines, often mentioned as
“<621>”, specify changes to the method
that may be implemented without revali-
dating the method. The chapter has been
summarized in many places, but the original
document should always be consulted. We
will allude to specific items in these guide-
lines in the context of specific challenges in
method transfer. It should be emphasized
that many laboratories follow these limits
and practices, but they are not universal
regulations. They are absolute require-
ments only for the compendial methods of
the USP.
The Fluid Path
There are important factors associated
with the fluid path in general; the pump-
ing or solvent delivery system; the sample
introduction or injector system, and the
detector. Each component will be consid-
ered for its potential impact on the method
in terms of altered retention time as it may
affect peak identification and resolution;
altered chromatographic selectivity as it
may affect resolution and quantification;
and peak shape as it may affect resolution
and sensitivity.
The fluid path of the instrument includes
all the tubing, and other elements where
liquid moves through the system. To con-
sider the impact on transfer, we must dis-
tinguish between segments that transport
the sample and segments that are only
exposed to the mobile phase. We gen-
erally assume that the fluid is unaltered
during this transport, but this may not be
Thomas E. Wheat
The process of transferring chromatographic methods between users and laboratories is often complicated and time
consuming. This is the second installment of a three-part consideration of this common activity. In part 1, the focus was
on the method itself. In this second part, the techniques and concerns about characterizing the systems in use in the
originating laboratory and the new facility will be described. Given that the scientists executing the transfer often do not
have free access to the originating system, alternative approaches to matching chromatographic results will be considered.
Instrument Considerations in the Transfer of Chromatographic Methods,Part II: System Considerations

WWW.CHROMATOGRAPHYONLINE.COM NOVEMBER 2018 LCGC NORTH AMERICA VOLUME 36 NUMBER 11 825
absolutely true. While the instrument may
create trace chemical changes in the mobile
phase, such as metal leaching, this seldom
complicates method transfer, since mate-
rials of construction are consistent across
models and manufacturers. The worrisome
effects are physical. In addition, the tubing
dimensions create some timing differences.
The time to transit the fluid path is often
of great concern to laboratory scientists
using chromatographs and transferring
methods; these scientists frequently com-
ment that tubing must be shortened and
modules placed closer together. In fact,
such changes are almost imperceptible. As
a point of reference, a 3 m piece of 0.005
inch (~127 μm) tubing has a volume of
about 12.7 μL. So the transit time at 1.00
mL/min is only 0.01 min or 0.75 s. Even dou-
bling the tubing diameter only increases the
time to 3 sec. Larger differences are typically
allowed for flow rate or retention time vari-
ability in typical system suitability specifica-
tions. So, there is little reason to focus on
tubing length as a factor in time offset.
The tubing in the system also contrib-
utes some mixing or dispersion, primar-
ily because of laminar flow differences
between the tubing wall and the center.
The magnitude of this effect is dependent
on both the diameter and length of the
tubing. It is important here to distinguish
between parts of the flow path used for
mobile-phase transport only and the parts
downstream from the injector where the
sample is in the flow path. As a general
rule, the upstream parts of the system
can contribute some mixing to blend the
mobile phase. However, as discussed
above, the volumes and the residence
time are so small that there is no significant
contribution to mixing. There is, of course,
substantial solvent blending in all systems,
and we will discuss that below in the con-
text of the pumping system.
Dispersion in the fluid path downstream
from the injector has an impact on both
peak shape and resolution. This has been
considered in detail in other investigations
(3). The largest contribution to dispersion
during sample transport originates with the
tubing diameter, with length as a smaller
contributor. It is, therefore, important during
method transfer to ensure that the tubing
used for connecting the modules of the tar-
get system are the smallest possible diam-
eter and the shortest length. In following
this guideline, however, it is not necessary
to take extreme measures. Consider the
expected volume of the peaks as they elute
from the column. Many standard methods
have peak volumes near or above 50 μL.
The effect of a 10 μL tubing volume will be
relatively small. Even for the most modern
ultra-high performance liquid chromatogra-
phy (UHPLC) methods, with peak volumes
near 10 μL, 0.004 inch (~102 μm) contributes
about 2 μL per foot, and 0.0025 inch (63.5
μm) is less than 1 μL per foot.
When implementing the above tubing
considerations, many scientists overlook
the back pressure that can arise simply
from flow through tubing. At the midpoint
of a water–methanol gradient, at 1 mL/
min, the resistance to flow through 1 m of
a 0.0025 inch (~63.5 μm) tubing generates
a back pressure greater than 5000 psi. For
this reason, the tubing used to assemble a
system should be no smaller than required
for minimizing dispersion.
Pumps
The pumping, or solvent delivery system,
has received the most attention of any
instrument module in terms of its effect on
method transfer. Isocratic separations are
reasonably simple because modern sys-
tems reliably deliver the specified flow rate
from a reservoir of preblended solvent,
with the preparation constraints discussed
in part I of the series. Gradients are much
more complicated to duplicate between
systems. We assume that the pump is
delivering liquid flow at the programmed
rate, and that the percentage composi-
tion accurately corresponds to the pro-
grammed value. We also expect that any
gradient follows the intended profile and
that the specified composition reaches the
column at the intended time. All modern
chromatographic systems closely approach
these assumptions, but there are always
deviations from the ideal. The differences
in the deviations between different brands
or models of pumps create complications
for method transfer. The differences can
affect retention time and selectivity. It is
less well recognized that the differences
can also affect column regeneration and
reequilibration. Most scientists consider
the system volume to be the major source
of the deviations so method transfer strate-
gies are often based on equalizing the
system volume differences.
FIGURE 1: The measurement of the volume of a chromatographic system is based on running a gradient after removing the column. Mobile-phase A = water. Mobile-phase B = water with 10 mg/mL caffeine. Detection wavelength = 273 nm. The strong solvent is spiked with a UV absorbing marker (in this case, caffeine). Mobile-phase gradient: hold at 0% B for 5 min, then 0–100% B in 20 min, 100% B for 5 min, 100–0% B in 5 min; fl ow rate: 1 mL/min. (Reprinted with permission from reference 2).
100.00
80.00
Gra
die
nt
(%)
60.00
40.00
20.00
5.00 10.00
50%
100%
tG
tD
FVD
tG
t1/2 (2)
tG
t1/2
15.00 20.00
=
– –12
25.00 30.00 35.00 40.00
Time (min)
0.00
0.00

Silicon Wafer Technology Makes LC Analysis for Proteomics More powerful and Effective, A User’s ExperienceA Q&A
Geert Van Raemdonck Global Field Support Expert
PharmaFluidics
A s the field of proteomics grows more complex, traditional separation techniques like
nano-liquid chromatography (LC) have a harder time extracting critical information
efficiently. PharmaFluidics’ μPAC™, a breakthrough in column design, helps bring
LC analysis up to speed. LCGC recently sat down with Geert Van Raemdonck, global
field support expert at PharmaFluidics, to discuss this topic. After using the μPAC™ at the
University of Antwerp, Van Raemdonck was convinced about the benefits of micro-pillar
array column technology. His enthusiasm resulted in him joining the team of PharmaFluidics.
LCGC discussed with Van Raemdonck the unique properties of the μPAC™ columns
and got a user’s-eye view of what it’s like to work with them in proteomics applications.
Van Raemdonck also shared his ideas about how future products could meet even more
advanced analytical needs.
LCGC: What are the biggest differences between the μPAC™ columns and conven-tional nano-LC columns?Van Raemdonck: The biggest difference of the column is the way the backbone of the
stationary phase is manufactured. μPAC™ incorporates a chip made of a silicon wafer, and
freestanding pillars are etched out of the wafer, which results in a perfectly ordered structure.
This leads to a high separation performance because there is almost no peak dispersion.
Sharp peaks also lead to higher sensitivity, so that small amounts of molecules can be
detected more easily.
In addition, back-pressure is significantly lower as compared to conventional columns,
which allows you to operate your column at a broader flow range, going from about 300 nL
up to 1 μL per minute.
And last, since the μPAC™ column is etched out of a silicon wafer, there is no batch-to-
batch variation, as every column that is produced is exactly the same.
LCGC: For which applications are these μPAC™ columns best suited?Van Raemdonck: Special applications seen in the field of proteomics are analyses of samples
with low amounts of peptides—for instance, the analysis of biopsies or protein extracts from
a tissue. But, there’s also the opportunity for the analysis of complex samples that require
longer gradients, as for biomarker discovery. The technology is also suitable for chemically
labeled samples like iTRAQ or TMT, where the gradients applied for separation often last
four hours and longer.
Additional applications are in pharmaceutical fields, like in the detection of small subtle
differences in biopharmaceuticals, and biosimilars, like for antibody production and quality

AN EVALUATION OF USING μPAC™ COLUMNS FOR PROTEOMIC APPLICATIONS
control. In metabolomics, it might also be helpful to use
μPAC™ columns because of the low concentrations of mol-
ecules, and also in lipidomics experiments, where a high
resolution is required.
LCGC: Are there any drawbacks to these types of columns compared with classical columns?Van Raemdonck: In my opinion, there are no specific draw-
backs related to the μPAC™ columns. However, I think it’s
important to keep a few things in mind.
First of all, the back-pressure of
the μPAC™ should always stay below
350 bar, or 5,000 PSI, to prevent
any damage to the freestanding
pi l lars that form the separat ion
bed of the column. This maximum
back-pressure is lower than for clas-
sical nano-LC columns, but it also
lowers the shear force of the LC
instrumentation.
Secondly, it’s important to ground
the column in case of applying a high
voltage to the spray emitter of the
mass spectrometer. This prevents
any charg ing ef fects s ince the
column is made of a semi-conductive silicon chip.
Finally, the price of a μPAC™ column is higher than
most commercially available columns. However, since the
lifetime of a μPAC™ column outperforms any conventional
nano-LC column, the price per injection will be at least
equal or even lower.
LCGC: What product improvements would you like to see in the future from a user’s point of view?Van Raemdonck: I think an introduction of trapping columns
would be very useful since this would reduce the loading time
and also offer higher flexibility in the sample volumes that can
be injected into the column.
Further, it would be interesting to have the addition of
some products to our current portfolio—like, for instance,
those with bigger pore sizes in combination with other coat-
ings, like reverse-phase C8 or C4, which could be applied
in peptidomics and top-down applications.
And finally, if it would be possible to integrate the grounding
mechanism, that would also be very handy.
LCGC: Did you encounter any issues during the instal-lation and first use of the column?
Van Raemdonck: I used the μPACTM for the first time when I was
working at the University of Antwerp. The installation was done
perfectly by the team of PharmaFluidics. One thing that you
have to keep in mind is that you have to adapt your methods to
the internal volume of the 200-cm column. This is about 9 μL,
so it’s important that at the end of your gradient, you provide
enough equilibration time to equilibrate your column before you
inject your next sample. If you desire, you can also increase your
flow rate (due to the lower back-pressure) in order to reduce
this equilibration time.
LCGC: Why is grounding the column so important?Van Raemdonck: The column is
made out of a single silicon wafer
that’s semi-conductive. So, when the
column is not grounded and when a
high voltage is applied to the spray
emitter that is used to transfer your
molecules to your mass spectrometer,
the current can actually reach the
column and this will influence the
retention of the column.
So, this will result in some charging
effects that will retain your tryptic
peptides, which will result in significantly broader peaks. And
this discrepancy can be really big—you’ll see it immediately
when a column is not grounded; you’ll be having very broad
peaks. Unfortunately, adequate grounding is often a step
that’s forgotten.
LCGC: For which proteomics applications do you see the biggest potential for the μPACTM technology?Van Raemdonck: On the one hand, there are the small
sample sizes that I already mentioned—like the pro-
tein or peptide extractions from tissues and biopsies.
Furthermore, there are also the top-down proteomics
applications with the C4 or C8 coating. But, there are also
opportunities for protein–protein interactions and host-cell
protein identifications since there will be very tiny amounts
of compounds detected.
There is also a benefit to using the μPAC™ technology for
targeted applications like scheduled parallel reaction moni-
toring, since the elution profiles can be set really narrow.
So, you can include much more of the compounds that you
want to validate in a single run. And further, it could also be
very interesting to use the very stable retention times of the
μPAC™ columns for data-independent analysis.
“Since the μPAC™ column
is etched out of a silicon
wafer, there is no batch-
to-batch variation, as every
column that is produced is
exactly the same.”

828 LCGC NORTH AMERICA VOLUME 36 NUMBER 11 NOVEMBER 2018 WWW.CHROMATOGRAPHYONLINE.COM
System Volume
The system volume, also called dwell vol-
ume, void volume, or delay volume, is the
amount of liquid from the point where two,
or more, solvents meet and the point where
the blended solvents reach the head of the
column. Two systems with different dwell
volumes, delivering the same gradient, will
give different retention times. It has long
been recognized that characterizing the
volume of a system is the key first step for
maintaining constant retention time in a
method transfer. There are many published
and freely circulated procedures for mea-
suring system dwell volume (4,5). The gen-
eral approach is to prepare two batches of
the same solvent, one of which is spiked
with a UV-absorbing marker, such as uracil,
acetone, propyl paraben, or caffeine. The
column is replaced with a short length of
small inner diameter (i.d.) tubing. A gradi-
ent is run from 100% A to 100% B over 20
min, followed by a return to 100% A over 5
min. A hold, typically 5 min, is incorporated
at 100% B, and at the return to 100% A. The
gradient is observed as the UV absorbance
trace at the wavelength appropriate for the
selected marker. The volume of the system
is best measured at the midpoint of the gra-
dient. The difference in time between the
programmed midpoint and the observed
midpoint is multiplied by the flow rate to
obtain the system dwell volume. Although
it is sometimes suggested that the volume
be measured with an instantaneous step
from A to B or, alternatively, at the first lift-
off of the gradient trace, the midpoint is
much preferred as reflecting a steady state
transfer through the mixing volume of the
system, as discussed below. Although sys-
tem volume values typically are published
by instrument manufacturers, these val-
ues are seldom ideal for method transfer
experiments because the measurement
procedures are not consistent from one
manufacturer to another. It is, therefore,
necessary to measure the particular sys-
tems in use. For most purposes, the best
method is the one recommended by the
manufacturer of the system, but the overrid-
ing consideration is that the same method
be used to measure the volume of both
the original and the target system. A typical
useful procedure is shown in Figure 1 (5).
The measurement of dwell volume does
not ensure perfect replication of the gradi-
ent to be transferred. When the gradient
trace generated during the measurement
is examined in detail, it is always observed
that the offset time or volume is not con-
stant throughout the gradient profile.
This variation is a consequence of sev-
eral factors. Systems generally create the
programmed percentages by blending
volumes of each solvent. There is, how-
ever, some inaccuracy associated with the
nonadditive effects associated with pairs
of solvents. In addition, all instruments
make some adjustment for compressibil-
ity changes. The much larger source of
changes in the gradient profile is the mix-
ing that is incorporated in all systems. Gra-
dient systems must include a volume for
mixing of the proportioned solvents. Many
different designs have been used for mix-
ers, but they all must meet the two criteria
of stable, reproducible retention times and
ripple-free baselines. The ripples reflect
solvent concentration inhomogeneities
that may alter retention and will certainly
complicate quantitative integration of the
peaks. The alternative mixer designs all
are intended to smooth these ripples by
making the solvent changes uniform with
time. To achieve this, the mixer must have
a common volume that is large enough to
span the period of the ripple. This com-
mon volume, however, also distorts the
programmed profile of the gradient. When
a change in composition is initiated, that
change is intended to be uniformly dis-
tributed throughout the mixer volume. But
that change, now much smaller because
it is diluted by the mixer volume, begins
to emerge from the mixer immediately. In
other words, it reaches the head of the col-
umn in much less than the physical volume
of the system. Over the course of the gra-
dient, this phenomenon becomes less
significant as the series of small composi-
tion increments settles into a steady state
change. This is the basis for recommend-
ing that the system volume be measured
at the gradient midpoint. Measurement
at the start of the rise in the gradient
monitoring trace gives a much smaller
volume than the physical volume, or the
steady state condition.
Mixers
The differences among mixers can have
three effects on chromatography. First,
with a smaller system volume, the leading
edge of the gradient reaches the column
and causes peaks that elute very early in
the gradient to be shifted to an earlier
retention time. Second, because the entire
mixer volume must be flushed with the
final conditions of the gradient before that
strong solvent is delivered to the column,
the column may not be regenerated on
one system as compared to the other. This
can lead to a drift in retention times over a
series of injections. Third, on return to ini-
tial, the entire mixer volume must again be
flushed before re-equilibration can begin.
Again, the two systems may differ in the
equilibration to initial conditions for the
next injection. In this case, the two systems
may prove reproducible but different from
one another. These three problems have
different symptoms, and solutions, from a
simple mismatch in measurement of dwell
volume. Strategies for correcting system
volume differences will be discussed in
part III.
Gradient Mixing
There is one additional difference among
chromatographic systems that must be
considered. Pumps are usually classi-
fied as multi-pump gradient, high-pres-
sure mixing systems or as single-pump
gradient, low-pressure mixing systems.
The high-pressure mixing systems cre-
ate specific compositions by varying the
flow from two or more pumps to gen-
erate the desired solvent percentages.
The low-pressure mixing approach uses
a solenoid valve where each port opens
for a percentage of the valve cycle time
corresponding to the programmed com-
position. This series of solvent aliquots is
carried to the pump through a single tub-
ing piece. Some blending of the solvent
segments occurs in the transport tubing
and then in the pump heads as the mobile
phase is brought to the pressure and flow
for the method. Both system designs can
work very well in terms of compositional
accuracy and precision. The system vol-
ume is usually somewhat smaller with a
multi-pump gradient system, whereas the

WWW.CHROMATOGRAPHYONLINE.COM NOVEMBER 2018 LCGC NORTH AMERICA VOLUME 36 NUMBER 11 829
single pump system can provide more
convenience as described in part I in the
context of solvent preparation.
There is an additional characteristic asso-
ciated with low-pressure mixing systems
that is not generally recognized. The fluid
in the transfer tubing from the proportion-
ing valve enters the pump head as a block
corresponding to the delivery volume of the
pump head. That series of solvent segments
is mixed, more or less completely, into a sin-
gle packet at the composition specified at
that time. That blended volume of solvent
is then delivered into the flow path towards
the column inlet. Rather than the smoothly
blended continuous gradient that we envi-
sion, the pump transmits a series of small
steps that are somewhat smoothed at the
edges of the packets. This flow and com-
position pattern is further complicated by a
mechanical characteristic of pumps. When
the piston, or plunger, expels the liquid
from the head, it does not dispense all the
liquid, because there is space between the
surface of the piston and the walls of the
pump head. This unswept liquid can be a
substantial fraction of the total volume of
the pump head, on the order of 40% of
its physical volume. That residual volume
mixes with the incoming mobile phase of
the next segment of solvent aliquots. The
result of this sequence of events is that the
mobile phase is diluted with the composi-
tion of the previous pump cycle, which was
also similarly diluted. This contributes
to the larger system volume associated
with single-pump systems, and, more
importantly, adds to the required time to
reach the regeneration step in a gradient
method and also to complete the return
to initial conditions for re-equilibrating for
the next injection.
Tools for Instrument
Calibration in Method Transfer
The physical factors that directly affect
the shape of the gradient in a given
system have elicited interest in alterna-
tives to the common and simple ways
to estimate and use the system volume.
One interesting alternative is the use of
marker compounds to calibrate the sys-
tem. A more general tool, called “Mea-
sure Your Gradient,” has been developed
to evaluate the shape of the gradient
on various systems (6). This tool can be
implemented from an open-source web
tool: http://www.measureyourgradient.
org/index.php. For this approach, the
intent is to recreate the identical gradient
on the two systems in question. The gra-
dient table entries will be different, but
the solvent composition delivered to the
column will be identical. The “Measure
Your Gradient” tool uses a very exactly
defined mixture of test compounds along
with a specified column, mobile phase,
and method. This test is run on both sys-
tems and the retention times are entered
into the software. The gradient is calcu-
lated to give a specific array of retention
times. Because this approach provides a
multi-point calibration that addresses the
several physical factors discussed above
that make gradient transfer imperfect,
it provides a very good adjustment for
method transfer. It is, however, limited
if the information is not available about
both systems in the method transfer.
This problem arises when implementing
methods that are even a few years old
where the systems may no longer exist.
Even in the case where current instru-
ment systems were used to develop the
method, those instruments may not be
available to the laboratory responsible
for the transfer. This same obstacle can
interfere with the conventional measure-
ment strategies discussed above. When
the observed system volume is to be
used to match the gradients delivered
by two systems, the same measurement
protocol must be used on both systems.
That may simply not be possible.
An alternative to measuring the exact
system volume can be suggested for
transfer of the separation method. The
originator method (the method being
duplicated), should provide system suit-
ability criteria specifying the retention
time for each sample component that
is to be measured. Use the established
method on the new system. This initial
experiment may not meet the specifi-
cations, but the major analyte peak will
be recognizable. Compare the retention
time of this peak on the new system with
the time in the specifications. The differ-
ence in retention time multiplied by the
flow rate gives the difference in system
volume between the two systems. This
trial can then be repeated after apply-
ing the strategies discussed in part III
to match the volumes between the two
systems. After a few iterations of this
empirical adjustment, the chromatogram
should be close to meeting specification.
If there are still discrepancies, apply a
correction to the target system that mini-
mizes all the differences in time.
Conclusions
We have considered the contribution
of system characteristics to transferring
chromatographic methods. The possible
differences between the originating and
the target systems can alter resolution
by changing the characteristics of sol-
vent delivery and by altering dispersion
of the separated peaks as they migrate
through the system. Consideration must
also be given to the resistance to flow
within the system tubing and the blend-
ing of solvents. In our final part of this
three-part series, we will consider the
modules that comprise each system and
the ways that they can be aligned for
consistent results.
References
(1) T.E. Wheat, LCGC North Am. 36(9), 693–696 (2018).
(2) General Chapter <621> “Chromatogra-phy” in United States Pharmacopeia 40 National Formulary 35 (USP 40-NF 35, United States Pharmacopeial Convention, Rockville, Maryland, 2017), pp. 508-520.
(3) F. Gritti, T. McDonald, and M. Gilar, J. Chrom. A 1420, 54-65 (2015).
(4) J. W. Dolan, LCGC Europe, 19(6), 336-343 (2006).
(5) P. Hong and P.R. McConville; Waters Corporation White Paper; 720005723EN; ©2016 Waters Corporation (2016).
(6) M.H. Magee, J.C. Manulik, B.B. Barnes, D. Abate-Pella, J.T. Hewitt, P.G. Boswell; J. Chrom. A 1369, 73-82 (2014).
Thomas E. Wheatis a principal scientist with Chromato-graphic Consulting, LLC in Hopedale, Massachusetts. Direct correspon-dence to: [email protected].

830 LCGC NORTH AMERICA VOLUME 36 NUMBER 11 NOVEMBER 2018 WWW.CHROMATOGRAPHYONLINE.COM
Plates are generated during the elu-
tion of solutes through a chromato-
graphic column and contain a wealth
of information about the separation
process, mainly peak dispersion. It is an
easily measured quantity used to probe
column properties.
We had previously shown in part IV of
this series (1) that the plate concept orig-
inated from fractional distillation and was
later used to interpret results obtained
from countercurrent distribution (CCD)
extractions. At about the same time that
CCD was being developed, A. J. P. Mar-
tin (1910-2002) and R. L. M. Synge (1914-
1996) formulated a theory of chromatog-
raphy using the theoretical plate concept
(2,3). These researchers went on to win the
Nobel Prize in Chemistry in 1952 for the
invention of partition chromatography.
In this article, we will focus on the
development of theoretical plates and
peak broadening, and arrive at relation-
ships that are applicable to liquid chro-
matographic (LC) separations. The more
important relationships from distillation
and CCD will once again be reviewed for
the benefit of the reader.
Background Information
Fractional Distillation
The concept of theoretical plates
was first introduced with respect to
fractional distillation, which required
an accounting of the separat ion
ef ficiency of dif ferent lengths and
designed distillation columns (1). It was
assumed that the distillation process
occurs in stages along the length of a
distillation column, the location of which
varies during the distillation process.
At each stage, equilibrium is reached
between the vapor and liquid phases,
and separation occurs between high-
and low-vapor-pressure components.
The number of theoretical plates is
proportional to column length, and
depends upon column design. It
should be emphasized that distillation
is not a chromatographic process, but
a countercurrent process of rising vapor
in contact with descending distillate
droplets.
To compare distillation efficiencies
among columns of different lengths, col-
umn length, L, is divided by plates, N, to
give the height equivalent of a theoretical
plate, HETP, or simply plate height H:
H = L/N [1]
Although distillation is a complex pro-
cess, each plate can be viewed as a vir-
tual platform on which vapor-liquid equi-
librium occurs.
CCD Extractions
A cleverly designed automated CCD
extraction apparatus, comprised of
multiple two-compartment transfer
tubes, was invented by Craig and Post
(2). Craig tubes consist of upper and
lower compartments, filled respectively
with two immiscible solvents (1,2). The
first tube contains sample dissolved in
either the upper or lower immiscible
liquid phase. After each extraction,
the upper phases are simultaneously
transferred to adjacent tubes, contents
mixed, and the process repeated until all
transfers are completed. The amount of
solute that is equilibrated between the
two phases depends on the distribution
coefficient of the solute, K, and relative
volumes of the two phases (1,3).
Distribution profiles of solutes are
constructed manually by plotting solute
concentration, c, against the number of
transfers, r, or tube location. If we assume
a Gaussian distribution (see Figure 1), the
number of theoretical plates of a CCD
run can be approximated using
N ∝ rK [2]
with a standard deviation defined by
σ = √rpq [3]
where p and q are the respective sol-
ute fractions in the two immiscible
phases at equilibrium. (By convention,
p is the solute fraction in the upper
compartment or mobile phase and q
is the solute fraction in the lower com-
partment or stationary phase). We can
now see that the chromatographic
theory, including peak broadening, is
beginning to take shape.
Martin and Synge’s
Contributions to LC Theories
Martin and Synge sought to improve
upon CCD extractions with a paradigm
shift by inventing partition chromatog-
raphy, a technique that uses a liquid
stationary phase. Their experiments con-
sisted of using LC columns packed with
an adsorbent coated with an immiscible
liquid phase. (In addition, paper chroma-
Howard G. Barth
This month’s “Chromatography Fundamentals” is a continuation of the development of the theoretical plate concept,
with emphasis on its significance, properties, and uses as applied to liquid chromatography.
Chromatography Fundamentals, Part V:Theoretical Plates: Significance, Properties, and Uses

WWW.CHROMATOGRAPHYONLINE.COM NOVEMBER 2018 LCGC NORTH AMERICA VOLUME 36 NUMBER 11 831
tography was also introduced by these
Nobel laureates.)
They made the following assumptions,
which are universally valid for chromato-
graphic techniques (4,5):
1. Separation is uniform throughout a
chromatographic column.
2. A column can be divided into equal
lengths, stages, or segments.
3. Within each stage, there is sufficient
time for equilibrium to be reached,
as solutes partition between mobile
and stationary phases.
4. Solutes are sufficiently dilute so that
their retention characteristics, i.e.,
thermodynamic properties, are inde-
pendent of one another.
5. When applied to LC (or GC), each
stage approximates one theoretical
plate.
6. The number of theoretical plates
generated by a solute can be calcu-
lated by representing each peak as a
Gaussian distribution.
7. Each theoretical plate is considered to
be a discrete site (a nano-size separa-
tory funnel, if you wish), in which sol-
utes distribute between two phases.
8. After equilibrium, solute is carried
by the mobile phase to the next
theoretical plate and the process
repeated until components emerge
from the column with characteristic
retention times and peak widths, as
described by a Gaussian distribution.
Martin and Synge published two experi-
mental methods for determining the num-
ber of theoretical plates of an LC peak (4).
Method 1
A Gaussian distribution was used to
describe solute concentration as a func-
tion of retention time t, where tr is peak
maximum, σ is the standard deviation,
and x = t − tr:
2π)e c = (1/√ −1/2 (x2/σ2) [4]
Based on this equation, the following
relationship was derived:
N = 2π (h2l2/A2) [5]
Inflection Point
0.5 h
0.607 h
h
Injection
W = 4
W1/2
2
tr , V
r , or d
FIGURE 1: Gaussian chromatographic peak indicating different methods of measuring theoretical plates. Refer to Table I and equations 6, 12 to 15.
Learn more about SiliaFast™ FaPEx®: ■ Visit: www.silicycle.com/fapex
■ Contact us: [email protected]
C E R T I F I É E I S O 9 0 01 : 2 015 C E R T I F I E D
www.silicycle.com
Unique on the market
Up to 120 X faster than existing methods
Simple
Wide spectrum
Cost effective
SPEED UP YOUR PESTICIDE RESIDUE ANALYSIS
WITH SILIAFAST ™ FaPEx® CARTRIDGES
T
ECHNO
L
OGY
PA
TENTED

832 LCGC NORTH AMERICA VOLUME 36 NUMBER 11 NOVEMBER 2018 WWW.CHROMATOGRAPHYONLINE.COM
Here l is the distance from the point of
injection to the peak maximum, h is peak
height, and A is peak area.
Equation 5 can now be converted to
the iconic plate equation, where l is set
equal to retention time, tr, and area and
height are transformed into peak width in
units of time (4–11):
N = 16 (t
r )2
(wt)2
[6]
Provided that the peak is a Gaussian
distribution, equations 5 and 6 are equiv-
alent.
Method 2
The second approach used was to
compare LC to CCD extractions. Since
r is equal to one transfer in a CCD
analysis, or by definition, r = n, equation
3 can be written as
rpq ∝ nσ = √ √ [7a]
We know that n is a single plate, i.e.,
n = N, thus equation 7a, becomes
rpq ∝ σ = √ n ∝ N √ √ [7b]
As previously shown (1), after r trans-
fers, the CCD tube that contains the max-
imum concentration of solute, μ, is given
by
μ = rp [8]
Since μ ∝ tr and from equation 2 we know
that r ∝ N, equation 8 can be recast as
tr ∝ N [9]
Taking the ratio of equations 9 and 7b,
we obtain
√
tr N
N=σ
[10]
Squaring numerator and denominator,
N2
NN= =
(tr )2
σ2
[11]
Letting time be the unit of measurement,
wt=4σt, we obtain the expected result,
N =(t
r)2
(wt/4)2
= 16(t
r)2
(wt)2
[12]
which is identical to equation 6. This clas-
sical equation not only allowed separa-
tion efficiency to be compared among
columns, but also was key for optimiz-
ing LC experimental parameters, as
described below.
Theoretical Plate Representations
Retention and peak width in equation
6 can be adjusted to accommodate the
types of measurements being made.
Thus these values can be expressed in
terms of volume, by multiplying each
term by flow rate, F:
N =16(V
r)2
(wv)2
[13]
For researchers who still rely on strip-
chart recorders, or for estimating plates
from TLC or open columns (3), the follow-
ing equation can be used:
N = 16(d
r)2
(wd)2
[14]
where dr is either the peak maximum
distance on the strip chart or the migra-
tion distance of a solute band or TLC
spot, and wd is the baseline width.
Equations 5, 6, 13, and 14 are similar,
if not identical; however, plate calcula-
tions from planar chromatography and
open-column LC are estimates, since
solute zones are usually not Gaussian.
(Before online computers, peak widths
were calculated manually by drawing
tangents to the two slopes of a peak, as
seen in Figure 1.)
Occasionally, baseline widths may be
problematic to measure reliably because
of noise, drift, peak asymmetry, or the
presence of partially resolved peaks. A
common procedure to avoid these diffi-
culties is to measure peak widths higher
up the peak, as illustrated in Figure 1.
Thus, at one-half peak height, equation
15 is used:
TABLE I: Summary of different representations of calculating theoretical plates from LCdata. Refer to Figure 1.
Eqn Relationship Applicability
6 N = 16N(t
r)
rr2
(wt)2
Commonly used plate equation with units of time.
12 N = 16N(V
r)
rr2
(wv)2
Use when retention volume is required, e.g., SEC.
14 N = 16N(d
r)
rr2
(wd
w )2Use with planar or open-column chromatography.
15 N = 5.54N(t
r)
rr2
(w1/2
)2
Use for asymmetric, skewed, or partiallyresolved peaks; w is measured at 0.5 x ht.w
16 N =N 4(t
r)2
(w2
wwσ)2
Alternative to eqn 14: w is measured between wpeak infl ection points at 0.607 x peak height.
tr, retention time.rr
wt
w = 4σt, peak width in units of time.
Vr,
V retention volume.
wv
= 4σv, peak width in units of volume.
dr, distance of peak maximum.rr
wd
w = 4σd, peak width in units of length.
w½
ww = 2.35σt, peak width at one-half peak height in time units.
w2
wwσ
= 2σt, peak width at 2σ in time units.
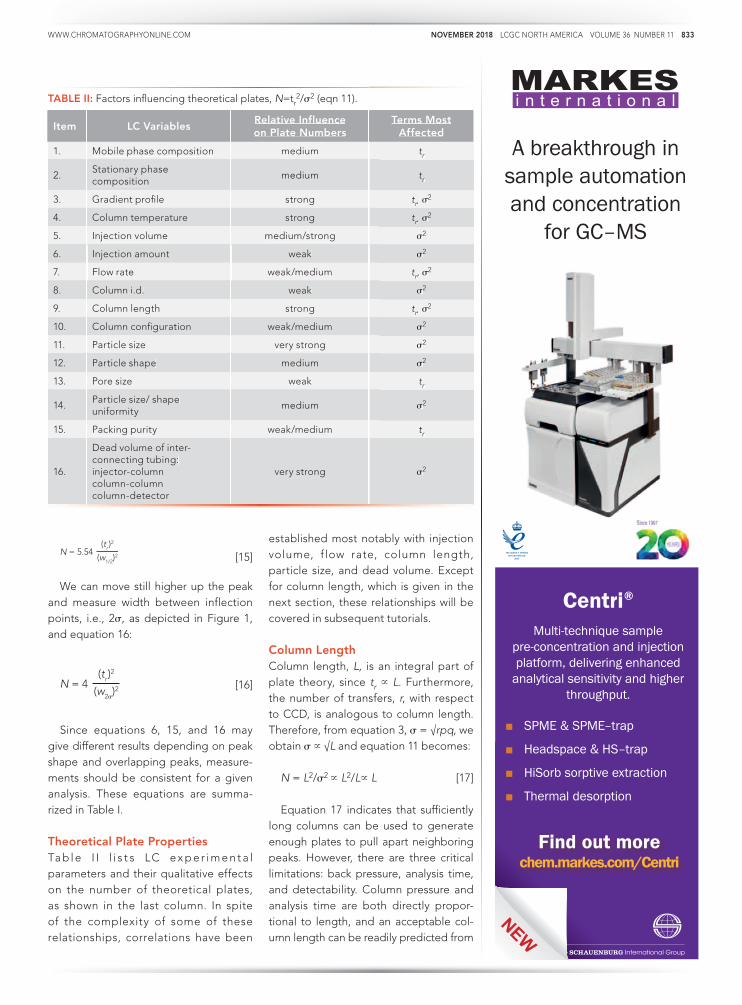
WWW.CHROMATOGRAPHYONLINE.COM NOVEMBER 2018 LCGC NORTH AMERICA VOLUME 36 NUMBER 11 833
N = 5.54(t
r)2
(w1/2
)2
[15]
We can move still higher up the peak
and measure width between inflection
points, i.e., 2σ, as depicted in Figure 1,
and equation 16:
N = 4(t
r)2
(w2σ
)2
[16]
Since equations 6, 15, and 16 may
give different results depending on peak
shape and overlapping peaks, measure-
ments should be consistent for a given
analysis. These equations are summa-
rized in Table I.
Theoretical Plate Properties
Ta b l e I I l i s t s LC ex p e r i m e n t a l
parameters and their qualitative effects
on the number of theoretical plates,
as shown in the last column. In spite
of the complexity of some of these
relationships, correlations have been
established most notably with injection
volume, f low rate, column length,
particle size, and dead volume. Except
for column length, which is given in the
next section, these relationships will be
covered in subsequent tutorials.
Column Length
Column length, L, is an integral part of
plate theory, since tr ∝ L. Furthermore,
the number of transfers, r, with respect
to CCD, is analogous to column length.
Therefore, from equation 3, σ = √rpq, we
obtain σ ∝ √L and equation 11 becomes:
N = L2/σ2 ∝ L2/L∝ L [17]
Equation 17 indicates that sufficiently
long columns can be used to generate
enough plates to pull apart neighboring
peaks. However, there are three critical
limitations: back pressure, analysis time,
and detectability. Column pressure and
analysis time are both directly propor-
tional to length, and an acceptable col-
umn length can be readily predicted from
TABLE II: Factors infl uencing theoretical plates, N=tr2/σ2 (eqn 11).
Item LC VariablesRelative Influenceon Plate Numbers
Terms Most Affected
1. Mobile phase composition medium tr
2.Stationary phasecomposition
medium tr
3. Gradient profi le strong tr,rr σ2
4. Column temperature strong tr,rr σ2
5. Injection volume medium/strong σ2
6. Injection amount weak σ2
7. Flow rate weak/medium tr, σ2
8. Column i.d. weak σ2
9. Column length strong tr,rr σ2
10. Column confi guration weak/medium σ2
11. Particle size very strong σ2
12. Particle shape medium σ2
13. Pore size weak tr
14.Particle size/ shapeuniformity
medium σ2
15. Packing purity weak/medium tr
16.
Dead volume of inter-connecting tubing: injector-columncolumn-columncolumn-detector
very strong σ2
A breakthrough in
sample automation
and concentration
for GC–MS
NEW
Centri ®
Multi-technique sample
pre-concentration and injection
platform, delivering enhanced
analytical sensitivity and higher
throughput.
ɵ SPME & SPME–trap
ɵ Headspace & HS–trap
ɵ HiSorb sorptive extraction
ɵ Thermal desorption
Find out more chem.markes.com/Centri

834 LCGC NORTH AMERICA VOLUME 36 NUMBER 11 NOVEMBER 2018 WWW.CHROMATOGRAPHYONLINE.COM
a single measurement using any conve-
nient column length.
As column length increases, peaks
broaden with a corresponding decreased
detector response, defined by equation
4. Decreased detector response, however,
will also affect signal-to-noise ratio, limiting
detection of trace or minor components.
Plate Height
An essential relationship derived
from theoretical plates is plate height or
height equivalent of a theoretical plate,
HETP (see equation 1). Martin and Synge
referred to it as plate “thickness”, in
which the “thicker” or wider the plate, the
lower the separation efficiency. They pro-
posed that plate thickness corresponded
to the depth of the stationary phase and
reasoned correctly that column efficiency
could be improved by decreasing this
layer or increasing the rate of transfer of
solute molecules during partitioning.
Equation 1 can also be expressed dif-
ferently by letting N = L2/σ2:
H = L/N = Lσ2/L2 = σ2/L [18]
Plate height now becomes peak vari-
ance per unit column length, a rela-
tionship used for studying column and
packing properties that govern peak
broadening, as discussed in part VI.
Chromatographic Resolution
Another critical relationship is the reso-
lution, Rs, between adjacent peaks,
Rs = (x2-x1)/4σ = 6x/4σ [19}
where ∆x is the distance between two
peak maxima, and σ is the average stan-
dard deviation of two adjacent peaks,
which we assume are Gaussian. A value
of ≥ 1.5 is required for baseline resolution
of two peaks of equal areas.
Resolution can be related to column
length by considering the behavior of
peaks during elution. As two adjacent
peaks travel through a column, peak max-
ima move apart, according to
Δx ∝ L [20]
Peak dispersion or width, however,
also increases, but not as fast. The rela-
tionship between peak width and column
length becomes apparent by rearranging
equation 18:
σ = (LH)½ [21]
Since H is constant for a given column,
σ ∝ L½ [22]
the resolution equation now can be
expressed as
Rs=∆x/4σ ∝ L/L½ ∝ L½ [23]
Based on this relationship, resolution
will increase by only 40%, each time col-
umn length is doubled. Furthermore, if
we wanted to double resolution, column
length would have to be increased by a
factor of four. The resolution equation will
be examined in more detail in a subse-
quent article of this series.
Theoretical Plates: Range
and Limitations
It is instructive to estimate the minimum
plate count of low-resolution chromato-
graphic methods, like paper, thin-layer, or
open-column chromatography. We can
assume a worst-case scenario in which
a solute tails from the point of applica-
tion to its final resting place. If we let x
be the distance from sample application
to the middle of a sample spot (splotch)
or tailed band, then σ ≈ ½x. The approxi-
mate plate count is N = x2/σ2 ≈ 4. Indeed,
the typical plate count of open columns
seldom exceed 102. Even with these
extraordinarily low plate counts, by mod-
ern standards, these methods were highly
praised for their separation abilities.
Modern, high efficiency columns,
by comparison, can typically range
TABLE III: Application of theoretical plates for selecting and maintaining high columnperformance.
Application Procedure Comments
Column selection
Choose column withrequired N.
Procedure for calculating required N is Ndescribed by resolution equation.b
Column installation
Compare N with listed value.NN should be within range of list-Ned value, if not, reinstall column.
Column comparisons
Compare N vs. mL/min plots Namong potential columns.a
Select column with shallowest slope.
Column stability
Plot N vs. wks of usageNChange column when plate loss reaches
10-20% or if Rs becomes unacceptably low.
a. A more meaningful plot is H vs. linear velocity, see Chromatography Fundamentals, Part VIII.H
b. Chromatography Fundamentals, Part VIII of this series.
TABLE IV: Using theoretical plates to optimize experimental LC conditions.
Experimental Variables
Data Analysis Optimum Value
InjectionVolume
Plot N vs. μN L: plates will be-gin to decrease with increas-
ing injection volume.
Select injection volume within region giving maximum plates,
maintaining adequate s/n.
Sample Con-centration
Plot N vs. N mg/mL: plates will begin to decrease with increas-
ing injection concentration.
Select concentration within region giving maximum plates,
maintaining adequate s/n.
Flow RatePlot N vs. N mL/min: plates will slowly decrease with increasing fl ow rate.
Select fl ow rate to achieve maximum N maintaining Nadequate analysis time.
Column Temperature
Plot N vs. °C: plates will in-Ncrease with temperature.
Select temperature at max allowable value without sac-rifi cing safety or resolution.

WWW.CHROMATOGRAPHYONLINE.COM NOVEMBER 2018 LCGC NORTH AMERICA VOLUME 36 NUMBER 11 835
between 104 to less than 105 plates per
column, depending, of course, on col-
umn length. In theory, there is no upper
plate limit, since we can always con-
struct longer columns.
Suppliers sometimes advertise col-
umns based of plates per meter, which
can be misleading since actual column
lengths are significantly shorter. In order
to compare columns, it is best to choose
columns based on actual plates per col-
umn length; for column comparisons,
plate height is preferred, which is inde-
pendent of column length.
Recall that LC plate theory was devel-
oped by assuming Gaussian peak distri-
butions: for non-Gaussian peaks, such as
skewed or tailed shapes, the plate con-
cept is no longer applicable, and plate
counts are usually underestimated, unless
peak width is measured at 50% or 60.7%
of peak height (equations 15 and 16).
Furthermore, plate theory is also based
on the assumption that chromatographic
conditions remain constant throughout
the analysis and that equilibrium has
been reached.
When gradient elution or temperature
programming is applied, equilibrium
may not be attained. In addition, reten-
tion times are dictated by the gradient
profile. As a result, strongly retained
peaks can remain stationary during
part of the gradient and elute at con-
siderably long times with compressed
peak widths, producing artificially high
plate counts. Under these conditions,
the physical significance of theoretical
plates is lost.
Theoretical Plates: Applications
Theoretical plate measurements of
unretained solutes are typically used
in the development and maintenance
of LC methods, as described below
and summarized in Tables III and
IV. Unretained solutes ref lec t the
un i fo r mi t y o f the pac ked bed,
packing particle size, mobile phase
hydrodynamic s , so lu te d i f fus ion
coefficient in the mobile phase, and
extracolumn effects. In addition to
these effects, retained solutes also
probe stationary phase characteristics,
such as its thickness and homogeneity,
and the diffusion coefficients of solutes
within the stationary phase. In this
section, only unretained solutes are
considered for column evaluation, since
they will produce higher plate counts
than retained components, thus are
more sensitive probes.
Most LC peaks have profiles that devi-
ate from Gaussian distributions and are
not strictly symmetrical; consequently,
there will be errors associated with base-
line width measurements. In view of this
imprecision, only two significant figures
are justified for reporting plate counts.
A summary of theoretical plate
applications is outlined below and in
Tables III and IV.
Getting Started with Plates
Based on preliminary analytical runs,
the required number of plates to
effect a separation are estimated; this
procedure will be described in part VII.
With this value, an appropriate column
of required plates can be selected.
After a new column is installed, the
plate number is checked against the sup-
plier’s value to ensure that the column
was correctly plumbed into the LC sys-
tem.
Experimental parameters, such as
injection volume, solute concentration,
flow rate, and column temperature, are
then optimized for maximum plate count.
Column performance typically will dete-
riorate with time, as a result of buildup of
particulates or contaminants, disruption
of packing uniformity, dissolution of silica
packing, loss of bonded phase, or surface
oxidation. Column fidelity is ascertained
by monitoring separation attributes, such
as plate count, solute retention time, and
resolution on a routine basis.
Conclusions
The number of theoretical plates, which
forms the basis of chromatographic
theory, is a key parameter used in
all modes of chromatography for
measuring column ef ficiency. It is
simply the ratio of retention squared
to peak variance, a relationship first
realized by Martin and Synge.
When column length is normalized
with respect to plate number, we obtain
a new parameter, the plate height, which
is a measure of the amount of peak
broadening that occurs when solute trav-
els through a defined length of column.
Solute emerges as a Gaussian distribu-
tion carrying information regarding sol-
ute and column characteristics, as well as
experimental conditions.
Plate number and height are used
to develop and optimize chromato-
graphic methods, details of which will
be presented in subsequent articles
of this series on the fundamentals of
chromatography.
Our next tutorial will review the prop-
erties of the Gaussian distribution with
emphasis on peak variance and its effect
on chromatographic resolution.
References (1) H.G. Barth, LCGC North Am. 36(8),
532–535 (2018).(2) E.W. Berg, Physical and Chemical
Methods of Separation (McGraw-Hill, NY, 1963).
(3) H.G. Barth, LCGC North Am. 36(3), 200-203 (2018).
(4) R J. Magee, Selected Readings in Chromatography (Pergamon Press, Oxford, UK, 1970).
(5) A.J.P. Martin and R.L.M. Synge, Biochem. J., 35, 1359 (1941).
(6) R.L. Grob, Chpt. 2, In: R.L. Grob, Ed., Modern Practice of Gas Chromatography, 2nd ed. (Wiley-Interscience, New York, 1985), pp. 49–114.
(7) S.G. Weber and P.W. Carr, Chpt. 1, In: P.R. Brown and R.A. Hartwick, Eds., High Performance Liquid Chromatography (Wiley-Interscience, New York, 1989), pp. 1–115.
(8) J.C. Giddings, Unified Separation Theory (Wiley-Interscience, New York, 1991).
(9) B.L. Karger, L.R. Snyder, and C. Horvath, An Introduction to Separation Science (Wiley-Interscience, New York, 1973).
(10) P.A. Bristow, Liquid Chromatography in Practice (Handforth, Cheshire, UK, 1976).
(11) L.R. Snyder, J.J. Kirkland, and J.W. Dolan, Introduction to Modern Liquid Chromatography (Wiley, New York, 3rd ed., 2010).
Howard G. Barthis with Analytical Chemistry Consul-tants, Ltd. in Wilmington, Delaware. Direct correspondence to: [email protected]

836 LCGC NORTH AMERICA VOLUME 36 NUMBER 11 NOVEMBER 2018 WWW.CHROMATOGRAPHYONLINE.COM
PRODUCTS & RESOURCES Reference materialsLGC Standards’ reference materials
are designed for food, beverage, and
environmental analysis. According
to the company, the materials
include those for cannabis, allergens,
veterinary drugs, pesticides, dyes,
toxins, and other organic materials.
LGC Standards,
Manchester, NH. www.lgcstandards.com
Multitechnique sample preparation systemMarkes’ Centri multitechnique system
is designed for sample automation and
concentration for gas chromatography–
mass spectrometry. According to the
company, four sampling modes are
available: HiSorb high capacity sorptive
extraction, headspace, solidphase
microextraction, and thermal desorption.
Markes International,
Llantrisant, UK.chem.markes.com/Centri
Custom HPLC columnsCustom HPLC col-
umns from Hamilton
can be packed with
any of the company’s
stationary phases in
various hardware for-
mats. According to the
company, the stationary
phases are available in
various particle sizes.
Hamilton Company,
Reno, NV. www.hamiltoncompany.com
ColumnsTosoh’s TSKgel PWXL-CP
columns are designed for the
analysis of water-soluble cationic
polymers by size-exclusion chro-
matography. According to the
company, the column packing
material incorporates a cationic
functionality on the surface of
the particles to prevent ionic
adsorption of the polymers.
Tosoh Bioscience, LLC,
King of Prussia, PA.www.tosohbioscience.com
GC mass spectrometersShimadzu’s GCMS NX series of
gas chromatograph (GC)–mass
spectrometers is designed
using the company’s latest Nexis
GC-2030 as the GC unit, which is
equipped with a next generation
flow controller that enables con-
trol and accommodates a variety
of applications. According to the
company, the systems include fea-
tures to facilitate maintenance and
to improve operating efficiency by reducing standby time. Shimadzu
Scientific Instruments, Columbia, MD. www.ssi.shimadzu.com
LC accessoriesAccessories from Restek are
designed for use in liquid chro-
matography analysis. According
to the company, products include
bottle top inlet valves, outlet
valves, couplers, fittings, unions,
tees and crosses, PEEK stainless
steel tubing, mobile-phase main-
tenance and safety products, bot-
tle tops, valves, filters, spargers,
replacement parts, and supplies.
Restek Corporation,
Bellefonte, PA. www.restek.com
Storage rackMacherey-Nagel’s
chemically resistant
foam storage rack
is designed for the
proper organization and
protection of crimping
tools. According to
the company, the
storage rack is part of
its range of vials, caps,
and chromatography
accessories.
Macherey-Nagel Inc., Bethlehem, PA. www.mn-net.com
Thin film solid-phase microextractionGerstel’s thin-film solid-phase microex-
traction device is a 20 x 4 mm carbon
mesh sheet impregnated with sorptive
phase, designed to be placed inside
a sample vial for analyte extraction
from the headspace or liquid phase.
According to the company, the large
surface area, wide polarity range, and
phase volume result in faster extraction
and improved analyte recovery.
Gerstel,
Linthicum, MD.
www.gerstelus.com

WWW.CHROMATOGRAPHYONLINE.COM NOVEMBER 2018 LCGC NORTH AMERICA VOLUME 36 NUMBER 11 837
Ad IndexADVERTISER PAGE ADVERTISER PAGE
Separation systemThe Eclipse DualTech separation
system from Wyatt Technology
is designed for both hollow-fi-
ber flow field-flow fractionation
(HF5) and asymmetric-flow
field-flow fractionation (AF4)
techniques. According to the
company, both techniques may
be integrated into one instru-
ment and coupled to the company’s DAWN HELEOS II detector.
Wyatt Technology Corp., Santa Barbara, CA. www.wyatt.com
SyringesVICI Precision Sampling Pressure-
Lok analytical syringes are made
with polytetrafluoroethylene
(PTFE) plunger tips. According
to the company, the tips are
designed to remain smooth,
without the seizing or residue
of conventional metal plunges,
and have leak-proof seals.
Valco Instruments Co., Inc.,
Houston, TX.www.vici.com
GC columnThe Quadrex 007-65HT GC
column is designed for the
analysis of highmolecular-weight
triglycerides in edible oils via high-
temperature gas chromatography.
According to the company, the
polar high-temperature column
can withstand temperatures up to
365 °C while achieving separation
of the individual triglycerides.
Quadrex Corporation,
Woodbridge, CT.www.quadrexcorp.com
Fixed-ratio flow splittersMott’s PerfecPeak fixed flow
splitters are designed to pro-
vide improved peak resolution
and accurate splitting with a
fingertight design. According to
the company, the design allows
for low internal volume, and the
splitters are equipped with
interchangeable splits and a
0.1-μm replaceable prefilter.
Mott Corporation,
Farmington, CT.www.mottcorp.com
Cornerstone Scientific. . . . . . . . . . . . . . . . . . . 807a, b
Gerstel GmbH & Co. KG. . . . . . . . . . . . . . . . . . . 793
Hamilton Company . . . . . . . . . . . . . . . . . . . . . 797
LGC Standards . . . . . . . . . . . . . . . . . . . . . . . . 821
Macherey-Nagel GmbH & Co. KG . . . . . . . . . . . . . 789
Markes International Ltd. . . . . . . . . . . . . . . . . . . 833
Merck Millipore. . . . . . . . . . . . . . . . . . . . . . . . 813
MilliporeSigma . . . . . . . . . . . . . . . . . . CV2, 803, 812
Mott Corporation . . . . . . . . . . . . . . . . . . . . . . 799
Optimize Technologies . . . . . . . . . . . . . . . . . . . 817
Parker Balston, Inc. . . . . . . . . . . . . . . . . . . . . . . 815
PharmaFluidics . . . . . . . . . . . . . . . . . . . . . 826–827
Pickering Laboratories . . . . . . . . . . . . . . . . . . . . 801
PITTCON. . . . . . . . . . . . . . . . . . . . . . . . . . . . 823
Restek Corporation. . . . . . . . . . . . . . . . . . . . . . 792
Shimadzu Scientific Instruments. . . . . . . . . . . . . . . CV4
Showa Denko America, Inc.. . . . . . . . . . . . . . . . . . 787
Silicycle, Inc. . . . . . . . . . . . . . . . . . . . . . . . . . 831
Sonntek, Inc.. . . . . . . . . . . . . . . . . . . . . . . . . . 809
Tosoh Bioscience. . . . . . . . . . . . . . . . . . . . . . . 819
VICI Harbor Group. . . . . . . . . . . . . . . . . . . . . . 791
Wyatt Technology Corporation . . . . . . . . . . . . . . . 795

THE ESSENTIALSE xcerpts f rom LCGC’s p ro fess iona l
deve lopment p la t form, CHROMacademy.com
HPLC Column Maintenance:
Tips for Extending HPLC Column Lifetime
While the relative cost of HPLC
columns has been reduced
over time, extending column lifetime
remains an important consideration
for most laboratories. The following
tips should help to protect your col-
umns and significantly extend the use-
ful lifetime of most phases.
Always read the manufacturer’s litera-
ture with respect to the recommended
pressure, eluent pH and temperature
operating ranges for the column, and
stick to these ranges.
Note that higher operating temperatures
often go hand in hand with reduced pH
operating ranges. At low pH, the main
symptom of column degradation is typ-
ically loss of efficiency (peak broaden-
ing) and at high pH, peak tailing and an
increase in column back pressure.
Avoid mechanical shock of the column
bed, such as dropping the column, and
ramp the pressure or flow slowly (1 mL/
min/min is ideal) each time eluent flow
is initiated.
Most modern HPLC equipment is capa-
ble of achieving this flow or pressure
ramp automatically through secondary
instrument settings. Bed voiding due
to pressure shock often manifests itself
via split or very badly tailing peaks. Col-
umns may be reversed for analysis if a
replacement is not readily available;
however, the efficiency of the column
is likely to reduce much more quickly
as the bed will ultimately slump in the
opposite direction, leading to the same
chromatographic symptoms.
If columns have dried out, initiate
the flow very slowly (0.1 mL/min/min)
using an eluent containing at least
50% acetonitrile.
If a “standard” (non “aq” or non-polar
embedded phase type) reversed-phase col-
umn is suspected of phase collapse (short-
ening retention times, poor efficiency) due
to use with 100% aqueous mobile phases,
the column should be reactivated at high
flow with 100% acetonitrile at 60 oC (take
care to not precipitate any solid buffers from
the eluent remaining within the column). In
both of these cases, between 50 and 100
column volumes may be required to prop-
erly re-equilibrate or re-activate the phase.
Columns should be properly washed
after each use.
A recommended washing routine may be:
• Current content to 90% acetonitrile at
10% organic per 2 column volumes and
hold for 10 column volumes (again take
care to avoid precipitation of solid buffers
by ramping the acetonitrile concentra-
tion slowly, as recommended here).
• 10% acetonitrile per 2 column volumes to
50:50 acetonitrile:water and hold for 10
column volumes.
• Remove from the system, end cap and
store. End capping of the column is very
important to avoid the phase drying out.
One might use an older HPLC system as
a column “wash station,” which can save
significant amounts of operating time on
“live” instruments.
If samples are likely to contain partic-
ulate matter, choose a good quality
inline filter with the appropriate mesh
size; 0.45 μm for traditional columns and
0.2 μm for UHPLC columns is typical.
If the sample matrix or diluent is likely to
harm the sorbent (due to pH, for exam-
ple) or is particularly chemically dirty or
intractable, a guard column may be used,
and the phase should be matched with
that of the analytical column. Take great
care when selecting the dimensions of the
guard column and connecting to the ana-
lytical column to ensure that the efficiency
of the separation is not compromised.
If column or frit contamination is sus-
pected due to peak splitting or loss of
efficiency, it is possible to reverse the
direction of the column for back flush-
ing purposes, and the column washing
procedure mentioned above is a good
“recipe” for this purpose.
One should uncouple the column from
the detector to avoid fouling, and note
that reversal for flushing should only be
used as a matter of last resort, and that
the original efficiency of the column may
not be achieved.
Remember that column volume may
be estimated using π x r2 x L x 0.6
(the approximate interstitial poros-
ity of silica used for HPLC column
packing materials).
So, for a 150 x 4.6 mm column, this would
approximate to:
3.142 x (2.3)2 x 150 x 0.6 = 1.496 μL or ~1.5
mL
These tips will help extend your column life-
times.
838 LCGC NORTH AMERICA VOLUME 36 NUMBER 11 NOVEMBER 2018 WWW.CHROMATOGRAPHYONLINE.COM
FIND THIS, AND OTHER WEBCASTS, AT
www.CHROMacademy.com/Essentials
(free until December 20).
MORE ONLINE:

Agilent Technologies is offering five years complimentary access to
CHROMacademy for all university students and staff.
CHROMacademy is an intuitive, comprehensive e-learning and trouble-
shooting platform with more than 3,000 pages of content for HPLC,
GC, sample preparation, and hyphenated techniques. No other online
resource offers separation scientists more live streaming events, a
knowledge base, practical solutions, and new technologies in one easy
to navigate website.
Get your free five year membership worth US $1,995* by submitting the
form at www.chromacademy.com/agilent.
* Five years free access to CHROMacademy only available to customers affiliated with an academic
or research institution, conditions apply. A valid university e-mail address if required.
© Agilent Technologies, Inc. 2017
FREECHROMACADEMY MEMBERSHIP

ProviFKng the Ultimate Balance of High-Level Performance and Ease-of-Use in an Integrated HPLC
Prominence-i
Most Trusted Name in LC
Nexera-i
Order consumables and accessories on-line at http://store.shimadzu.comShimadzu Scientific Instruments Inc., 7102 Riverwood Dr., Columbia, MD 21046, USA
Ideal for both R&D and QC environments, the i-Series Plus
emerges in response to your requests for design evolution.
Every i-Series has a touch-screen LCD display for easy, in-
tuitive system control and chromatogram viewing, built-in
degassing, quaternary solvent delivery, autosampler, and
UV or PDA detector. As always, sample injections are the
fastest around (< 14 s), with ultra-low carryover.
Learn more about Shimadzu’s i-Series Plus.
Call (800) 477-1227 or visit us online at
www.ssi.shimadzu.com/iseries
You asked for it, you got it. The
i-Series Plus offers everything you
need in an integrated HPLC:
X Automate sample dilution and reagent/
internal standard addition
X Store up to three 350mm LC columns
X Choose the analysis flow path with
convenient software control
X Add a refractive index or fluorescence
detector
X Achieve wider linear range and
repeatability for the smallest injected
volumes of 1 μL or less