Embed Size (px)
Citation preview
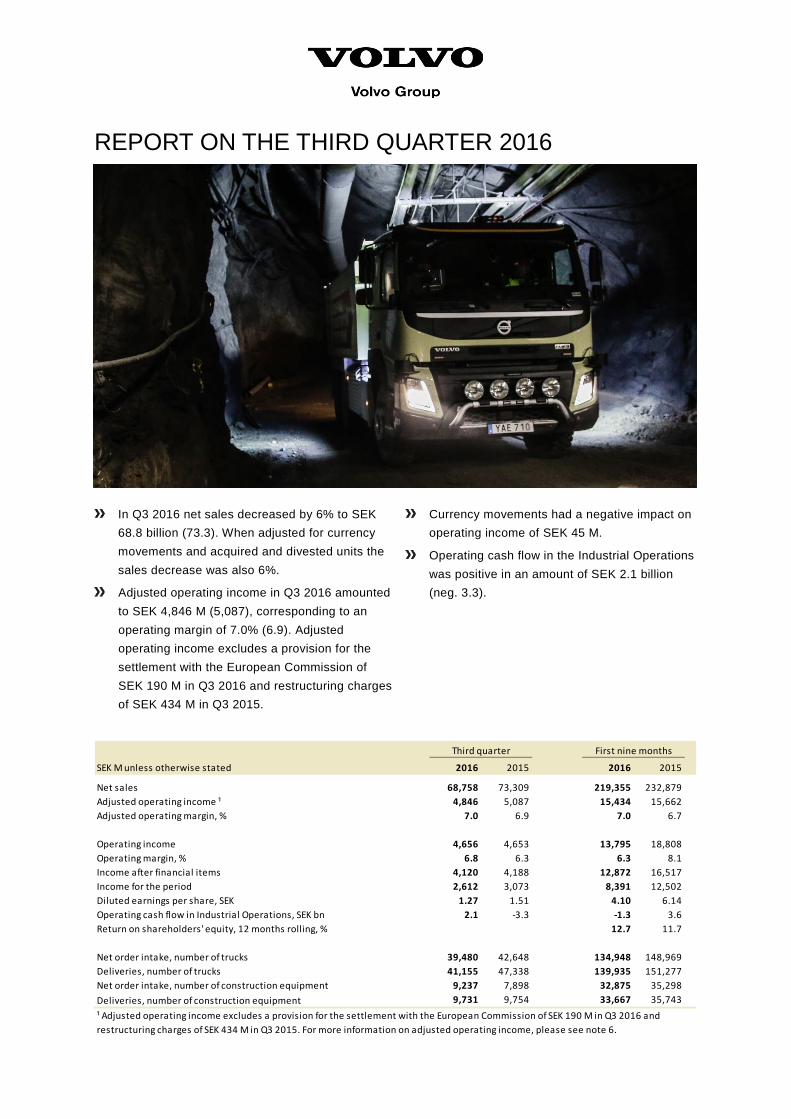
REPORT ON THE THIRD QUARTER 2016
In Q3 2016 net sales decreased by 6% to SEK 68.8 billion (73.3). When adjusted for currency movements and acquired and divested units the sales decrease was also 6%.
Adjusted operating income in Q3 2016 amounted to SEK 4,846 M (5,087), corresponding to an operating margin of 7.0% (6.9). Adjusted operating income excludes a provision for the settlement with the European Commission of SEK 190 M in Q3 2016 and restructuring charges of SEK 434 M in Q3 2015.
Currency movements had a negative impact on operating income of SEK 45 M.
Operating cash flow in the Industrial Operations was positive in an amount of SEK 2.1 billion (neg. 3.3).
SEK M unless otherwise stated 2016 2015 2016 2015
Net sales 68,758 73,309 219,355 232,879Adjusted operating income ¹ 4,846 5,087 15,434 15,662Adjusted operating margin, % 7.0 6.9 7.0 6.7
Operating income 4,656 4,653 13,795 18,808Operating margin, % 6.8 6.3 6.3 8.1Income after financial items 4,120 4,188 12,872 16,517Income for the period 2,612 3,073 8,391 12,502Diluted earnings per share, SEK 1.27 1.51 4.10 6.14Operating cash flow in Industrial Operations, SEK bn 2.1 -3.3 -1.3 3.6Return on shareholders' equity, 12 months rolling, % 12.7 11.7
Net order intake, number of trucks 39,480 42,648 134,948 148,969Deliveries, number of trucks 41,155 47,338 139,935 151,277Net order intake, number of construction equipment 9,237 7,898 32,875 35,298Deliveries, number of construction equipment 9,731 9,754 33,667 35,743¹ Adjusted operating income excludes a provision for the settlement with the European Commission of SEK 190 M in Q3 2016 and restructuring charges of SEK 434 M in Q3 2015. For more information on adjusted operating income, please see note 6.
Third quarter First nine months

2 Report on the third quarter 2016
CEO’S COMMENTS
Maintained margins despite declining sales – continuous improvements and cost control in focus In the third quarter, profitability improved slightly as better underlying performance offset the impact from lower volumes. Sales decreased by 6% to SEK 69 billion. The adjusted operating income amounted to SEK 4.8 billion, corresponding to an operating margin of 7.0% due to a positive cost development and a strong European truck market. Volumes in our truck business were down in all markets except Europe where activity remained high. Total deliveries of trucks decreased by 13%. The downward correction in the North American market continued and there is still a need to take down dealer inventories. Production volumes have gradually been adjusted downwards to meet the lower demand and further steps will be taken. Expectations of unit growth in other truck markets are limited and therefore focus will be on the service business and continuous improvements. The truck business continued to improve its profitability and the adjusted operating margin increased to 8.2% despite 13% lower volumes. In September, IAA, Europe’s leading trade show for transport and logistics took place. During the show, the Volvo FH was awarded first position in the prestigious Fehrenkötter-test, with victories in both fuel consumption and total cost of ownership. The multi-brand test stretches over 2.5 years in real-life customer operations and shows a leading position for Volvo FH in Euro 6-execution. During the quarter Volvo’s fully autonomous truck was the first in the world to be tested in operations deep underground in the Kristineberg Mine in Sweden. The self-driving truck is part of a development project aimed at improving the transport flow and safety in the mine. Volvo CE operates in a market with continued low demand. Deliveries are the same as last year’s third quarter but sales are down 3%. Operating margin improved slightly to 5.2% despite flat volumes and an un-favorable product mix. On the positive side orders increased slightly across all regions but from low levels in the BRIC regions. We see no immediate increase of demand and continue the internal work to focus on Volvo CE’s strongholds. During the quarter Volvo CE displayed a range of innovations such as a hybrid wheel
loader with the potential to improve fuel efficiency by up to 50% and autonomous wheel loader and hauler prototypes. Volvo Buses’ deliveries were down by 7% in the quarter and while the development was good in Europe, deliveries in Asia and South America declined. The profitability decreased slightly, impacted by negative currency development. Volvo Buses also had a successful week at IAA and showed several new features such as Volvo Dynamic Steering, which benefits the driver by facilitating the operation of the bus. In addition, the market leading range of sustainable public transport solutions attracted a lot of interest. Volvo Penta continues to have a good performance with a strong operating margin of 14.5%. This is largely due to a strong development in Europe and innovative products, giving Volvo Penta a competitive edge in the market. Volvo Financial Services is reinforcing activities to deliver bundled solutions to the customer. This is further leveraging VFS contribution to grow the Group’s service business. The credit portfolio continued to perform well and VFS had a return on equity of 13.3%. Given current market conditions we will continue to have strong focus on cost control and optimized utilization of our regional value-chains. The outlined strategy, with Brand and Business Area driven organizations with decentralized accountability, continues to develop according to expectations. The aim is to get even more customer-centric organizations by capturing the service potential, simplifying our business portfolios and driving efficiency and motivation through continuous improvements. Martin Lundstedt President and CEO
3 Report on the third quarter 2016
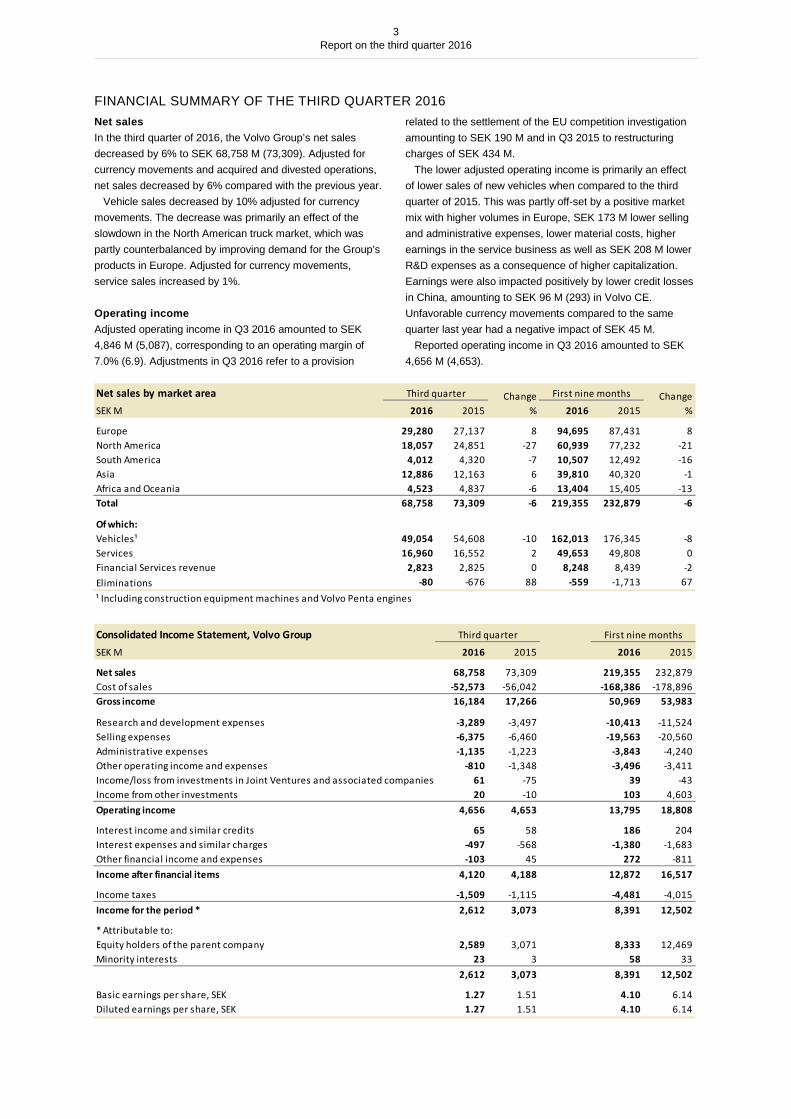
FINANCIAL SUMMARY OF THE THIRD QUARTER 2016Net sales In the third quarter of 2016, the Volvo Group’s net sales decreased by 6% to SEK 68,758 M (73,309). Adjusted for currency movements and acquired and divested operations, net sales decreased by 6% compared with the previous year. Vehicle sales decreased by 10% adjusted for currency movements. The decrease was primarily an effect of the slowdown in the North American truck market, which was partly counterbalanced by improving demand for the Group’s products in Europe. Adjusted for currency movements, service sales increased by 1%. Operating income Adjusted operating income in Q3 2016 amounted to SEK 4,846 M (5,087), corresponding to an operating margin of 7.0% (6.9). Adjustments in Q3 2016 refer to a provision
related to the settlement of the EU competition investigation amounting to SEK 190 M and in Q3 2015 to restructuring charges of SEK 434 M. The lower adjusted operating income is primarily an effect of lower sales of new vehicles when compared to the third quarter of 2015. This was partly off-set by a positive market mix with higher volumes in Europe, SEK 173 M lower selling and administrative expenses, lower material costs, higher earnings in the service business as well as SEK 208 M lower R&D expenses as a consequence of higher capitalization. Earnings were also impacted positively by lower credit losses in China, amounting to SEK 96 M (293) in Volvo CE. Unfavorable currency movements compared to the same quarter last year had a negative impact of SEK 45 M. Reported operating income in Q3 2016 amounted to SEK 4,656 M (4,653).
Net sales by market areaSEK M 2016 2015 2016 2015
Europe 29,280 27,137 8 94,695 87,431 8North America 18,057 24,851 -27 60,939 77,232 -21South America 4,012 4,320 -7 10,507 12,492 -16Asia 12,886 12,163 6 39,810 40,320 -1Africa and Oceania 4,523 4,837 -6 13,404 15,405 -13Total 68,758 73,309 -6 219,355 232,879 -6
Of which:Vehicles¹ 49,054 54,608 -10 162,013 176,345 -8Services 16,960 16,552 2 49,653 49,808 0Financial Services revenue 2,823 2,825 0 8,248 8,439 -2Eliminations -80 -676 88 -559 -1,713 67¹ Including construction equipment machines and Volvo Penta engines
Consolidated Income Statement, Volvo GroupSEK M 2016 2015 2016 2015
Net sales 68,758 73,309 219,355 232,879Cost of sales -52,573 -56,042 -168,386 -178,896Gross income 16,184 17,266 50,969 53,983
Research and development expenses -3,289 -3,497 -10,413 -11,524Selling expenses -6,375 -6,460 -19,563 -20,560Administrative expenses -1,135 -1,223 -3,843 -4,240Other operating income and expenses -810 -1,348 -3,496 -3,411Income/loss from investments in Joint Ventures and associated companies 61 -75 39 -43Income from other investments 20 -10 103 4,603Operating income 4,656 4,653 13,795 18,808
Interest income and similar credits 65 58 186 204Interest expenses and similar charges -497 -568 -1,380 -1,683Other financial income and expenses -103 45 272 -811Income after financial items 4,120 4,188 12,872 16,517
Income taxes -1,509 -1,115 -4,481 -4,015Income for the period * 2,612 3,073 8,391 12,502
* Attributable to:Equity holders of the parent company 2,589 3,071 8,333 12,469Minority interests 23 3 58 33 2,612 3,073 8,391 12,502
Basic earnings per share, SEK 1.27 1.51 4.10 6.14Diluted earnings per share, SEK 1.27 1.51 4.10 6.14
Third quarter First nine months
Third quarter First nine months Change%
Change%
4 Report on the third quarter 2016
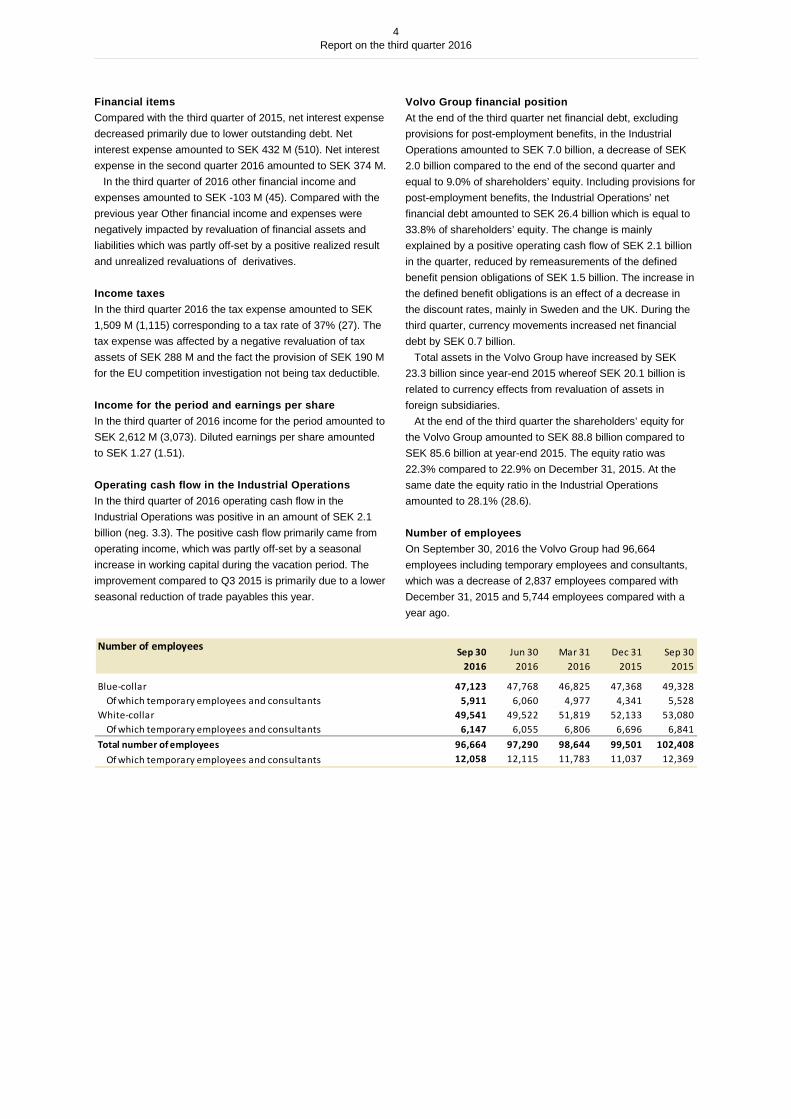
Financial items Compared with the third quarter of 2015, net interest expense decreased primarily due to lower outstanding debt. Net interest expense amounted to SEK 432 M (510). Net interest expense in the second quarter 2016 amounted to SEK 374 M. In the third quarter of 2016 other financial income and expenses amounted to SEK -103 M (45). Compared with the previous year Other financial income and expenses were negatively impacted by revaluation of financial assets and liabilities which was partly off-set by a positive realized result and unrealized revaluations of derivatives. Income taxes In the third quarter 2016 the tax expense amounted to SEK 1,509 M (1,115) corresponding to a tax rate of 37% (27). The tax expense was affected by a negative revaluation of tax assets of SEK 288 M and the fact the provision of SEK 190 M for the EU competition investigation not being tax deductible. Income for the period and earnings per share In the third quarter of 2016 income for the period amounted to SEK 2,612 M (3,073). Diluted earnings per share amounted to SEK 1.27 (1.51). Operating cash flow in the Industrial Operations In the third quarter of 2016 operating cash flow in the Industrial Operations was positive in an amount of SEK 2.1 billion (neg. 3.3). The positive cash flow primarily came from operating income, which was partly off-set by a seasonal increase in working capital during the vacation period. The improvement compared to Q3 2015 is primarily due to a lower seasonal reduction of trade payables this year.
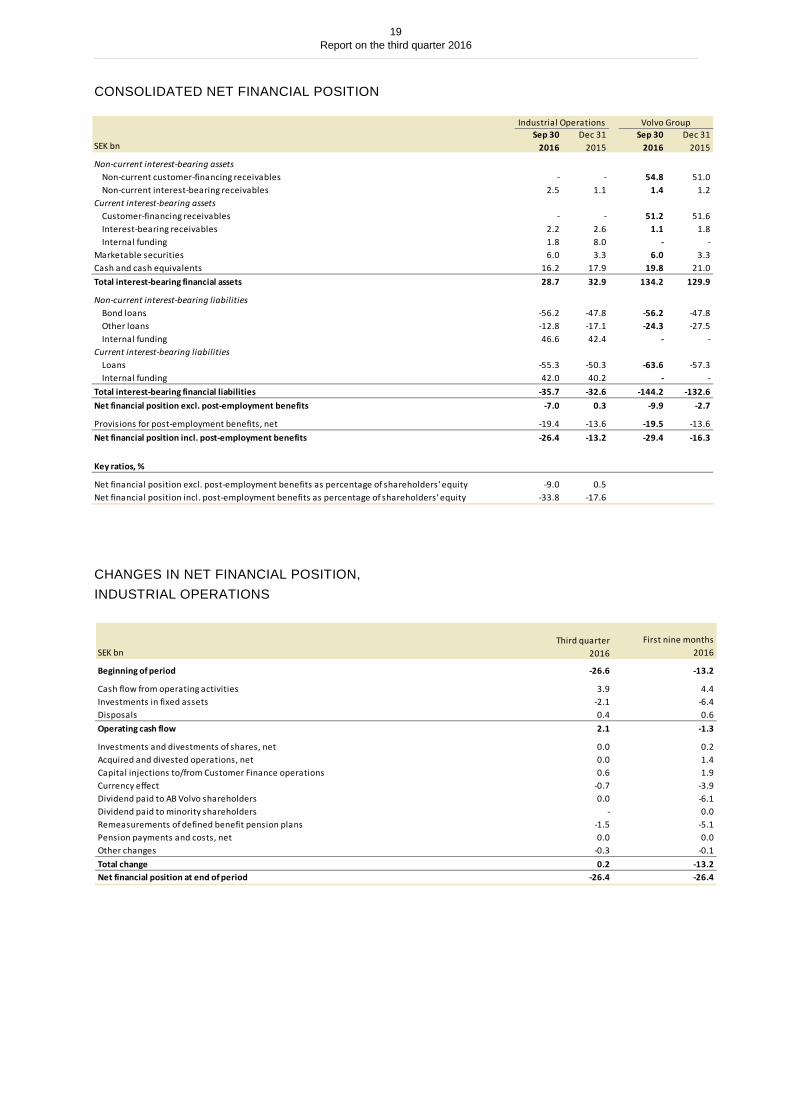
Volvo Group financial position At the end of the third quarter net financial debt, excluding provisions for post-employment benefits, in the Industrial Operations amounted to SEK 7.0 billion, a decrease of SEK 2.0 billion compared to the end of the second quarter and equal to 9.0% of shareholders’ equity. Including provisions for post-employment benefits, the Industrial Operations’ net financial debt amounted to SEK 26.4 billion which is equal to 33.8% of shareholders’ equity. The change is mainly explained by a positive operating cash flow of SEK 2.1 billion in the quarter, reduced by remeasurements of the defined benefit pension obligations of SEK 1.5 billion. The increase in the defined benefit obligations is an effect of a decrease in the discount rates, mainly in Sweden and the UK. During the third quarter, currency movements increased net financial debt by SEK 0.7 billion. Total assets in the Volvo Group have increased by SEK 23.3 billion since year-end 2015 whereof SEK 20.1 billion is related to currency effects from revaluation of assets in foreign subsidiaries. At the end of the third quarter the shareholders’ equity for the Volvo Group amounted to SEK 88.8 billion compared to SEK 85.6 billion at year-end 2015. The equity ratio was 22.3% compared to 22.9% on December 31, 2015. At the same date the equity ratio in the Industrial Operations amounted to 28.1% (28.6). Number of employees On September 30, 2016 the Volvo Group had 96,664 employees including temporary employees and consultants, which was a decrease of 2,837 employees compared with December 31, 2015 and 5,744 employees compared with a year ago.
Number of employees Sep 30
2016Jun 30
2016Mar 31
2016Dec 31
2015Sep 30
2015
Blue-collar 47,123 47,768 46,825 47,368 49,328Of which temporary employees and consultants 5,911 6,060 4,977 4,341 5,528
White-collar 49,541 49,522 51,819 52,133 53,080Of which temporary employees and consultants 6,147 6,055 6,806 6,696 6,841
Total number of employees 96,664 97,290 98,644 99,501 102,408Of which temporary employees and consultants 12,058 12,115 11,783 11,037 12,369
5 Report on the third quarter 2016
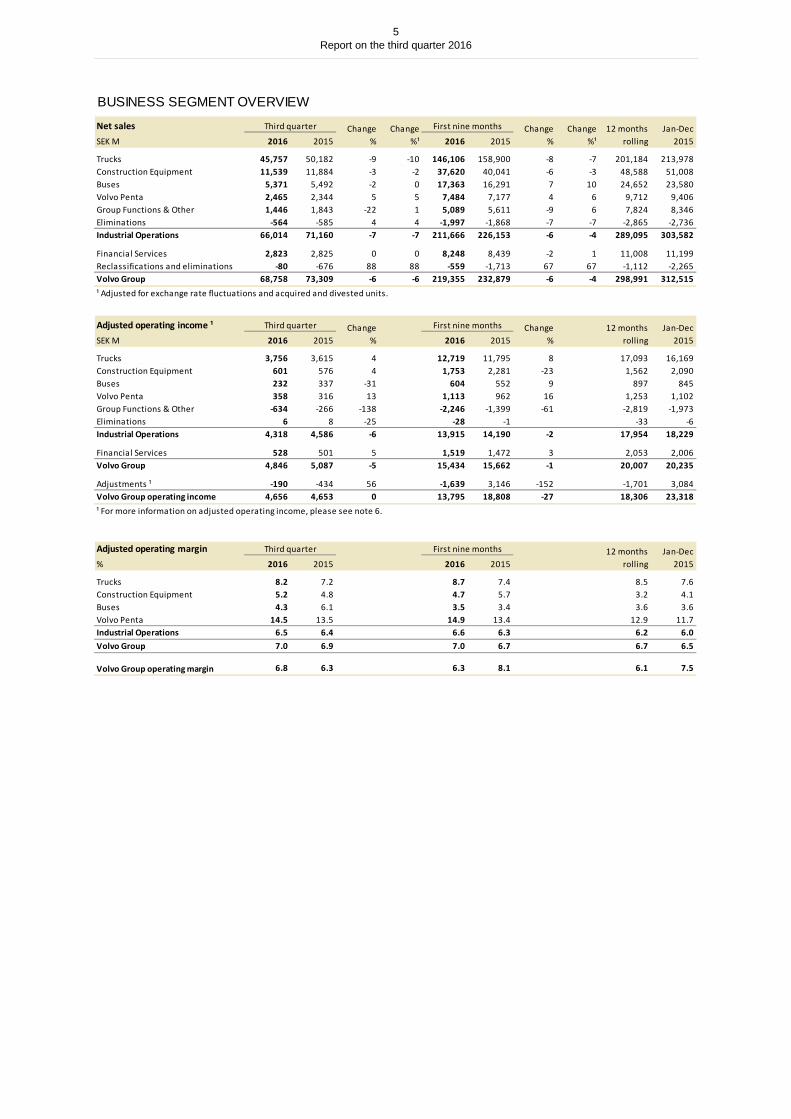
BUSINESS SEGMENT OVERVIEW
Net salesSEK M 2016 2015 2016 2015
Trucks 45,757 50,182 -9 -10 146,106 158,900 -8 -7 201,184 213,978Construction Equipment 11,539 11,884 -3 -2 37,620 40,041 -6 -3 48,588 51,008Buses 5,371 5,492 -2 0 17,363 16,291 7 10 24,652 23,580Volvo Penta 2,465 2,344 5 5 7,484 7,177 4 6 9,712 9,406Group Functions & Other 1,446 1,843 -22 1 5,089 5,611 -9 6 7,824 8,346Eliminations -564 -585 4 4 -1,997 -1,868 -7 -7 -2,865 -2,736Industrial Operations 66,014 71,160 -7 -7 211,666 226,153 -6 -4 289,095 303,582
Financial Services 2,823 2,825 0 0 8,248 8,439 -2 1 11,008 11,199Reclassifications and eliminations -80 -676 88 88 -559 -1,713 67 67 -1,112 -2,265Volvo Group 68,758 73,309 -6 -6 219,355 232,879 -6 -4 298,991 312,515¹ Adjusted for exchange rate fluctuations and acquired and divested units.
Adjusted operating income ¹SEK M 2016 2015 2016 2015
Trucks 3,756 3,615 4 12,719 11,795 8 17,093 16,169Construction Equipment 601 576 4 1,753 2,281 -23 1,562 2,090Buses 232 337 -31 604 552 9 897 845Volvo Penta 358 316 13 1,113 962 16 1,253 1,102Group Functions & Other -634 -266 -138 -2,246 -1,399 -61 -2,819 -1,973Eliminations 6 8 -25 -28 -1 -2,700 -33 -6Industrial Operations 4,318 4,586 -6 13,915 14,190 -2 17,954 18,229
Financial Services 528 501 5 1,519 1,472 3 2,053 2,006Volvo Group 4,846 5,087 -5 15,434 15,662 -1 20,007 20,235
Adjustments ¹ -190 -434 56 -1,639 3,146 -152 -1,701 3,084Volvo Group operating income 4,656 4,653 0 13,795 18,808 -27 18,306 23,318
Adjusted operating margin% 2016 2015 2016 2015
Trucks 8.2 7.2 8.7 7.4 8.5 7.6Construction Equipment 5.2 4.8 4.7 5.7 3.2 4.1Buses 4.3 6.1 3.5 3.4 3.6 3.6Volvo Penta 14.5 13.5 14.9 13.4 12.9 11.7Industrial Operations 6.5 6.4 6.6 6.3 6.2 6.0Volvo Group 7.0 6.9 7.0 6.7 6.7 6.5
Volvo Group operating margin 6.8 6.3 6.3 8.1 6.1 7.5
Change%¹
Third quarter Change%
Change%¹
First nine months Change%
Third quarter Change%
First nine months Change%
12 months rolling
Jan-Dec 2015
¹ For more information on adjusted operating income, please see note 6.
12 months rolling
Jan-Dec 2015
Third quarter First nine months 12 months rolling
Jan-Dec 2015

6 Report on the third quarter 2016
TRUCKS
Sustained profitability on lower volumes
Good demand in Europe, further weakened in North America and continued low in Brazil
Profitability sustained – adjusted operating margin of 8.2% (7.2) in spite of volumes being down by 13%
Volvo FH overall winner in the prestigious Fehrenkötter-test based on best fuel economy and lowest cost of ownership
Market development During the third quarter the truck market in Europe continued to develop favorably. As of August registrations in Europe 28 increased by 17% compared with the previous year (Europe 28 excludes the UK, which from the third quarter no longer publish recent registration data). Demand for transport continued to be good, resulting in high capacity utilization of the truck fleets and good customer profitability. Demand for new trucks was also driven by some customers renewing their truck fleets. Demand for trucks in Europe is expected to cool down next year, but to still be on a good level. North American heavy-duty truck manufacturers continued in a correction mode in the third quarter, lowering production in response to reduced replacement demand and elevated inventories of new and used trucks. While decent economic conditions prevail, retail deliveries are down 19% through September compared to the very strong market in 2015. Virtually the entire decline was registered in the highway tractor segments. It is expected that new retail truck deliveries for North America will finish at around 240,000 for 2016 and come down to 215,000 in 2017.
Through September registrations of heavy-duty trucks in Brazil declined by 29%. However, the market seems to be bottoming out at around 30,000 trucks in 2016. The recovery is expected to be slow and gradual as there is excess capacity in the freight industry and limited replacement need. In India registrations of heavy-duty trucks rose by 9% through September, driven by continuous good economic activity and good business confidence. The positive development is expected to continue throughout the remainder of 2016 as well as during 2017 and result in an Indian total market that continues to grow. The Chinese total market for heavy-duty trucks increased by 20% and medium-duty by 17% through September 2016. The Chinese market is expected to have bottomed out and is predicted to recover slowly next year. In Japan, demand remained good in the first three quarters. Registrations of medium- and heavy-duty trucks increased somewhat compared to the same quarter last year. The Japanese market is assessed as being stable on good levels during the remainder of 2016 as well as in 2017.
Total market developmentRegistrations, number of trucks 2016 2015
Europe 28 ¹ heavy-duty (as of Aug ) 174,895 149,051 17 270,000 295,000 +5,000 280,000North America heavy-duty 185,114 228,246 -19 301,700 240,000 unchanged 215,000Brazil heavy-duty 22,850 32,020 -29 41,600 30,000 unchanged 35,000China heavy-duty 492,303 408,798 20 550,700 640,000 +30,000 640,000China medium-duty 158,918 135,606 17 200,400 230,000 +20,000 230,000India heavy-duty 170,960 157,074 9 209,900 250,000 unchanged 290,000India medium-duty 56,445 49,225 15 68,200 80,000 unchanged 100,000Japan heavy-duty 35,929 34,249 5 44,500 45,000 unchanged 45,000Japan medium-duty 35,408 34,562 2 45,200 45,000 unchanged 45,000
Forecast2017
¹From the third quarter registration is no longer available for the UK. Registrations for Europe 28 for the first three quarters 2016 and 2015 include Norway and Switzerland but exclude the UK and Bulgaria. The UK reported 36,238 registered trucks for the full year 2015. Note! Forecast for 2016 and 2017 as well as full year registrations for 2015 include the UK and Bulgaria.
First nine months Change%
Forecast 2016
Full year2015
Change vs.previous forecast

7 Report on the third quarter 2016
Deliveries per market areaNumber of trucks 2016 2015 2016 2015
Europe 20,510 18,408 11 70,161 60,531 16North America 8,309 15,329 -46 31,088 49,118 -37South America 2,413 3,060 -21 6,852 7,961 -14Asia 6,923 7,173 -3 22,740 23,221 -2Africa and Oceania 3,000 3,368 -11 9,094 10,446 -13Total deliveries 41,155 47,338 -13 139,935 151,277 -7
Heavy duty (>16 tons) 34,255 40,831 -16 115,802 129,178 -10Medium duty (7-16 tons) 3,328 3,204 4 11,560 10,789 7Light duty (<7 tons) 3,572 3,303 8 12,573 11,310 11Total deliveries 41,155 47,338 -13 139,935 151,277 -7
Volvo 22,353 25,495 -12 74,923 82,865 -10UD 4,919 4,725 4 15,493 14,914 4Renault Trucks 9,920 10,495 -5 34,792 33,144 5Mack 3,963 6,623 -40 14,727 20,354 -28Total deliveries 41,155 47,338 -13 139,935 151,277 -7
Non-consolidated operationsVE Commercial Vehicles (Eicher) 10,442 9,373 11 33,394 25,207 32Dongfeng Commercial Vehicle Company (Dongfeng Trucks)¹ 28,614 24,654 16 78,897 77,395 2¹ Deliveries as of August 2015 and August 2016.
Third quarter Change%
First nine months Change%
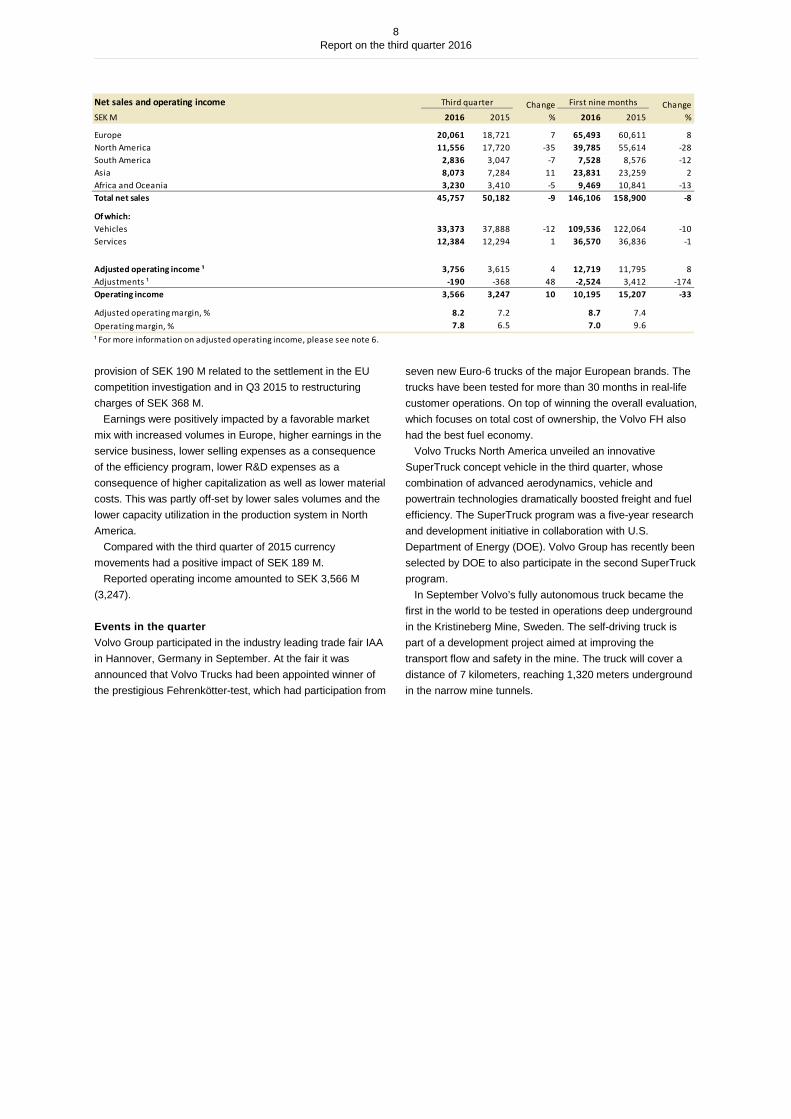
Orders and deliveries Total net orders decreased by 7% in the third quarter, compared with the third quarter last year, and deliveries declined by 13%. Orders in Europe increased by 6% with orders for Volvo up 12% whereas orders for Renault Trucks were almost flat. Production in Europe has been adjusted in order to meet the increased order intake earlier in the year and deliveries increased by 11% in the quarter. However, as lead-times now have been reduced to normal levels, production will be slightly adjusted in the fourth quarter. In North America order intake declined by 37% compared to the same quarter last year and deliveries came down by 46% in total. The decline in both orders and deliveries compared with 2015 was caused by the market correction and dealers focusing on reducing their inventories. Production in the Group’s North American manufacturing system was lowered in the quarter and will be further reduced in the fourth quarter to allow for further inventory reduction at dealers. Order intake in South America increased by 36% in the third
quarter, although from low levels, reflecting some improvement in export related segments of the market as well as dealers exiting a period of destocking. Deliveries were down 21% as a consequence of the continuous unstable demand in the Brazilian market. In Asia order intake decreased by 4% in the third quarter. Deliveries were down 3%, primarily driven by lower deliveries of Volvo Trucks in Asia. Net sales and operating income During the third quarter of 2016, the truck operation’s net sales amounted to SEK 45,757 M, which was 9% lower than the third quarter last year. The decrease in sales was mainly driven by lower new vehicle sale in North America. Adjusted for currency movements net sales decreased by 10%, with sales of vehicles decreasing by 13% and service sales by 1%. Adjusted operating income in the third quarter amounted to SEK 3,756 M (3,615) corresponding to an operating margin of 8.2% (7.2). Adjustments in Q3 2016 refer to an additional
Net order intake per market areaNumber of trucks 2016 2015 2016 2015
Europe 19,868 18,715 6 73,058 67,219 9North America 6,764 10,745 -37 23,123 40,564 -43South America 2,958 2,176 36 6,967 6,722 4Asia 7,256 7,556 -4 22,753 24,751 -8Africa and Oceania 2,634 3,456 -24 9,047 9,713 -7Total orders 39,480 42,648 -7 134,948 148,969 -9
Heavy duty (>16 tons) 33,484 35,489 -6 110,760 125,778 -12Medium duty (7-16 tons) 2,963 2,766 7 10,798 10,433 3Light duty (<7 tons) 3,033 4,393 -31 13,390 12,758 5Total orders 39,480 42,648 -7 134,948 148,969 -9
Volvo 21,649 23,550 -8 72,090 81,462 -12UD 4,764 4,626 3 15,466 15,954 -3Renault Trucks 9,164 9,905 -7 35,804 35,643 0Mack 3,903 4,567 -15 11,588 15,910 -27Total orders 39,480 42,648 -7 134,948 148,969 -9
Non-consolidated operationsVE Commercial Vehicles (Eicher) 10,712 11,341 -6 33,840 33,993 0
Third quarter Change%
First nine months Change%
8 Report on the third quarter 2016
provision of SEK 190 M related to the settlement in the EU competition investigation and in Q3 2015 to restructuring charges of SEK 368 M. Earnings were positively impacted by a favorable market mix with increased volumes in Europe, higher earnings in the service business, lower selling expenses as a consequence of the efficiency program, lower R&D expenses as a consequence of higher capitalization as well as lower material costs. This was partly off-set by lower sales volumes and the lower capacity utilization in the production system in North America. Compared with the third quarter of 2015 currency movements had a positive impact of SEK 189 M. Reported operating income amounted to SEK 3,566 M (3,247). Events in the quarter Volvo Group participated in the industry leading trade fair IAA in Hannover, Germany in September. At the fair it was announced that Volvo Trucks had been appointed winner of the prestigious Fehrenkötter-test, which had participation from
seven new Euro-6 trucks of the major European brands. The trucks have been tested for more than 30 months in real-life customer operations. On top of winning the overall evaluation, which focuses on total cost of ownership, the Volvo FH also had the best fuel economy. Volvo Trucks North America unveiled an innovative SuperTruck concept vehicle in the third quarter, whose combination of advanced aerodynamics, vehicle and powertrain technologies dramatically boosted freight and fuel efficiency. The SuperTruck program was a five-year research and development initiative in collaboration with U.S. Department of Energy (DOE). Volvo Group has recently been selected by DOE to also participate in the second SuperTruck program. In September Volvo’s fully autonomous truck became the first in the world to be tested in operations deep underground in the Kristineberg Mine, Sweden. The self-driving truck is part of a development project aimed at improving the transport flow and safety in the mine. The truck will cover a distance of 7 kilometers, reaching 1,320 meters underground in the narrow mine tunnels.
Net sales and operating incomeSEK M 2016 2015 2016 2015
Europe 20,061 18,721 7 65,493 60,611 8North America 11,556 17,720 -35 39,785 55,614 -28South America 2,836 3,047 -7 7,528 8,576 -12Asia 8,073 7,284 11 23,831 23,259 2Africa and Oceania 3,230 3,410 -5 9,469 10,841 -13Total net sales 45,757 50,182 -9 146,106 158,900 -8
Of which:Vehicles 33,373 37,888 -12 109,536 122,064 -10Services 12,384 12,294 1 36,570 36,836 -1
Adjusted operating income ¹ 3,756 3,615 4 12,719 11,795 8Adjustments ¹ -190 -368 48 -2,524 3,412 -174Operating income 3,566 3,247 10 10,195 15,207 -33
Adjusted operating margin, % 8.2 7.2 8.7 7.4Operating margin, % 7.8 6.5 7.0 9.6¹ For more information on adjusted operating income, please see note 6.
Third quarter Change%
First nine months Change%

9 Report on the third quarter 2016
CONSTRUCTION EQUIPMENT
Continued decline in the global market
Lower demand in most markets except Europe and India, stabilization on very low levels in China
Slight margin improvement despite flat volumes and unfavorable product mix
Showcasing innovations and prototypes in electromobility, automation and connected worksite solutions
Market development Through August the European market continued its upward trend, rising 8%, mainly driven by a recovery in France as well as growth in Germany and Italy. However, growth in these markets was tempered by a slowdown in the UK as well as a further decline in Russia, from already low levels in 2015. The North American market was 2% below last year driven by a continued decline in demand for larger machines which was not fully offset by growth in the compact segment. The sharp declines in South America continue with Brazil down 44% due to continued economic uncertainty and low business confidence. In Asia (excluding China) the total market declined by 4%. Whilst India is continuing to grow strongly, the total market decline was driven by weakness in the Japanese market where Volvo CE is not present. The Chinese market declined by 6%. The excavator segment has showed positive growth since June, while the segment for wheel loaders continues to decline, although at a reduced pace in recent months.
Orders and deliveries Net order intake in the third quarter increased by 17% compared with the same quarter in 2015, although from low levels. Order intake increased across all regions. In Europe, higher order intake in France and Germany was counterbalanced by lower orders in Norway and Russia. The increase in North America was partly driven by the launch of compact equipment with Tier IV final compliant engines. In South America the increase in order intake was largely related to SDLG in Brazil. Order intake in Asia (including China) was 24% higher. This was driven by increased order intake for the Volvo brand in China, mainly for excavators, and the continued strong growth in India as well as increases for SDLG branded products in China and South-East Asia. In the third quarter, deliveries were at a level similar to last year. Higher deliveries in Europe as well as of SDLG branded products in export markets and in the stabilizing Chinese excavator market were counterbalanced by lower Volvo branded machine sales in the Middle East as well as the Americas.
Net order intake per market areaNumber of construction equipment 2016 2015 2016 2015
Europe 2,603 2,579 1 10,597 10,041 6North America 1,065 1,003 6 4,197 4,359 -4South America 420 248 69 744 1,523 -51Asia 4,527 3,661 24 15,627 17,848 -12Africa and Oceania 622 407 53 1,710 1,527 12Total orders 9,237 7,898 17 32,875 35,298 -7
Of whichVolvo 6,285 5,225 20 22,812 23,942 -5SDLG 2,902 2,643 10 9,955 11,233 -11
Of which in China 2,033 1,965 3 7,759 9,157 -15
Third quarter Change%
First nine months Change%
Total market developmentChange in % measured in units 2016 Forecast 2016
Europe 8 0% to +10% 0% to +10% -5% to +5%North America -2 -10% to 0% -10% to 0% -10% to 0%South America -36 -35% to -25% -35% to -25% -5% to +5%Asia excl. China -4 -10% to 0% -10% to 0% -5% to +5%China -6 -10% to 0% -15% to -5% 0% to +10%
Year-to-date Aug
Previous forecast Forecast 2017
10 Report on the third quarter 2016
Net sales and operating income In the third quarter of 2016, net sales decreased by 3% to SEK 11,539 M (11,884). Adjusted for currency movements net sales were down by 2%. Adjusted for currency movements, net sales of machines were 2% lower compared with the third quarter of 2015 while service sales were down by 1%. Adjusted operating income increased to SEK 601 M (576) corresponding to an operating margin of 5.2% (4.8). Adjustments refer to a reversal of restructuring charges of SEK 5 M in the third quarter of 2015. Compared to the third quarter of 2015, adjusted operating income was positively impacted by lower costs for credit losses in China amounting to SEK 96 M (293), which was partly off-set by a negative product mix with a larger portion of small machines and unfavorable currency movements in an amount of SEK 104 M. Reported operating income amounted to SEK 601 M (581).
Events in the quarter The third quarter saw Volvo Construction Equipment showcase a range of futuristic concepts and innovations, from electromobility to automation and connected worksite solutions, at the company’s Xploration Forum, held in Eskilstuna, Sweden., Highlights at the event included the LX1 prototype hybrid wheel loader – a machine with the potential to improve fuel efficiency by up to 50%, and a prototype autonomous wheel loader and articulated hauler working together. The HX1 fully autonomous, electric load carrier concept was also unveiled. The HX1 prototype forms part of an ongoing connected site project that aims to transform the quarry and aggregates industry by reducing carbon emissions by up to 95% and total cost of ownership by up to 25%.
Deliveries per market areaNumber of construction equipment 2016 2015 2016 2015
Europe 3,322 3,041 9 11,550 9,740 19North America 1,179 1,551 -24 4,079 4,697 -13South America 398 422 -6 834 1,608 -48Asia 4,328 4,245 2 15,626 18,098 -14Africa and Oceania 504 495 2 1,578 1,600 -1Total deliveries 9,731 9,754 0 33,667 35,743 -6
Of whichVolvo 6,779 7,091 -4 23,604 24,399 -3SDLG 2,902 2,633 10 9,955 11,221 -11
Of which in China 2,033 1,965 3 7,759 9,157 -15¹ Deliveries as of September 2015 and September 2016.
Net sales and operating incomeSEK M 2016 2015 2016 2015
Europe 4,583 4,247 8 14,846 13,424 11North America 2,476 3,065 -19 8,258 9,464 -13South America 400 477 -16 955 1,731 -45Asia 3,423 3,444 -1 11,588 13,224 -12Africa and Oceania 657 651 1 1,973 2,198 -10Total net sales 11,539 11,884 -3 37,620 40,041 -6
Of which:Construction Equipment 9,158 9,447 -3 30,624 32,753 -7Services 2,381 2,437 -2 6,997 7,287 -4
Adjusted operating income ¹ 601 576 4 1,753 2,281 -23Adjustments ¹ - 5 - - -87 -Operating income 601 581 3 1,753 2,195 -20
Adjusted operating margin, % 5.2 4.8 4.7 5.7Operating margin, % 5.2 4.9 4.7 5.5¹ For more information on adjusted operating income, please see note 6.
Third quarter Change%
First nine months Change%
Third quarter Change%
First nine months Change%
11 Report on the third quarter 2016
BUSES
Lower volumes impacted profitability
Order intake decreased by 7% Adjusted operating margin of 4.3% (6.1) First order for Volvo 7900 Electric
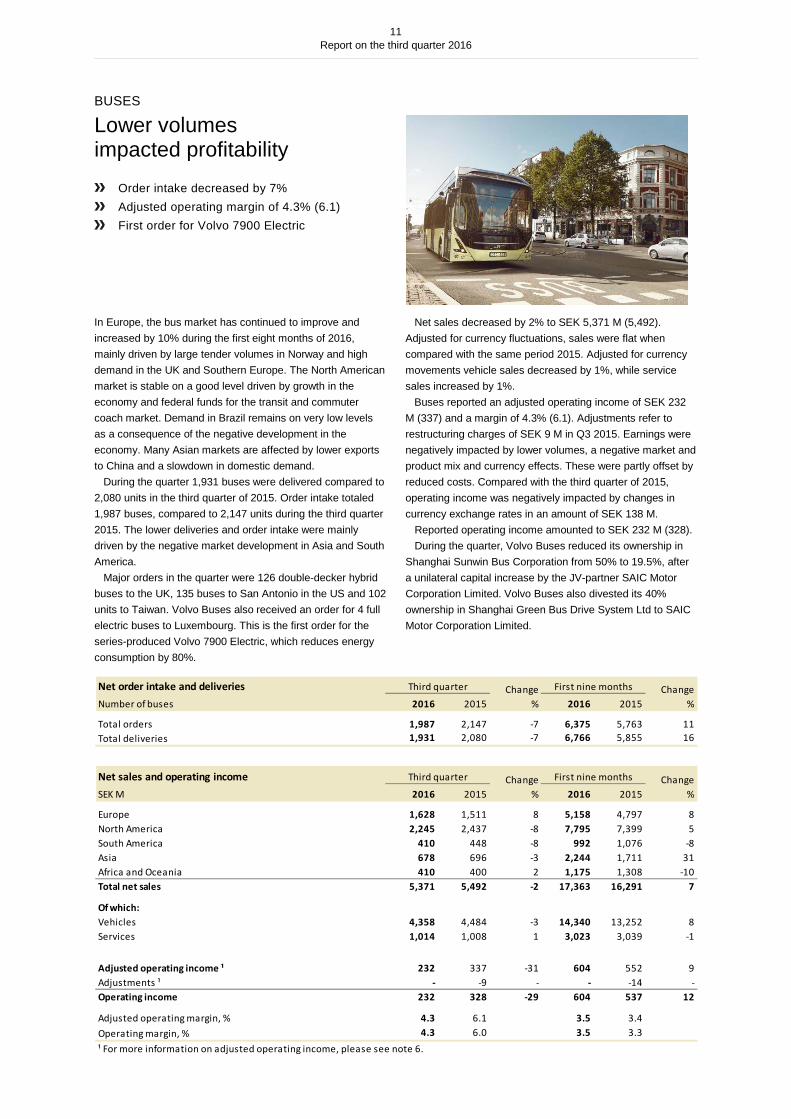
In Europe, the bus market has continued to improve and increased by 10% during the first eight months of 2016, mainly driven by large tender volumes in Norway and high demand in the UK and Southern Europe. The North American market is stable on a good level driven by growth in the economy and federal funds for the transit and commuter coach market. Demand in Brazil remains on very low levels as a consequence of the negative development in the economy. Many Asian markets are affected by lower exports to China and a slowdown in domestic demand. During the quarter 1,931 buses were delivered compared to 2,080 units in the third quarter of 2015. Order intake totaled 1,987 buses, compared to 2,147 units during the third quarter 2015. The lower deliveries and order intake were mainly driven by the negative market development in Asia and South America. Major orders in the quarter were 126 double-decker hybrid buses to the UK, 135 buses to San Antonio in the US and 102 units to Taiwan. Volvo Buses also received an order for 4 full electric buses to Luxembourg. This is the first order for the series-produced Volvo 7900 Electric, which reduces energy consumption by 80%.
Net sales decreased by 2% to SEK 5,371 M (5,492). Adjusted for currency fluctuations, sales were flat when compared with the same period 2015. Adjusted for currency movements vehicle sales decreased by 1%, while service sales increased by 1%. Buses reported an adjusted operating income of SEK 232 M (337) and a margin of 4.3% (6.1). Adjustments refer to restructuring charges of SEK 9 M in Q3 2015. Earnings were negatively impacted by lower volumes, a negative market and product mix and currency effects. These were partly offset by reduced costs. Compared with the third quarter of 2015, operating income was negatively impacted by changes in currency exchange rates in an amount of SEK 138 M. Reported operating income amounted to SEK 232 M (328). During the quarter, Volvo Buses reduced its ownership in Shanghai Sunwin Bus Corporation from 50% to 19.5%, after a unilateral capital increase by the JV-partner SAIC Motor Corporation Limited. Volvo Buses also divested its 40% ownership in Shanghai Green Bus Drive System Ltd to SAIC Motor Corporation Limited.
Net order intake and deliveriesNumber of buses 2016 2015 2016 2015
Total orders 1,987 2,147 -7 6,375 5,763 11Total deliveries 1,931 2,080 -7 6,766 5,855 16¹ Net order intake as of September 2015 and September 2016.
Net sales and operating incomeSEK M 2016 2015 2016 2015
Europe 1,628 1,511 8 5,158 4,797 8North America 2,245 2,437 -8 7,795 7,399 5South America 410 448 -8 992 1,076 -8Asia 678 696 -3 2,244 1,711 31Africa and Oceania 410 400 2 1,175 1,308 -10Total net sales 5,371 5,492 -2 17,363 16,291 7
Of which:Vehicles 4,358 4,484 -3 14,340 13,252 8Services 1,014 1,008 1 3,023 3,039 -1
Adjusted operating income ¹ 232 337 -31 604 552 9Adjustments ¹ - -9 - - -14 -Operating income 232 328 -29 604 537 12
Adjusted operating margin, % 4.3 6.1 3.5 3.4Operating margin, % 4.3 6.0 3.5 3.3¹ For more information on adjusted operating income, please see note 6.
Third quarter Change%
First nine months Change%
Third quarter Change%
First nine months Change%
12 Report on the third quarter 2016
VOLVO PENTA
Profitability remains strong
Continued sales growth, with new customers in industrial off-road engines
Operating margin of 14.5% (13.5) Innovation award for engine & propulsion system
of the year at Cannes Yachting Festival The overall marine leisure market remains flat, with signs of a slight increase. The gasoline segment is still declining, but Volvo Penta is gaining market share. In September, Volvo Penta was awarded engine & propulsion system of the year by Yachts France Magazine at the World Yachts Trophies 2016 ceremony, highlighting Volvo Penta IPS as an innovation for the yacht segment. The marine commercial market is impacted by turmoil in the oil and gas industry. Volvo Penta’s new marine diesel 8-liter engine was revealed to the public at the SMM, an international maritime trade fair in Hamburg, Germany. For industrial off-road engines, the market is fragmented – with stability in the material handling segment and low demand in the construction segment. The downturn in mining continues due to low commodity prices. Volvo Penta continues to gain new customers within the off-road engine segment. The market for industrial power generation engines shows a slight positive development in Asia, Middle East, Africa, and the export-oriented European market. The domestic
European and North American markets also show stable development, but on low levels. Net order intake during the third quarter was 7,780 units, which was 7% lower than last year driven by fewer orders in the marine leisure gasoline segment. A total of 8,823 engines were delivered in the third quarter, a decrease of 6% compared to the preceding year. Net sales increased by 5% to SEK 2,465 M (2,344). Adjusted for currency movements, net sales also increased by 5%. Adjusted for currency, net sales of engines increased by 1% mainly driven by a positive product mix while net sales of services increased by 14% primarily driven by higher marine leisure volumes due to increased boating activity in Europe and North America. Operating income amounted to SEK 358 M (316). The operating margin was 14.5% (13.5), positively impacted by favorable segment mix. Compared with the third quarter of 2015, operating income was impacted positively by changes in currency exchange rates in an amount of SEK 16 M.
Net order intake and deliveriesNumber of Engines 2016 2015 2016 2015
Total orders 7,780 8,328 -7 27,651 29,650 -7Total deliveries 8,823 9,428 -6 28,254 28,798 -2¹ Net order intake as of September 2015 and September 2016.
Net sales and operating incomeSEK M 2016 2015 2016 2015
Europe 1,192 1,070 11 3,829 3,433 12North America 531 550 -3 1,606 1,594 1South America 74 70 6 198 276 -28Asia 541 495 9 1,461 1,449 1Africa and Oceania 128 159 -19 390 425 -8Total net sales 2,465 2,344 5 7,484 7,177 4
Of which:Engines 1,655 1,630 2 5,263 5,165 2Services 810 714 13 2,221 2,012 10
Adjusted operating income ¹ 358 316 13 1,113 962 16Adjustments ¹ - - - - -16 -Operating income 358 316 13 1,113 945 18
Adjusted operating margin, % 14.5 13.5 14.9 13.4Operating margin, % 14.5 13.5 14.9 13.2¹ For more information on adjusted operating income, please see note 6.
Third quarter Change%
First nine months Change%
Third quarter Change%
First nine months Change%
13 Report on the third quarter 2016
FINANCIAL SERVICES
Continued strong performance
Stable volume and penetration levels Continued good portfolio performance Solid profitability
The customer finance business continued to record good results due to low credit losses and price realization. During the quarter, operating income improved to SEK 528 M (501). New business volume and the penetration rate remained stable, despite increased competition in many markets. Overall portfolio performance continued to be strong, highlighted by all-time low levels of overdues and credit losses in most of Europe. In North America, the portfolio continued to perform well, although returning to more
normalized business cycle conditions. The economy in Brazil remains in a recession, and focus continues to be on executing downturn management activities, which have mitigated the negative effects. During the quarter, VFS syndicated approximately SEK 1.1 billion of the credit portfolio across a number of markets, effectively reducing concentration risks and freeing up credit capacity to support sales. .
IMPORTANT EVENTSVolvo reached settlement with the European Commission On July 19, 2016 the Volvo Group announced that it had reached a settlement with the European Commission putting an end to a long-running EU antitrust investigation. As part of the settlement Volvo in October paid a fine of EUR 670 M corresponding to SEK 6.3 billion. The amount is mainly covered by provisions made in 2014 and 2016, in total EUR 650 M (SEK 6.1 billion). An additional provision had a negative impact of EUR 20 M (SEK 190 M) on the operating income in the third quarter of 2016.
Previously reported important events • New truck organization • Volvo completed sale of IT operation • Annual General Meeting of AB Volvo • Additional provision in connection with EU
competition investigation Detailed information about the events is available at www.volvogroup.com
Financial ServicesSEK M 2016 2015 2016 2015
Number of financed units 12,010 11,922 36,061 35,668Total penetration rate¹, % 27 26 25 25New financing volume, SEK billion 13.4 13.3 39.0 39.9Credit portfolio net, SEK billion 126 122Credit provision expenses 173 172 447 588Operating income, SEK M 528 501 1,519 1,472Credit reserves, % of credit portfolio 1.42 1.40Return on shareholders’ equity, rolling 12 months, % 13.3 13.4¹ Share of unit sales financed by Volvo Financial Services in relation to the total number of units sold by the Volvo Group in markets where financial services are offered.
Third quarter First nine months
14 Report on the third quarter 2016
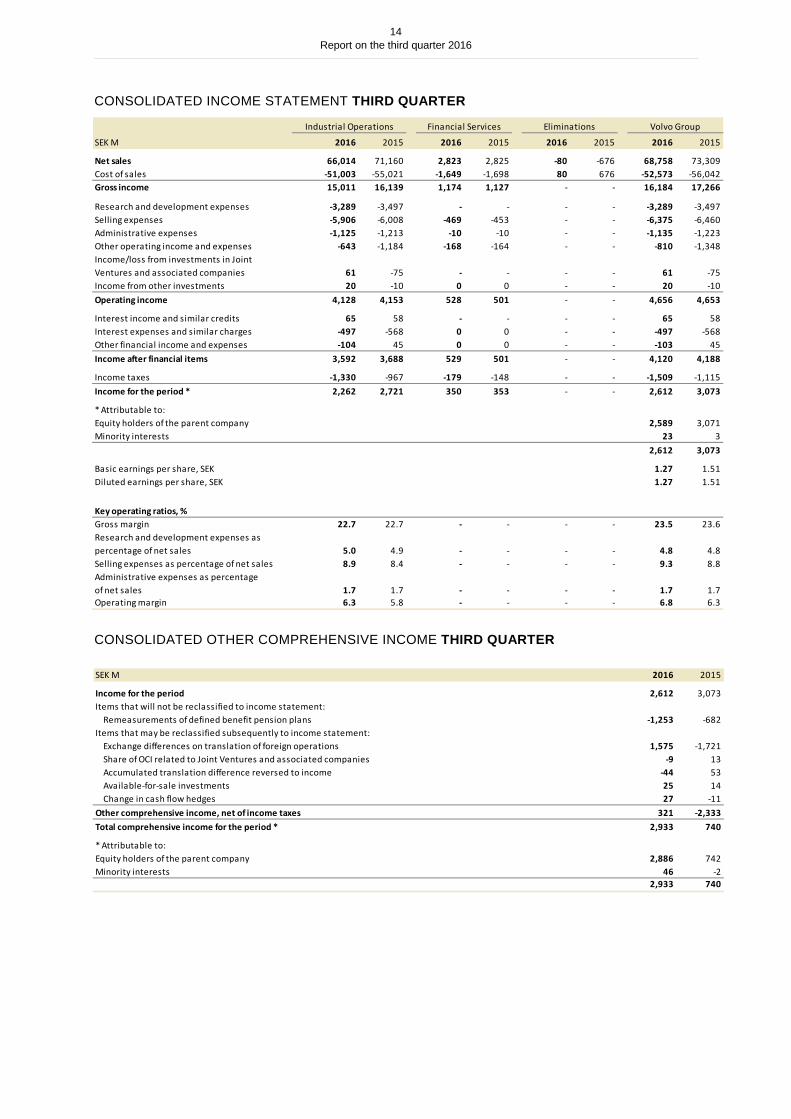
CONSOLIDATED INCOME STATEMENT THIRD QUARTER
CONSOLIDATED OTHER COMPREHENSIVE INCOME THIRD QUARTER
SEK M 2016 2015
Income for the period 2,612 3,073Items that will not be reclassified to income statement:
Remeasurements of defined benefit pension plans -1,253 -682Items that may be reclassified subsequently to income statement:
Exchange differences on translation of foreign operations 1,575 -1,721Share of OCI related to Joint Ventures and associated companies -9 13Accumulated translation difference reversed to income -44 53Available-for-sale investments 25 14Change in cash flow hedges 27 -11
Other comprehensive income, net of income taxes 321 -2,333Total comprehensive income for the period * 2,933 740
* Attributable to: Equity holders of the parent company 2,886 742Minority interests 46 -2 2,933 740
SEK M 2016 2015 2016 2015 2016 2015 2016 2015
Net sales 66,014 71,160 2,823 2,825 -80 -676 68,758 73,309Cost of sales -51,003 -55,021 -1,649 -1,698 80 676 -52,573 -56,042Gross income 15,011 16,139 1,174 1,127 - - 16,184 17,266
Research and development expenses -3,289 -3,497 - - - - -3,289 -3,497Selling expenses -5,906 -6,008 -469 -453 - - -6,375 -6,460Administrative expenses -1,125 -1,213 -10 -10 - - -1,135 -1,223Other operating income and expenses -643 -1,184 -168 -164 - - -810 -1,348Income/loss from investments in Joint Ventures and associated companies 61 -75 - - - - 61 -75Income from other investments 20 -10 0 0 - - 20 -10Operating income 4,128 4,153 528 501 - - 4,656 4,653
Interest income and similar credits 65 58 - - - - 65 58Interest expenses and similar charges -497 -568 0 0 - - -497 -568Other financial income and expenses -104 45 0 0 - - -103 45Income after financial items 3,592 3,688 529 501 - - 4,120 4,188
Income taxes -1,330 -967 -179 -148 - - -1,509 -1,115Income for the period * 2,262 2,721 350 353 - - 2,612 3,073
* Attributable to:Equity holders of the parent company 2,589 3,071Minority interests 23 3 2,612 3,073
Basic earnings per share, SEK 1.27 1.51Diluted earnings per share, SEK 1.27 1.51
Key operating ratios, %Gross margin 22.7 22.7 - - - - 23.5 23.6Research and development expenses as percentage of net sales 5.0 4.9 - - - - 4.8 4.8Selling expenses as percentage of net sales 8.9 8.4 - - - - 9.3 8.8Administrative expenses as percentage of net sales 1.7 1.7 - - - - 1.7 1.7Operating margin 6.3 5.8 - - - - 6.8 6.3
Industrial Operations Financial Services Eliminations Volvo Group
15 Report on the third quarter 2016
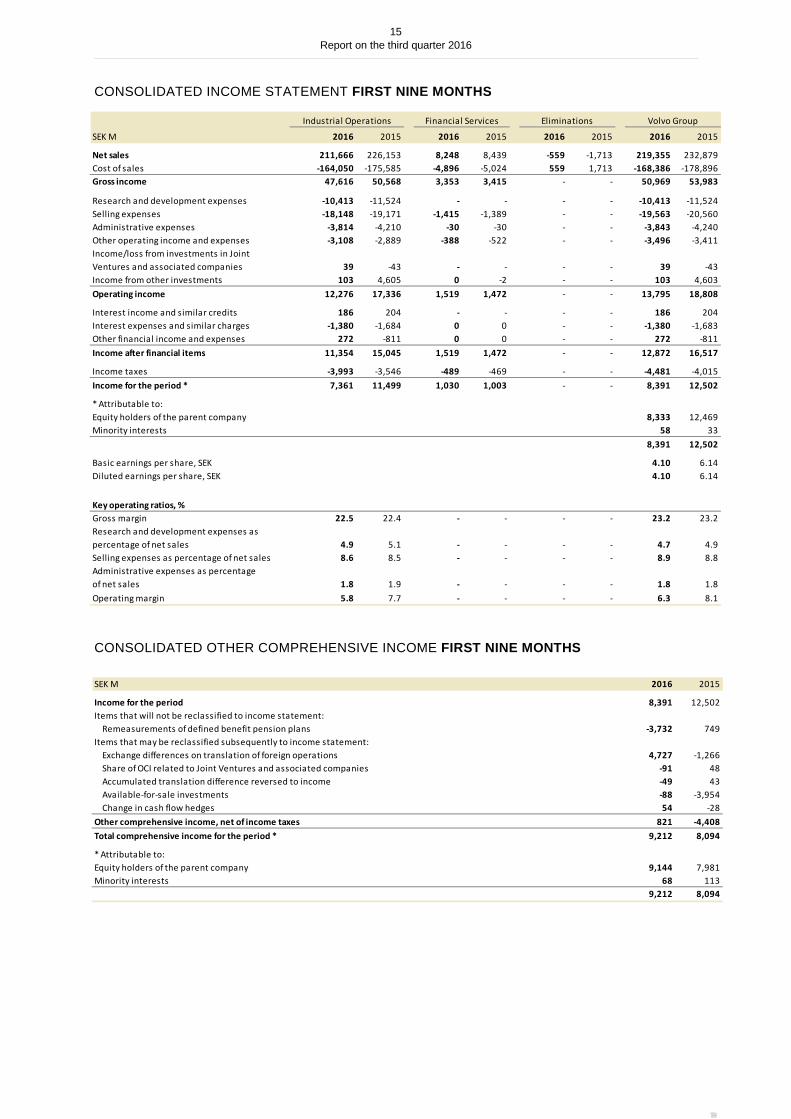
CONSOLIDATED INCOME STATEMENT FIRST NINE MONTHS
CONSOLIDATED OTHER COMPREHENSIVE INCOME FIRST NINE MONTHS
SEK M 2016 2015
Income for the period 8,391 12,502Items that will not be reclassified to income statement:
Remeasurements of defined benefit pension plans -3,732 749Items that may be reclassified subsequently to income statement:
Exchange differences on translation of foreign operations 4,727 -1,266Share of OCI related to Joint Ventures and associated companies -91 48Accumulated translation difference reversed to income -49 43Available-for-sale investments -88 -3,954Change in cash flow hedges 54 -28
Other comprehensive income, net of income taxes 821 -4,408Total comprehensive income for the period * 9,212 8,094
* Attributable to: Equity holders of the parent company 9,144 7,981Minority interests 68 113 9,212 8,094
SEK M 2016 2015 2016 2015 2016 2015 2016 2015
Net sales 211,666 226,153 8,248 8,439 -559 -1,713 219,355 232,879Cost of sales -164,050 -175,585 -4,896 -5,024 559 1,713 -168,386 -178,896Gross income 47,616 50,568 3,353 3,415 - - 50,969 53,983
Research and development expenses -10,413 -11,524 - - - - -10,413 -11,524Selling expenses -18,148 -19,171 -1,415 -1,389 - - -19,563 -20,560Administrative expenses -3,814 -4,210 -30 -30 - - -3,843 -4,240Other operating income and expenses -3,108 -2,889 -388 -522 - - -3,496 -3,411Income/loss from investments in Joint Ventures and associated companies 39 -43 - - - - 39 -43Income from other investments 103 4,605 0 -2 - - 103 4,603Operating income 12,276 17,336 1,519 1,472 - - 13,795 18,808
Interest income and similar credits 186 204 - - - - 186 204Interest expenses and similar charges -1,380 -1,684 0 0 - - -1,380 -1,683Other financial income and expenses 272 -811 0 0 - - 272 -811Income after financial items 11,354 15,045 1,519 1,472 - - 12,872 16,517
Income taxes -3,993 -3,546 -489 -469 - - -4,481 -4,015Income for the period * 7,361 11,499 1,030 1,003 - - 8,391 12,502
* Attributable to:Equity holders of the parent company 8,333 12,469Minority interests 58 33 8,391 12,502
Basic earnings per share, SEK 4.10 6.14Diluted earnings per share, SEK 4.10 6.14
Key operating ratios, %Gross margin 22.5 22.4 - - - - 23.2 23.2Research and development expenses as percentage of net sales 4.9 5.1 - - - - 4.7 4.9Selling expenses as percentage of net sales 8.6 8.5 - - - - 8.9 8.8Administrative expenses as percentage of net sales 1.8 1.9 - - - - 1.8 1.8Operating margin 5.8 7.7 - - - - 6.3 8.1
Industrial Operations Financial Services Eliminations Volvo Group
SEK MSep 30 2014Dec 31 2013Sep 30 2014Dec 31 2013Sep 30 2014Dec 31 2013Sep 30 2014Dec 31 2013 Assets Non-current assets Intangible assets36,87836,4791021090036,98036,588 Tangible assets Property, plant and equipment54,00252,14686870054,08852,233 Assets under operating leases18,28217,01315,65713,714(5,318)(5,055)28,62125,672 Financial assets Investments in joint ventures and associated companies4,6864,37700004,6864,377 Other shares and participations4,0001,944146004,0141,950 Non-current customer-financing receivables1,08872748,94149,466(1,151)(6,401)48,87843,792 Deferred tax assets13,40312,3268618400014,26413,166 Prepaid pensions1011011001022 Non-current interest-bearing receivables740550243418(104)782480 Other non-current receivables3,5103,017151128(152)(208)3,5092,937 Total non-current assets136,599128,59065,83664,395(6,603)(11,768)195,832181,217 Current assets Inventories47,65540,9642451890047,90041,153 Current receivables Customer-financing receivables59267946,75440,854(909)(1,464)46,43740,069 Tax assets2,4651,6924657002,5111,749 Interest-bearing receivables1,5601,64520473(972)(1,209)608909 Internal funding2,3752,25600(2,375)(2,256)00 Accounts receivable29,89329,1704312450030,32429,415 Other receivables14,06712,2071,5031,383(1,011)(936)14,55912,654 Non interest-bearing assets held for sale3518,10200003518,102 Interest-bearing assets held for sale02000002 Marketable securities5,9462,570121005,9472,591 Cash and cash equivalents14,90325,6601,8701,679(438)(371)16,33526,968 Total current assets119,807124,94750,87044,901(5,705)(6,236)164,972163,612 Total assets256,406253,537116,706109,296(12,308)(18,004)360,804344,829 Equity and liabilities Equity attributable to the equity holders of the parent company69,966 67,134 9,474 8,906 (2)(8)79,438 76,032 Minority interests1,6221,33300001,6221,333 Total equity71,58868,4679,4748,906(2)(8)81,06077,365 Non-current provisions Provisions for post-employment benefits14,667 12,249 67 73 0 0 14,734 12,322 Provisions for deferred taxes373241,9792,082002,0162,406 Other provisions7,3716,005242183327,6166,190 Non-current liabilities Bond loans56,08746,585000056,08746,585 Other loans27,52931,21913,49012,182(1,149)(6,537)39,87036,864 Internal funding(44,327)(34,027)38,26935,7616,058(1,734)00 Other liabilities15,82914,315664665(3,749)(3,503)12,74411,477 Current provisions12,57111,24673585012,64911,304 Current liabilities Loans38,81746,8069,8776,705(1,648)(1,959)47,04651,552 Internal funding(29,838)(38,090)38,92339,659(9,085)(1,569)00 Non interest-bearing liabilities held for sale1293320000129332 Interest-bearing liabilities held for sale0180000018 Trade payables48,82753,6853932160049,22053,901 Tax liabilities1,8411,07232048002,1611,120 Other liabilities35,27833,3312,9352,758(2,741)(2,696)35,47233,393 Total equity and liabilities256,406253,537116,706109,296(12,308)(18,004)360,804344,829 Key ratios, % Total equity as percentage of total assets27.927.08.18.1––22.522.4 Shareholders' equity per share, excluding minority interests, SEK––––––39.237.5 Return on operating capital, 12 months rolling values8.15.9–––––– Return on shareholders' equity, 12 months rolling values––11.912.1––7.45.0
Industrial operationsCustomer FinanceEliminationsVolvo Group Total
16 Report on the third quarter 2016
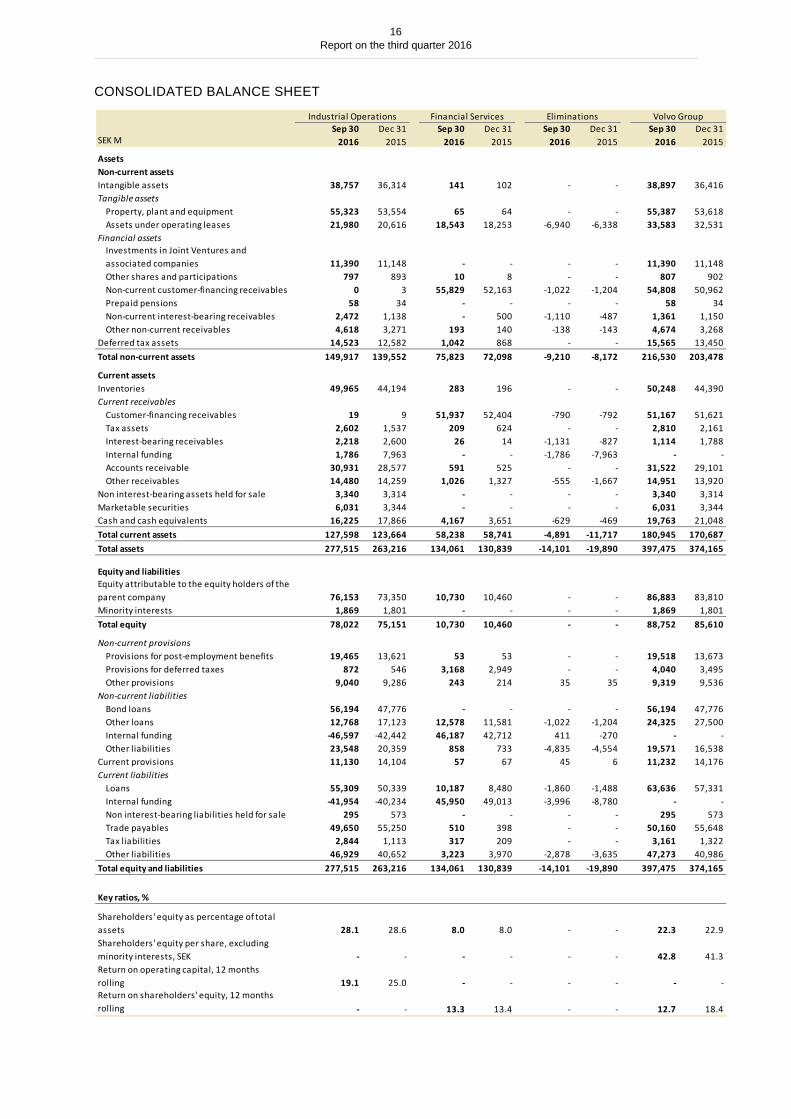
CONSOLIDATED BALANCE SHEET
SEK MSep 30
2016Dec 31
2015Sep 30
2016Dec 31
2015Sep 30
2016Dec 31
2015Sep 30
2016Dec 31
2015
AssetsNon-current assetsIntangible assets 38,757 36,314 141 102 - - 38,897 36,416Tangible assets
Property, plant and equipment 55,323 53,554 65 64 - - 55,387 53,618Assets under operating leases 21,980 20,616 18,543 18,253 -6,940 -6,338 33,583 32,531
Financial assetsInvestments in Joint Ventures and associated companies 11,390 11,148 - - - - 11,390 11,148Other shares and participations 797 893 10 8 - - 807 902Non-current customer-financing receivables 0 3 55,829 52,163 -1,022 -1,204 54,808 50,962Prepaid pensions 58 34 - - - - 58 34Non-current interest-bearing receivables 2,472 1,138 - 500 -1,110 -487 1,361 1,150Other non-current receivables 4,618 3,271 193 140 -138 -143 4,674 3,268
Deferred tax assets 14,523 12,582 1,042 868 - - 15,565 13,450Total non-current assets 149,917 139,552 75,823 72,098 -9,210 -8,172 216,530 203,478
Current assetsInventories 49,965 44,194 283 196 - - 50,248 44,390Current receivables
Customer-financing receivables 19 9 51,937 52,404 -790 -792 51,167 51,621Tax assets 2,602 1,537 209 624 - - 2,810 2,161Interest-bearing receivables 2,218 2,600 26 14 -1,131 -827 1,114 1,788Internal funding 1,786 7,963 - - -1,786 -7,963 - -Accounts receivable 30,931 28,577 591 525 - - 31,522 29,101Other receivables 14,480 14,259 1,026 1,327 -555 -1,667 14,951 13,920
Non interest-bearing assets held for sale 3,340 3,314 - - - - 3,340 3,314Marketable securities 6,031 3,344 - - - - 6,031 3,344Cash and cash equivalents 16,225 17,866 4,167 3,651 -629 -469 19,763 21,048Total current assets 127,598 123,664 58,238 58,741 -4,891 -11,717 180,945 170,687Total assets 277,515 263,216 134,061 130,839 -14,101 -19,890 397,475 374,165
Equity and liabilitiesEquity attributable to the equity holders of the parent company 76,153 73,350 10,730 10,460 - - 86,883 83,810Minority interests 1,869 1,801 - - - - 1,869 1,801Total equity 78,022 75,151 10,730 10,460 - - 88,752 85,610
Non-current provisionsProvisions for post-employment benefits 19,465 13,621 53 53 - - 19,518 13,673Provisions for deferred taxes 872 546 3,168 2,949 - - 4,040 3,495Other provisions 9,040 9,286 243 214 35 35 9,319 9,536
Non-current liabilitiesBond loans 56,194 47,776 - - - - 56,194 47,776Other loans 12,768 17,123 12,578 11,581 -1,022 -1,204 24,325 27,500Internal funding -46,597 -42,442 46,187 42,712 411 -270 - -Other liabilities 23,548 20,359 858 733 -4,835 -4,554 19,571 16,538
Current provisions 11,130 14,104 57 67 45 6 11,232 14,176Current liabilities
Loans 55,309 50,339 10,187 8,480 -1,860 -1,488 63,636 57,331Internal funding -41,954 -40,234 45,950 49,013 -3,996 -8,780 - -Non interest-bearing liabilities held for sale 295 573 - - - - 295 573Trade payables 49,650 55,250 510 398 - - 50,160 55,648Tax liabilities 2,844 1,113 317 209 - - 3,161 1,322Other liabilities 46,929 40,652 3,223 3,970 -2,878 -3,635 47,273 40,986
Total equity and liabilities 277,515 263,216 134,061 130,839 -14,101 -19,890 397,475 374,165
Key ratios, %
Shareholders' equity as percentage of total assets 28.1 28.6 8.0 8.0 - - 22.3 22.9Shareholders' equity per share, excluding minority interests, SEK - - - - - - 42.8 41.3Return on operating capital, 12 months rolling 19.1 25.0 - - - - - -Return on shareholders' equity, 12 months rolling - - 13.3 13.4 - - 12.7 18.4
Industrial Operations Financial Services Eliminations Volvo Group
17 Report on the third quarter 2016
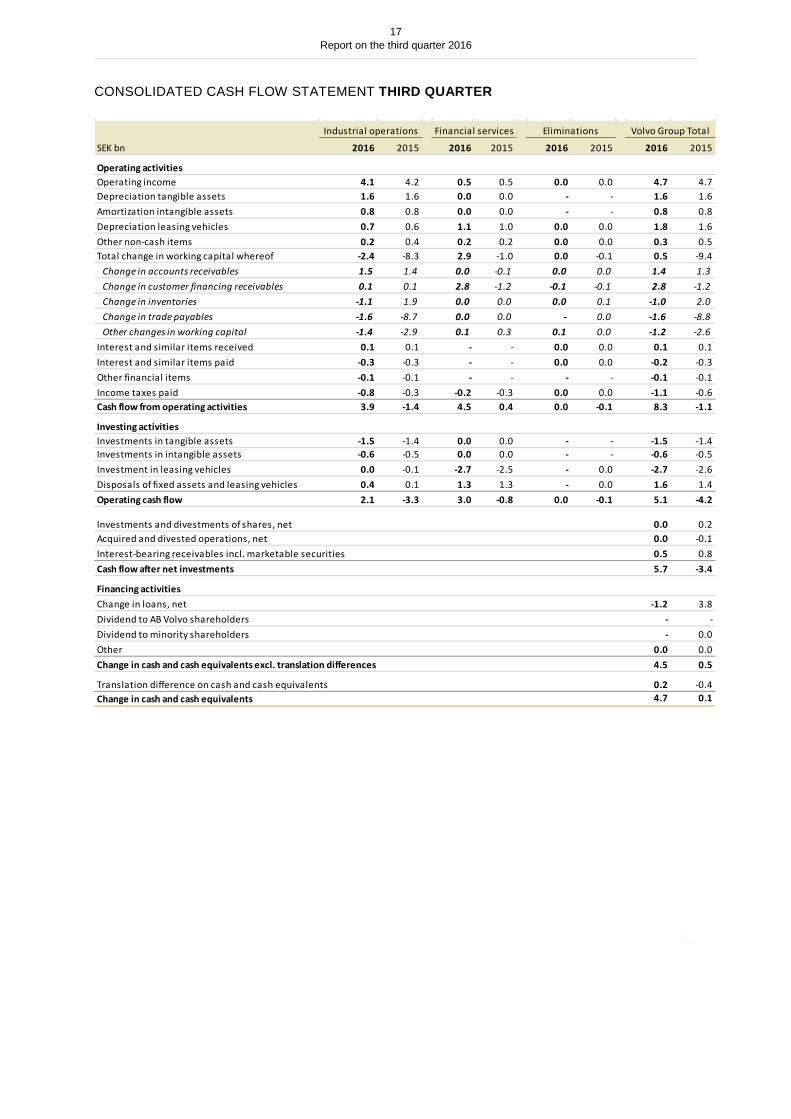
CONSOLIDATED CASH FLOW STATEMENT THIRD QUARTER
SEK bn 2016 2015 2016 2015 2016 2015 2016 2015
Operating activitiesOperating income 4.1 4.2 0.5 0.5 0.0 0.0 4.7 4.7 Depreciation tangible assets 1.6 1.6 0.0 0.0 - - 1.6 1.6 Amortization intangible assets 0.8 0.8 0.0 0.0 - - 0.8 0.8 Depreciation leasing vehicles 0.7 0.6 1.1 1.0 0.0 0.0 1.8 1.6 Other non-cash items 0.2 0.4 0.2 0.2 0.0 0.0 0.3 0.5 Total change in working capital whereof -2.4 -8.3 2.9 -1.0 0.0 -0.1 0.5 -9.4
Change in accounts receivables 1.5 1.4 0.0 -0.1 0.0 0.0 1.4 1.3 Change in customer financing receivables 0.1 0.1 2.8 -1.2 -0.1 -0.1 2.8 -1.2Change in inventories -1.1 1.9 0.0 0.0 0.0 0.1 -1.0 2.0 Change in trade payables -1.6 -8.7 0.0 0.0 - 0.0 -1.6 -8.8Other changes in working capital -1.4 -2.9 0.1 0.3 0.1 0.0 -1.2 -2.6
Interest and similar items received 0.1 0.1 - - 0.0 0.0 0.1 0.1 Interest and similar items paid -0.3 -0.3 - - 0.0 0.0 -0.2 -0.3Other financial items -0.1 -0.1 - - - - -0.1 -0.1Income taxes paid -0.8 -0.3 -0.2 -0.3 0.0 0.0 -1.1 -0.6Cash flow from operating activities 3.9 -1.4 4.5 0.4 0.0 -0.1 8.3 -1.1
Investing activitiesInvestments in tangible assets -1.5 -1.4 0.0 0.0 - - -1.5 -1.4Investments in intangible assets -0.6 -0.5 0.0 0.0 - - -0.6 -0.5Investment in leasing vehicles 0.0 -0.1 -2.7 -2.5 - 0.0 -2.7 -2.6Disposals of fixed assets and leasing vehicles 0.4 0.1 1.3 1.3 - 0.0 1.6 1.4 Operating cash flow 2.1 -3.3 3.0 -0.8 0.0 -0.1 5.1 -4.2
Investments and divestments of shares, net 0.0 0.2 Acquired and divested operations, net 0.0 -0.1Interest-bearing receivables incl. marketable securities 0.5 0.8 Cash flow after net investments 5.7 -3.4
Financing activitiesChange in loans, net -1.2 3.8 Dividend to AB Volvo shareholders - -Dividend to minority shareholders - 0.0 Other 0.0 0.0 Change in cash and cash equivalents excl. translation differences 4.5 0.5
Translation difference on cash and cash equivalents 0.2 -0.4Change in cash and cash equivalents 4.7 0.1
Industrial operations Financial services Eliminations Volvo Group Total
¹
SEK Bn20142013201420132014201320142013
Operating activitiesOperating income (loss)1.82.10.50.30.10.02.32.4Depreciation tangible assets1.81.50.00.00.00.01.81.5Amortization intangible assets0.90.90.00.00.00.00.90.9Depreciation leasing vehicles0.30.90.90.7(0.1)0.01.21.6Other non-cash items0.2(0.1)0.20.30.10.00.60.2Total change in working capital whereof(1.9)(6.2)(2.9)0.20.1(0.2)(4.7)(6.2) Change in accounts receivable2.72.1(0.1)0.00.00.02.72.1 Change in customer financing receivable(0.1)0.0(2.9)0.40.20.0(2.8)0.4 Change in inventories(0.1)(1.5)0.00.00.0(0.2)(0.1)(1.7) Change in trade payables(2.9)(5.1)0.00.00.0(0.1)(2.9)(5.2) Other changes in working capital(1.5)(1.7)0.1(0.2)(0.1)0.1(1.5)(1.8)Interest and similar items received0.10.10.00.00.00.00.10.1Interest and similar items paid(0.4)(0.6)0.00.00.0(0.1)(0.3)(0.7)Other financial items0.0(0.1)0.00.00.10.00.0(0.1)Income taxes paid(0.3)(0.6)(0.2)(0.1)(0.1)0.0(0.5)(0.7)Cash flow from operating activities2.6(2.1)(1.5)1.40.2(0.3)1.4(1.0)
Investing activitiesInvestments in tangible assets(1.8)(2.2)0.00.00.00.0(1.8)(2.2)Investments in intangible assets(0.2)(0.6)0.00.00.00.0(0.2)(0.6)Investment in leasing vehicles(0.1)(0.5)(1.9)(1.7)0.00.1(2.0)(2.1)Disposals of fixed assets and leasing vehicles0.40.10.70.80.00.01.00.9Operating cash flow0.9(5.3)(2.7)0.50.2(0.2)(1.6)(5.0)
Acquired and divested operations, net0.00.3Interest-bearing receivables incl marketable securites(0.1)0.5Cash-flow after net investments(1.7)(4.2)
Financing activitiesChange in loans, net3.52.7Dividend to minority shareholders0.0(0.2)Other(0.1)0.2Change in cash and cash equivalents excl. translation differences1.7(1.5)
Translation difference on cash and cash equivalents0.4(0.4)Change in cash and cash equivalents2.1(1.9)
Industrial operationsCustomer FinanceEliminationsVolvo Group Total

18 Report on the third quarter 2016
CONSOLIDATED CASH FLOW STATEMENT FOR THE FIRST NINE MONTHS
SEK bn 2016 2015 2016 2015 2016 2015 2016 2015
Operating activitiesOperating income 12.3 17.3 1.5 1.5 0.0 0.0 13.8 18.8 Depreciation tangible assets 4.6 4.8 0.0 0.0 - 0.0 4.7 4.8 Amortization intangible assets 2.3 2.5 0.0 0.0 - 0.0 2.3 2.5 Depreciation leasing vehicles 2.1 2.0 3.0 3.0 0.0 0.0 5.1 5.0 Other non-cash items 2.4 -2.5 0.5 0.6 0.0 0.0 2.8 -1.9Total change in working capital whereof -15.1 -11.7 1.9 -6.1 -0.2 0.5 -13.3 -17.4
Change in accounts receivables -1.0 -0.6 -0.1 0.0 0.0 0.0 -1.1 -0.7Change in customer financing receivables 0.2 0.0 1.9 -6.7 -0.2 0.0 1.9 -6.7Change in inventories -4.2 -4.4 0.0 -0.1 0.0 0.0 -4.2 -4.5Change in trade payables -8.0 -6.2 0.1 0.1 - 0.0 -7.9 -6.1Other changes in working capital -2.0 -0.6 0.0 0.6 0.0 0.5 -2.0 0.5
Interest and similar items received 0.3 0.3 - - 0.0 0.0 0.3 0.3 Interest and similar items paid -1.3 -1.3 - - 0.0 0.0 -1.3 -1.3Other financial items -0.2 -0.2 - - - - -0.2 -0.2Income taxes paid -3.0 -2.2 0.1 -0.2 0.0 0.0 -3.0 -2.4Cash flow from operating activities 4.4 9.1 7.0 -1.3 -0.2 0.5 11.3 8.3
Investing activitiesInvestments in tangible assets -4.1 -4.4 0.0 0.0 - 0.0 -4.1 -4.4Investments in intangible assets -2.2 -1.3 0.0 0.0 - 0.0 -2.3 -1.4Investment in leasing vehicles -0.1 -0.3 -7.0 -6.7 - 0.0 -7.1 -7.0Disposals of fixed assets and leasing vehicles 0.6 0.5 3.9 3.9 - 0.0 4.5 4.4 Operating cash flow -1.3 3.6 3.9 -4.1 -0.2 0.5 2.3 0.0
Investments and divestments of shares, net 0.2 -2.0Acquired and divested operations, net 1.4 0.3 Interest-bearing receivables incl. marketable securities -2.4 1.1 Cash flow after net investments 1.5 -0.6
Financing activitiesChange in loans, net 2.5 -1.6Dividend to AB Volvo shareholders -6.1 -6.1Dividend to minority shareholders 0.0 0.0 Other 0.1 0.1 Change in cash and cash equivalents excl. translation differences -2.0 -8.3
Translation difference on cash and cash equivalents 0.7 -0.2Change in cash and cash equivalents -1.3 -8.4
Industrial operations Financial services Eliminations Volvo Group Total
19 Report on the third quarter 2016
CONSOLIDATED NET FINANCIAL POSITION
CHANGES IN NET FINANCIAL POSITION, INDUSTRIAL OPERATIONS
SEK bn
Beginning of period -26.6 -13.2
Cash flow from operating activities 3.9 4.4Investments in fixed assets -2.1 -6.4Disposals 0.4 0.6Operating cash flow 2.1 -1.3
Investments and divestments of shares, net 0.0 0.2Acquired and divested operations, net 0.0 1.4Capital injections to/from Customer Finance operations 0.6 1.9Currency effect -0.7 -3.9Dividend paid to AB Volvo shareholders 0.0 -6.1Dividend paid to minority shareholders - 0.0Remeasurements of defined benefit pension plans -1.5 -5.1Pension payments and costs, net 0.0 0.0Other changes -0.3 -0.1Total change 0.2 -13.2Net financial position at end of period -26.4 -26.4
Third quarter 2016
First nine months 2016
SEK bnSep 30
2016Dec 31
2015Sep 30
2016Dec 31
2015
Non-current interest-bearing assetsNon-current customer-financing receivables - - 54.8 51.0Non-current interest-bearing receivables 2.5 1.1 1.4 1.2
Current interest-bearing assetsCustomer-financing receivables - - 51.2 51.6Interest-bearing receivables 2.2 2.6 1.1 1.8Internal funding 1.8 8.0 - -
Marketable securities 6.0 3.3 6.0 3.3Cash and cash equivalents 16.2 17.9 19.8 21.0Total interest-bearing financial assets 28.7 32.9 134.2 129.9
Non-current interest-bearing liabilitiesBond loans -56.2 -47.8 -56.2 -47.8Other loans -12.8 -17.1 -24.3 -27.5Internal funding 46.6 42.4 - -
Current interest-bearing liabilitiesLoans -55.3 -50.3 -63.6 -57.3Internal funding 42.0 40.2 - -
Total interest-bearing financial liabilities -35.7 -32.6 -144.2 -132.6Net financial position excl. post-employment benefits -7.0 0.3 -9.9 -2.7
Provisions for post-employment benefits, net -19.4 -13.6 -19.5 -13.6Net financial position incl. post-employment benefits -26.4 -13.2 -29.4 -16.3
Key ratios, %
Net financial position excl. post-employment benefits as percentage of shareholders' equity -9.0 0.5Net financial position incl. post-employment benefits as percentage of shareholders' equity -33.8 -17.6
Industrial Operations Volvo Group

20 Report on the third quarter 2016
CONSOLIDATED CHANGES IN TOTAL EQUITY
SEK BnThird quarter
2014First nine months
2014
Beginning of period (37.8) (32.1)Cash flow from operating activities 2.6 1.1Investments in fixed assets (2.1) (6.2)Disposals 0.4 0.9
Operating cash-flow 0.9 (4.2)
Acquired and divested operations, net* 0.0 7.5Capital injections to/from Customer Finance operations 0.2 0.7Currency effect 0.1 (1.3)Dividend paid to AB Volvo shareholders 0.0 (6.1)Remeasurements of defined benefit pension plans (0.9) (2.0)Pension payments and costs, net 0.1 0.3Other changes 0.0 (0.2)Total change 0.4 (5.3)Net financial position at end of period (37.4) (37.4)
SEK bnSep 30
2016Dec 31
2015
Total equity at the end of previous period 85.6 80.0
Shareholders' equity attributable to equity holders of the parent company at beginning of period 83.8 78.3Income for the period 8.3 15.1Other comprehensive income 0.8 -3.5Total comprehensive income 9.1 11.5
Dividend to AB Volvo's shareholders -6.1 -6.1Share-based payments 0.0 0.1Other changes 0.0 0.0Shareholders' equity attributable to equity holders of the parent company at end of period 86.9 83.8
Minority interests at beginning of period 1.8 1.7Income for the period 0.1 0.0Other comprehensive income 0.0 0.0Total comprehensive income 0.1 0.1
Other changes 0.0 0.0Minority interests at end of period 1.9 1.8
Total equity at end of period 88.8 85.6
21 Report on the third quarter 2016
QUARTERLY FIGURES
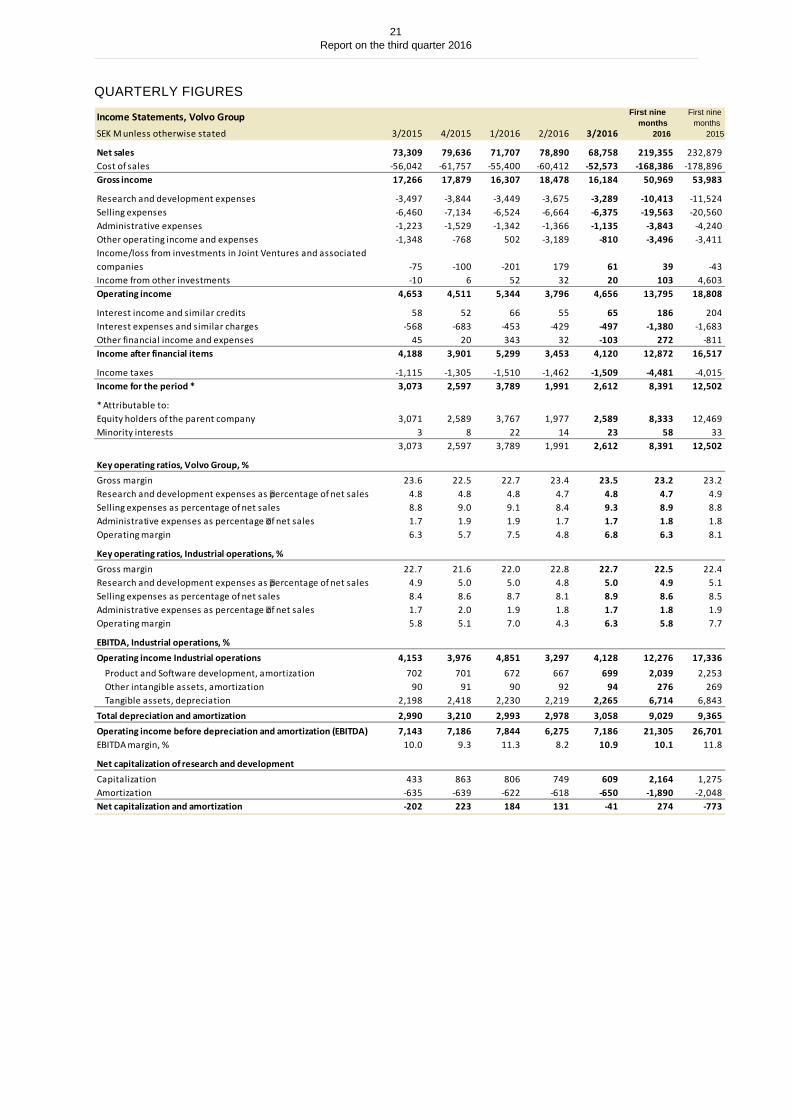
Income Statements, Volvo GroupSEK M unless otherwise stated 3/2015 4/2015 1/2016 2/2016 3/2016
Net sales 73,309 79,636 71,707 78,890 68,758 219,355 232,879Cost of sales -56,042 -61,757 -55,400 -60,412 -52,573 -168,386 -178,896Gross income 17,266 17,879 16,307 18,478 16,184 50,969 53,983
Research and development expenses -3,497 -3,844 -3,449 -3,675 -3,289 -10,413 -11,524Selling expenses -6,460 -7,134 -6,524 -6,664 -6,375 -19,563 -20,560Administrative expenses -1,223 -1,529 -1,342 -1,366 -1,135 -3,843 -4,240Other operating income and expenses -1,348 -768 502 -3,189 -810 -3,496 -3,411Income/loss from investments in Joint Ventures and associated companies -75 -100 -201 179 61 39 -43Income from other investments -10 6 52 32 20 103 4,603Operating income 4,653 4,511 5,344 3,796 4,656 13,795 18,808
Interest income and similar credits 58 52 66 55 65 186 204Interest expenses and similar charges -568 -683 -453 -429 -497 -1,380 -1,683Other financial income and expenses 45 20 343 32 -103 272 -811Income after financial items 4,188 3,901 5,299 3,453 4,120 12,872 16,517
Income taxes -1,115 -1,305 -1,510 -1,462 -1,509 -4,481 -4,015Income for the period * 3,073 2,597 3,789 1,991 2,612 8,391 12,502
* Attributable to:Equity holders of the parent company 3,071 2,589 3,767 1,977 2,589 8,333 12,469Minority interests 3 8 22 14 23 58 33 3,073 2,597 3,789 1,991 2,612 8,391 12,502
Key operating ratios, Volvo Group, %Gross margin 23.6 22.5 22.7 23.4 23.5 23.2 23.2Research and development expenses as percentage of net sales 4.8 4.8 4.8 4.7 4.8 4.7 4.9Selling expenses as percentage of net sales 8.8 9.0 9.1 8.4 9.3 8.9 8.8Administrative expenses as percentage of net sales 1.7 1.9 1.9 1.7 1.7 1.8 1.8Operating margin 6.3 5.7 7.5 4.8 6.8 6.3 8.1
Key operating ratios, Industrial operations, %Gross margin 22.7 21.6 22.0 22.8 22.7 22.5 22.4Research and development expenses as percentage of net sales 4.9 5.0 5.0 4.8 5.0 4.9 5.1Selling expenses as percentage of net sales 8.4 8.6 8.7 8.1 8.9 8.6 8.5Administrative expenses as percentage of net sales 1.7 2.0 1.9 1.8 1.7 1.8 1.9Operating margin 5.8 5.1 7.0 4.3 6.3 5.8 7.7
EBITDA, Industrial operations, %Operating income Industrial operations 4,153 3,976 4,851 3,297 4,128 12,276 17,336
Product and Software development, amortization 702 701 672 667 699 2,039 2,253Other intangible assets, amortization 90 91 90 92 94 276 269Tangible assets, depreciation 2,198 2,418 2,230 2,219 2,265 6,714 6,843
Total depreciation and amortization 2,990 3,210 2,993 2,978 3,058 9,029 9,365Operating income before depreciation and amortization (EBITDA) 7,143 7,186 7,844 6,275 7,186 21,305 26,701EBITDA margin, % 10.0 9.3 11.3 8.2 10.9 10.1 11.8
Net capitalization of research and developmentCapitalization 433 863 806 749 609 2,164 1,275Amortization -635 -639 -622 -618 -650 -1,890 -2,048Net capitalization and amortization -202 223 184 131 -41 274 -773
First nine months
2015
First nine months
2016
22 Report on the third quarter 2016
QUARTERLY FIGURES
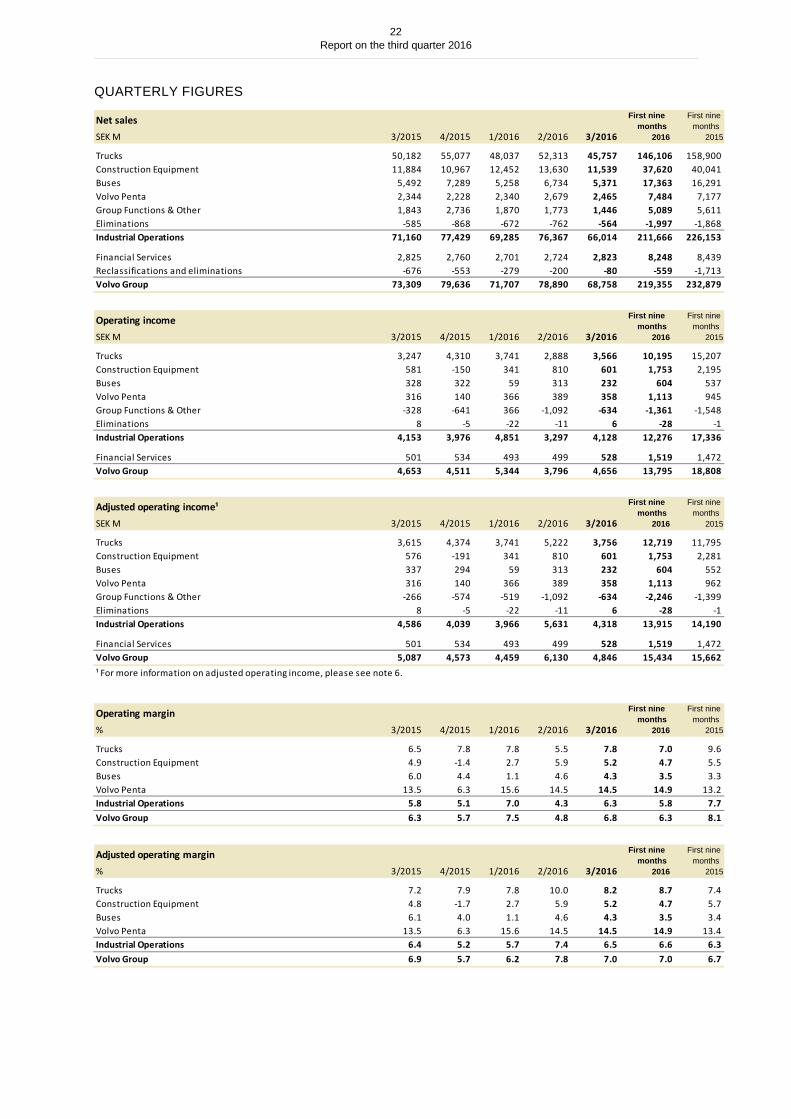
Net salesSEK M 3/2015 4/2015 1/2016 2/2016 3/2016
Trucks 50,182 55,077 48,037 52,313 45,757 146,106 158,900Construction Equipment 11,884 10,967 12,452 13,630 11,539 37,620 40,041Buses 5,492 7,289 5,258 6,734 5,371 17,363 16,291Volvo Penta 2,344 2,228 2,340 2,679 2,465 7,484 7,177Group Functions & Other 1,843 2,736 1,870 1,773 1,446 5,089 5,611Eliminations -585 -868 -672 -762 -564 -1,997 -1,868Industrial Operations 71,160 77,429 69,285 76,367 66,014 211,666 226,153
Financial Services 2,825 2,760 2,701 2,724 2,823 8,248 8,439Reclassifications and eliminations -676 -553 -279 -200 -80 -559 -1,713Volvo Group 73,309 79,636 71,707 78,890 68,758 219,355 232,879
Operating incomeSEK M 3/2015 4/2015 1/2016 2/2016 3/2016
Trucks 3,247 4,310 3,741 2,888 3,566 10,195 15,207Construction Equipment 581 -150 341 810 601 1,753 2,195Buses 328 322 59 313 232 604 537Volvo Penta 316 140 366 389 358 1,113 945Group Functions & Other -328 -641 366 -1,092 -634 -1,361 -1,548Eliminations 8 -5 -22 -11 6 -28 -1Industrial Operations 4,153 3,976 4,851 3,297 4,128 12,276 17,336
Financial Services 501 534 493 499 528 1,519 1,472Volvo Group 4,653 4,511 5,344 3,796 4,656 13,795 18,808
Adjusted operating income¹SEK M 3/2015 4/2015 1/2016 2/2016 3/2016
Trucks 3,615 4,374 3,741 5,222 3,756 12,719 11,795Construction Equipment 576 -191 341 810 601 1,753 2,281Buses 337 294 59 313 232 604 552Volvo Penta 316 140 366 389 358 1,113 962Group Functions & Other -266 -574 -519 -1,092 -634 -2,246 -1,399Eliminations 8 -5 -22 -11 6 -28 -1Industrial Operations 4,586 4,039 3,966 5,631 4,318 13,915 14,190
Financial Services 501 534 493 499 528 1,519 1,472Volvo Group 5,087 4,573 4,459 6,130 4,846 15,434 15,662¹ For more information on adjusted operating income, please see note 6.
Operating margin% 3/2015 4/2015 1/2016 2/2016 3/2016
Trucks 6.5 7.8 7.8 5.5 7.8 7.0 9.6Construction Equipment 4.9 -1.4 2.7 5.9 5.2 4.7 5.5Buses 6.0 4.4 1.1 4.6 4.3 3.5 3.3Volvo Penta 13.5 6.3 15.6 14.5 14.5 14.9 13.2Industrial Operations 5.8 5.1 7.0 4.3 6.3 5.8 7.7Volvo Group 6.3 5.7 7.5 4.8 6.8 6.3 8.1
Adjusted operating margin% 3/2015 4/2015 1/2016 2/2016 3/2016
Trucks 7.2 7.9 7.8 10.0 8.2 8.7 7.4Construction Equipment 4.8 -1.7 2.7 5.9 5.2 4.7 5.7Buses 6.1 4.0 1.1 4.6 4.3 3.5 3.4Volvo Penta 13.5 6.3 15.6 14.5 14.5 14.9 13.4Industrial Operations 6.4 5.2 5.7 7.4 6.5 6.6 6.3Volvo Group 6.9 5.7 6.2 7.8 7.0 7.0 6.7
First nine months
2016
First nine months
2015
First nine months
2016
First nine months
2015
First nine months
2015
First nine months
2015
First nine months
2016
First nine months
2015
First nine months
2016
First nine months
2016
23 Report on the third quarter 2016
QUARTERLY FIGURES
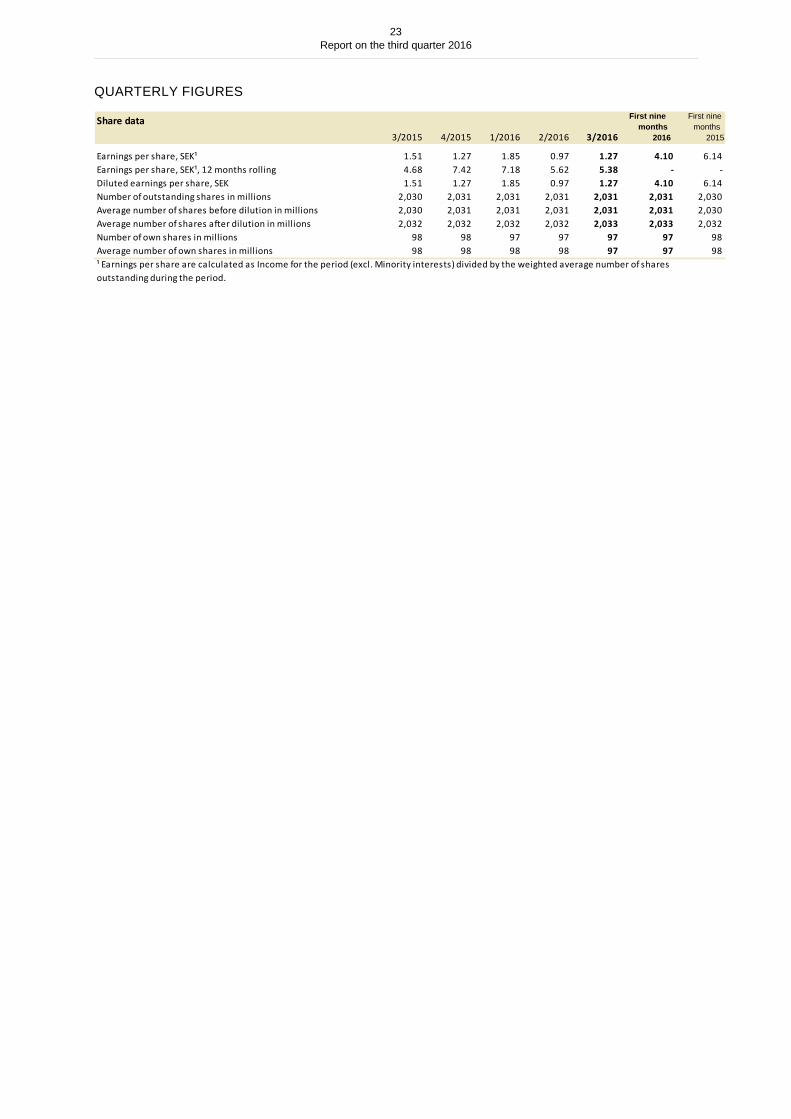
Share data3/2015 4/2015 1/2016 2/2016 3/2016
Earnings per share, SEK¹ 1.51 1.27 1.85 0.97 1.27 4.10 6.14Earnings per share, SEK¹, 12 months rolling 4.68 7.42 7.18 5.62 5.38 - -Diluted earnings per share, SEK 1.51 1.27 1.85 0.97 1.27 4.10 6.14Number of outstanding shares in millions 2,030 2,031 2,031 2,031 2,031 2,031 2,030Average number of shares before dilution in millions 2,030 2,031 2,031 2,031 2,031 2,031 2,030Average number of shares after dilution in millions 2,032 2,032 2,032 2,032 2,033 2,033 2,032Number of own shares in millions 98 98 97 97 97 97 98Average number of own shares in millions 98 98 98 98 97 97 98
First nine months
2015
¹ Earnings per share are calculated as Income for the period (excl. Minority interests) divided by the weighted average number of shares outstanding during the period.
First nine months
2016

24 Report on the third quarter 2016
NOTE 1 | ACCOUNTING PRINCIPLESThe Volvo Group applies International Financial Reporting Standards (IFRS) as endorsed by the EU. The accounting principles adopted and definitions are consistent with those described in the Volvo Group Annual Report 2015 (available at www.volvogroup.com). There are no new accounting principles applicable from 2016 that significantly affects the Volvo Group.
This interim report has been prepared in accordance with IAS 34 Interim Financial Reporting and the Swedish Annual Accounts Act. The parent company applies the Swedish Annual Accounts Act and RFR 2 Reporting for legal entities.
NOTE 2 | RISKS AND KEY SOURCES OF ESTIMATION UNCERTAINTY All business operations involve risk – managed risk-taking is a condition of maintaining a sustained favorable profitability. Risk may be due to events in the world and can affect a given industry or market. Risk can be specific to a single company. Volvo works continuously to identify, measure and manage risk, and in some cases Volvo can influence the likelihood that a risk-related event will occur. In cases in which such events are beyond Volvo’s control, the aim is to minimize the consequences. The risks to which the Volvo Group is exposed are classified into three main categories: External-related risks – such as the cyclical nature of the commercial vehicles business, intense competition, changes in prices for commercial vehicles and government regulations; Financial risks – such as currency fluctuations, interest levels fluctuations, valuations of shares or similar instruments, credit risk and liquidity risk and; Operational risks – such as market reception of new products, reliance on suppliers, protection and maintenance of intangible assets, complaints and legal actions by customers and other third parties and risk related to human capital. For a more elaborate account of these risks, please refer to the Risk Management section on pages 107-109 in the Volvo Group Annual Report 2015 (available at www.volvogroup.com). Risk updates for the period Short-term risks, when applicable, are also described in the respective segment section of this report. An increase in demand could potentially result in delivery disturbances due to suppliers’ financial instability or shortage of resources. Uncertainty regarding customers’ access to the financing of products in emerging markets might have a negative impact on demand. Volvo verifies annually, or more frequently if necessary, the goodwill value of its business areas and other intangible assets for possible impairment. The size of the surplus value differs between the business areas and they are, to a varying degree, sensitive to changes in the business environment.
Instability in the business recovery and volatility in interest and currency rates may lead to indications of impairment. The reported amounts for contingent liabilities reflect a part of Volvo’s risk exposure. Total contingent liabilities as of September 30, 2016, amounted to SEK 15.7 billion, the same level as December 31, 2015. The gross exposure of SEK 15.7 billion is partly reduced by counter guarantees and collaterals. The contingent liabilities for credit guarantees for construction equipment in China have decreased. However, including both contingent liabilities and on-balance sheet exposure the credit risk is still significant, and in the third quarter of 2016 an additional cost for credit losses of SEK 96 M was recognized. The decrease in the contingent liabilities for credit guarantees are offset by increased tax claims and residual value guarantees. In July 2016, the Volvo Group reached a settlement with the European Commission in the EU competition investigation. As part of the settlement, Volvo has paid fine of EUR 670 M (SEK 6.3 bn).The amount was mainly covered by provisions made in 2014 and 2016, in aggregate EUR 650 M (SEK 6.1 bn). An additional provision had a negative impact of EUR 20 M (SEK 190 M) on the operating income in the third quarter of 2016. The full fine was paid in October 2016. Following the adoption of the European Commission’s settlement decision, the Volvo Group will be dealing with private damages claims from customers and other third parties alleging that they suffered loss by reason of the conduct covered in the decision. At this stage it is not possible to make a reliable estimate of the amount of any liability that could arise from any such proceedings. In the matter regarding the competition investigation initiated by the Korean Fair Trade Commission (KFTC), a decision was rendered in August 2016 by the High Court in Seoul which found in favor of Volvo’s appeal of the fine imposed by KFTC of approximately SEK 133 M (as of September 30, 2016). The KFTC filed an appeal of the High Court decision to the Supreme Court in September 2016. The previously disclosed contingent liability corresponding to the fine amount remains. The other legal proceedings and investigations described in note 21 and note 24 in the Volvo Group Annual Report 2015 are progressing but no material changes have occurred in these matters in the third quarter of 2016.
25 Report on the third quarter 2016
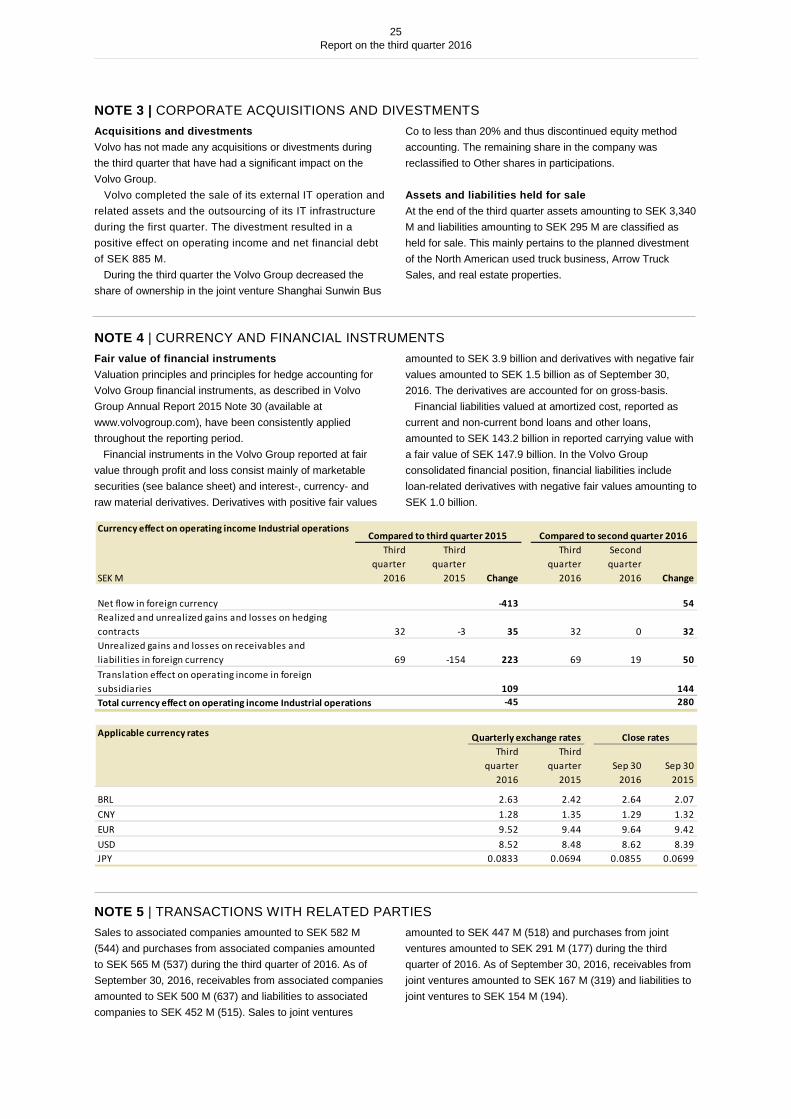
NOTE 3 | CORPORATE ACQUISITIONS AND DIVESTMENTSAcquisitions and divestments Volvo has not made any acquisitions or divestments during the third quarter that have had a significant impact on the Volvo Group. Volvo completed the sale of its external IT operation and related assets and the outsourcing of its IT infrastructure during the first quarter. The divestment resulted in a positive effect on operating income and net financial debt of SEK 885 M.
During the third quarter the Volvo Group decreased the share of ownership in the joint venture Shanghai Sunwin Bus
Co to less than 20% and thus discontinued equity method accounting. The remaining share in the company was reclassified to Other shares in participations. Assets and liabilities held for sale At the end of the third quarter assets amounting to SEK 3,340 M and liabilities amounting to SEK 295 M are classified as held for sale. This mainly pertains to the planned divestment of the North American used truck business, Arrow Truck Sales, and real estate properties.
NOTE 4 | CURRENCY AND FINANCIAL INSTRUMENTS Fair value of financial instruments Valuation principles and principles for hedge accounting for Volvo Group financial instruments, as described in Volvo Group Annual Report 2015 Note 30 (available at www.volvogroup.com), have been consistently applied throughout the reporting period. Financial instruments in the Volvo Group reported at fair value through profit and loss consist mainly of marketable securities (see balance sheet) and interest-, currency- and raw material derivatives. Derivatives with positive fair values
amounted to SEK 3.9 billion and derivatives with negative fair values amounted to SEK 1.5 billion as of September 30, 2016. The derivatives are accounted for on gross-basis. Financial liabilities valued at amortized cost, reported as current and non-current bond loans and other loans, amounted to SEK 143.2 billion in reported carrying value with a fair value of SEK 147.9 billion. In the Volvo Group consolidated financial position, financial liabilities include loan-related derivatives with negative fair values amounting to SEK 1.0 billion.
NOTE 5 | TRANSACTIONS WITH RELATED PARTIES Sales to associated companies amounted to SEK 582 M (544) and purchases from associated companies amounted to SEK 565 M (537) during the third quarter of 2016. As of September 30, 2016, receivables from associated companies amounted to SEK 500 M (637) and liabilities to associated companies to SEK 452 M (515). Sales to joint ventures
amounted to SEK 447 M (518) and purchases from joint ventures amounted to SEK 291 M (177) during the third quarter of 2016. As of September 30, 2016, receivables from joint ventures amounted to SEK 167 M (319) and liabilities to joint ventures to SEK 154 M (194).
Currency effect on operating income Industrial operations
SEK M
Third quarter
2016
Third quarter
2015 Change
Third quarter
2016
Second quarter
2016 Change
Net flow in foreign currency -413 54Realized and unrealized gains and losses on hedging contracts 32 -3 35 32 0 32Unrealized gains and losses on receivables and liabilities in foreign currency 69 -154 223 69 19 50Translation effect on operating income in foreign subsidiaries 109 144Total currency effect on operating income Industrial operations -45 280
Applicable currency rates
Third quarter
2016
Third quarter
2015Sep 30
2016Sep 30
2015
BRL 2.63 2.42 2.64 2.07CNY 1.28 1.35 1.29 1.32EUR 9.52 9.44 9.64 9.42USD 8.52 8.48 8.62 8.39JPY 0.0833 0.0694 0.0855 0.0699
Compared to third quarter 2015 Compared to second quarter 2016
Close ratesQuarterly exchange rates
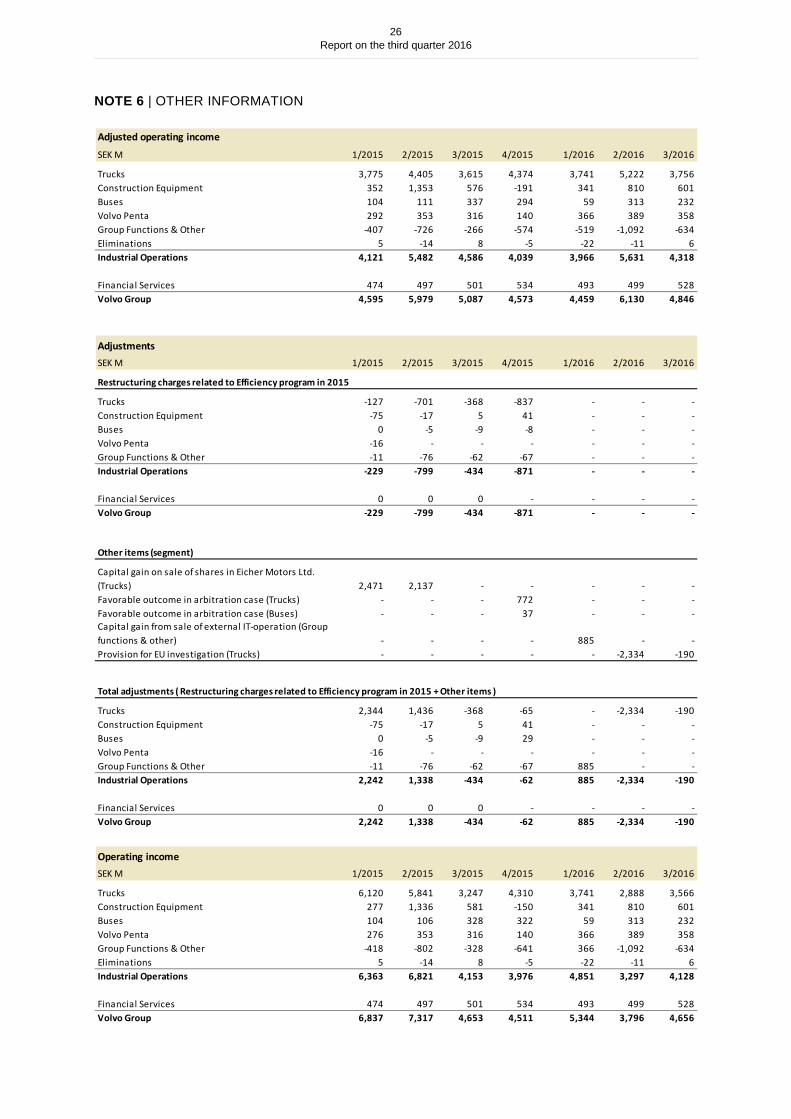
26 Report on the third quarter 2016
NOTE 6 | OTHER INFORMATION
Adjusted operating income
SEK M 1/2015 2/2015 3/2015 4/2015 1/2016 2/2016 3/2016
Trucks 3,775 4,405 3,615 4,374 3,741 5,222 3,756Construction Equipment 352 1,353 576 -191 341 810 601Buses 104 111 337 294 59 313 232Volvo Penta 292 353 316 140 366 389 358Group Functions & Other -407 -726 -266 -574 -519 -1,092 -634Eliminations 5 -14 8 -5 -22 -11 6Industrial Operations 4,121 5,482 4,586 4,039 3,966 5,631 4,318
Financial Services 474 497 501 534 493 499 528Volvo Group 4,595 5,979 5,087 4,573 4,459 6,130 4,846
AdjustmentsSEK M 1/2015 2/2015 3/2015 4/2015 1/2016 2/2016 3/2016
Restructuring charges related to Efficiency program in 2015
Trucks -127 -701 -368 -837 - - -Construction Equipment -75 -17 5 41 - - -Buses 0 -5 -9 -8 - - -Volvo Penta -16 - - - - - -Group Functions & Other -11 -76 -62 -67 - - -Industrial Operations -229 -799 -434 -871 - - -
Financial Services 0 0 0 - - - -Volvo Group -229 -799 -434 -871 - - -
Other items (segment)
2,471 2,137 - - - - -Favorable outcome in arbitration case (Trucks) - - - 772 - - -Favorable outcome in arbitration case (Buses) - - - 37 - - -
- - - - 885 - -Provision for EU investigation (Trucks) - - - - - -2,334 -190
Total adjustments ( Restructuring charges related to Efficiency program in 2015 + Other items )
Trucks 2,344 1,436 -368 -65 - -2,334 -190Construction Equipment -75 -17 5 41 - - -Buses 0 -5 -9 29 - - -Volvo Penta -16 - - - - - -Group Functions & Other -11 -76 -62 -67 885 - -Industrial Operations 2,242 1,338 -434 -62 885 -2,334 -190
Financial Services 0 0 0 - - - -Volvo Group 2,242 1,338 -434 -62 885 -2,334 -190
Operating incomeSEK M 1/2015 2/2015 3/2015 4/2015 1/2016 2/2016 3/2016
Trucks 6,120 5,841 3,247 4,310 3,741 2,888 3,566Construction Equipment 277 1,336 581 -150 341 810 601Buses 104 106 328 322 59 313 232Volvo Penta 276 353 316 140 366 389 358Group Functions & Other -418 -802 -328 -641 366 -1,092 -634Eliminations 5 -14 8 -5 -22 -11 6Industrial Operations 6,363 6,821 4,153 3,976 4,851 3,297 4,128
Financial Services 474 497 501 534 493 499 528Volvo Group 6,837 7,317 4,653 4,511 5,344 3,796 4,656
Capital gain from sale of external IT-operation (Group functions & other)
Capital gain on sale of shares in Eicher Motors Ltd. (Trucks)
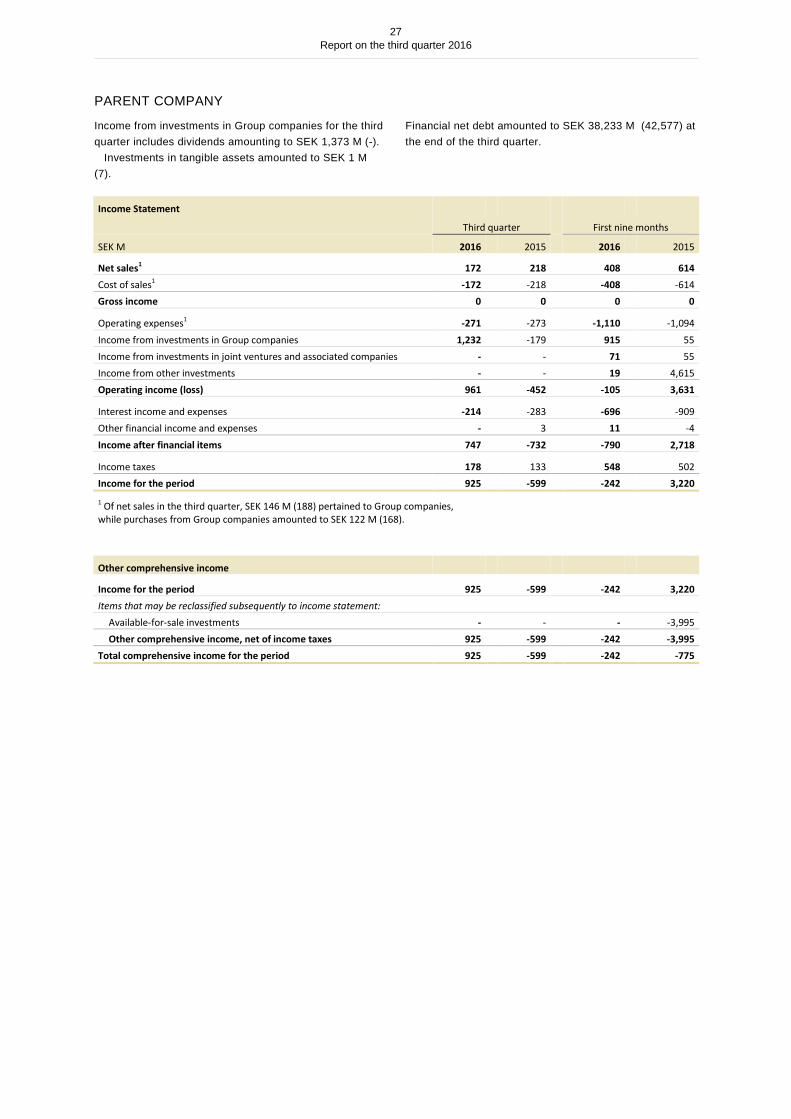
27 Report on the third quarter 2016
PARENT COMPANY
Income from investments in Group companies for the third quarter includes dividends amounting to SEK 1,373 M (-). Investments in tangible assets amounted to SEK 1 M (7).
Financial net debt amounted to SEK 38,233 M (42,577) at the end of the third quarter.
Income Statement
Third quarter First nine months
SEK M 2016
2015 2016 2015
Net sales1 172
218 408 614 Cost of sales1 -172
-218 -408 -614
Gross income 0
0 0 0
Operating expenses1 -271
-273 -1,110 -1,094 Income from investments in Group companies 1,232
-179 915 55
Income from investments in joint ventures and associated companies -
- 71 55 Income from other investments -
- 19 4,615
Operating income (loss) 961
-452 -105 3,631
Interest income and expenses -214
-283 -696 -909 Other financial income and expenses -
3 11 -4
Income after financial items 747
-732 -790 2,718
Income taxes 178
133 548 502 Income for the period 925
-599 -242 3,220
1 Of net sales in the third quarter, SEK 146 M (188) pertained to Group companies, while purchases from Group companies amounted to SEK 122 M (168).
Other comprehensive income
Income for the period 925 -599 -242 3,220 Items that may be reclassified subsequently to income statement:
Available-for-sale investments - - - -3,995 Other comprehensive income, net of income taxes 925 -599 -242 -3,995
Total comprehensive income for the period 925 -599 -242 -775
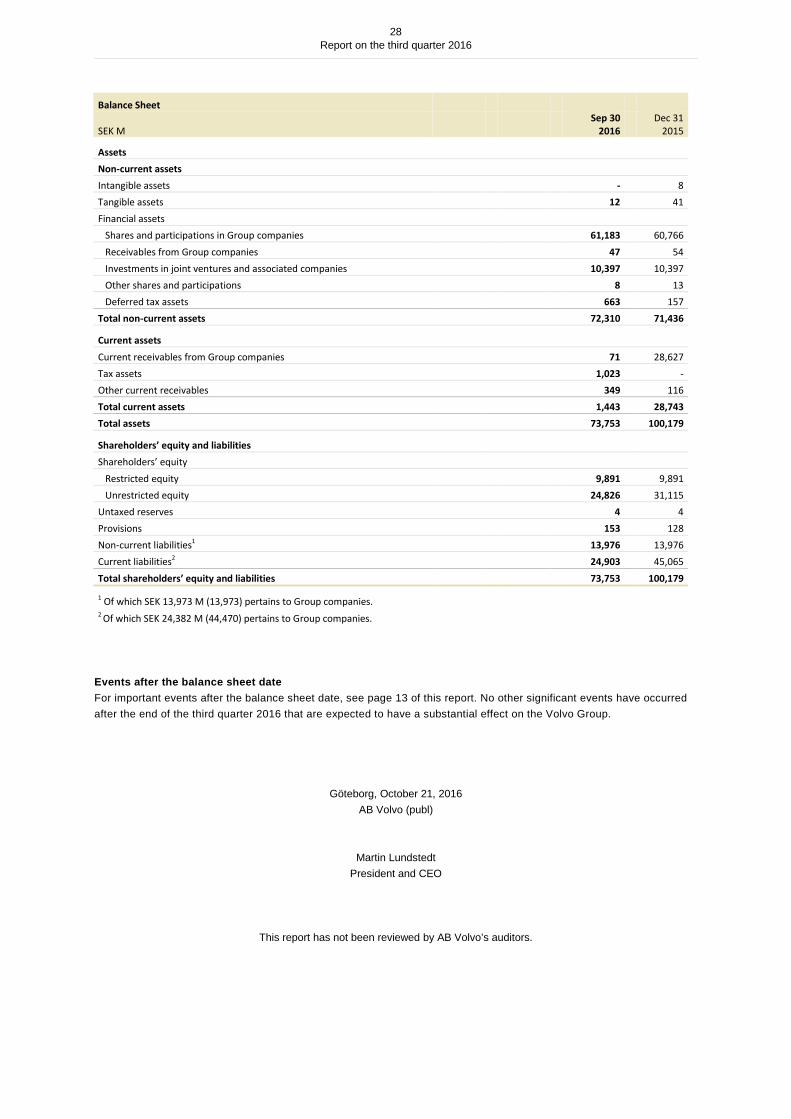
28 Report on the third quarter 2016
Balance Sheet
SEK M Sep 30
2016 Dec 31
2015
Assets Non-current assets Intangible assets - 8 Tangible assets 12 41 Financial assets Shares and participations in Group companies 61,183 60,766 Receivables from Group companies 47 54 Investments in joint ventures and associated companies 10,397 10,397 Other shares and participations 8 13 Deferred tax assets 663 157 Total non-current assets 72,310 71,436
Current assets Current receivables from Group companies 71 28,627 Tax assets 1,023 - Other current receivables 349 116 Total current assets 1,443 28,743 Total assets 73,753 100,179
Shareholders’ equity and liabilities Shareholders’ equity Restricted equity 9,891 9,891 Unrestricted equity 24,826 31,115 Untaxed reserves 4 4 Provisions 153 128 Non-current liabilities1 13,976 13,976 Current liabilities2 24,903 45,065 Total shareholders’ equity and liabilities 73,753 100,179
1 Of which SEK 13,973 M (13,973) pertains to Group companies. 2 Of which SEK 24,382 M (44,470) pertains to Group companies.
Events after the balance sheet date For important events after the balance sheet date, see page 13 of this report. No other significant events have occurred after the end of the third quarter 2016 that are expected to have a substantial effect on the Volvo Group.
Göteborg, October 21, 2016 AB Volvo (publ)
Martin Lundstedt President and CEO
This report has not been reviewed by AB Volvo’s auditors.

29 Report on the third quarter 2016
NET ORDER INTAKE
Net order intake of trucks by brandNumber of trucks 2016 2015 2016 2015
VolvoEurope 11,675 10,401 12 40,688 35,792 14North America 3,223 6,600 -51 12,472 25,951 -52South America 2,759 1,984 39 6,300 5,753 10Asia 3,089 3,621 -15 8,938 10,188 -12Africa and Oceania 903 944 -4 3,692 3,778 -2Total Volvo 21,649 23,550 -8 72,090 81,462 -12
Heavy duty (>16 tons) 20,927 22,818 -8 69,609 79,309 -12Medium duty (7-16 tons) 722 732 -1 2,481 2,153 15Total Volvo 21,649 23,550 -8 72,090 81,462 -12
UDNorth America 20 98 -80 67 121 -45South America - 39 - 97 138 -30Asia 3,970 3,673 8 12,852 13,042 -1Africa and Oceania 774 816 -5 2,450 2,653 -8Total UD 4,764 4,626 3 15,466 15,954 -3
Heavy duty (>16 tons) 3,346 3,154 6 10,242 10,446 -2Medium duty (7-16 tons) 1,296 1,258 3 4,643 4,933 -6Light duty (<7 tons) 122 214 -43 581 575 1Total UD 4,764 4,626 3 15,466 15,954 -3
Renault TrucksEurope 8,193 8,314 -1 32,370 31,427 3North America 36 34 6 181 171 6South America 7 15 -53 16 46 -65Asia 197 248 -21 963 1,502 -36Africa and Oceania 731 1,294 -44 2,274 2,497 -9Total Renault Trucks 9,164 9,905 -7 35,804 35,643 0
Heavy duty (>16 tons) 5,308 4,950 7 19,321 20,113 -4Medium duty (7-16 tons) 945 776 22 3,674 3,347 10Light duty (<7 tons) 2,911 4,179 -30 12,809 12,183 5Total Renault Trucks 9,164 9,905 -7 35,804 35,643 0
MackNorth America 3,485 4,013 -13 10,403 14,321 -27South America 192 138 39 554 785 -29Asia - 14 - - 19 -Africa and Oceania 226 402 -44 631 785 -20Total Mack 3,903 4,567 -15 11,588 15,910 -27
Heavy duty (>16 tons) 3,903 4,567 -15 11,588 15,910 -27Total Mack 3,903 4,567 -15 11,588 15,910 -27
Third quarter Change%
First nine months Change%
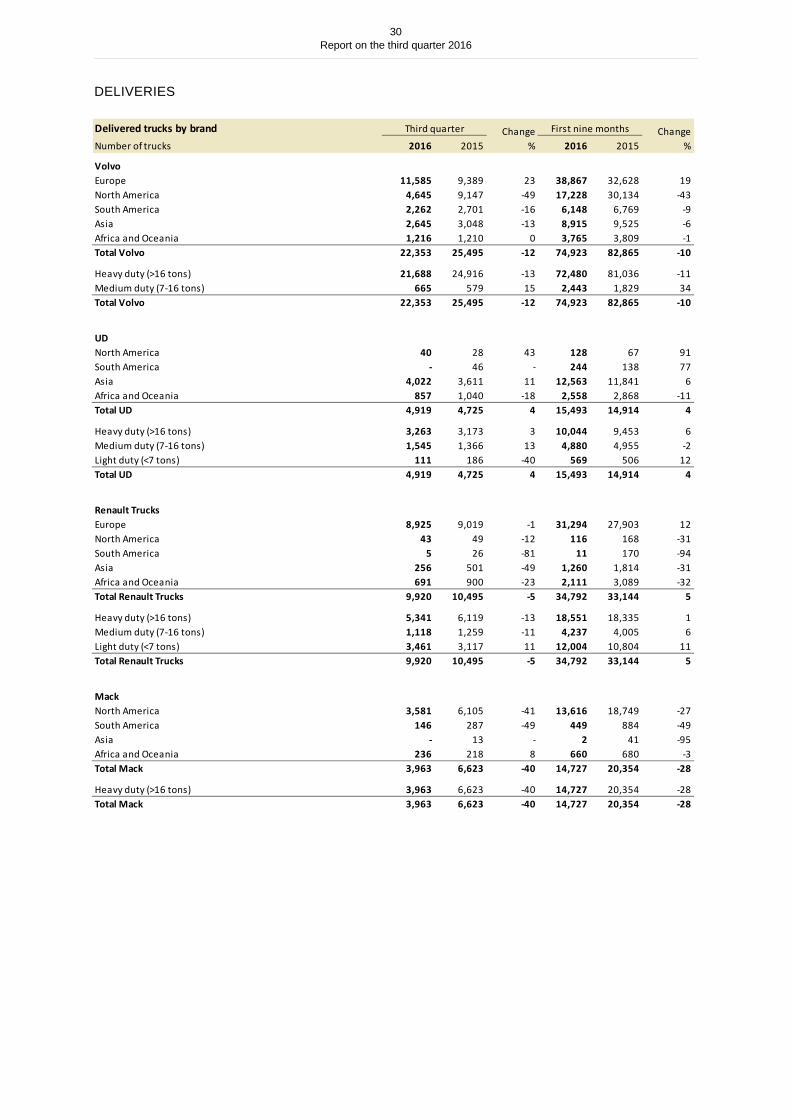
30 Report on the third quarter 2016
DELIVERIES
Delivered trucks by brandNumber of trucks 2016 2015 2016 2015
VolvoEurope 11,585 9,389 23 38,867 32,628 19North America 4,645 9,147 -49 17,228 30,134 -43South America 2,262 2,701 -16 6,148 6,769 -9Asia 2,645 3,048 -13 8,915 9,525 -6Africa and Oceania 1,216 1,210 0 3,765 3,809 -1Total Volvo 22,353 25,495 -12 74,923 82,865 -10
Heavy duty (>16 tons) 21,688 24,916 -13 72,480 81,036 -11Medium duty (7-16 tons) 665 579 15 2,443 1,829 34Total Volvo 22,353 25,495 -12 74,923 82,865 -10
UDNorth America 40 28 43 128 67 91South America - 46 - 244 138 77Asia 4,022 3,611 11 12,563 11,841 6Africa and Oceania 857 1,040 -18 2,558 2,868 -11Total UD 4,919 4,725 4 15,493 14,914 4
Heavy duty (>16 tons) 3,263 3,173 3 10,044 9,453 6Medium duty (7-16 tons) 1,545 1,366 13 4,880 4,955 -2Light duty (<7 tons) 111 186 -40 569 506 12Total UD 4,919 4,725 4 15,493 14,914 4
Renault TrucksEurope 8,925 9,019 -1 31,294 27,903 12North America 43 49 -12 116 168 -31South America 5 26 -81 11 170 -94Asia 256 501 -49 1,260 1,814 -31Africa and Oceania 691 900 -23 2,111 3,089 -32Total Renault Trucks 9,920 10,495 -5 34,792 33,144 5
Heavy duty (>16 tons) 5,341 6,119 -13 18,551 18,335 1Medium duty (7-16 tons) 1,118 1,259 -11 4,237 4,005 6Light duty (<7 tons) 3,461 3,117 11 12,004 10,804 11Total Renault Trucks 9,920 10,495 -5 34,792 33,144 5
MackNorth America 3,581 6,105 -41 13,616 18,749 -27South America 146 287 -49 449 884 -49Asia - 13 - 2 41 -95Africa and Oceania 236 218 8 660 680 -3Total Mack 3,963 6,623 -40 14,727 20,354 -28
Heavy duty (>16 tons) 3,963 6,623 -40 14,727 20,354 -28Total Mack 3,963 6,623 -40 14,727 20,354 -28
Third quarter Change%
First nine months Change%
31 Report on the third quarter 2016
This information is information that AB Volvo (publ) is obliged to make public pursuant to the EU Market Abuse Regulation. The information was submitted for publication, through the agency of the contact person set out above, at 7.20 CET on October 21, 2016. This report contains forward-looking statements that reflect the Board of Directors’ and management’s current views with respect to certain future events and potential financial performance. Although the Board of Directors and the management believe that the expectations reflected in such forward-looking statements are reasonable, no assurance can be given that such expectations will prove to have been correct. Accordingly, results could differ materially from those set out in the forward-looking statements as a result of, among other factors, (i) changes in economic, market and competitive conditions, (ii) success of business and operating initiatives, (iii) changes in the regulatory environment and other government actions, (iv) fluctuations in exchange rates and (v) business risk management. This report does not imply that the Company has undertaken to revise these forward-looking statements, beyond what is required under the company’s registration contract with Nasdaq Stockholm, if and when circumstances arise that will lead to changes compared to the date when these statements were provided.

Financial calendar
Report on the fourth quarter 2016 February 1, 2017
Annual and Sustainability Report 2016 March 2017
Annual General Meeting 2017 April 4, 2017
Report on the first quarter 2017 April 25, 2017
Report on the second quarter 2017 July 20, 2017
Report on the third quarter 2017 October 20, 2017
Contacts
Investor Relations:
Christer Johansson +46 31 66 13 34
Anders Christensson +46 31 66 11 91
Anna Sikström +46 31 66 13 36
Aktiebolaget Volvo (publ) 556012–5790 Investor Relations, VHQ SE-405 08 Göteborg, Sweden Tel +46 31 66 00 00 www.volvogroup.com