Embed Size (px)
Citation preview
Vortex Simulation of Two Cylinders in TandemUsing Overlapping Grid SystemWisnu Wardhana ( [email protected] )
Institut Teknologi Sepuluh Nopember https://orcid.org/0000-0002-8822-6420Ede Wardhana
Institut Teknologi Sepuluh NopemberMeitha Soetardjo
BPPT: Badan Pengkajian dan Penerapan Teknologi
Original Article
Keywords: �ow simulation, discrete vortex, cylinder, tandem , overlapping grid
Posted Date: November 24th, 2020
DOI: https://doi.org/10.21203/rs.3.rs-113057/v1
License: This work is licensed under a Creative Commons Attribution 4.0 International License. Read Full License
·1·
Title page
Vortex Simulation of Two Cylinders in Tandem Using Overlapping Grid System
Wisnu Wardhana, born in 1958, is currently an associate professor at Institut Teknologi Sepuluh Nopember Surabaya, Indonesia. He reveiced his bachelor degree of Naval Architecture in ITS Surabaya, master degree and PhD of Marine Technology at Newcastle Upon tyne University, UK. His research interests include hydrodynamics and fluid-structure interaction. Tel: +62 821 8384 8384; E-mail: [email protected]
Ede M. Wardhana, born in 1992, is currently a lecture of Marine Engineering Department at ITS Surabaya, Indonesia. He received his bachelor and master degree on Marine Engineering in ITS Surabaya, Indonesia, in 2013 and 2016.
Meitha Soetardjo, born in 1959, is currently an engineer at Laboratory of Hydrodynamic Technology, BPP Teknologi Surabaya, Indonesia and received bachelor degree in Naval Architect at ITS Surabaya, Indonesia.
Corresponding author:Wisnu Wardhana E-mail:[email protected]

Wisnu Wardhana.
·2·
ORIGINAL ARTICLE
Vortex Simulation of Two Cylinders in Tandem Using Overlapping Grid System
Wisnu Wardhana1, Ede M. Wardhana2, Meitha Soetardjo3 Received June xx, 201x; revised February xx, 201x; accepted March xx, 201x
© Chinese Mechanical Engineering Society and Springer-Verlag Berlin Heidelberg 2017
Abstract: To give a considerable time reduction in the calculation of the vortex velocity and in the CPU time, discrete vortex modelling of flows using overlapping grid system for two tandem cylinders is carried out. This simple and time efficient method gives a better scatter of surface vorticity as the vortices around the body are now calculated on grid point. This research is to simulate the loading on structural elements of the structures due to their interaction with anodes or with other members. To show the flow phenomena and interactions involved, the in-line and transverse force coefficients are presented. The comparison of the results with experimental and numerical results and the range for good results is presented. Keywords: flow simulation • discrete vortex • cylinder • tandem • overlapping grid
1 Introduction
There are two unusual features of flow in the experiment for two cylinders in tandem with various different gap ratios carried out by [1] that, firstly, the side facing the gap between the cylinders had a very low negative pressure which was almost the same as the corresponding value of the base pressure of the upstream cylinder. This fact is an indication that the flow around the gap is almost stagnant. Secondly, the negative gap pressure in front of the downstream cylinder exceeded that on its downstream face. This means that when the distance is less than a critical gap, the downstream cylinder experiences a negative drag-thrust
force. The vortex reduction scheme is used to simulate the turbulent dissipation in the wake downstream.
2 Basic Formulation
The complex potential w(z) can be formulated where 𝑁𝑏 is the number of cylinder, 𝛾𝑒𝑏 is the strength of vortices at element e of body b, 𝑑𝑆𝑒𝑏 is the length of element e of body b, 𝑧𝑒𝑏 is the position of element e of body b, 𝛤𝑒𝑏 is the strength of a vortex ν shed by cylinder b, 𝑧𝜈𝑏 is the position of a vortex ν shed by cylinder b, as follows, w(z)=u∞e-i∝∞z+ i2π∑∑γebdSeb ln(z-zeb)+ i2π∑∑Γvb ln(z-zvb)Nvb
v=1Nbb=1
Nebe=1
Nbb=1
(1)
In this study an overlapping grid system which has ‘square’ elements is used for individual cylinder to give good pattern of the flow close to the cylinder surface.
The grid node on the cylinder surface provides the control points at which equation (2) above is solved to zero tangential velocity to satisfy Dirichlet boundary condition [10].
The solution procedure for the induced velocity at an element Sn must include the influence of those two cylinders in the fluid domain. −12𝛾𝑚 + ∮ 𝑘𝑚𝑛𝛾𝑛𝑑𝑆𝑛𝑐𝑁𝑏 + �⃗� ∞ ∙ 𝑑 𝑆𝑚 + ∑ ∑𝑙𝑚𝑣Γ𝑣𝑏 = 0𝑁𝑣
𝑣=1𝑁𝑏𝑏=1 (2)
3 Methodology Equation (2) must satisfy the Dirichlet boundary
condition as follow, − 𝛾𝑚𝑝2 + ∑ ∑ ∆𝑆𝑛𝑞2𝜋 ℜ(𝑖𝛾𝑛𝑞𝑒𝑖𝛽𝑚𝑝𝑧𝑚𝑝 −𝑧𝑛𝑞 )𝑁𝑒𝑞𝑛=1𝑁𝑏𝑞=1 + ℜ(𝑢∞𝑒−𝑖(∝∞−𝛽𝑚𝑝 )) +∑ ∑ Γ𝑣𝑞2𝜋 ℜ( 𝑖𝑒𝑖𝛽𝑚𝑝𝑧𝑚𝑝 −𝑧𝑣𝑞) = 0 𝑁𝑣𝑣=1𝑁𝑏𝑞=1
(3)
Wisnu Wardhana
1 Department of Ocean Engineering, Institut Teknologi Sepuluh
Nopember Surabaya (ITS), Surabaya, Indonesia
2 Department of Marine Engineering, ITS Surabaya, Indonesia
3 Laboratory of Hydrodynamic Technology, BPP Teknologi
Surabaya, Indonesia
Vortex Simulation of Two Cylinders in Tandem Using Overlapping Grid System
·3·
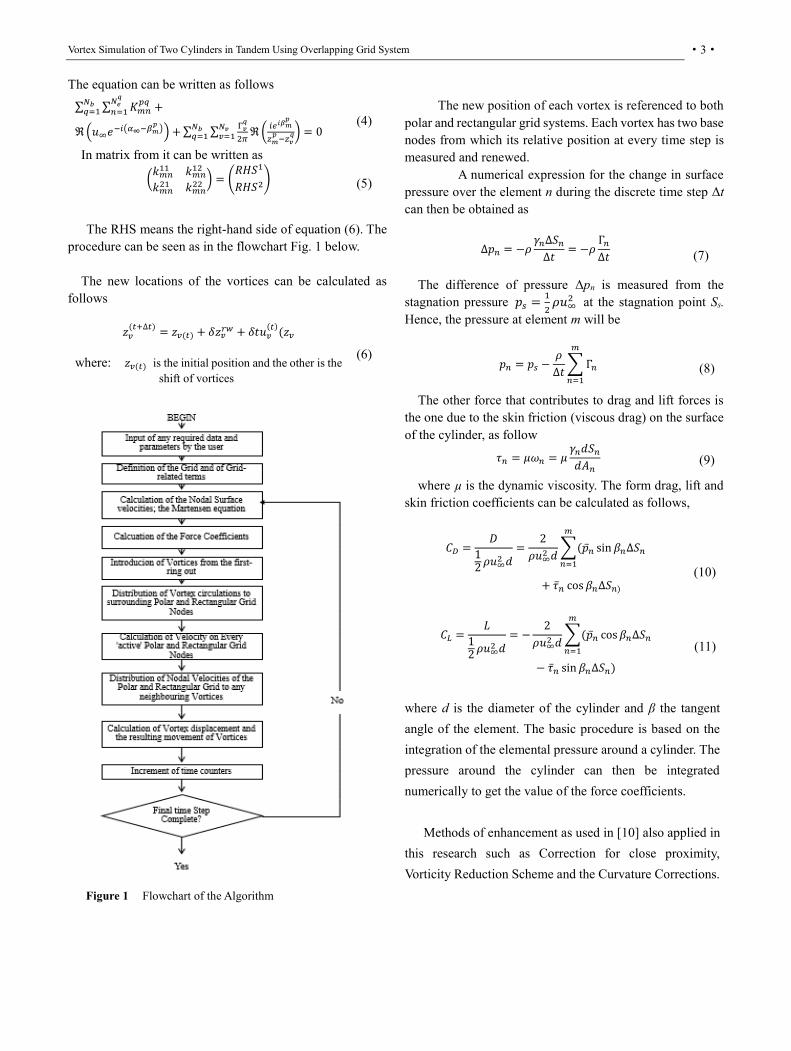
The equation can be written as follows ∑ ∑ 𝐾𝑚𝑛𝑝𝑞 +𝑁𝑒𝑞𝑛=1𝑁𝑏𝑞=1ℜ(𝑢∞𝑒−𝑖(𝛼∞−𝛽𝑚𝑝 )) +∑ ∑ Γ𝑣𝑞2𝜋 ℜ( 𝑖𝑒𝑖𝛽𝑚𝑝𝑧𝑚𝑝 −𝑧𝑣𝑞) = 0𝑁𝑣𝑣=1𝑁𝑏𝑞=1 (4)
In matrix from it can be written as (𝑘𝑚𝑛11 𝑘𝑚𝑛12𝑘𝑚𝑛21 𝑘𝑚𝑛22 ) = (𝑅𝐻𝑆1𝑅𝐻𝑆2) (5)
The RHS means the right-hand side of equation (6). The procedure can be seen as in the flowchart Fig. 1 below.
The new locations of the vortices can be calculated as follows 𝑧𝑣(𝑡+∆𝑡) = 𝑧𝑣(𝑡) + 𝛿𝑧𝑣𝑟𝑤 + 𝛿𝑡𝑢𝑣(𝑡)(𝑧𝑣
where: 𝑧𝑣(𝑡) is the initial position and the other is the
shift of vortices
(6)
The new position of each vortex is referenced to both polar and rectangular grid systems. Each vortex has two base nodes from which its relative position at every time step is measured and renewed.
A numerical expression for the change in surface pressure over the element n during the discrete time step Δt can then be obtained as
∆𝑝𝑛 = −𝜌 𝛾𝑛∆𝑆𝑛∆𝑡 = −𝜌 Γ𝑛Δ𝑡 (7)
The difference of pressure Δpn is measured from the stagnation pressure 𝑝𝑠 = 12 𝜌𝑢∞2 at the stagnation point Ss. Hence, the pressure at element m will be
𝑝𝑛 = 𝑝𝑠 − 𝜌Δ𝑡 ∑ Γ𝑛𝑚𝑛=1 (8)
The other force that contributes to drag and lift forces is the one due to the skin friction (viscous drag) on the surface of the cylinder, as follow 𝜏𝑛 = 𝜇𝜔𝑛 = 𝜇 𝛾𝑛𝑑𝑆𝑛𝑑𝐴𝑛 (9)
where µ is the dynamic viscosity. The form drag, lift and skin friction coefficients can be calculated as follows,
𝐶𝐷 = 𝐷12𝜌𝑢∞2 𝑑 = 2𝜌𝑢∞2 𝑑 ∑(�̅�𝑛 sin 𝛽𝑛Δ𝑆𝑛𝑚𝑛=1+ �̅�𝑛 cos𝛽𝑛Δ𝑆𝑛)
(10)
𝐶𝐿 = 𝐿12𝜌𝑢∞2 𝑑 = − 2𝜌𝑢∞2 𝑑 ∑(�̅�𝑛 cos𝛽𝑛Δ𝑆𝑛𝑚𝑛=1− �̅�𝑛 sin 𝛽𝑛Δ𝑆𝑛) (11)
where d is the diameter of the cylinder and β the tangent angle of the element. The basic procedure is based on the integration of the elemental pressure around a cylinder. The pressure around the cylinder can then be integrated numerically to get the value of the force coefficients.
Methods of enhancement as used in [10] also applied in this research such as Correction for close proximity, Vorticity Reduction Scheme and the Curvature Corrections.
Figure 1 Flowchart of the Algorithm
Wisnu Wardhana.
·4·
4 RESULTS
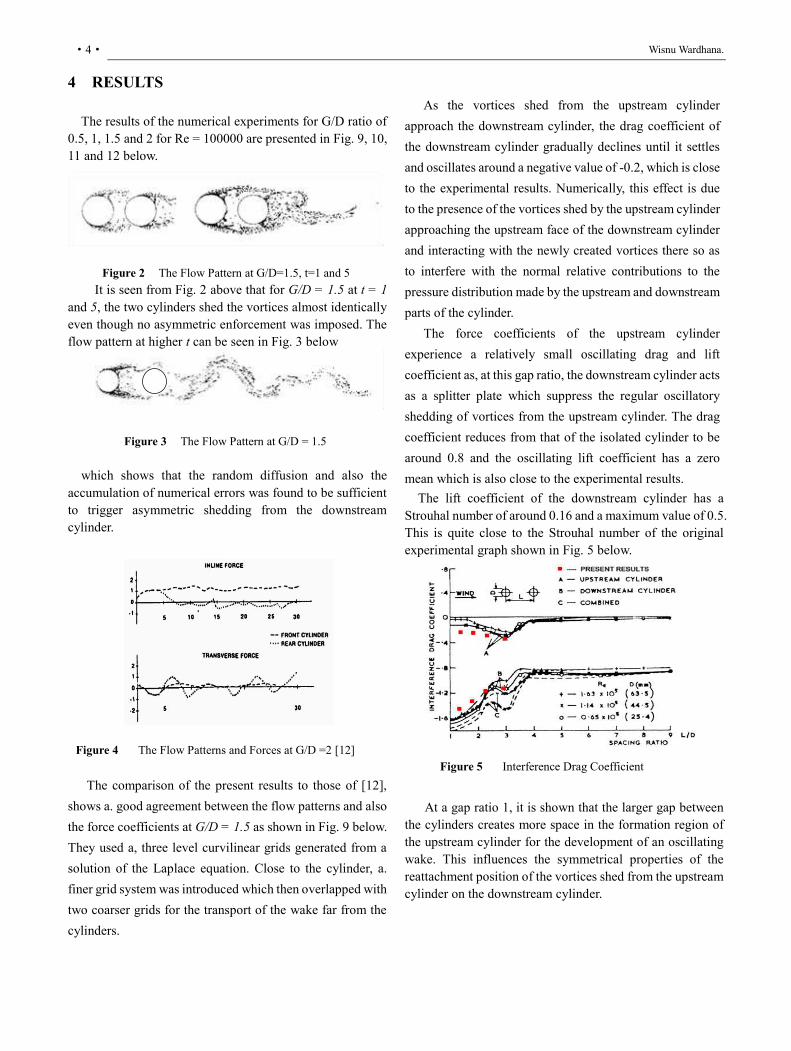
The results of the numerical experiments for G/D ratio of 0.5, 1, 1.5 and 2 for Re = 100000 are presented in Fig. 9, 10, 11 and 12 below.
It is seen from Fig. 2 above that for G/D = 1.5 at t = 1 and 5, the two cylinders shed the vortices almost identically even though no asymmetric enforcement was imposed. The flow pattern at higher t can be seen in Fig. 3 below
which shows that the random diffusion and also the accumulation of numerical errors was found to be sufficient to trigger asymmetric shedding from the downstream cylinder.
The comparison of the present results to those of [12], shows a. good agreement between the flow patterns and also the force coefficients at G/D = 1.5 as shown in Fig. 9 below. They used a, three level curvilinear grids generated from a solution of the Laplace equation. Close to the cylinder, a. finer grid system was introduced which then overlapped with two coarser grids for the transport of the wake far from the cylinders.
As the vortices shed from the upstream cylinder approach the downstream cylinder, the drag coefficient of the downstream cylinder gradually declines until it settles and oscillates around a negative value of -0.2, which is close to the experimental results. Numerically, this effect is due to the presence of the vortices shed by the upstream cylinder approaching the upstream face of the downstream cylinder and interacting with the newly created vortices there so as to interfere with the normal relative contributions to the pressure distribution made by the upstream and downstream parts of the cylinder.
The force coefficients of the upstream cylinder experience a relatively small oscillating drag and lift coefficient as, at this gap ratio, the downstream cylinder acts as a splitter plate which suppress the regular oscillatory shedding of vortices from the upstream cylinder. The drag coefficient reduces from that of the isolated cylinder to be around 0.8 and the oscillating lift coefficient has a zero mean which is also close to the experimental results.
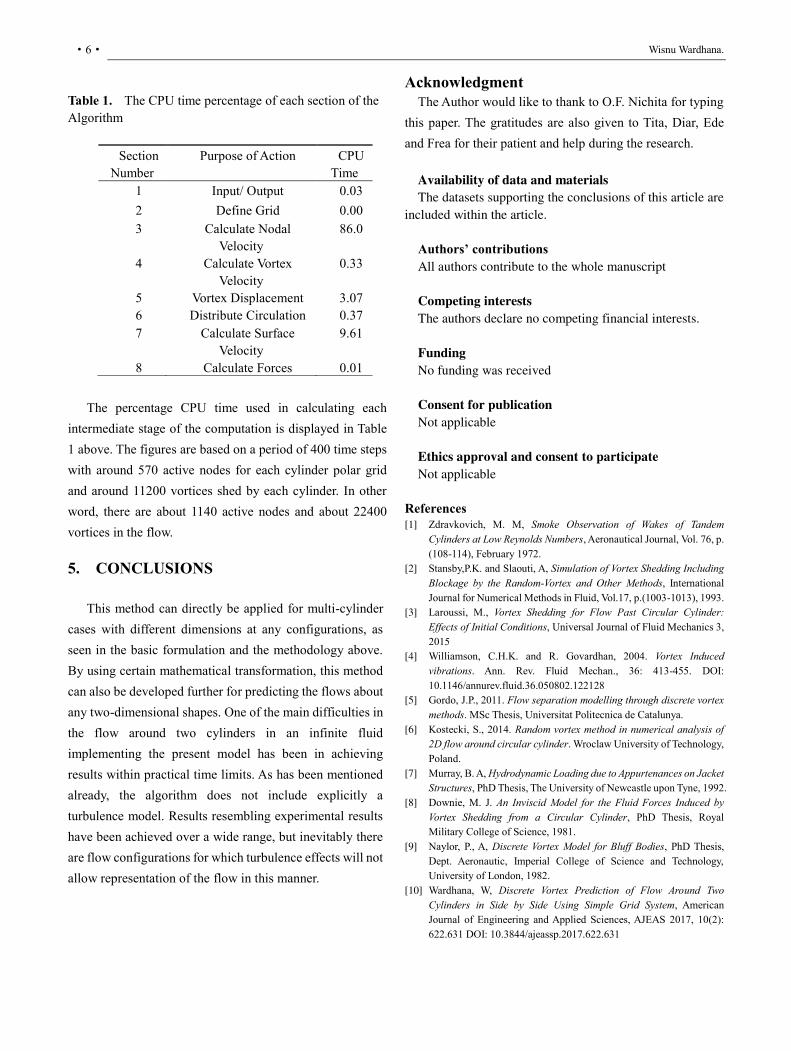
The lift coefficient of the downstream cylinder has a Strouhal number of around 0.16 and a maximum value of 0.5. This is quite close to the Strouhal number of the original experimental graph shown in Fig. 5 below.
At a gap ratio 1, it is shown that the larger gap between the cylinders creates more space in the formation region of the upstream cylinder for the development of an oscillating wake. This influences the symmetrical properties of the reattachment position of the vortices shed from the upstream cylinder on the downstream cylinder.
Figure 2 The Flow Pattern at G/D=1.5, t=1 and 5
Figure 3 The Flow Pattern at G/D = 1.5
Figure 4 The Flow Patterns and Forces at G/D =2 [12] Figure 5 Interference Drag Coefficient

Vortex Simulation of Two Cylinders in Tandem Using Overlapping Grid System
·5·
The oscillatory reattachment of the shear layers from the upstream cylinder causes an asymmetric vorticity distribution around the downstream cylinder. This phenomenon is reflected in the graphs of the force coefficients for the downstream cylinder, in which both the drag coefficient CD and the lift coefficient CL are oscillatory in nature. The lift coefficient is more oscillatory at a mean peak value 0.9 which is slightly higher than before. while the drag coefficient continues to oscillate about a zero mean, as shown in Fig. 8.
For gap ratio of G/D = 1.5, the larger gap causes the drag and lift coefficients of the downstream cylinder to oscillate more regularly about the zero mean. but there are no significant changes to the force coefficients of the upstream cylinder. This then creates a. more regular Von Karman vortex street behind the downstream cylinder, similar to that of a single cylinder in isolation.
As the gap ratio of G/D is increased to 2, oscillation of the lift coefficient of the upstream cylinder begins to appear. This shows that the upstream cylinder is just on the verge of shedding vortices as is shown also in the flow visualisation in Fig. 10 below in which the shape of the formation region of the upstream cylinder is regularly asymmetric relative to the downstream cylinder position. In turn, this influences the behaviour of the force coefficients of the downstream cylinder which become less regular and for which the mean value of the peak lift and drag coefficients are 0.5 and 0.8 respectively.
This behaviour is in line with the experimental results as described by [1] for which at around this gap ratio, a sudden jump in the Strouhal number occurs for the downstream cylinder. Regular vortex shedding was first detected behind
the upstream cylinder, as shown in the Strouhal number curve illustrated in Fig. 6 above.
In a numerical experiment using the Finite Element method [13] at a low Reynolds number of 100, found that a similar trend occurred at around this gap ratio and they divided the flow into Vortex Suppression and Vortex
Formation regimes at gap ratios of 1.5 and 3.5. In the vortex suppression regime, as in the previous case, the gap ratio is less than the critical spacing. The shear layers separating from the upstream cylinder reattach to the downstream cylinder so that vortices do not have sufficient room to grow, to develop or to be shed. Since the downstream flow is in the attached vortex region of the upstream cylinder, the oncoming stream to the downstream cylinder is quite weak. When the gap ratio is greater than its critical value, as in the present case, a vortex formation regime begins to appear from behind both cylinders. The occurrence of vortex shedding between the two cylinders creates an oscillatory oncoming flow upstream of the downstream cylinder and this leads to a stronger oscillatory flow behind the downstream cylinder.
Experimental evidence, and also the results presented in Fig. 10, show that for a gap ratio greater than 2, the general trend of the flow visualisations and the associated force coefficients of the upstream cylinder behaves more and more like an isolated cylinder with the interference drag coefficient approaching to zero. The drag coefficient of the downstream cylinder, however, shows a consistently lower value than that of an isolated cylinder and settles at a value of around 0.5, which is slightly higher than the experimental values. The lift coefficient oscillates with Strouhal number 0.18 which is slightly less than that of the isolated cylinder.
For higher gap ratios, however, the present model failed to simulate the flow phenomena. This is because the formation region of the upstream cylinder imposes a strong unstable asymmetric distribution of newly created vorticity upon the downstream cylinder which develops to create all unrealistic flow pattern and corresponding force coefficients for both cylinders.
The results for the drag coefficient for the gap ratio G/D less than 2 have been compiled and are displayed in Fig. 8. The above results have also been represented in terms of the interference drag coefficient by deducting a drag for the isolated cylinder of 1.1. It is found that fairly good results are achieved for this particular range of the gap ratios.
Figure 6 The Strouhal Number Behind Cylinder in Tandem from [1]
Wisnu Wardhana.
·6·
Table 1. The CPU time percentage of each section of the Algorithm
The percentage CPU time used in calculating each intermediate stage of the computation is displayed in Table 1 above. The figures are based on a period of 400 time steps with around 570 active nodes for each cylinder polar grid and around 11200 vortices shed by each cylinder. In other word, there are about 1140 active nodes and about 22400 vortices in the flow.
5. CONCLUSIONS
This method can directly be applied for multi-cylinder cases with different dimensions at any configurations, as seen in the basic formulation and the methodology above. By using certain mathematical transformation, this method can also be developed further for predicting the flows about any two-dimensional shapes. One of the main difficulties in the flow around two cylinders in an infinite fluid implementing the present model has been in achieving results within practical time limits. As has been mentioned already, the algorithm does not include explicitly a turbulence model. Results resembling experimental results have been achieved over a wide range, but inevitably there are flow configurations for which turbulence effects will not allow representation of the flow in this manner.
Acknowledgment The Author would like to thank to O.F. Nichita for typing
this paper. The gratitudes are also given to Tita, Diar, Ede and Frea for their patient and help during the research.
Availability of data and materials
The datasets supporting the conclusions of this article are
included within the article.
Authors’ contributions
All authors contribute to the whole manuscript
Competing interests
The authors declare no competing financial interests.
Funding
No funding was received
Consent for publication
Not applicable
Ethics approval and consent to participate
Not applicable
References
[1] Zdravkovich, M. M, Smoke Observation of Wakes of Tandem Cylinders at Low Reynolds Numbers, Aeronautical Journal, Vol. 76, p. (108-114), February 1972.
[2] Stansby,P.K. and Slaouti, A, Simulation of Vortex Shedding Including Blockage by the Random-Vortex and Other Methods, International Journal for Numerical Methods in Fluid, Vol.17, p.(1003-1013), 1993.
[3] Laroussi, M., Vortex Shedding for Flow Past Circular Cylinder: Effects of Initial Conditions, Universal Journal of Fluid Mechanics 3, 2015
[4] Williamson, C.H.K. and R. Govardhan, 2004. Vortex Induced vibrations. Ann. Rev. Fluid Mechan., 36: 413-455. DOI: 10.1146/annurev.fluid.36.050802.122128
[5] Gordo, J.P., 2011. Flow separation modelling through discrete vortex methods. MSc Thesis, Universitat Politecnica de Catalunya.
[6] Kostecki, S., 2014. Random vortex method in numerical analysis of 2D flow around circular cylinder. Wroclaw University of Technology, Poland.
[7] Murray, B. A, Hydrodynamic Loading due to Appurtenances on Jacket Structures, PhD Thesis, The University of Newcastle upon Tyne, 1992.
[8] Downie, M. J. An Inviscid Model for the Fluid Forces Induced by Vortex Shedding from a Circular Cylinder, PhD Thesis, Royal Military College of Science, 1981.
[9] Naylor, P., A, Discrete Vortex Model for Bluff Bodies, PhD Thesis, Dept. Aeronautic, Imperial College of Science and Technology, University of London, 1982.
[10] Wardhana, W, Discrete Vortex Prediction of Flow Around Two Cylinders in Side by Side Using Simple Grid System, American Journal of Engineering and Applied Sciences, AJEAS 2017, 10(2): 622.631 DOI: 10.3844/ajeassp.2017.622.631
Section Number
Purpose of Action CPU Time
1 Input/ Output 0.03
2 Define Grid 0.00
3 Calculate Nodal Velocity
86.0
4
Calculate Vortex Velocity
0.33
5 Vortex Displacement 3.07
6 Distribute Circulation 0.37
7 Calculate Surface Velocity
9.61
8 Calculate Forces 0.01

Vortex Simulation of Two Cylinders in Tandem Using Overlapping Grid System
·7·
[11] Chorin, A. J, Vortex Sheet Approximation of Boundary layers, Journal of Computational Physics, Vol. 27, p. (428-442), 1978.
[12] Hansen, E. Asp., Yde, L. and Jacobsen, V, Simulated Turbulent Flow and Forces Around Groups of Cylinders, Offshore Technology Coference, Paper No. 6577, p. (143-154), 1991
[13] Sun, J., Li, J. and Roux, B, Flow Regimes and Frequency Selection of a Cylinder Oscillating in an Upstream Cylinder Wake, International Journal for Numerical Method in Fluid, Vol. 16, p.(915-929), 1993.
Biographical notes
Wisnu Wardhana, born in 1958, is currently an associate professor at Institut Teknologi Sepuluh Nopember Surabaya, Indonesia. He reveiced his bachelor degree of Naval Architecture in ITS Surabaya, master degree and PhD of Marine Technology at Newcastle Upon tyne University, UK. His research interests include hydrodynamics and fluid-structure interaction. Tel: +62 821 8384 8384; E-mail: [email protected]
Ede M. Wardhana, born in 1992, is currently a lecture of Marine Engineering Department at ITS Surabaya, Indonesia. He received his bachelor and master degree on Marine Engineering in ITS Surabaya, Indonesia, in 2013 and 2016.
Meitha Soetardjo, born in 1959, is currently an engineer at Laboratory of Hydrodynamic Technology, BPP Teknologi Surabaya, Indonesia and received bachelor degree in Naval Architect at ITS Surabaya, Indonesia.
Appendix
Figure 10 The Flow Pattern for G/D = 2, and the Force Coefficients for Re = 100000
Figure 7 The Flow Pattern for G/D = 0.5, and the Force Coefficients for Re = 100000
Figure 8 The Flow Pattern for G/D = 1, and the Force Coefficients for Re = 100000
Figure 9 The Flow Pattern for G/D = 1.5, and the Force Coefficients for Re = 100000

Figures
Figure 1
Flowchart of the Algorithm

Figure 2
The Flow Pattern at G/D=1.5, t=1 and 5
Figure 3
The Flow Pattern at G/D = 1.5

Figure 4
The Flow Patterns and Forces at G/D =2 [12]

Figure 5
Interference Drag Coe�cient

Figure 6
The Strouhal Number Behind Cylinder in Tandem from [1]
Figure 7
The Flow Pattern for G/D = 0.5, and the Force Coe�cients for Re = 100000

Figure 8
The Flow Pattern for G/D = 1, and the Force Coe�cients for Re = 100000
Figure 9
The Flow Pattern for G/D = 1.5, and the Force Coe�cients for Re = 100000
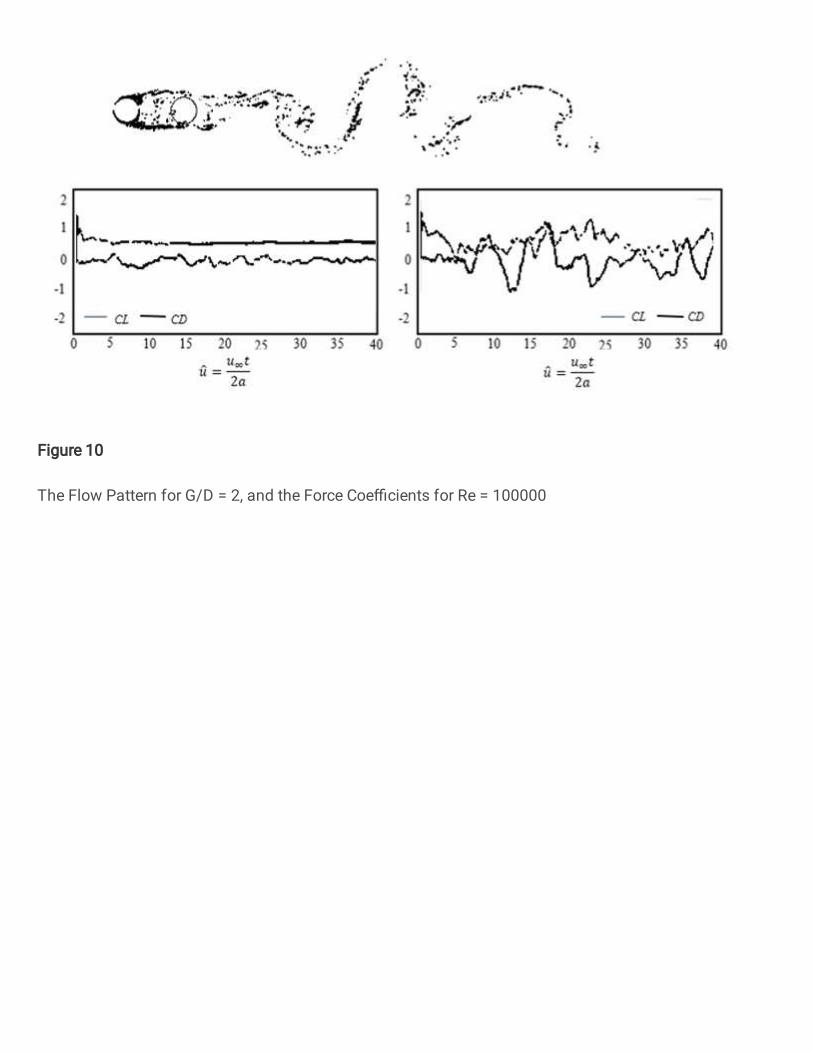
Figure 10
The Flow Pattern for G/D = 2, and the Force Coe�cients for Re = 100000


![EFFECT OF SINGLE LIGHT ORIENTATION ON LANDING GEAR WAKE · Figure 2.9: Two cylinders in the tandem arrangement [41]. L is the distance between the centers of the two cylinders (same](https://img.pdfslide.net/doc/110x75/5e83a8a52036f560143b12a4/effect-of-single-light-orientation-on-landing-gear-wake-figure-29-two-cylinders.jpg)