Embed Size (px)
Citation preview

VRT – A View From30,000 Feet
to VRT or Not
4 year Avg. Corn
• Red
– Avg. 50 bu/ac
– Rate?
• Yellow
– Avg. 120 bu/ac
– Rate?
• Green
– Avg. 170 bu/ac
– Rate?
VRT Overview
• The “W’s”
• to VRT or Not
• Field Research
• Method – Seed
– Inputs & RxMaps
• Method - Fertilizer
– Zone-Grid
– Process
– RxMaps
• Summary

The “W’s” of VRT
• Who – Joe Farmer
• What – fertilizer & seed
• Where – Field on foot by foot basis
• When – NOW
• Why – to VRT or Not
– Fertilizer or Seed or BOTH
The “W’s” of VRT
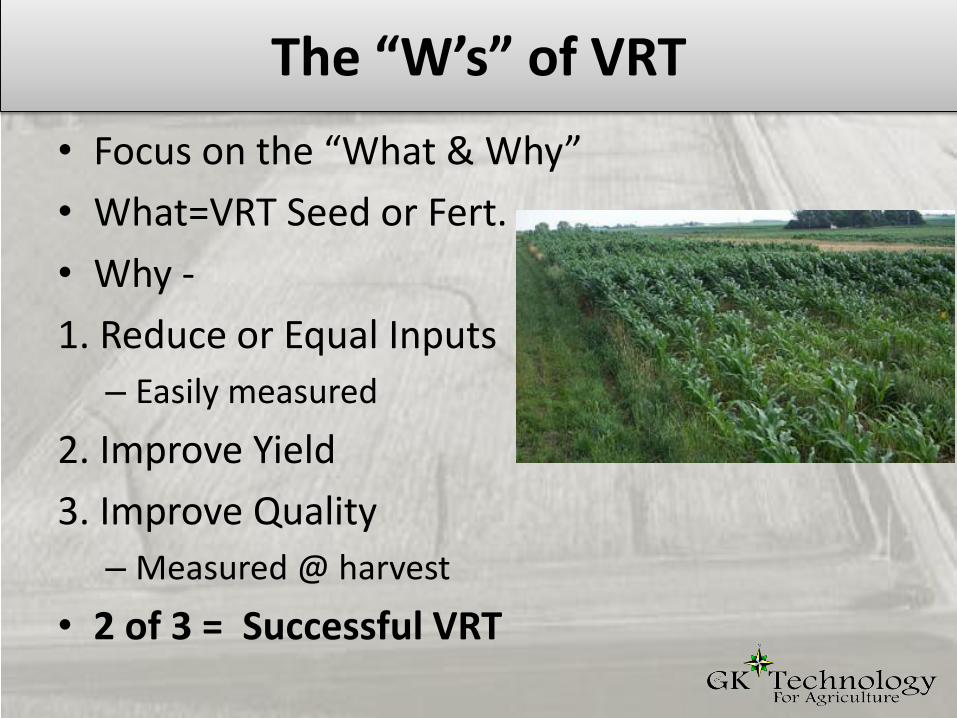
• Focus on the “What & Why”
• What=VRT Seed or Fert.
• Why -
1. Reduce or Equal Inputs
– Easily measured
2. Improve Yield
3. Improve Quality
– Measured @ harvest
• 2 of 3 = Successful VRT

to VRT or Not
• VRT-Can be applied to any field
– Should it?
– What method?
– At what rates?
• First - Do the “Field Research”
VRT Field Research
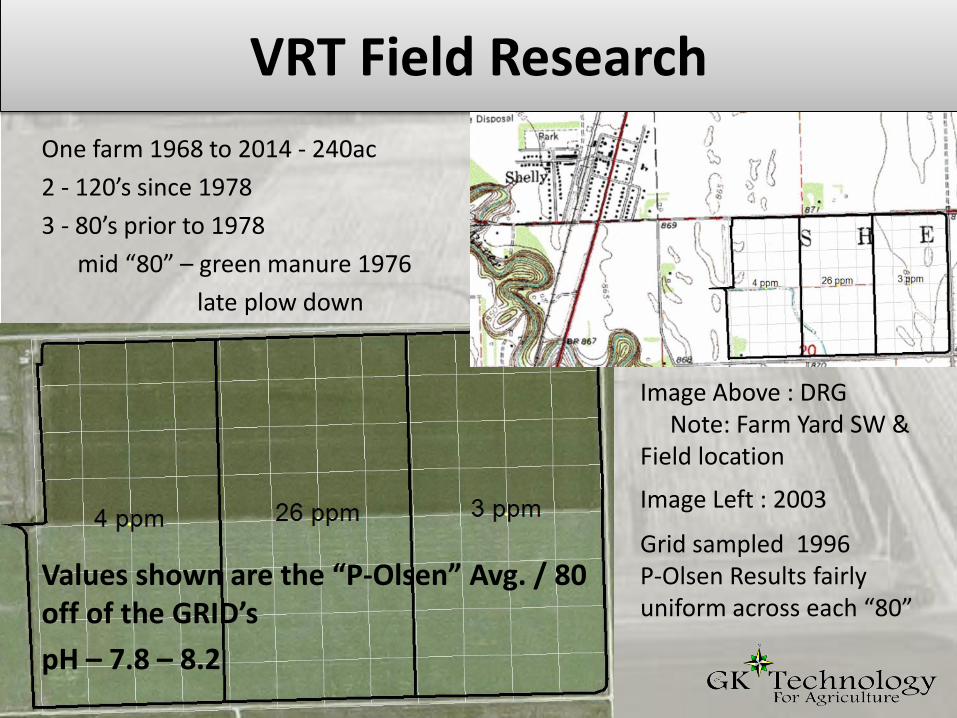
One farm 1968 to 2014 - 240ac
2 - 120’s since 1978
3 - 80’s prior to 1978
mid “80” – green manure 1976
late plow down
Values shown are the “P-Olsen” Avg. / 80 off of the GRID’s
pH – 7.8 – 8.2
Image Above : DRGNote: Farm Yard SW &
Field location
Image Left : 2003
Grid sampled 1996P-Olsen Results fairly uniform across each “80”
VRT Field Research
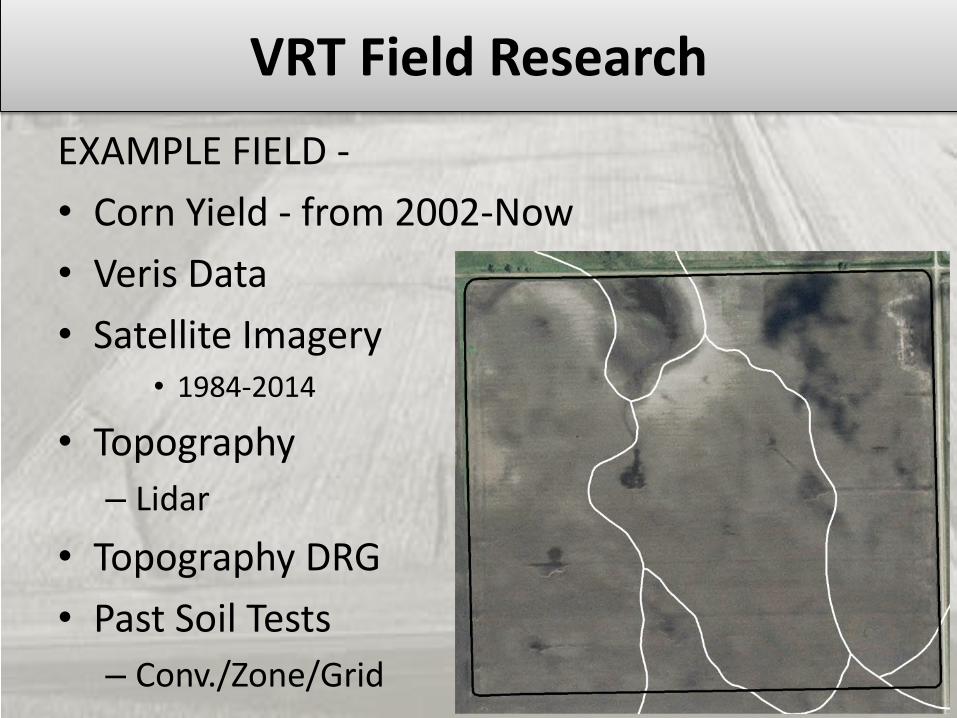
EXAMPLE FIELD -
• Corn Yield - from 2002-Now
• Veris Data
• Satellite Imagery • 1984-2014
• Topography
– Lidar
• Topography DRG
• Past Soil Tests
– Conv./Zone/Grid
VRT Field Research
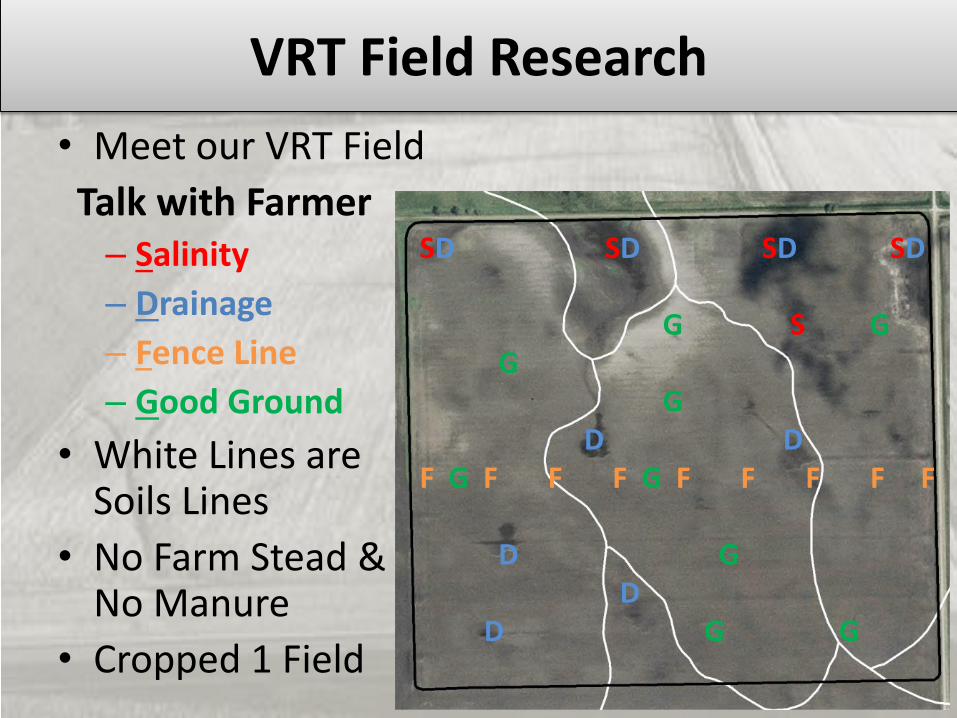
• Meet our VRT Field
Talk with Farmer– Salinity
– Drainage
– Fence Line
– Good Ground
• White Lines are Soils Lines
• No Farm Stead & No Manure
• Cropped 1 Field
SD SD SD SD
G S GG
GD D
F G F F F G F F F F F
D GD
D G G
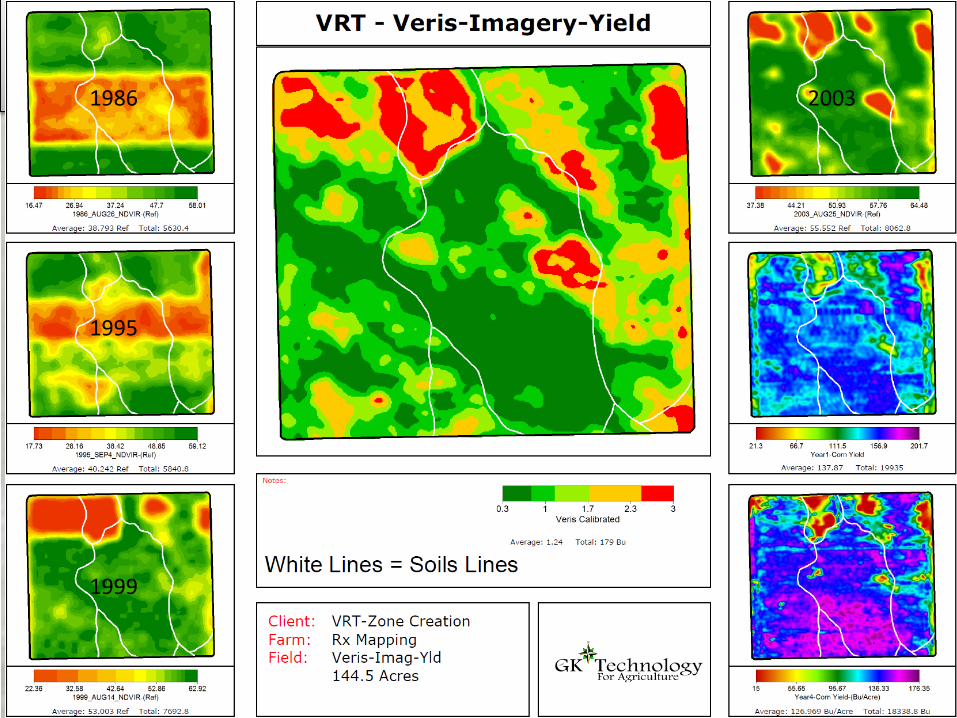
1986
1995
1999
2003
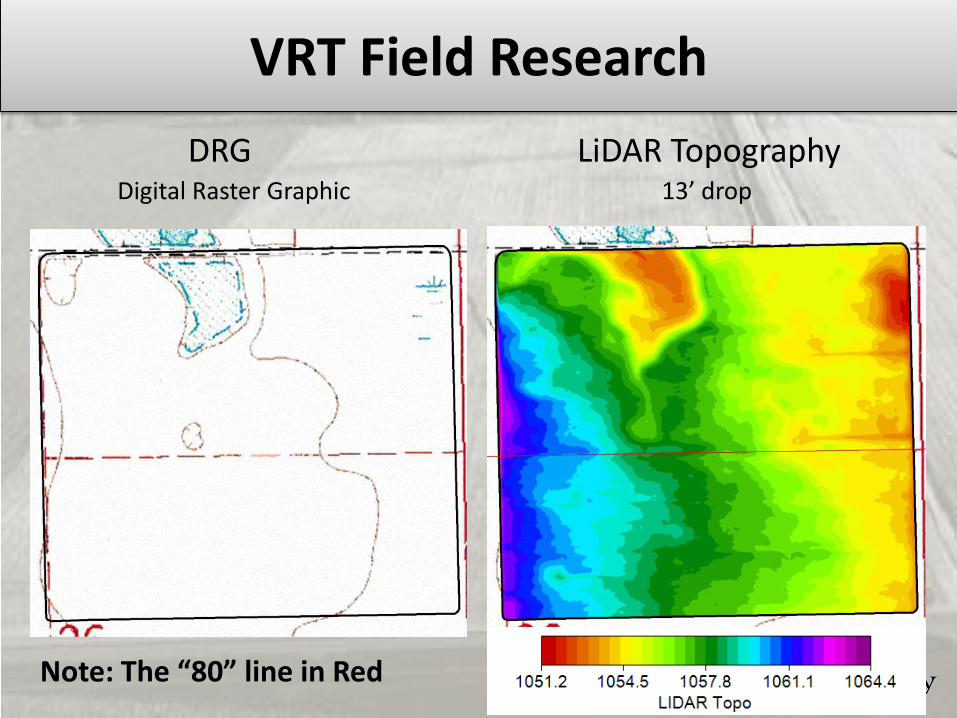
VRT Field Research
DRG LiDAR TopographyDigital Raster Graphic 13’ drop
Note: The “80” line in Red
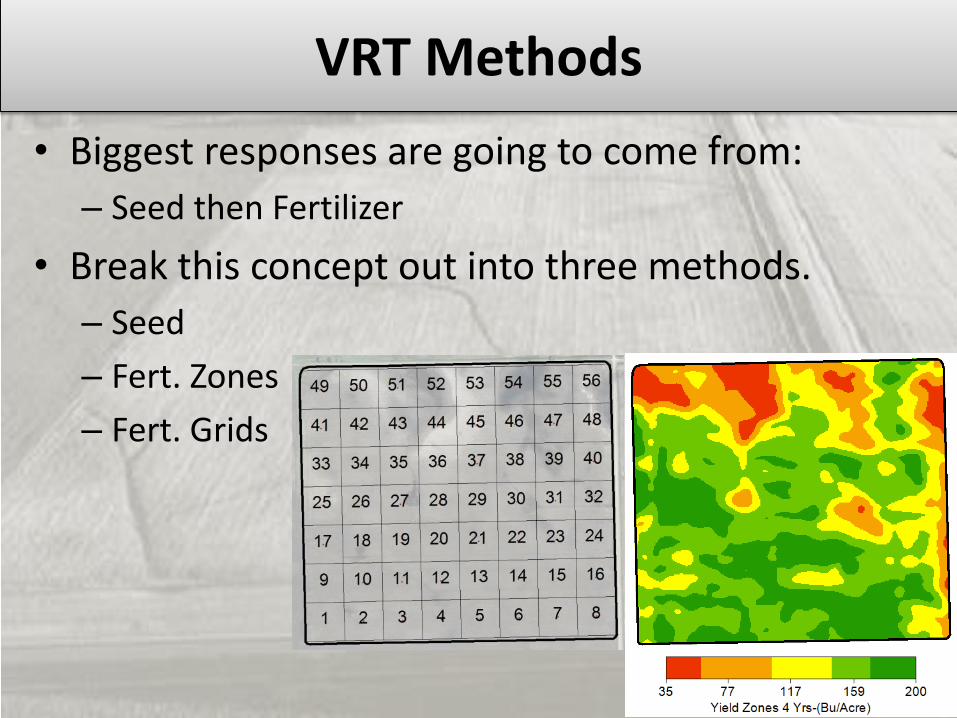
VRT Methods
• Biggest responses are going to come from:
– Seed then Fertilizer
• Break this concept out into three methods.
– Seed
– Fert. Zones
– Fert. Grids
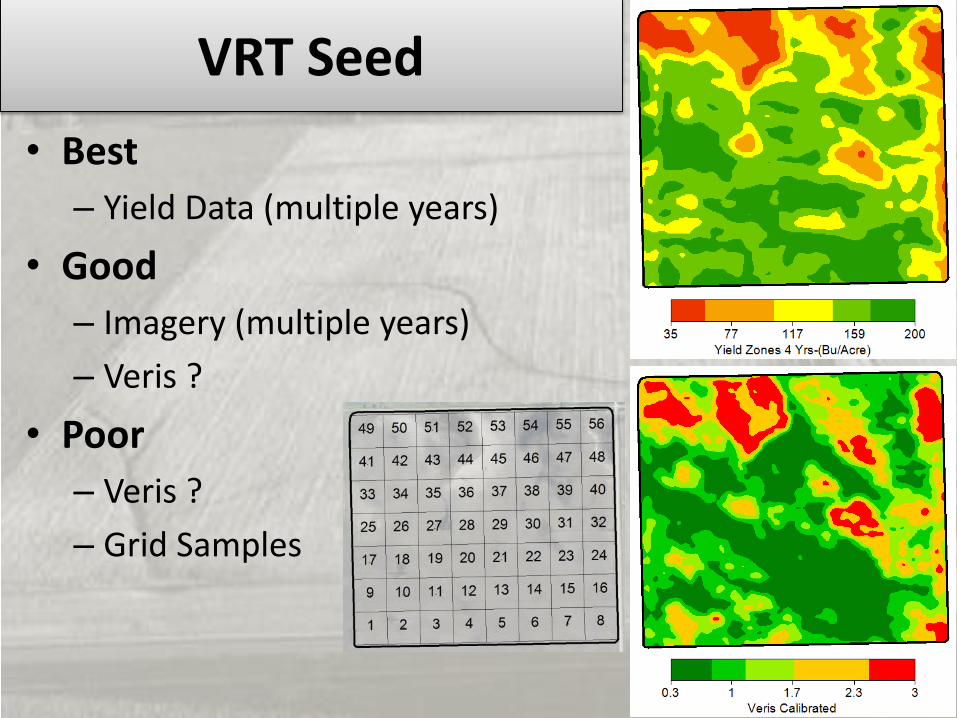
VRT Seed
• Best
– Yield Data (multiple years)
• Good
– Imagery (multiple years)
– Veris ?
• Poor
– Veris ?
– Grid Samples
VRT Seed
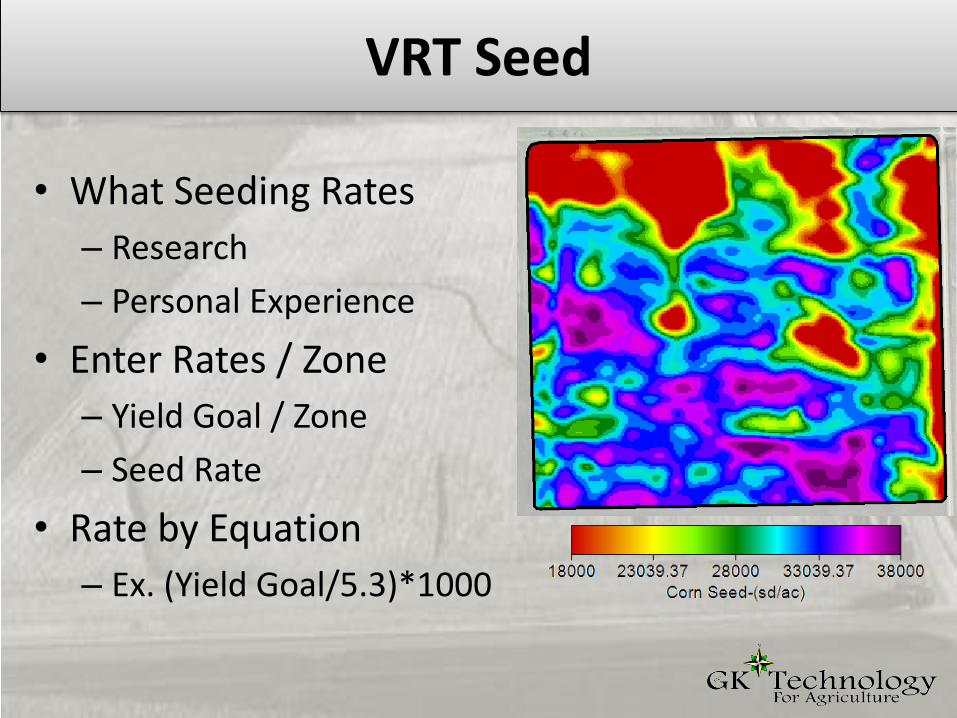
• What Seeding Rates
– Research
– Personal Experience
• Enter Rates / Zone
– Yield Goal / Zone
– Seed Rate
• Rate by Equation
– Ex. (Yield Goal/5.3)*1000
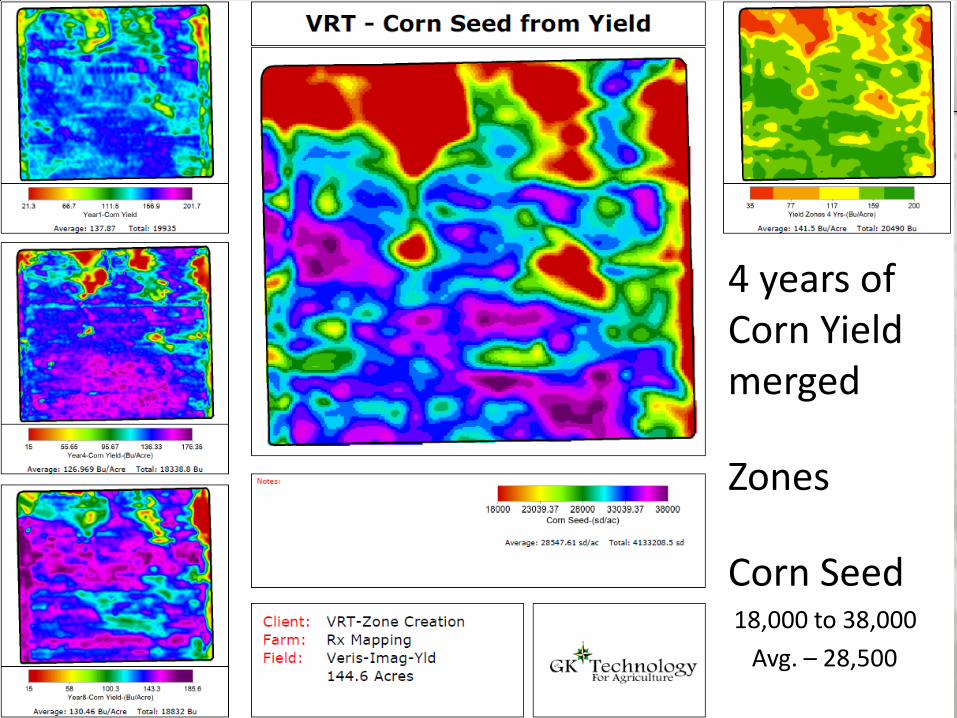
4 years of Corn Yield merged
Zones
Corn Seed18,000 to 38,000
Avg. – 28,500
VRT Fertilizer (Zone or Grid)
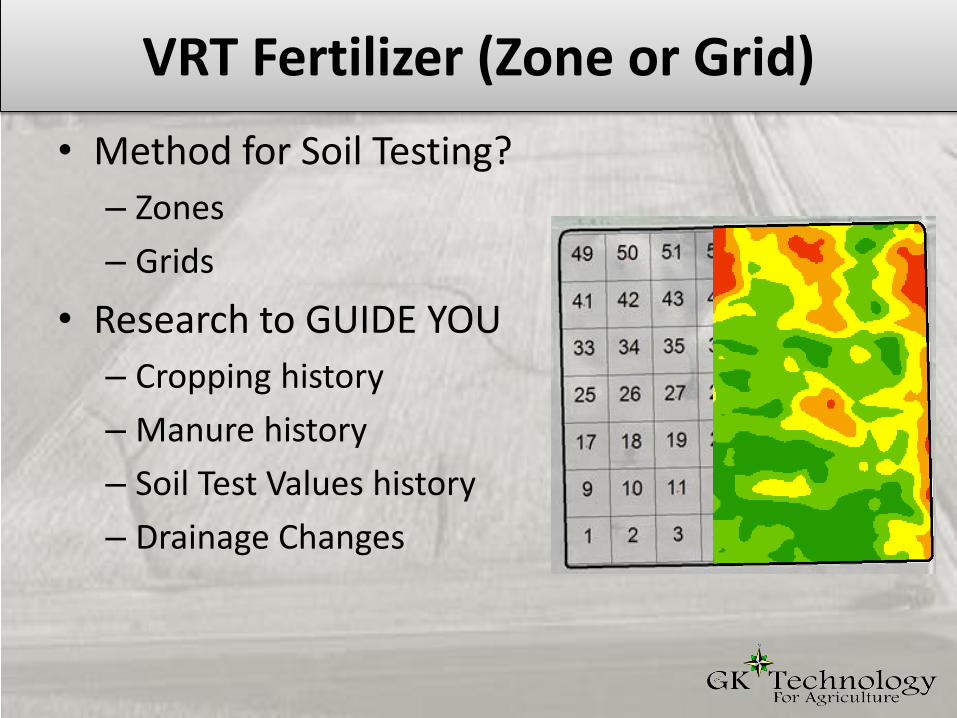
• Method for Soil Testing?
– Zones
– Grids
• Research to GUIDE YOU
– Cropping history
– Manure history
– Soil Test Values history
– Drainage Changes
VRT Fertilizer (Zone or Grid)
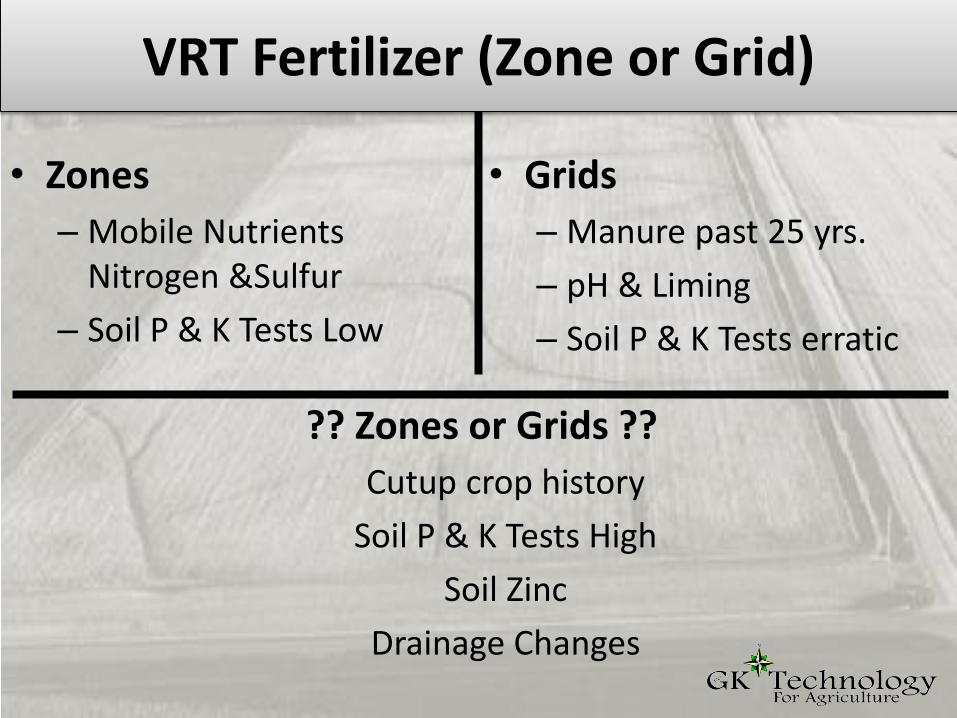
• Zones
– Mobile Nutrients Nitrogen &Sulfur
– Soil P & K Tests Low
• Grids
– Manure past 25 yrs.
– pH & Liming
– Soil P & K Tests erratic
?? Zones or Grids ??
Cutup crop history
Soil P & K Tests High
Soil Zinc
Drainage Changes
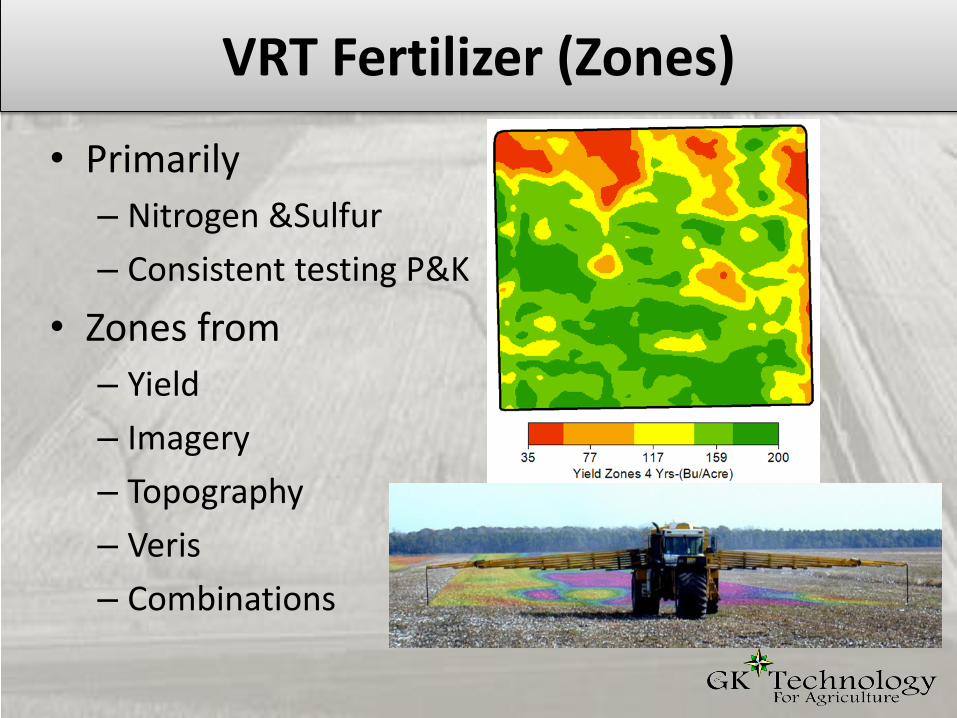
VRT Fertilizer (Zones)
• Primarily
– Nitrogen &Sulfur
– Consistent testing P&K
• Zones from
– Yield
– Imagery
– Topography
– Veris
– Combinations
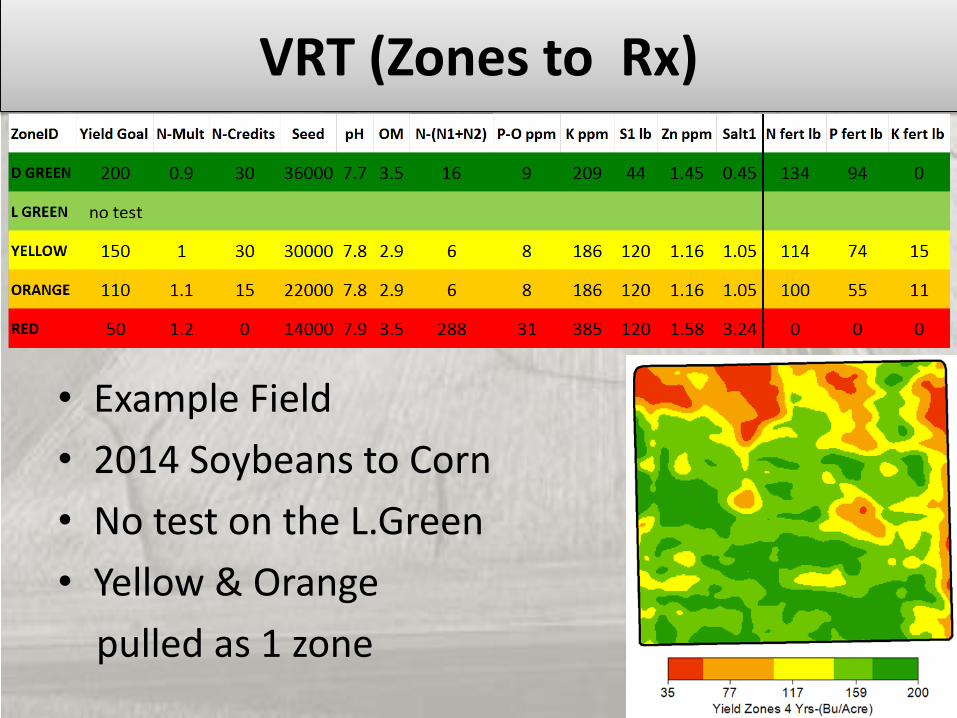
VRT (Zones to Rx)
• Example Field
• 2014 Soybeans to Corn
• No test on the L.Green
• Yellow & Orange
pulled as 1 zone
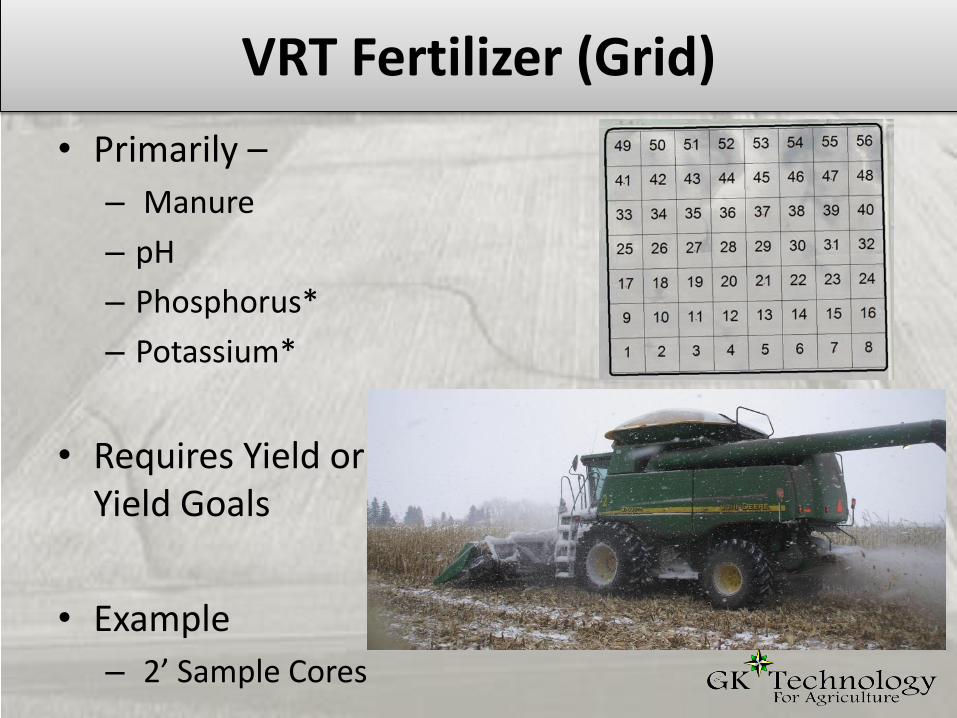
VRT Fertilizer (Grid)
• Primarily –
– Manure
– pH
– Phosphorus*
– Potassium*
• Requires Yield or Yield Goals
• Example
– 2’ Sample Cores
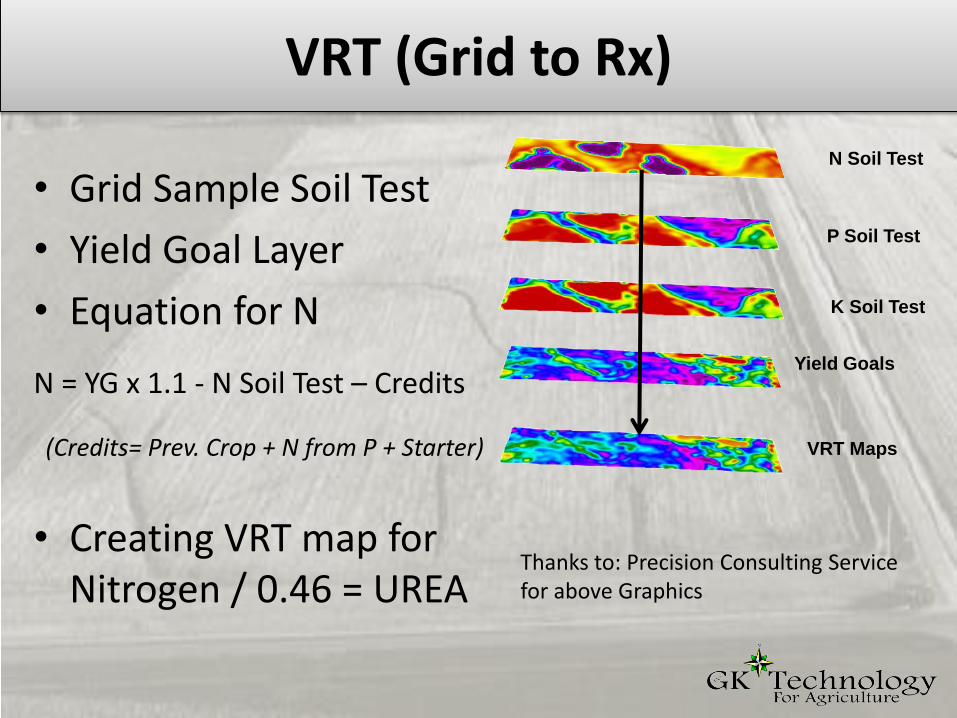
VRT (Grid to Rx)
• Grid Sample Soil Test
• Yield Goal Layer
• Equation for N
N = YG x 1.1 - N Soil Test – Credits
(Credits= Prev. Crop + N from P + Starter)
• Creating VRT map for Nitrogen / 0.46 = UREA
Thanks to: Precision Consulting Service for above Graphics
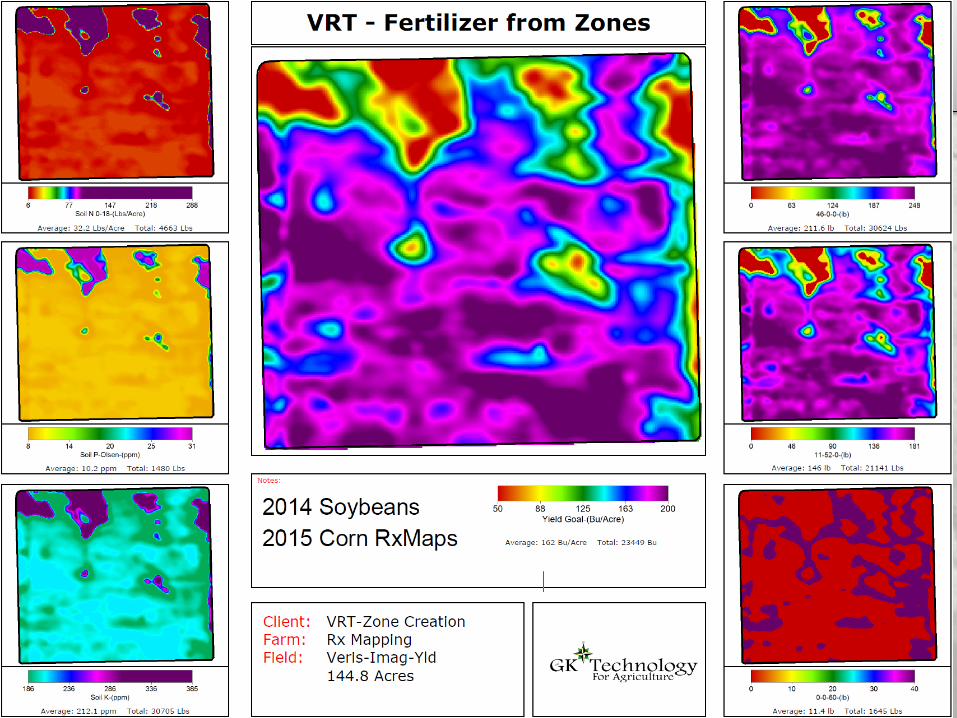
VRT Maps
Yield Goals
N Soil Test
K Soil Test
P Soil Test


Co
st D
iffe
ren
ce in
Met
ho
ds
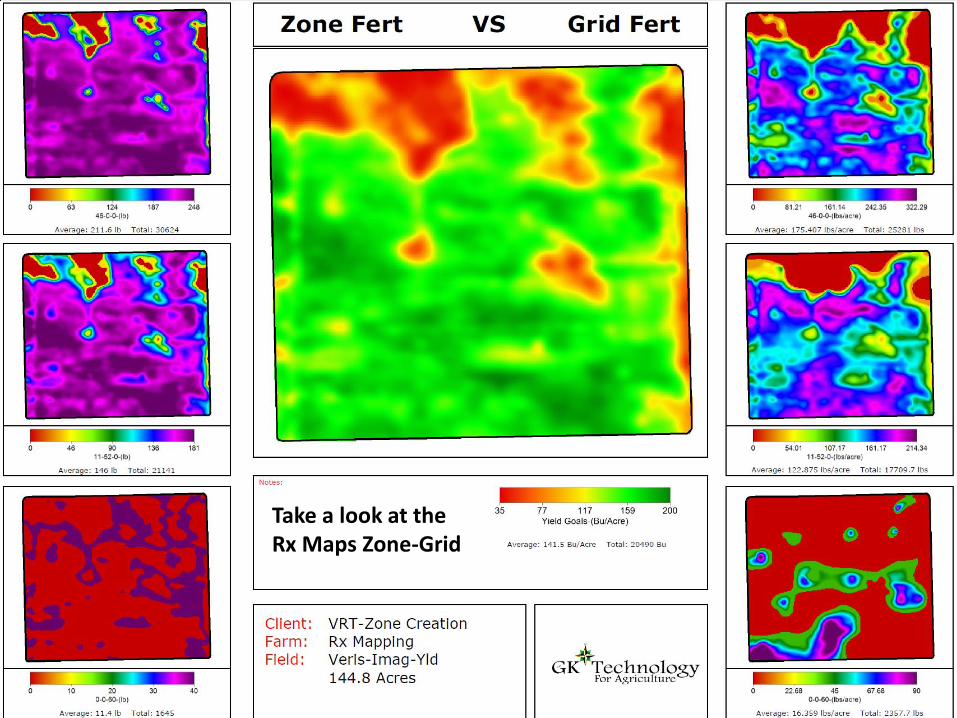
Take a look at the Rx Maps Zone-Grid

Yield & Quality Improvements
• Not measured in this example
• Need to put out check strips to measure
• This is the most difficult to measure
– Requires planning
– Also follow up
2 PROBLEMS
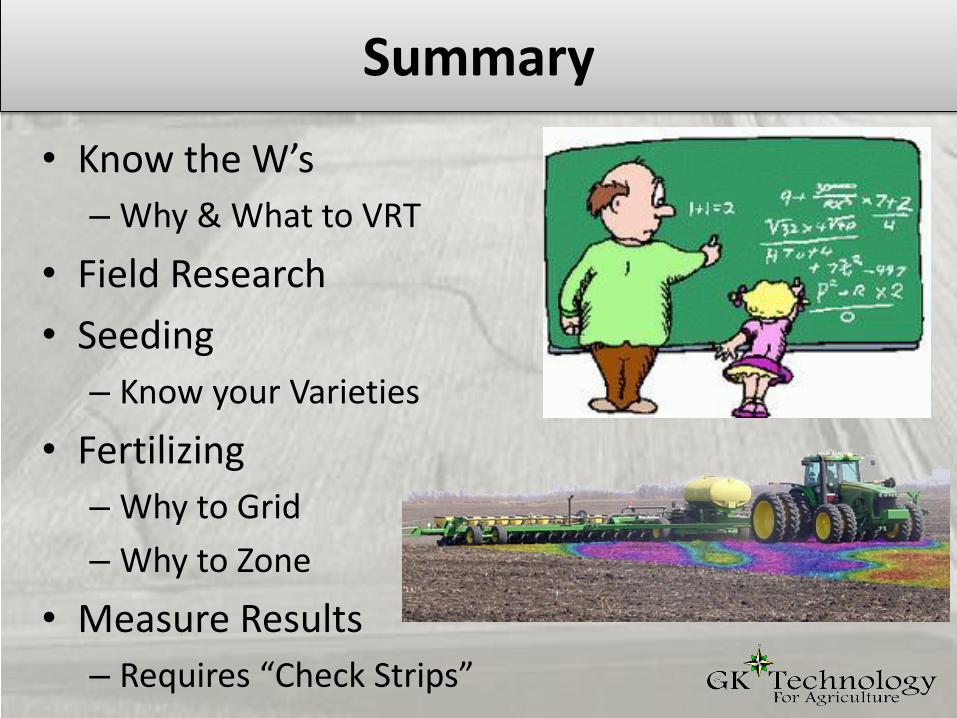
Summary
• Know the W’s
– Why & What to VRT
• Field Research
• Seeding
– Know your Varieties
• Fertilizing
– Why to Grid
– Why to Zone
• Measure Results
– Requires “Check Strips”


![Broadband VPN Router VRT-311 / VRT-311S User s Manual1].pdf · VRT-311 User Guide 2 • Fixed or Dynamic IP Address. On the Internet (WAN port) connection, VRT-311 / VRT-311S supports](https://img.pdfslide.net/doc/110x75/5a70b5ce7f8b9abb538c3673/broadband-vpn-router-vrt-311-vrt-311s-user-s-manualwwwplanetcomtwenproductimages878em-vrt311v11pdfpdf.jpg)