Embed Size (px)
Citation preview

Lecture on Angular Vibration
Measurements Based on Phase Demodulation
Jiří TůmaVSB Technical University of Ostrava
Czech Republic

© Jiri Tuma, 2005 2
Outline
• Motivation• Principle of phase demodulation using
Hilbert transform• Gear angular vibration measurements• Transmission error (TE) measurements• Measurements of the car engine rotational speed
uniformity• Software tools for phase demodulation

Motivation
Angular vibration as the source of the machine vibration and noise

© Jiri Tuma, 2005 4
Angular and Linear Vibration Excitation
Centre line Pitch
circle
Basic circle
Line of action
Pressure angle
Pitch point
Support point
FTFSTS FF =
FT force acting to the wheel at the pitch point
FS force acting at the wheel support bearing
Forces FT and FSresult in torquewheel Force FS excites gearcase vibration

© Jiri Tuma, 2005 5
Gear Angular VibrationTime : Time (Enhanced Time(Encoder))
-0,0016-0,00080,00000,00080,0016
0,0 0,1 0,2 0,3 0,4 0,5 0,6 0,7 0,8 0,9 1,0
Revolution [-]
deg
Time : Time (Time (Enhanced Time(Encoder))) - 0 to 100 ord
-60000
-30000
0
30000
60000
0,0 0,1 0,2 0,3 0,4 0,5 0,6 0,7 0,8 0,9 1,0
Revolution [-]
deg/
s^2
Time : Order Analyzer : Enhanced Time(Vibrace H)
-10
-5
0
5
10
0,0 0,1 0,2 0,3 0,4 0,5 0,6 0,7 0,8 0,9 1,0Revolution [-]
m/s
^2
Linear acceleration on the gearbox housing
Angular acceleration
Angular vibration
Double differentiation

© Jiri Tuma, 2005 6
Source of car shaking while running at idle speed
Crankshaft angular vibration
Engine linear vibration
Car body linear vibration

© Jiri Tuma, 2005 7
Variation of the Angular Acceleration Variation in 3D Surface Plot
© Jiri Tuma, 2002
Transducers and signal processing methods

© Jiri Tuma, 2005 9
Transducers for Angular Vibration Measurements
• Tangentially mounted accelerometers• Laser Torsional Vibration Meter
(Doppler effect)• Incremental rotary encoders
(several hundreds of pulses per revolution)

© Jiri Tuma, 2005 10
How to Process Impulse Signals
• Time interval length measurements– Sample number & Interpolation– High frequency oscillator (10 GHz) & Impulse
counter (Signal analyzer Rotec)• Phase demodulation

Principle of the Hilbert transform

© Jiri Tuma, 2005 12
Analytic Signal Property
fP π=ω 2
Real harmonic signal
Complex analytic signal
(vanishing XN)

© Jiri Tuma, 2005 13
Analytic Signal in a Helix Shape
fP π=ω 2

© Jiri Tuma, 2005 14
Analytic signal
PXZ 2=
PP XjY −=NN XjY =
NNN XXjjYj −==
NP XXX +=
Evaluation of Analytic Signal
PXNX
2π
2π
−
2π
Hilbert transform =+ jTime signal
• Fast Fourier Transform (FFT)
• Digital filters
Evaluation of the Hilbert transform using …

© Jiri Tuma, 2005 15
Evaluation of the Hilbert Transform using FFT
2π
2π
( ) ( ) ωjYIFFTky =( ) ( )ωω jYjX →
( ) ( ) kxFFTjX =ω
NN XjY = PP XjY −=

© Jiri Tuma, 2005 16
Evaluation of Analytic Signal using Digital Filter
HilbertTransformer
x(t)y(t)
z(t)
Real part
Imaginary part
Frequency response function
( )⎩⎨⎧
<<−>>+−
=0,0,
ωπωπω
jj
eG jHT
( ) ( )
⎩⎨⎧
+==
=
=∫=+
−
12,22,0
21
knnkn
deeGng njjHTHT
π
ωπ
π
π
ωω
Impulse response

© Jiri Tuma, 2005 17
Hilbert Transformer
FIR Filter Coefficients : hy160
-0,8
-0,6
-0,4
-0,2
0,0
0,2
0,4
0,6
0,8
-20 -16 -12 -8 -4 0 4 8 12 16 20Index n
Frequency response functionImpulse response n = -80,…,80FIR Filter FRF : ; Coefficients : hy160
0,0
0,2
0,4
0,6
0,8
1,0
1,2
0,0 0,2 0,4 0,6 0,8 1,0Normalised Frequency [-]
Mag
nitu
de
160-order FIR filter
Hilbert Transformer

Principle of phase demodulation

© Jiri Tuma, 2005 19
Phase ModulationReal phase modulated
signal
Pω
-1,5-1,0-0,50,00,51,01,5
0 0,1 0,2 0,3 0,4 0,5 0,6 0,7 0,8 0,9 1
Revolution
x(t) = A cos(ωPt+∆φM(t))
PhaseModulation signal Sideband
components
Carrying component
Analytic signal

© Jiri Tuma, 2005 20
( )πϕ ≤∆⇒≤ samplff2
-4
-2
0
2
4
0 0,1 0,2 0,3 0,4 0,5 0,6 0,7 0,8 0,9 1
Revolution
Unit
Phase Unwrapping and Linear Trend Removing
-0,15
-0,1
-0,05
0
0,05
0,1
0,15
0 0,2 0,4 0,6 0,8 1
Revolution
rad
01234567
0 0,2 0,4 0,6 0,8 1
Revolution
rad
Discontinuities removing
π−
π+
π2
ϕ→π−ϕ⇒π+>ϕ∆ϕ→π+ϕ⇒π−<ϕ∆ 2,2

© Jiri Tuma, 2005 21
An alternative procedure
( ) ( )( ) ( ) ( ) ( )
( ) ( )tytxdt
tdytxtydt
tdx
dttdt 22 +
−=
ϕ=ω
( ) ( )( ) ⎟⎟⎠
⎞⎜⎜⎝
⎛=ϕ
txtyt arctan
( ) ( ) ( )tytxte 22 +=
Phase ……………....
Angular frequency …
Envelope ..…………
( ) ( ) τ∫ τω=ϕ dtt
0Phase ………………

Gear Angular Vibration Measurements
Solving the gearbox noise problem at the very source

Transmission error measurements
Emitted gearbox noise level is proportional to the transmission error level
decreasing TE by 10 dB results in decreasingthe noise level by 7 dB

© Jiri Tuma, 2005 24
Measurement Principle
( ) 11
22 Θ−Θ=
nnradTE
( ) 211
22 r
nnmTE ⎟⎟
⎠
⎞⎜⎜⎝
⎛Θ−Θ=
21, nn
2r…. Angle of rotation [rad]21, ΘΘ
…. Teeth number
…. Wheel radius
TE – Transmission error
E1
E2
n1
n2
1Θ
2Θ
pinion
wheel
E1, E2…. Incremental rotary encoders

© Jiri Tuma, 2005 25
Instrumentation
9/2 channels PULSEOrder Analysis
Heidehain encoders of the ERN 460-500 type
(less than 300 €)

© Jiri Tuma, 2005 26
Encoder Accuracy
E1E2
order1
Circle part
Heidehain encoders of the ERN 460-500 type(500 pulses per revolution)
Phase difference
0,000001
0,000010
0,000100
0,001000
0,010000
0,100000
1,000000
1 10 100 1000Order [-]
RM
S de
g
634 RPM1040 RPM

© Jiri Tuma, 2005 27
Measurement Arrangement
4/2 channels PULSEOrder Analysis
&Special software
Heidehain encoders of the ERN 460-500 type
I REV II III IVV
21
44
21
44
E1
E2
Axle
Engine
Car gearbox
Using the Fourier to evaluate the Hilbert transform

© Jiri Tuma, 2005 29
Effect of Phase Modulation on Pulse Frequency Spectrum
Pinion 21 T Wheel 44 T
Enhanced Spectrum , 21-Tooth Gear
-90-80-70-60-50-40-30-20-10
010
395 416 437 458 479 500 521 542 563 584 605
Order [-]
RM
S dB
/ref 1
V
Enhanced Spectrum , 44-Tooth Gear
-90-80-70-60-50-40-30-20-10
010
324 368 412 456 500 544 588 632 676
Order [-]R
MS
dB/re
f 1 V

© Jiri Tuma, 2005 30
Pinion Angular Vibration
Unwrapped phase Phase variation
Time history : Pinion 21T : Enhanced Time(Impulsy500)
0
20000
40000
60000
80000
100000120000
140000
160000
180000
200000
0,0 0,2 0,4 0,6 0,8 1,0
Revolution [-]
deg
Time fázová demodulace pastorek : Pinion 21T : Enhanced Time(Impulsy500)
-8
-6
-4
-2
0
2
4
6
8
10
12
0,0 0,2 0,4 0,6 0,8 1,0
Revolution [-]de
g

© Jiri Tuma, 2005 31
Phase Modulation Frequency Spectrum
Pinion 21 T Wheel 44 T
Autospectrum : Pinion 21T : Enhanced Time(Impulsy500)
-120
-110
-100
-90
-80
-70
-60
-50
-40
-30
-20
0 21 42 63 84 105 126
Order [-]
RM
S d
B/re
f 1
Autospectrum : Wheel 44T : Enhanced Time(Impulsy500)
-120
-110
-100
-90
-80
-70
-60
-50
-40
-30
-20
0 44 88 132 176 220
Order [-]R
MS
dB/
ref 1
deg

© Jiri Tuma, 2005 32
Comb Filter 1 - Frequency Response
0 1 2 3 40
1
5
( )0ffjH
0fff0 …toothmeshing frequency
Pass Band
5 harmonics of the toothmeshing frequency with
the limited number of sidebands

© Jiri Tuma, 2005 33
Angular Vibration of the 21-Tooth Gear in Deg (after Comb Filtration)
Toothmeshing frequency harmonics with 3 sideband components
Time History : Pinion 21T : Enhanced Time(Impulsy500)
-0,0020-0,0015-0,0010-0,00050,00000,00050,00100,00150,0020
0,0 0,1 0,2 0,3 0,4 0,5 0,6 0,7 0,8 0,9 1,0Revolution [-]
deg

© Jiri Tuma, 2005 34
Angular Vibration of the 44-Tooth Gear in Deg (after Comb Filtration)Toothmeshing frequency harmonics with 6 sideband components
Time History : Wheel 44T : Enhanced Time(Impulsy500)
-0,006
-0,004
-0,002
0,000
0,002
0,004
0,006
0,0 0,1 0,2 0,3 0,4 0,5 0,6 0,7 0,8 0,9 1,0Revolution [-]
deg

© Jiri Tuma, 2005 35
Comb Filter 2 - Frequency Response
0 1 2 3 40
1
5
( )0ffjH
0fff0 …toothmeshing frequency
Pass Band 0
Only harmonics of the toothmeshing frequency
without sidebands

© Jiri Tuma, 2005 36
Phase Delay Between Signals
Original delayOriginal delay Zero delayZero delay
-2,0-1,5-1,0-0,50,00,51,01,5
0,0 0,2 0,4 0,6 0,8 1,0
Tooth pitch rotation [-]
m/s
^2
V ibration s ignal synchronized w ith pinion rotation Vibration s ignal synchronized w ith w heel rotation
-2,0-1,5-1,0-0,50,00,51,01,5
0,0 0,2 0,4 0,6 0,8 1,0
Tooth pitch rotation [-]
m/s
^2V ibration Signal synchronized w ith pinion rotation Vibration s ignal de layed by phase shift

© Jiri Tuma, 2005 37
Transmission Error(average per a tooth pitch rotation)
-4
-3
-2
-1
0
1
2
3
4
0 1 2 3Tooth pitch rotation
TE [m
icro
n)
500 RPM, +40 Nm 500 RPM, +80 Nm

© Jiri Tuma, 2005 38
Truck Gearbox

© Jiri Tuma, 2005 39
Transmission Error
2R
-6
-4
-2
0
2
4
6
0 0,2 0,4 0,6 0,8 1
Tooth pitch rotation
mic
ron 433 Nm
867 Nm1300 Nm
2N
-6
-4
-2
0
2
4
6
0 0,2 0,4 0,6 0,8 1
Tooth pitch rotation
mic
ron 348 Nm
697 Nm1045 Nm

Using the FIR filter to evaluate the Hilbert transform

© Jiri Tuma, 2005 41
Measured Impulse Signals
Time 3 : Time Capture Analyzer : Expanded Time(Encoder1) ; Expanded Time(Encoder2)
-20246
0,0000 0,0005 0,0010 0,0015 0,0020 0,0025 0,0030 0,0035
Time [s]
V
Impulse signals
Frequency spectraAutospectrum : Time Capture Analyzer : Expanded Time(Encoder1) ; Expanded Time(Encoder2)
40
60
80
100
120
140
0 5000 10000 15000 20000 25000
Frequency [Hz]
RM
S dB
/ref 1
E-6

© Jiri Tuma, 2005 42
Filtered Impulse Signals
Filtered impulse signals
Frequency spectra of filtered signals
Time : Time Capture Analyzer : Time: Real (Expanded Time(Encoder1)) ; Time 2: Real (Expanded Time(Encoder2))
-4-2024
0,0000 0,0005 0,0010 0,0015 0,0020 0,0025 0,0030 0,0035Time [s]
Autospectrum 1 : Time Capture Analyzer : Time: Real (Expanded Time(Encoder1)) ; Time 2: Real (Expanded Time(Encoder2))
-80
-60
-40-20
0
20
0 5000 10000 15000 20000 25000Frequency [Hz]
RM
S dB
/ref 1
V

© Jiri Tuma, 2005 43
Phase Difference
Unwrapped phase of impulse signals
Phase difference (Signal1 – Signal2 * 27/44)
FIR Filters : Time Capture Analyzer : Time: Real (Expanded Time(Encoder1));Time: Real (Expanded Time(Encoder2))
0
1000000
2000000
3000000
4000000
0,0 0,1 0,2 0,3 0,4 0,5 0,6 0,7 0,8 0,9
Time [s]
deg
Difference : Time Capture Analyzer : FIR Filters: Unwrapped Phase (Time: Real (Expanded Time(Encoder1)))
-0,10-0,050,000,050,10
0,0 0,1 0,2 0,3 0,4 0,5 0,6 0,7 0,8 0,9Time [s]
deg

© Jiri Tuma, 2005 44
Phase SpectrumPhase spectrum
Autospectrum 2 : Time Capture Analyzer : Difference (FIR Filters: Unwrapped Phase (Time: Real (Expanded Time(Encoder1))) - FIR Filters: Unwrapped Phase (Time 2: Real (Expanded
Time(Encoder2))))
-40
-30
-20
-10
0
10
20
30
40
0 1000 2000 3000 4000 5000
Frequency [Hz]
RM
S dB
/ref 1
deg

© Jiri Tuma, 2005 45
Time Domain SignalIFFT of phase spectrum
Time History : Time Capture Analyzer : Time 1: Real (Difference (FIR Filters: Unwrapped Phase (Time: Real (Expanded Time(Encoder1))) - FIR Filters: Unwrapped Phase (Time 2: Real (Expanded
Time(Encoder2)))))
-50-40-30-20-10
0102030405060
0,0 0,1 0,2 0,3 0,4 0,5 0,6 0,7 0,8 0,9
Time [s]
mic
ron
© Jiri Tuma, 2005 46
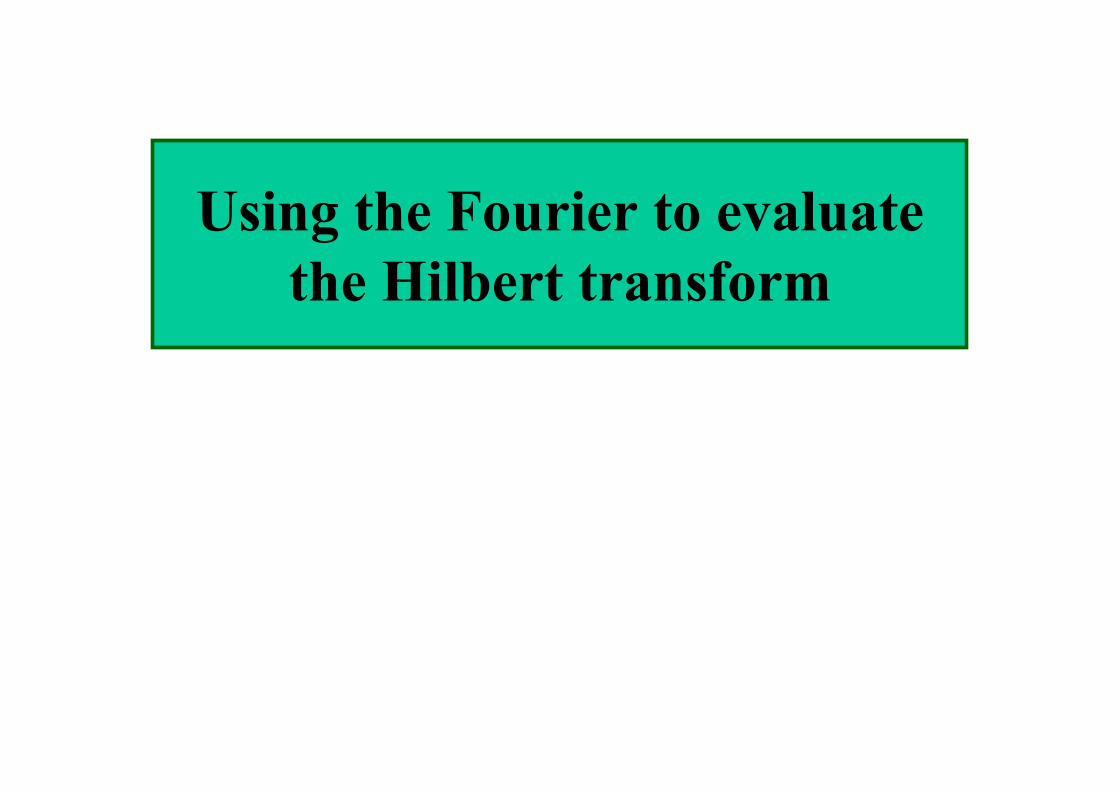
Transmission Error Time History
Time History : Time Capture Analyzer : Resampling (Time 1: Real (Difference (FIR Filters: Unwrapped Phase (Time: Real (Expanded Time(Encoder1))) - FIR Filters: Unwrapped Phase (Time 2: Real (Expanded
Time(Encoder2))))))
-10-505
10
0 1 2 3 4 5 6 7 8Revolution [-]
mic
ron
Time History : Time Capture Analyzer : Resampling 1 (Time 1: Real (Difference (FIR Filters: Unwrapped Phase (Time: Real (Expanded Time(Encoder1))) - FIR Filters: Unwrapped Phase (Time 2: Real (Expanded
Time(Encoder2))))))
-10-505
10
0 2 4 6 8 10 12 14Revolution [-]
mic
ron
Pinion
Wheel

© Jiri Tuma, 2005 47
Averaged Transmission Error
Time History : Time Capture Analyzer : Resampling 1: Averaged (Time 1: Real (Difference (FIR Filters:
Unwrapped Phase (Time: Real (Expanded Time(Encoder1))) - FIR Filters: Unwrapped Phase
(Time 2: Real (Expanded Time(Encoder2))))))1
-5-4-3-2-101234
0,0 0,2 0,4 0,6 0,8 1,0
Revolution [-]
Time History : Time Capture Analyzer : Resampling: Averaged (Time 1: Real (Difference (FIR Filters:
Unwrapped Phase (Time: Real (Expanded Time(Encoder1))) - FIR Filters: Unwrapped Phase
(Time 2: Real (Expanded Time(Encoder2))))))
-5-4-3-2-101234
0,0 0,2 0,4 0,6 0,8 1,0
Revolution [-]
Pinion Wheel
Results of the gear design improvements
Effect of the design improvements on the gearbox noise

© Jiri Tuma, 2005 49
Effect of Contact Ratio on the Average Toothmesh Acceleration Signal
total contact ratio = profile contact ratio + face contact ratioγε
( )0.1≈εβ
αε βε
Truck Gearbox
LCR HCR

© Jiri Tuma, 2005 50
Effect of Contact Ratio on the Noise Level in dB
Truck gearbox noise level at the distance of 1m
86,0
88,0
90,0
92,0
94,0
96,0
98,0
100,0
Speed
dB(A
)
LCR 92,0 92,9 95,0 95,4 95,0 96,5HCR 90,0 91,8 90,4 89,7 88,2 90,3
3R 3N 4R 4N 5R 5N

© Jiri Tuma, 2005 51
Effect of Tooth Surface Modification
1000
1100
1200
1300
1400
1500
1600
1700
1800
1900
2000
2100
2200
5386
4330
3408
2740
2203
1771Hluk v
dB
RPM
88-9284-8880-8476-8072-7668-7264-6860-64
Torque Nm
1000
1100
1200
1300
1400
1500
1600
1700
1800
1900
2000
2100
2200
3831
3080
2448
1968
1549
1245
1001
805Hluk v
dB
RPM
88-9284-8880-8476-8072-7668-7264-6860-64
Torque NmGear train S Gear train T2
S
T1T2

Measurements of a car engine rotational speed variation
Solving the problem of a car with random burst shaking while its engine is running in idle
Car body vibrations correlate with changes in engine rotational speed

© Jiri Tuma, 2005 53
Engine rotation uniformity at idlespeed
780
790
800
810
820
0 50 100 150 200
Index
RPM
Average RPM during 250 consecutive double revolutions
800 RPM = 13.3 Hz800 RPM = 13.3 Hz

© Jiri Tuma, 2005 54
Measurements of a Car EngineRotational Speed and Acceleration
4/2 channels PULSEOrder Analysis
&tacho
crankshaft
camshaft
Impulse signals
(Divider)

© Jiri Tuma, 2005 55
Source of an Impulse Signal

© Jiri Tuma, 2005 56
Impulse Signal
-6
-4
-2
0
2
4
6
0 0,5 1 1,5 2
Revolution
V
-6-4-20246
0,9 0,92 0,94 0,96 0,98 1
Revolution
V
Impulse signal for engine control unit
Addition ofmissing impulses
60 – 2 = 58 impulses per revolution

© Jiri Tuma, 2005 57
Angular Variation
-1,5
-1
-0,5
0
0,5
1
1,5
0 0,2 0,4 0,6 0,8 1 1,2 1,4 1,6 1,8 2
Revolution
deg

© Jiri Tuma, 2005 58
Engine rotation uniformity at idlespeed
770
780
790
800
810
820
830
0 0,2 0,4 0,6 0,8 1 1,2 1,4 1,6 1,8 2
Revolution
RPM
Instantaneous RPM during the 2-revolution engine cycle
800 RPM = 13.3 Hz800 RPM = 13.3 Hz

© Jiri Tuma, 2005 59
Differentiation in the FrequencyDomain
0
0,2
0,4
0,6
0,8
1
1,2
0 6 12Orders
deg
Angle Velocity Acceleration
0
1
2
3
4
5
6
7
8
0 6 12Orders
RPM
0
20
40
60
80
100
120
0 6 12Orders
rad/s2
Filteredout
Filteredout
( ) ( )ωΦϕ jt , Φω=Ωϕ=ω jdtd , Ωω=Εω=ε jdtd ,

© Jiri Tuma, 2005 60
Engine Crankshaft Angular Velocityand Acceleration
7 7 0
7 8 0
7 9 0
8 0 0
8 1 0
8 2 0
8 3 0
0 0 ,2 0 ,4 0 ,6 0 ,8 1 1 ,2 1 ,4 1 ,6 1 ,8 2
R e vo lu tio n
R P M
- 2 0 0
- 1 5 0
- 1 0 0
- 5 0
0
5 0
1 0 0
1 5 0
2 0 0
2 5 0
3 0 0
0 0 , 2 0 , 4 0 , 6 0 , 8 1 1 , 2 1 , 4 1 , 6 1 , 8 2
R e v o l u t i o n
r a d / s 2
Angular accelerationAngular acceleration
Angular velocityAngular velocity 6 ord limit6 ord limit

© Jiri Tuma, 2005 61
Angular acceleration variation during two engine revolutions
-200
-150
-100
-50
0
50
100
150
200
250
300
0 0,2 0,4 0,6 0,8 1 1,2 1,4 1,6 1,8 2
Revolution
rad/s2
4-cylinder / 4-stroke engine4-cylinder / 4-stroke engine
compression cyclecompression cycle
combustion cyclecombustion cycle
-
+

© Jiri Tuma, 2005 62
Effect of sinusoidal signal distortion on its frequency spectrum
-1
-0,5
0
0,5
1
0 0,5 1 1,5 2
full
half
zero
0
0,2
0,4
0,6
0,8
1
full half zero
0.5 ord
1 ord
1.5 ord
2 ord
1.5 ord = 6.6 Hz1.5 ord = 6.6 Hz

© Jiri Tuma, 2005 63
Crankshaft angular acceleration frequency spectrum
0
10
20
30
40
50
60
70
80
90
0 0,5 1 1,5 2 2,5 3 3,5 4
Order
rad/s2
0 1 2 3 40
40
80
120
160
200
240
rad/s 2
Order
Index
70-8060-70
50-6040-50
30-4020-3010-20
0-10
6.6 Hz 13.3 Hz 26.6 Hz

© Jiri Tuma, 2005 64
Linear acceleration frequency spectra
EngineEngine Car bodyCar body
6.6 Hz6.6 - 13.3 - 26.6 Hz
Absorber effect
Human body extra sensitive

© Jiri Tuma, 2005 65
Ride comfort
Frequency [Hz]
RMS of Acceleration
84

© Jiri Tuma, 2005 66
Results
0
0,02
0,04
0,06
0,08
0,1
0,12
0,14
1 11 21 31 41 51 61 71 81 91 101 111 121Index
m/s
2
0
0,01
0,02
0,03
0,04
0,05
0,06
0,07
0,08
0,09
1 11 21 31 41 51 61 71 81 91 101 111 121Index
m/s
2
0.5 ord = 6.6 Hz
1 ord = 13.3 Hz
Original absorber Improved absorber

Software Tools for Transmission Error
Evaluation

© Jiri Tuma, 2005 68
Automation Program for PULSE, the BK Signal Analyser

© Jiri Tuma, 2005 69
Signal Analyser

© Jiri Tuma, 2005 70
Conclusion
• The lecture is focused on the problem of the angular vibration measurements using phase demodulation
• The shaft angular vibration excite the housing linear vibration and consequently machine noise
• The theory is illustrated by experimental data.

© Jiri Tuma, 2005 71
Thank you for your attention