Embed Size (px)
Citation preview

VVMethoden – TP2
Criticality Analysis for the Verification and
Validation of Automated Vehicles
Christian Neurohr
OFFIS e.V. – Institute for Information Technology
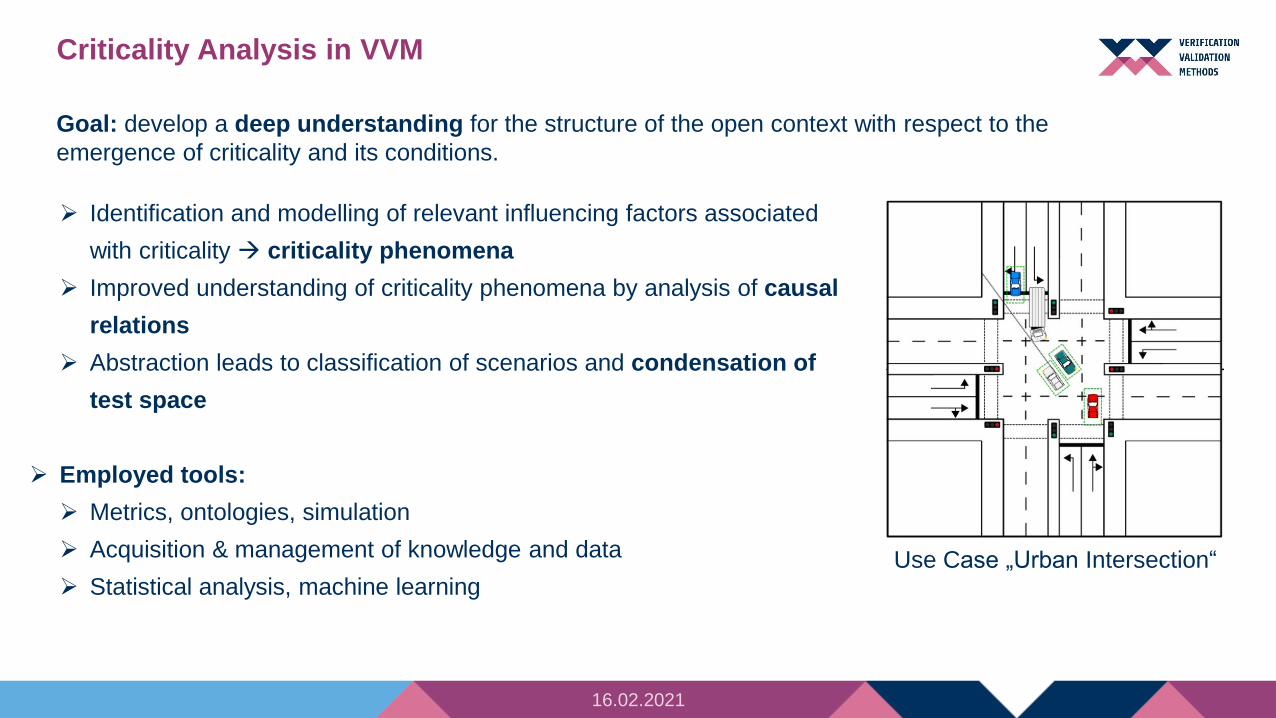
Criticality Analysis in VVM
Identification and modelling of relevant influencing factors associated
with criticality criticality phenomena
Improved understanding of criticality phenomena by analysis of causal
relations
Abstraction leads to classification of scenarios and condensation of
test space
Employed tools:
Metrics, ontologies, simulation
Acquisition & management of knowledge and data
Statistical analysis, machine learning
Goal: develop a deep understanding for the structure of the open context with respect to the
emergence of criticality and its conditions.
16.02.2021
Use Case „Urban Intersection“
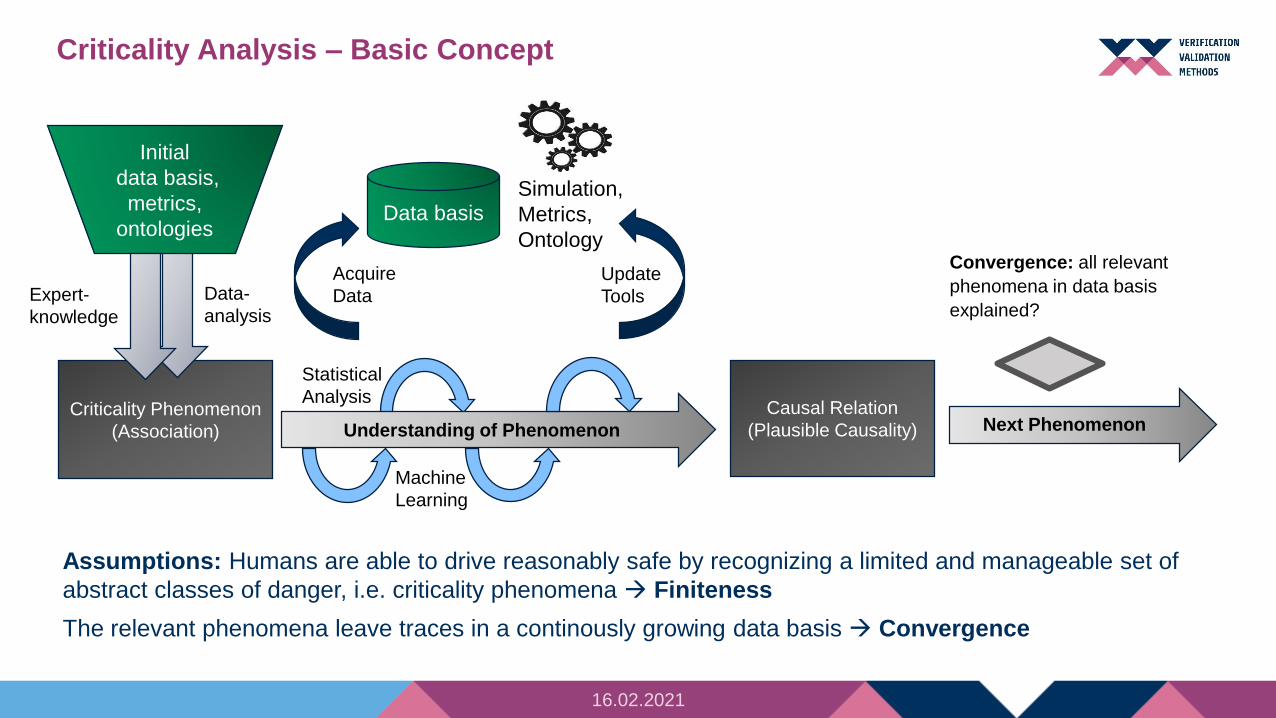
Criticality Phenomenon
(Association)
Convergence: all relevant
phenomena in data basis
explained?
Statistical
Analysis
Understanding of Phenomenon
Initial
data basis,
metrics,
ontologies
Causal Relation
(Plausible Causality)
Machine
Learning
Next Phenomenon
Simulation,
Metrics,
Ontology
Data basis
Acquire
Data
Update
Tools
Assumptions: Humans are able to drive reasonably safe by recognizing a limited and manageable set of
abstract classes of danger, i.e. criticality phenomena Finiteness
The relevant phenomena leave traces in a continously growing data basis Convergence
Expert-
knowledge
Data-
analysis
16.02.2021
Criticality Analysis – Basic Concept
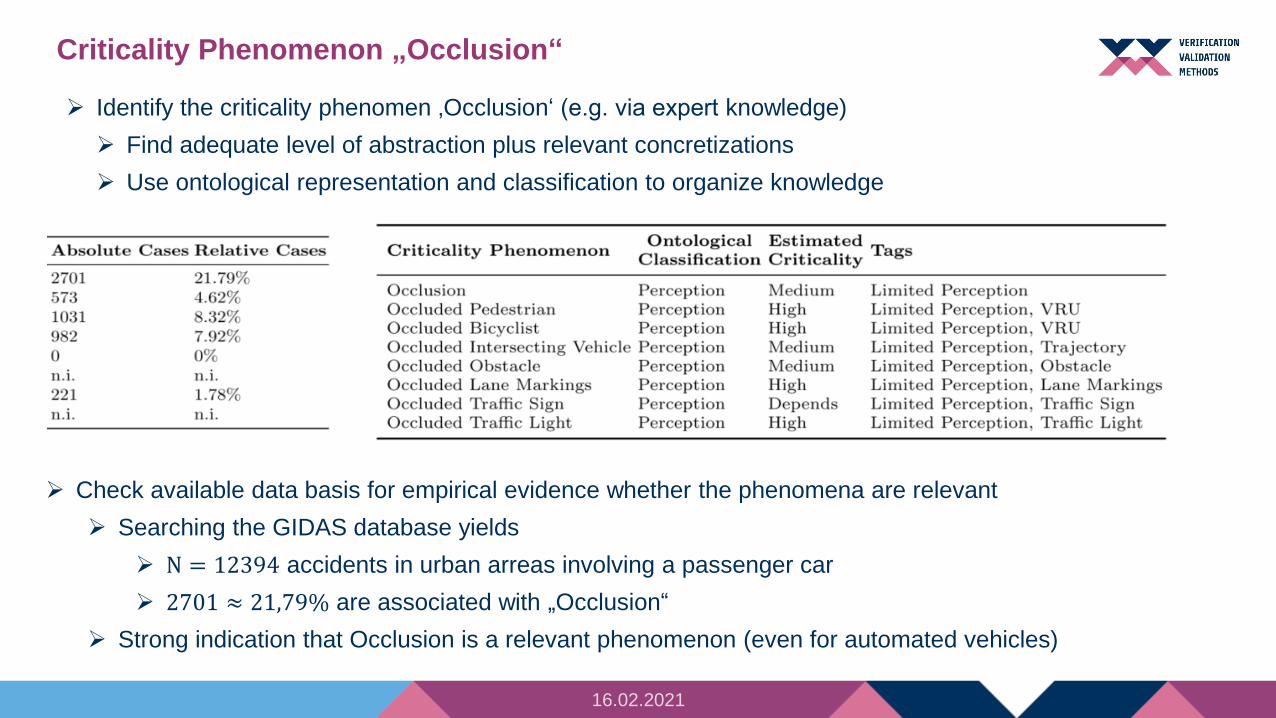
Criticality Phenomenon „Occlusion“
Identify the criticality phenomen ‚Occlusion‘ (e.g. via expert knowledge)
Find adequate level of abstraction plus relevant concretizations
Use ontological representation and classification to organize knowledge
Check available data basis for empirical evidence whether the phenomena are relevant
Searching the GIDAS database yields
N = 12394 accidents in urban arreas involving a passenger car
2701 ≈ 21,79% are associated with „Occlusion“
Strong indication that Occlusion is a relevant phenomenon (even for automated vehicles)
16.02.2021
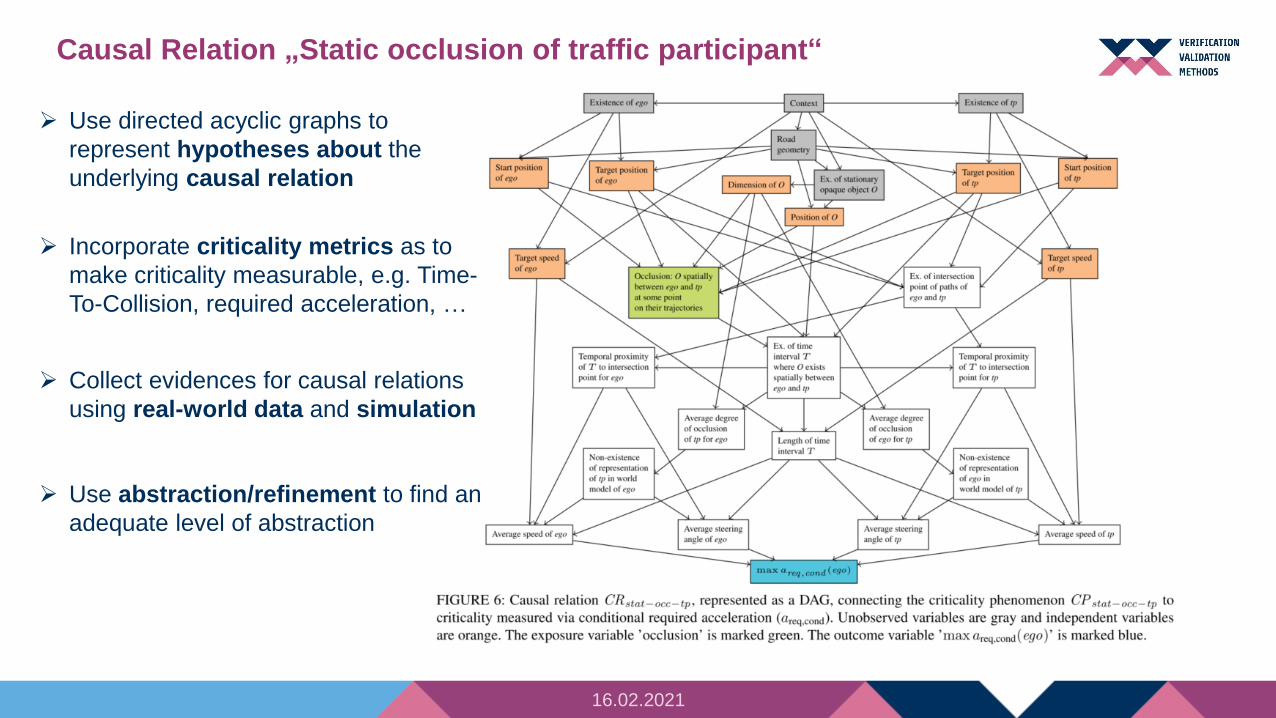
Causal Relation „Static occlusion of traffic participant“
Use directed acyclic graphs to
represent hypotheses about the
underlying causal relation
16.02.2021
Incorporate criticality metrics as to
make criticality measurable, e.g. Time-
To-Collision, required acceleration, …
Collect evidences for causal relations
using real-world data and simulation
Use abstraction/refinement to find an
adequate level of abstraction
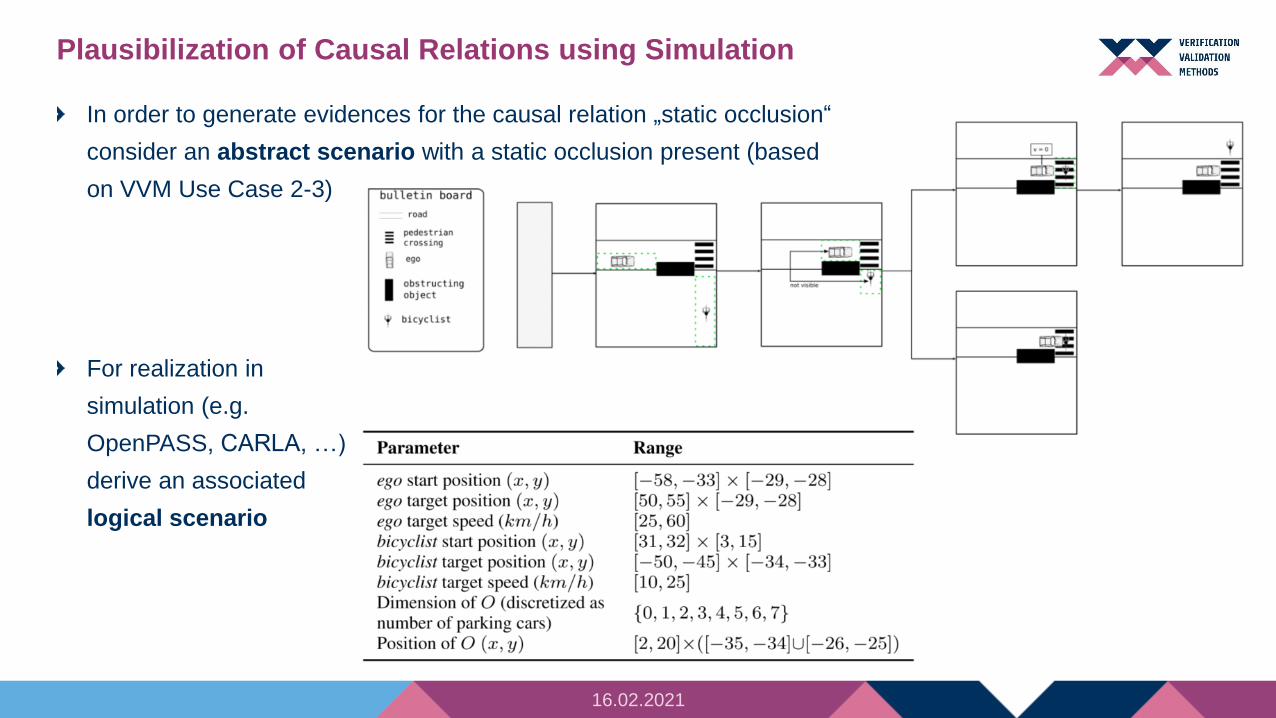
In order to generate evidences for the causal relation „static occlusion“
consider an abstract scenario with a static occlusion present (based
on VVM Use Case 2-3)
Plausibilization of Causal Relations using Simulation
16.02.2021
For realization in
simulation (e.g.
OpenPASS, CARLA, …)
derive an associated
logical scenario
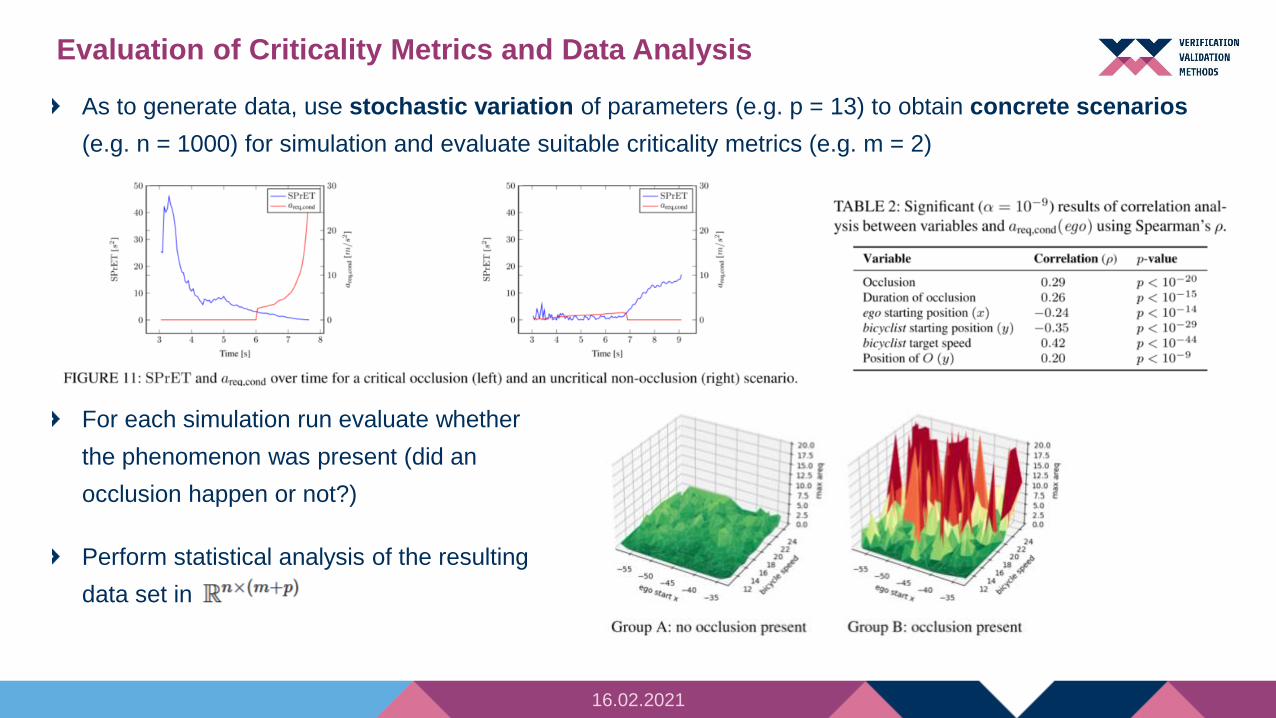
As to generate data, use stochastic variation of parameters (e.g. p = 13) to obtain concrete scenarios
(e.g. n = 1000) for simulation and evaluate suitable criticality metrics (e.g. m = 2)
Evaluation of Criticality Metrics and Data Analysis
16.02.2021
For each simulation run evaluate whether
the phenomenon was present (did an
occlusion happen or not?)
Perform statistical analysis of the resulting
data set in

Journal Publication „Criticality Analysis for the Verification and Validation of Automated Vehicles“ published
at IEEE Access (21.01.2021)
Joint publication by several VVM partners
Authors: Christian Neurohr (OFFIS), Lukas Westhofen (OFFIS), Martin Butz (Bosch), Martin Bollmann
(ZF), Ulrich Eberle (Opel), Roland Galbas (Bosch)
ResearchGate
IEEExplore
Further reading
16.02.2021

Thank you for the attention.
16.02.2021
Contact:
Dr. Christian Neurohr
+49 441 9722-593
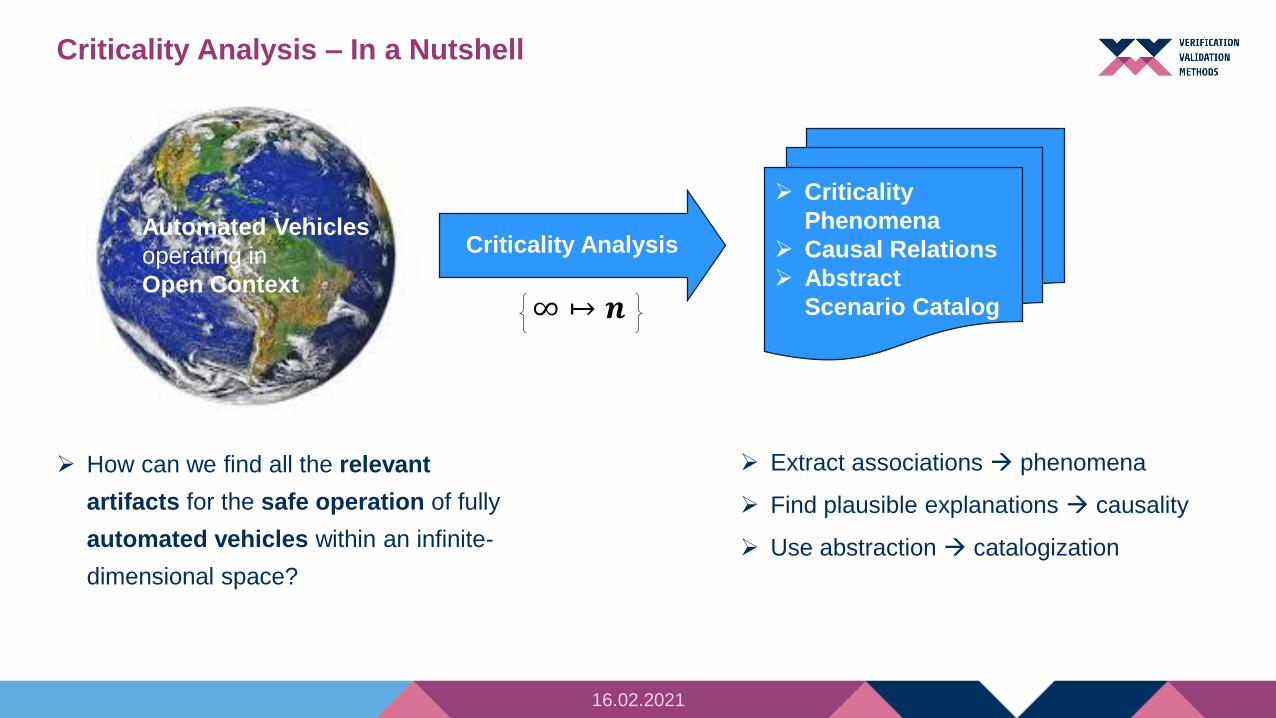
Criticality
Phenomena
Causal Relations
Abstract
Scenario Catalog
Criticality Analysis – In a Nutshell
Automated Vehicles
operating in
Open Context∞ ↦ 𝒏
How can we find all the relevant
artifacts for the safe operation of fully
automated vehicles within an infinite-
dimensional space?
Extract associations phenomena
Find plausible explanations causality
Use abstraction catalogization
Criticality Analysis
16.02.2021
16.02.2021
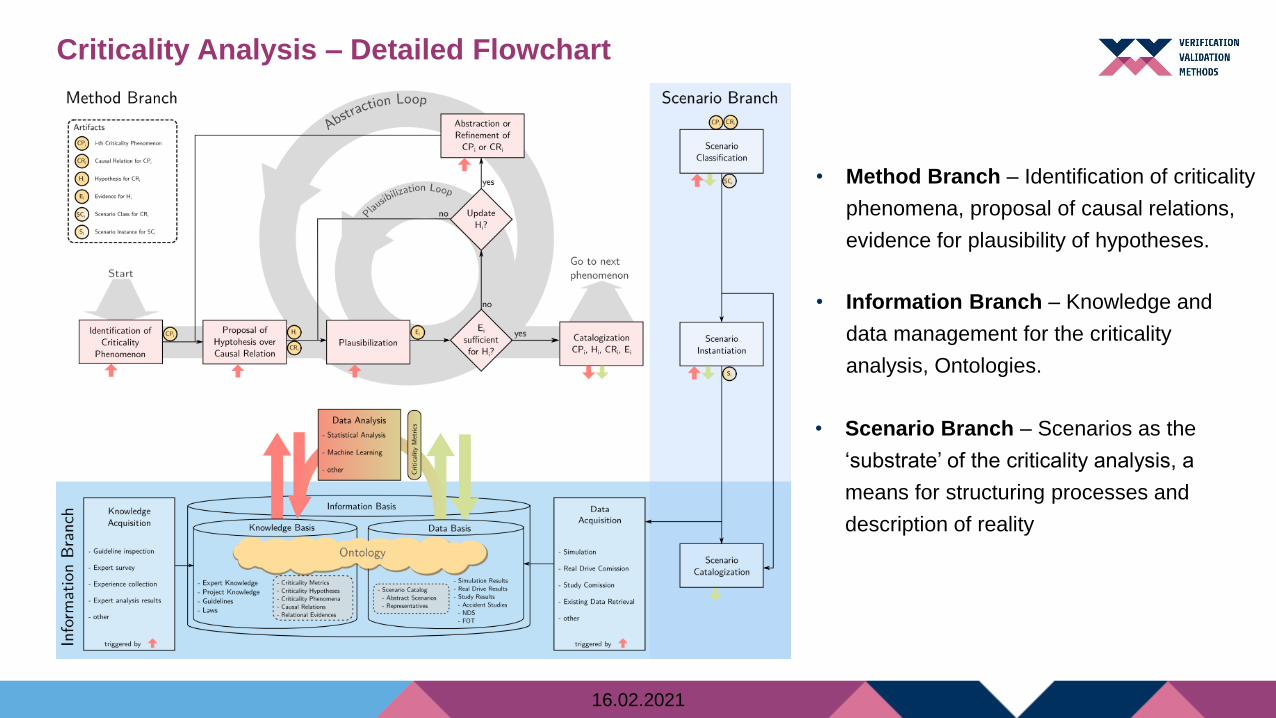
Criticality Analysis – Detailed Flowchart
• Method Branch – Identification of criticality
phenomena, proposal of causal relations,
evidence for plausibility of hypotheses.
• Scenario Branch – Scenarios as the
‘substrate’ of the criticality analysis, a
means for structuring processes and
description of reality
• Information Branch – Knowledge and
data management for the criticality
analysis, Ontologies.
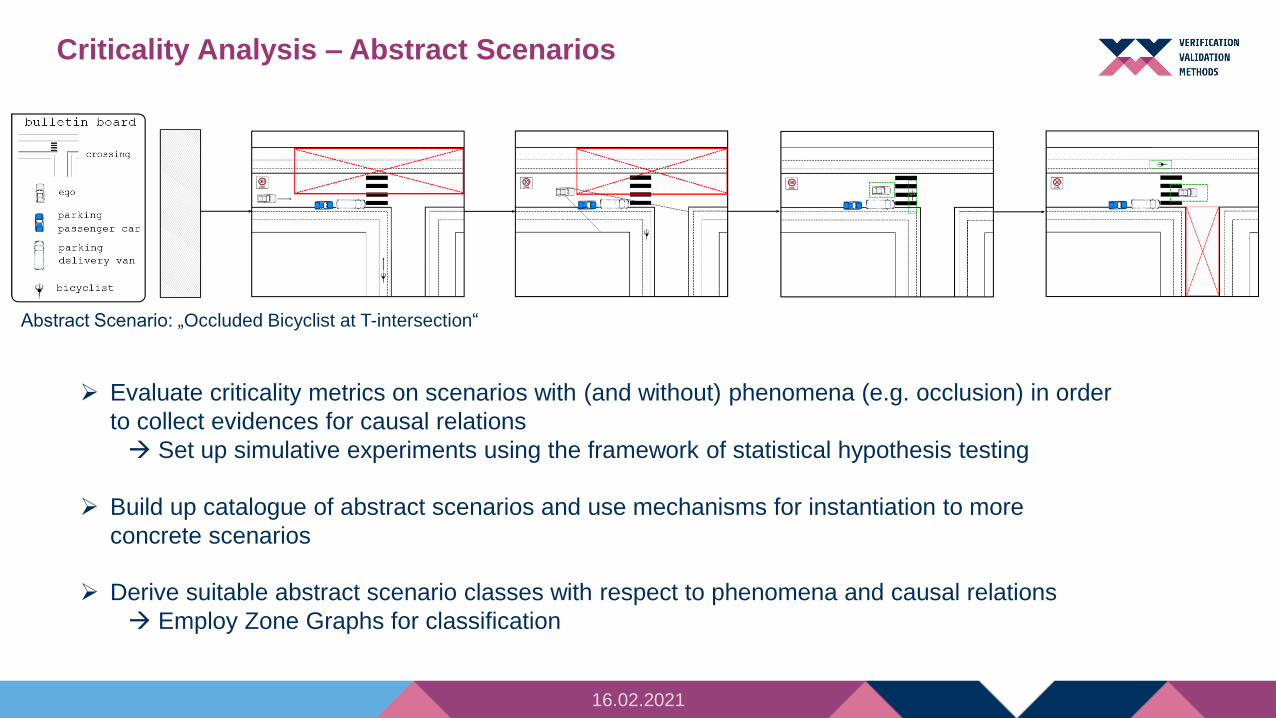
Criticality Analysis – Abstract Scenarios
Build up catalogue of abstract scenarios and use mechanisms for instantiation to more
concrete scenarios
16.02.2021
Derive suitable abstract scenario classes with respect to phenomena and causal relations
Employ Zone Graphs for classification
Evaluate criticality metrics on scenarios with (and without) phenomena (e.g. occlusion) in order
to collect evidences for causal relations
Set up simulative experiments using the framework of statistical hypothesis testing
Abstract Scenario: „Occluded Bicyclist at T-intersection“