Embed Size (px)
Citation preview
PNNL-14901
W-519 Sagebrush Mitigation Project FY-2004 Final Review and Status R.E. Durham M.R. Sackschewsky September 2004 Prepared for the U.S. Department of Energy under Contract DE-AC06-76RL01830
DISCLAIMER This report was prepared as an account of work sponsored by an agency of the United States Government. Neither the United States Government nor any agency thereof, nor Battelle Memorial Institute, nor any of their employees, makes any warranty, express or implied, or assumes any legal liability or responsibility for the accuracy, completeness, or usefulness of any information, apparatus, product, or process disclosed, or represents that its use would not infringe privately owned rights. Reference herein to any specific commercial product, process, or service by trade name, trademark, manufacturer, or otherwise does not necessarily constitute or imply its endorsement, recommendation, or favoring by the United States Government or any agency thereof, or Battelle Memorial Institute. The views and opinions of authors expressed herein do not necessarily state or reflect those of the United States Government or any agency thereof. PACIFIC NORTHWEST NATIONAL LABORATORY operated by BATTELLE for the UNITED STATES DEPARTMENT OF ENERGY under Contract DE-AC06-76RL01830 Printed in the United States of America Available to DOE and DOE contractors from the Office of Scientific and Technical Information, P.O. Box 62, Oak Ridge, TN 37831-0062; ph: (865) 576-8401 fax: (865) 576-5728 email: [email protected] Available to the public from the National Technical Information Service, U.S. Department of Commerce, 5285 Port Royal Rd., Springfield, VA 22161 ph: (800) 553-6847 fax: (703) 605-6900 email: [email protected] online ordering: http://www.ntis.gov/ordering.htm
This document was printed on recycled paper.
(8/00)
PNNL-14901 W-519 Sagebrush Mitigation Project FY-2004 Final Review and Status
R.E. Durham M.R. Sackschewsky September 2004 Prepared for the U.S. Department of Energy under Contract DE-AC06-76RL01830 Pacific Northwest National Laboratory Richland, Washington 99352

EXECUTIVE SUMMARY
This report summarizes activities conducted as mitigation for loss of sagebrush-steppe habitats due to Project W-519, the construction of the infrastructure for the Tank Waste Remediation System Vitirification Plant. The focus of this report is to provide a review and final status of mitigation actions performed through FY2004. Data collected since FY1999 have been included where appropriate.
The Mitigation Action Plan (MAP) for Project W-519 prescribed three general actions to be performed as mitigation for the disturbance of approximately 40 ha (100 acres) of mature sagebrush-steppe habitat. These actions included: 1) transplanting approximately 130,000 sagebrush seedlings on the Fitzner-Eberhardt Arid Lands Ecology Reserve (ALE); 2) rectification of the new transmission line corridor via seeding with native grasses and sagebrush; and 3) research on native plant species with a goal of increasing species diversity in future mitigation or restoration actions.
Nearly 130,000 Wyoming big sagebrush seedlings where planted on ALE during FY2000 and FY2001. About 39,000 of those seedlings were burned during the 24-Command Fire of June 2000. The surviving and subsequent replanting has resulted in about 91,000 seedlings that were planted across four general areas on ALE (Lower Cold Creek / Iowa Flats, Gate-111 Road, and a post-burn area near Yakima Ridge).
A 50% survival rate at any monitoring period was defined as the performance standard in the MAP for this project. Data collected in 2004 indicate that, of the over 5000 monitored plants, 51.1% are still alive and of those the majority are thriving and blooming. This supports the potential for natural recruitment and the ultimate goal of wildlife habitat replacement. Thus, the basic performance standard for sagebrush survival within the habitat compensation planting has been met.
Monitoring activities conducted in 2004 indicate considerable variation in seedling survival depending on the type of plant material, site conditions, and to a lesser extent, treatments performed at the time of planting. The principle findings include: 1) a clear indication that in most settings, bare-root seedling survival is considerably higher than tubling survival; 2) we can expect low plant survival at sites with a high cover of large native bunchgrasses – especially bluebunch wheatgrass; 3) mycorrhizal root treatments appeared to increase growth and survival at the Coppice Dune and 98-Burn Undisturbed sites, but appeared to have little effect at the 98-Burn Disturbed, 111-Road Sitanion, or Cold Creek sites; 3) use of a hydrogel dip at planting increases survival of bare-root plants compared to dipping in plain water; 4) reducing leaf area via clipping after planting did not increase survival of bare-root plants; 5) seedlings planted on a south-aspect hillside at the Lower Cold Creek planting area had higher survival than seedlings planted on the hilltop or northern-aspects– although these survival rates were lower than the survival rate down on the flats at this same location.
Rectification of the transmission corridor occurred in early March 2001, with the broadcast seeding of Sandberg’s bluegrass and sagebrush. Success criteria for this site-of-disturbance rectification required a grass establishment after four years with greater than 25% total canopy
ii
cover with 60% of the plant cover from planted species (DOE 1998). This planting met the total canopy criterion but failed the criterion of 60% relative coverage of planted species. Although the performance standard was not met, the planting is not necessarily a failure; the communities on the tower pads appear to be developing toward the desired end state. We feel that there are no reasonable mitigative actions that can be taken at this time that would significantly alter or speed up the plant community development on these sites. In fact, most options, such as overseeding, may cause damage to the currently establishing communities on those sites.
No future monitoring events are scheduled for this project. This report was prepared as an account of work sponsored by an agency of the United States Government. Neither the United States Government nor any agency thereof, nor Battelle Memorial Institute, nor any of their employees, makes any warranty, express or implied, or assumes any legal liability or responsibility for the accuracy, completeness, or usefulness of any information, apparatus, product, or process disclosed, or represents that its use would not infringe privately owned rights. Reference herein to any specific commercial product, process, or service by trade name, trademark, manufacturer, or otherwise does not necessarily constitute or imply its endorsement, recommendation, or favoring by the United States Government or any agency thereof, or Battelle Memorial Institute. The views and opinions of authors expressed herein do not necessarily state or reflect those of the United States Government or any agency thereof.
PACIFIC NORTHWEST NATIONAL LABORATORY operated by BATTELLE
for the UNITED STATES DEPARTMENT OF ENERGY
under Contract DE-AC06-76RLO 1830
iii
CONTENTS
EXECUTIVE SUMMARY ............................................................................................................ ii LIST OF TABLES........................................................................................................................ vii LIST OF FIGURES ..................................................................................................................... viii
W-519: FY-2004 FINAL REVIEW AND STATUS 1.0 PROJECT OVERVIEW ..................................................................................................... 1.1
2.0 COMPENSATION MITIGATION ACTIVITIES ..............................................................2.1
2.1 Planting and Research Strategies ................................................................................2.1
2.1.1 Criteria for Site Selection................................................................................2.1
2.1.2 Rational for Site Size ..................................................................................... 2.1
2.1.3 Research Considerations.................................................................................2.3
2.2 Planting Schedule........................................................................................................2.4
2.3 Research Design, Site Descriptions, and Planting Layouts ....................................... 2.5
2.3.1 98-Burn Area (98-B).......................................................................................2.5
2.3.1.1 Coppice Dune site (98B-CD)..............................................................2.5
2.3.1.2 Disturbed site (98B-D)........................................................................2.5
2.3.1.3 Undisturbed site (98B-UN).................................................................2.6
2.3.2 111 Road .........................................................................................................2.7
2.3.2.1 Bunchgrass site (111-BG)...................................................................2.7
2.3.2.2 Winterfat site (111-WF)......................................................................2.7
2.3.2.3 Transition site (111-TR) .....................................................................2.7
2.3.2.4 Sitanion site (111-SH).........................................................................2.8
2.3.3 Cold Creek Area .............................................................................................2.9
2.3.4 Iowa Flats........................................................................................................2.9
2.4 Materials and Methods..............................................................................................2.11
2.4.1 Plant material ................................................................................................2.11
2.4.2 Planting method ............................................................................................2.12
iv
2.4.3 Treatments carried out during FY 2000........................................................2.12
2.4.3.1 Dip/no dip treatment .........................................................................2.12
2.4.3.2 Native soil inoculation ......................................................................2.12
2.4.3.3 Root to shoot manipulation...............................................................2.12
2.4.4 Treatments carried out during FY 2001........................................................2.12
2.4.4.1 Mycorrhizae inoculant ......................................................................2.13
2.4.5 Time zero monitoring ...................................................................................2.13
2.4.6 First and subsequent monitoring years .........................................................2.14
2.5 Survival Results ........................................................................................................2.14
2.5.1 98-Burn Area ................................................................................................2.15
2.5.1.1 Coppice Dune site .............................................................................2.16
2.5.1.2 Undisturbed site ................................................................................2.17
2.5.1.3 Disturbed site ....................................................................................2.18
2.5.2 111 Road .......................................................................................................2.19
2.5.3 Cold Creek Valley.........................................................................................2.19
2.5.4 Iowa Flats......................................................................................................2.20
2.6 Growth Analysis .......................................................................................................2.20
2.7 Flowering ..................................................................................................................2.23
2.8 Discussion.................................................................................................................2.26
3.0 RECTIFICATION ACTIVITIES ........................................................................................3.1
3.1 Overview.....................................................................................................................3.1
3.2 Background.................................................................................................................3.1
3.3 Review of Methods and Materials ..............................................................................3.1
3.3.1 Seeding............................................................................................................3.1
3.3.2 Monitoring ......................................................................................................3.2
3.4 Results .........................................................................................................................3.2
3.5 Discussion...................................................................................................................3.2
4.0 GERMINATION ECOLOGY OF SHRUB-STEPPE FORBS............................................4.1
4.1 Overview.....................................................................................................................4.1
4.2 Background.................................................................................................................4.1
4.2.1 Species selection .............................................................................................4.1
v
4.2.2 Seed viability tests ..........................................................................................4.1
4.2.3 Field studies ....................................................................................................4.1
4.2.4 Laboratory baseline and other germination trials ...........................................4.2
4.2.5 FY-2002 field and laboratory research ...........................................................4.3
4.3 Methods and Materials FY 2002.................................................................................4.3
4.3.1 Field storage trial ............................................................................................4.3
4.3.2 Seedling emergence field trial ........................................................................4.3
4.4 Results and Discussion ...............................................................................................4.4
4.4.1 Seedling emergence field trial ........................................................................4.4
4.4.2 Seasonal field storage .....................................................................................4.7
4.5 Discussion...................................................................................................................4.9
5.0 REFERENCES ....................................................................................................................5.1
vi
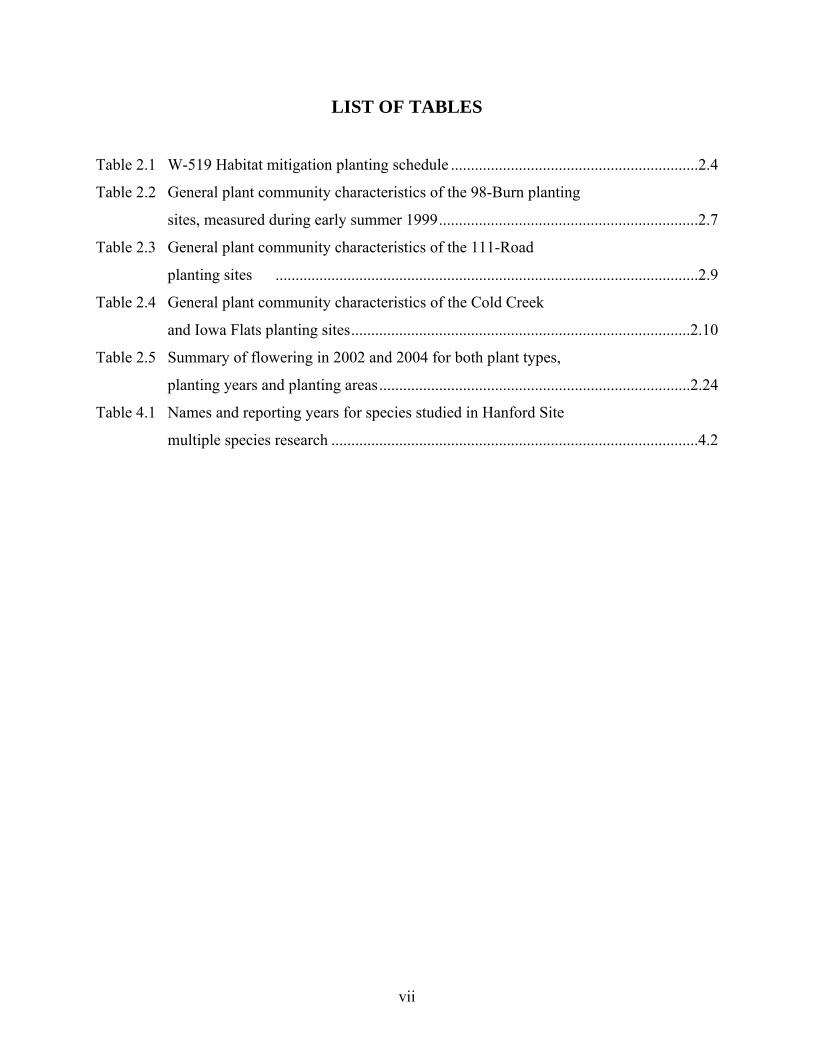
LIST OF TABLES
Table 2.1 W-519 Habitat mitigation planting schedule ..............................................................2.4
Table 2.2 General plant community characteristics of the 98-Burn planting
sites, measured during early summer 1999.................................................................2.7
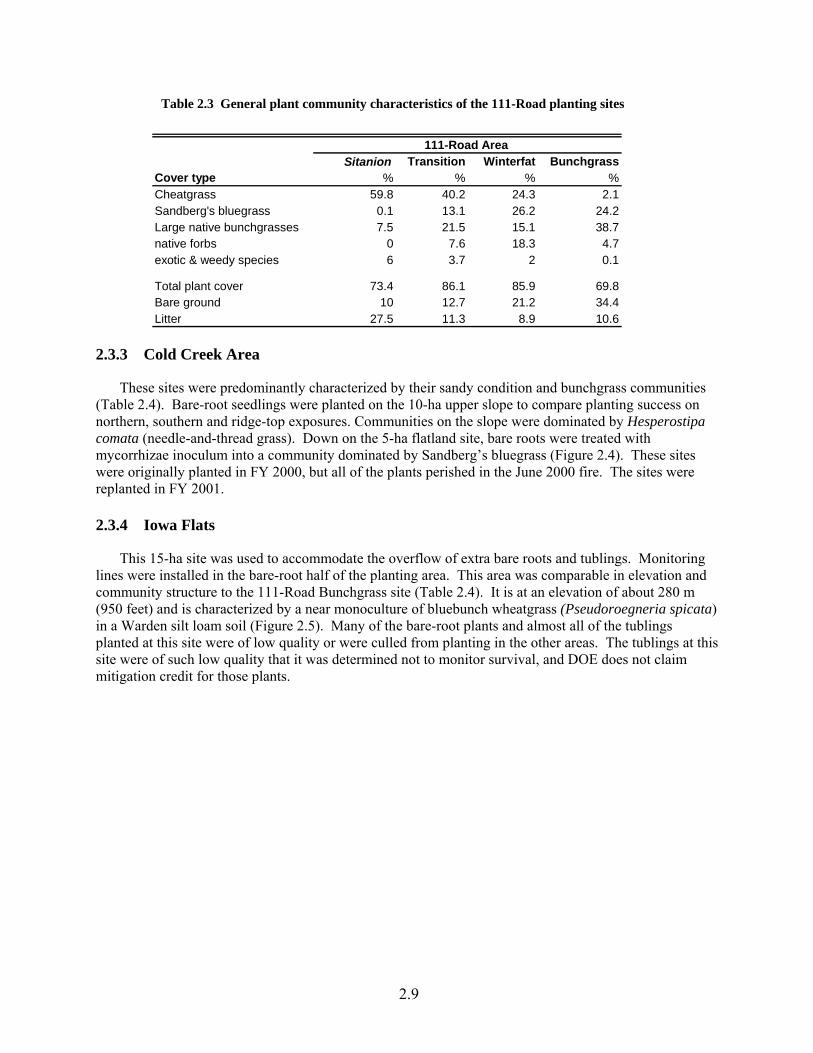
Table 2.3 General plant community characteristics of the 111-Road
planting sites ..........................................................................................................2.9
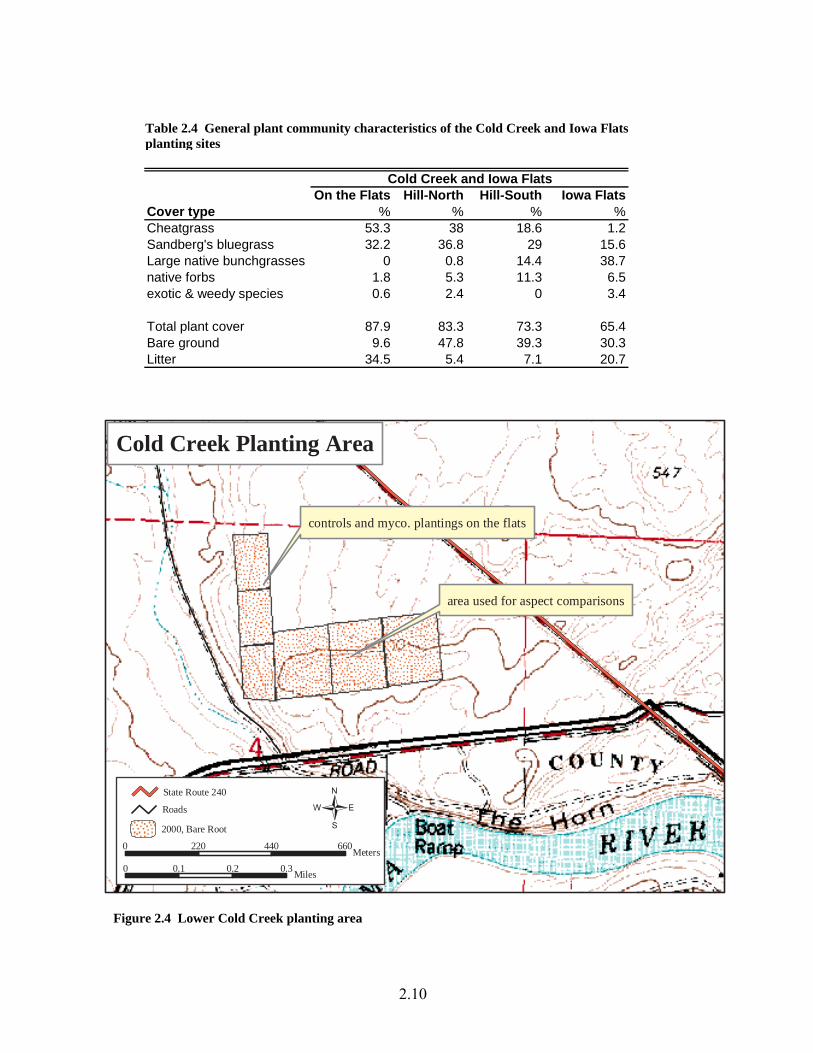
Table 2.4 General plant community characteristics of the Cold Creek
and Iowa Flats planting sites.....................................................................................2.10
Table 2.5 Summary of flowering in 2002 and 2004 for both plant types,
planting years and planting areas..............................................................................2.24
Table 4.1 Names and reporting years for species studied in Hanford Site
multiple species research ............................................................................................4.2
vii
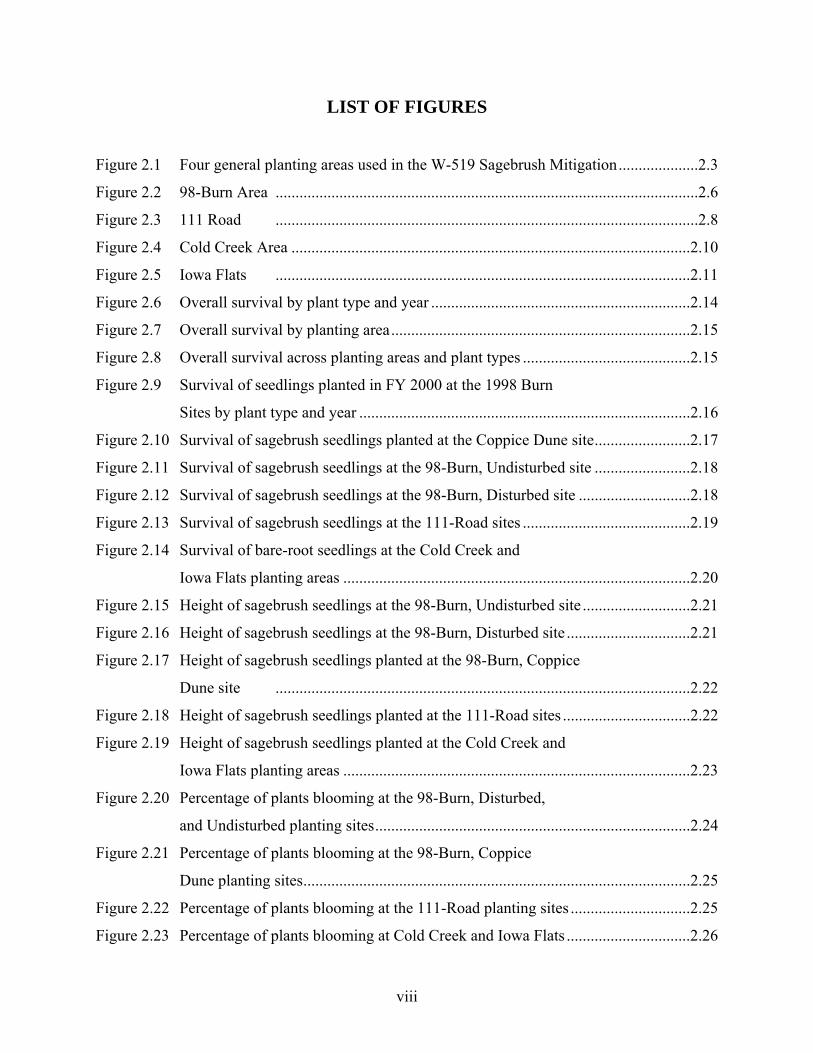
LIST OF FIGURES
Figure 2.1 Four general planting areas used in the W-519 Sagebrush Mitigation....................2.3
Figure 2.2 98-Burn Area ..........................................................................................................2.6
Figure 2.3 111 Road ..........................................................................................................2.8
Figure 2.4 Cold Creek Area ....................................................................................................2.10
Figure 2.5 Iowa Flats ........................................................................................................2.11
Figure 2.6 Overall survival by plant type and year .................................................................2.14
Figure 2.7 Overall survival by planting area...........................................................................2.15
Figure 2.8 Overall survival across planting areas and plant types ..........................................2.15
Figure 2.9 Survival of seedlings planted in FY 2000 at the 1998 Burn
Sites by plant type and year ...................................................................................2.16
Figure 2.10 Survival of sagebrush seedlings planted at the Coppice Dune site........................2.17
Figure 2.11 Survival of sagebrush seedlings at the 98-Burn, Undisturbed site ........................2.18
Figure 2.12 Survival of sagebrush seedlings at the 98-Burn, Disturbed site ............................2.18
Figure 2.13 Survival of sagebrush seedlings at the 111-Road sites ..........................................2.19
Figure 2.14 Survival of bare-root seedlings at the Cold Creek and
Iowa Flats planting areas .......................................................................................2.20
Figure 2.15 Height of sagebrush seedlings at the 98-Burn, Undisturbed site ...........................2.21
Figure 2.16 Height of sagebrush seedlings at the 98-Burn, Disturbed site ...............................2.21
Figure 2.17 Height of sagebrush seedlings planted at the 98-Burn, Coppice
Dune site ........................................................................................................2.22
Figure 2.18 Height of sagebrush seedlings planted at the 111-Road sites ................................2.22
Figure 2.19 Height of sagebrush seedlings planted at the Cold Creek and
Iowa Flats planting areas .......................................................................................2.23
Figure 2.20 Percentage of plants blooming at the 98-Burn, Disturbed,
and Undisturbed planting sites...............................................................................2.24
Figure 2.21 Percentage of plants blooming at the 98-Burn, Coppice
Dune planting sites.................................................................................................2.25
Figure 2.22 Percentage of plants blooming at the 111-Road planting sites ..............................2.25
Figure 2.23 Percentage of plants blooming at Cold Creek and Iowa Flats ...............................2.26
viii
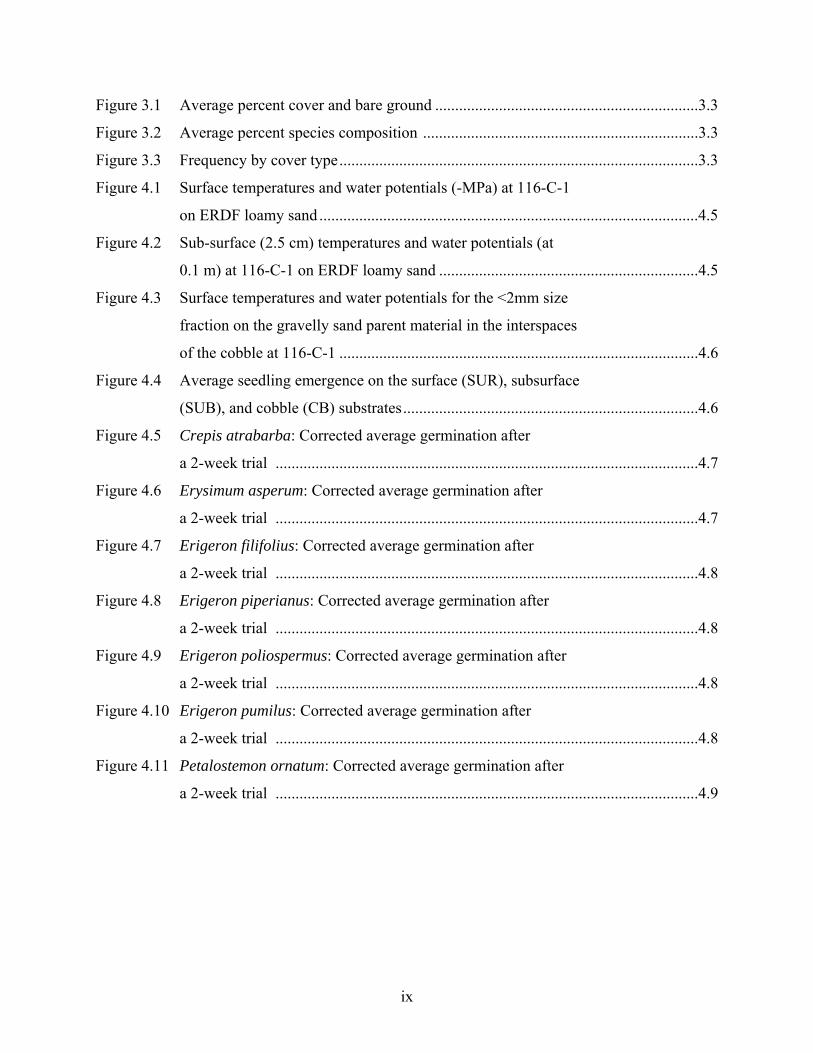
Figure 3.1 Average percent cover and bare ground ..................................................................3.3
Figure 3.2 Average percent species composition .....................................................................3.3
Figure 3.3 Frequency by cover type..........................................................................................3.3
Figure 4.1 Surface temperatures and water potentials (-MPa) at 116-C-1
on ERDF loamy sand ...............................................................................................4.5
Figure 4.2 Sub-surface (2.5 cm) temperatures and water potentials (at
0.1 m) at 116-C-1 on ERDF loamy sand .................................................................4.5
Figure 4.3 Surface temperatures and water potentials for the <2mm size
fraction on the gravelly sand parent material in the interspaces
of the cobble at 116-C-1 ..........................................................................................4.6
Figure 4.4 Average seedling emergence on the surface (SUR), subsurface
(SUB), and cobble (CB) substrates..........................................................................4.6
Figure 4.5 Crepis atrabarba: Corrected average germination after
a 2-week trial ..........................................................................................................4.7
Figure 4.6 Erysimum asperum: Corrected average germination after
a 2-week trial ..........................................................................................................4.7
Figure 4.7 Erigeron filifolius: Corrected average germination after
a 2-week trial ..........................................................................................................4.8
Figure 4.8 Erigeron piperianus: Corrected average germination after
a 2-week trial ..........................................................................................................4.8
Figure 4.9 Erigeron poliospermus: Corrected average germination after
a 2-week trial ..........................................................................................................4.8
Figure 4.10 Erigeron pumilus: Corrected average germination after
a 2-week trial ..........................................................................................................4.8
Figure 4.11 Petalostemon ornatum: Corrected average germination after
a 2-week trial ..........................................................................................................4.9
ix
1.0 Project Overview This document provides a final review and describes the status of planting and research activities
performed in support of the W-519 Sagebrush Mitigation Implementation Plan (Numatec 1998). The period covered is from the project’s early development in the fall of 1999 through the completion of final monitoring during the summer of 2004.
Since 1998, between 40 and 50 ha (100 to 125 acres) of mature sage-steppe habitat have been disturbed or destroyed near the 200-East Area at Hanford as part of the Tank Waste Remediation System privatization Phase 1 Facility construction. Prior to these disturbances, a Mitigation Action Plan (MAP) was prepared to outline the actions necessary for mitigating the loss of these ecological resources (DOE 1998). In the MAP, DOE committed to: 1) compensate for approximately 100 acres of mature sagebrush steppe that would be destroyed by the W-519 project; 2) rectify the habitat losses along a new transmission corridor that would be installed to provide electrical power to the proposed vitrification plants; and 3) support research on both restoration methods and means to increase the native biodiversity of restoration and mitigation projects.
Initial research planning, site selection and characterization, and plant material procurement was initiated in FY1999. Sagebrush planting occurred in early FY2000 and again in early FY2001. As a result, approximately 130,000 Wyoming big sagebrush seedlings were planted as compensation on previously disturbed post-burn sites on the Fitzner/Eberhardt Arid Lands Ecology Reserve (ALE). Site-of-disturbance rectification was preformed in March 2001 along the transmission line corridor with the seeding of Sandberg’s bluegrass and Wyoming big sagebrush.
In addition to the direct compensation provided by sagebrush plantings and the rectification of the transmission line corridor, DOE committed to support research aimed at identifying ways to increase restoration and planting success and to increase our knowledge of the ecology of native shrub-steppe forbs.
Section 2.0 describes compensation mitigation activities that occurred on ALE from 1999 through 2004. This section describes site characterizations, planting strategies, research tasks, and a summary of the monitoring events that occurred throughout the project. Section 3.0 reports the site-of-disturbance rectification activities associated with the transmission line corridor. Section 4.0 reports work conducted between 1999 and 2002 that related to the germination ecology of shrub-steppe forb species.
1.1

2.1
2.0 Compensation Mitigation Activities This section outlines planting-site descriptions, planting designs and treatments, and reports the final
monitoring results of compensatory mitigation activities occurring between 1999 and the summer of 2004 in support of the W-519 Sagebrush Mitigation Project. All work was conducted on ALE.
2.1 Planting and Research Strategies
Planting strategies focused on the overall goals and objectives of the MAP as they were relevant to the confines of site availability on ALE. Goals for the W-519 mitigation planting were: 1) replace habitat value lost as a result of W-519 activities; 2) provide replacement habitat for shrub-steppe dependent species; 3) perform in-kind replacement to the greatest extent possible; 4) bridge gaps in existing shrub steppe habitat where possible; and 5) increase available knowledge about sagebrush planting and habitat restoration techniques.
Factors considered in planting design and development included: 1) site selection; 2) desired plot size; and 3) research and experimental considerations.
2.1.1 Criteria for Site Selection
A number of factors were considered during the selection of planting locations that resulted in a set of optimal site selection criteria. These criteria were defined as sites that would:
• be capable of developing into communities resembling the area disturbed by project activities (i.e., in-kind replacement)
• have pre-existing understory communities that contain significant proportions of native grasses and forbs to encourage the development of high quality habitat capable of supporting large wildlife populations
• have intact, native soils
• bridge gaps between existing blocks of shrub-steppe habitat
• be relatively near the location of disturbance
• be grouped to allow for meaningful comparisons of the various environmental factors effecting sagebrush survival (e.g., soil type, aspect, etc.)
• be near established roads to minimize additional disturbance.
2.1.2 Rationale for Site Size
There were two principle strategies considered while defining the sizes and numbers of areas to be planted. The planting could be conducted on a large number of relatively small plots, a relatively few number of larger plots, or an intermediate number and size of plots. The decision to use large or small planting plots was directly related to the relative importance assigned to the advantages and disadvantages of each.
2.2
Advantages of numerous small plots:
• would include the ability to spread the planting over a wider geographical area; thus allowing for planting in a greater number of environmental conditions
• protect against the likelihood of all or most of the planting effort being lost to a single fire event or other natural disaster
• would serve as a seed source over a larger area
• would ultimately result in more habitat area than a fewer number of large plantings.
Disadvantages of numerous small plots:
• they are logistically complicated to perform, from the initial planting to subsequent monitoring
• It is difficult to incorporate different plant types or other experimental manipulations within a single plot, thus making meaningful comparisons difficult.
• A small plot could be lost due to natural disturbance processes before it could expand to a size that would be useful to shrub-steppe dependant species.
Advantages of using a small number of large plots:
• Large plots are logistically simple to perform, from initial planting through subsequent monitoring.
• plots would be large enough to be usable by shrub-steppe dependant wildlife (potentially within 5 years)
• Several different treatments or plant material types could be incorporated into the same planting area, allowing for meaningful comparisons.
• Larger planting areas could serve as usable bridges between existing habitat areas.
Disadvantages of using a small number of large plots:
• The variety of environmental settings that can be utilized is limited.
• Relatively few plots would mean that a greater proportion of the planting is susceptible to loss from a single fire event or other natural disaster.
• In the absence of disturbance, a small number of large plots ultimately would yield less usable habitat area than many small plantings.
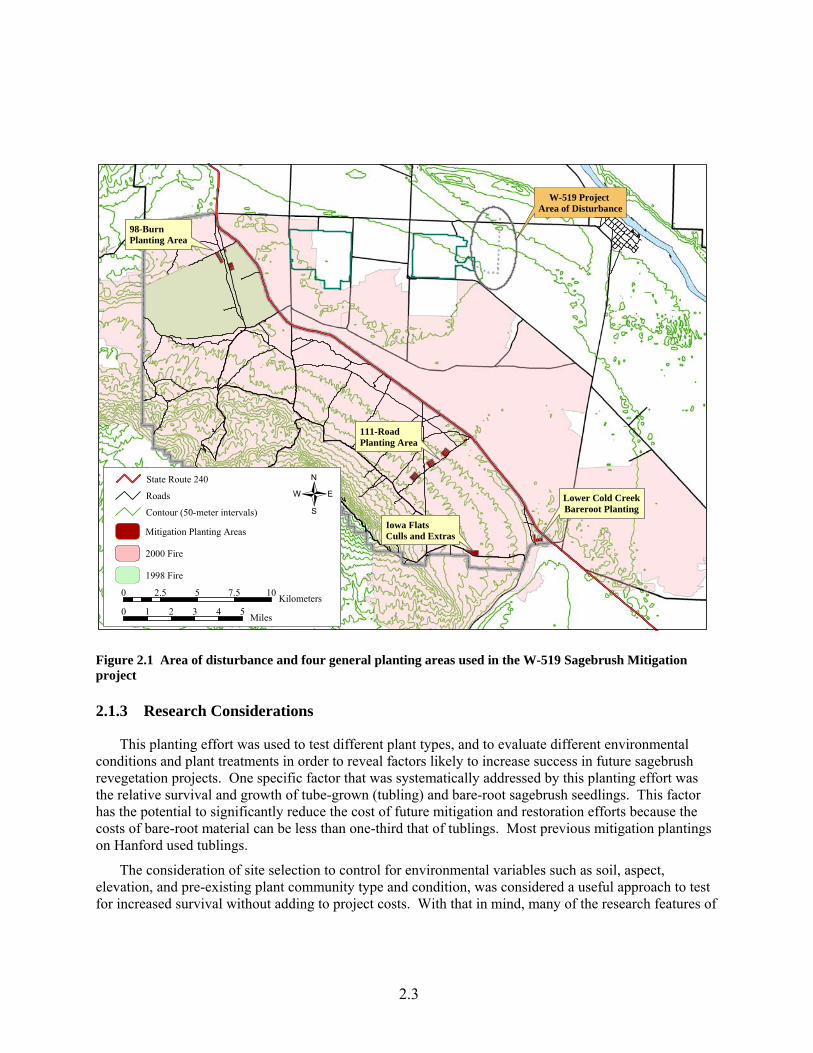
Neither approach is perfect, nor is one approach necessarily better than the other. However, intermediate scenarios are possible that have many of the advantages of both approaches while minimizing the disadvantages. With that in mind, a relatively small number (10) of relatively large plots were identified. Each of the planting areas were between 2 and 20 ha (5 and 50 acres) located in four widely separated areas on ALE (Figure 2.1).
W-519 Project Area of Disturbance
98-BurnPlanting Area
111-RoadPlanting Area
Iowa FlatsCulls and Extras
Lower Cold CreekBareroot Planting
0 1 2 3 4 5 Miles
0 2.5 5 7.5 10 Kilometers
State Route 240
Roads
Contour (50-meter intervals)
Mitigation Planting Areas
2000 Fire
1998 Fire
{
Figure 2.1 Area of disturbance and four general planting areas used in the W-519 Sagebrush Mitigation project
2.1.3 Research Considerations
This planting effort was used to test different plant types, and to evaluate different environmental conditions and plant treatments in order to reveal factors likely to increase success in future sagebrush revegetation projects. One specific factor that was systematically addressed by this planting effort was the relative survival and growth of tube-grown (tubling) and bare-root sagebrush seedlings. This factor has the potential to significantly reduce the cost of future mitigation and restoration efforts because the costs of bare-root material can be less than one-third that of tublings. Most previous mitigation plantings on Hanford used tublings.
The consideration of site selection to control for environmental variables such as soil, aspect, elevation, and pre-existing plant community type and condition, was considered a useful approach to test for increased survival without adding to project costs. With that in mind, many of the research features of
2.3
this project focused on the analysis and comparisons of survival in different environmental settings. In this way, we hoped to reveal the most conducive combinations of conditions for sagebrush transplanting success. We also attempted to take advantage of the natural variation occurring both among and within planting sites to examine the effects of various suites of environmental variables on sagebrush transplant survival.
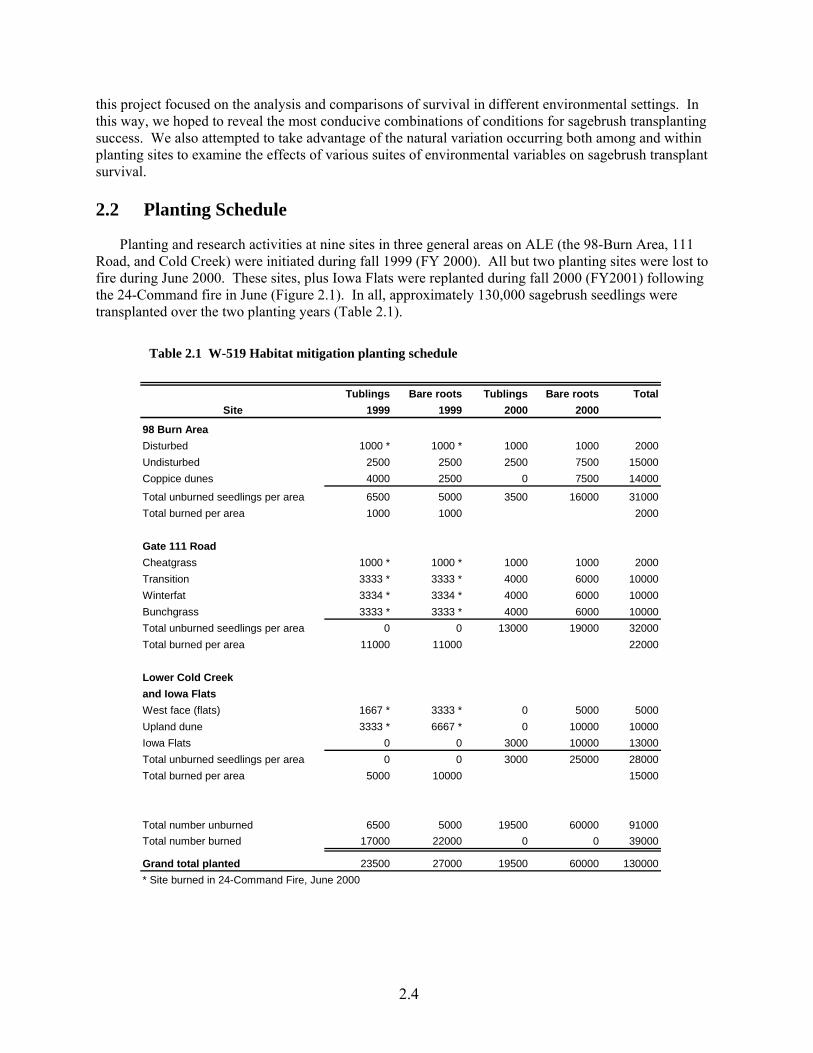
2.2 Planting Schedule
Planting and research activities at nine sites in three general areas on ALE (the 98-Burn Area, 111 Road, and Cold Creek) were initiated during fall 1999 (FY 2000). All but two planting sites were lost to fire during June 2000. These sites, plus Iowa Flats were replanted during fall 2000 (FY2001) following the 24-Command fire in June (Figure 2.1). In all, approximately 130,000 sagebrush seedlings were transplanted over the two planting years (Table 2.1).
Tublings Bare roots Tublings Bare roots TotalSite 1999 1999 2000 2000
98 Burn AreaDisturbed 1000 * 1000 * 1000 1000 2000Undisturbed 2500 2500 2500 7500 15000Coppice dunes 4000 2500 0 7500 14000
Total unburned seedlings per area 6500 5000 3500 16000 31000Total burned per area 1000 1000 2000
Gate 111 RoadCheatgrass 1000 * 1000 * 1000 1000 2000Transition 3333 * 3333 * 4000 6000 10000Winterfat 3334 * 3334 * 4000 6000 10000Bunchgrass 3333 * 3333 * 4000 6000 10000Total unburned seedlings per area 0 0 13000 19000 32000Total burned per area 11000 11000 22000
Lower Cold Creekand Iowa FlatsWest face (flats) 1667 * 3333 * 0 5000 5000Upland dune 3333 * 6667 * 0 10000 10000Iowa Flats 0 0 3000 10000 13000Total unburned seedlings per area 0 0 3000 25000 28000Total burned per area 5000 10000 15000
Total number unburned 6500 5000 19500 60000 91000Total number burned 17000 22000 0 0 39000
Grand total planted 23500 27000 19500 60000 130000* Site burned in 24-Command Fire, June 2000
Table 2.1 W-519 Habitat mitigation planting schedule
2.4
2.5
The Undisturbed and Coppice Dune sites located within a post-fire footprint referred to as the 98 Burn Area were not entirely lost to the 24-Command fire. These surviving sites represent approximately 11,500 sagebrush seedlings (6,500, 10-in3 tubling and 5,000 bare-root seedlings). Year-one seedling survival and associated research activities for those sites were reported in the FY-2000 W-519 Sagebrush Mitigation Report (Sackschewsky et al. 2000). At that time, overall seedling survival averaged about 49%, where much of that mortality appeared to be caused by the fingerings of fire that swept through parts of the area in June 2000.
As stated previously, the primary goal of this project was habitat mitigation, with a primary objective to maximize the amount of information obtained. Part of this objective was to determine if an economic advantage could be found using tublings over the use of bare-root stock, while maximizing the density of sagebrush on mitigation sites. Tublings have been used on many restoration sites at Hanford, and they offer several advantages compared to bare-root material. For instance, delivery time is not subject to climatic conditions at the nursery where bare-root stock must be ‘hardened off’ in the field by reduced temperatures and water until carbohydrate reserves are established and the seedlings are in a dormant state. This factor alone will limit the use of bare-root plants to late fall and early winter plantings. On the other hand, 10-in3 tublings can cost three times that of bare-root material.
The first planting utilized both bare-root seedlings and 10-in3 tublings. However, no economic or performance advantage was found during FY 2000 to support their use over bare-root plants. Prior to the second planting in FY-2001, a source for 4-in3 tublings was identified. These smaller containerized seedlings were comparably priced to the bare-root plants. This afforded an opportunity to further compare the use of tublings with bare-root seedlings. The FY-2001 planting took place during December 2000 with the planting of 19,500 4-in3 tublings and 60,000 bare-root seedlings.
2.3 Research Design, Site Descriptions, and Planting Layouts
2.3.1 98-Burn Area (98B)
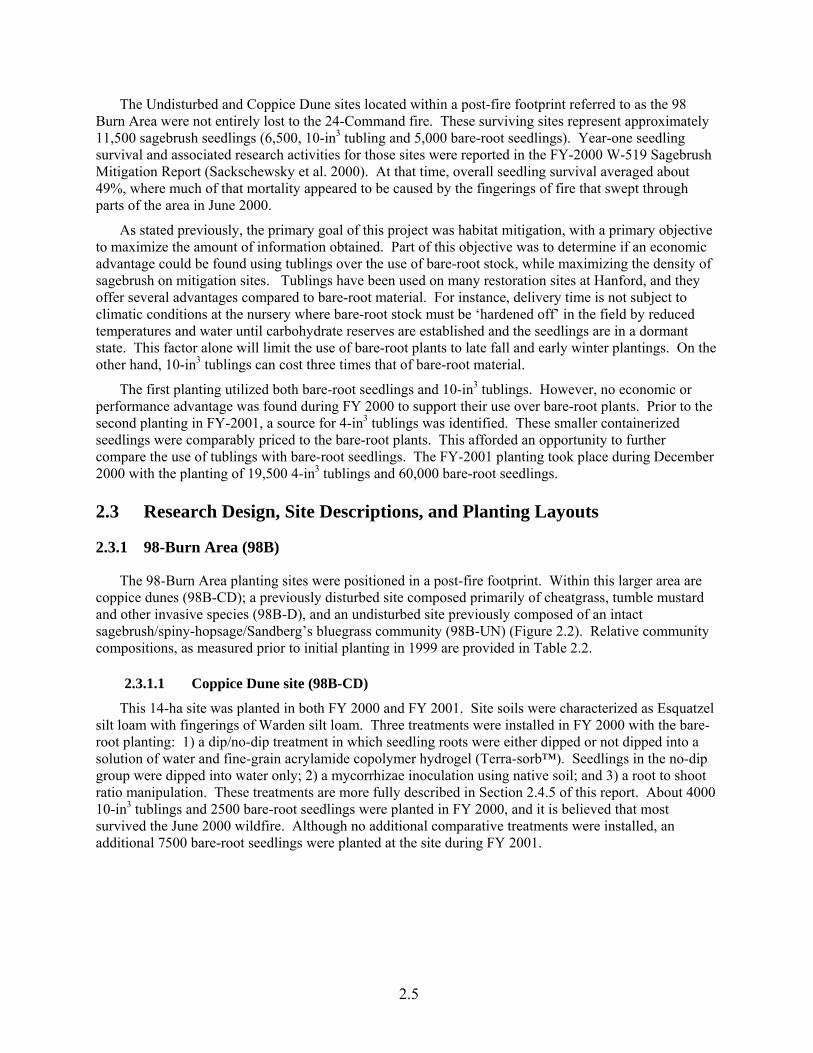
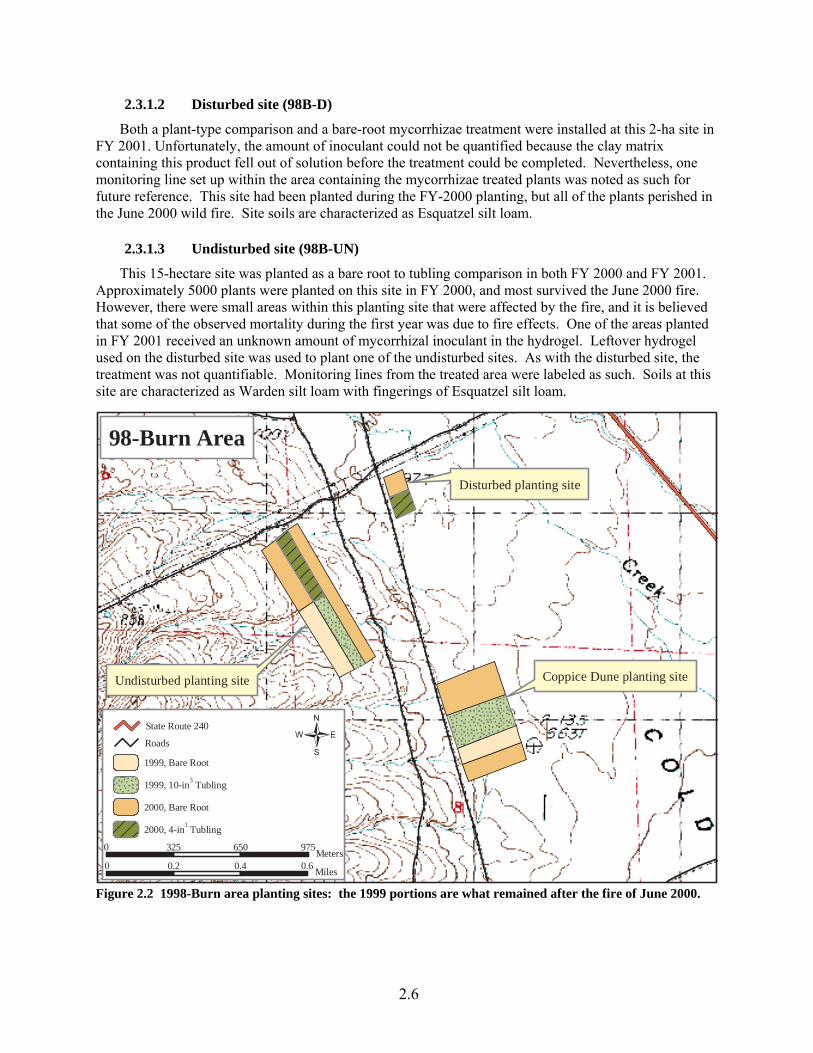
The 98-Burn Area planting sites were positioned in a post-fire footprint. Within this larger area are coppice dunes (98B-CD); a previously disturbed site composed primarily of cheatgrass, tumble mustard and other invasive species (98B-D), and an undisturbed site previously composed of an intact sagebrush/spiny-hopsage/Sandberg’s bluegrass community (98B-UN) (Figure 2.2). Relative community compositions, as measured prior to initial planting in 1999 are provided in Table 2.2.
2.3.1.1 Coppice Dune site (98B-CD)
This 14-ha site was planted in both FY 2000 and FY 2001. Site soils were characterized as Esquatzel silt loam with fingerings of Warden silt loam. Three treatments were installed in FY 2000 with the bare-root planting: 1) a dip/no-dip treatment in which seedling roots were either dipped or not dipped into a solution of water and fine-grain acrylamide copolymer hydrogel (Terra-sorb™). Seedlings in the no-dip group were dipped into water only; 2) a mycorrhizae inoculation using native soil; and 3) a root to shoot ratio manipulation. These treatments are more fully described in Section 2.4.5 of this report. About 4000 10-in3 tublings and 2500 bare-root seedlings were planted in FY 2000, and it is believed that most survived the June 2000 wildfire. Although no additional comparative treatments were installed, an additional 7500 bare-root seedlings were planted at the site during FY 2001.
2.3.1.2 Disturbed site (98B-D)
Both a plant-type comparison and a bare-root mycorrhizae treatment were installed at this 2-ha site in FY 2001. Unfortunately, the amount of inoculant could not be quantified because the clay matrix containing this product fell out of solution before the treatment could be completed. Nevertheless, one monitoring line set up within the area containing the mycorrhizae treated plants was noted as such for future reference. This site had been planted during the FY-2000 planting, but all of the plants perished in the June 2000 wild fire. Site soils are characterized as Esquatzel silt loam.
2.3.1.3 Undisturbed site (98B-UN)
This 15-hectare site was planted as a bare root to tubling comparison in both FY 2000 and FY 2001. Approximately 5000 plants were planted on this site in FY 2000, and most survived the June 2000 fire. However, there were small areas within this planting site that were affected by the fire, and it is believed that some of the observed mortality during the first year was due to fire effects. One of the areas planted in FY 2001 received an unknown amount of mycorrhizal inoculant in the hydrogel. Leftover hydrogel used on the disturbed site was used to plant one of the undisturbed sites. As with the disturbed site, the treatment was not quantifiable. Monitoring lines from the treated area were labeled as such. Soils at this site are characterized as Warden silt loam with fingerings of Esquatzel silt loam.
Figure 2.2 1998-Burn area planting sites: the 1999 portions are what remained after the fire of June 2000.
0 0.2 0.4 0.6Miles
0 325 650 975Meters
State Route 240
Roads
1999, Bare Root
1999, 10-in3 Tubling
2000, Bare Root
2000, 4-in3 Tubling
�
98-Burn Area
Coppice Dune planting site
Disturbed planting site
Undisturbed planting site
2.6
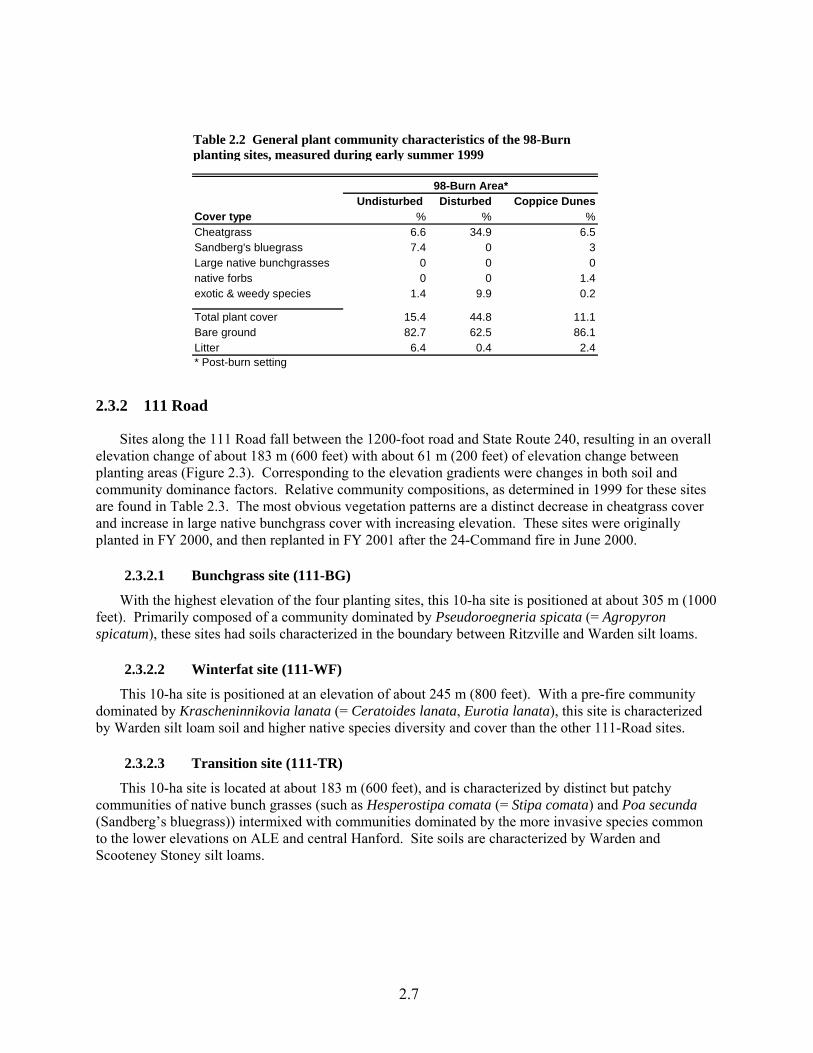
2.3.2 111 Ro
Sites along elevation changplanting areas (community domare found in Taand increase in planted in FY 2
2.3.2.1 With the hi
feet). Primarilyspicatum), these
2.3.2.2 This 10-ha
dominated by Kby Warden silt
2.3.2.3 This 10-ha
communities of(Sandberg’s bluto the lower eleScooteney Ston
Table 2.2 General plant community characteristics of the 98-Burnplanting sites, measured during early summer 1999
Undisturbed Disturbed Coppice DunesCover type % %Cheatgrass 6.6 34.9 6.5Sandberg's bluegrass 7.4 0 3Large native bunchgrasses 0 0 0native forbs 0 0 1.4exotic & weedy species 1.4 9.9 0.2
Total plant cover 15.4 44.8 11.1Bare ground 82.7 62.5 86.1Litter 6.4 0.4 2.4* Post-burn setting
98-Burn Area*
%
ad
the 111 Road fall between the 1200-foot road and State Route 240, resulting in an overall e of about 183 m (600 feet) with about 61 m (200 feet) of elevation change between Figure 2.3). Corresponding to the elevation gradients were changes in both soil and inance factors. Relative community compositions, as determined in 1999 for these sites
ble 2.3. The most obvious vegetation patterns are a distinct decrease in cheatgrass cover large native bunchgrass cover with increasing elevation. These sites were originally 000, and then replanted in FY 2001 after the 24-Command fire in June 2000.
Bunchgrass site (111-BG)
ghest elevation of the four planting sites, this 10-ha site is positioned at about 305 m (1000 composed of a community dominated by Pseudoroegneria spicata (= Agropyron sites had soils characterized in the boundary between Ritzville and Warden silt loams.
Winterfat site (111-WF)
site is positioned at an elevation of about 245 m (800 feet). With a pre-fire community rascheninnikovia lanata (= Ceratoides lanata, Eurotia lanata), this site is characterized loam soil and higher native species diversity and cover than the other 111-Road sites.
Transition site (111-TR)
site is located at about 183 m (600 feet), and is characterized by distinct but patchy native bunch grasses (such as Hesperostipa comata (= Stipa comata) and Poa secunda egrass)) intermixed with communities dominated by the more invasive species common vations on ALE and central Hanford. Site soils are characterized by Warden and ey silt loams.
2.7
2.3.2.4 Sitanion site (111-SH)
This 2-ha site is located at about 120 m (400 feet) and is positioned closest to the Gate 111 entrance to ALE off State Route 240. This site is characterized by a community of Elymus elymoides (= Sitanion hystrix), Sandberg’s bluegrass, and Bromus tectorum (cheatgrass). Ephrata sandy loam characterizes the site soil. A mycorrhizae treatment was installed on this site in FY 2001.
d
111-Road Planting Area
Winterfat Site
Sitanion Site
Bunchgrass Site
Transition Site
0 0.5 1 1.5Miles
0 0.7 1.4 2.1Kilometers
State Route 240
Roads
2000, 4-in3 Tubling
2000, Bare Root
�1200-foot Road
Figure 2.3 111-Road: Four sites planted along an elevational gradient between the 1200-foot road anState Route 240
2.8
Sitanion Transition Winterfat Bunchgrass
Cover type % % %Cheatgrass 59.8 40.2 24.3 2.1Sandberg's bluegrass 0.1 13.1 26.2 24.2Large native bunchgrasses 7.5 21.5 15.1 38.7native forbs 0 7.6 18.3 4.7exotic & weedy species 6 3.7 2 0.1
Total plant cover 73.4 86.1 85.9 69.8Bare ground 10 12.7 21.2 34.4Litter 27.5 11.3 8.9 10.6
111-Road Area
%
Table 2.3 General plant community characteristics of the 111-Road planting sites
2.3.3 Cold Creek Area
These sites were predominantly characterized by their sandy condition and bunchgrass communities (Table 2.4). Bare-root seedlings were planted on the 10-ha upper slope to compare planting success on northern, southern and ridge-top exposures. Communities on the slope were dominated by Hesperostipa comata (needle-and-thread grass). Down on the 5-ha flatland site, bare roots were treated with mycorrhizae inoculum into a community dominated by Sandberg’s bluegrass (Figure 2.4). These sites were originally planted in FY 2000, but all of the plants perished in the June 2000 fire. The sites were replanted in FY 2001.
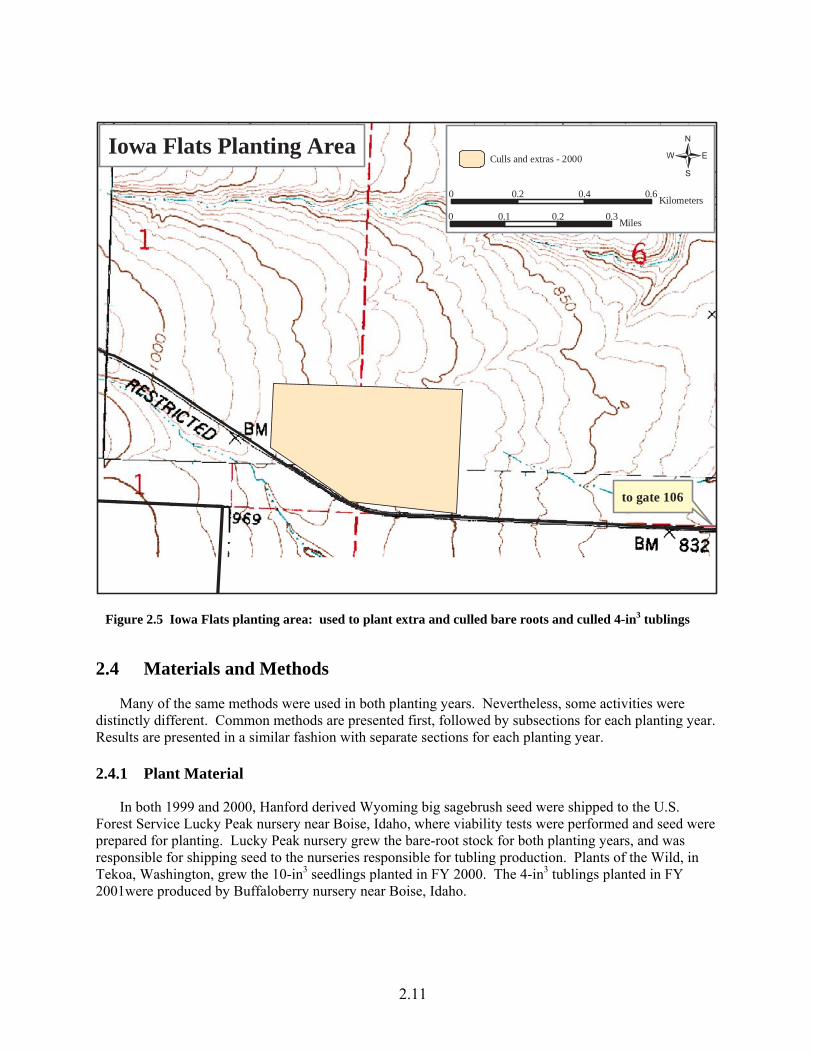
2.3.4 Iowa Flats
This 15-ha site was used to accommodate the overflow of extra bare roots and tublings. Monitoring lines were installed in the bare-root half of the planting area. This area was comparable in elevation and community structure to the 111-Road Bunchgrass site (Table 2.4). It is at an elevation of about 280 m (950 feet) and is characterized by a near monoculture of bluebunch wheatgrass (Pseudoroegneria spicata) in a Warden silt loam soil (Figure 2.5). Many of the bare-root plants and almost all of the tublings planted at this site were of low quality or were culled from planting in the other areas. The tublings at this site were of such low quality that it was determined not to monitor survival, and DOE does not claim mitigation credit for those plants.
2.9
On the Flats Hill-North Hill-South Iowa FlatsCover type % % %Cheatgrass 53.3 38 18.6 1.2Sandberg's bluegrass 32.2 36.8 29 15.6Large native bunchgrasses 0 0.8 14.4 38.7native forbs 1.8 5.3 11.3 6.5exotic & weedy species 0.6 2.4 0 3.4
Total plant cover 87.9 83.3 73.3 65.4Bare ground 9.6 47.8 39.3 30.3Litter 34.5 5.4 7.1 20.7
Cold Creek and Iowa Flats
%
Table 2.4 General plant community characteristics of the Cold Creek and Iowa Flats planting sites
2.10
Cold Creek Planting Area
area used for aspect comparisons
controls and myco. plantings on the flats
0 0.1 0.2 0.3Miles
0 220 440 660Meters
State Route 240
Roads
2000, Bare Root �Figure 2.4 Lower Cold Creek planting area
2.11
Materials and Methods
in both planting years. Nevertheless, some activities were dist ear.
, Hanford derived Wyoming big sagebrush seed were shipped to the U.S. For were
2.4
Iowa Flats Planting Area
to gate 106
0 0.1 0.2 0.3Miles
0 0.2 0.4 0.6Kilometers
Culls and extras - 2000 �
Figure 2.5 Iowa Flats planting area: used to plant extra and culled bare roots and culled 4-in3 tublings
Many of the same methods were usedinctly different. Common methods are presented first, followed by subsections for each planting y
Results are presented in a similar fashion with separate sections for each planting year.
2.4.1 Plant Material
In both 1999 and 2000est Service Lucky Peak nursery near Boise, Idaho, where viability tests were performed and seed
prepared for planting. Lucky Peak nursery grew the bare-root stock for both planting years, and was responsible for shipping seed to the nurseries responsible for tubling production. Plants of the Wild, in Tekoa, Washington, grew the 10-in3 seedlings planted in FY 2000. The 4-in3 tublings planted in FY 2001were produced by Buffaloberry nursery near Boise, Idaho.
2.12
Planting methods were the same in both years. Tubling and bare-root seedlings were hand planted by s inch hoedads. Bare-root seedling roots were dipped into a fine-grade Terra-
Sorb™ hydrogel (acrylamide copolymer) prepared at a concentration of 4.0 g Terra-Sorb™ powder per liter
On November 30, 1999, 6500 tublings were planted across the undisturbed and coppice dune sites erimental treatments, described
below, were applied to bare-root plantings on the coppice dune site.
he utility of using a hydrogel on bare dlin ermine if the use of this material should be included in contract spec s du antings. One area was planted as a control as described above, whi
ip were examined in this treatment. The dip was prepared by adding 1,700 grams of soil to a 5-gal bucket of prepared hydrogel. The inoculum so growing root zone (~2 dm) under a healthy sagebrush stan
reasing the root to shoot ratio by trimming the s r p creasing the leaf area. On December 7, 1999, two days after , th height to the nearest centimeter. The height of each seed
During FY 2000, the relative performance of bare-root seedlings was compared to 10-in3 tublings. In in3 tublings. This comparison
was conducted over a variety of soils and elevations. As in FY 2000, experimental treatments were perf
2.4.2 Planting Method
a profe sional crew using 17-
of water. Seedlings were planted at a nominal density of 1000 seedlings/ha (400 seedlings/ac) across all sites. Prior to FY 2001, planting activities had been scheduled for late October into mid-November. The FY-2001 planting was scheduled for December, to decrease the potential for low soil-water conditions. It is likely that in FY 2000 some mortality was caused by the extended field storage required while waiting for sufficient soil moisture to accumulate.
2.4.3 Experimental Treatments Carried out During FY 2000
followed by 5000 bare-root seedlings planted on December 5, 1999. Exp
2.4.3.1 Dip/no dip treatment
Two areas on the coppice dune site were established to examine t-root see gs with the intent to detification ring future bare-root pl
le the no-dip treatment consisted of dipping plant roots in water only.
2.4.3.2 Native soil inoculation
The effects, if any, of adding a mycorrhizal inoculum to the hydrogel d
il was collected from an activelyd where vesicular-arbuscular mycorrhizal (VAM) spores are considered to occur in abundance
(Wicklow-Howard 1994). The plants were dipped into this slurry and planted as before. Inoculum soil was sent to a food-web laboratory for VAM spore analysis.
2.4.3.3 Root to shoot manipulation
This experiment was intended to examine the effect of inctems afte lanting, thereby effectively de planting e seedlings were measured forling was then reduced by half using scissors and a ruler.
2.4.4 Experimental Treatments Carried out During FY 2001
FY 2001, the relative performance of bare-root stock was compared to 4-
ormed in FY 2001 with some of the bare-root seedlings.
2.13
2.4.4.1 Mycorrhizae inoculant
A three-species blend of arbuscular mycorrhizal (AM) fungi was purchased from Mycorrhizal Applications, Inc., of Grants Pass, Oregon. BioGROW endo,™ and BioGROW micronized endo,™ are both commercially available products that allowed for a relatively controllable treatment. That is, the number and type of active spores per pound of product were known. The three species used were: Glomus intraradices, Glomus mosseae, and Glomus aggregatum. Wyoming big sagebrush is known to develop non-specific associations with such mycorrhizae.
The methodology for applying this inoculum proved challenging. Attempts were considered unsuccessful at the 98-Burn area where the plan was to inoculate one half of the bare-root seedlings at the 2-hectare disturbed site.
First attempt: One half of the bare-root seedlings planted on the 2-hectare 98B-D site received a commercial mycorrhizal inoculant called BioGROW endo.™ This mycorrhizal treatment was prepared by mixing 4.5 kg (10-lbs) AM inoculant bound in a clay matrix into about 7.5 liters (2 gal) of prepared hydrogel solution. This product was reported to provide 132-thousand AM spores per kilogram of inoculant (60-thousand AM spores per pound). About four liters (1 gal) of additional water was added to make the slurry thin enough for the matrix to suspend but still cling to seedling roots. Unfortunately, the matrix and hydrogel quickly fell out of solution rendering the mixture useless.
One, 11-liter (about 3 gal) application was planned to treat 500 seedlings. If successful, this application would have added about 1200 AM spores (132K AM spores/kg inoculant x 4.5 kg inoculant/500 plants) onto or near seedling roots by suspension in the hydrogel dip. Nevertheless, one half of the bare-root seedlings planted on the 2-hectare 98-Burn-Disturbed site were given this treatment. The leftover slurry was also used on one of the 98B-UN sites. This site was also labeled with a myco extension (98B_UN_B5_myco), but again, this was not considered a quantifiable treatment.
Second attempt: A micronized version of the same inoculant called BioGROW micronized endo,™ was received in time to plant one half of the bare-root seedlings at 111-SH, and one half of the low-laying Cold Creek planting site. The manufacturer reported this micronized AM inoculant to be more concentrated (about 220-thousand spores per kg), and recommended a concentration of 3.4 kilograms (7.5 lbs) inoculant per 500 seedlings (about 1500 AM spores per seedling based on 220K x 3.4 kg/500 seedlings).
At 111-SH, 500 bare-root seedlings were treated with 3.4 kilograms of inoculant in solution (1500 AM spores per seedling as outlined above).
Using an amount of hydrogel adequate to cover the treatment size, 1000 bare-root seedlings were treated with 5.7 kilograms (12.5 lbs) of inoculant in solution at the Cold Creek site (1250 AM spores per seedling based on 100-thousand AM spores x 12.5 kg inoculant /1000 seedlings).
2.4.5 Time Zero Monitoring
Mapping commenced in December 1999 to establish permanent monitoring transects at each planting site. In most cases, at least two 100-m transects were installed for each plant type and/or planting site. For some of the specialty treatments, such as mycorrhizal dips, one transect may have been installed for the treatment adjacent to a control transect. Transect lines were permanently marked at both ends with T-posts and/or 2-1/2 foot 1⁄2-inch rebar. Metal tags baring the line number and project identification were wired to both the starting and end posts of each line. Where possible, a 100-plant minimum was established for each transect. Seedlings were mapped by assigning coordinates based on distance from, and distance along the line. Seedlings on the right side of the belt were assigned positive distance values
while those seedlings on the left side were given negative distance values. Other baseline measurements included seedling height with two widths and comments on health.
2.4.6 First and Subsequent Monitoring Years
All mapped seedlings were revisited during July in 2000, 2001, 2002, and 2004. As before, measures of living seedling height and two widths were recorded. A value of health was established where all plants were categorized as healthy (2), sick (1), or dead (0). This qualitative value was based on appearance only. A seedling was considered healthy if it displayed no more than 60 percent chlorotic foliage, while sick plants received a rank of 1 when the seedling exhibited greater than 60 percent chlorotic foliage or did not look as though it would survive to the next monitoring event. Plants were considered dead when no live leaves were present on any stem, or when previously mapped seedlings could not be located.
2.5 Survival Results
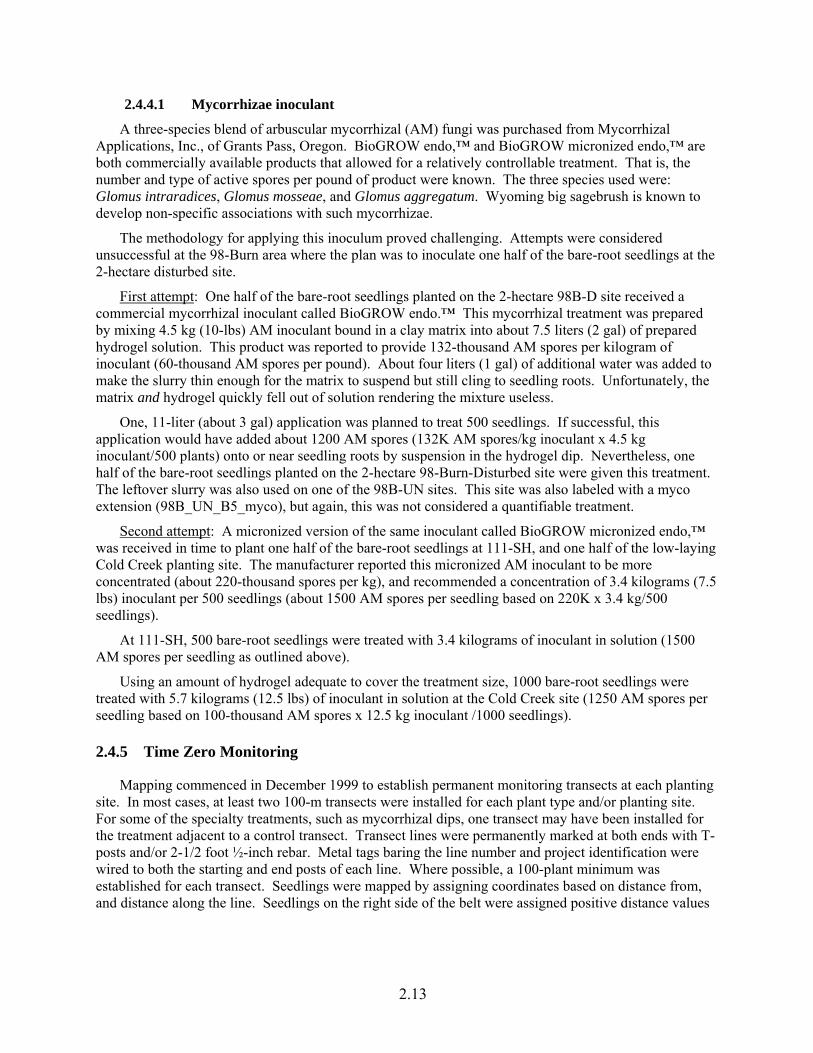
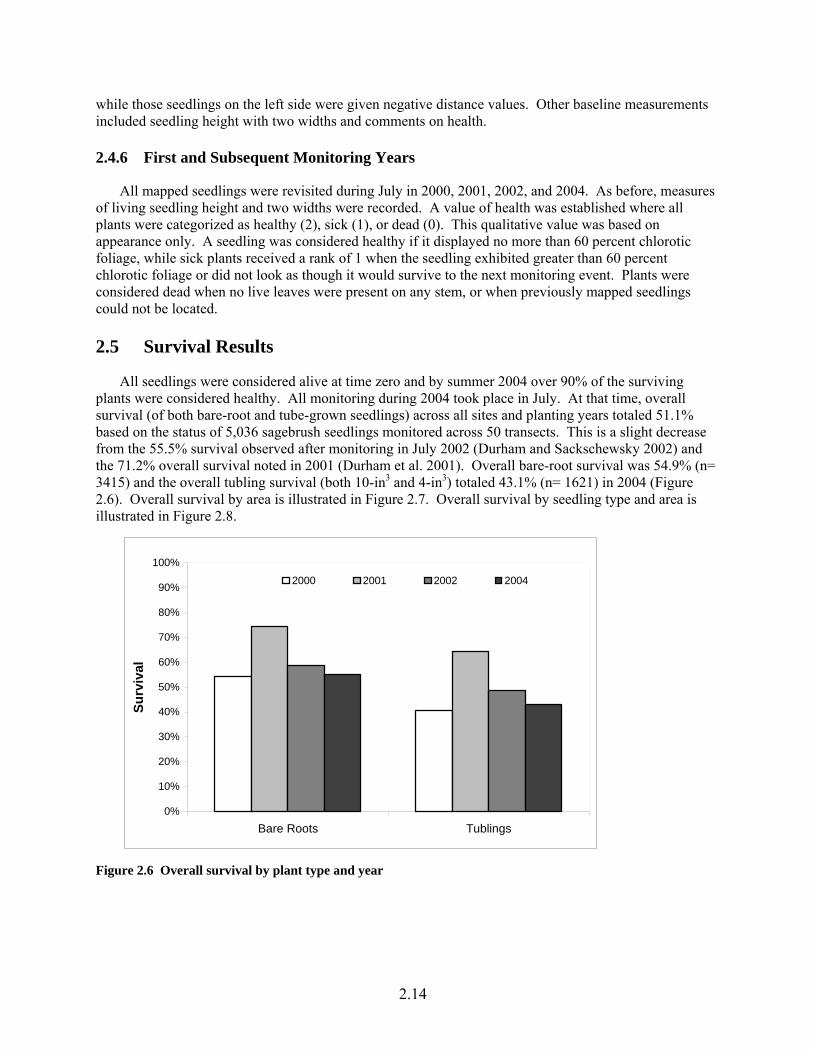
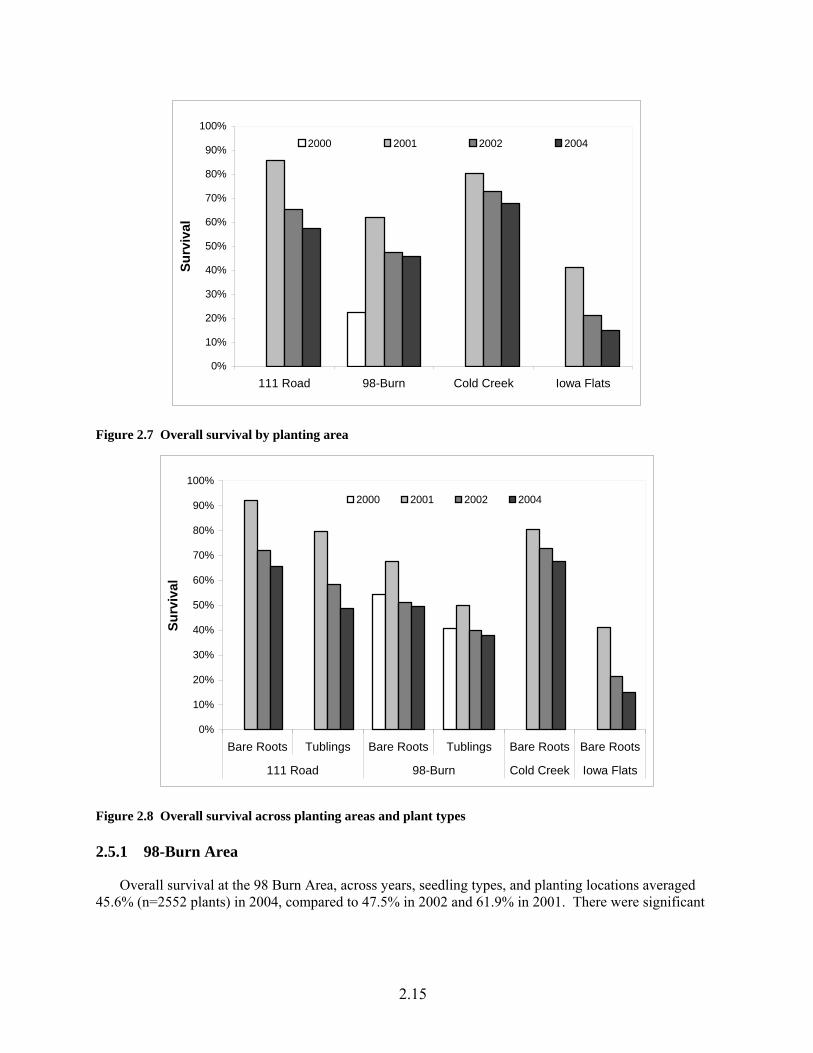
All seedlings were considered alive at time zero and by summer 2004 over 90% of the surviving plants were considered healthy. All monitoring during 2004 took place in July. At that time, overall survival (of both bare-root and tube-grown seedlings) across all sites and planting years totaled 51.1% based on the status of 5,036 sagebrush seedlings monitored across 50 transects. This is a slight decrease from the 55.5% survival observed after monitoring in July 2002 (Durham and Sackschewsky 2002) and the 71.2% overall survival noted in 2001 (Durham et al. 2001). Overall bare-root survival was 54.9% (n= 3415) and the overall tubling survival (both 10-in3 and 4-in3) totaled 43.1% (n= 1621) in 2004 (Figure 2.6). Overall survival by area is illustrated in Figure 2.7. Overall survival by seedling type and area is illustrated in Figure 2.8.
0%
10%
20%
30%
40%
50%
60%
70%
80%
90%
100%
Bare Roots Tublings
Surv
ival
2000 2001 2002 2004
Figure 2.6 Overall survival by plant type and year
2.14
0%
10%
20%
30%
40%
50%
60%
70%
80%
90%
100%
111 Road 98-Burn Cold Creek Iowa Flats
Surv
ival
2000 2001 2002 2004
Figure 2.7 Overall survival by planting area
0%
10%
20%
30%
40%
50%
60%
70%
80%
90%
100%
Bare Roots Tublings Bare Roots Tublings Bare Roots Bare Roots
111 Road 98-Burn Cold Creek Iowa Flats
Surv
ival
2000 2001 2002 2004
Figure 2.8 Overall survival across planting areas and plant types
2.5.1 98-Burn Area
Overall survival at the 98 Burn Area, across years, seedling types, and planting locations averaged 45.6% (n=2552 plants) in 2004, compared to 47.5% in 2002 and 61.9% in 2001. There were significant
2.15
differences in overall survival at the three planting locations (χ2(2 df) =191, p<<0.0001). The Undisturbed site had the highest overall survival at 59.8% (n=1008) while the disturbed site had the lowest survival at 21.0% (n=423). The Coppice Dune site was intermediate at 42.1% (n=1121).
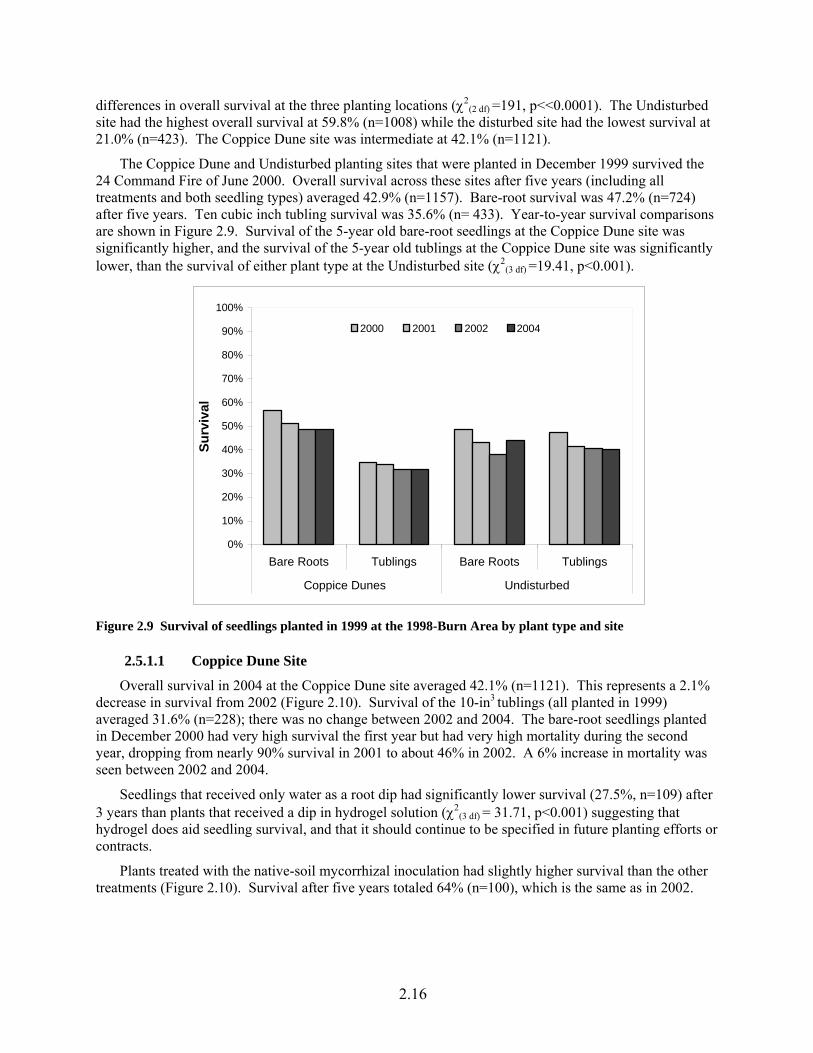
The Coppice Dune and Undisturbed planting sites that were planted in December 1999 survived the 24 Command Fire of June 2000. Overall survival across these sites after five years (including all treatments and both seedling types) averaged 42.9% (n=1157). Bare-root survival was 47.2% (n=724) after five years. Ten cubic inch tubling survival was 35.6% (n= 433). Year-to-year survival comparisons are shown in Figure 2.9. Survival of the 5-year old bare-root seedlings at the Coppice Dune site was significantly higher, and the survival of the 5-year old tublings at the Coppice Dune site was significantly lower, than the survival of either plant type at the Undisturbed site (χ2(3 df) =19.41, p<0.001).
0%
10%
20%
30%
40%
50%
60%
70%
80%
90%
100%
Bare Roots Tublings Bare Roots Tublings
Coppice Dunes Undisturbed
Surv
ival
2000 2001 2002 2004
Figure 2.9 Survival of seedlings planted in 1999 at the 1998-Burn Area by plant type and site
2.5.1.1 Coppice Dune Site
Overall survival in 2004 at the Coppice Dune site averaged 42.1% (n=1121). This represents a 2.1% decrease in survival from 2002 (Figure 2.10). Survival of the 10-in3 tublings (all planted in 1999) averaged 31.6% (n=228); there was no change between 2002 and 2004. The bare-root seedlings planted in December 2000 had very high survival the first year but had very high mortality during the second year, dropping from nearly 90% survival in 2001 to about 46% in 2002. A 6% increase in mortality was seen between 2002 and 2004.
Seedlings that received only water as a root dip had significantly lower survival (27.5%, n=109) after 3 years than plants that received a dip in hydrogel solution (χ2(3 df) = 31.71, p<0.001) suggesting that hydrogel does aid seedling survival, and that it should continue to be specified in future planting efforts or contracts.
Plants treated with the native-soil mycorrhizal inoculation had slightly higher survival than the other treatments (Figure 2.10). Survival after five years totaled 64% (n=100), which is the same as in 2002.
2.16
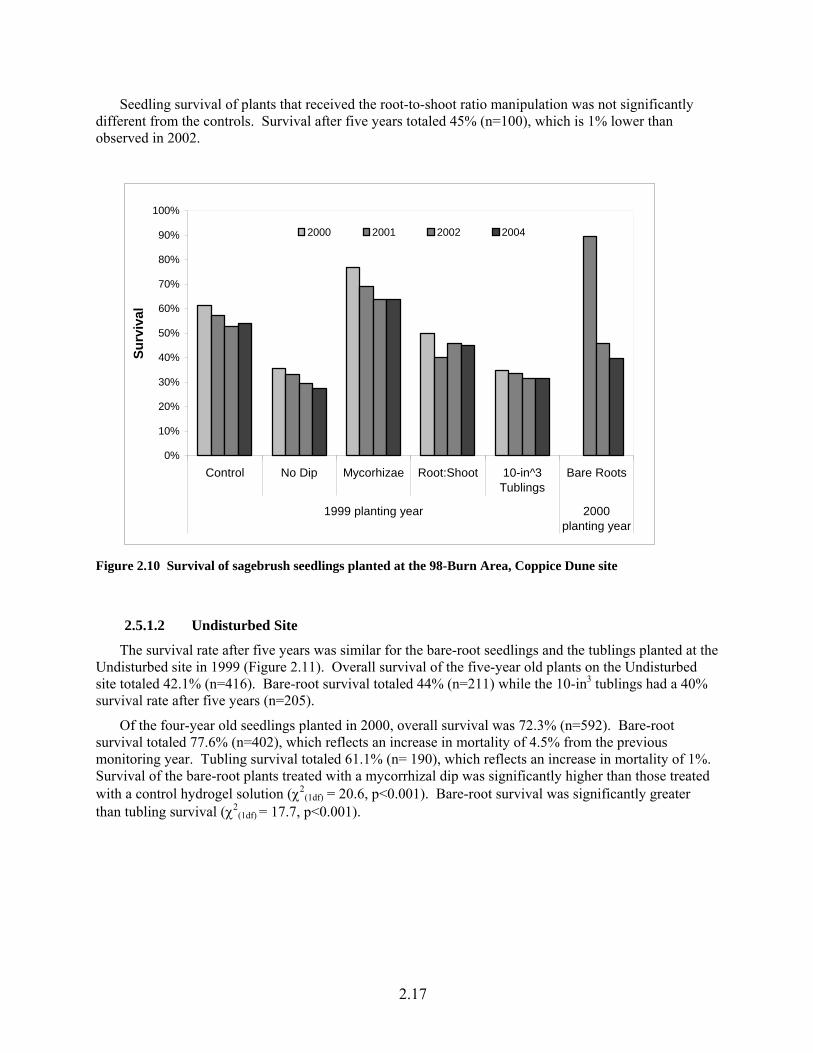
Seedling survival of plants that received the root-to-shoot ratio manipulation was not significantly different from the controls. Survival after five years totaled 45% (n=100), which is 1% lower than observed in 2002.
0%
10%
20%
30%
40%
50%
60%
70%
80%
90%
100%
Control No Dip Mycorhizae Root:Shoot 10-in^3Tublings
Bare Roots
1999 planting year 2000planting year
Surv
ival
2000 2001 2002 2004
Figure 2.10 Survival of sagebrush seedlings planted at the 98-Burn Area, Coppice Dune site
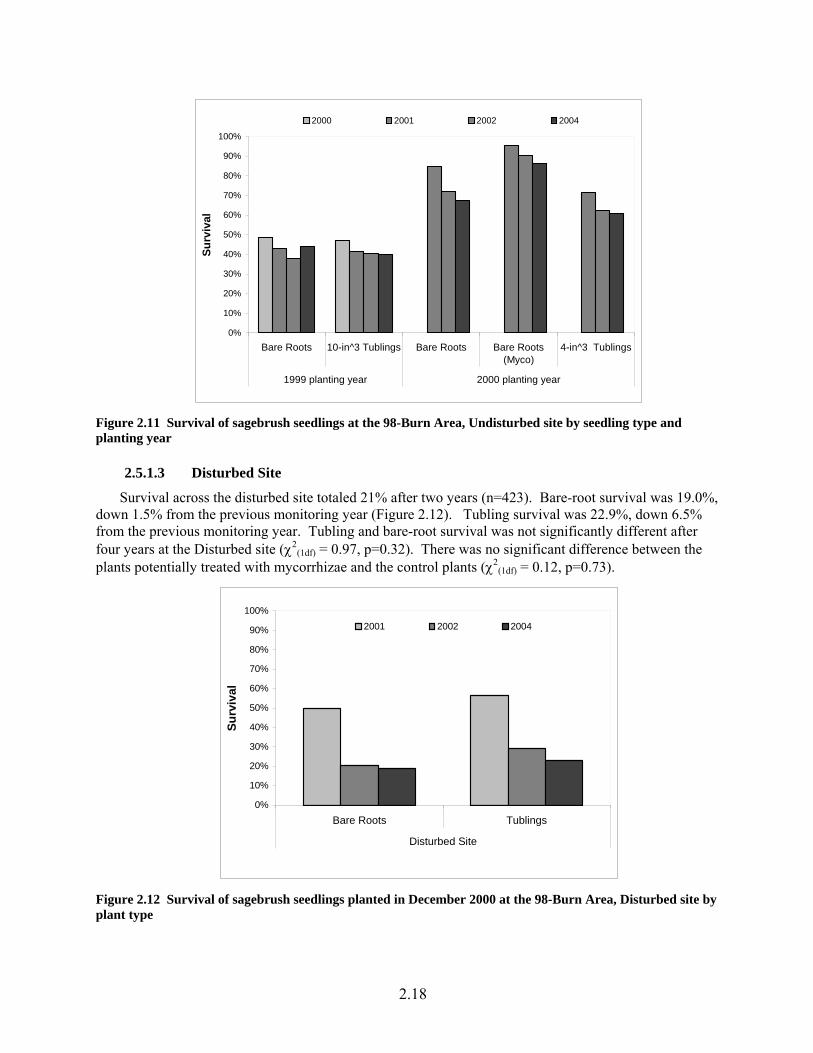
2.5.1.2 Undisturbed Site
The survival rate after five years was similar for the bare-root seedlings and the tublings planted at the Undisturbed site in 1999 (Figure 2.11). Overall survival of the five-year old plants on the Undisturbed site totaled 42.1% (n=416). Bare-root survival totaled 44% (n=211) while the 10-in3 tublings had a 40% survival rate after five years (n=205).
Of the four-year old seedlings planted in 2000, overall survival was 72.3% (n=592). Bare-root survival totaled 77.6% (n=402), which reflects an increase in mortality of 4.5% from the previous monitoring year. Tubling survival totaled 61.1% (n= 190), which reflects an increase in mortality of 1%. Survival of the bare-root plants treated with a mycorrhizal dip was significantly higher than those treated with a control hydrogel solution (χ2(1df) = 20.6, p<0.001). Bare-root survival was significantly greater than tubling survival (χ2(1df) = 17.7, p<0.001).
2.17
0%
10%
20%
30%
40%
50%
60%
70%
80%
90%
100%
Bare Roots 10-in^3 Tublings Bare Roots Bare Roots(Myco)
4-in^3 Tublings
1999 planting year 2000 planting year
Surv
ival
2000 2001 2002 2004
Figure 2.11 Survival of sagebrush seedlings at the 98-Burn Area, Undisturbed site by seedling type and planting year
2.5.1.3 Disturbed Site
Survival across the disturbed site totaled 21% after two years (n=423). Bare-root survival was 19.0%, down 1.5% from the previous monitoring year (Figure 2.12). Tubling survival was 22.9%, down 6.5% from the previous monitoring year. Tubling and bare-root survival was not significantly different after four years at the Disturbed site (χ2(1df) = 0.97, p=0.32). There was no significant difference between the plants potentially treated with mycorrhizae and the control plants (χ2(1df) = 0.12, p=0.73).
0%
10%
20%
30%
40%
50%
60%
70%
80%
90%
100%
Bare Roots Tublings
Disturbed Site
Surv
ival
2001 2002 2004
2.18
Figure 2.12 Survival of sagebrush seedlings planted in December 2000 at the 98-Burn Area, Disturbed site by plant type
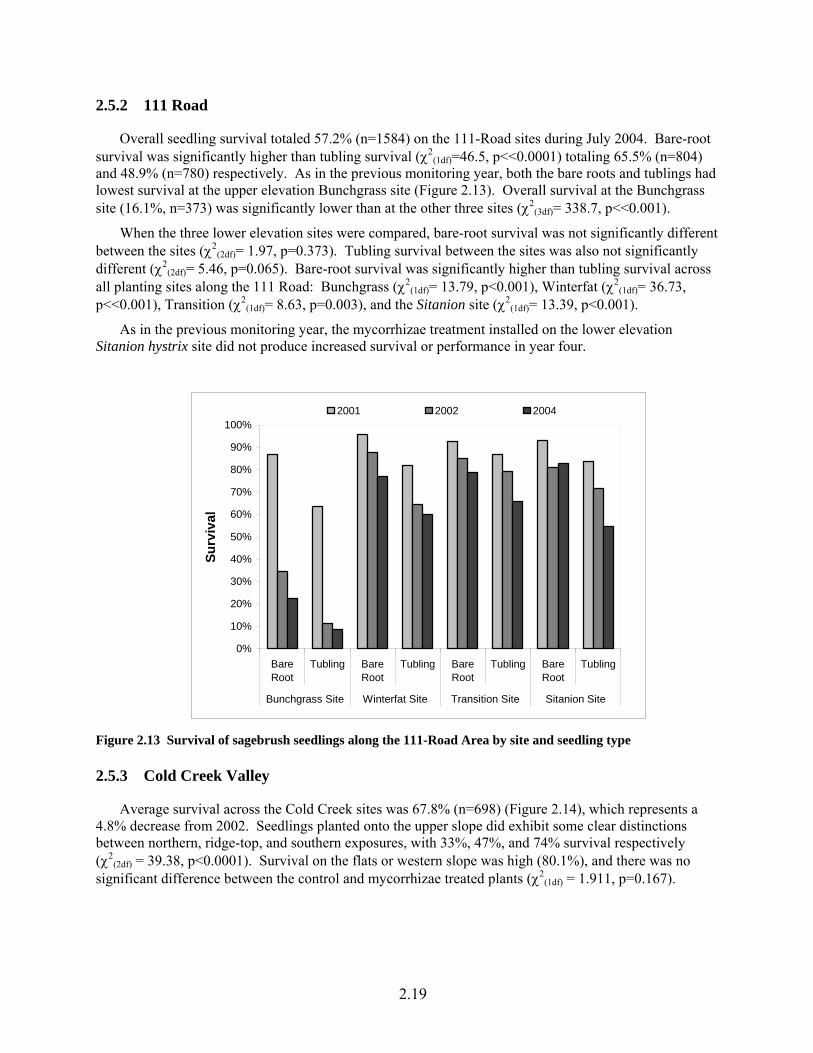
2.5.2 111 Road
Overall seedling survival totaled 57.2% (n=1584) on the 111-Road sites during July 2004. Bare-root survival was significantly higher than tubling survival (χ2(1df)=46.5, p<<0.0001) totaling 65.5% (n=804) and 48.9% (n=780) respectively. As in the previous monitoring year, both the bare roots and tublings had lowest survival at the upper elevation Bunchgrass site (Figure 2.13). Overall survival at the Bunchgrass site (16.1%, n=373) was significantly lower than at the other three sites (χ2(3df)= 338.7, p<<0.001).
When the three lower elevation sites were compared, bare-root survival was not significantly different between the sites (χ2(2df)= 1.97, p=0.373). Tubling survival between the sites was also not significantly different (χ2(2df)= 5.46, p=0.065). Bare-root survival was significantly higher than tubling survival across all planting sites along the 111 Road: Bunchgrass (χ2(1df)= 13.79, p<0.001), Winterfat (χ2(1df)= 36.73, p<<0.001), Transition (χ2(1df)= 8.63, p=0.003), and the Sitanion site (χ2(1df)= 13.39, p<0.001).
As in the previous monitoring year, the mycorrhizae treatment installed on the lower elevation Sitanion hystrix site did not produce increased survival or performance in year four.
0%
10%
20%
30%
40%
50%
60%
70%
80%
90%
100%
BareRoot
Tubling BareRoot
Tubling BareRoot
Tubling BareRoot
Tubling
Bunchgrass Site Winterfat Site Transition Site Sitanion Site
Surv
ival
2001 2002 2004
Figure 2.13 Survival of sagebrush seedlings along the 111-Road Area by site and seedling type
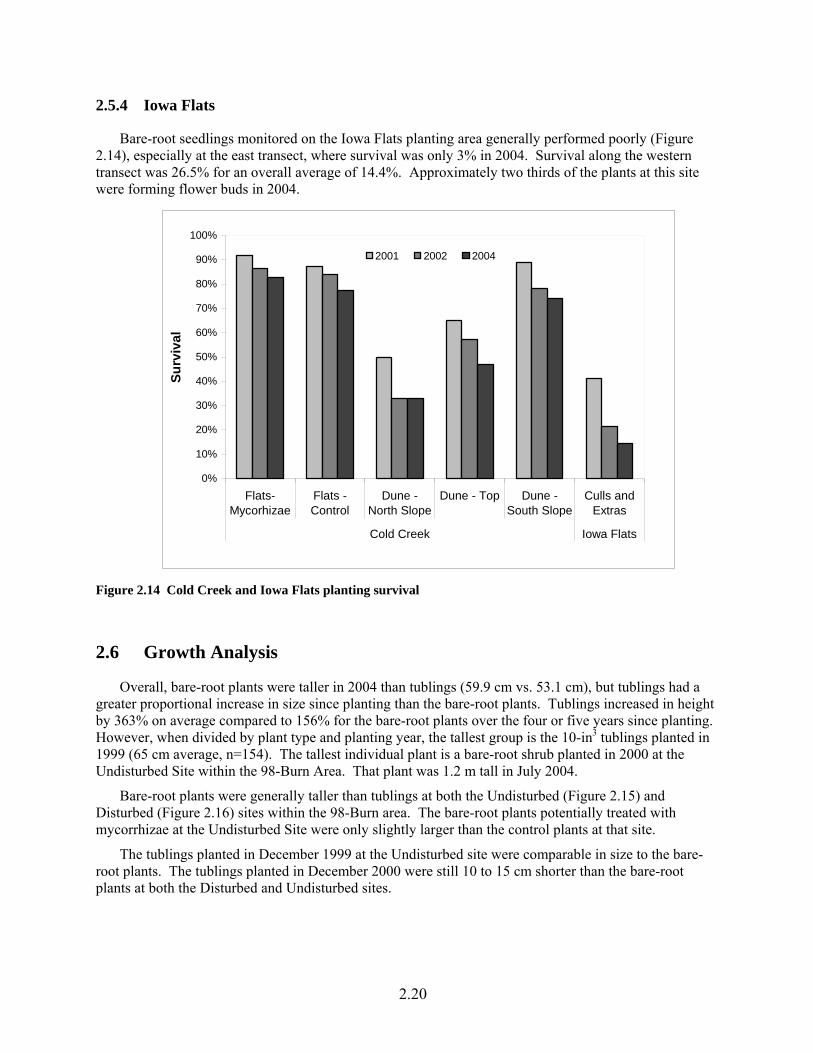
2.5.3 Cold Creek Valley
Average survival across the Cold Creek sites was 67.8% (n=698) (Figure 2.14), which represents a 4.8% decrease from 2002. Seedlings planted onto the upper slope did exhibit some clear distinctions between northern, ridge-top, and southern exposures, with 33%, 47%, and 74% survival respectively (χ2(2df) = 39.38, p<0.0001). Survival on the flats or western slope was high (80.1%), and there was no significant difference between the control and mycorrhizae treated plants (χ2(1df) = 1.911, p=0.167).
2.19
2.5.4 Iowa Flats
Bare-root seedlings monitored on the Iowa Flats planting area generally performed poorly (Figure 2.14), especially at the east transect, where survival was only 3% in 2004. Survival along the western transect was 26.5% for an overall average of 14.4%. Approximately two thirds of the plants at this site were forming flower buds in 2004.
0%
10%
20%
30%
40%
50%
60%
70%
80%
90%
100%
Flats-Mycorhizae
Flats -Control
Dune -North Slope
Dune - Top Dune -South Slope
Culls andExtras
Cold Creek Iowa Flats
Surv
ival
2001 2002 2004
Figure 2.14 Cold Creek and Iowa Flats planting survival
2.6 Growth Analysis
Overall, bare-root plants were taller in 2004 than tublings (59.9 cm vs. 53.1 cm), but tublings had a greater proportional increase in size since planting than the bare-root plants. Tublings increased in height by 363% on average compared to 156% for the bare-root plants over the four or five years since planting. However, when divided by plant type and planting year, the tallest group is the 10-in3 tublings planted in 1999 (65 cm average, n=154). The tallest individual plant is a bare-root shrub planted in 2000 at the Undisturbed Site within the 98-Burn Area. That plant was 1.2 m tall in July 2004.
Bare-root plants were generally taller than tublings at both the Undisturbed (Figure 2.15) and Disturbed (Figure 2.16) sites within the 98-Burn area. The bare-root plants potentially treated with mycorrhizae at the Undisturbed Site were only slightly larger than the control plants at that site.
The tublings planted in December 1999 at the Undisturbed site were comparable in size to the bare-root plants. The tublings planted in December 2000 were still 10 to 15 cm shorter than the bare-root plants at both the Disturbed and Undisturbed sites.
2.20
0
10
20
30
40
50
60
70
80
Bare Roots Tublings 10-in^3
Bare Roots Bare Roots(mycorhizae)
Tublings 4-in^3
1999 planting year 2000 planting year
Hei
ght (
cm)
1999 2000 2001 2002 2004
Of the seedlings planted on the Coppice Dune site in December 1999, tublings were comparable or slightly taller than the bare-root plants after 5 years (Figure 2.17). By July 2004, the bare-root seedlings planted in December 2000 were similar in height to those planted in December 2001.
Figure 2.15 Height of sagebrush seedlings at the 98-Burn Area, Undisturbed planting site
0
10
20
30
40
50
60
70
Bare Roots Tublings
Hei
ght (
cm)
2000 2001 2002 2004
Figure 2.16 Height of sagebrush seedlings at the 98-Burn Area, Disturbed planting site
2.21
0
10
20
30
40
50
60
70
80
Bare Roots Tublings 10-in^3
Bare Roots Bare Roots(mycorhizae)
Tublings 4-in^3
1999 planting year 2000 planting year
Hei
ght (
cm)
1999 2000 2001 2002 2004
Figure 2.17 Height of sagebrush seedlings planted at the 98-Burn Area, Coppice Dune planting site
The tallest plants within the 111-Road sites were the bare-root plants at the Winterfat site, while the shortest were the tublings at the Bunchgrass site (Figure 2.18). At all of the sites, the bare-root plants were between 5 and 20 cm taller on average than the tublings. Overall, growth at the Bunchgrass site was significantly less than at the other three sites along the 111-Road planting area.
0
10
20
30
40
50
60
70
80
BareRoot
Tubling BareRoot
Tubling BareRoot
Tubling BareRoot
Tubling
Bunchgrass site Winterfat site Transition site Sitanion site
Hei
ght (
cm)
2000 2001 2002 2004
Figure 2.18 Height of sagebrush seedlings along the 111-Road Area
2.22
At the Cold Creek sites, seedlings planted on the flats or west slope were taller than those planted on any aspect of the hill site (Figure 2.19). The mycorrhizae-treated plants were slightly taller than the control plants on the flats. The surviving bare-root plants at the Iowa Flats site were similar in height to the bare-root plants at the Bunchgrass site along the 111-Road planting area.
0
10
20
30
40
50
60
70
Flats-Control
Flats -mycorhizae
North Slope Hill Top South Slope Culls andExtras
Cold Creek Iowa Flats
Hei
ght (
cm)
2000 2001 2002 2004
Figure 2.19 Height of sagebrush seedlings planted at the Cold Creek and Iowa Flats planting areas
2.7 Flowering
Slightly over four fifths of the surviving plants were developing flowering buds at the time they were monitored in 2004. Tublings were slightly more likely to be flowering than bare-root plants (χ2=7.68, p<0.01), and 5th-year plants were more likely to be flowering than 4th-year plants (χ2=20.51, p<0.001). Flowering data are summarized in Table 2.5. The percentage of plants blooming at the different planting sites and treatments is illustrated in Figures 2.20 through 2.23.
2.23
0%
10%
20%
30%
40%
50%
60%
70%
80%
90%
100%
Undisturbed site Undisturbed site Undisturbed site-Myco
% F
low
erin
g
Bare Root 2002 Bare Root 2004Tubling 2002 Tubling 2004
Table 2.5 Summary of flowering percentages in 2002 and 2004 for both plant types, planting years, and planting areas
2002 2004Planting Area111 Road 28.1 85.098-Burn 45.5 88.0Cold Creek 27.8 65.5Iowa Flats 0 70.0
Planting Year1999 74 89.52000 27 80.9
Plant TypeBare Roots 37.9 81.3Tublings 28.3 86.0
Total 35.2 82.6
Percent Flowering
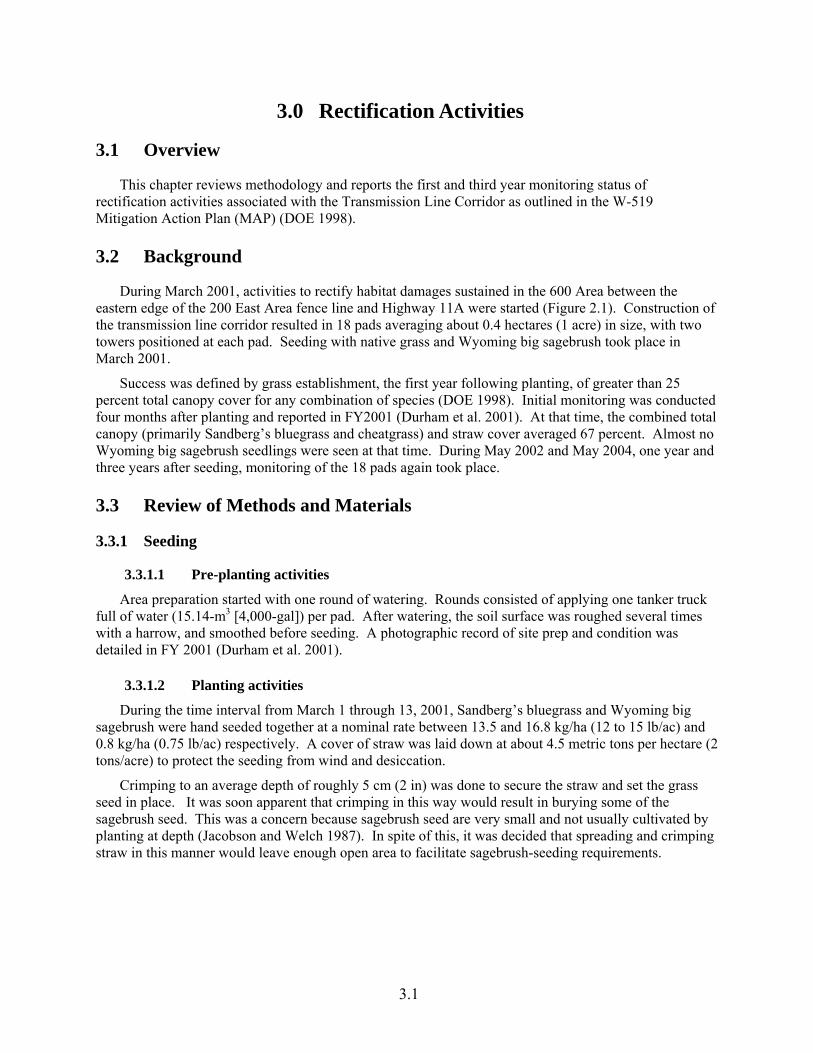
Figure 2.20 Percentage of plants blooming at the 98-Burn Area, Disturbed and Undisturbed planting sites
2.24
0%
10%
20%
30%
40%
50%
60%
70%
80%
90%
100%
Bare RootControl
Bare RootMyco
Bare RootNo Dip
Bare RootRoot:Shoot
10-in^3Tublings
Bare Roots
1999 planting year 2000planting
year
Flow
erin
g
2002
2004
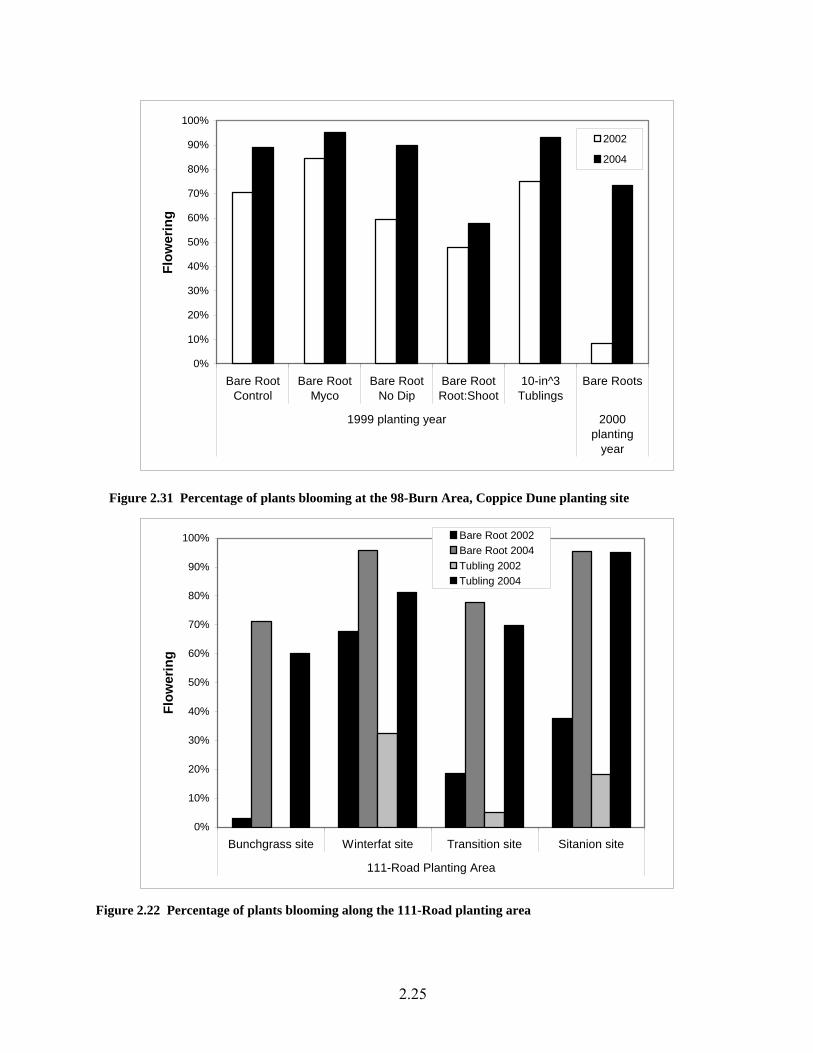
Figure 2.31 Percentage of plants blooming at the 98-Burn Area, Coppice Dune planting site
0%
10%
20%
30%
40%
50%
60%
70%
80%
90%
100%
Bunchgrass site Winterfat site Transition site Sitanion site
111-Road Planting Area
Flow
erin
g
Bare Root 2002Bare Root 2004Tubling 2002Tubling 2004
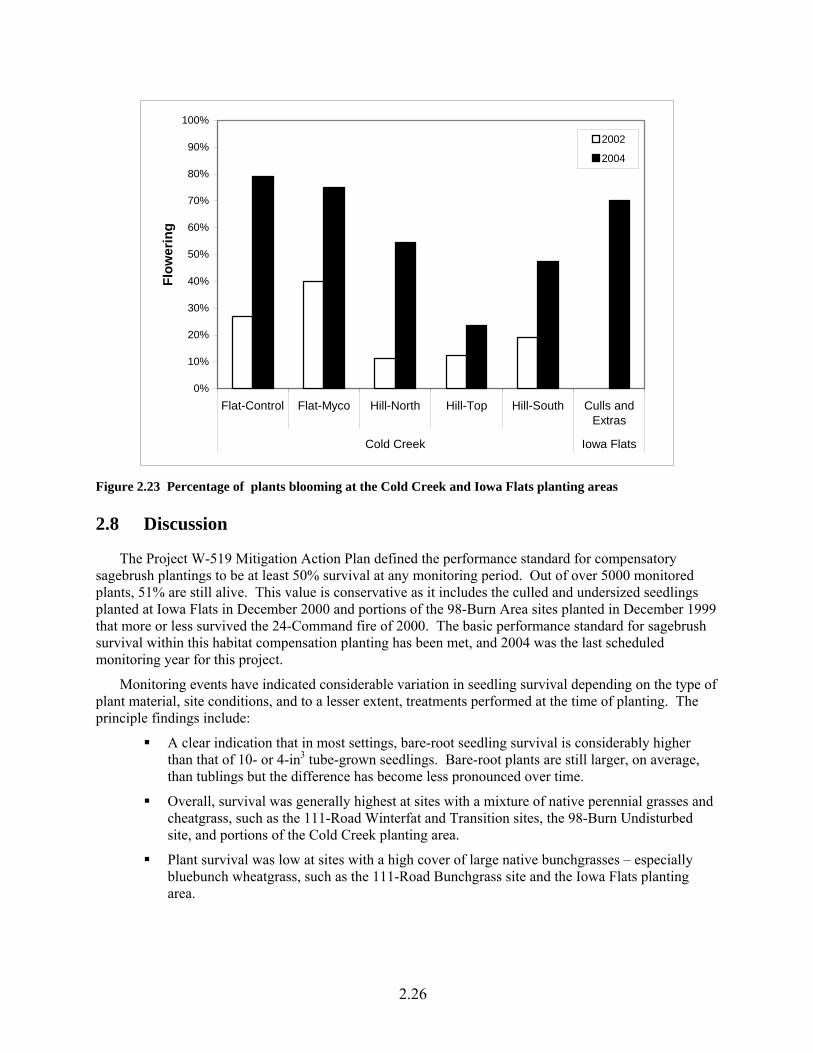
Figure 2.22 Percentage of plants blooming along the 111-Road planting area
2.25
0%
10%
20%
30%
40%
50%
60%
70%
80%
90%
100%
Flat-Control Flat-Myco Hill-North Hill-Top Hill-South Culls andExtras
Cold Creek Iowa Flats
Flow
erin
g
2002
2004
Figure 2.23 Percentage of plants blooming at the Cold Creek and Iowa Flats planting areas
2.8 Discussion
The Project W-519 Mitigation Action Plan defined the performance standard for compensatory sagebrush plantings to be at least 50% survival at any monitoring period. Out of over 5000 monitored plants, 51% are still alive. This value is conservative as it includes the culled and undersized seedlings planted at Iowa Flats in December 2000 and portions of the 98-Burn Area sites planted in December 1999 that more or less survived the 24-Command fire of 2000. The basic performance standard for sagebrush survival within this habitat compensation planting has been met, and 2004 was the last scheduled monitoring year for this project.
Monitoring events have indicated considerable variation in seedling survival depending on the type of plant material, site conditions, and to a lesser extent, treatments performed at the time of planting. The principle findings include:
A clear indication that in most settings, bare-root seedling survival is considerably higher than that of 10- or 4-in3 tube-grown seedlings. Bare-root plants are still larger, on average, than tublings but the difference has become less pronounced over time.
Overall, survival was generally highest at sites with a mixture of native perennial grasses and cheatgrass, such as the 111-Road Winterfat and Transition sites, the 98-Burn Undisturbed site, and portions of the Cold Creek planting area.
Plant survival was low at sites with a high cover of large native bunchgrasses – especially bluebunch wheatgrass, such as the 111-Road Bunchgrass site and the Iowa Flats planting area.
2.26

• Survival in more disturbed settings varied—It was relatively low at the 98-Burn Disturbed site but relatively high at the 111-Road Sitanion site.
• Mycorrhizal root treatments appeared to increase growth and survival at the Coppice Dune and 98-Burn Undisturbed sites, but appeared to have little effect at the 98-Burn Disturbed, 111-Road Sitanion, or Cold Creek sites.
• Use of a hydrogel dip at planting increases survival of bare-root plants compared to dipping in plain water.
• Reducing bare-root seedling leaf area via clipping after planting did not increase seedling survival.
• At the Lower Cold Creek planting area, seedlings planted on a south-aspect hillside had higher survival than seedlings planted on the hilltop or northern-aspects– although all of these survival rates were lower than survival down on the flats or western facing slope.
• Within four years, the majority of planted seedlings were flowering, and thus potentially contributing to sagebrush population growth and community development.
2.27

3.0 Rectification Activities
3.1 Overview
This chapter reviews methodology and reports the first and third year monitoring status of rectification activities associated with the Transmission Line Corridor as outlined in the W-519 Mitigation Action Plan (MAP) (DOE 1998).
3.2 Background
During March 2001, activities to rectify habitat damages sustained in the 600 Area between the eastern edge of the 200 East Area fence line and Highway 11A were started (Figure 2.1). Construction of the transmission line corridor resulted in 18 pads averaging about 0.4 hectares (1 acre) in size, with two towers positioned at each pad. Seeding with native grass and Wyoming big sagebrush took place in March 2001.
Success was defined by grass establishment, the first year following planting, of greater than 25 percent total canopy cover for any combination of species (DOE 1998). Initial monitoring was conducted four months after planting and reported in FY2001 (Durham et al. 2001). At that time, the combined total canopy (primarily Sandberg’s bluegrass and cheatgrass) and straw cover averaged 67 percent. Almost no Wyoming big sagebrush seedlings were seen at that time. During May 2002 and May 2004, one year and three years after seeding, monitoring of the 18 pads again took place.
3.3 Review of Methods and Materials
3.3.1 Seeding
3.3.1.1 Pre-planting activities
Area preparation started with one round of watering. Rounds consisted of applying one tanker truck full of water (15.14-m3 [4,000-gal]) per pad. After watering, the soil surface was roughed several times with a harrow, and smoothed before seeding. A photographic record of site prep and condition was detailed in FY 2001 (Durham et al. 2001).
3.3.1.2 Planting activities
During the time interval from March 1 through 13, 2001, Sandberg’s bluegrass and Wyoming big sagebrush were hand seeded together at a nominal rate between 13.5 and 16.8 kg/ha (12 to 15 lb/ac) and 0.8 kg/ha (0.75 lb/ac) respectively. A cover of straw was laid down at about 4.5 metric tons per hectare (2 tons/acre) to protect the seeding from wind and desiccation.
Crimping to an average depth of roughly 5 cm (2 in) was done to secure the straw and set the grass seed in place. It was soon apparent that crimping in this way would result in burying some of the sagebrush seed. This was a concern because sagebrush seed are very small and not usually cultivated by planting at depth (Jacobson and Welch 1987). In spite of this, it was decided that spreading and crimping straw in this manner would leave enough open area to facilitate sagebrush-seeding requirements.
3.1
Supplemental water began on March 18, 2001, applied as before at 15.14-m3 (4,000-gal), or about 0.4 cm (0.15 in) equivalent per pad every 7 to 10 days. Watering continued through May, which resulted in about 12 applications of water over a three-month period.
3.3.2 Monitoring
Eighteen permanent monitoring transects were established along the transmission corridor in July 2001. One 50-m line was installed at each pad. Line position was determined by the flip of a coin (for example, along the eastern side of the pad, or western side of the pad), and placement was based on available space. Line ends were marked with 2-1/2 foot, 1⁄2 -inch rebar that were marked with bright orange paint.
Following the cover class method described by Daubenmire (1959), ocular estimates of plant, straw and bare-ground covers were determined during May 2002. Sampling quadrates were 0.2-m x 0.5-m in size and were placed every 2 m along each transect (25 quadrates per line). For monitoring in year one, cover-type categories were established for cheatgrass, Sandberg’s bluegrass, Wyoming big sagebrush, straw, and bare ground. All other species were grouped into an “other” cover-type category.
During July 2001, it was observed that sagebrush seedlings were sparsely distributed across the revegetated area. The cover class method we employed to estimate soil surface protection and seeding success was not adequate to describe this distribution. For that reason, in May 2002, sagebrush density (seedlings/area) was measured by counting each sagebrush seedling found within 5 m of either side of the monitoring line. The resulting sample size was 0.05 ha (0.1 ac) at each of the 18 monitoring transects. These measurements were also conducted in May 2004.
3.4 Results
Combined total canopy cover (Sandberg’s bluegrass, cheatgrass, and “other”) across the 18 monitoring transects averaged 35.6% in 2004 (down from 47.1% in 2002). Bare-ground and litter cover averaged 21.8% and 45.5% respectively in 2004 (Figure 3.1). On average, Sandberg’s bluegrass comprised 27.7% (S.E.=2.3) of the species composition across the transects which is up from the 15% reported in FY2002. Cheatgrass comprised 37.4% (S.E.=2.3) of the species composition which is down from the 62% reported in FY2002 (Figure 3.2). Sandberg’s bluegrass was present on all transects, but demonstrated more variability within sites, with sampling frame frequency averaging 70.2% (S.E.=3.2). Cheatgrass on the other hand was found on all sites and in nearly 100% (99.3%, S.E.=0.5) of the sampling frames (Figure. 3.3).
Measurements of sagebrush density after three years suggest we might expect to see about 199 sagebrush seedlings per hectare (S.E.=57) (80.5 seedlings per acre [S.E.=23.0]) on average across the rectified transmission line corridor.
3.5 Discussion
Success criteria for the transmission line corridor site-of-disturbance rectification required a grass establishment with greater than 25 percent total canopy cover with 60% of the plant cover from planted species after four years (DOE 1998). This planting met the total canopy criterion but failed the criterion of 60% relative coverage of planted species. Although the performance standard was not met, the planting is not necessarily a failure. The proportion of cheatgrass is dropping and the proportion of Sandberg’s bluegrass is increasing, and is likely to continue.
3.2
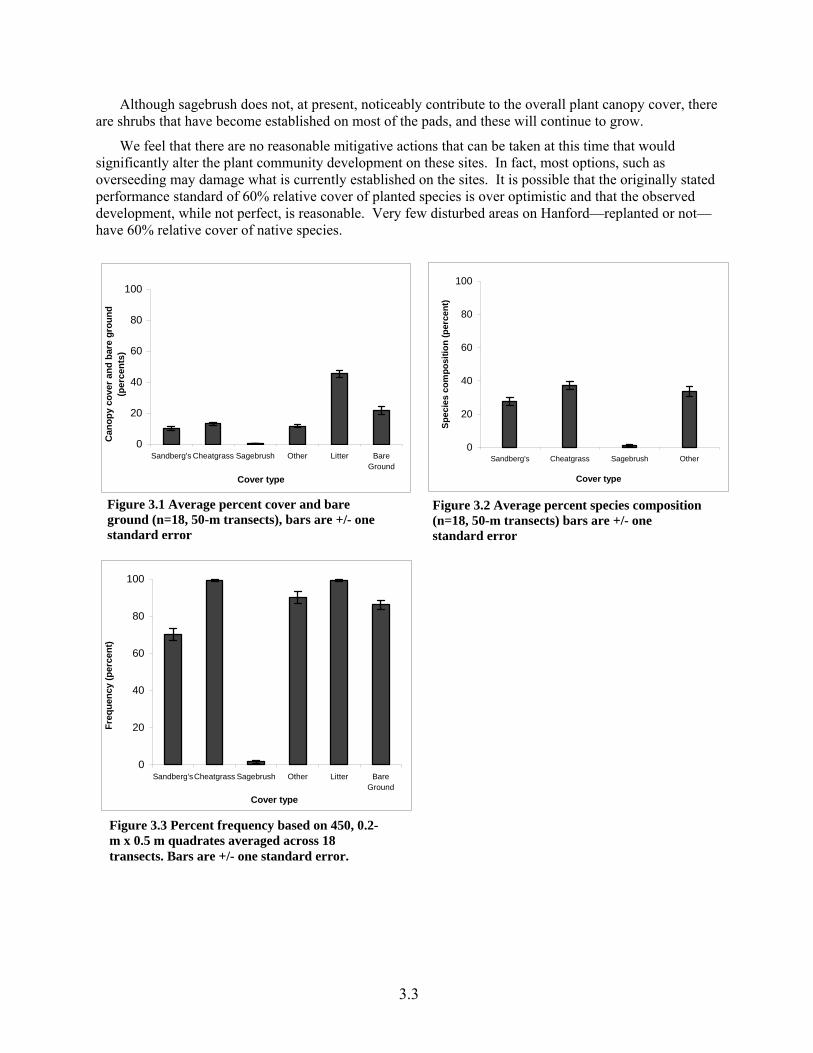
Although sagebrush does not, at present, noticeably contribute to the overall plant canopy cover, there are shrubs that have become established on most of the pads, and these will continue to grow.
We feel that there are no reasonable mitigative actions that can be taken at this time that would significantly alter the plant community development on these sites. In fact, most options, such as overseeding may damage what is currently established on the sites. It is possible that the originally stated performance standard of 60% relative cover of planted species is over optimistic and that the observed development, while not perfect, is reasonable. Very few disturbed areas on Hanford—replanted or not—have 60% relative cover of native species.
0
20
40
60
80
100
Sandberg's Cheatgrass Sagebrush Other Litter BareGround
Cover type
Can
opy
cove
r and
bar
e gr
ound
(p
erce
nts)
0
20
40
60
80
100
Sandberg's Cheatgrass Sagebrush Other
Cover type
Spec
ies
com
posi
tion
(per
cent
)
Figure 3.1 Average percent cover and bare ground (n=18, 50-m transects), bars are +/- one standard error
Figure 3.2 Average percent species composition (n=18, 50-m transects) bars are +/- one standard error
0
20
40
60
80
100
Sandberg'sCheatgrass Sagebrush Other Litter BareGround
Cover type
Freq
uenc
y (p
erce
nt)
Figure 3.3 Percent frequency based on 450, 0.2-m x 0.5 m quadrates averaged across 18 transects. Bars are +/- one standard error.
3.3

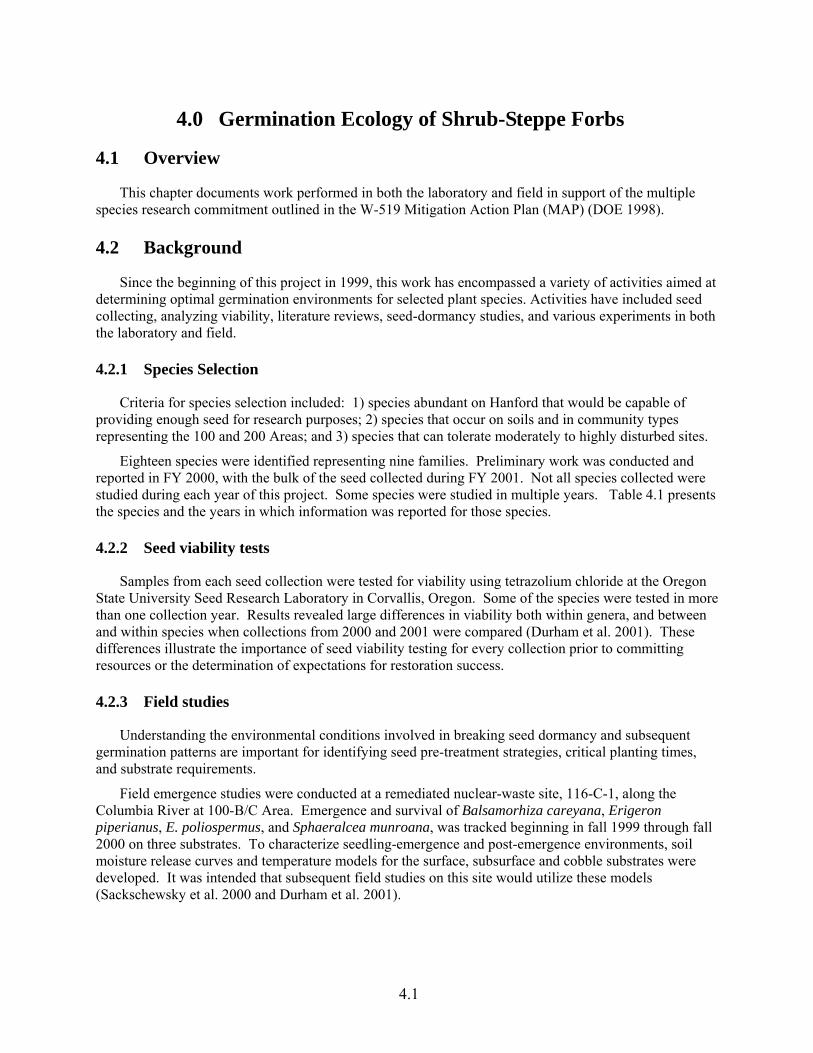
4.0 Germination Ecology of Shrub-Steppe Forbs
4.1 Overview
This chapter documents work performed in both the laboratory and field in support of the multiple species research commitment outlined in the W-519 Mitigation Action Plan (MAP) (DOE 1998).
4.2 Background
Since the beginning of this project in 1999, this work has encompassed a variety of activities aimed at determining optimal germination environments for selected plant species. Activities have included seed collecting, analyzing viability, literature reviews, seed-dormancy studies, and various experiments in both the laboratory and field.
4.2.1 Species Selection
Criteria for species selection included: 1) species abundant on Hanford that would be capable of providing enough seed for research purposes; 2) species that occur on soils and in community types representing the 100 and 200 Areas; and 3) species that can tolerate moderately to highly disturbed sites.
Eighteen species were identified representing nine families. Preliminary work was conducted and reported in FY 2000, with the bulk of the seed collected during FY 2001. Not all species collected were studied during each year of this project. Some species were studied in multiple years. Table 4.1 presents the species and the years in which information was reported for those species.
4.2.2 Seed viability tests
Samples from each seed collection were tested for viability using tetrazolium chloride at the Oregon State University Seed Research Laboratory in Corvallis, Oregon. Some of the species were tested in more than one collection year. Results revealed large differences in viability both within genera, and between and within species when collections from 2000 and 2001 were compared (Durham et al. 2001). These differences illustrate the importance of seed viability testing for every collection prior to committing resources or the determination of expectations for restoration success.
4.2.3 Field studies
Understanding the environmental conditions involved in breaking seed dormancy and subsequent germination patterns are important for identifying seed pre-treatment strategies, critical planting times, and substrate requirements.
Field emergence studies were conducted at a remediated nuclear-waste site, 116-C-1, along the Columbia River at 100-B/C Area. Emergence and survival of Balsamorhiza careyana, Erigeron piperianus, E. poliospermus, and Sphaeralcea munroana, was tracked beginning in fall 1999 through fall 2000 on three substrates. To characterize seedling-emergence and post-emergence environments, soil moisture release curves and temperature models for the surface, subsurface and cobble substrates were developed. It was intended that subsequent field studies on this site would utilize these models (Sackschewsky et al. 2000 and Durham et al. 2001).
4.1
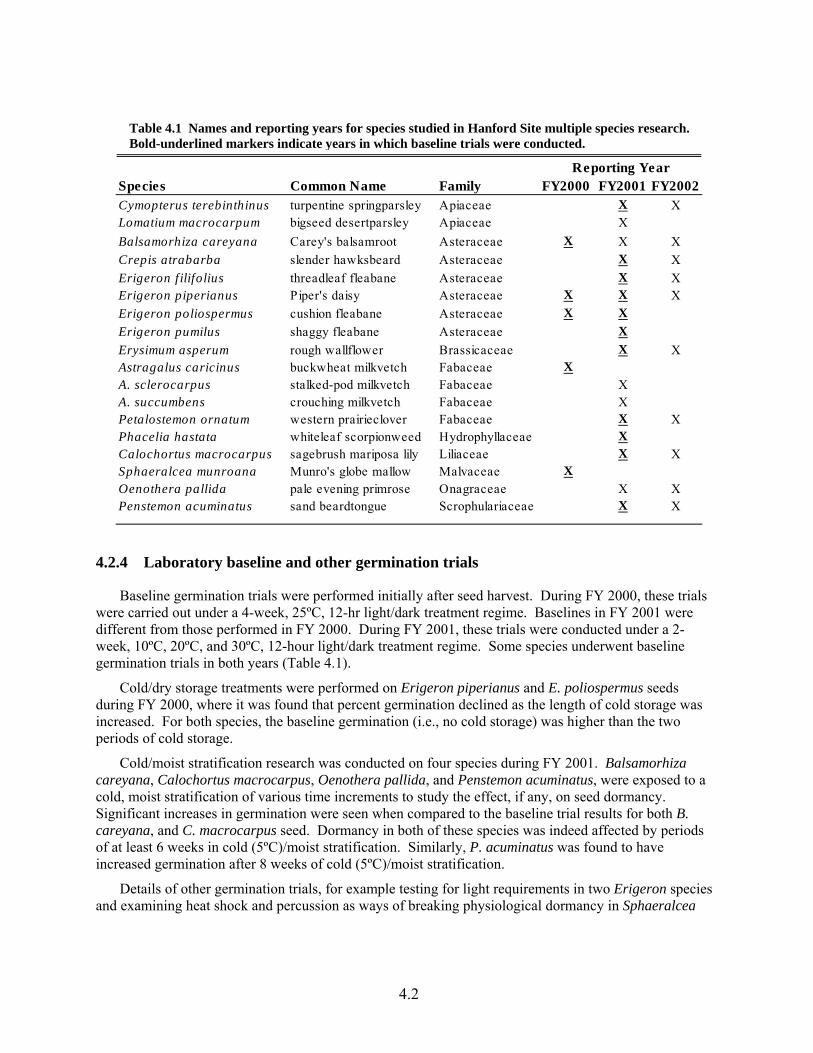
Species Common Name Family FY2000 FY2001 FY2002Cymopterus terebinthinus turpentine springparsley Apiaceae X XLomatium macrocarpum bigseed desertparsley Apiaceae XBalsamorhiza careyana Carey's balsamroot Asteraceae X X XCrepis atrabarba slender hawksbeard Asteraceae X XErigeron f ilifolius threadleaf fleabane Asteraceae X XErigeron piperianus Piper's daisy Asteraceae X X XErigeron poliospermus cushion fleabane Asteraceae X XErigeron pumilus shaggy fleabane Asteraceae XErysimum asperum rough wallflower Brassicaceae X XAstragalus caricinus buckwheat milkvetch Fabaceae XA. sclerocarpus stalked-pod milkvetch Fabaceae XA. succumbens crouching milkvetch Fabaceae XPetalostemon ornatum western prairieclover Fabaceae X XPhacelia hastata whiteleaf scorpionweed Hydrophyllaceae XCalochortus macrocarpus sagebrush mariposa lily Liliaceae X XSphaeralcea munroana Munro's globe mallow Malvaceae XOenothera pallida pale evening primrose Onagraceae X XPenstemon acuminatus sand beardtongue Scrophulariaceae X X
Reporting Year
Table 4.1 Names and reporting years for species studied in Hanford Site multiple species research. Bold-underlined markers indicate years in which baseline trials were conducted.
4.2.4 Laboratory baseline and other germination trials
Baseline germination trials were performed initially after seed harvest. During FY 2000, these trials were carried out under a 4-week, 25ºC, 12-hr light/dark treatment regime. Baselines in FY 2001 were different from those performed in FY 2000. During FY 2001, these trials were conducted under a 2-week, 10ºC, 20ºC, and 30ºC, 12-hour light/dark treatment regime. Some species underwent baseline germination trials in both years (Table 4.1).
Cold/dry storage treatments were performed on Erigeron piperianus and E. poliospermus seeds during FY 2000, where it was found that percent germination declined as the length of cold storage was increased. For both species, the baseline germination (i.e., no cold storage) was higher than the two periods of cold storage.
Cold/moist stratification research was conducted on four species during FY 2001. Balsamorhiza careyana, Calochortus macrocarpus, Oenothera pallida, and Penstemon acuminatus, were exposed to a cold, moist stratification of various time increments to study the effect, if any, on seed dormancy. Significant increases in germination were seen when compared to the baseline trial results for both B. careyana, and C. macrocarpus seed. Dormancy in both of these species was indeed affected by periods of at least 6 weeks in cold (5ºC)/moist stratification. Similarly, P. acuminatus was found to have increased germination after 8 weeks of cold (5ºC)/moist stratification.
Details of other germination trials, for example testing for light requirements in two Erigeron species and examining heat shock and percussion as ways of breaking physiological dormancy in Sphaeralcea
4.2
munroana and Astragalus caricinus, were reported in both FY 2000 and FY 2001. A significant treatment effect was found while studying S. munroana. Results of the heat shock treatment suggest that physiological dormancy is broken during periods of intense heat such as fire or high summer temperatures. Nevertheless, these results also suggested that heat shock was probably not the only natural means to break physical dormancy in this species (Sackschewsky et al. 2000, Durham et al. 2001).
4.2.5 FY-2002 field and laboratory research
Two types of germination research was conducted in FY 2002: 1) A seasonal field storage study (conducted in the laboratory after field storage) to determine the effects of summer, fall, and winter temperatures on the seed dormancy of 10 native forb species; and 2) a field emergence trial at 116-C-1 on nine species of native forbs.
4.3 Methods and Materials FY 2002
4.3.1 Field storage trial
The effects of field storage on seed dormancy was tested on nine species, Calochortus macrocarpus, Crepis atrabarba, Petalostemon ornatum, Penstemon acuminatus, Erysimum asperum, Erigeron filifolius, E. piperianus, E. poliospermus, and E. pumilus. Seed germination trials were conducted for each species after exposure to summer, fall, and winter temperatures and compared to the baseline germination trails conducted initially after harvest.
As with all of the germination ecology fieldwork performed for this project, the field storage trial was conducted at 116-C-1. On July 16, 2001, freshly harvested seed were put into seed tins. Seed tins, containing about 450 seeds each, were sealed with tape and placed into a rodent-proof wire cage that had been set down into the loamy sand. The tins were set down into the soil with only the tops exposed within the cage. One seed tin was harvested per species at the end of each season (September 26, December 19, and March 16).
After tin harvest, seeds were placed into the same treatment regime as the baseline germination trials conducted in FY 2001. That is, three replicates of 50 seeds, each exposed to temperature regimes of 10ºC, 20ºC, and 30ºC, under a 12-hour light/dark photoperiod. As before, a two-week germination trial was conducted.
4.3.2 Seedling emergence field trial
Seedling emergence was tracked for nine species: Balsamorhiza careyana, Crepis atrabarba, Cymopterus terebinthinus, Erigeron filifolius, E. pumilus, Erysimum asperum, Calochortus macrocarpus, Oenothera pallida, and Penstemon acuminatus. As before, this work was conducted at 116-C-1. The site was selected because of the two substrates present: the native gravel formation parent material and imported loamy sand. At this waste site, the topsoil was removed with only the Pasco gravel formation parent material remaining. A thin subsoil presently exists, consisting of sand mixed with the gravel and stones. In 1998, a layer of loamy sand from the area occupied by the Environmental Restoration Disposal Facility (ERDF) was applied to half of the waste site with a depth ranging from 5 centimeters to 1 meter (Weiss and Kemp 1998).
Three different substrate treatments were selected for the placement of seeds: the surface of the native cobble (designated as cobble), the surface of the ERDF loamy sand (surface), and a depth of 1.5 to
4.3
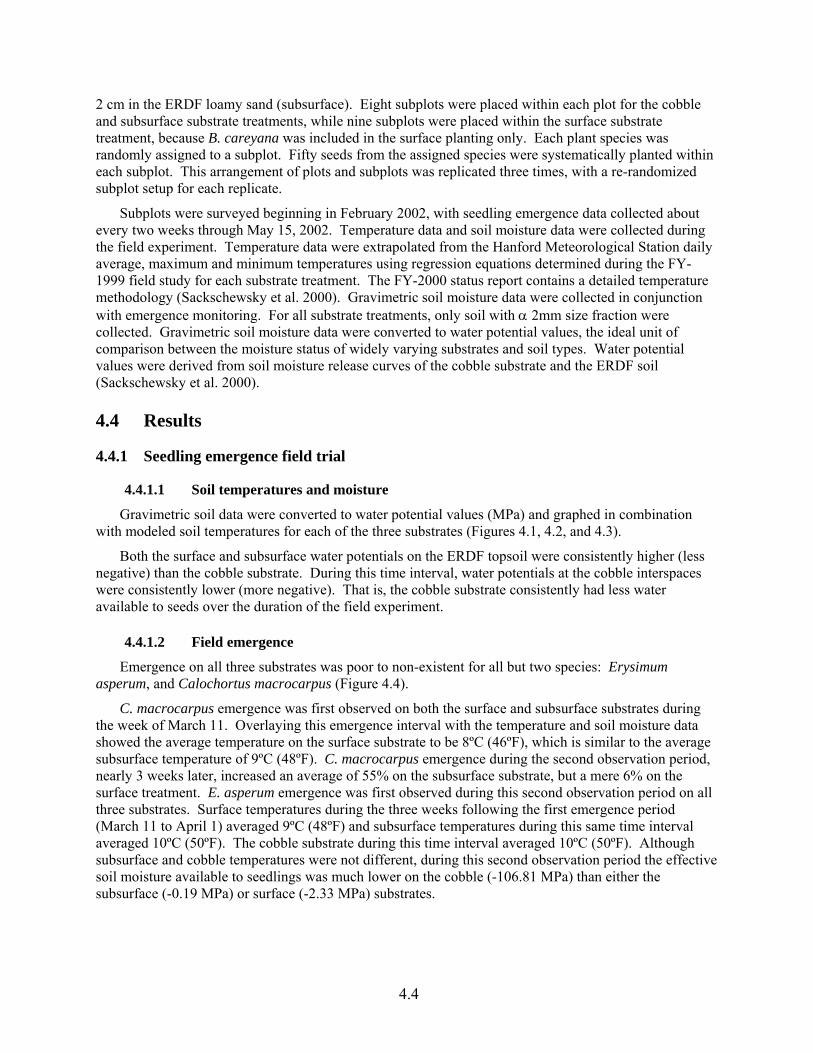
2 cm in the ERDF loamy sand (subsurface). Eight subplots were placed within each plot for the cobble and subsurface substrate treatments, while nine subplots were placed within the surface substrate treatment, because B. careyana was included in the surface planting only. Each plant species was randomly assigned to a subplot. Fifty seeds from the assigned species were systematically planted within each subplot. This arrangement of plots and subplots was replicated three times, with a re-randomized subplot setup for each replicate.
Subplots were surveyed beginning in February 2002, with seedling emergence data collected about every two weeks through May 15, 2002. Temperature data and soil moisture data were collected during the field experiment. Temperature data were extrapolated from the Hanford Meteorological Station daily average, maximum and minimum temperatures using regression equations determined during the FY-1999 field study for each substrate treatment. The FY-2000 status report contains a detailed temperature methodology (Sackschewsky et al. 2000). Gravimetric soil moisture data were collected in conjunction with emergence monitoring. For all substrate treatments, only soil with α 2mm size fraction were collected. Gravimetric soil moisture data were converted to water potential values, the ideal unit of comparison between the moisture status of widely varying substrates and soil types. Water potential values were derived from soil moisture release curves of the cobble substrate and the ERDF soil (Sackschewsky et al. 2000).
4.4 Results
4.4.1 Seedling emergence field trial
4.4.1.1 Soil temperatures and moisture
Gravimetric soil data were converted to water potential values (MPa) and graphed in combination with modeled soil temperatures for each of the three substrates (Figures 4.1, 4.2, and 4.3).
Both the surface and subsurface water potentials on the ERDF topsoil were consistently higher (less negative) than the cobble substrate. During this time interval, water potentials at the cobble interspaces were consistently lower (more negative). That is, the cobble substrate consistently had less water available to seeds over the duration of the field experiment.
4.4.1.2 Field emergence
Emergence on all three substrates was poor to non-existent for all but two species: Erysimum asperum, and Calochortus macrocarpus (Figure 4.4).
C. macrocarpus emergence was first observed on both the surface and subsurface substrates during the week of March 11. Overlaying this emergence interval with the temperature and soil moisture data showed the average temperature on the surface substrate to be 8ºC (46ºF), which is similar to the average subsurface temperature of 9ºC (48ºF). C. macrocarpus emergence during the second observation period, nearly 3 weeks later, increased an average of 55% on the subsurface substrate, but a mere 6% on the surface treatment. E. asperum emergence was first observed during this second observation period on all three substrates. Surface temperatures during the three weeks following the first emergence period (March 11 to April 1) averaged 9ºC (48ºF) and subsurface temperatures during this same time interval averaged 10ºC (50ºF). The cobble substrate during this time interval averaged 10ºC (50ºF). Although subsurface and cobble temperatures were not different, during this second observation period the effective soil moisture available to seedlings was much lower on the cobble (-106.81 MPa) than either the subsurface (-0.19 MPa) or surface (-2.33 MPa) substrates.
4.4
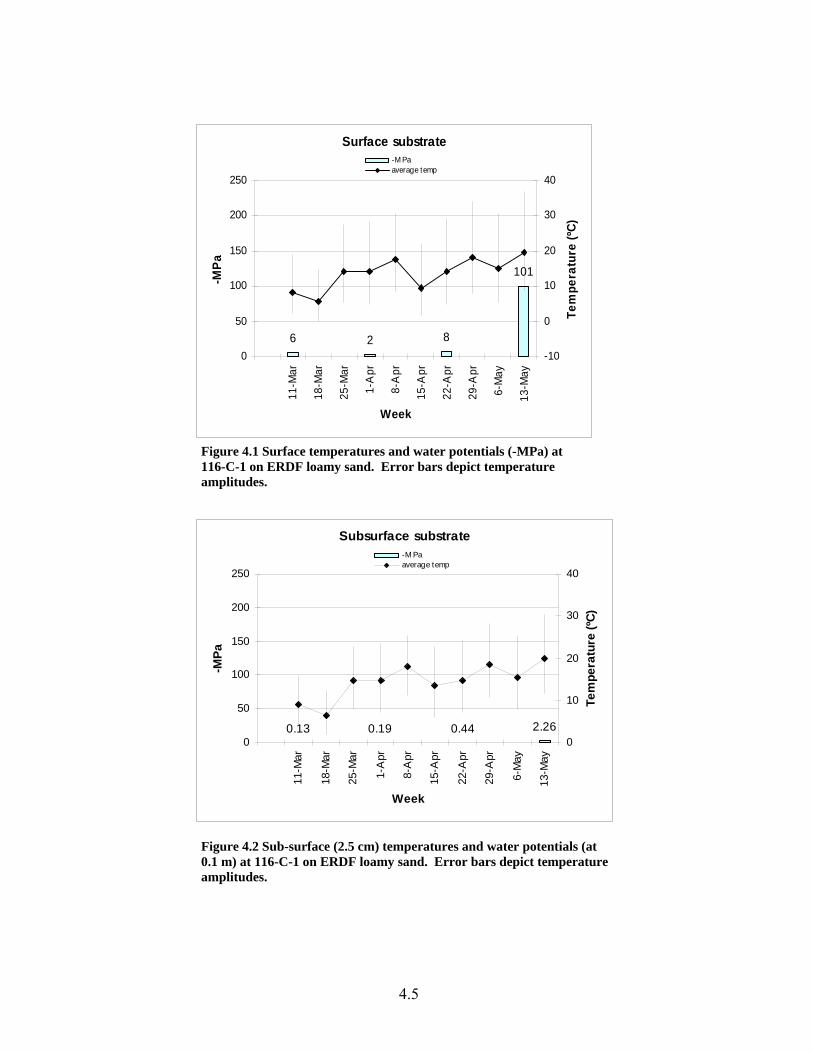
Surface substrate
6 2 8
101
0
50
100
150
200
250
11-M
ar
18-M
ar
25-M
ar
1-A
pr
8-A
pr
15-A
pr
22-A
pr
29-A
pr
6-M
ay
13-M
ay
Week
-MPa
-10
0
10
20
30
40
Tem
pera
ture
(ºC)
-M Paaverage temp
Figure 4.1 Surface temperatures and water potentials (-MPa) at 116-C-1 on ERDF loamy sand. Error bars depict temperature amplitudes.
Subsurface substrate
0.13 0.19 0.44 2.260
50
100
150
200
250
11-M
ar
18-M
ar
25-M
ar
1-A
pr
8-A
pr
15-A
pr
22-A
pr
29-A
pr
6-M
ay
13-M
ay
Week
-MPa
0
10
20
30
40Te
mpe
ratu
re (º
C)
-M Paaverage temp
Figure 4.2 Sub-surface (2.5 cm) temperatures and water potentials (at 0.1 m) at 116-C-1 on ERDF loamy sand. Error bars depict temperature amplitudes.
4.5
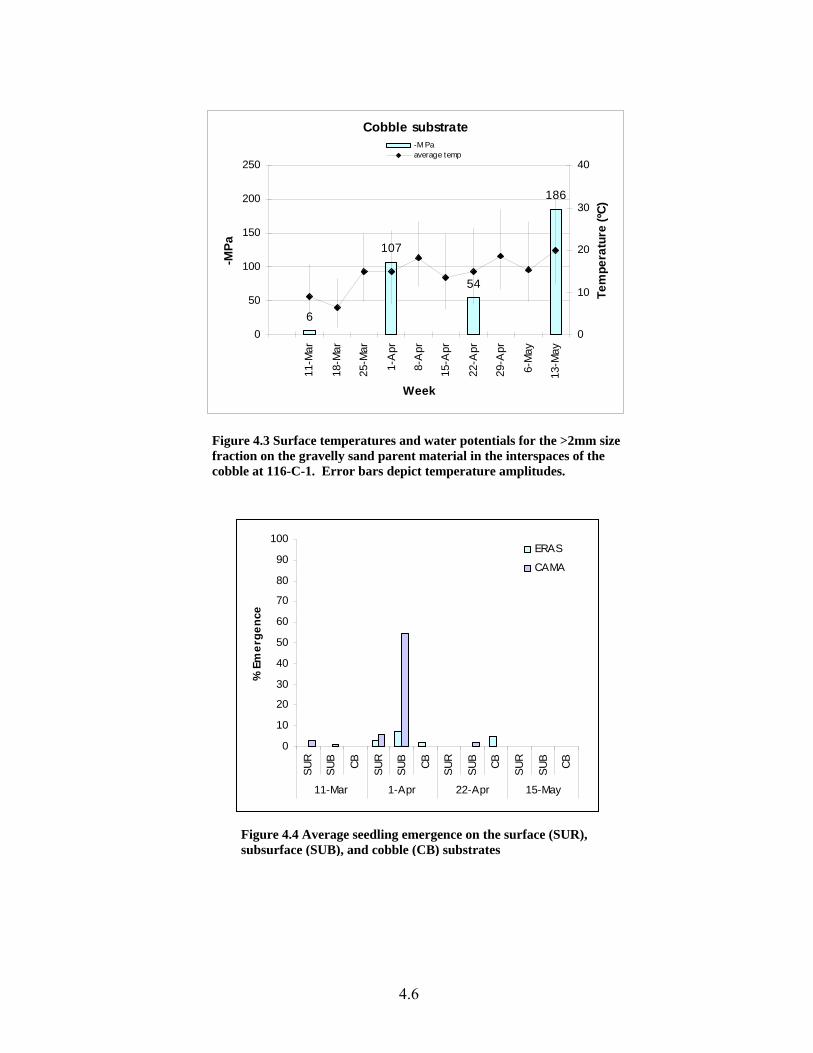
Cobble substrate
6
107
54
186
0
50
100
150
200
250
11-M
ar
18-M
ar
25-M
ar
1-A
pr
8-A
pr
15-A
pr
22-A
pr
29-A
pr
6-M
ay
13-M
ay
Week
-MPa
0
10
20
30
40
Tem
pera
ture
(ºC)
-M Paaverage temp
Figure 4.3 Surface temperatures and water potentials for the >2mm sfraction on the gravelly sand parent material in the interspaces of the cobble at 116-C-1. Error bars depict temperature amplitudes.
ize
0
10
20
30
40
50
60
70
80
90
100
SUR
SUB CB SUR
SUB CB SUR
SUB CB SUR
SUB CB
11-Mar 1-Apr 22-Apr 15-May
% E
mer
genc
e
ERAS
CAMA
Figure 4.4 Average seedling emergence on the surface (SUR), subsurface (SUB), and cobble (CB) substrates
4.6
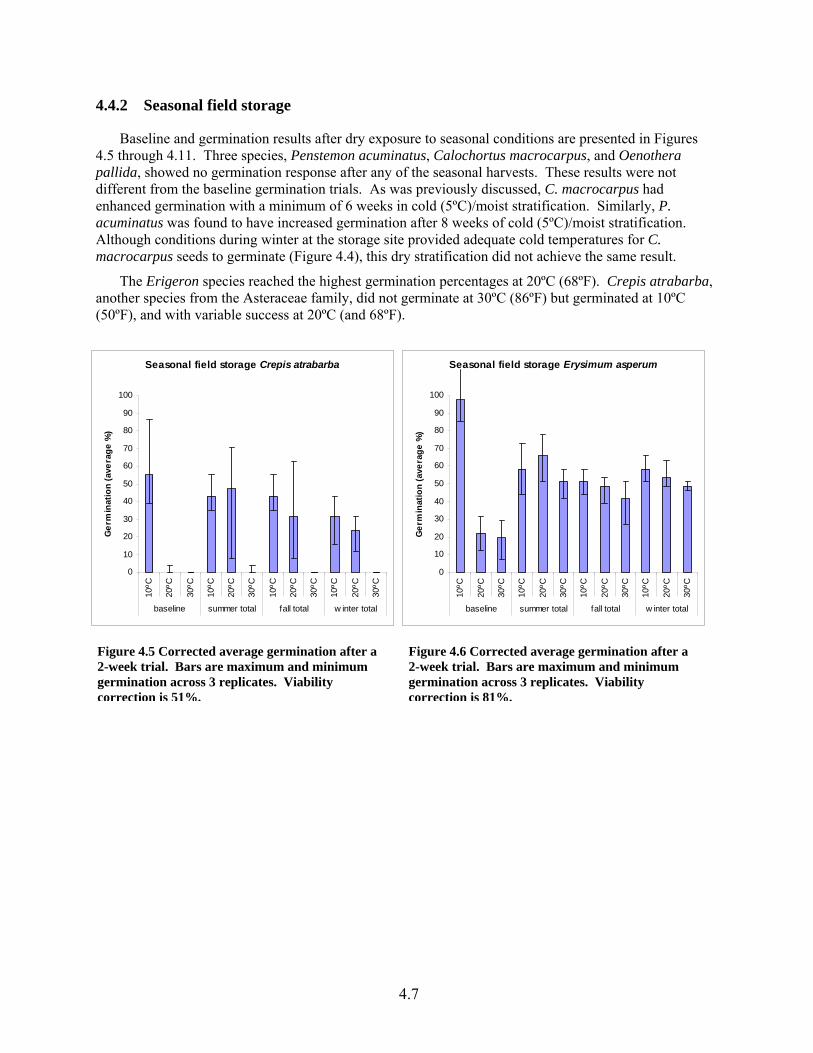
4.4.2 Seasonal field storage
Baseline and germination results after dry exposure to seasonal conditions are presented in Figures 4.5 through 4.11. Three species, Penstemon acuminatus, Calochortus macrocarpus, and Oenothera pallida, showed no germination response after any of the seasonal harvests. These results were not different from the baseline germination trials. As was previously discussed, C. macrocarpus had enhanced germination with a minimum of 6 weeks in cold (5ºC)/moist stratification. Similarly, P. acuminatus was found to have increased germination after 8 weeks of cold (5ºC)/moist stratification. Although conditions during winter at the storage site provided adequate cold temperatures for C. macrocarpus seeds to germinate (Figure 4.4), this dry stratification did not achieve the same result.
The Erigeron species reached the highest germination percentages at 20ºC (68ºF). Crepis atrabarba, another species from the Asteraceae family, did not germinate at 30ºC (86ºF) but germinated at 10ºC (50ºF), and with variable success at 20ºC (and 68ºF).
Seasonal field storage Crepis atrabarba
0
10
20
30
40
50
60
70
80
90
100
10ºC
20ºC
30ºC
10ºC
20ºC
30ºC
10ºC
20ºC
30ºC
10ºC
20ºC
30ºC
baseline summer total fall total w inter total
Ger
min
atio
n (a
vera
ge %
)
Seasonal field storage Erysimum asperum
0
10
20
30
40
50
60
70
80
90
100
10ºC
20ºC
30ºC
10ºC
20ºC
30ºC
10ºC
20ºC
30ºC
10ºC
20ºC
30ºC
baseline summer total fall total w inter total
Ger
min
atio
n (a
vera
ge %
)
Figure 4.5 Corrected average germination after a 2-week trial. Bars are maximum and minimum germination across 3 replicates. Viability correction is 51%.
Figure 4.6 Corrected average germination after a 2-week trial. Bars are maximum and minimum germination across 3 replicates. Viability correction is 81%.
4.7
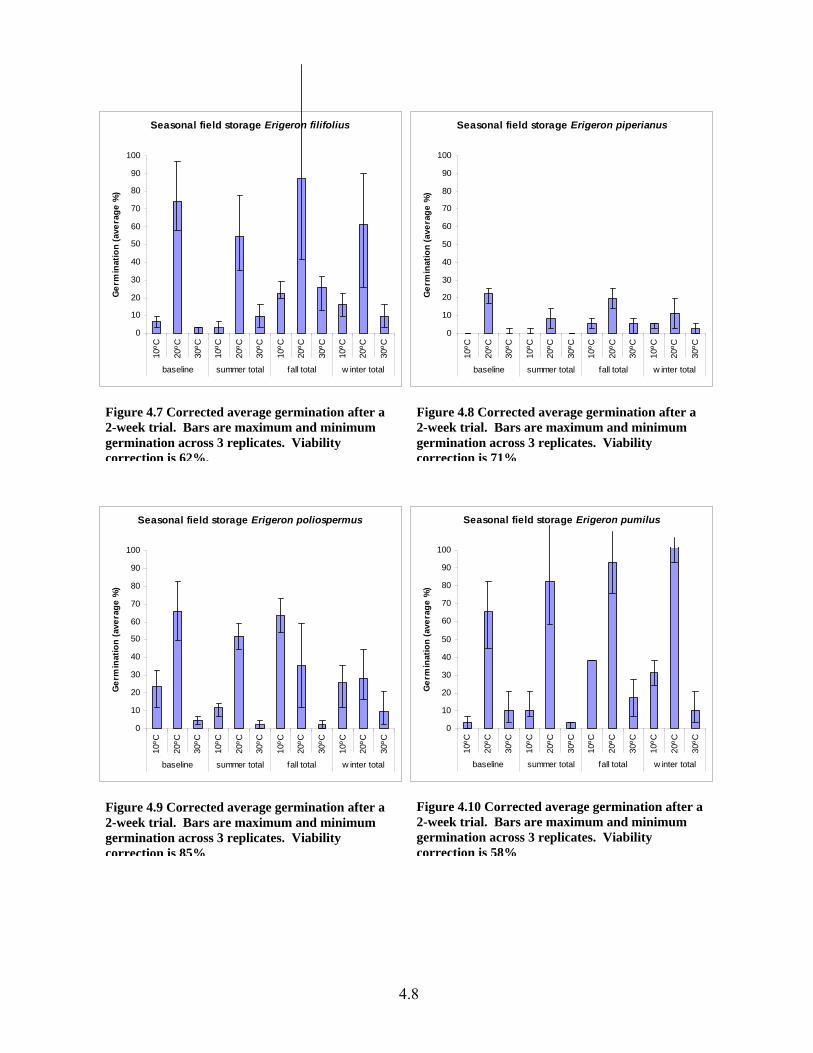
Seasonal field storage Erigeron filifolius
0
10
20
30
40
50
60
70
80
90
10010
ºC
20ºC
30ºC
10ºC
20ºC
30ºC
10ºC
20ºC
30ºC
10ºC
20ºC
30ºC
baseline summer total fall total w inter total
Ger
min
atio
n (a
vera
ge %
)Seasonal field storage Erigeron piperianus
0
10
20
30
40
50
60
70
80
90
100
10ºC
20ºC
30ºC
10ºC
20ºC
30ºC
10ºC
20ºC
30ºC
10ºC
20ºC
30ºC
baseline summer total fall total w inter total
Ger
min
atio
n (a
vera
ge %
)Figure 4.7 Corrected average germination after a 2-week trial. Bars are maximum and minimum germination across 3 replicates. Viability correction is 62%.
Figure 4.8 Corrected average germination after a 2-week trial. Bars are maximum and minimum germination across 3 replicates. Viability correction is 71%
Seasonal field storage Erigeron poliospermus
0
10
20
30
40
50
60
70
80
90
100
10ºC
20ºC
30ºC
10ºC
20ºC
30ºC
10ºC
20ºC
30ºC
10ºC
20ºC
30ºC
baseline summer total fall total w inter total
Ger
min
atio
n (a
vera
ge %
)
Seasonal field storage Erigeron pumilus
0
10
20
30
40
50
60
70
80
90
100
10ºC
20ºC
30ºC
10ºC
20ºC
30ºC
10ºC
20ºC
30ºC
10ºC
20ºC
30ºC
baseline summer total fall total w inter total
Ger
min
atio
n (a
vera
ge %
)
Figure 4.10 Corrected average germination after a 2-week trial. Bars are maximum and minimum germination across 3 replicates. Viability correction is 58%
Figure 4.9 Corrected average germination after a 2-week trial. Bars are maximum and minimum germination across 3 replicates. Viability correction is 85%
4.8
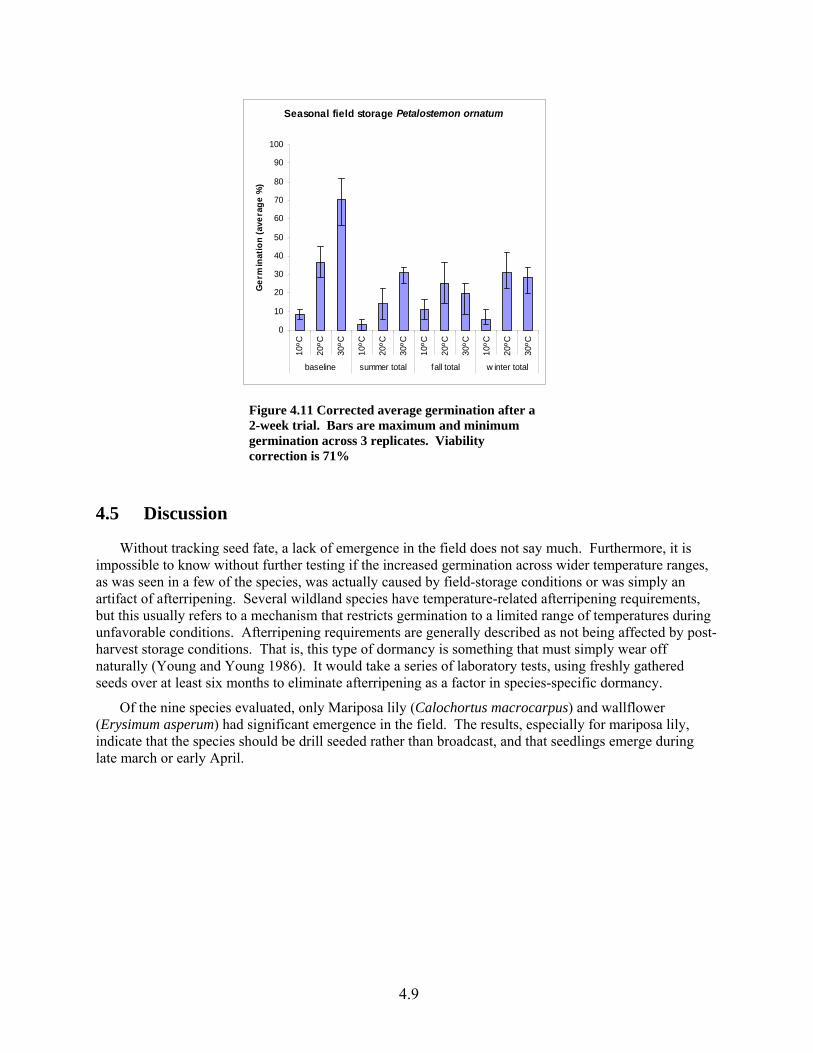
Seasonal field storage Petalostemon ornatum
0
10
20
30
40
50
60
70
80
90
100
10ºC
20ºC
30ºC
10ºC
20ºC
30ºC
10ºC
20ºC
30ºC
10ºC
20ºC
30ºC
baseline summer total fall total w inter total
Ger
min
atio
n (a
vera
ge %
)
Figure 4.11 Corrected average germination after a 2-week trial. Bars are maximum and minimum germination across 3 replicates. Viability correction is 71%
4.5 Discussion
Without tracking seed fate, a lack of emergence in the field does not say much. Furthermore, it is impossible to know without further testing if the increased germination across wider temperature ranges, as was seen in a few of the species, was actually caused by field-storage conditions or was simply an artifact of afterripening. Several wildland species have temperature-related afterripening requirements, but this usually refers to a mechanism that restricts germination to a limited range of temperatures during unfavorable conditions. Afterripening requirements are generally described as not being affected by post-harvest storage conditions. That is, this type of dormancy is something that must simply wear off naturally (Young and Young 1986). It would take a series of laboratory tests, using freshly gathered seeds over at least six months to eliminate afterripening as a factor in species-specific dormancy.
Of the nine species evaluated, only Mariposa lily (Calochortus macrocarpus) and wallflower (Erysimum asperum) had significant emergence in the field. The results, especially for mariposa lily, indicate that the species should be drill seeded rather than broadcast, and that seedlings emerge during late march or early April.
4.9

5.0 References
Daubenmire, R. 1959. A canopy-coverage method of vegetational analysis. Northwest Science, 33(1) 43-64.
Department of Energy (see U.S. Department of Energy)
Durham, R.E., J.S. Lewinsohn, and M.R. Sackschewsky. 2001. W-519 Sagebrush Mitigation Project: FY2001 Status Report. PNNL-14123. Pacific Northwest National Laboratory, Richland, Washington.
Durham, R.E., and M.R. Sackschewsky. 2002. W-519 Sagebrush Mitigation Project: FY2002 Status Report. PNNL-14131. Pacific Northwest National Laboratory, Richland, Washington.
Numatec Hanford Company. 1998. Mitigation Implementation Plan for Project W-519. HNF-3239 Rev. 0A. Numatec Hanford Company, Richland, Washington.
Sackschewsky, M.R., J.S. Lewinsohn, R.E. Durham. 2000. W-519 Sagebrush Mitigation Project FY 2000 Status Report. Letter Report. Pacific Northwest National Laboratory, Richland, Washington.
U.S. Department of Energy. 1998. Mitigation Action Plan for the U.S. Department of Energy, Hanford Site, Tank Waste Remediation System privatization Phase 1 Facility construction. U.S. DOE, Richland, Washington. May 1998.
Weiss, S.G., C.J. Kemp. 1998. Revegetation plan for the 116-C-1 Site. BHI-00628, Rev.1. Bechtel Hanford, Inc., Richland, Washington.
Wicklow-Howard, M.C. 1994. Mycorrhizal ecology of shrub-steppe habitat. In: Proceedings: Ecology and management of annual rangelands. USDA Forest Service, Intermountain Research Station, General Technical Report INT-GTR-313; p 207-210.
Young, J.A., C.G. Young, 1986. Collecting, processing and germinating seeds of wildland plants. Timber Press, Oregon.
5.1


PNNL-14901
Distribution
No. of Copies ONSITE 2 Department of Energy D.C. Ward A2-17 J. Zeisloft A3-04
2 Department of Energy, Office of River Protection
J.E. Rasmussen H6-60 B.L. Williams H6-60
No. of Copies 2 Pacific Northwest National Laboratory R.E. Durham K6-85 M.R. Sackschewsky K6-85
Distr.1