Embed Size (px)
Citation preview

WASTEWATER TREATMENT EVALUATION SALISBURY TOWNSHIP’S GAP STP
LANCASTER COUNTY, PA NPDES #PA0081574
MARCH through MAY 2015
Bureau of Point and Non-Point Source Management
June 2015
Salisbury Township WWTF at Gap Wastewater Treatment Evaluation
Department of Environmental Protection 1 Bureau of Point and Non-Point Source Management
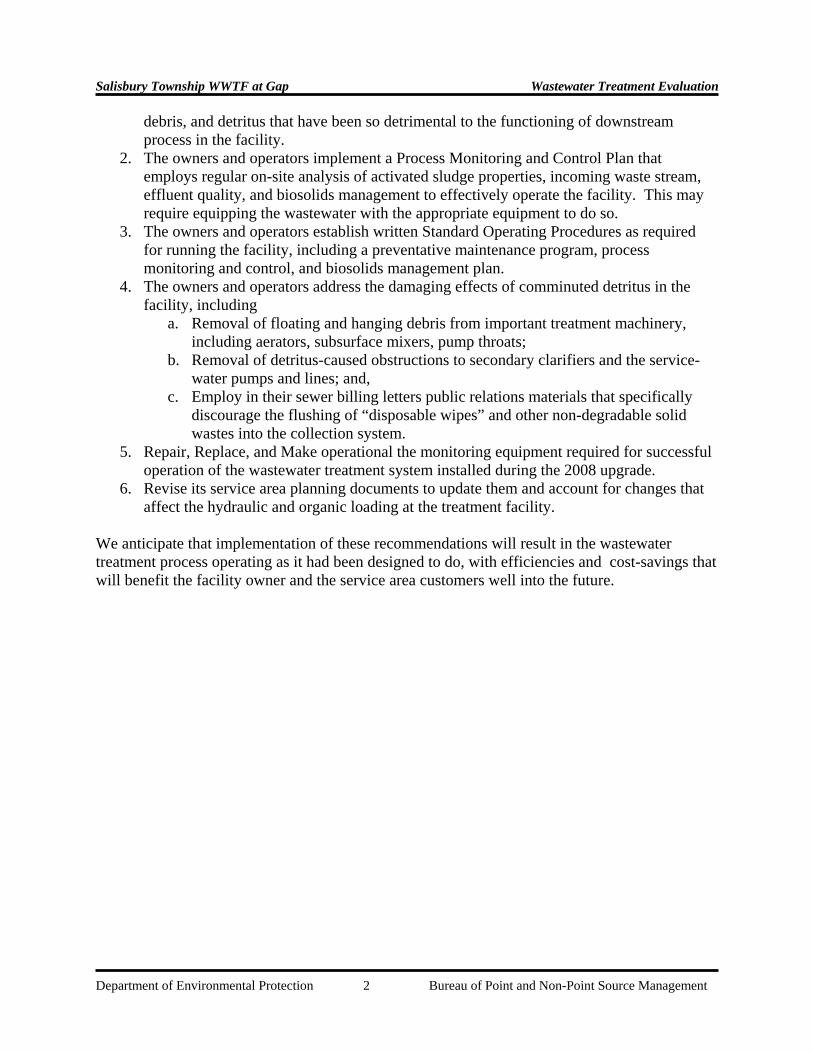
Executive Summary: The Pennsylvania Department of Environmental Protection (DEP) performed an Wastewater Treatment Evaluation of the Salisbury Township, Lancaster County, Gap Wastewater Treatment Facility (Gap) using onsite instrumentation and a portable wastewater laboratory between March 15 and May 13, 2015. Findings of the evaluation are summarized below. As a result of the evaluation, the DEP’s regional water quality enforcement administrators have recommended that a Consent Order and Agreement be entered into between the Commonwealth and Salisbury Township, requiring the latter to have a licensed engineer review the wastewater treatment facility for deficiencies in operation and propose corrective actions that will prevent further degradation of waterways downstream of the plant’s effluent discharge.
The findings are summarized as follows: 1. Salisbury Township’s Gap WWTF has a headworks which is insufficient to remove
inorganic detritus and debris in the raw sewage. This material adversely affects theperformance of a finely-tuned BNR treatment process downstream and results inexcursions from the facility’s discharge limits.
2. Loading to the facility may be inadequate for the operation of advanced biologicalnutrient removal technology, warranting the use of supplemental carbon to assist theBNR process.
3. In-line, electronic process monitoring equipment specified in the construction documentsfor the existing facility have either failed due to damage from detritus and/or frominsufficient maintenance, or they were never installed to begin with, rendering inoperablethe advanced BNR technology provided by the Vendor, Aqua-Aerobics, Inc. Further, thefacility lacked an Internet-uplink that would allow Aqua-Aerobics remote access tomonitor and trouble-shoot operations at the facility when problems occurred.
4. The WWTF operators do not perform sufficient process monitoring and control of thewastewater treatment and biosolids generation and disposal to achieve the level ofperformance indicated by the facility’s designers. The operators did not properly monitorsludge concentrations in the treatment process or in waste sludge hauling, resulting in
a. Inefficient operation of the facility;b. Activated sludge concentrations in excess of the recommended design
concentrations for properly operating the facility; andc. Predominance of filamentous organisms that led to deteriorated effluent quality.
5. NPDES Discharge Monitoring Reports (DMR) submitted to DEP may have beendeficient due to the lack of dependable analysis results used to determine mass/balanceand sludge disposal.
6. Township planning documents for the connection and management of users to the sewersystem have not been maintained up-to-date. The Act 537 Plan for the township is fifteen(15) years old, and the most recent projection for growth in the township was dated 2005.The Municipal Wasteload Management (Chapter 94) Reports of the facility have lackedpertinent information on population and system users, which may affect planning, and onprecipitation effects to the collection system, which affect hydraulic loading.
Based on the findings in this analysis, the WWTAP staff recommends that 1. An engineering study be commissioned to examine the existing plant headworks to
determine if additional preliminary treatment will prevent the accumulation of rags,
Salisbury Township WWTF at Gap Wastewater Treatment Evaluation
Department of Environmental Protection 2 Bureau of Point and Non-Point Source Management
debris, and detritus that have been so detrimental to the functioning of downstream process in the facility.
2. The owners and operators implement a Process Monitoring and Control Plan that employs regular on-site analysis of activated sludge properties, incoming waste stream, effluent quality, and biosolids management to effectively operate the facility. This may require equipping the wastewater with the appropriate equipment to do so.
3. The owners and operators establish written Standard Operating Procedures as required for running the facility, including a preventative maintenance program, process monitoring and control, and biosolids management plan.
4. The owners and operators address the damaging effects of comminuted detritus in the facility, including
a. Removal of floating and hanging debris from important treatment machinery, including aerators, subsurface mixers, pump throats;
b. Removal of detritus-caused obstructions to secondary clarifiers and the service-water pumps and lines; and,
c. Employ in their sewer billing letters public relations materials that specifically discourage the flushing of “disposable wipes” and other non-degradable solid wastes into the collection system.
5. Repair, Replace, and Make operational the monitoring equipment required for successful operation of the wastewater treatment system installed during the 2008 upgrade.
6. Revise its service area planning documents to update them and account for changes that affect the hydraulic and organic loading at the treatment facility.
We anticipate that implementation of these recommendations will result in the wastewater treatment process operating as it had been designed to do, with efficiencies and cost-savings that will benefit the facility owner and the service area customers well into the future.
Salisbury Township WWTF at Gap Wastewater Treatment Evaluation
Department of Environmental Protection 1 Bureau of Point and Non-Point Source Management
Narrative: The Pennsylvania Department of Environmental Protection (DEP) performed a Wastewater Treatment Evaluation (WTE) of the Salisbury Township, Lancaster County, Gap Wastewater Treatment Facility (Gap) using in-line instrumentation and a portable wastewater laboratory between March 15 and May 13, 2015. DEP staff were notified by members of the US Environmental Protection Agency, Region III, Technical Outreach section (EPA) that the facility required assistance in determining a cause and a cure for filamentous organisms affecting the process that resulted in effluent ammonia and total solids releases exceeding the limits of National Pollutant Discharge Elimination System (NPDES) permit number PA0081574. Messrs. Walter Higgins and James Kern of EPA had previously visited the facility, which had been upgraded to Biological Nutrient Removal (BNR) capability in 2008. The operator of the facility, Mr. Troy Wenger, had reported to them that the facility became difficult to manage following the upgrade. EPA’s technical outreach program provides assistance to wastewater operations within Pennsylvania, Delaware, and Maryland. DEP’s Bureau of Point and Non-point Source Management (BPNSM) runs a similar program called Wastewater Technical Assistance Program (WWTAP) to its permittees, but which is enhanced by the use of instrumentation which allows for continuous monitoring during process optimization..
The WTE evaluates existing operations and practices, followed by small-scale operational changes meant to optimize effluent quality. The purpose for optimizing effluent quality is to reduce nutrients in the final effluent, with an overall goal of improving surface water quality. The WTE was performed by staff of DEP’s Bureau of Point and Non-Point Source Management (BPNSM), Technical Assistance Section.
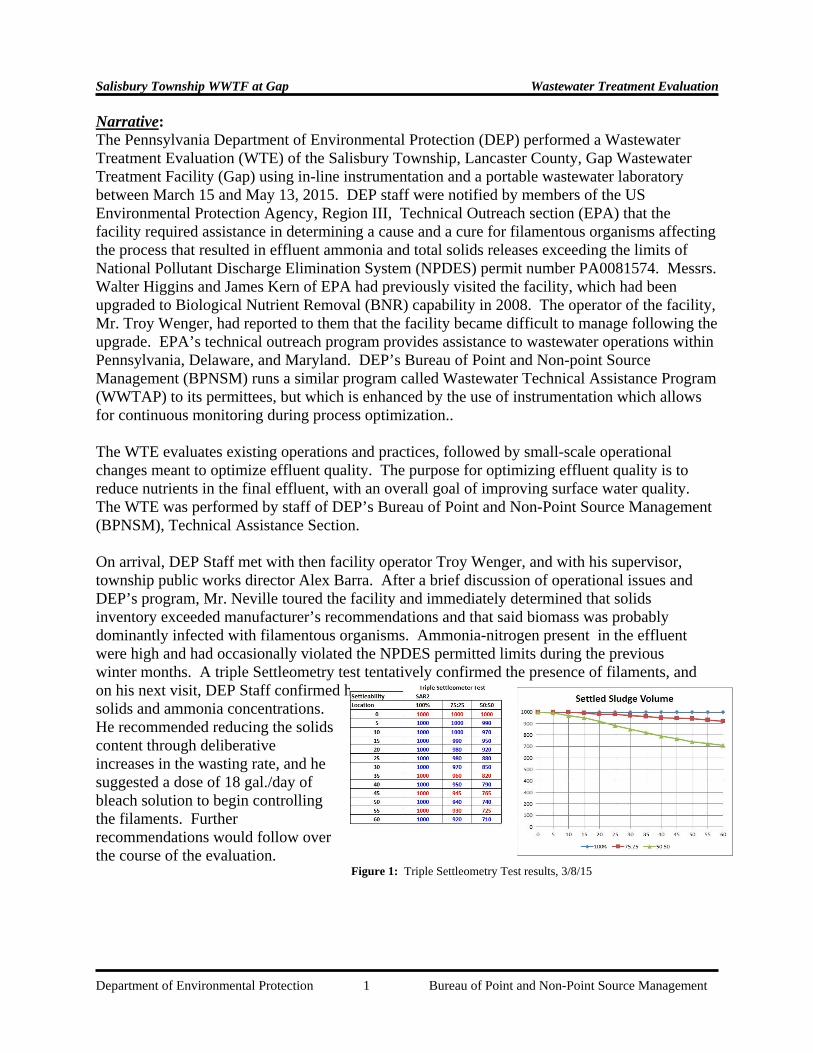
On arrival, DEP Staff met with then facility operator Troy Wenger, and with his supervisor, township public works director Alex Barra. After a brief discussion of operational issues and DEP’s program, Mr. Neville toured the facility and immediately determined that solids inventory exceeded manufacturer’s recommendations and that said biomass was probably dominantly infected with filamentous organisms. Ammonia-nitrogen present in the effluent were high and had occasionally violated the NPDES permitted limits during the previous winter months. A triple Settleometry test tentatively confirmed the presence of filaments, and on his next visit, DEP Staff confirmed high solids and ammonia concentrations. He recommended reducing the solids content through deliberative increases in the wasting rate, and he suggested a dose of 18 gal./day of bleach solution to begin controlling the filaments. Further recommendations would follow over the course of the evaluation.
Figure 1: Triple Settleometry Test results, 3/8/15
Salisbury Township WWTF at Gap Wastewater Treatment Evaluation
Department of Environmental Protection 2 Bureau of Point and Non-Point Source Management
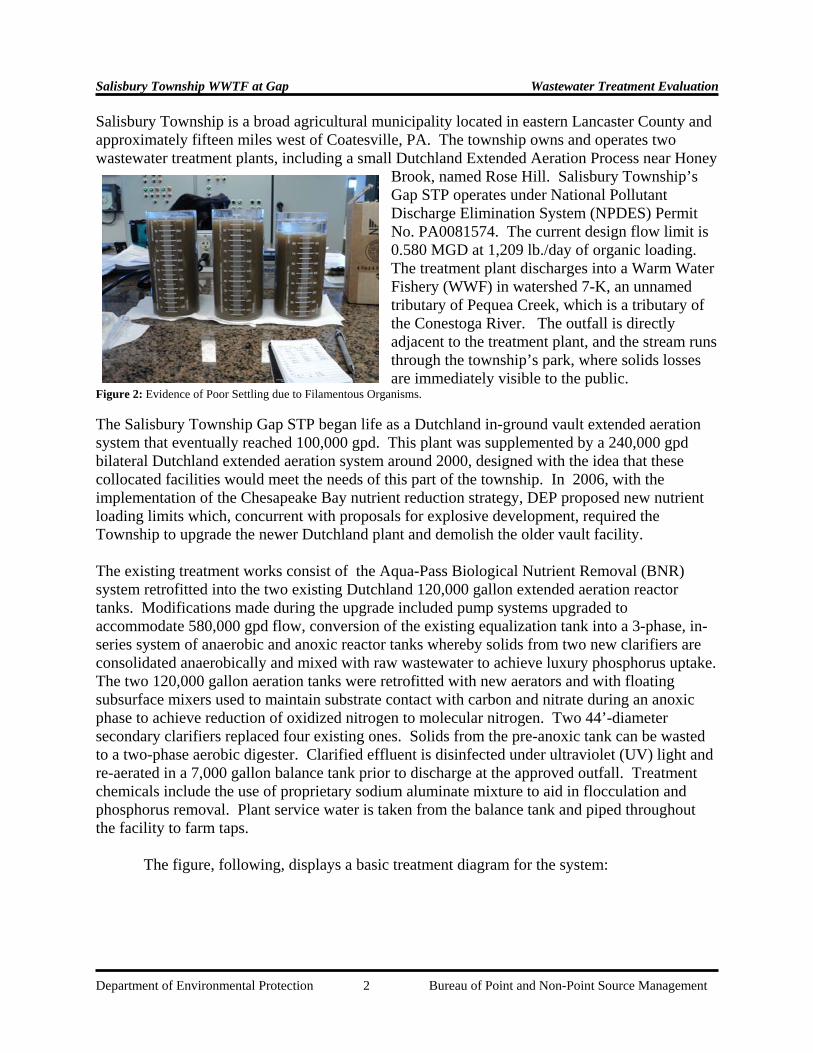
Salisbury Township is a broad agricultural municipality located in eastern Lancaster County and approximately fifteen miles west of Coatesville, PA. The township owns and operates two wastewater treatment plants, including a small Dutchland Extended Aeration Process near Honey
Brook, named Rose Hill. Salisbury Township’s Gap STP operates under National Pollutant Discharge Elimination System (NPDES) Permit No. PA0081574. The current design flow limit is 0.580 MGD at 1,209 lb./day of organic loading. The treatment plant discharges into a Warm Water Fishery (WWF) in watershed 7-K, an unnamed tributary of Pequea Creek, which is a tributary of the Conestoga River. The outfall is directly adjacent to the treatment plant, and the stream runs through the township’s park, where solids losses are immediately visible to the public.
Figure 2: Evidence of Poor Settling due to Filamentous Organisms.
The Salisbury Township Gap STP began life as a Dutchland in-ground vault extended aeration system that eventually reached 100,000 gpd. This plant was supplemented by a 240,000 gpd bilateral Dutchland extended aeration system around 2000, designed with the idea that these collocated facilities would meet the needs of this part of the township. In 2006, with the implementation of the Chesapeake Bay nutrient reduction strategy, DEP proposed new nutrient loading limits which, concurrent with proposals for explosive development, required the Township to upgrade the newer Dutchland plant and demolish the older vault facility. The existing treatment works consist of the Aqua-Pass Biological Nutrient Removal (BNR) system retrofitted into the two existing Dutchland 120,000 gallon extended aeration reactor tanks. Modifications made during the upgrade included pump systems upgraded to accommodate 580,000 gpd flow, conversion of the existing equalization tank into a 3-phase, in-series system of anaerobic and anoxic reactor tanks whereby solids from two new clarifiers are consolidated anaerobically and mixed with raw wastewater to achieve luxury phosphorus uptake. The two 120,000 gallon aeration tanks were retrofitted with new aerators and with floating subsurface mixers used to maintain substrate contact with carbon and nitrate during an anoxic phase to achieve reduction of oxidized nitrogen to molecular nitrogen. Two 44’-diameter secondary clarifiers replaced four existing ones. Solids from the pre-anoxic tank can be wasted to a two-phase aerobic digester. Clarified effluent is disinfected under ultraviolet (UV) light and re-aerated in a 7,000 gallon balance tank prior to discharge at the approved outfall. Treatment chemicals include the use of proprietary sodium aluminate mixture to aid in flocculation and phosphorus removal. Plant service water is taken from the balance tank and piped throughout the facility to farm taps.
The figure, following, displays a basic treatment diagram for the system:

Salisbury Township WWTF at Gap Wastewater Treatment Evaluation
Department of Environmental Protection 3 Bureau of Point and Non-Point Source Management
Figure 1: Schematic of Treatment Process The following table lists critical design criteria for the facility, and a listing of the NPDES Permit requirements may be found in Attachment F. Parameter Value Design Average Daily Flow 0.580 MGD Maximum Design Flow 1.16 MGD Average Design BOD5 Loading 1,209 lb./day Average Design TSS Loading 1,040 lb./day 2014 Annual Average Daily Flow 0.2549 MGD 2014 Organic Loading 473 lb./day Design Food-to-Mass Ratio 0.094 Design MLSS Concentration 4,000 mg/L Observed MLSS Concentration 5,500 mg/L Hydraulic Retention Time 13.6 hours Solids Retention Time 11.4 days Estimated Net Sludge Yield 0.74 lb. WAS per lb. BOD5 Estimated WAS Volume 8,249 gpd Actual WAS Volume >12,000 gpd Design O2 per lb. BOD5 1.25 lb. Design O2 per lb. TKN 4.60 Design Air Delivery 1,283 SCFM @ 7.7 psig Estimated Power Consumption 644 kW-hr per day Design MCRT 11.4 days Design HRT at 0.580 MGD 13.7 hours Clarifier Surface Overflow Rate (2 @ 44’ Diameter) 2.89 gpd/ ft2 @ max. mo. Flow Peak hourly SOR 5.78 gpd/ ft2 Surface Loading Rate @ 4,000 mg/L TSS 16 lb.-day/ft2 Design RAS concentration 10,000 mg/L Design WAS concentration via Phase Separator 13,000 mg/L
Salisbury Township WWTF at Gap Wastewater Treatment Evaluation
Department of Environmental Protection 4 Bureau of Point and Non-Point Source Management
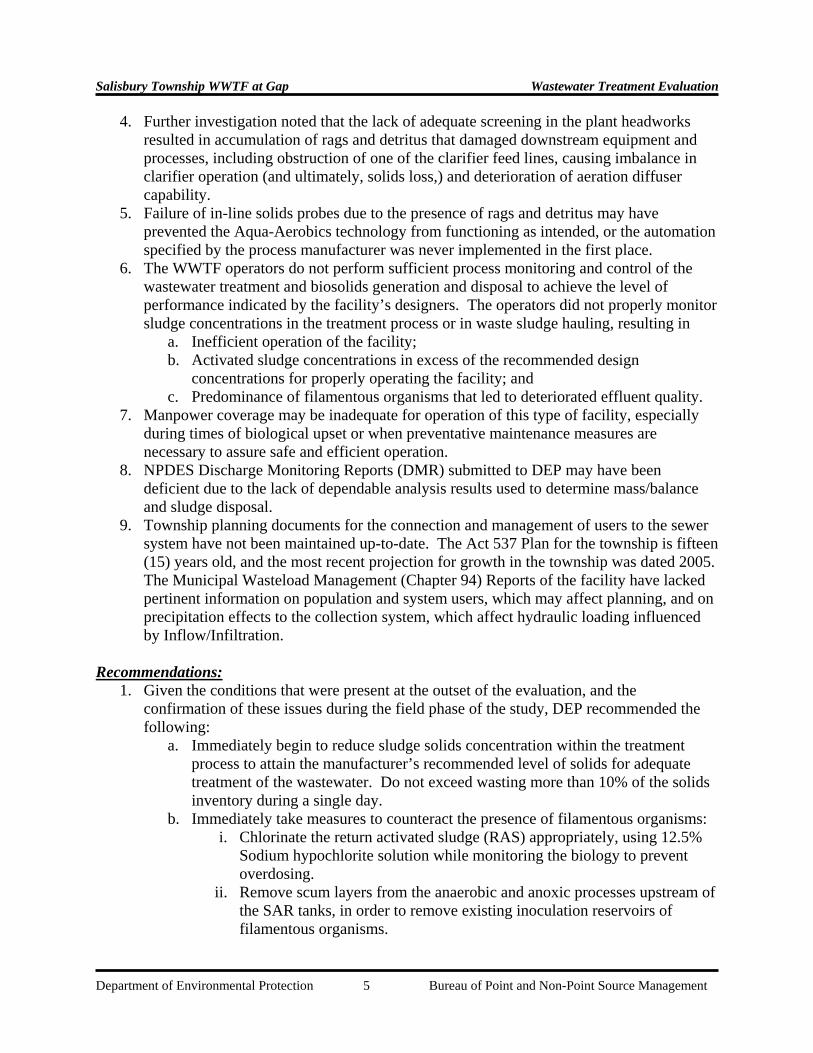
During the late winter months, the facility experienced process upsets due to filamentous bulking combined with ashing of solids later determined to be from maintenance of excessively high solids concentrations. DEP staff deployed in-line process monitoring probes at the anoxic zone and in Staged Aerobic Reactor (SAR) Tank 1 to monitor biological activity, and they installed ammonium and nitrate probes in the final effluent tank to monitor nitrogen. In addition, a portable process monitoring laboratory was set up in the control building to allow evaluators and operators to conduct process monitoring tests on site and to maintain calibration of the in-line probes. Over the following several weeks, DEP staff conducted process monitoring tests and reported that solids concentrations should be reduced, filamentous organisms should be treated, and efforts should be made to bring the process under control. The plant operator cited time and work assignment issues as factors mitigating against more in-depth process monitoring tests and noted that he continued meeting his monitoring requirements. (These are the required effluent tests for pH and DO, recording of UV intensity, collecting weekly samples for testing at a contract lab, and performing sludge settleability tests and collecting samples for off-site gravimetric solids tests.) Toward the latter part of the data collection period, the operator resigned his position, and the township hired a contract operations firm to maintain the facility. The new operator immediately began to control the filamentous growth using bleach solution, sought to clear rag obstructions throughout the plant, and had the comminutor removed for service and replacement of its grinding teeth. He pledged to spend at least three hours per day at the facility until its operation was under control and brought in manpower and equipment to help clear detritus from the clarifier influent lines and to get solids concentrations back to manageable levels. In the final week of the evaluation period, DEP staff and township representatives met to discuss options for implementing improvements to the facility. One of the significant items discussed was having an engineer re-evaluate the need for a more efficient headworks screening system for removal of rags and detritus. Another was to evaluate whether the originally specified monitoring equipment and system automation that had been cut from the planned upgrade should be installed and operated. The engineer would also review current and projected loading to determine if further improvements to capacity, such as flow equalization, should be considered. Findings:
1. The facility was operating under conditions of inadequate sludge wasting, which led to dissolved oxygen deficiency that promoted the dominance of filamentous organisms.
2. Loading to the facility may be inadequate, overall, and specifically inhibiting to the proper operation of a BNR process. Supplemental electron donor carbon sources may be necessary to drive BNR, and nutrient balance or bioremediation (prepared nutrients or bacterial cultures) may be necessary to restore balance and inhibit the dominance of filamentous organisms.
3. The presence of excessive solids and filamentous organisms hinders adequate performance of the secondary clarifiers and results in both ashing of solids and occasional loss of clarifier blanket solids to downstream processes.
Salisbury Township WWTF at Gap Wastewater Treatment Evaluation
Department of Environmental Protection 5 Bureau of Point and Non-Point Source Management
4. Further investigation noted that the lack of adequate screening in the plant headworks resulted in accumulation of rags and detritus that damaged downstream equipment and processes, including obstruction of one of the clarifier feed lines, causing imbalance in clarifier operation (and ultimately, solids loss,) and deterioration of aeration diffuser capability.
5. Failure of in-line solids probes due to the presence of rags and detritus may have prevented the Aqua-Aerobics technology from functioning as intended, or the automation specified by the process manufacturer was never implemented in the first place.
6. The WWTF operators do not perform sufficient process monitoring and control of the wastewater treatment and biosolids generation and disposal to achieve the level of performance indicated by the facility’s designers. The operators did not properly monitor sludge concentrations in the treatment process or in waste sludge hauling, resulting in
a. Inefficient operation of the facility; b. Activated sludge concentrations in excess of the recommended design
concentrations for properly operating the facility; and c. Predominance of filamentous organisms that led to deteriorated effluent quality.
7. Manpower coverage may be inadequate for operation of this type of facility, especially during times of biological upset or when preventative maintenance measures are necessary to assure safe and efficient operation.
8. NPDES Discharge Monitoring Reports (DMR) submitted to DEP may have been deficient due to the lack of dependable analysis results used to determine mass/balance and sludge disposal.
9. Township planning documents for the connection and management of users to the sewer system have not been maintained up-to-date. The Act 537 Plan for the township is fifteen (15) years old, and the most recent projection for growth in the township was dated 2005. The Municipal Wasteload Management (Chapter 94) Reports of the facility have lacked pertinent information on population and system users, which may affect planning, and on precipitation effects to the collection system, which affect hydraulic loading influenced by Inflow/Infiltration.
Recommendations:
1. Given the conditions that were present at the outset of the evaluation, and the confirmation of these issues during the field phase of the study, DEP recommended the following:
a. Immediately begin to reduce sludge solids concentration within the treatment process to attain the manufacturer’s recommended level of solids for adequate treatment of the wastewater. Do not exceed wasting more than 10% of the solids inventory during a single day.
b. Immediately take measures to counteract the presence of filamentous organisms: i. Chlorinate the return activated sludge (RAS) appropriately, using 12.5%
Sodium hypochlorite solution while monitoring the biology to prevent overdosing.
ii. Remove scum layers from the anaerobic and anoxic processes upstream of the SAR tanks, in order to remove existing inoculation reservoirs of filamentous organisms.
Salisbury Township WWTF at Gap Wastewater Treatment Evaluation
Department of Environmental Protection 6 Bureau of Point and Non-Point Source Management
iii. If tenable, employ the use of prepared bacteria to offset the adverse impacts of the necessary chlorination of the biomass.
2. Remove rags and detritus from the treatment system. This entails three significant actions:
a. Install temporary measures at the plant headworks to capture and divert much of the rags and insoluble detritus entering the plant;
b. Repair the existing comminutor, where teeth are either missing or where there exists insufficient clearance to assure destruction of rags and insoluble detritus;
c. Remove rags and detritus from process equipment, including the subsurface aerators, pump impellers, anoxic mixers, clarifier rakes. This activity will be labor intensive and will require process tanks to be alternately emptied and cleaned.
3. Evaluate the facility’s headworks with an eye to long-term solution of the rags/detritus issue:
a. An engineering study should be pursued to find a treatment technology which adequately removes rags and detritus from the influent wastewater prior to its entry into the SAR treatment process.
b. Rags and detritus should be rinsed of soluble BOD prior to disposal in landfill (or incineration) in order to use that BOD to help drive denitrification in anoxic processes.
4. Implement a Process Monitoring and Control Plan that employs regular on-site analysis of activated sludge properties, incoming waste stream, effluent quality, and biosolids management to effectively operate the facility. This may require equipping the laboratory with the appropriate equipment to do so:
a. At present, the existing laboratory has only minimal equipment for activated sludge process monitoring and control.
b. The evaluator recommended additional analytical testing be done on-site, including regular testing, including but not limited to
i. Suspended Solids by gravimetric or volumetric assay; ii. Mixed liquor dissolved oxygen, pH, and alkalinity;
iii. Settleability of mixed liquor entering the clarifiers; iv. Regular microscopy of mixed liquor suspended solids; v. In-house testing of effluent nutrients;
vi. Waste sludge solids concentration at digesters, following gravity decanting and prior to shipment of liquid waste solids to offsite treatment and disposal.
5. Establish written Standard Operating Procedures as required for running the facility, including a preventative maintenance program, process surveillance, and biosolids management plan;
6. Repair, replace, and make operational the monitoring equipment required for successful operation of the wastewater treatment system installed during the 2008 upgrade;
7. Evaluate and update the existing projections for growth in the treatment facility’s service area:
a. Capacity projections for the Aqua-Aerobics upgrade were made prior to the 2008 housing industry crash that adversely impacted commercial and residential

Salisbury Township WWTF at Gap Wastewater Treatment Evaluation
Department of Environmental Protection 7 Bureau of Point and Non-Point Source Management
development in the township, rendering projected connections and loadings inaccurate.
b. Inadequate influent loading to a BNR-process treatment facility will affect performance of that facility and may result in degradation of effluent quality. This is especially critical when providing adequate conditions for nitrogen control, where costly supplemental treatment chemicals may be required.
8. The engineer may also need to evaluate manpower coverage to assure the facility is operated thoroughly but efficiently.
These recommendations are made in with the intention to provide the Township with sufficient guidance in assuring efficient treatment of sewage, production of a quality effluent that meets or exceeds the requirements of its NPDES permit, and proper disposal of waste biosolids, with an eye toward assuring community and worker safety while also maintaining economical cost control and oversight. Permit Modifications— Any modifications to the permitted treatment process may require an amendment to the Water Management Permit. If unsure whether a permit modification is necessary, please contact the DEP regional office prior to making any modifications. Disclaimers: The mention of a particular brand of equipment is in no way an endorsement for any specific company. The Department urges the permittee to research available products and select those which are the most applicable for its situation.
The goal of the Wastewater Technical Evaluation is to reduce nutrients in wastewater plant discharges. This often times involves permittees achieving effluent quality above and beyond any permit requirements.
Salisbury Township WWTF at Gap Wastewater Treatment Evaluation
Department of Environmental Protection A-1 Bureau of Point and Non-Point Source Management
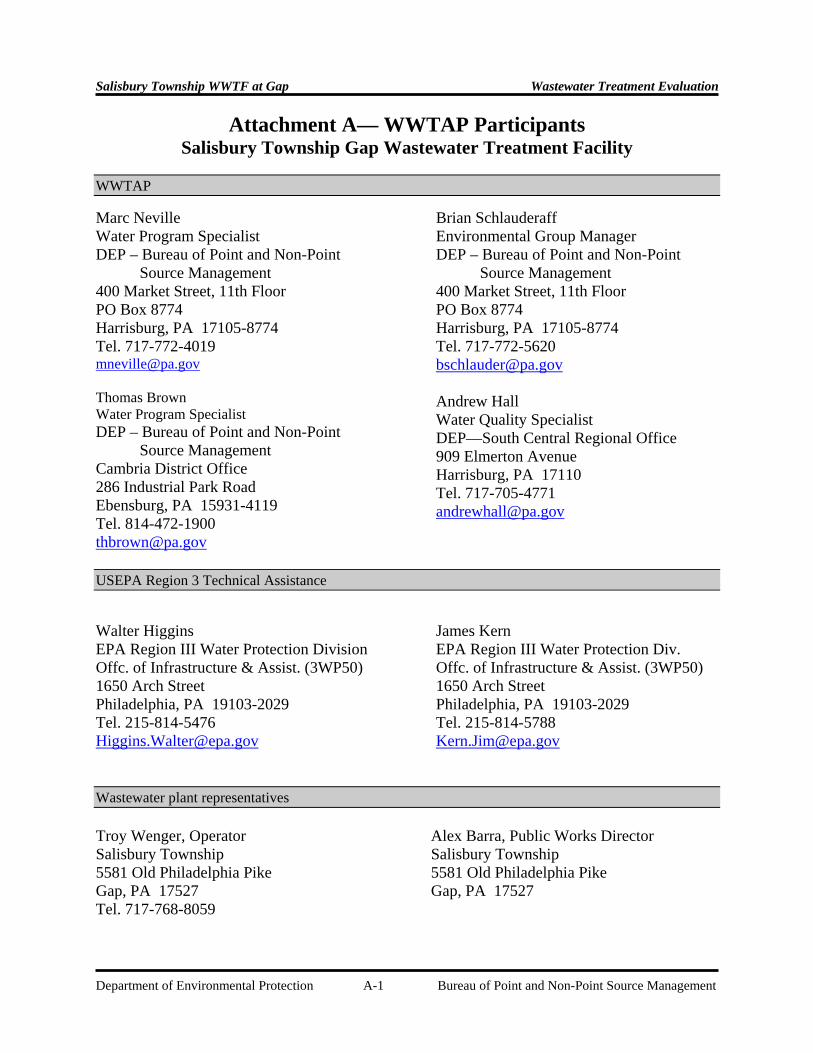
Attachment A— WWTAP Participants Salisbury Township Gap Wastewater Treatment Facility
WWTAP
USEPA Region 3 Technical Assistance
Wastewater plant representatives
Troy Wenger, Operator Salisbury Township 5581 Old Philadelphia Pike Gap, PA 17527 Tel. 717-768-8059
Alex Barra, Public Works Director Salisbury Township 5581 Old Philadelphia Pike Gap, PA 17527
Marc Neville Water Program Specialist DEP – Bureau of Point and Non-Point Source Management 400 Market Street, 11th Floor PO Box 8774 Harrisburg, PA 17105-8774 Tel. 717-772-4019 [email protected] Thomas Brown Water Program Specialist DEP – Bureau of Point and Non-Point Source Management Cambria District Office 286 Industrial Park Road Ebensburg, PA 15931-4119 Tel. 814-472-1900 [email protected]
Brian Schlauderaff Environmental Group Manager DEP – Bureau of Point and Non-Point Source Management 400 Market Street, 11th Floor PO Box 8774 Harrisburg, PA 17105-8774 Tel. 717-772-5620 [email protected] Andrew Hall Water Quality Specialist DEP—South Central Regional Office 909 Elmerton Avenue Harrisburg, PA 17110 Tel. 717-705-4771 [email protected]
Walter Higgins EPA Region III Water Protection Division Offc. of Infrastructure & Assist. (3WP50) 1650 Arch Street Philadelphia, PA 19103-2029 Tel. 215-814-5476 [email protected]
James Kern EPA Region III Water Protection Div. Offc. of Infrastructure & Assist. (3WP50) 1650 Arch Street Philadelphia, PA 19103-2029 Tel. 215-814-5788 [email protected]
Salisbury Township WWTF at Gap Wastewater Treatment Evaluation
Department of Environmental Protection B-1 Bureau of Point and Non-Point Source Management
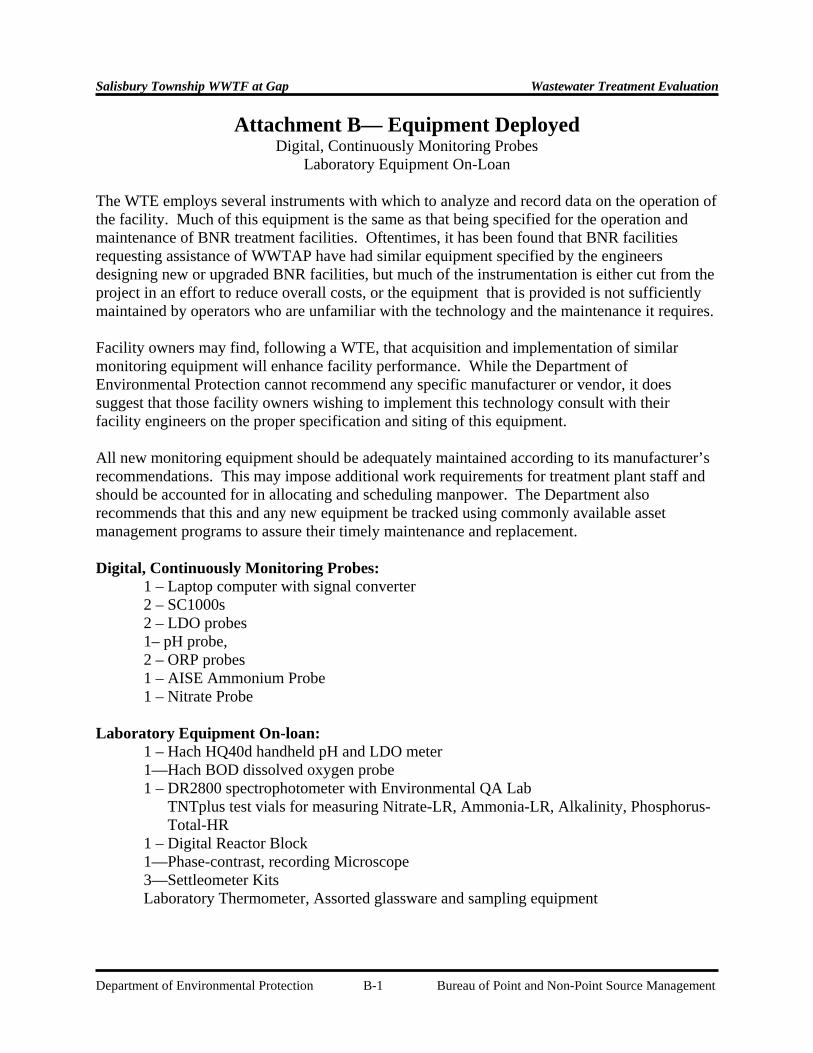
Attachment B— Equipment Deployed Digital, Continuously Monitoring Probes
Laboratory Equipment On-Loan The WTE employs several instruments with which to analyze and record data on the operation of the facility. Much of this equipment is the same as that being specified for the operation and maintenance of BNR treatment facilities. Oftentimes, it has been found that BNR facilities requesting assistance of WWTAP have had similar equipment specified by the engineers designing new or upgraded BNR facilities, but much of the instrumentation is either cut from the project in an effort to reduce overall costs, or the equipment that is provided is not sufficiently maintained by operators who are unfamiliar with the technology and the maintenance it requires. Facility owners may find, following a WTE, that acquisition and implementation of similar monitoring equipment will enhance facility performance. While the Department of Environmental Protection cannot recommend any specific manufacturer or vendor, it does suggest that those facility owners wishing to implement this technology consult with their facility engineers on the proper specification and siting of this equipment. All new monitoring equipment should be adequately maintained according to its manufacturer’s recommendations. This may impose additional work requirements for treatment plant staff and should be accounted for in allocating and scheduling manpower. The Department also recommends that this and any new equipment be tracked using commonly available asset management programs to assure their timely maintenance and replacement. Digital, Continuously Monitoring Probes:
1 – Laptop computer with signal converter 2 – SC1000s 2 – LDO probes 1– pH probe, 2 – ORP probes 1 – AISE Ammonium Probe 1 – Nitrate Probe
Laboratory Equipment On-loan: 1 – Hach HQ40d handheld pH and LDO meter 1—Hach BOD dissolved oxygen probe 1 – DR2800 spectrophotometer with Environmental QA Lab TNTplus test vials for measuring Nitrate-LR, Ammonia-LR, Alkalinity, Phosphorus-
Total-HR 1 – Digital Reactor Block 1—Phase-contrast, recording Microscope 3—Settleometer Kits Laboratory Thermometer, Assorted glassware and sampling equipment
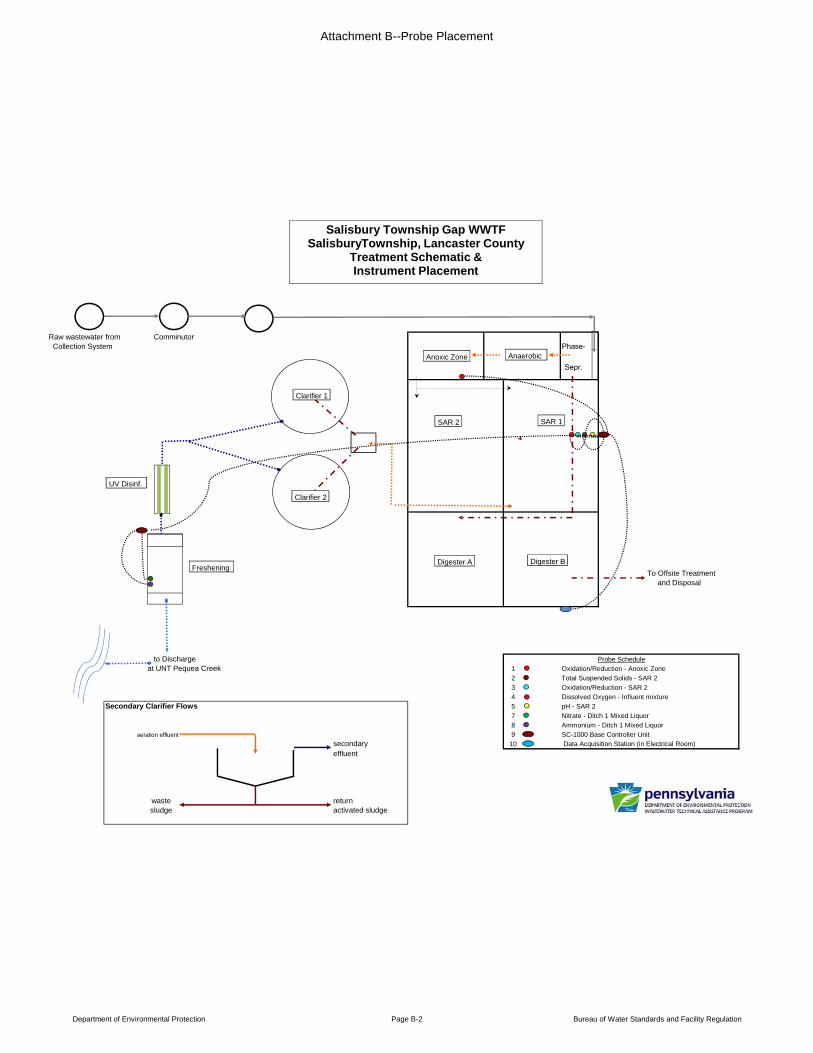
Attachment B--Probe Placement
Raw wastewater from Comminutor Collection System Phase-
Sepr.
To Offsite Treatment and Disposal
to Discharge at UNT Pequea Creek 1 Oxidation/Reduction - Anoxic Zone
2 Total Suspended Solids - SAR 2
3 Oxidation/Reduction - SAR 2
4 Dissolved Oxygen - Influent mixture
Secondary Clarifier Flows 5 pH - SAR 2
7 Nitrate - Ditch 1 Mixed Liquor
8 Ammonium - Ditch 1 Mixed Liquor
aeration effluent 9 SC-1000 Base Controller Unitsecondary 10 Data Acquisition Station (in Electrical Room)
effluent
waste returnsludge activated sludge
Probe Schedule
Salisbury Township Gap WWTFSalisburyTownship, Lancaster County
Treatment Schematic & Instrument Placement
SAR 2 SAR 1
Clarifier 2
Clarifier 1
UV Disinf.
Freshening Digester A Digester B
Anoxic Zone Anaerobic
Department of Environmental Protection Page B-2 Bureau of Water Standards and Facility Regulation
Salisbury Township WWTF at Gap Wastewater Treatment Evaluation
Department of Environmental Protection C-1 Bureau of Point and Non-Point Source Management
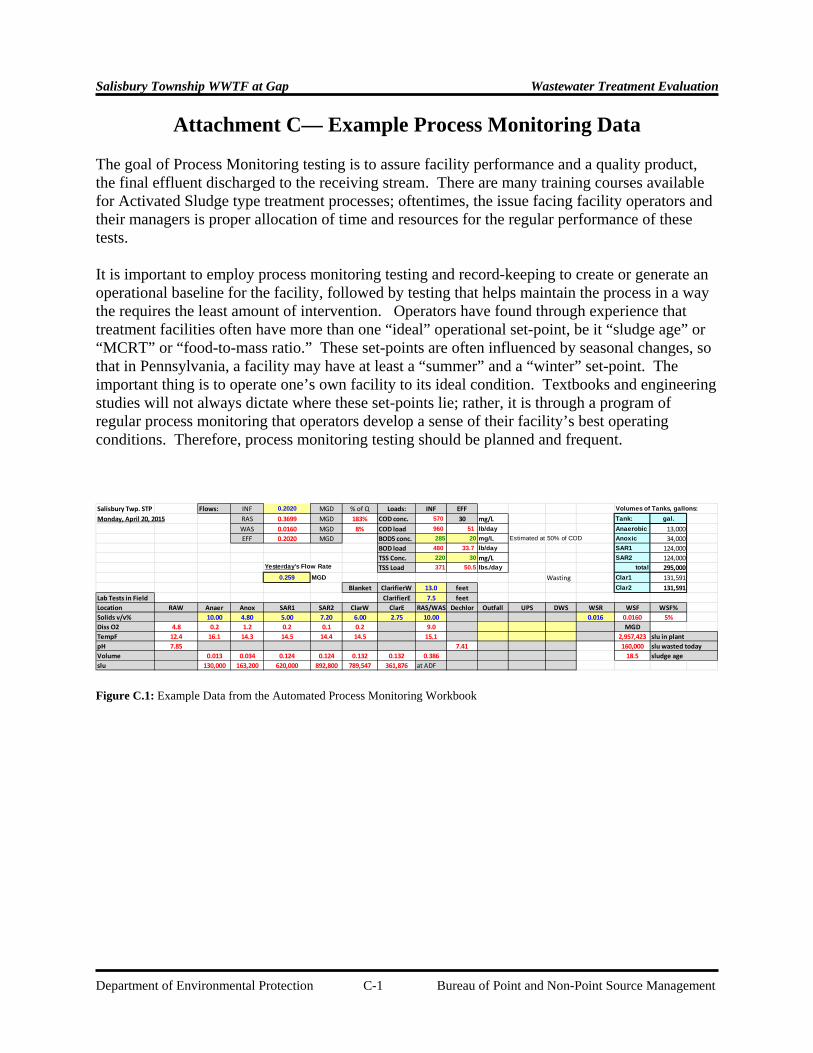
Attachment C— Example Process Monitoring Data The goal of Process Monitoring testing is to assure facility performance and a quality product, the final effluent discharged to the receiving stream. There are many training courses available for Activated Sludge type treatment processes; oftentimes, the issue facing facility operators and their managers is proper allocation of time and resources for the regular performance of these tests. It is important to employ process monitoring testing and record-keeping to create or generate an operational baseline for the facility, followed by testing that helps maintain the process in a way the requires the least amount of intervention. Operators have found through experience that treatment facilities often have more than one “ideal” operational set-point, be it “sludge age” or “MCRT” or “food-to-mass ratio.” These set-points are often influenced by seasonal changes, so that in Pennsylvania, a facility may have at least a “summer” and a “winter” set-point. The important thing is to operate one’s own facility to its ideal condition. Textbooks and engineering studies will not always dictate where these set-points lie; rather, it is through a program of regular process monitoring that operators develop a sense of their facility’s best operating conditions. Therefore, process monitoring testing should be planned and frequent. Salisbury Twp. STP Flows: INF 0.2020 MGD % of Q Loads: INF EFF Volumes of Tanks, gallons:
RAS 0.3699 MGD 183% COD conc. 570 30 mg/L Tank: gal.
WAS 0.0160 MGD 8% COD load 960 51 lb/day Anaerobic 13,000
EFF 0.2020 MGD BOD5 conc. 285 20 mg/L Estimated at 50% of COD Anoxic 34,000
BOD load 480 33.7 lb/day SAR1 124,000
TSS Conc. 220 30 mg/L SAR2 124,000Yesterday's Flow Rate TSS Load 371 50.5 lbs./day total 295,000
0.259 MGD Wasting Clar1 131,591
Blanket ClarifierW 13.0 feet Clar2 131,591
Lab Tests in Field ClarifierE 7.5 feet
Location RAW Anaer Anox SAR1 SAR2 ClarW ClarE RAS/WAS Dechlor Outfall UPS DWS WSR WSF WSF%
Solids v/v% 10.00 4.80 5.00 7.20 6.00 2.75 10.00 0.016 0.0160 5%
Diss O2 4.8 0.2 1.2 0.2 0.1 0.2 9.0 MGD
TempF 12.4 16.1 14.3 14.5 14.4 14.5 15.1 2,957,423 slu in plant
pH 7.85 7.41 160,000 slu wasted today
Volume 0.013 0.034 0.124 0.124 0.132 0.132 0.386 18.5 sludge age
slu 130,000 163,200 620,000 892,800 789,547 361,876 at ADF
Monday, April 20, 2015
Figure C.1: Example Data from the Automated Process Monitoring Workbook

Salisbury Township WWTF at Gap Wastewater Treatment Evaluation
Department of Environmental Protection C-2 Bureau of Point and Non-Point Source Management
Figure C.2: Example Data from the Automated Process Monitoring Workbook
Figure C.3: Example Data from the Automated Process Monitoring Workbook
Salisbury Township WWTF at Gap Wastewater Treatment Evaluation
Department of Environmental Protection C-3 Bureau of Point and Non-Point Source Management
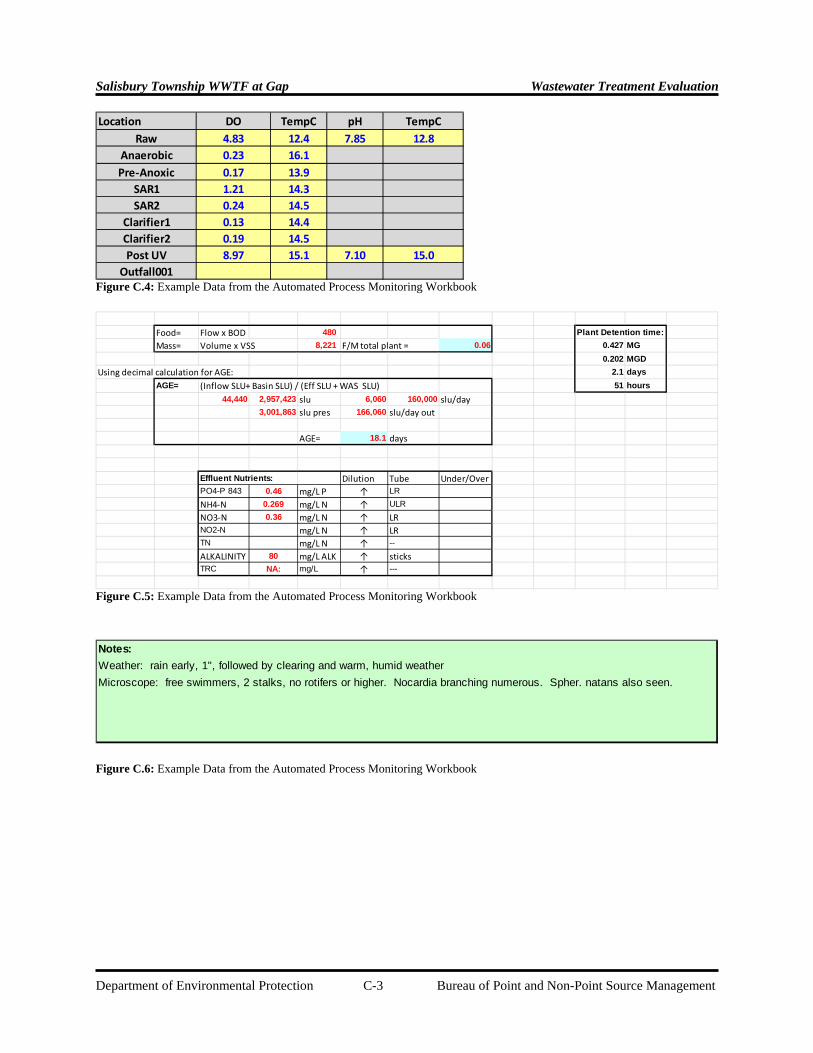
Location DO TempC pH TempC
Raw 4.83 12.4 7.85 12.8
Anaerobic 0.23 16.1
Pre‐Anoxic 0.17 13.9
SAR1 1.21 14.3
SAR2 0.24 14.5
Clarifier1 0.13 14.4
Clarifier2 0.19 14.5
Post UV 8.97 15.1 7.10 15.0
Outfall001 Figure C.4: Example Data from the Automated Process Monitoring Workbook
Food= Flow x BOD 480 Plant Detention time:
Mass= Volume x VSS 8,221 F/M total plant = 0.06 0.427 MG
0.202 MGD
Using decimal calculation for AGE: 2.1 days
AGE= (Inflow SLU+ Basin SLU) / (Eff SLU + WAS SLU) 51 hours
44,440 2,957,423 slu 6,060 160,000 slu/day
3,001,863 slu pres 166,060 slu/day out
AGE= 18.1 days
Effluent Nutrients: Dilution Tube Under/OverPO4-P 843 0.46 mg/L P ↑ LR
NH4‐N 0.269 mg/L N ↑ ULR
NO3‐N 0.36 mg/L N ↑ LRNO2-N mg/L N ↑ LRTN mg/L N ↑ --
ALKALINITY 80 mg/L ALK ↑ sticksTRC NA: mg/L ↑ ---
Figure C.5: Example Data from the Automated Process Monitoring Workbook
Notes:
Weather: rain early, 1", followed by clearing and warm, humid weather
Microscope: free swimmers, 2 stalks, no rotifers or higher. Nocardia branching numerous. Spher. natans also seen.
Figure C.6: Example Data from the Automated Process Monitoring Workbook
Salisbury Township WWTF at Gap Wastewater Treatment Evaluation
Department of Environmental Protection D-1 Bureau of Point and Non-Point Source Management
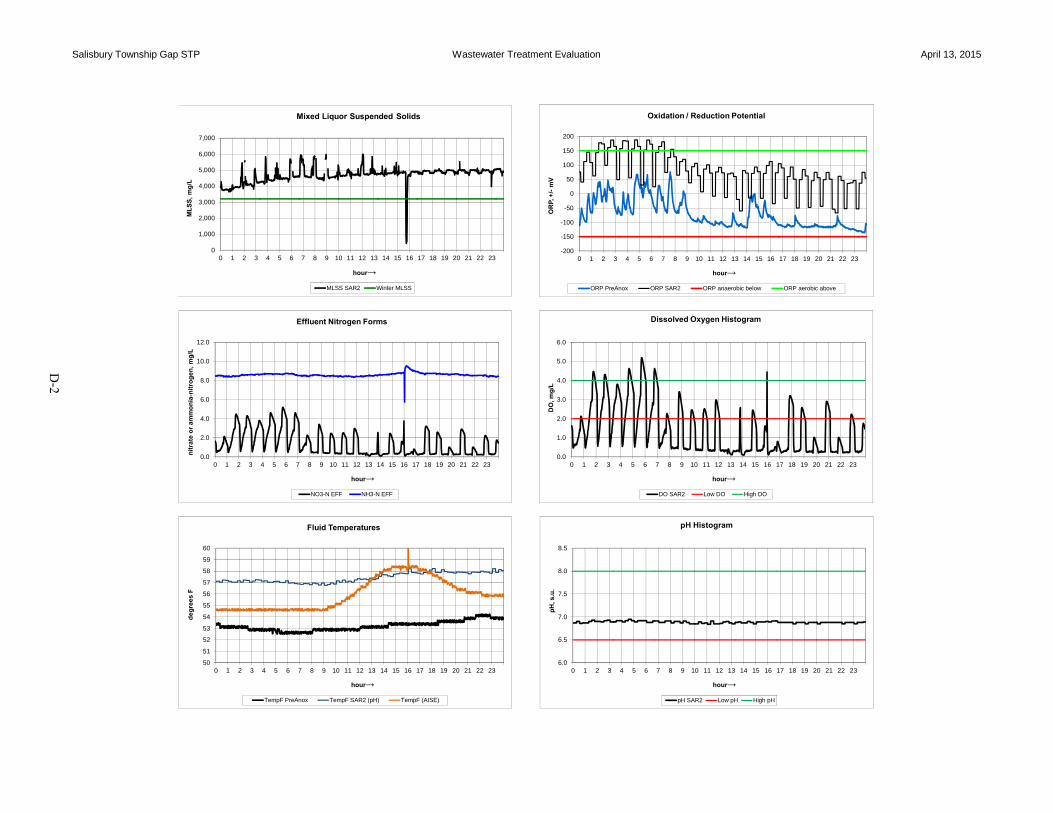
Attachment D—Parameter Histograms
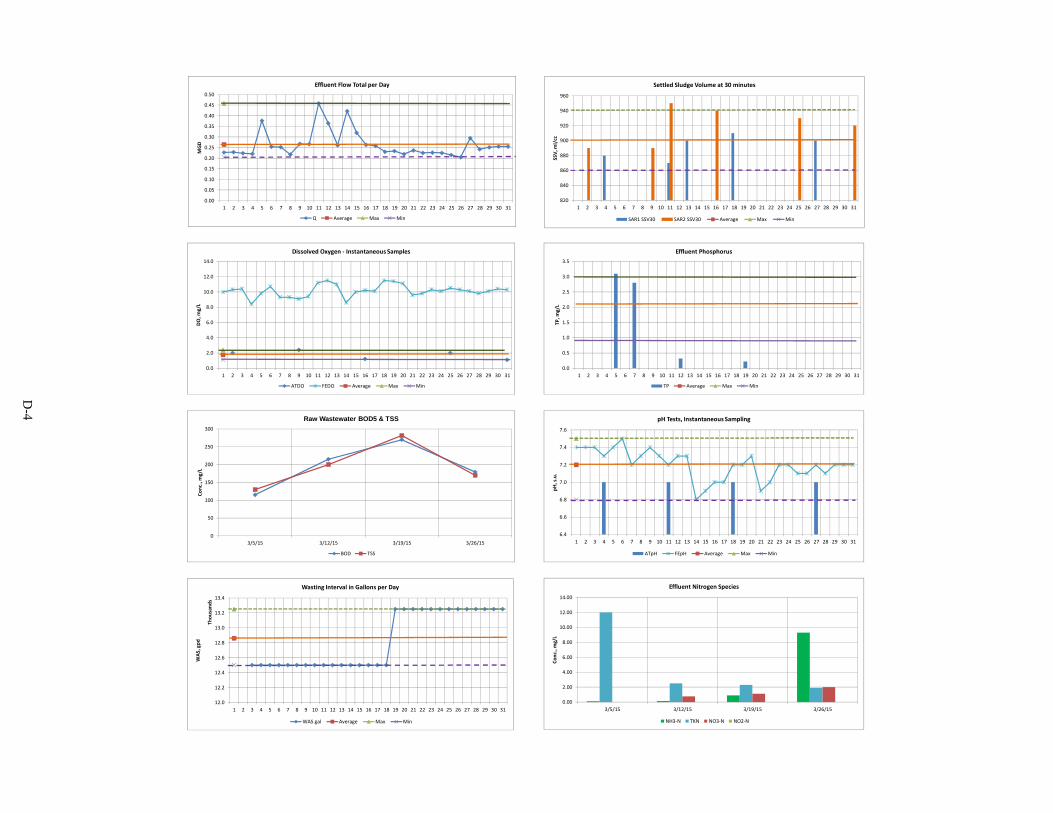
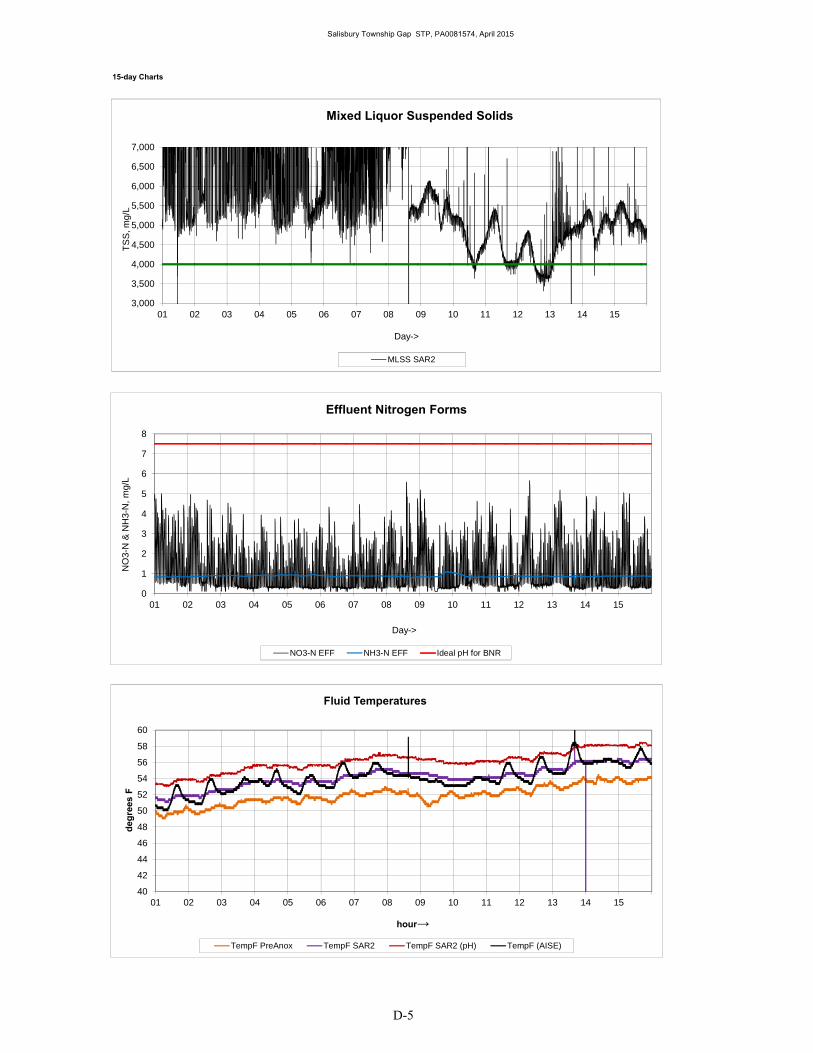
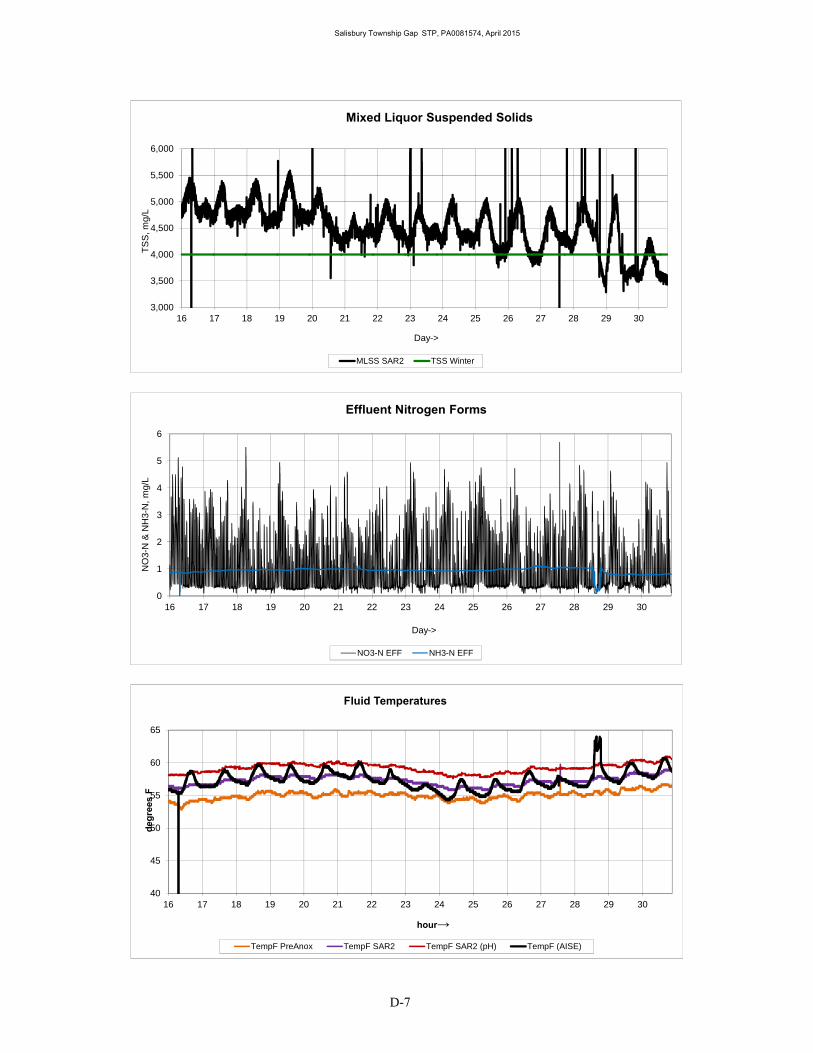
The following histograms are representative of the in-line probe output from the DEP’s data acquisition system. The technology employed consists of the monitoring features of a Supervisory Control and Data Acquisition (SCADA) system similar to that specified by Aqua-Aerobics when the Aqua-Pass technology was engineered.
The following first page of histograms display probe output for April 13, 2015. Following the daily histograms is a tabulation of March 2015 Flow and Effluent loading
data, combined with histograms and trend charts. The subsequent pages of histograms display the month-long collation of data during April
2015 and are useful for observing trends.
One item that comes to attention is the histogram showing MLSS for early April: The recording is spikey and indistinct. The recorded numbers were generally in the high 5000 mg/L range; however there were significant number of spikes into territory that does not make sense until one corroborates it with the evidence of excessive rags and detritus becoming caught in the probe’s self-cleaning mechanism, causing excessively high readings.
The Hach TSS probes installed as part of the original Aqua Aerobics SCADA package have all failed and become irreparably damaged due to this accumulation of comminuted detritus in the process reactors. The experience speaks to the need for a better method of managing rags and detritus in the Salisbury Township Gap STP. A proper headworks screening system would virtually negate this downstream damage to parts of the treatment system, and the probes that may replace these damaged ones will still require regular maintenance once installed.
Other trends that are observable in these histograms include process pH remaining below the ideal range for denitrification most of the time. This speaks to the issue of insufficient alkalinity to buffer against the formation of acid during biological nitrification. The micro-organisms that nitrify and denitrify the wastewater are more restricted in the range of pH they tolerate. In this case, pH below the ideal range of 6.8 to 7.5 s.u. speaks to the need for automated delivery of alkalinity, in the form of a metered slurry or as a liquid buffer, such as magnesium hydroxide suspension.
Oxidation / Reduction Probes are quite useful in optimizing BNR processes, because the electric potential of the biomass after dissolved oxygen concentration has fallen to zero allows the operator to determine whether or not truly anoxic conditions exist. The reading is also a barrier against operating the anoxic process under anaerobic conditions, where denitrification is supplanted by reduction of sulfides, production of alcohols, and formation of odor-producing chemicals. The charts showing ORP trends indicate that the anoxic zone tended to maintain good conditions for denitrification, while those in the SAR tended to be on the low end of ideal for nitrification.
Salisbury Township Gap STP Wastewater Treatment Evaluation April 13, 2015
0
1,000
2,000
3,000
4,000
5,000
6,000
7,000
0 1 2 3 4 5 6 7 8 9 10 11 12 13 14 15 16 17 18 19 20 21 22 23
ML
SS
, m
g/L
hour→
Mixed Liquor Suspended Solids
MLSS SAR2 Winter MLSS
0.0
2.0
4.0
6.0
8.0
10.0
12.0
0 1 2 3 4 5 6 7 8 9 10 11 12 13 14 15 16 17 18 19 20 21 22 23
nit
rate
or
am
mo
nia
-nit
rog
en
, m
g/L
hour→
Effluent Nitrogen Forms
NO3-N EFF NH3-N EFF
50
51
52
53
54
55
56
57
58
59
60
0 1 2 3 4 5 6 7 8 9 10 11 12 13 14 15 16 17 18 19 20 21 22 23
de
gre
es
F
hour→
Fluid Temperatures
TempF PreAnox TempF SAR2 (pH) TempF (AISE)
0.0
1.0
2.0
3.0
4.0
5.0
6.0
0 1 2 3 4 5 6 7 8 9 10 11 12 13 14 15 16 17 18 19 20 21 22 23
DO
, mg
/L
hour→
Dissolved Oxygen Histogram
DO SAR2 Low DO High DO
6.0
6.5
7.0
7.5
8.0
8.5
0 1 2 3 4 5 6 7 8 9 10 11 12 13 14 15 16 17 18 19 20 21 22 23
pH
, s.u
.
hour→
pH Histogram
pH SAR2 Low pH High pH
-200
-150
-100
-50
0
50
100
150
200
0 1 2 3 4 5 6 7 8 9 10 11 12 13 14 15 16 17 18 19 20 21 22 23
OR
P, +
/-m
V
hour→
Oxidation / Reduction Potential
ORP PreAnox ORP SAR2 ORP anaerobic below ORP aerobic above
D-2
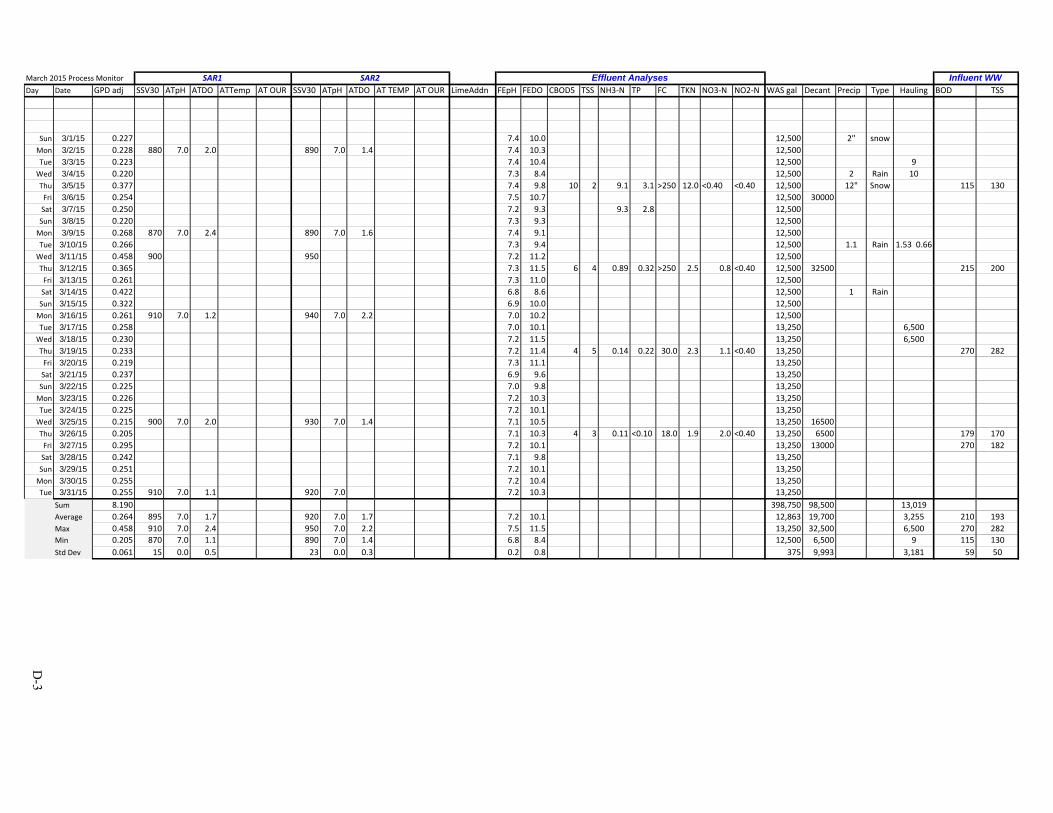
March 2015 Process Monitor
Day Date GPD adj SSV30 ATpH ATDO ATTemp AT OUR SSV30 ATpH ATDO AT TEMP AT OUR LimeAddn FEpH FEDO CBOD5 TSS NH3‐N TP FC TKN NO3‐N NO2‐N WAS gal Decant Precip Type Hauling BOD TSS
Sun 3/1/15 0.227 7.4 10.0 12,500 2" snow
Mon 3/2/15 0.228 880 7.0 2.0 890 7.0 1.4 7.4 10.3 12,500
Tue 3/3/15 0.223 7.4 10.4 12,500 9
Wed 3/4/15 0.220 7.3 8.4 12,500 2 Rain 10
Thu 3/5/15 0.377 7.4 9.8 10 2 9.1 3.1 >250 12.0 <0.40 <0.40 12,500 12" Snow 115 130
Fri 3/6/15 0.254 7.5 10.7 12,500 30000
Sat 3/7/15 0.250 7.2 9.3 9.3 2.8 12,500
Sun 3/8/15 0.220 7.3 9.3 12,500
Mon 3/9/15 0.268 870 7.0 2.4 890 7.0 1.6 7.4 9.1 12,500
Tue 3/10/15 0.266 7.3 9.4 12,500 1.1 Rain 1.53 0.66
Wed 3/11/15 0.458 900 950 7.2 11.2 12,500
Thu 3/12/15 0.365 7.3 11.5 6 4 0.89 0.32 >250 2.5 0.8 <0.40 12,500 32500 215 200
Fri 3/13/15 0.261 7.3 11.0 12,500
Sat 3/14/15 0.422 6.8 8.6 12,500 1 Rain
Sun 3/15/15 0.322 6.9 10.0 12,500
Mon 3/16/15 0.261 910 7.0 1.2 940 7.0 2.2 7.0 10.2 12,500
Tue 3/17/15 0.258 7.0 10.1 13,250 6,500
Wed 3/18/15 0.230 7.2 11.5 13,250 6,500
Thu 3/19/15 0.233 7.2 11.4 4 5 0.14 0.22 30.0 2.3 1.1 <0.40 13,250 270 282
Fri 3/20/15 0.219 7.3 11.1 13,250
Sat 3/21/15 0.237 6.9 9.6 13,250
Sun 3/22/15 0.225 7.0 9.8 13,250
Mon 3/23/15 0.226 7.2 10.3 13,250
Tue 3/24/15 0.225 7.2 10.1 13,250
Wed 3/25/15 0.215 900 7.0 2.0 930 7.0 1.4 7.1 10.5 13,250 16500
Thu 3/26/15 0.205 7.1 10.3 4 3 0.11 <0.10 18.0 1.9 2.0 <0.40 13,250 6500 179 170
Fri 3/27/15 0.295 7.2 10.1 13,250 13000 270 182
Sat 3/28/15 0.242 7.1 9.8 13,250
Sun 3/29/15 0.251 7.2 10.1 13,250
Mon 3/30/15 0.255 7.2 10.4 13,250
Tue 3/31/15 0.255 910 7.0 1.1 920 7.0 7.2 10.3 13,250
Sum 8.190 398,750 98,500 13,019
Average 0.264 895 7.0 1.7 920 7.0 1.7 7.2 10.1 12,863 19,700 3,255 210 193
Max 0.458 910 7.0 2.4 950 7.0 2.2 7.5 11.5 13,250 32,500 6,500 270 282
Min 0.205 870 7.0 1.1 890 7.0 1.4 6.8 8.4 12,500 6,500 9 115 130
Std Dev 0.061 15 0.0 0.5 23 0.0 0.3 0.2 0.8 375 9,993 3,181 59 50
Influent WWEffluent AnalysesSAR2SAR1
D-3
820
840
860
880
900
920
940
960
1 2 3 4 5 6 7 8 9 10 11 12 13 14 15 16 17 18 19 20 21 22 23 24 25 26 27 28 29 30 31
SSV, m
l/cc
Settled Sludge Volume at 30 minutes
SAR1 SSV30 SAR2 SSV30 Average Max Min
0.00
0.05
0.10
0.15
0.20
0.25
0.30
0.35
0.40
0.45
0.50
1 2 3 4 5 6 7 8 9 10 11 12 13 14 15 16 17 18 19 20 21 22 23 24 25 26 27 28 29 30 31
MGD
Effluent Flow Total per Day
Q Average Max Min
0.0
2.0
4.0
6.0
8.0
10.0
12.0
14.0
1 2 3 4 5 6 7 8 9 10 11 12 13 14 15 16 17 18 19 20 21 22 23 24 25 26 27 28 29 30 31
DO, m
g/L
Dissolved Oxygen ‐ Instantaneous Samples
ATDO FEDO Average Max Min
0.0
0.5
1.0
1.5
2.0
2.5
3.0
3.5
1 2 3 4 5 6 7 8 9 10 11 12 13 14 15 16 17 18 19 20 21 22 23 24 25 26 27 28 29 30 31
TP, m
g/L
Effluent Phosphorus
TP Average Max Min
0
50
100
150
200
250
300
3/5/15 3/12/15 3/19/15 3/26/15
Conc., m
g/L
Raw Wastewater BOD5 & TSS
BOD TSS
6.4
6.6
6.8
7.0
7.2
7.4
7.6
1 2 3 4 5 6 7 8 9 10 11 12 13 14 15 16 17 18 19 20 21 22 23 24 25 26 27 28 29 30 31
pH, s.u.
pH Tests, Instantaneous Sampling
ATpH FEpH Average Max Min
0.00
2.00
4.00
6.00
8.00
10.00
12.00
14.00
3/5/15 3/12/15 3/19/15 3/26/15
Conc., m
g/L
Effluent Nitrogen Species
NH3‐N TKN NO3‐N NO2‐N
12.0
12.2
12.4
12.6
12.8
13.0
13.2
13.4
1 2 3 4 5 6 7 8 9 10 11 12 13 14 15 16 17 18 19 20 21 22 23 24 25 26 27 28 29 30 31
WAS, gpd
Thousands
Wasting Interval in Gallons per Day
WAS gal Average Max Min
D-4
Salisbury Township Gap STP, PA0081574, April 2015
15-day Charts
3,000
3,500
4,000
4,500
5,000
5,500
6,000
6,500
7,000
01 02 03 04 05 06 07 08 09 10 11 12 13 14 15
TS
S, m
g/L
Day->
Mixed Liquor Suspended Solids
MLSS SAR2
0
1
2
3
4
5
6
7
8
01 02 03 04 05 06 07 08 09 10 11 12 13 14 15
NO
3-N
& N
H3-
N,
mg/
L
Day->
Effluent Nitrogen Forms
NO3-N EFF NH3-N EFF Ideal pH for BNR
40
42
44
46
48
50
52
54
56
58
60
01 02 03 04 05 06 07 08 09 10 11 12 13 14 15
deg
rees
F
hour→
Fluid Temperatures
TempF PreAnox TempF SAR2 TempF SAR2 (pH) TempF (AISE)
D-5

Salisbury Township Gap STP, PA0081574, April 2015
-250
-200
-150
-100
-50
0
50
100
150
200
250
01 02 03 04 05 06 07 08 09 10 11 12 13 14 15
OR
P, +
/-m
V
hour→
Oxidation / Reduction Potential
ORP PreAnox ORP SAR2 ORP Anaer ORP Aerobic
0.0
1.0
2.0
3.0
4.0
5.0
6.0
01 02 03 04 05 06 07 08 09 10 11 12 13 14 15
DO
, mg
/L
hour→
Dissolved Oxygen Histogram
DO SAR2 DO Effluent
5.0
5.5
6.0
6.5
7.0
7.5
8.0
8.5
9.0
9.5
01 02 03 04 05 06 07 08 09 10 11 12 13 14 15
pH
, s.
u.
hour→
pH Histogram
pH SAR2 pH Low pH High Ideal pH for BNR
D-6
Salisbury Township Gap STP, PA0081574, April 2015
3,000
3,500
4,000
4,500
5,000
5,500
6,000
16 17 18 19 20 21 22 23 24 25 26 27 28 29 30
TS
S, m
g/L
Day->
Mixed Liquor Suspended Solids
MLSS SAR2 TSS Winter
40
45
50
55
60
65
16 17 18 19 20 21 22 23 24 25 26 27 28 29 30
deg
rees
F
hour→
Fluid Temperatures
TempF PreAnox TempF SAR2 TempF SAR2 (pH) TempF (AISE)
0
1
2
3
4
5
6
16 17 18 19 20 21 22 23 24 25 26 27 28 29 30
NO
3-N
& N
H3-
N,
mg/
L
Day->
Effluent Nitrogen Forms
NO3-N EFF NH3-N EFF
D-7

Salisbury Township Gap STP, PA0081574, April 2015
-250
-200
-150
-100
-50
0
50
100
150
200
250
16 17 18 19 20 21 22 23 24 25 26 27 28 29 30
OR
P, +
/-m
V
hour→
Oxidation / Reduction Potential
ORP PreAnox ORP SAR2 ORP Anaer ORP Aerobic
0.0
1.0
2.0
3.0
4.0
5.0
6.0
7.0
16 17 18 19 20 21 22 23 24 25 26 27 28 29 30
DO
, mg
/L
hour→
Dissolved Oxygen Histogram
DO SAR2 DO Low DO High
5.0
5.5
6.0
6.5
7.0
7.5
8.0
8.5
9.0
9.5
16 17 18 19 20 21 22 23 24 25 26 27 28 29 30
pH
, s.
u.
hour→
pH Histogram
pH SAR2 pH Low
D-8
Department of Environmental Protection E-1 Bureau of Point and Non-Point Source Management
Salisbury Township WWTF at Gap Wastewater Treatment Evaluation
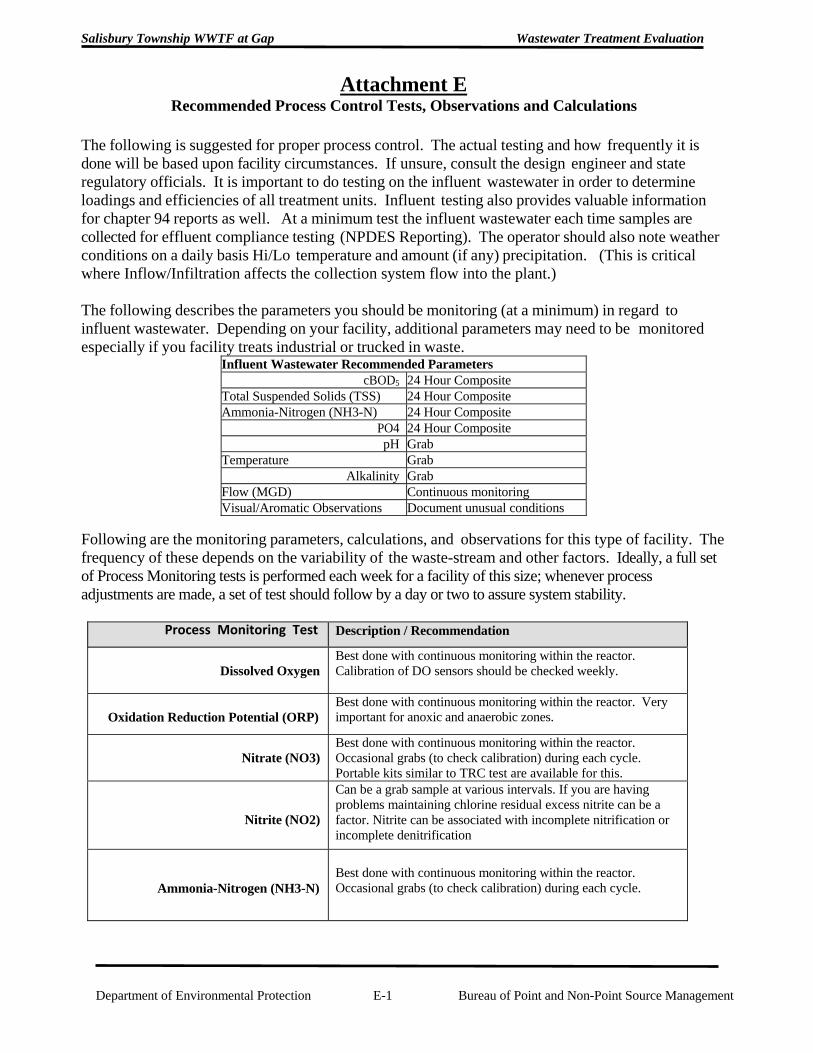
Attachment E Recommended Process Control Tests, Observations and Calculations
The following is suggested for proper process control. The actual testing and how frequently it is done will be based upon facility circumstances. If unsure, consult the design engineer and state regulatory officials. It is important to do testing on the influent wastewater in order to determine loadings and efficiencies of all treatment units. Influent testing also provides valuable information for chapter 94 reports as well. At a minimum test the influent wastewater each time samples are collected for effluent compliance testing (NPDES Reporting). The operator should also note weather conditions on a daily basis Hi/Lo temperature and amount (if any) precipitation. (This is critical where Inflow/Infiltration affects the collection system flow into the plant.) The following describes the parameters you should be monitoring (at a minimum) in regard to influent wastewater. Depending on your facility, additional parameters may need to be monitored especially if you facility treats industrial or trucked in waste.
Influent Wastewater Recommended Parameters cBOD5 24 Hour Composite
Total Suspended Solids (TSS) 24 Hour Composite Ammonia-Nitrogen (NH3-N) 24 Hour Composite
PO4 24 Hour Composite pH Grab
Temperature Grab Alkalinity Grab
Flow (MGD) Continuous monitoring Visual/Aromatic Observations Document unusual conditions
Following are the monitoring parameters, calculations, and observations for this type of facility. The frequency of these depends on the variability of the waste-stream and other factors. Ideally, a full set of Process Monitoring tests is performed each week for a facility of this size; whenever process adjustments are made, a set of test should follow by a day or two to assure system stability.
Process Monitoring Test Description / Recommendation
Dissolved Oxygen
Best done with continuous monitoring within the reactor. Calibration of DO sensors should be checked weekly.
Oxidation Reduction Potential (ORP)
Best done with continuous monitoring within the reactor. Very important for anoxic and anaerobic zones.
Nitrate (NO3)
Best done with continuous monitoring within the reactor. Occasional grabs (to check calibration) during each cycle. Portable kits similar to TRC test are available for this.
Nitrite (NO2)
Can be a grab sample at various intervals. If you are having problems maintaining chlorine residual excess nitrite can be a factor. Nitrite can be associated with incomplete nitrification or incomplete denitrification
Ammonia-Nitrogen (NH3-N)
Best done with continuous monitoring within the reactor. Occasional grabs (to check calibration) during each cycle.
Department of Environmental Protection E-2 Bureau of Point and Non-Point Source Management
Salisbury Township WWTF at Gap Wastewater Treatment Evaluation
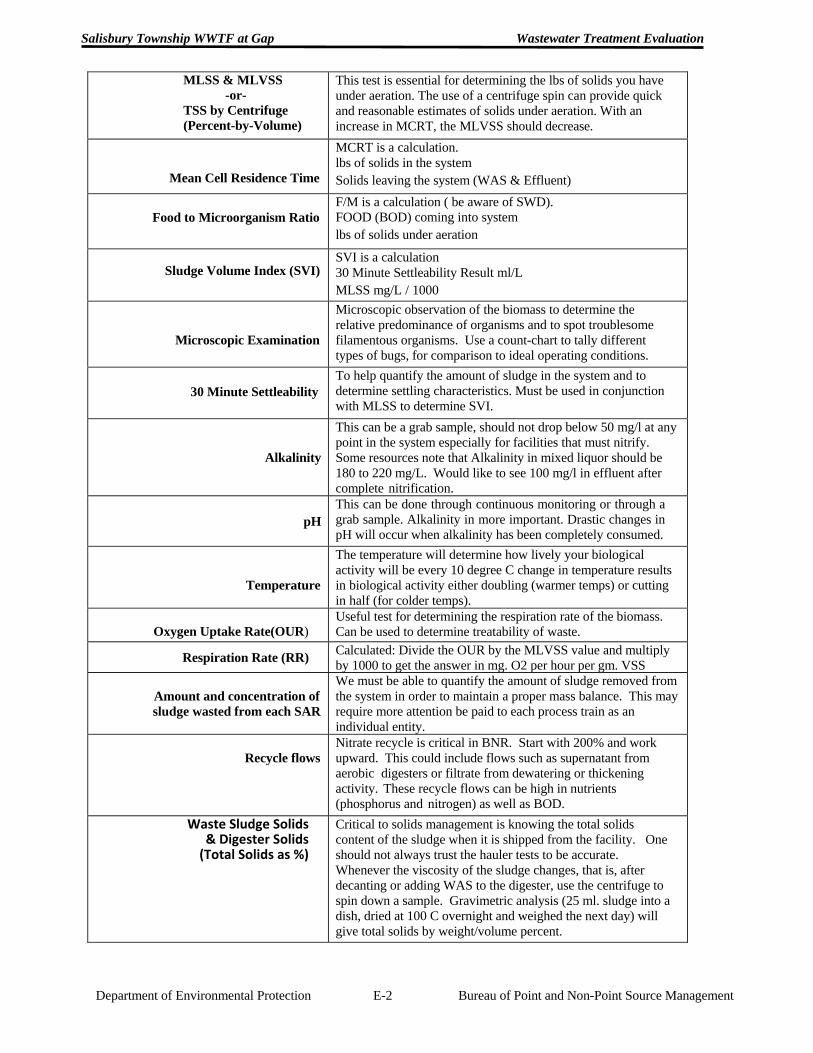
MLSS & MLVSS -or-
TSS by Centrifuge (Percent-by-Volume)
This test is essential for determining the lbs of solids you have under aeration. The use of a centrifuge spin can provide quick and reasonable estimates of solids under aeration. With an increase in MCRT, the MLVSS should decrease.
Mean Cell Residence Time
MCRT is a calculation. lbs of solids in the system Solids leaving the system (WAS & Effluent)
Food to Microorganism Ratio
F/M is a calculation ( be aware of SWD). FOOD (BOD) coming into system lbs of solids under aeration
Sludge Volume Index (SVI)
SVI is a calculation 30 Minute Settleability Result ml/L MLSS mg/L / 1000
Microscopic Examination
Microscopic observation of the biomass to determine the relative predominance of organisms and to spot troublesome filamentous organisms. Use a count-chart to tally different types of bugs, for comparison to ideal operating conditions.
30 Minute Settleability
To help quantify the amount of sludge in the system and to determine settling characteristics. Must be used in conjunction with MLSS to determine SVI.
Alkalinity
This can be a grab sample, should not drop below 50 mg/l at any point in the system especially for facilities that must nitrify. Some resources note that Alkalinity in mixed liquor should be 180 to 220 mg/L. Would like to see 100 mg/l in effluent after complete nitrification.
pH
This can be done through continuous monitoring or through a grab sample. Alkalinity in more important. Drastic changes in pH will occur when alkalinity has been completely consumed.
Temperature
The temperature will determine how lively your biological activity will be every 10 degree C change in temperature results in biological activity either doubling (warmer temps) or cutting in half (for colder temps).
Oxygen Uptake Rate(OUR)
Useful test for determining the respiration rate of the biomass. Can be used to determine treatability of waste.
Respiration Rate (RR) Calculated: Divide the OUR by the MLVSS value and multiply by 1000 to get the answer in mg. O2 per hour per gm. VSS
Amount and concentration of sludge wasted from each SAR
We must be able to quantify the amount of sludge removed from the system in order to maintain a proper mass balance. This may require more attention be paid to each process train as an individual entity.
Recycle flows
Nitrate recycle is critical in BNR. Start with 200% and work upward. This could include flows such as supernatant from aerobic digesters or filtrate from dewatering or thickening activity. These recycle flows can be high in nutrients (phosphorus and nitrogen) as well as BOD.
Waste Sludge Solids & Digester Solids (Total Solids as %)
Critical to solids management is knowing the total solids content of the sludge when it is shipped from the facility. One should not always trust the hauler tests to be accurate. Whenever the viscosity of the sludge changes, that is, after decanting or adding WAS to the digester, use the centrifuge to spin down a sample. Gravimetric analysis (25 ml. sludge into a dish, dried at 100 C overnight and weighed the next day) will give total solids by weight/volume percent.
Salisbury Township WWTF at Gap Wastewater Treatment Evaluation
Department of Environmental Protection F-1 Bureau of Point and Non-Point Source Management
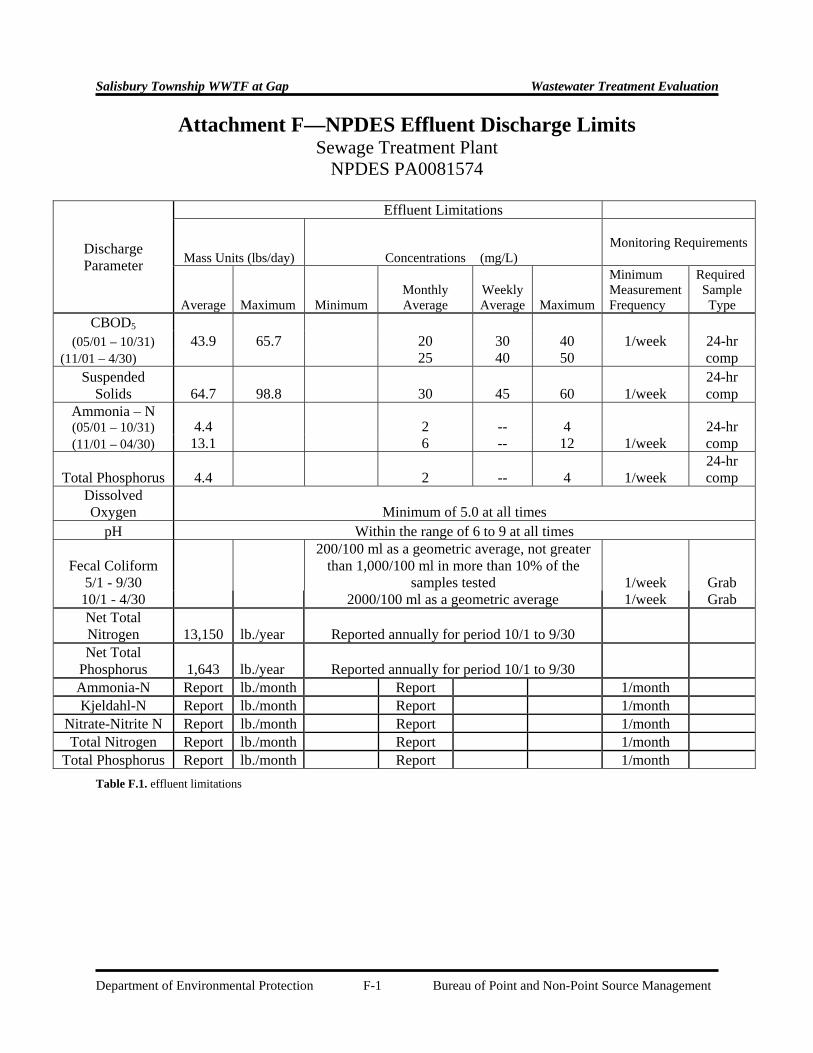
Attachment F—NPDES Effluent Discharge Limits Sewage Treatment Plant
NPDES PA0081574
Discharge Parameter
Effluent Limitations
Mass Units (lbs/day)
Concentrations (mg/L)
Monitoring Requirements
Average Maximum
Minimum
Monthly Average
Weekly Average Maximum
Minimum Measurement Frequency
Required Sample Type
CBOD5 (05/01 – 10/31) 43.9 65.7 20 30 40 1/week 24-hr
(11/01 – 4/30) 25 40 50 comp Suspended
Solids 64.7 98.8 30 45 60 1/week 24-hr comp
Ammonia – N (05/01 – 10/31) 4.4 2 -- 4 24-hr (11/01 – 04/30) 13.1 6 -- 12 1/week comp
Total Phosphorus 4.4 2 -- 4
1/week 24-hr comp
Dissolved Oxygen Minimum of 5.0 at all times
pH Within the range of 6 to 9 at all times
Fecal Coliform 5/1 - 9/30
200/100 ml as a geometric average, not greater than 1,000/100 ml in more than 10% of the
samples tested 1/week Grab 10/1 - 4/30 2000/100 ml as a geometric average 1/week Grab Net Total Nitrogen 13,150 lb./year Reported annually for period 10/1 to 9/30 Net Total
Phosphorus 1,643 lb./year Reported annually for period 10/1 to 9/30 Ammonia-N Report lb./month Report 1/month Kjeldahl-N Report lb./month Report 1/month
Nitrate-Nitrite N Report lb./month Report 1/month Total Nitrogen Report lb./month Report 1/month
Total Phosphorus Report lb./month Report 1/month
Table F.1. effluent limitations
Salisbury Township WWTF at Gap Wastewater Treatment Evaluation
Department of Environmental Protection G-1 Bureau of Point and Non-Point Source Management
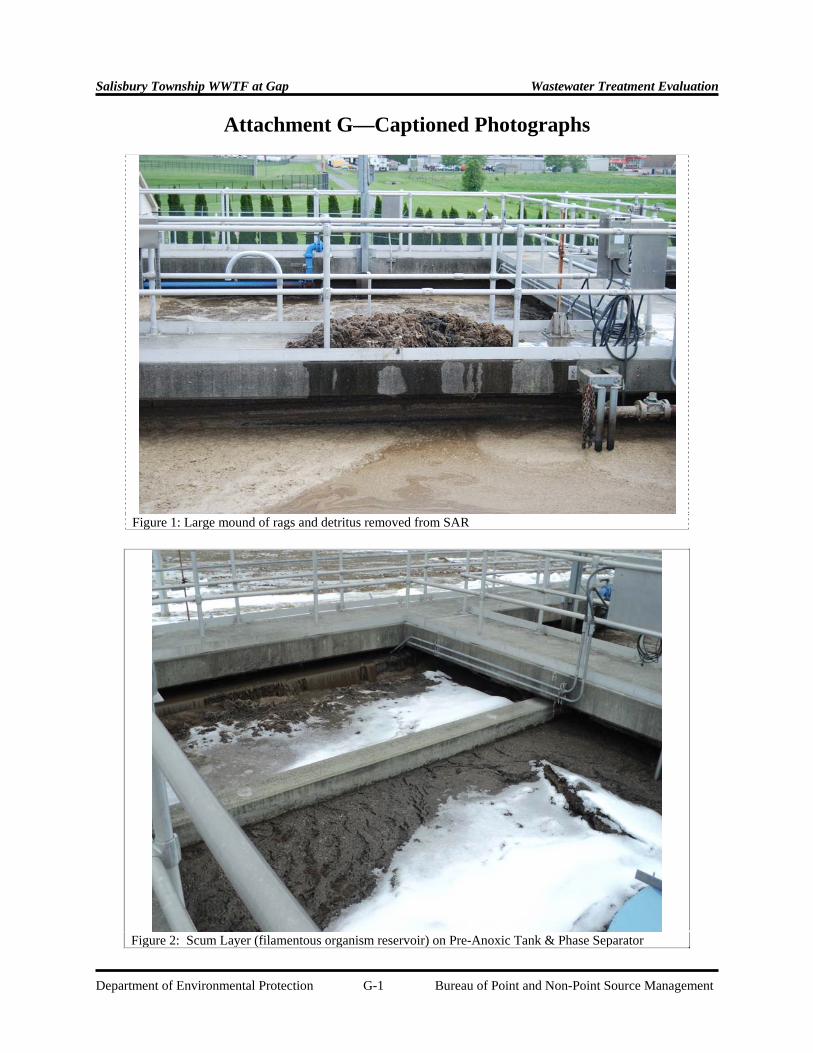
Attachment G—Captioned Photographs
Figure 1: Large mound of rags and detritus removed from SAR
Figure 2: Scum Layer (filamentous organism reservoir) on Pre-Anoxic Tank & Phase Separator

Salisbury Township WWTF at Gap Wastewater Treatment Evaluation
Department of Environmental Protection G-2 Bureau of Point and Non-Point Source Management
Figure 3: Probe Installation at Effluent Reaeration Tank: Nitrate, Ammonium, & DO Probes
Figure 4: Probe Installation at SAR: pH, TSS, DO, and ORP; Anoxic Tank: ORP
Salisbury Township WWTF at Gap Wastewater Treatment Evaluation
Department of Environmental Protection G-3 Bureau of Point and Non-Point Source Management
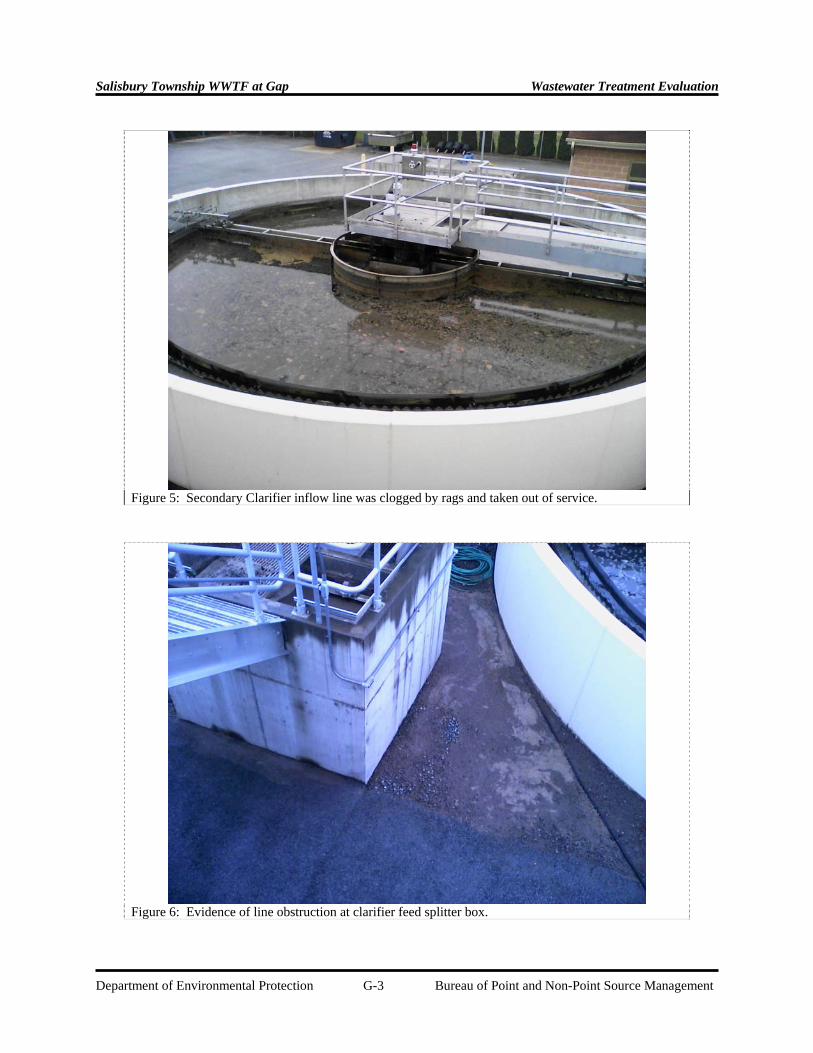
Figure 5: Secondary Clarifier inflow line was clogged by rags and taken out of service.
Figure 6: Evidence of line obstruction at clarifier feed splitter box.
Salisbury Township WWTF at Gap Wastewater Treatment Evaluation
Department of Environmental Protection G-4 Bureau of Point and Non-Point Source Management
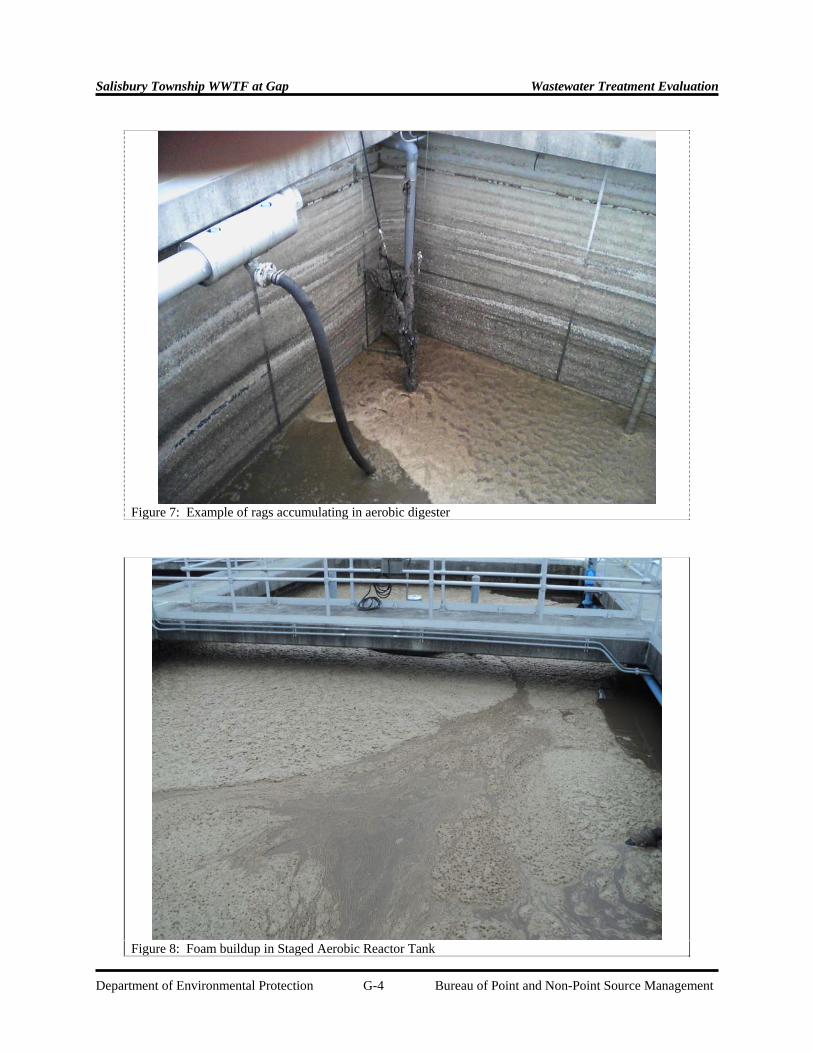
Figure 7: Example of rags accumulating in aerobic digester
Figure 8: Foam buildup in Staged Aerobic Reactor Tank

Salisbury Township WWTF at Gap Wastewater Treatment Evaluation
Department of Environmental Protection G-5 Bureau of Point and Non-Point Source Management
Figure 9: Outfall 001 at UNT Pequea Creek, running though township park.
Figure 10: Evidence of impacts of deteriorated effluent quality as seen in receiving stream.