Embed Size (px)
Citation preview

Field Evaluation of Virus Treatment Efficiency by Wastewater Soil Absorption Systems with
Aggregate-Free and Aggregate-Laden Infiltrative Surfaces
Final Report
Prepared By
Kathryn S. Lowe1 Sheila Van Cuyk2 Eric Dodson2 Robert L. Siegrist3
of
Environmental Science & Engineering Division Colorado School of Mines
112 Coolbaugh Hall Golden, Colorado 80401
for
Infiltrator Systems, Inc. Old Saybrook, Connecticut
__________________ 1 Senior Research Associate, Environmental Science & Engineering, Colorado School of Mines, Golden, CO
80401 Tel. 303-273-3685, Fax 303-273-3315, email: [email protected]
2 Graduate Research Assistant, Environmental Science & Engineering, Colorado School of Mines, Golden, CO 80401 3 Associate Professor, Environmental Science & Engineering, Colorado School of Mines, Golden, CO 80401

TABLE OF CONTENTS
Page
List of Figures ................................................................................................................................. ii List of Tables ................................................................................................................................. iii Acronyms and Abbreviations ........................................................................................................ iv Acknowledgments............................................................................................................................v 1.0 Executive Summary ................................................................................................................1 2.0 Introduction.............................................................................................................................2 2.1. Background.....................................................................................................................2 2.2. Goals, Objectives and Scope ..........................................................................................4 3.0 Technical Approach and Methods for Virus Treatment Efficiency .......................................6 3.1. Home Identification and Characteristics............................................................................6 3.2. Evaluation of WSAS Under Field Conditions ...................................................................7 3.2.1. Soil Characteristics ................................................................................................8 3.2.2. Wastewater Flow and Hydraulic Loading Rate .....................................................9 3.2.3. Septic Tank Effluent Sampling and Analysis ........................................................9 3.2.4. Multicomponent Surrogate/Tracer Addition .......................................................10 3.2.5. WSAS Soil Coring and Sampling........................................................................11 3.2.6. WSAS Soil Analysis ............................................................................................14 4.0 Virus Treatment Efficiency Results......................................................................................16 4.1. WSAS Characteristics...................................................................................................16 4.1.1. WSAS Age and HLR ...........................................................................................16 4.1.2. Septic Tank Effluent Composition.......................................................................17 4.1.3. WSAS Soil Characteristics ..................................................................................18 4.2. Multicomponent Surrogate/Tracer Results...................................................................21 4.3. Discussion.....................................................................................................................25 5.0 Conclusions...........................................................................................................................27 6.0 References.............................................................................................................................29 7.0 Appendix...............................................................................................................................33
WSAS Field Study Final Report, April 16, 2001 i

LIST OF FIGURES
No. Page
2.1. Illustration of an onsite wastewater soil absorption system typical of the 25 million systems in operation in the U.S. today.....................................................2 2.2. Illustration of hydraulic and purification processes operative in a wastewater soil absorption system..........................................................................................................2 3.1. Grain size distributions for soil samples collected from the infiltrative surface depths at study sites in two subdivisions monitored in Colorado........................................9 3.2. STE sample collection .......................................................................................................10 3.3. Illustration of the general field site monitoring locations..................................................12 3.4. The GeoProbeTM 54DT direct-push mobile rig .................................................................13 3.5. Hand excavation from ground surface to the top of a chamber system.............................13 3.6. Soil core collection using direct-push methods: a) locating the equipment at the site, b) advancing the dual-tube assembly, and c) retrieval of dual-tube assembly with sample .................................................................14 3.7. Soil sample preparation for analyses .................................................................................15 4.1. Water content in soil core samples by depth below the infiltrative surface ......................19 4.2. Nitrate- and ammonium-nitrogen in soil samples by depth below the infiltrative surface ........................................................................................................20 4.3. Fecal coliform data in soil samples from four home sites sampled during Phase 2 ..........20 4.4. Concentrations of the conservative bromide tracer and MS-2 and PRD-1 bacteriophages in the STE dosing tank over time..............................................................21 4.5. Phase 1 inactivation of MS-2 and PRD-1 in STE during incubation at 2°0C and 4°C .....22 4.6. Bromide, MS-2 and PRD-1 levels in soil core extracts collected during Phase 2, 7 to 9 days following addition of surrogates and tracer to the STE being applied............23 4.7 Estimated removal efficiency of MS-2 and PRD-1 bacteriophages with depth below the infiltrative surface at home site Id#s 10, 12, 14, and 16. ..................................24 A.1. Soil core locations at home site Id# 10 ..............................................................................34 A.2. Soil core locations at home site Id# 12 ..............................................................................34 A.3. Soil core locations at home site Id# 14 ..............................................................................35 A.4. Soil core locations at home site Id# 16 ..............................................................................35 A.5. Available phosphorus in soil core samples by depth below the infiltrative surface..........36 A.6. Organic matter in soil core samples by depth below the infiltrative surface.....................36
WSAS Field Study Final Report, April 16, 2001 ii

LIST OF TABLES
No. Page
3.1. Selected characteristics of onsite wastewater systems monitored in this study ..................7 4.1. Summary of system characteristics....................................................................................16 4.2. Descriptive statistics for STE composition........................................................................17 4.3. Comparison of STE composition from Phase 2 with literature values..............................18 4.4. Results of field studies of virus treatment in wastewater soil absorption systems............25 A.1. Characteristics of STE samples collected from site Id# 10 ...............................................37 A.2. Characteristics of STE samples collected from site Id# 12 ...............................................37 A.3. Characteristics of STE samples collected from site Id# 14 ...............................................38 A.4. Characteristics of STE samples collected from site Id# 16 ...............................................38 A.5. Summary of soil core data collected in Phase 2 ................................................................39 A.6. Bromide concentrations in the STE dosing tank with time ...............................................41 A.7. MS-2 concentrations in the STE dosing tank with time ....................................................41 A.8. PRD-1 concentrations in the STE dosing tank with time ..................................................41 A.9. Bromide and MS-2 and PRD-1 bacteriophages in soil with depth....................................42 A.10. Relationship of fecal coliforms and bacteriophage in soil core samples collected below the infiltrative surface .............................................................................................44 A.11. Estimated virus treatment efficiencies ...............................................................................45
WSAS Field Study Final Report, April 16, 2001 iii

ACRONYMS AND ABBREVIATIONS
AI.S. - area of the infiltrative surface Bkgd - background BOD5 - biochemical oxygen demand at 5-days cBOD5 - carbonaceous biochemical oxygen demand at 5-days CSM - Colorado School of Mines cfu - colony forming unit CV - coefficient of variation D - depth FC - fecal coliforms HLR - hydraulic loading rate ID - inner diameter Id# - identification number IS - infiltrative surface ISI - Infiltrator Systems, Inc. LTAR - long term acceptance rate MPI - minutes per inch MS-2 - bacteriophage that infects E. coli. ND - non detect Ne - effective porosity PBS - phosphate buffered saline solution PETG - poly ethylenterephthalate pfu - plaque forming unit PRD-1 - bacteriophage that infects Salmonella typhimurium SCS - Soil Conservation Service STE - septic tank effluent Q - flow rate Tr - travel time required USDA - U.S. Department of Agriculture WSAS - wastewater soil absorption system(s)
WSAS Field Study Final Report, April 16, 2001 iv

ACKNOWLEDGMENTS
A research program to characterize the hydraulic and purification performance of mature onsite wastewater systems (i.e., systems that have been in operation for more than one year), including systems with aggregate-free (chamber) and aggregate-laden (gravel) infiltrative surfaces is underway in the Environmental Science and Engineering Division at the Colorado School of Mines. A major element of this research program was completed in the Fall of 1999 which included Phase 1 field sampling and analysis of onsite wastewater treatment systems at 16 homes in Colorado and ancillary laboratory studies (Siegrist et al., 2000). This report describes the methods and results of a companion field study, Phase 2, completed in Colorado to evaluate the field performance of four wastewater soil absorption systems including both aggregate-free (chamber) and aggregate-laden (gravel) designs. This work was made possible by the contributions and support of several individuals and organizations. The work was sponsored by Infiltrator Systems, Inc. and ISI is acknowledged for their interest and support in advancing the state-of-knowledge regarding onsite wastewater system design and performance. This study would not have been possible without the participation and cooperation of the homeowners at the individual residences studied. In addition, the following individuals are recognized for their contributions and valuable support:
John Albert - Colorado School of Mines, Golden, CO Sandrine Delgin - Colorado School of Mines, Golden, CO Lucie MacCalister - Colorado School of Mines, Golden, CO Abigail Wren - Colorado School of Mines, Golden, CO Mark Mumby - MEM Consulting, Grand Junction, CO John Parsens - University of Wisconsin, Madison, WI
WSAS Field Study Final Report, April 16, 2001 v

1.0 EXECUTIVE SUMMARY
This report discusses a field study completed at the Colorado School of Mines (CSM) to characterize the hydraulic and purification performance of mature onsite wastewater systems (i.e., systems that have been in operation for more than one year), including systems with aggregate-free (chamber) and aggregate-laden (gravel) infiltrative surfaces. This work included Phase 1 field testing of 16 mature soil infiltration systems including one system for virus treatment efficiency in 1999 and Phase 2 field testing for system characterization and virus treatment efficiency at four mature soil infiltration systems in 2001. Phase 2 field testing was conducted at four individual home sites, from the pool of 16 homes monitored during Phase 1, located in Adams and Summit Counties, Colorado. The four sites included one aggregate-laden wastewater soil absorption system (WSAS) and three aggregate-free chamber WSAS. Results of the Phase 1 field study have been previously reported (Siegrist et al. 2000, Siegrist and Van Cuyk 2001). At four of the study sites, septic tank effluent (STE) was characterized, and three intact soil cores, two from within the infiltrative surface and one background location, were successfully acquired and the soil properties were characterized with depth. Effluent and soil core samples show constituent levels in the range of previously reported work. As expected, levels of nitrogen species and fecal coliform bacteria decreased with increased depth below the infiltrative surface. To evaluate virus treatment efficiency, a multicomponent mixture of viral surrogates (two bacteriophages, MS-2 and PRD-1) and a conservative tracer (bromide) were added to the STE before it was applied to the soil absorption system. Samples of the STE were collected every 2 to 3 days and characterized for the surrogate and tracer concentrations. Seven to nine days after introduction of the viral surrogates and tracer, coring of the subsurface beneath the infiltrative surface commenced. Soil cores were taken at three spatially separate locations and subsamples were collected at depths of 0-5, 10-15, 25-30 and 55-60 cm below the infiltrative surface. Extraction and analysis were conducted for bromide, MS-2, PRD-1, fecal coliform, nutrients (total nitrogen and total phosphorous), and water content. The methodology for using a multicomponent mixture of virus surrogates and a conservative tracer to assess virus purification in a wastewater soil absorption system developed during Phase 1 was successfully applied under field conditions at four additional sites in Phase 2. Bromide was detected in all but one soil core from within the infiltrative surface. Three-log reductions in the applied MS-2 and PRD-1 viral surrogate concentrations were achieved at 30 cm below the infiltrative surface. The results of this study suggest that aggregate-free systems in Colorado that are sized with 40 to 50% less gross infiltration area for a given design flow are providing equivalent environmental protection as the larger aggregate-laden systems. These field results are consistent with the results of intermediate-scale 3-D sand lysimeter studies (Van Cuyk et al. 1999, Siegrist et al. 1999, Van Cuyk et al. 2001) and Phase 1 field testing (Siegrist et al. 2000, Siegrist and Van Cuyk 2001) performed previously at CSM.
WSAS Field Study Final Report, April 16, 2001 1

2.0 INTRODUCTION
2.1. BACKGROUND Wastewater treatment for onsite and small community applications commonly relies on infiltration and percolation of primary effluent through soil to achieve purification prior to recharge to ground water (U.S. EPA 1978, 1980, 1997, Jenssen and Siegrist 1990, Crites and Tchobanoglous 1998) (Fig. 2.1). These wastewater soil absorption systems (WSAS) can achieve high purification efficiencies due to the complex interactions of hydraulic and purification processes (Fig. 2.2) (Schwagger and Boller 1997, Ausland 1998, McCray et al. 2000). Extensive and lengthy contact between wastewater constituents and the soil matrix and associated biofilms occurs during unsaturated flow achieved by daily loadings limited to a small fraction of the soil’s saturated hydraulic conductivity (Ksat) (e.g., <5 cm/d). In addition, a clogging zone evolves at the soil infiltrative surface (Fig. 2.1 and 2.2) which leads to reduced permeability and more uniform infiltration and a concomitant unsaturated flow almost regardless of hydraulic loading. Wastewater-induced clogging increases the soil biogeochemical activity and can enhance sorption, biotransformation and die-off/inactivation processes within the clogging zone itself or in the underlying unsaturated soil (Siegrist 1987, Siegrist et al. 1991, Ausland 1998, Van Cuyk et al. 1999, McCray et al. 2000). Clogging zone genesis has been described as a humification-like process and modeled as a function of the mass loading rates of wastewater suspended matter and bio-oxidizable substances (Siegrist 1987, Siegrist and Boyle 1987). In most WSAS, clogging zone genesis must occur to some degree to foster the advanced purification required before ground water recharge, but not to the point where it causes hydraulic problems.
Wastewater source
Pretreatment Effluent delivery
Infiltration area Clogging zone
Soil
Ground water
Well
Percolation
GW recharge
Fig. 2.1. Illustration of an onsite wastewater soil absorption system typical of the 25 million systems in operation in the U.S. today.
Percolate
Infiltrativesurface zonewith effective
permeability forinfiltration
Unsaturatedporous media
with permeabilityfor percolation
Flow with advectiveand diffusive transport,and purification by:
Straining and filtrationSorptionChemical reactionsBiotransformation Die-off and predationPlant uptake
Wastewater effluent
Ground water… to receptors... Fig. 2.2. Illustration of hydraulic and purification processes operative in a wastewater soil absorption system.
WSAS Field Study Final Report, April 16, 2001 2

If clogging zone development is retarded or absent altogether, for example due to the application of highly pretreated effluent (e.g., sand filter effluent), purification of pathogens and other constituents of concern may be less than predicted and desired. Conversely, if soil clogging is too excessive, for example due to application of high strength effluents (e.g., restaurant wastewater), clogging can be detrimental by causing hydraulic dysfunction and soil anaerobiosis and reduced purification (e.g., slower organic matter breakdown and reduced nitrification). System physical features, operational parameters, and environmental conditions can determine hydraulic and purification behaviors in wastewater infiltration systems. As briefly described below, the infiltrative surface character and the underlying unsaturated soil depth above a ground water table (i.e., vadose zone), are two system features that are commonly determined during design. The soil infiltrative surface is normally located below the original ground surface and commonly has a 15- to 30-cm thick layer of 2- to 4-cm diameter gravel placed on it to provide storage for peak wastewater flows and to support the overburden soils (Fig. 2.1). Performance data regarding the rate and extent of soil clogging in systems with gravel on the infiltrative surface (aggregate-laden) led to system designs that avoid the use of gravel aggregate (e.g., open chamber, fabric-wrapped piping, plastic media, fabric bundles). The most common type of system that provides an open or aggregate-free surface involves the use of chambers (Keys 1996, May 1996, Tyler et al. 1991). Gravel on an infiltrative surface can reduce infiltration zone permeability (or infiltrability) by (1) blocking pore entries, (2) becoming embedded in the soil matrix, (3) yielding fines that are deposited in pore entries, or (4) focusing wastewater constituents as a result of the reduced permeability due to the effects of (1)-(3) (Amerson et al., 1991, Caldwell Connell Engineers Pty 1986, Jenssen and Siegrist 1990, Siegrist 1987, Siegrist and Boyle 1987, Siegrist et al. 1991, Tyler and Converse 1994). Based on an equivalency concept with respect to infiltrability, aggregate-free systems are being utilized with design infiltration areas (i.e., gross total area provided) on the order of 40 to 50% less than required with aggregate-laden systems. While keeping the daily loading rate onto the effective infiltrative area the same (i.e., that surface not masked or impacted directly by gravel), the relative hydraulic loading rate (HLR) on the gross infiltration area is increased by 67 to 100%. While previous experience with aggregate-free systems has revealed satisfactory hydraulic performance (Dix and May 1997, England and Dix 1999, Hoxie et al. 1990, May 1996, Nodarse & Assoc., Inc. 1997, Ricklefs 1992, Saxton and Crumley 1993), until recently, comparatively less experimental data has existed regarding purification performance (Van Cuyk et al. 1999). The depth of the soil vadose zone to ground water can affect hydraulic function and in turn purification by influencing the soil water content, aeration status, media surface area, and hydraulic retention time. In the U.S., depths for soil infiltration systems range from 0.15 (South Carolina) to 1.5 m (Massachusetts) and for intermittent sand filters, from 0.6 and 0.9 m (US EPA 1980, Anderson et al. 1985, Crites and Tchobanoglous 1998, ISI 2001). While a high degree of treatment normally occurs in the infiltration zone as soil clogging develops, at higher HLRs and with nonuniform distribution methods, constituents of concern that would normally be treated may be transported through the vadose zone to ground water. For example, many studies have shown that a large percentage of bacteria remain near the infiltrative surface when effluents are applied to porous media (Brown et al. 1979, Kristiansen 1991, Huysman and Verstraete 1993,
WSAS Field Study Final Report, April 16, 2001 3

Emerick et al. 1997, Masson 1999, Stevik et al. 1999). However, if HLRs are too high or the dosing frequency is too low, some microbes can be transported to lower regions in a soil matrix, posing a purification concern in systems that are too shallow to ground water. Alternatively, while depth is important to hydraulic and purification behavior, at some point there is limited gain in purification by increasing vadose zone depth (Peeples et al. 1991). In Colorado, wastewater soil absorption systems (WSAS) are designed based on long-term acceptance rates (LTAR) and a design flow estimated at 225 gpd/bedroom (based on 75 gpcd * 2 per/bedroom* 150% peaking factor). The LTAR ranges are typical of those reported in the literature and used in other state codes (e.g., coarse to medium sand w/ 1-5 minute per inch (MPI) percolation test = 1.3 gpd/ft2, fine to loamy sand w/ 6-10 MPI = 1.2 gpd/ft2, sandy loam to loam w/ 11-20 MPI = 0.72 gpd/ft2, loam w/21-30 MPI = 0.50 gpd/ft2, silt loam to sandy clay loam w/ 31-40 MPI = 0.40 gpd/ft2, sandy clay loam w/ 41-60 MPI = 0.3 gpd/ft2, etc.). Thus, design application rates in Colorado are mostly in the range of 0.40 to 1.2 gpd/ft2. The required distance between the bottom of an infiltration trench or bed and high ground water is 4 ft. Regulations allow infiltration area to include sidewall area (below the distribution pipe) and bottom area. The State allows a 50% reduction in area with a “standard” Infiltrator chamber (12 in. high, 34 in. wide and with a 7 in invert height) compared to an aggregate-laden trench. When used in a bed configuration, the State of Colorado allows for a 40% area reduction using this “standard” Infiltrator chamber. In each case, the reduction is based on the actual open area of the chamber bottom.
2.2. GOALS, OBJECTIVES AND SCOPE Research was initiated in the Environmental Science & Engineering Division at the CSM to study the hydraulic and purification behavior of wastewater soil infiltration systems from start-up through initial clogging zone development and to quantify the effects of infiltrative surface character and vadose zone soil depth. The research effort is comprised of four primary efforts; (1) controlled laboratory experimentation with 3-dimensional lysimeters, (2) Phase 1 field testing of 16 mature soil infiltration systems including 1 system for virus treatment efficiency, (3) Phase 2 field testing of virus treatment efficiency at 4 mature soil infiltration systems, and (4) transport/fate and process modeling. The methods and results of the 3-D lysimeter studies are described in previous publications (e.g., Fischer 1999, Masson 1999, Van Cuyk et. al. 1999, Siegrist and Van Cuyk 2001, Van Cuyk et al. 2001). Results of these 3-D laboratory lysimeter studies completed in 1999 revealed that the performance of aggregate-free systems was comparable to aggregate-laden systems, even though the HLR of the aggregate-free system is 67% higher (i.e., 8.4 vs. 5.0 cm/day, respectively, based on gross horizontal area provided). For both system types, it was shown that a 60- to 90-cm depth to groundwater provided adequate depth of unsaturated media for purification of conventional pollutants (e.g., cBOD5, suspended solids, ammonia nitrogen) as well as bacteria and virus to occur. Two phases of field studies have been conducted. Phase 1, initiated in 1999 was designed to complement the lysimeter studies by focusing on infiltration of domestic STE in more mature
WSAS Field Study Final Report, April 16, 2001 4
soil absorption systems under field conditions (Siegrist et al. 2000, Siegrist and Van Cuyk 2001). In this study WSAS in Colorado that had been in operation for one year or longer were characterized through STE and soil sampling and analyses to gain insight into the comparative performance of aggregate-free (chamber) and aggregate-laden (gravel) infiltration systems. A total of 16 individual onsite wastewater systems were monitored including 10 chamber systems and 6 gravel systems. Data collected at each site included residence characteristics, system design features, STE composition, occurrence and depth of ponding of the soil infiltrative surface, and pollutant concentrations with depth below the infiltrative surface for parameters such as nutrients and fecal coliform bacteria. During Phase 1, a laboratory study was completed to determine the relationship between fecal coliform bacteria concentrations measured directly in percolating water versus analyses of bulk soil samples. Finally, virus treatment efficiency was evaluated using a multicomponent mixture of MS-2 and PRD-1 bacteriophages and a conservative bromide tracer. The results of these Phase 1 studies suggest that aggregate-free systems in Colorado that are sized with 40 to 50% less infiltration area for a given design flow are performing comparably to the larger aggregate-laden systems. These field results are consistent with the results of intermediate-scale sand lysimeter studies performed previously at CSM. Phase 2 field testing, described in this report, was initiated in Fall 2000 as a companion to Phase 1 to expand the evaluation of virus treatment efficiency from one chamber WSAS to a total of 5 WSAS. The purpose of this Phase 2 research is to evaluate and characterize the hydraulic and purification performance of mature onsite wastewater systems (i.e., systems that have been in operation for more than one year), including systems with aggregate-free (chamber) and aggregate-laden (gravel) infiltrative surfaces. As in Phase 1, virus treatment efficiency was evaluated using a multicomponent field tracer test including a conservative tracer (bromide) and two viral surrogates (MS-2 and PRD-1). Field testing was conducted at 4 individual home sites located in Brighton and Summit County in Colorado from the pool of 16 homes monitored during Phase 1. The four sites included one aggregate-laden WSAS and three aggregate-free (chamber) WSAS. Both water and soil samples were retrieved from the field with analysis completed in the CSM pilot laboratory and at an off-site laboratory (University of Wisconsin Soil and Plant Analysis Laboratory). This report describes the methods and results of the Phase 2 field work. Section 3 contains a description of the technical approach and methods while Section 4 summarizes the virus treatment study results. Section 5 presents the conclusions and recommendations derived from the work.
WSAS Field Study Final Report, April 16, 2001 5

3.0 TECHNICAL APPROACH AND METHODS FOR VIRUS TREATMENT EFFICIENCY
3.1. HOME IDENTIFICATION AND CHARACTERISTICS Study subdivisions in Colorado were identified during Phase 1 based on individual expressions of interest to collaborate with the CSM research team by county environmental health department staff as well as subdivision developers and homeowner’s associations. The two study areas identified included the Hamilton Creek subdivision in Summit County, Colorado and the Todd Creek Farms subdivision near Brighton in Adams County, Colorado. The Hamilton Creek subdivision is located approximately 60 miles west of Denver, near the town of Silverthorne and is at an elevation of ~9,000 feet. Todd Creek Farms subdivision, located 40 miles northeast of Denver, is at an elevation of ~5,000 feet. Initially working with the environmental health departments in Summit County and Tri-County, Colorado, individual homes within each of the two study subdivisions were identified by letters of invitation to participate and by support from key subdivision persons (e.g., president of homeowners association). Homeowner questionnaires were used to gather information regarding (1) dwelling occupancy and water using and waste generating fixtures and (2) general soil absorption system design features. General screening criteria were established so the study would include individual wastewater systems that were: designed and installed according to modern practice; between 1 and 10 years old; and loaded at >25 to 50% of the design flow capacity. Detailed information regarding the onsite system site evaluation, design, and installation was gathered from county records, as-built construction drawings and interviews with homeowners, as well as field observations. From this, a pool of 16 systems was identified that had been in operation for periods of 1 to 5 years or longer and included both aggregate-free Infiltrator chamber systems and aggregate-laden gravel systems (Siegrist et al. 2000 Siegrist and Van Cuyk 2001). In order to build off of the information obtained during Phase 1 field testing, and to ensure that the systems evaluated in both studies were comparable, a letter of invitation to participate in Phase 2 was mailed to each of the 16 Phase 1 participants. From these 16 systems, a total of 7 responses (3 aggregate-laden and 4 aggregate-free) to the invitation were received including 6 interested in participating and 1 no longer interested in participating (homeowners had moved). Final selection for participation in Phase 2 was based on maturity of the onsite system, exhibited STE ponding of the infiltrative surface, and sites providing easy access to the septic tank and chamber soil absorption system to facilitate the required sampling activities. Based on these selection criteria and to ensure evaluation of both aggregate-laden and aggregate-free Infiltrator chamber systems, 1 aggregate-laden gravel system from Hamilton Creek and 3 aggregate-free Infiltrator chamber systems from the Todd Creek Farms subdivision were selected for study during Phase 2. It should be noted that of the three aggregate-laden systems interested in participating, one system was ponded above the gravel layer and one system could not be located by the field team due to rocky, frozen soil covering the system. “New” systems (i.e., systems other than those from the initial pool of 16 homes) were not pursued at this time in order to build off of the previous information gained (i.e., characterization and monitoring completed during
WSAS Field Study Final Report, April 16, 2001 6

Phase 1). At the 4 homes selected for inclusion in Phase 2, an initial site inspection was conducted, 4 STE samples were collected, multicomponent surrogate/tracer mixture was added to the system, and at least 3 soil cores (2 locations from within the infiltrative surface and one background location) were collected 7 to 9 days following surrogate/tracer addition. All of the onsite systems included septic tank pretreatment with a dosed (but not uniform, pressure distribution) application of STE to WSAS trenches or narrow beds. Design practice in both Summit County and Adams County allows for 40 to 50% reduction in infiltrative surface of aggregate-free systems compared to aggregate-laden system, however; sizing of individual systems relies on subsurface soil infiltration rates. Some characteristics of the homes and their onsite systems are summarized in Table 3.1. General schematics of each home site are presented in Figs. A.1 through A.4. Table 3.1. Selected characteristics of onsite wastewater systems monitored in this study.
Home site1
Id# Res. size (BR)
Water use
(gal/mon)
Date of system installa-
tion
I.S. type
Effective Area of I.S.
(ft2)
Est. HLR2
(gpd/ft2)
Est. HLR2
(cm/day)
Ponded
2 (P1) 3 7785 1991 Chamber 354 0.73 2.99 Yes 10 (P2) 4 5350 1992 Gravel 864 0.21 0.84 Yes
12* (P2) 3 7550 1997 Chamber 918 0.28 1.16 Yes 14* (P2) 4 50923 1997 Chamber 1140 0.15 0.61 No (wet) 16* (P2) 3 9880 1998 Chamber 656 0.53 2.16 Yes P1 = Phase 1, completed in 1999. P2 = Phase 2, completed in 2001. 1 Homes identified and evaluated during Phase 1. * denotes homes located in Adams County. 2 HLR = flow (gpd)/area of effective infiltrative surface (ft2) where 1 cm/d = 0.24 gpd/ft2. 3 Range based on differing values reported on the as-built drawings and permit. 3.2. EVALUATION OF WSAS UNDER FIELD CONDITIONS During Phase 1, one system, from the pool of 16 WSAS monitored, was chosen for field-scale evaluation of virus treatment efficiency using a multicomponent surrogate and tracer methodology. This effort was viewed as experimental and as a means to refine methodology employed during controlled laboratory experiments (Van Cuyk et al. 2001) and apply it under field conditions to a mature operating WSAS. Conservative tracers and viral surrogates had been used previously in studying flow and transport in ground water systems (both native bacteriophage and spiked phage) (Harvey 1997a, 1997b) and appeared quite suitable for evaluation of WSAS under field conditions. However, multicomponent surrogates and tracers had received relatively limited use for evaluation of WSAS under field conditions. Field studies reported in the literature included studies in Florida with virus surrogate spiking of a research site near Tampa by Anderson et al. (1991, 1994) and spiking of cesspools near the Florida Keys by Rose et al. (1999). Field studies completed in California by Oakely et al. (1999) and in Massachusetts by Higgins et al. (1999) relied on indigenous bacteriophage. Most of these studies (all but the study by Anderson et al. (1994)) did not employ multicomponent mixtures containing a conservative tracer plus two contrasting viral surrogates. During Phase 1, the methodology utilizing a multicomponent mixture of virus surrogates and a conservative tracer
WSAS Field Study Final Report, April 16, 2001 7

was successfully applied under field conditions with the results reported elsewhere (Siegrist et al. 2000, Siegrist and Van Cuyk 2001 Van Cuyk et al. 2001). In this Phase 2 study, methods similar to those used during Phase 1 were employed to confirm that four additional mature WSAS, including both Infiltrator chambers with a typical reduced infiltrative surface area and aggregate-laden systems, can remove virus such that the concentrations are reduced by > 3 logs between the infiltrative surface and 60 cm depth below the infiltrative surface. Two viral surrogates (MS-2 and PRD-1 bacteriophage) and a conservative tracer were added to the STE being applied to a soil absorption system at four sites. Then after 7 to 9 days, during which application of STE and the surrogates/tracer continued, soil cores were collected from the infiltrative surface vertically downward to 60 cm depth below the infiltrative surface. From each core, soil samples were aseptically collected and analyzed to quantify the concentrations of the viral surrogates and tracer as well as the soil water content, organic matter, nutrients, and fecal coliform concentrations. 3.2.1 Soil Characteristics General soil characteristics for the two subdivision locations were initially assessed from the U. S. Department of Agriculture (USDA) Soil Conservation Survey (SCS) reports (USDA 1974, 1977). Soils in the Hamilton Creek subdivision near Silverthorne were reported to consist of Anvik and Frisco soils (mixed Boralfic and mixed Typic Cryoborolls) of deep, well drained material formed in colluvium and glacial drift derived from a variety of rocks (USDA 1977). These soils are on mountainous uplands that have slopes of 6-35%. The typical soil profile includes a brown loam surface layer (0-15 in., 0-38 cm) with a subsoil of clay loam (15-20 in., 38-51 cm). The depth to bedrock is >5 ft. (1.5 m) and depth to high ground water is > 6 ft. (1.8 m). Rock fragments (10-24 in. (25-60 cm) diameter) make up 30-80% of the solum. Soils in the Todd Creek Farms subdivision near Brighton consist of nearly level to strongly sloping, well drained Platner and Ulm loams (fine, montmorillonitic mesic soils) (USDA 1974). The typical soil profile includes a heavy loam surface layer (0-7 in., 0-18 cm), with a subsoil of silty clay (7-13 in., 18-33 cm) and a substratum of clay (13-22 in., 33-56 cm). It is listed by SCS as having slow permeability and an average depth to bedrock of 40 to 60 in. (1-1.5 m). Soil characteristics specific to this study were determined from soil samples collected from the pool of 16 WSAS during Phase 1 at depths below the infiltrative surface. Analysis performed at CSM for grain size distribution revealed a coarse-grained soil texture which included considerable pebble and cobble fractions. As shown in Fig. 3.1, the grain size analyses revealed 35 wt.% gravel, 55 wt.% sand, and <10 wt.% of the soil in the silt and clay fraction (i.e., wt.% passing through a no. 200 sieve which is 0.074 mm diameter).
WSAS Field Study Final Report, April 16, 2001 8

0
10
20
30
40
50
60
70
0.01 0.1 1 10 Grain size (mm)
Hamilton Creek
Todd Creek
% Finer by wt.
Fig. 3.1. Grain size distributions for soil samples collected from the infiltrative surface depths
at study sites in two subdivisions monitored in Colorado. 3.2.2 Wastewater Flow and Hydraulic Loading Rate Water use data were collected during Phase 1 via water use records and/or periodic readings of water meters at each home. The water use data were assumed to be representative of wastewater flow. The flow data were used along with the WSAS area determined from the as-built plans to calculate the estimated HLR in gpd/ft2 that each WSAS was actually receiving (see Table 3.1). Water use data was not obtained at one location (home site Id# 14) as a community well serves several homes in the area and data specific to the home of interest was not available. 3.2.3 Septic Tank Effluent Sampling and Analysis Septic tank effluent sampling and analysis during Phase 1 has been previously reported (Siegrist et al. 2000). During Phase 2, STE was collected from within the last compartment of the septic tank (all septic tanks were either 2- or 3-chamber tanks). Duplicate grab samples were taken and placed in sterile polypropylene bottles and stored at 4°C until brought to the laboratory for analysis (Fig. 3.2). Two rounds of STE samples were collected from each site prior to surrogate/tracer addition. All laboratory analysis of the STE were performed within 24 hours of sample collection. The following characteristics of the STE were determined following standard methods (APHA 1998).
o pH was measured electrometrically. o Alkalinity was measured (total alkalinity) via titration with sulfuric acid according to
APHA method 2320B. o cBOD5 (carbonaceous biochemical oxygen demand) was measured according to APHA
method 5210B.
WSAS Field Study Final Report, April 16, 2001 9

o COD analysis was performed using a Hach reactor digestion, colorimetric method (Hach 1992, U.S. EPA-approved).
o Total solids and total suspended solids were measured according to APHA methods 2540B and 2540D.
o Total nitrogen (TN) was measured by persulfate digestion, nitrate nitrogen by chromotropic acid method and ammonium by salicylate method (Hach 1992, U.S. EPA-approved).
o Total phosphorus (TP) was measured according to EPA acid persulfate method (U.S. EPA 365.2).
o Fecal coliform analysis was performed by membrane filtration according to APHA method 9222D.
Fig. 3.2 STE sample collection. 3.2.4 Multicomponent Surrogate/Tracer Addition The multicomponent mixture was comprised of two viral surrogates, MS-2 and PRD-1 bacteriophages (not infectious to humans) (Van Duin 1988), in addition to the conservative tracer, bromide. MS-2 and PRD-1 had been previously used as viral surrogates in ground water transport studies (Harvey 1997a,b) as well as Phase 1 (Siegrist et al. 2000, Van Cuyk et al. 2001). MS-2 is an icosahedral phage with a diameter of 26 nm (VanDuin 1988) and a pHiep of 3.9 (Bales et al. 1991) while PRD-1 is an icosahedral lipid phage with a diameter of 62 nm (Olsen et al. 1974). The volume of wastewater within the last compartment of the septic tank at each study site was estimated based on as-built drawings and other homeowner records. Prior to the addition of the surrogate/tracer mixture, STE samples, in triplicate, were collected to quantify pretreatment levels of bromide, MS-2 and PRD-1. All samples were analyzed in duplicate. Surrogates or tracer were not detected in the STE with the exception of one sample at 1 pfu-MS-2/mL. Stock solutions of bromide (added as KBr), MS-2 and PRD-1 were added to the last compartment in the septic tank to obtain final concentrations targeted at 1500 mg-Br/L of bromide and 1.0 × 10⁷ pfu/mL of both MS-2 and PRD-1. The bacteriophage concentrations were selected to be
WSAS Field Study Final Report, April 16, 2001 10

representative of those in STE during or soon after a viral infection within the household and enable detection in the soil. Following surrogate/tracer addition to the STE, the tank was mixed using a submersible pump which recirculated STE within the compartment for approximately 10 minutes. After this period of mixing, five (5) grab samples of the STE, amended with the surrogates and tracer, were collected to characterize the time zero conditions. Subsequently, STE samples were collected from the dosing tank every 2 to 3 days in order to characterize the concentrations of surrogates and tracers being dosed into the soil infiltration system over time. An estimate of the time required for effluent to infiltrate and percolate to a depth of 60 cm was made based on the daily flow, area of infiltrative surface, and an effective porosity for the soil based on the following relationship:
Tr =
AI.S.( ) D( ) Ne( )Q
[3.1]
where, Tr = travel time required for effluent to reach the depth of interest (days), D = depth of interest (m), AI.S. = infiltrative surface area (m2), Q = daily flow (m3/day), and Ne = effective porosity (v/v). This relationship assumes uniform application and infiltration into the absorption system and is thus a first approximation of travel times. For the Phase 2 study sites, the AI.S. was determined from the as-built drawings (see Table 3.1), the depth of interest to evaluate was 0.60 m, the average daily flow was 0.9 m3/d, and the effective porosity was estimated at 0.20 v/v. For these conditions, the time required for applied effluent to percolate to 60 cm depth below the infiltrative surface was estimated at 5.5 to 20 days. However, Phase 1 results indicated that these travel times were conservative as indicated by the presence of detectable bacteriophage in the soil but not bromide. It was assumed that the bromide had either passed through the system during the time between tracer addition to the tank and coring (26 days) or to have been applied at too low of a concentration (i.e., 500 mg-Br/L) to be detected within the soil pore water. Building off of these Phase 1 observations, a higher concentration of bromide (1500 mg-Br/L) was initially added to the tank and coring commenced ~ 1 week following surrogate/tracer addition. During this time between surrogate/tracer addition and soil coring, samples were collected from the STE being applied to the WSAS to identify changes in concentrations over time. 3.2.5 WSAS Soil Coring and Sampling Soil coring, sampling and analysis of the WSAS at 15 of 16 sites was completed during Phase 1 and has been reported previously (Siegrist et al. 2000). Soil coring, sampling and analysis was not completed at one site due to ponding above the gravel surface at the time of the field investigation. This site was not included in Phase 2. During Phase 2, the WSAS were probed at two spatially separate locations within the infiltration systems and at one background location using dual-tube sampling methods 7 to 9 days after introduction of the surrogate/tracer (Fig. 3.3). At three locations (home site Id#s 10, 12, and 14)
WSAS Field Study Final Report, April 16, 2001 11

the GeoProbeTM 54DT, a small gas powered direct-push probing machine, was used to collect soil cores (Fig. 3.4). At the forth location (home site Id# 16) soil cores were collected using hand methods similar to those used during Phase 1. For the chamber systems, the soil above the chamber was hand excavated and an access hole was cut into the top of the chamber for access to the infiltrative surface (Fig. 3.5). For the gravel system, a continuous soil core was collected from the ground surface to 60 cm below the infiltrative surface using the GeoProbeTM 54DT. Schematics of core locations at each site are presented in Appendix A (Fig. A-1 through A-4).
Gravel-laden trench or Gravel-free Chamber
Distribution pipingSeptic tank
(a) Plan view
(b) Profile view
S S
~~~ Undisturbed native soil ~~~
Infiltration surface
Gravel trench or Chamber
Intact continuous core samples from the I.S. to 60-cm depth
Incipient or permanent ponding
Access portsSeptic tank
Wastewater effluent samples
S = sample
Single-family home
Water meter
Bkg S
S
Fig. 3.3. Illustration of the general field site monitoring location. Direct-push soil core collection with the GeoProbeTM 54DT utilized the GeoProbe/Terraprobe sampling method (Fig 3.6). A 4-ft.-long x 2-in.-inner diameter (ID) (1.2 m x 5 cm) dual-tube assembly with polyethylenterephthalate (PETG) liners was used to collect continuous
WSAS Field Study Final Report, April 16, 2001 12

undisturbed samples from the ground surface to 24 in. (60 cm) below the infiltrative surface. The dual-tube assembly is comprised of an outer stainless steel core barrel (3.25-in ID [8 cm]), an inner stainless steel core barrel (2.25-in ID [6 cm]) and PETG liners (2-in ID [5 cm]) inserted into the inner core barrel. The dual-tube assembly is hammered, without rotation, ~3.5 ft (1 m) into the ground surface. The inner core barrel with PETG sleeve and soil core is then retrieved to the surface. Upon retrieval to the surface, the PETG liner with the intact soil core was removed from the sampler, capped and stored at 4°C prior to transporting to the CSM laboratory for analyses. A clean PETG sleeve was then replaced into the inner core barrel and reinserted into the outer core barrel retained in the subsurface. The dual-tube assembly was then again advanced ~3.5 ft (1 m) and the process repeated until a continuous core to the desired depth was obtained. Hand sample collection methods consisted of hand excavating to the top of the chamber, cutting a hole in the top of the chamber and inserting a 4-in. (10 cm) ID PVC plastic pipe to case the hand excavated hole and prevent ponded fluid from entering the corehole. Care was taken upon encountering the soil infiltrative surface to avoid unnecessary disruption of the surface soil and any clogging layer. The ponded fluid was sampled and pumped with a peristaltic pump out of the center of the casing. Then, a thin-tube (1.75-in. ID [4.5 cm]) sampling probe with a precleaned acetate liner (6-in. long [15 cm]) was driven into the undisturbed soil and an intact core retrieved within the sleeve. The core was capped with foil, labeled, and placed in a cooler containing blue ice. The thin-tube push probe (after cleaning with 70% v/v ethanol in water followed by a deionized water rinse) was inserted into the probe hole and driven another depth interval (nominally 6 in. [15 cm]). This process was repeated until a depth of 24 in. (60 cm) was reached or cobbles and dense soil prevented further penetration. These soil core collection methods enabled relatively intact core samples to be aseptically collected from the WSAS infiltrative surface vertically downward to a depth of 60 cm below the infiltrative surface. The occurrence and magnitude of ponding within each system was manually determined. All samples were stored at 4°C until laboratory analysis was performed at CSM.
Fig. 3.4 The GeoProbeTM 54DT direct-push mobile rig. Fig. 3.5 Hand excavation from ground
WSAS Field Study Final Report, April 16, 2001 13

surface to top of a chamber system.
WSAS Field Study Final Report, April 16, 2001 14

(a) (b) (c) Fig. 3.6. Soil core collection using direct-push methods: a) locating the equipment at the site,
b) advancing the dual-tube assembly, and c) retrieval of dual-tube assembly with sample.
3.2.6 WSAS Soil Analysis Following soil core collection in the field, samples were transported to the CSM laboratory for analysis. In the laboratory, the cores were carefully opened and the outer-most soil media was removed and wasted (Fig. 3.7). Subsamples of the interior of the core were then taken with sterile utensils at 4 intervals (0-5 cm, 10-15 cm, 25-30 cm, and 55-60 cm below the infiltrative surface) that corresponded approximately to those used in the previous CSM laboratory lysimeter study and Phase 1 sampling (Van Cuyk et al. 1999, Siegrist et al. 2000). At each sample interval, soil sample extractions were performed for bromide, bacteriophage, and fecal coliform bacteria within 24 hours of sample collection. Laboratory analyses for water content was also performed within 24 hours of sample collection. After drying, soil samples were
WSAS Field Study Final Report, April 16, 2001 15
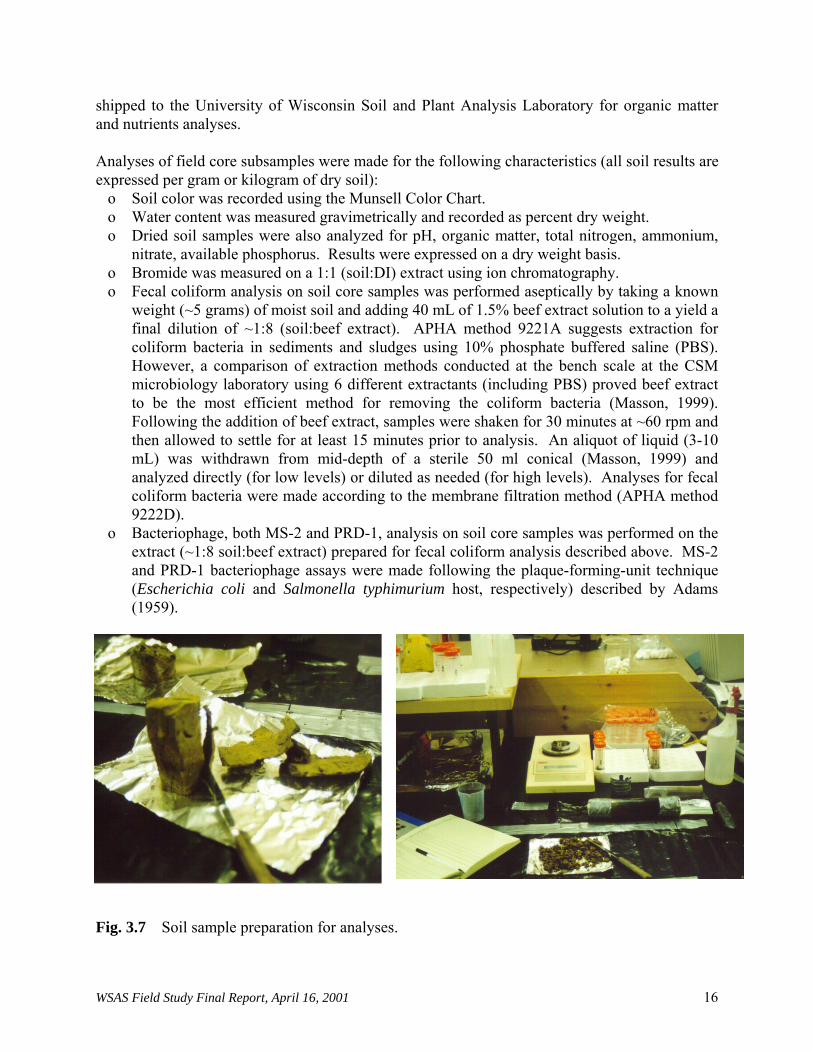
shipped to the University of Wisconsin Soil and Plant Analysis Laboratory for organic matter and nutrients analyses. Analyses of field core subsamples were made for the following characteristics (all soil results are expressed per gram or kilogram of dry soil):
o Soil color was recorded using the Munsell Color Chart. o Water content was measured gravimetrically and recorded as percent dry weight. o Dried soil samples were also analyzed for pH, organic matter, total nitrogen, ammonium,
nitrate, available phosphorus. Results were expressed on a dry weight basis. o Bromide was measured on a 1:1 (soil:DI) extract using ion chromatography. o Fecal coliform analysis on soil core samples was performed aseptically by taking a known
weight (~5 grams) of moist soil and adding 40 mL of 1.5% beef extract solution to a yield a final dilution of ~1:8 (soil:beef extract). APHA method 9221A suggests extraction for coliform bacteria in sediments and sludges using 10% phosphate buffered saline (PBS). However, a comparison of extraction methods conducted at the bench scale at the CSM microbiology laboratory using 6 different extractants (including PBS) proved beef extract to be the most efficient method for removing the coliform bacteria (Masson, 1999). Following the addition of beef extract, samples were shaken for 30 minutes at ~60 rpm and then allowed to settle for at least 15 minutes prior to analysis. An aliquot of liquid (3-10 mL) was withdrawn from mid-depth of a sterile 50 ml conical (Masson, 1999) and analyzed directly (for low levels) or diluted as needed (for high levels). Analyses for fecal coliform bacteria were made according to the membrane filtration method (APHA method 9222D).
o Bacteriophage, both MS-2 and PRD-1, analysis on soil core samples was performed on the extract (~1:8 soil:beef extract) prepared for fecal coliform analysis described above. MS-2 and PRD-1 bacteriophage assays were made following the plaque-forming-unit technique (Escherichia coli and Salmonella typhimurium host, respectively) described by Adams (1959).
Fig. 3.7 Soil sample preparation for analyses.
WSAS Field Study Final Report, April 16, 2001 16

4. VIRUS TREATMENT EFFICIENCY RESULTS 4.1. WSAS CHARACTERISTICS 4.1.1 WSAS Age and HLR A summary of the system characteristics is shown in Table 4.1. The chamber systems varied in age from 3 to 10 yr. while the gravel system was 9 yr. old. The estimated HLR averaged 1.73 cm/d for the chamber systems, including both Phase 1 and Phase 2, compared to 0.84 cm/d for the gravel system. During Phase 2, three of the four systems (home site Id#s 10, 12, and 16) exhibited some degree of effluent ponding while the fourth system (home site Id# 14) was wet with ponding observable in surface depressions. During soil coring (after surrogate/tracer addition) it was observed that one system (home site Id#16) was fully ponded. This system was not eliminated from consideration at this time due in part to schedule and reporting constraints (e.g., time required to identify an additional system, add surrogate/tracer to the STE, and allow sufficient time for migration of the surrogate/tracer into an through the infiltration area). It is also important to note that this system was designed as an infiltration/evapotransporation system, relying on a fraction of net loss of fluid from evapotransporation rather than percolation through the low permeable subsurface soils, and was sampled during the winter months when evapotransporation was at a minimum (i.e., dominant infiltration/negligible evapotransporation). Data from these four systems suggest comparable hydraulic performance with the chamber systems receiving a loading rate on average that was 106% higher (1.73 vs. 0.84 cm/d per unit of horizontal infiltrative surface area).
Table 4.1. Summary of system characteristics.
Site Id# Phase of Sampling
Infiltrative Surface
type
Age Est. HLR
(cm/d)
Depth to Infiltrative
Surface
Ponding Depth
2 Phase 1 Chamber 10 2.99 ~4 ft yes1
10 Phase 2 Gravel 9 0.84 3.0 to 3.5 ft ~3 in. 12 Phase 2 Chamber 4 1.16 2.5 to 3.3 ft 2 in. 14 Phase 2 Chamber 4 0.61 1.3 to 1.6 ft wet 16 Phase 2 Chamber 3 2.16 1.5 to 2.25 ft 12 in.
1 Depth of ponding not measured.
WSAS Field Study Final Report, April 16, 2001 17

4.1.2 Septic Tank Effluent Composition Descriptive statistics for STE at each site are presented in Table 4.2 while results for individual homes may be found in the Appendix (see Tables A.1 through A.4). The STE composition at the individual study homes was typical of residential STE containing appreciable concentrations of pollutants. The average concentrations were: cBOD5 = 122 mg/L, TSS = 209 mg/L, total N = 58 mg-N/L, and total P = 13.4 mg-P/L. Fecal coliform bacteria ranged from 1.4 x 10⁵ to 2.64 x 10⁷ cfu/100mL. Table 4.3 presents a synopsis of some literature values, allowing a comparison of the STE composition determined in this study to previously reported values.
Table 4.2. Descriptive statistics for STE composition.
Parameter Units Average Std. dev. Total No. Minimum Maximum
pH - 7.57 0.53 16 6.98 8.55
Alkalinity mg-CaCO3/L 535 42 16 464 620
cBOD5 mg/L 122 120 10 31 389
COD mg/L 558 130 20 369 786
TS mg/L 1191 157 32 630 1435
TSS mg/L 209 127 31 35 550
TN mg-N/L 58 16 32 32 84
NH4-N mg-N/L 47 13 32 29 75
NO3-N mg-N/L 0.66 0.18 31 0.4 1.1
Total P mg-P/L 13.4 6.4 31 2.2 31.2
Fecal coli. cfu/100mL NA NA 23 1.40E+05 2.64E+07 1 See Appendix A, Tables A.1 through A.4 for detailed results of each WSAS. NA = statistic is not applicable.
WSAS Field Study Final Report, April 16, 2001 18

Table 4.3. Comparison of STE composition from Phase 2 with literature values.
Parameter (units)
Average Std. dev. Range Reference
BOD5 122 120 30 to 389 This CSM study, Phase 2 (mg/L) 175 52 98 to 358 This CSM study, Phase 1 81 31 29 to 140 Tyler et al., 1991 - - 150 to 250 Crites & Tchobanoglous, 1998 132 - - Harkin et al., 1979
COD 558 130 369 to 786 This CSM study, Phase 2 (mg/L) 260 164 109 to 990 This CSM study, Phase 1 157 46 49 to 244 Tyler et al., 1991 - - 250 to 500 Crites & Tchobanoglous, 1998 445 - - Harkin et al., 1979
TSS 209 127 35 to 550 This CSM study, Phase 2 (mg/L) 251 245 20 to 958 This CSM study, Phase 1 - - 40 to 140 Crites & Tchobanoglous, 1998 87 - - Harkin et al., 1979
NH4-N 47 13 29 to 75 This CSM study, Phase 2 (mg-N/L) 43 17 3 to 64 This CSM study, Phase 1 50 11 10 to 69 Tyler et al., 1991 41 - 30 to 50 Crites & Tchobanoglous, 1998
NO3-N 0.66 0.18 0.4 to 1.1 This CSM study, Phase 2 (mg-N/L) 1.3 0.74 0.5 to 2.4 This CSM study, Phase 1 0 0 0 to 2 Tyler et al., 1991
Total P 13.4 6.4 2.2 to 31.2 This CSM study, Phase 2 (mg-P/L) 7.7 2.0 5.7 to 11.1 This CSM study, Phase 1 17.3 - 12 to 20 Crites & Tchobanoglous, 1998 7.3 - - Harkin et al., 1979
Fecal coli. - - 1.4E+05 to 2.6E+07 This CSM study, Phase 2 (org/100mL) - - 4.0E+04 to 5.1E+06 This CSM study, Phase 1 - - 1.0E+06 to 1.0E+08 Crites & Tchobanoglous, 1998 1.00E+06 - - Harkin et al., 1979
“-“ indicates information not available. 4.1.3 WSAS Soil Characteristics A total of 3 soil cores (two within the infiltrative surface and one background location) were successfully collected and sampled at each of 4 WSAS (3 chamber and 1 gravel systems) studied during Phase 2. Three of the four systems exhibited some degree of effluent ponding while the fourth system was wet with ponding observable in surface depressions. Coring was expedited through the use of direct push core collection methods, larger diameter core barrels, and descriptive information gained during Phase 1 (e.g., location of subsurface system boundaries, system depth). Detailed results for each WSAS may be found in the Appendix (Table A.5) while a summary of the results follow.
WSAS Field Study Final Report, April 16, 2001 19

Water content versus depth for the soil cores collected from all of the study sites in Phase 2 is shown in Fig. 4.1. Water content is generally highest near the infiltrative surface and declines with increasing depth below the infiltrative surface. Figure 4.2 illustrates the ammonium-nitrogen and nitrate-nitrogen data from soil core samples by depth interval for each site. Ammonium-nitrogen and nitrate-nitrogen appear to be present throughout the sampling depths at each site, with highest levels at depths closest to the infiltrative surface. At one location (home site Id# 16), ponding was present to the top of the chamber and a black anoxic layer ~3-in. (7.5 cm) thick was observed surrounding the outside of the chamber. Nitrification does not appear to be occurring at this location as indicated by the absence of nitrate in the soil cores (see Fig. 4.2). Similar to water content and ammonium-nitrogen and nitrate-nitrogen, available phosphorous and % organic matter decline with depth below the infiltrative surface (see graphs presented in Appendix A, Figs. A.5 and A.6).
0.0
5.0
10.0
15.0
20.0
25.0
30.0
35.0
40.0
0-5 10-15 25-30 55-60
Depth below Infiltrative Surface (cm)
% (d
ry w
t.) W
ater
Con
tent
Fig. 4.1. Water content in soil core samples by depth below the infiltrative surface. Background soil core data are excluded. The results for fecal coliform bacteria levels with depth are summarized in Appendix A (Table A.5) while Fig. 4.3 provides a graphical summary of fecal coliform levels at soil coring depths for chamber versus gravel systems. As shown, the results for the chamber systems are comparable to those for the gravel systems. At all of the Phase 2 study sites, fecal coliform concentrations declined with depth and by 60 cm depth, fecal coliform bacteria were not detected (detection level of 1 cfu per g dry soil). It should be noted that fecal coliform bacteria was detected at 9 to 20 cfu/100mL in the background core at one location (home site Id# 14) collected outside of the infiltrative surface (Table A.5). The source of the fecal coliforms is unknown. The fecal coliform results observed in this Phase 2 study are similar to the Phase 1 results and previous results in the literature (Converse and Tyler 1998, Siegrist et al. 2000).
WSAS Field Study Final Report, April 16, 2001 20

NH4-N and NO3-N at Site Id# 10
0.0
2.0
4.0
6.0
8.0
10.0
12.0
14.0
16.0
18.0
20.0
0-5 10-15 25-30 55-60
Depth below IS (cm)
mg/
kg a
s N
NH4NO3
NH4-N and NO3-N at Site Id# 16
0.00
20.00
40.00
60.00
80.00
100.00
120.00
0-5 10-15 25-30 55-60
Depth below IS (cm)
mg/
kg a
s N
NH4NO3
NH4-N and NO3-N at Site Id# 12
0.0
2.0
4.0
6.0
8.0
10.0
12.0
14.0
16.0
18.0
20.0
0-5 10-15 25-30 55-60
Depth below IS (cm)
mg/
kg a
s N
NH4NO3
NH4-N and NO3-N at Site Id# 14
0.0
2.0
4.0
6.0
8.0
10.0
12.0
14.0
16.0
18.0
20.0
0-5 10-15 25-30 55-60
Depth below IS (cm)
mg/
kg a
s N
NH4NO3
Fig. 4.2. Nitrate- and ammonium-nitrogen in soil samples by depth below the infiltrative
surface (in mg/kg as N, dry soil). Note variation in y-axis scale for site Id# 16.
1
10
100
1000
10000
100000
0-5 10-15 25-30 55-60
Depth below Infiltrative Surface (cm)
FC (c
fu/g
dry
soi
l)
= chamber system
= gravel system
Fig. 4.3. Fecal coliform data in soil samples from four home sites (1 gravel and 3 chambers)
sampled during Phase 2. Background soil core data are excluded.
WSAS Field Study Final Report, April 16, 2001 21

4.2. Multicomponent Surrogate/Tracer Results The concentrations of conservative tracer (bromide) and viral surrogates (MS-2 and PRD-1) measured in the STE at each home over time are shown in Fig. 4.4 with details provided in Appendix A (Tables A.6 through A.8). These results show a decline in the bromide concentration in the dosing tank that is consistent with the decline in concentration expected based on dilution due to incoming STE without bromide tracer. After five days, the bromide concentration had declined by 62 to 90% and had declined by 88 to 96% at the time of coring.
0
200
400
600
800
1000
1200
1400
1600
1800
2000
0 2 4 6 8 10
Elapsed time after adding tracer to effluent (days)
mg-
Br/L
10121416
1
10
100
1000
10000
100000
0 2 4 6 8 10
Elapsed time after adding tracer to effluent (days)
pfu-
PRD
1/m
L
10121416
1
10
100
1000
10000
0 2 4 6 8 10
Elapsed time after adding tracer to effluent (days)
pfu-
MS2
/mL
10121416
Fig. 4.4. Concentrations of the conservative tracer bromide and PRD-1 and MS-2
bacteriophages in the STE dosing tank over time at sites 10, 12, 14, and 16.
WSAS Field Study Final Report, April 16, 2001 22

Initial levels of both MS-2 and PRD-1 were several orders of magnitude less than anticipated based on stock concentrations (1015 and 1013 pfu/mL respectively) and tank size. The lower initial concentration might be attributed to potential adsorption of the bacteriophage onto solids present in the tank during mixing. Settling of the particles within the grab samples prior to analysis may have prevented detection/quantification. It should be noted that initial bromide concentrations were within expected ranges (1226 to 1870 mg-Br/L) of the initial target concentration (1500 mg-Br/L) indicating tank volume estimates were acceptable. The levels of MS-2 and PRD-1 remained relatively unchanged through out the duration of the test (Fig. 4.4). These apparently unchanging virus levels may be due in part to analytical error and the potential for some growth of the bacteriophages in the STE. Results during the Phase 1 inactivation test indicated that some apparent growth of bacteriophage in the STE was possible at 4°C and 20°C (Fig 4.5) (Siegrist et al. 2000). More intensive monitoring of the temporal changes in surrogate/tracer concentrations was conducted during Phase 2 and appears to confirm a similar trend.
1.E+00
1.E+02
1.E+04
1.E+06
1.E+08
0 5 10 15 20 25
Elapsed time since spiking effluent (days)
MS-2 (4C) PRD-1 (4C)MS-2 (20C) PRD-1 (20C)
pfu/mL
Fig. 4.5. Phase 1 inactivation of MS-2 and PRD-1 in STE during incubation at 20°C and 4°C. Note that all samples were run in duplicate and the average percent difference was 11%. Analysis of the soil cores detected bromide in the extracted soil samples at up to 30 cm below the infiltrative surface confirming that STE from the tank had indeed been delivered to the location of the soil core and that sufficient time had elapsed for percolation through the soil to a depth of >30 cm (Fig. 4.6 and Appendix A, Table A.9). The absence of bromide in soil core extracts in the 55 to 60 cm interval is attributed to insufficient time between surrogate/tracer addition and soil coring for the added bromide to migrate into and through the depth interval of interest.
WSAS Field Study Final Report, April 16, 2001 23

Soil core values for MS-2 and PRD-1 are also graphically depicted in Fig. 4.6 with detailed results presented in Appendix A, Table A.9. An overall trend of lower levels of surrogate virus with increasing depth below the infiltrative surface was observed. As with the conservative tracer, the absence of both surrogates in soil core extracts in the 55 to 60 cm interval could be attributed to insufficient time between surrogate/tracer addition and soil coring for the surrogate/tracer to migrate into and through the depth interval of interest. Fecal coliform bacteria also declined with depth below the infiltrative surface, but it should be noted that fecal coliform was detected in the background samples at home site Id# 14 (Appendix A, Table A.5).
Site Id# 10
0.1
1
10
100
1000
10000
ponding 0-5 10-15 25-30 55-60
Depth below IS (cm)
conc
entr
atio
n
Br (mg/L or mg/kg dry soil)
MS2 (pfu per mL or g dry soil)
PRD1 (pfu per mL or g dry soil)
Site Id# 12
0.1
1
10
100
1000
10000
ponding 0-5 10-15 25-30 55-60
Depth below IS (cm)
conc
entr
atio
n
Br (mg/L or mg/kg dry soil)
MS2 (pfu per mL or g dry soil)
PRD1 (pfu per mL or g dry soil)
Site Id# 14
0.1
1
10
100
1000
10000
ponding 0-5 10-15 25-30 55-60
Depth below IS (cm)
conc
entr
atio
n
Br (mg/L or mg/kg dry soil)
MS2 (pfu per mL or g dry soil)
PRD1 (pfu per mL or g dry soil)
Site Id# 16
0.1
1
10
100
1000
10000
ponding 0-5 10-15 25-30 55-60
Depth below IS (cm)
conc
entr
atio
n
Br (mg/L or mg/kg dry soil)
MS2 (pfu per mL or g dry soil)
PRD1 (pfu per mL or g dry soil)
Fig. 4.6. Bromide, MS-2 and PRD-1 levels in soil core extracts collected during Phase 2, 7
to 9 days following addition of surrogates and tracer to the STE being applied. Note: Detection limits are: bromide at 0.1 mg/L (ponding) or mg/kg dry soil; and MS-2 and PRD-1 at 1 pfu/mL (ponding) or g of dry soil. Zero values (blank bars) represent non-detects.
The relationship of MS-2 and PRD-1 to fecal coliform concentrations is of interest, since fecal coliforms are often used as indicators of microbial contamination. During Phase 1 a comparison of fecal coliforms to MS-2 and PRD-1 indicated that, under the conditions examined, fecal coliforms in soil extracts may be a reasonable indicator for the presence of virus at the same location. Results from Phase 2 confirm this relationship as all soil core extracts with virus also had fecal coliform concentrations (Appendix A, Table A.10).
WSAS Field Study Final Report, April 16, 2001 24

The removal of bacteriophages was conservatively estimated based on the assumption that all bacteriophage detected in the extraction of soil solids were mobile in the soil pore water. Based on the average dry wt.% water content at each home site, the pfu/g dry soil values were converted to pfu/mL of pore water (Table A.11). These estimated pore water values were then compared to the dose concentration of MS-2 or PRD-1. The estimated pore water concentrations correspond to 98.2 to 99.9% removal efficiency for both MS-2 and PRD-1 within the top 15 cm below the infiltrative surface and 99.5 to 99.8% for MS-2 and 99.1 to 99.9% for PRD-1 at 30 cm below the infiltrative surface (Fig. 4.7, Table A.11). Because the conservative tracer was not detected at the 55-60 cm interval, treatment efficiencies were not estimated for this depth. Considering that the extracted bacteriophages may not have all been mobile in the pore water and some growth of the spiked bacteriophage may have occurred, it is reasonable to conclude that a 3-log removal of the applied viral surrogates was achieved at a total depth of 30 cm (maximum sample depth where surrogate/tracers were detected). Achievement of 3-log removal of virus after STE infiltration at 1 to 3 cm/d and percolation through 60 to 90 cm of natural soil is reasonable to achieve as shown in this and previous field studies (see Table 4.4).
95
96
97
98
99
100
0-5 10-15 25-30
Depth below Infiltrative Surface (cm)
% R
educ
tion
of M
S-2
10121416
95
96
97
98
99
100
0-5 10-15 25-30
Depth below Infiltrative Surface (cm)
% R
educ
tion
of P
RD
-1
10121416
Fig. 4.7. Estimated removal efficiency of MS-2 and PRD-1 bacteriophages with depth below
the infiltrative surface at home site Id#s 10, 12, 14, and 16. Note: blank bars represent removal efficiencies lower than 95% (see Table A.11).
WSAS Field Study Final Report, April 16, 2001 25

Table 4.4. Results of field studies of virus treatment in wastewater soil absorption systems. Investigator
Study characteristics/
location
Virus and concentrations
applied
Method of assessment
Findings
This CSM study, Phase 2, 2001
1.73 cm/d HLR of STE to three mature chamber soil absorption system and 0.84 cm/d HLR of STE to one mature gravel soil absorption system Colorado
Spiking of STE with MS-2 at ~1.0 to 4.3x10³ and PRD-1 at ~6.5 to 11.1x10³ pfu/mL
Soil core collection and extraction
99.9% removal after 30 cm
This CSM study, Phase 1, 1999
2.7 cm/d HLR of STE to a mature chamber soil absorption system Colorado
Spiking of STE with MS-2 at 7.5x10⁴ and PRD-1 at 1.5x10⁵ pfu/mL
Soil core collection and extraction
99.9% removal after 60 cm
Higgins et al., 1999
3cm/day HLR of STE to a buried sand filter constructed of medium sand Massachusetts
Indigenous MS-2 at 3x10⁴ pfu/mL in raw wastewater and 7.8x10³
in STE applied to sand
Pressure-free pan lysimeters placed during sand placement in buried lined cells
74.44% removal in septic tank 99.17% removal in 30cm1
98.45% removal in 60 cm1
99.79% removal in 152cm1
Oakley et al., 1999
Variable loading (0.81-6.5 cm/day) of STE to a soil absorption system in clay loam California
Indigenous φX174 at 1x100 to 1x10⁴ pfu/mL in STE
Suction-lysimeters augured and driven into intact natural soil
1-log removal in recirculating gravel filter
100% removal in 60 cm soil
Anderson et al., 1991
Onsite soil absorption systems and subdivisions on fine sandy soils Florida
Indigenous virus present in STE at 0.06 to 43.7 MPN of infectious units per L
Soil cores and extraction plus ground water samples
No Enterovirus detected in soil samples below the soil infiltration area at four homes
At one home, virus was detected in shallow ground water (0.6 to 0.9 m) depth right under the system but not 3 m downgradient from it
Gilbert et al., 1976
Secondary effluent land applied at 100 m/year with cyclic flooding onto fine loamy sand Arizona
Indigenous Enterovirus at 1x10³ to 7x10³ pfu/100L in municipal effluent
Ground water sampling and analysis
99.99% removal in 3 to 9 m soil
1 %removals shown in soil are based on the STE levels applied to the soil. 4.3. DISCUSSION The interpretation of soil purification efficiency requires determination that wastewater did in fact reach the infiltrative surface location at which soil cores have been collected. Such an assessment can be made by integrated consideration of several factors, including: ponding (or
WSAS Field Study Final Report, April 16, 2001 26
wetness), soil color, water content and nutrient levels in the soil core profile, as well as the presence of fecal coliform bacteria, the tracer and viral surrogates near the infiltrative surface. Based on these parameters, all soil cores were collected at locations where STE had infiltrated. Ammonium-nitrogen and nitrate-nitrogen appear to be present throughout the sampling depths with the highest levels at depths closest to the infiltrative surface. These data are consistent with results found in laboratory lysimeters (Van Cuyk et al. 1999, Fischer 1999), the Phase 1 field study (Siegrist et al. 2000), and with recent published field research (Tyler and Converse 1998). Comparisons for nitrogen and fecal coliform demonstrate that the data collected in this study is generally consistent with previously reported results (Table 4.3). While a large degree of variation in constituent concentrations was observed between individual systems, and even among duplicate cores taken within the same system, the values measured for both system types were for all practical purposes, comparable. During Phase 2, surrogate/tracer methods developed and lessons learned in Phase 1 were deployed at 4 additional sites enabling evaluation of five WSAS for virus treatment efficiency, including both aggregate-laden and aggregate-free systems. Bromide concentrations added in the STE dosing chamber were 1500 mg-Br/L to ensure continued high dosing of the bromide during the study. Frequent sampling and analysis of the STE (every 2 to 3 days) indicated that high levels of bromide were delivered to the infiltrative surface throughout the duration of this test. Bromide was detected in all soil cores from within the infiltrative surface with the exception of one site (home site Id#16). Frequent detection of bromide is attributed to the higher sustained concentrations of the conservative tracer delivered and the shorter time frame between surrogate/tracer addition and soil sampling. It is possible that bromide was not detected at home site Id#16 because the system was ponded to the top of the chamber (12 in. depth) and initial concentrations were attenuated to the extent that it’s presence in the soil pore water was not detected. At home site Id#16, bromide was detected in the ponded STE as well as in the samples taken from infiltrative surface vents located at both ends of the infiltration field (12 to 183 mg-Br/L). As noted during Phase 1 and confirmed in Phase 2, a relationship was observed between the concentrations of fecal coliforms and MS-2 and PRD-1 virus in soil samples. These data suggest that under the conditions examined, in soil extracts where fecal coliform bacteria are absent, then it is unlikely that virus exist at the same location. Bacteriophage was detected in the surface cores (0-5 cm and 10-15 cm below the infiltrative surface) collected where ponding was observed. The results of the evaluation completed revealed that under the conditions examined, a 3-log treatment efficiency for virus was achieved at the 30-cm depth below the STE soil infiltrative surface. Removal of > 3 logs of virus during soil absorption of STE is consistent with the results of the CSM laboratory studies (Van Cuyk et al. 2001) as well as the results of previous field studies reported by other investigators (Table 4.4).
WSAS Field Study Final Report, April 16, 2001 27

5.0 CONCLUSIONS
A field study was completed to monitor the performance of five mature wastewater soil absorption systems in Colorado to gain insight into the comparative performance of aggregate-free (chamber) and aggregate-laden (gravel) infiltration systems. Two phases of field activities have been conducted. Phase 1, initiated in 1999 was designed to characterize infiltration of domestic STE in more mature soil absorption systems under field conditions and included evaluation of virus treatment efficiency at one location. Phase 2 field testing, described in this report, was initiated in Fall 2000 as a companion to Phase 1 to expand the evaluation of virus treatment efficiency from one chamber WSAS to a total of 5 WSAS including both aggregate-laden and aggregate-free systems. During both phases, virus treatment efficiency was evaluated using a multicomponent mixture of MS-2 and PRD-1 bacteriophages and a conservative bromide tracer. Data collected at each site included residence characteristics, system design features, STE composition, occurrence and depth of ponding of the soil infiltrative surface, and bacteriophage, conservative tracer, fecal coliform bacteria and nutrient concentrations with depth below the infiltrative surface. Based on the work completed during both Phase 1 and Phase 2 field evaluations, and with consideration of the related 3-D lysimeter research and previously reported findings (Van Cuyk et al. 1999, 2001; Siegrist et al. 1999, 2000; Siegrist and Van Cuyk 2001), the following conclusions have been drawn and several recommendations can be made. 1. The STE composition at the four individual study homes was typical of residential STE
containing appreciable concentrations of pollutants. The average concentrations were: cBOD5 = 122 mg/L, TSS = 209 mg/L, total N = 58 mg-N/L, and total P = 13.4 mg-P/L. Fecal coliform bacteria ranged from 1.4 x 10⁵ to 2.64 x 10⁷ cfu/100mL.
2. The chamber systems varied in age from 3 to 10 yr. while the gravel system was 9 yr. old.
The estimated HLR averaged 1.73 cm/d for the chamber systems, including both Phase 1 and Phase 2, compared to 0.84 cm/d for the gravel system. During Phase 2, three of the four systems (home site Id#s 10, 12, and 16) exhibited some degree of effluent ponding while the fourth system (home site Id#14) was wet with ponding observable in surface depressions. During soil coring (after surrogate/tracer addition) it was observed that one system (home site Id#16) was fully ponded. This system was not eliminated from consideration at this time due in part to schedule and reporting constraints (e.g., time required to identify an additional system, add surrogate/tracer to the STE, and allow sufficient time for migration of the surrogate/tracer into and through the infiltration area). It is also important to note that this system was designed as an infiltration/evapotransporation system relying on a fraction of the net loss of fluid from evapotransporation rather than percolation through the low permeable subsurface soils, and was sampled during the winter months when evapotransporation was at a minimum (i.e., dominant infiltration/negligible evapotransporation). Data from these four systems suggest comparable hydraulic performance with the chamber systems receiving a loading rate on average that was 106% higher (1.73 vs. 0.84 cm/d per unit of horizontal infiltrative surface area).
WSAS Field Study Final Report, April 16, 2001 28

3. Monitoring of soil properties and pollutant concentrations with depth beneath the infiltrative surfaces revealed spatially variable concentrations. At most sites, pollutant concentrations declined with depth and by 60 cm depth, fecal coliform bacteria were not detected. The results of this effort also confirmed a relationship between fecal coliform concentrations measured in soil core samples to MS-2 and PRD-1 virus concentrations, observed during Phase 1.
4. The methodology for using a multicomponent mixture of viral surrogates (MS-2 and PRD-1)
and a conservative tracer (bromide) to assess virus purification in a wastewater soil absorption system developed during Phase 1 was successfully applied under field conditions to four additional sites (3 aggregate-free systems and one aggregate-laden system). During Phase 1, ≥ 3-log reductions in the applied MS-2 and PRD-1 viral surrogate concentrations were achieved at 60 cm below the infiltrative surface at one aggregate-free system. During Phase 2, 3-log reductions in the applied MS-2 and PRD-1 viral surrogate concentrations were achieved at 30 cm below the infiltrative surface (maximum sample depth where surrogate/tracers were detected).
5. Under the conditions examined in this study, the performance and virus treatment efficiency
measurements made for the chamber systems were comparable to those determined for gravel systems, even though the chambers were estimated to be receiving a HLR of 0.42 gpd/ft2 (1.73 cm/d) as compared to 0.21 gpd/ft2 (0.84 cm/d) for the gravel system. The performance observations made under field conditions are consistent with the findings derived from 3-D lysimeter studies carried out under controlled laboratory conditions at CSM (Van Cuyk et al. 1999, 2001; Siegrist et al. 1999) and Phase 1 field studies (Siegrist et al. 2000; Siegrist and Van Cuyk 2001) and indicate that aggregate-free chamber systems and aggregate-laden gravel systems provided equivalent environmental protection.
WSAS Field Study Final Report, April 16, 2001 29
5.0 REFERENCES
Adams, M.H. 1959. Bacteriophages. Interscience Publishers: New York. American Public Health Association (APHA). 1992. Standard Methods for the Examination of
Water and Wastewater. 18th ed. Am. Public Health Assoc., Am. Water Works Assoc., and Water Pollut. Control Fed., Washington, DC.
American Public Health Association (APHA). 1998. Standard Methods for the Examination of Water and Wastewater. 20th ed. Clesceri, L.S., A.E. Greenberg and A.D. Eaton, eds. APHA-AWWA-WPCF, Washington, DC.
Amerson, R.S., E.J. Tyler and J.C. Converse. 1991. Infiltration as Affected by Compaction, Fines and Contact Area of Gravel. In: Proc. 6th National Symposium on Individual and Small Community Sewage Systems. ASAE, St. Joseph, MI. pp: 214-222.
Anderson, D.L., R.L. Siegrist and R.J. Otis. 1985. Technology Assessment of Intermittent Sand Filters. U.S. Environmental Protection Agency, Municipal Environmental Res. Lab., Cincinnati, Ohio.
Anderson, D.L., A.L. Lewis, and K.M. Sherman. 1991. Human Enterovirus Monitoring at Onsite Sewage Disposal Systems in Florida. In: Proc. 6th National Symposium on Individual and Small Community Sewage Systems. ASAE, St. Joseph, MI. pp: 94-104.
Anderson, D.L., R.J. Otis, J.I. McNeille, and R.A. Apfel. 1994. In-Situ Lysimeter Investigation of Pollutant Attenuation in the Vadose Zone of a Fine Sand. Proc. 7th International Symposium on Individual and Small Community Sewage Systems. December 1994, Atlanta, GA. pp. 209-218.
Ausland, G.A. 1998. Hydraulics and Purification in Wastewater Filters. Ph.D. dissertation. Agricultural University of Norway. As, Norway.
Bales, R.C., S.R. Hinkie, T.W. Kroeger, and K. Stocking. 1991. Bacteriophage Adsorption During Transport Through Porous Media: Chemical Perturbations and Reversibility. Environ. Sci. Technol. 25(12):2088-2095.
Brown, K.W., H.W. Wolf, K.C. Donnelly, and J.F. Slowey. 1979. The Movement of Fecal Coliforms and Coliphages below Septic Lines. J. Environmental Quality. 8(1):121-125.
Caldwell Connell Engineers Pty., Ltd. 1986. On-Site Wastewater Disposal Systems Final Report for the Water Authority of Western Australia.
Crites, R.C. and G. Tchobanoglous. 1998. Small and Decentralized Wastewater Systems. McGraw-Hill Publishing Company, Boston.
Converse, J.C., and Tyler, E.J. 1998. Soil Treatment of Aerobically Treated Domestic Wastewater with Emphasis on Modified Mounds. Eighth national Symposium on Individual and Small Community Sewage Systems.
Dix, S. P. and R. May. 1997. A Review of the Field Performance of Chamber Leaching Systems. ASTM Conference on Site Characterization and Design of On-Site Septic Systems.
Emerick, R.W., R.M. Test, G. Tchobanoglous, and J. Darby. 1997. Shallow intermittent sand filtration: Microorganism removal. The Small Flows Journal. 3(1):12-22.
England, A. and S. Dix. 1999. Performance of the Infiltrator Chamber System in Hamilton County, Tennessee. Proc. National Onsite Wastewater Recycling Association 8th Annual Conf. and Exhibition, Jekyll Island, GA, November 1999. pp. 99-106.
Fischer, E.A. 1999. Nutrient Transformation and Fate During Intermittent Sand Filtration of Wastewater. M.S. Thesis. Colorado School of Mines, Golden, Colorado.
WSAS Field Study Final Report, April 16, 2001 30

Gilbert, R.G., R.C. Rice, H. Bouwer, C.P. Gerba, C. Wallis, and J.L. Melnick. 1976. Science 192:1004-1005.
HACH. 1992. Water Analysis Handbook. 2nd ed. HACH Chemical Co., Loveland, CO. USA. Harkin, J.M., C.J. Fitzgerald, C.P. Duffy, and D.G. Kroll. 1979. Evaluation of Mound Systems
for Purification of Septic Tank Effluent. Technical Report. WIS WRI 79-05. University of Wisconsin Water Resources Center, Madison, Wisconsin.
Harvey, R.W. 1997a. Microorganisms as Tracers in Groundwater Injection and Recovery Experiments: A Review. FEMS Microbiology Reviews. 20:461-472.
Harvey, R.W. 1997b. In Situ and Laboratory Methods to Study Subsurface Microbial Transport. In: Manual of Environmental Microbiology. Hurst, C.J., G.R. Knudsen, M.J. McInerney, L.D. Stetzenback, and M.V. Walter (eds.). ASM Press, Washington, D.C. pp. 586-599.
Higgins, J.J., G. Heufelder, and Sean Foss. 1999. Removal Efficiency of Standard Septic Tank and Leach Trench Septic Systems for MS2 Coliphage. Proc. 10th Northwest On-Site Wastewater Treatment Shortcourse. September 20-21, 1999, Univ. of Washington, Seattle, WA. pp. 81-88.
Hoxie, D.C., A. Frick, and J. Hardcastle. 1990. Subsurface Wastewater Disposal Systems Designed in Maine by the Site Evaluation Method: System Design, Land Use Trends and Failure Rate.
Huysman, F. and W. Verstraete. 1993. Water Facilitated Transport of Bacteria in Unsaturated Soil Columns: Influence of Inoculation and Irrigation Methods. Soil Biol. Biochem. 25(1):91-97.
ISI. 2001. Carl Thompson, ISI, Personal Communication with Kathryn Lowe, Colorado School of Mines, April 10, 2001.
Jenssen, P.D. and R.L. Siegrist. 1990. Technology Assessment of Wastewater Treatment by Soil Infiltration Systems. Water Science & Tech. 22(3/4):83-92.
Keswick, B.H. and C.P. Gerba. 1980. Viruses in Groundwater. Environ. Sci. Technol. 14(11):1290-1297.
Keys, J.R. 1996. Septic Tank Effluent Infiltration and Loading Rates for Gravel and Chamber Absorption Systems. M.S. thesis. University of Wisconsin-Madison.
Kristiansen, R. 1991. Sand-filter Trenches for Purification of Septic Tank Effluent: III, The Microflora. Journal of Environmental Quality, 10(3):361-364
Masson, S.K. 1999. Fate of Microorganisms in a Soil Infiltration System as Affected by Infiltrative Surface Character and Depth. M.S. Thesis. Colorado School of Mines, Golden, CO.
May, R. 1996. Problems Associated with the Use of Gravel in Septic-Tank Leachfield Systems. Journal Environmental Health. September 1996. pp. 6-11.
McCray, J.E., D. Huntzinger, S. Van Cuyk, and R.L. Siegrist. 2000. Mathematical Modeling of Unsaturated Flow and Transport in Soil-Based Wastewater Treatment Systems. WEFTEC 2000, Water Environment Federation, October, Anaheim, CA.
Minitab, Inc. 1995. Minitab Release 10Xtra. State College, PA. 16801-3008. Nodarse & Associates, Inc. 1997. Final Report: Aggregate-free Florida Side-by-Side Test Site
– To State of Florida Department of HRS, Onsite Sewage Program. Oakley, S., W.P. Greenwood, and M. Lee. 1999. Monitoring Nitrogen and Virus Removal in the
Vadose Zone with Suction Lysimeters. Proc. 10th Northwest On-Site Wastewater Treatment Shortcourse. September 20-21, 1999, Univ. of Washington, Seattle, WA. pp. 211-232.
WSAS Field Study Final Report, April 16, 2001 31

Olsen, R.H., J. Siak, and R. Gray. 1974. Characterization of PRD1, A Plasmid-Dependent Broad Host Range DNA Bacteriophage. J Virol., (14): 689-699.
Peeples, J.A., K.M. Mancl, and D.L. Widrig. 1991. An Examination of the Role of Sand Depth on the Treatment Efficiency of Pilot Scale Intermittent Sand Filters. Proc. 6th Nat. Symp. on Individual and Small Community Sewage Systems. ASAE, St. Joseph, MI.
Ricklefs, S.A. 1992. Evaluating Innovative Systems – A Field Study Utilizing Leaching Chamber Design. Texas On-Site Wastewater Treatment and research Conference Proceedings.
Rose, J.B., D.W. Griffin, and L.W. Nicosia. 1999. Virus Transport from Septic Tanks to Coastal Waters. Proc. 10th Northwest On-Site Wastewater Treatment Shortcourse. Sept. 20-21, Univ. of Washington, Seattle, WA. pp. 71-80.
Saxton, J. and R. Crumley. 1993. Study of Gravel and Chamber Drainfield Performance in Georgia. Chamber Leaching Systems.
Schwagger, A and M. Boller. 1997. Transport Phenomena in Intermittent Filters. Wat. Sci. Tech. 35(6): 13-20.
Siegrist, R.L. and W.C. Boyle. 1987. Wastewater Induced Soil Clogging Development. J. Environmental Engineering. 113(3):550-566.
Siegrist, R.L. 1987. Soil Clogging During Subsurface Wastewater Infiltration as Affected by Effluent Composition and Loading Rate. J. Environmental Quality. 16, pp. 181-187.
Siegrist, R.L. and P.D. Jenssen. 1989. Nitrogen Removal During Wastewater Infiltration as Affected by Design and Environmental Factors. Proc. 6th On-site Wastewater Treatment Short Course. Sept. 1989. University of Washington, Seattle.
Siegrist, R.L., R. Smed-Hildmann, Z. Filip, and P.D. Jenssen. 1991. Humic Substance Formation During Wastewater Infiltration. ASAE Publ. 10-91. ASAE, St. Joseph, MI. pp. 182-191.
Siegrist, R.L., S. Van Cuyk, S. Masson, and E. Fischer. 2000. Field Evaluation of Wastewater Soil Absorption Systems with Aggregate-Free and Aggregate-Laden Infiltrative Surfaces. Project Report prepared by Colorado School of Mines for Infiltrator Systems, Inc. May 2000.
Siegrist, R.L. and S. Van Cuyk. 2001. Wastewater Soil Absorptions Systems: The Performance Effects of Process and Environmental Control. Proc. On-Site Wastewater Treatment. Fort Worth, TX. Mar. 11-14, 2001.
Siegrist, R.L., S. Van Cuyk, A. Logan, S. Masson, and E. Fischer. 1999. Hydraulic and Purification Behavior in Wastewater Soil Treatment Systems as Affected by Infiltrative Surface Character and Vadose Zone Soil Depth. Proc. Annual Conf. of the National Onsite Wastewater Recycling Association. Jekyll Island, GA. Nov. 3-6, 1999.
Stevik, T.K.. G.A. Ausland, P.D. Jenssen, P.D., and R.L Siegrist. 1999. Purification of E. coli Bacteria During Intermittent Filtration of Wastewater Effluent as Affected by Dosing Rate and Media Type. Water Research. 33(9):2088-2098.
Tyler, E.J., M. Milner, and J.C. Converse. 1991. Wastewater Infiltration from Chamber and Gravel Systems. Proceedings of Sixth National Symposium on Individual and Small Community Sewage Systems.
Tyler, E.J. and J.C. Converse, 1994. Soil Acceptance of On-site Wastewater as Affected by Soil Morphology and Wastewater Quality. In: Proc. 7th International Symposium on Individual and Small Community Sewage Systems, ASAE, St. Joseph, MI. pp. 185-194.
USDA. 1974. Soil Survey of Adams County, Colorado. United States Department of Agriculture, Soil Conservation Service, Washington, D.C. 20402.
WSAS Field Study Final Report, April 16, 2001 32

USDA. 1977. Soil Survey of Summit County Area, Colorado. United States Department of Agriculture, Soil Conservation Service, Washington, D.C. 20402.
U.S. EPA. 1978. Management of Small Waste Flows. Report of Small Scale Waste Management Project, University of Wisconsin, Madison, WI. U.S. Environmental Protection Agency, Municipal Environmental Res. Lab., EPA-600/2-78-173. Cincinnati, Ohio.
U.S. EPA. 1980. Design Manual for Onsite Wastewater Treatment and Disposal Systems. U.S. Environmental Protection Agency Municipal Environmental Res. Lab., Cincinnati, Ohio.
U.S. EPA. 1997. Response to Congress on Use of Decentralized Wastewater Treatment Systems. U.S. Environmental Protection Agency, Office of Water, Washington, D.C.
Van Cuyk, S., R.L. Siegrist, A. Logan, S. Masson, E. Fischer, and L. Figueroa. 1999. Purification of Wastewater in Soil Treatment Systems as affected by Infiltrative Surface Character and Unsaturated Soil Depth. Water Environment Federation, WEFTEC ’99. New Orleans, Louisiana.
Van Cuyk, S., R. Siegrist, A. Logan, S. Masson, E. Fischer, and L. Figueroa. 2001. Hydraulic and Purification Behaviors and Their Interactions During Wastewater Treatment in Soil Infiltration Systems. Wat. Res. 35(4):953-964.
Van Duin. J. 1988. In: The Bacteriophages. 1st ed.; Calender, R. (ed.). Plenum Press, New York. Vol. 1, pp. 117-167.
Vaughn, J.M., E.F. Landry and M.Z. Thomas. 1983. Entrainment of Viruses from Septic Tank Leach Fields Through a Shallow, Sandy Soil Aquifer. Appl. Environ. Micro. 45(5):1474-1480.
WSAS Field Study Final Report, April 16, 2001 33

WSAS Field Study Final Report, April 16, 2001 34
7.0 APPENDIX

House
Septic Tank
Scale:
~ 10 ft.
Vent
B = corehole location*
*
*
** * B1
B4
B3
B2
B5 54 ft
6.5 ft
6.5 ft
54 ft
House
Septic Tank
Scale:
~ 10 ft.
Vent
B = corehole location*
*
*
** * B1
B4
B3
B2
B5 54 ft54 ft
6.5 ft
6.5 ft
54 ft
Fig. A.1. Soil core locations at home site Id# 10, aggregate-laden.
Scale:
~ 10 ft.
B = corehole location*
House
Septic Tank
Vents
51 ft 59 ft
44 ft
**
* B2
B1
Bkgd
Scale:
~ 10 ft.
B = corehole location*
House
Septic Tank
Vents
51 ft 59 ft
44 ft
**
* B2
B1
Bkgd
Fig. A.2. Soil core locations at home site Id# 12, aggregate-free.
WSAS Field Study Final Report, April 16, 2001 35

Scale:
~ 10 ft.
B = corehole location*
House
Septic Tank
~60 ft
Vent
~50 ft
46 ft
*
*
* B2
B1
Bkgd
Scale:
~ 10 ft.
B = corehole location*
House
Septic Tank
~60 ft
Vent
~50 ft
46 ft
*
*
* B2
B1
Bkgd
Fig. A.3. Soil core locations at home site Id# 14, aggregate-free.
House / Garage
~30 ft
~45 ft
* Bkgd
48 ft
Vent
46 ft
Scale:
~ 10 ft.
B = corehole location*
* B1
* B2
House / Garage
~30 ft
~45 ft
* Bkgd
48 ft
Vent
46 ft
Scale:
~ 10 ft.
B = corehole location*
* B1
* B2
Fig. A.4. Soil core locations at home site Id# 16, aggregate-free.
WSAS Field Study Final Report, April 16, 2001 36

0
5
10
15
20
25
30
0-5 10-15 25-30 55-60
Depth below Infiltrative Surface (cm)
Avai
labl
e P
(mg-
P/kg
)
Fig. A.5. Available phosphorus in soil core samples by depth below the infiltrative surface
(in mg-P/kg dry soil). Background soil core data are excluded.
0.0
0.2
0.4
0.6
0.8
1.0
1.2
1.4
0-5 10-15 25-30 55-60
Depth below Infiltrative Surface (cm)
% (d
ry w
t.) O
rgan
ic M
atte
r
Fig. A.6. Organic matter in soil core samples by depth below the infiltrative surface.
Background soil core data are excluded.
WSAS Field Study Final Report, April 16, 2001 37

Table A.1. Characteristics of STE samples collected from Site Id# 10, gravel system.
Site pH Alk. COD cBOD5 TS TSS TN NH4 NO3 TP FC Id# mg/L as CaCO3 mg/L mg/L mg/L mg/L mg/L as N mg/L as N mg/L as N mg/L as P cfu/100 mL 10 7.57 494 482 218 1035 162 52 49.9 0.6 11.9 1.40E+05
- - 481 - 1020 150 76 47.3 0.8 - - 7.49 508 576 230 1195 148 64 47.7 0.8 8.9 1.40E+05 - - 543 - 1155 245 60 48.2 0.5 13.9 - 7.54 518 369 30.6 990 - 84 54.2 0.8 11.2 2.30E+05 - - - - 965 200 60 44.2 0.5 2.2 2.00E+05 7.38 524 - 34.2 630 245 64 44.4 0.4 3.6 3.20E+05 - - - - 1080 275 72 44.0 0.4 15.0 2.80E+05
min. 7.38 494 369 30.6 630 148 52 44.0 0.4 2.2 1.40E+05max. 7.57 524 576 230.0 1195 275 84 54.2 0.8 15.0 3.20E+05median 7.52 513 482 126.1 1028 200 64 47.5 0.6 11.2 2.15E+05ave. 7.50 511 490.2 128.2 1009 204 67 47.5 0.6 9.5 2.18E+05- = no data. Table A.2. Characteristics of STE samples collected from Site Id# 12, chamber system.
Site pH Alk. COD cBOD5 TS TSS TN NH4 NO3 TP FC Id# mg/L as CaCO3 mg/L mg/L mg/L mg/L mg/L as N mg/L as N mg/L as N mg/L as P cfu/100 mL 12 8.32 476 376 - 1265 455 40 29.4 0.5 12 4.60E+06
- - 372 - 1255 550 48 28.8 0.5 12.2 - 8.25 506 423 - 1300 140 72 31.4 0.6 13.2 8.20E+06 - - 403 - 1340 285 64 30.2 0.5 14.6 - 8.55 580 442 42.6 1410 310 32 34.4 1 5.6 1.77E+07 - - - - 1435 375 32 37 ND 6.7 1.91E+07 8.5 588 - 37.2 1415 365 32 32 0.8 4.8 2.64E+07 - - - - 1360 480 32 37.2 0.6 13.6 1.38E+07
min 8.25 476 372 37.2 1255 140 32 28.8 0.5 4.8 4.60E+06max 8.55 588 442 42.6 1435 550 72 37.2 1.0 14.6 2.64E+07median 8.41 543 403 39.9 1350 370 36 31.7 0.6 12.1 1.58E+07
ave. 8.41 537.5 403.2 39.9 1348 370 44 32.6 0.6 10.3 1.50E+07- = no data. ND = non detect
WSAS Field Study Final Report, April 16, 2001 38

Table A.3. Characteristics of STE samples collected from Site Id# 14, chamber system.
Site pH Alk. COD cBOD5 TS TSS TN NH4 NO3 TP FC Id# mg/L as CaCO3 mg/L mg/L mg/L mg/L mg/L as N mg/L as N mg/L as N mg/L as P cfu/100 mL 14 7.34 540 688 - 1250 110 76 71 0.7 20.7 7.60E+06
- - 674 - 1190 140 80 68.6 0.6 19.5 - 7.34 546 701 - 1235 135 76 75 0.5 19.6 7.80E+06 - - 703 - 1225 135 80 71 0.6 23.7 - 6.98 546 786 389.4 1170 215 64 63.6 1.1 19.3 1.45E+07 - - - - 1200 190 68 66.4 1.1 9.7 4.30E+06 7.23 578 - 67.2 1265 195 71 57.6 0.6 31.2 7.10E+06 - - - - 1255 210 68 59.4 0.7 16.8 2.40E+06
min 6.98 540 674 67.2 1170 110 64 57.6 0.5 9.7 2.40E+06max 7.34 578 786 389.4 1265 215 80 75.0 1.1 31.2 1.45E+07median 7.29 546 701 228.3 1230 165 74 67.5 0.7 19.6 7.35E+06ave. 7.22 552.5 710.4 228.3 1224 166 73 66.6 0.7 20.1 7.28E+06- = no data. Table A.4. Characteristics of STE samples collected from Site Id# 16, chamber system.
Site pH Alk. COD cBOD5 TS TSS TN NH4 NO3 TP FC Id# mg/L as CaCO3 mg/L mg/L mg/L mg/L mg/L as N mg/L as N mg/L as N mg/L as P cfu/100 mL 16 7.12 620 657 - 1245 70 64 42.2 0.6 12.8 5.40E+06
- - 653 - 1250 80 64 42.2 0.6 14.6 - 7.1 464 604 - 1145 35 40 43.8 0.7 13.2 - - - 608 - 1215 105 40 41.2 0.6 10.8 - 7.18 548 620 49.2 1045 75 40 41.6 0.9 5 5.20E+06 - - - - 1100 85 44 38.4 0.7 8.4 8.60E+06 7.15 518 - 120 1225 145 52 39.2 0.6 17.9 6.00E+06 - - - - 1260 155 52 39.2 0.7 21.8 1.17E+07
min 7.10 464 604 49.2 1045 35 40 38.4 0.6 5.0 5.20E+06max 7.18 620 657 120.0 1260 155 64 43.8 0.9 21.8 1.17E+07median 7.14 533 620 84.6 1220 83 48 41.4 0.7 13.0 6.00E+06ave. 7.14 537.5 628.4 84.6 1186 94 50 41.0 0.7 13.1 7.38E+06- = no data.
WSAS Field Study Final Report, April 16, 2001 39

Table A.5. Summary of soil core data collected in Phase 2.1
Site Sample Ponding Depth Color pH WC Org Mat TN NH4 NO3 TP Avail P FC
Id# Location (y/n) (cm) % % mg/kg as
N mg/kg as
N mg/kg as
N mg/kg as P mg/kg as P cfu/g dry soil 10 B2 no, wet 0-5 10YR4/3 - 10.4 - - - - - - ND 10-15 7.5YR4/4 - 12.7 - - - - - - ND 25-30 10YR4/4 - 11.8 - - - - - - ND 55-60 10YR4/3 - 12.5 - - - - - - ND B4 yes 0-5 7.5YR4/3 7.1 11.3 0.7 386.90 19.69 2.69 721.57 27 7.E+01 10-15 10YR3/4 7.4 12.5 0.5 295.62 10.06 1.12 402.17 13 5.E+01 25-30 10YR5/6 7.4 13.2 0.6 186.85 8.69 2.44 221.72 11 2.E+01 55-60 7.5YR4/4 7.2 12.7 0.5 302.00 8.80 3.50 390.89 10 ND12 Bkgd2 NA 0-5 10YR5/2 - 20.6 - - - - - - ND 10-15 10YR6/3 - 10.2 - - - - - - ND 25-30 10YR6/3 - 14.3 - - - - - - ND 55-60 10YR6/4 - 1.9 - - - - - - ND B1 no, wet 0-5 - 8.6 23.7 1.0 836.61 9.16 7.82 807.65 27 7.E+03 0-5 - - 25.3 - - - - - - 2.E+04 10-15 10YR5/3 8.9 24.1 0.6 402.85 8.94 4.85 558.38 7 4.E+02 10-15 10YR5/3 - 24.2 - - - - - - 7.E+02 25-30 10YR5/3 9.2 26.0 0.6 382.67 5.73 7.24 569.91 2 4.E+01 25-30 10YR5/3 - 26.0 - - - - - - 4.E+01 55-60 10YR5/3 9.2 18.1 0.5 305.88 5.98 5.68 447.98 2 ND 55-60 10YR5/3 - 18.1 - - - - - - ND B2 yes 0-5 10YR4/4 8.5 26.9 0.5 513.33 10.94 9.83 629.93 7 3.E+02 10-15 10YR5/6 8.9 27.6 0.4 298.60 6.31 6.62 395.31 2 ND 25-30 10YR4/4 8.9 20.1 0.5 337.83 6.22 4.19 575.52 2 2.E+02 55-60 10YR4/4 8.6 26.6 0.4 327.10 9.69 10.44 380.04 2 ND- = no data, NA = not applicable, ND = not detected. 1 Results expressed on dry weight basis. 2 Bkgd = background cores, soil samples taken at stated distance below infiltrative surface.
WSAS Field Study Final Report, April 16, 2001 40

Table A.5 (cont). Summary of soil core data collected in Phase 2.1
Site Sample Ponding Depth Color pH WC Org Mat TN NH4 NO3 TP Avail P FC
Id# Location (y/n) (cm) % % mg/kg as
N mg/kg as
N mg/kg as
N mg/kg as P mg/kg as P cfu/g dry soil 14 Bkgd NA 0-5 10YR5/6 - 15.0 - - - - - - 9.E+00 10-15 10YR5/6 - 12.9 - - - - - - 3.E+01 25-30 10YR5/6 - 13.0 - - - - - - 9.E+00 55-60 10YR5/6 - 13.7 - - - - - - 2.E+01 B1 no, wet 0-5 10YR4/4 8.6 30.5 1.0 744.04 8.96 13.31 704.43 1 2.E+02 10-15 10YR4/4 8.8 24.3 0.9 604.70 5.70 12.90 487.40 17 ND 25-30 10YR4/4 8.8 23.7 0.8 496.39 6.32 12.52 446.77 1 ND 55-60 10YR5/4 9.0 26.8 0.7 401.79 5.69 11.77 436.65 1 ND B2 yes 0-5 mottled 8.1 35.6 1.3 1110.91 46.95 3.36 971.93 21 9.E+02 0-5 mottled - 34.4 - - - - - - 1.E+03 10-15 10YR4/4 8.8 24.7 0.8 607.24 7.60 2.14 583.54 1 2.E+02 10-15 10YR4/4 - 24.7 - - - - - - 7.E+01 25-30 10YR4/4 8.9 24.1 0.7 447.41 6.30 3.27 572.41 1 2.E+01 25-30 10YR4/4 - 23.8 - - - - - - 1.E+01 55-60 10YR4/4 8.8 22.8 0.7 413.33 6.35 3.62 441.95 2 ND 55-60 10YR4/4 - 22.7 - - - - - - ND16 Bkgd NA 0-5 7.5YR3/3 - 22.4 - - - - - - ND 10-15 7.5YR3/3 - 22.4 - - - - - - ND 25-30 10YR5/6 - 31.1 - - - - - - ND 55-60 10YR5/6 - 25.0 - - - - - - ND 10YR4/6 B1 yes 0-5 8.0 24.2 0.6 594.55 117.30 1.16 394.18 3 ND 0-5 10YR4/6 - 24.4 - - - - - - ND 10-15 10YR4/6 7.9 24.6 0.8 575.79 54.61 1.11 421.53 4 ND 10-15 10YR4/6 - 23.1 - - - - - - ND 25-30 10YR4/6 8.5 21.8 0.6 410.46 11.90 1.22 466.15 3 ND 25-30 10YR4/6 - - - - - - - - ND 55-60 10YR5/4 8.2 28.5 0.6 387.36 19.55 1.83 292.51 3 ND 55-60 10YR5/4 - 27.7 - - - - - - ND B2 yes 0-5 mottled 8.1 26.3 0.8 722.71 113.43 0.15 319.22 4 1.E+01 10-15 10YR4/3 8.0 26.0 0.8 568.89 22.15 1.86 311.61 6 ND- = no data, NA = not applicable, ND = not detected. 1 Results expressed on dry weight basis.
WSAS Field Study Final Report, April 16, 2001 41

2 Bkgd = background cores, soil samples taken at stated distance below infiltrative surface.
WSAS Field Study Final Report, April 16, 2001 42
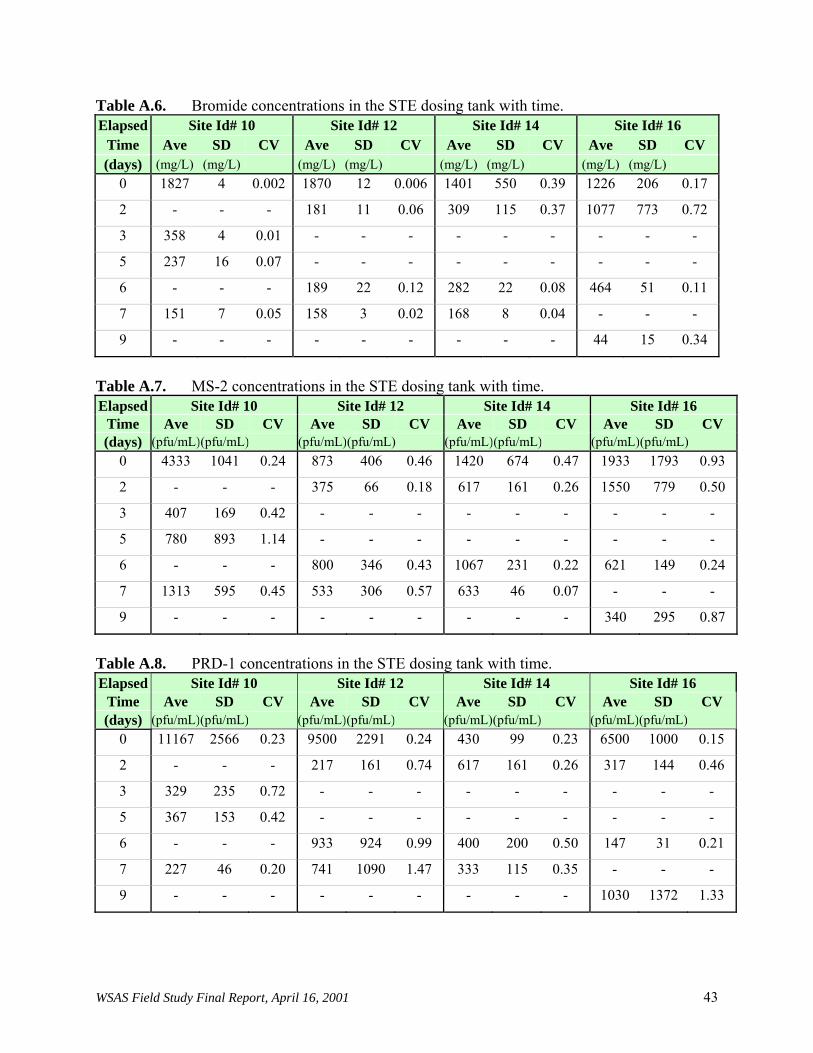
Table A.6. Bromide concentrations in the STE dosing tank with time. Elapsed Site Id# 10 Site Id# 12 Site Id# 14 Site Id# 16
Time Ave SD CV Ave SD CV Ave SD CV Ave SD CV (days) (mg/L) (mg/L) (mg/L) (mg/L) (mg/L) (mg/L) (mg/L) (mg/L)
0 1827 4 0.002 1870 12 0.006 1401 550 0.39 1226 206 0.17
2 - - - 181 11 0.06 309 115 0.37 1077 773 0.72
3 358 4 0.01 - - - - - - - - -
5 237 16 0.07 - - - - - - - - -
6 - - - 189 22 0.12 282 22 0.08 464 51 0.11
7 151 7 0.05 158 3 0.02 168 8 0.04 - - -
9 - - - - - - - - - 44 15 0.34
Table A.7. MS-2 concentrations in the STE dosing tank with time. Elapsed Site Id# 10 Site Id# 12 Site Id# 14 Site Id# 16
Time Ave SD CV Ave SD CV Ave SD CV Ave SD CV (days) (pfu/mL)(pfu/mL) (pfu/mL)(pfu/mL) (pfu/mL)(pfu/mL) (pfu/mL)(pfu/mL)
0 4333 1041 0.24 873 406 0.46 1420 674 0.47 1933 1793 0.93
2 - - - 375 66 0.18 617 161 0.26 1550 779 0.50
3 407 169 0.42 - - - - - - - - -
5 780 893 1.14 - - - - - - - - -
6 - - - 800 346 0.43 1067 231 0.22 621 149 0.24
7 1313 595 0.45 533 306 0.57 633 46 0.07 - - -
9 - - - - - - - - - 340 295 0.87
Table A.8. PRD-1 concentrations in the STE dosing tank with time. Elapsed Site Id# 10 Site Id# 12 Site Id# 14 Site Id# 16
Time Ave SD CV Ave SD CV Ave SD CV Ave SD CV (days) (pfu/mL)(pfu/mL) (pfu/mL)(pfu/mL) (pfu/mL)(pfu/mL) (pfu/mL)(pfu/mL)
0 11167 2566 0.23 9500 2291 0.24 430 99 0.23 6500 1000 0.15
2 - - - 217 161 0.74 617 161 0.26 317 144 0.46
3 329 235 0.72 - - - - - - - - -
5 367 153 0.42 - - - - - - - - -
6 - - - 933 924 0.99 400 200 0.50 147 31 0.21
7 227 46 0.20 741 1090 1.47 333 115 0.35 - - -
9 - - - - - - - - - 1030 1372 1.33
WSAS Field Study Final Report, April 16, 2001 43

Table A.9. Bromide and MS-2 and PRD-1 bacteriophages in soil with depth.
Br MS-2 PRD-1 Site Sample Ponding Depth mg/kg pfu/g dry soil pfu/g dry soil Id# Location (y/n) (cm) dry soil or pfu/mL or pfu/mL
10 B2 no, wet 0-5 1.6 ND ND 10-15 0.8 ND ND 25-30 0.5 ND ND 55-60 0.2 ND ND B4 yes ponding 143.5 940.0 196.0 0-5 18.0 126.0 ND 10-15 23.7 18.0 ND 25-30 12.4 ND ND 55-60 0.2 ND ND 12 Bkgd NA 0-5 <0.1 ND ND 10-15 <0.1 ND ND 25-30 <0.1 ND ND 55-60 <0.1 ND ND B1 no, wet 0-5 22.4 210.0 ND 0-5 D 24.9 214.0 ND 10-15 20.5 21.0 ND 10-15 D 21.3 ND ND 25-30 9.5 ND ND 25-30 D 8.0 ND ND 55-60 0.1 ND ND 55-60 D 0.1 ND ND B2 yes ponding 42.7 640.0 64.0 0-5 19.1 22.0 ND 10-15 7.9 ND ND 25-30 3.6 ND ND 55-60 <0.1 ND ND B = corehole location Bkgd = background corehole location D = duplicate NA = not applicable ND = non detect - = not analyzed (insufficient sample volume)
WSAS Field Study Final Report, April 16, 2001 44

Table A.9. (cont). Bromide and MS-2 and PRD-1 bacteriophages in soil with depth.
Br MS-2 PRD-1 Site Sample Ponding Depth mg/kg pfu/g dry soil pfu/g dry soil Id# Location (y/n) (cm) dry soil or pfu/mL or pfu/mL 14 Bkgd NA 0-5 0.1 ND ND 10-15 0.4 ND ND 25-30 0.3 ND ND 55-60 <0.1 ND ND B1 no, wet 0-5 7.8 ND ND 10-15 0.1 ND ND 25-30 <0.1 ND ND 55-60 <0.1 ND ND B2 yes ponding 174.3 800.0 200.0 0-5 21.7 497.0 ND 0-5 D 24.7 244.0 ND 10-15 2.9 ND ND 10-15 D 3.3 ND ND 25-30 0.9 ND ND 25-30 D 0.6 ND ND 55-60 <0.1 ND ND 55-60 D <0.1 ND ND 16 Bkgd NA 0-5 1.8 ND ND 10-15 - ND ND 25-30 - ND ND 55-60 - ND ND B1 yes ponding 61 52.0 2000.0 0-5 0.6 ND ND 0-5 D 0.4 ND ND 10-15 0.6 ND ND 25-30 0.5 ND ND 25-30 D 0.7 ND ND 55-60 1.0 ND ND 55-60 D 0.9 ND ND B2 yes ponding 62.0 ND 200.0 0-5 0.3 ND ND 10-15 0.2 ND ND B = corehole location Bkgd = background corehole location D = duplicate NA = not applicable ND = non detect - = not analyzed (insufficient sample volume)
WSAS Field Study Final Report, April 16, 2001 45

Table A.10. Relationship of fecal coliforms and bacteriophage in soil core samples collected below the infiltrative surface (Background locations removed from comparison).
Depth FC MS-2 PRD-1 Ratios (cm) cfu/g dry soil pfu/g dry soil pfu/g dry soil FC/MS-2 FC/PRD-1
5 2.E+04 214 ND 115.03 5 7.E+03 210 ND 34.94 5 1.E+03 244 ND 5.50 5 9.E+02 497 ND 1.75 5 3.E+02 22 ND 14.91 5 2.E+02 ND ND 5 7.E+01 126 ND 0.57 5 1.E+01 ND ND 5 ND ND ND 5 ND ND ND 5 ND ND ND
15 7.E+02 ND ND 15 4.E+02 21 ND 20.07 15 2.E+02 ND ND 15 7.E+01 ND ND 15 5.E+01 18 ND 3.05 15 ND ND ND 15 ND ND ND 15 ND ND ND 15 ND ND ND 15 ND ND ND 15 ND ND ND 30 2.E+02 ND ND 30 4.E+01 ND ND 30 4.E+01 ND ND 30 2.E+01 ND ND 30 2.E+01 ND ND 30 1.E+01 ND ND 30 ND ND ND 30 ND ND ND 30 ND ND ND 30 ND ND ND 60 ND ND ND 60 ND ND ND 60 ND ND ND 60 ND ND ND 60 ND ND ND 60 ND ND ND 60 ND ND ND 60 ND ND ND 60 ND ND ND 60 ND ND ND
ND = non detect
WSAS Field Study Final Report, April 16, 2001 46

Table A.11. Estimated virus treatment efficiency.
MS-2
Home Site Id# 10 12 14 16
Depth below IS 5cm 15cm 30cm 5cm 15cm 30cm 5cm 15cm 30cm 5cm 15cm 30cm 126 18 1 210 21 1 1 1 1 1 1 1 1 1 1 214 1 1 497 1 1 1 1 1 22 1 1 244 1 1 1 1 1
Median (pfu/g) 63.5 9.5 1 210 1 1 244 1 1 1 1 1Median (pfu/mL) 522.63 78.19 8.23 879.77 4.19 4.19 921.10 3.78 3.78 3.97 3.97 3.97
Initial Tank Conc. 4333 4333 4333 873 873 873 1420 1420 1420 1933 1933 1933% Reduction 87.94 98.20 99.81 -0.77 99.52 99.52 35.13 99.73 99.73 99.79 99.79 99.79
PRD-1
Home Site Id# 10 12 14 16Depth below IS 5cm 15cm 30cm 5cm 15cm 30cm 5cm 15cm 30cm 5cm 15cm 30cm
1 1 1 1 1 1 1 1 1 1 1 1 1 1 1 1 1 1 1 1 1 1 1 1 1 1 1 1 1 1 1 1 1 1 1 1
Median (pfu/g) 1 1 1 1 1 1 1 1 1 1 1 1Median (pfu/mL) 8.23 8.23 8.23 4.19 4.19 4.19 3.78 3.78 3.78 3.97 3.97 3.97
Initial Tank Conc. 11167 11167 11167 9500 9500 9500 430 430 430 6500 6500 6500% Reduction 99.93 99.93 99.93 99.96 99.96 99.96 99.12 99.12 99.12 99.94 99.94 99.94
Note: Bacteriophage detection limits of 1 pfu/g dry soil.
WSAS Field Study Final Report, April 16, 2001 47