Embed Size (px)
Citation preview
1
Wastewater Treatment Update
Mexico
Elias Freig MPA; MS; JD GMI Municipal Wastewater Subcommittee Meeting Singapore, 2-3 July 2012
2
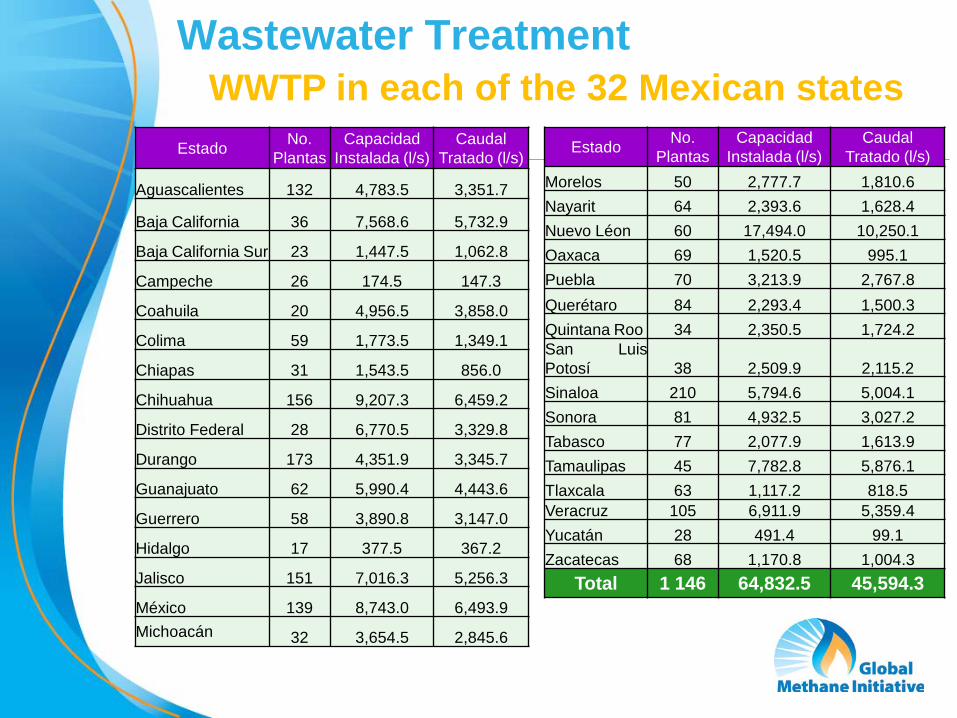
Wastewater Treatment WWTP in each of the 32 Mexican states
Estado No. Plantas
Capacidad Instalada (l/s)
Caudal Tratado (l/s)
Aguascalientes 132 4,783.5 3,351.7
Baja California 36 7,568.6 5,732.9
Baja California Sur 23 1,447.5 1,062.8
Campeche 26 174.5 147.3
Coahuila 20 4,956.5 3,858.0
Colima 59 1,773.5 1,349.1
Chiapas 31 1,543.5 856.0
Chihuahua 156 9,207.3 6,459.2
Distrito Federal 28 6,770.5 3,329.8
Durango 173 4,351.9 3,345.7
Guanajuato 62 5,990.4 4,443.6
Guerrero 58 3,890.8 3,147.0
Hidalgo 17 377.5 367.2
Jalisco 151 7,016.3 5,256.3
México 139 8,743.0 6,493.9 Michoacán 32 3,654.5 2,845.6
Estado No. Plantas
Capacidad Instalada (l/s)
Caudal Tratado (l/s)
Morelos 50 2,777.7 1,810.6 Nayarit 64 2,393.6 1,628.4 Nuevo Léon 60 17,494.0 10,250.1 Oaxaca 69 1,520.5 995.1 Puebla 70 3,213.9 2,767.8 Querétaro 84 2,293.4 1,500.3 Quintana Roo 34 2,350.5 1,724.2 San Luis Potosí 38 2,509.9 2,115.2 Sinaloa 210 5,794.6 5,004.1 Sonora 81 4,932.5 3,027.2 Tabasco 77 2,077.9 1,613.9 Tamaulipas 45 7,782.8 5,876.1 Tlaxcala 63 1,117.2 818.5 Veracruz 105 6,911.9 5,359.4 Yucatán 28 491.4 99.1 Zacatecas 68 1,170.8 1,004.3
Total 1 146 64,832.5 45,594.3
3
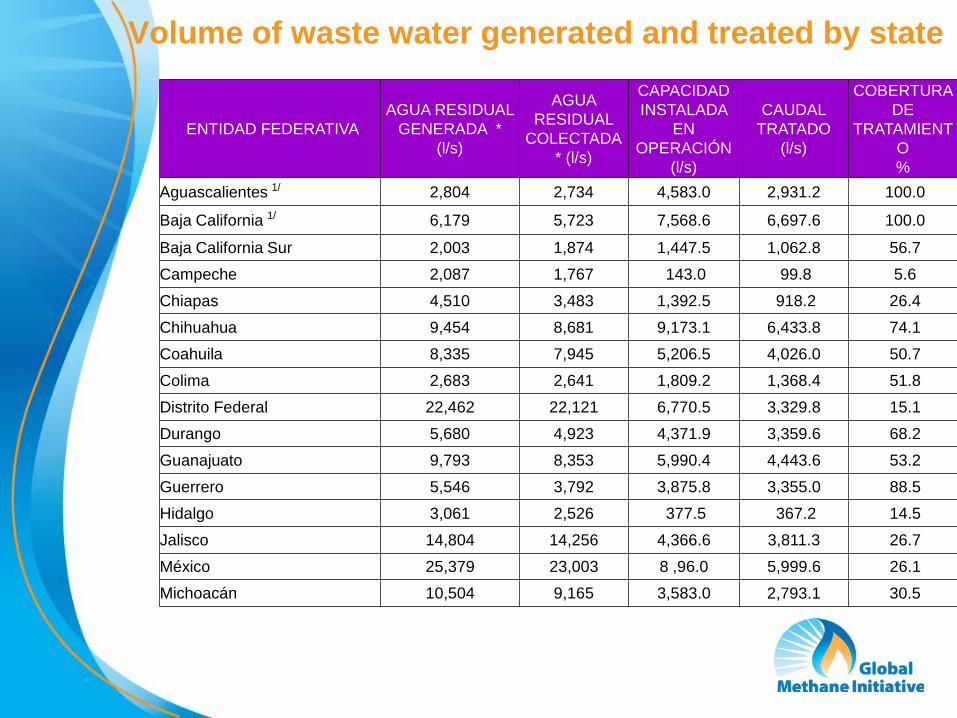
Volume of waste water generated and treated by state
ENTIDAD FEDERATIVA AGUA RESIDUAL
GENERADA * (l/s)
AGUA RESIDUAL
COLECTADA * (l/s)
CAPACIDAD INSTALADA
EN OPERACIÓN
(l/s)
CAUDAL TRATADO
(l/s)
COBERTURA DE
TRATAMIENTO %
Aguascalientes 1/ 2,804 2,734 4,583.0 2,931.2 100.0
Baja California 1/ 6,179 5,723 7,568.6 6,697.6 100.0 Baja California Sur 2,003 1,874 1,447.5 1,062.8 56.7 Campeche 2,087 1,767 143.0 99.8 5.6 Chiapas 4,510 3,483 1,392.5 918.2 26.4 Chihuahua 9,454 8,681 9,173.1 6,433.8 74.1 Coahuila 8,335 7,945 5,206.5 4,026.0 50.7 Colima 2,683 2,641 1,809.2 1,368.4 51.8 Distrito Federal 22,462 22,121 6,770.5 3,329.8 15.1 Durango 5,680 4,923 4,371.9 3,359.6 68.2 Guanajuato 9,793 8,353 5,990.4 4,443.6 53.2 Guerrero 5,546 3,792 3,875.8 3,355.0 88.5 Hidalgo 3,061 2,526 377.5 367.2 14.5 Jalisco 14,804 14,256 4,366.6 3,811.3 26.7 México 25,379 23,003 8 ,96.0 5,999.6 26.1 Michoacán 10,504 9,165 3,583.0 2,793.1 30.5
4
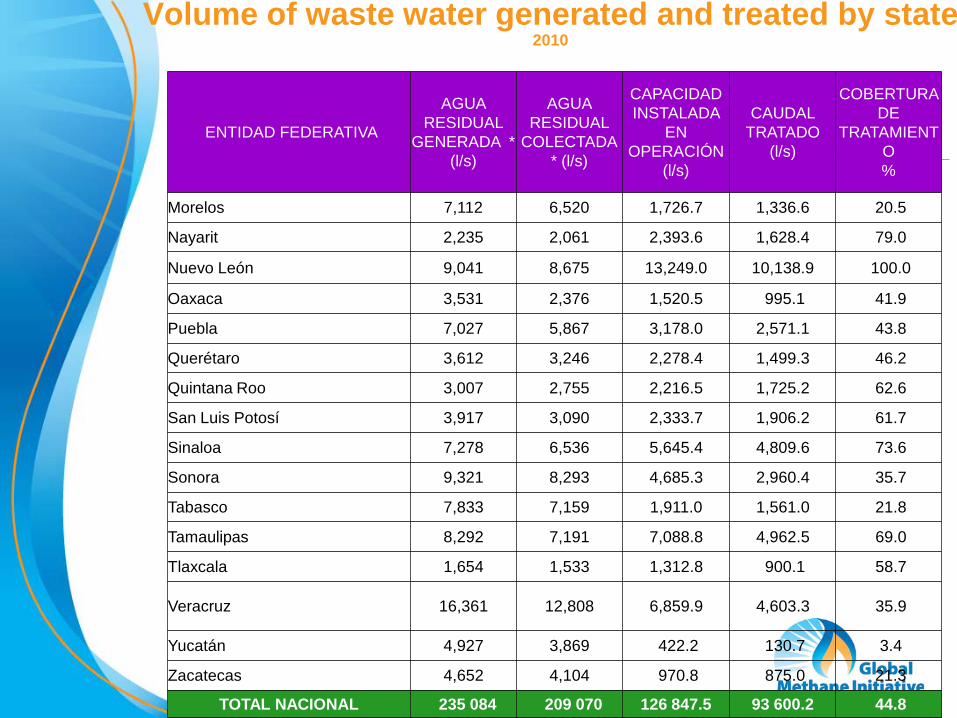
Volume of waste water generated and treated by state 2010
ENTIDAD FEDERATIVA
AGUA RESIDUAL
GENERADA * (l/s)
AGUA RESIDUAL
COLECTADA * (l/s)
CAPACIDAD INSTALADA
EN OPERACIÓN
(l/s)
CAUDAL TRATADO
(l/s)
COBERTURA DE
TRATAMIENTO %
Morelos 7,112 6,520 1,726.7 1,336.6 20.5
Nayarit 2,235 2,061 2,393.6 1,628.4 79.0
Nuevo León 9,041 8,675 13,249.0 10,138.9 100.0
Oaxaca 3,531 2,376 1,520.5 995.1 41.9
Puebla 7,027 5,867 3,178.0 2,571.1 43.8
Querétaro 3,612 3,246 2,278.4 1,499.3 46.2
Quintana Roo 3,007 2,755 2,216.5 1,725.2 62.6
San Luis Potosí 3,917 3,090 2,333.7 1,906.2 61.7
Sinaloa 7,278 6,536 5,645.4 4,809.6 73.6
Sonora 9,321 8,293 4,685.3 2,960.4 35.7
Tabasco 7,833 7,159 1,911.0 1,561.0 21.8
Tamaulipas 8,292 7,191 7,088.8 4,962.5 69.0
Tlaxcala 1,654 1,533 1,312.8 900.1 58.7
Veracruz 16,361 12,808 6,859.9 4,603.3 35.9
Yucatán 4,927 3,869 422.2 130.7 3.4
Zacatecas 4,652 4,104 970.8 875.0 21.3
TOTAL NACIONAL 235 084 209 070 126 847.5 93 600.2 44.8
5
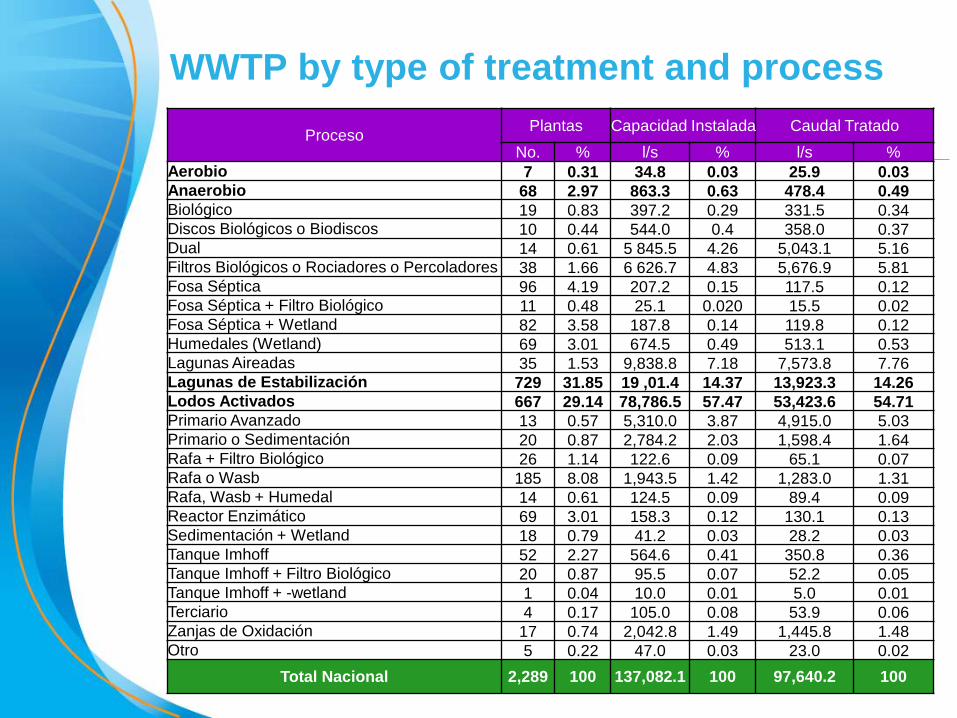
WWTP by type of treatment and process Proceso Plantas Capacidad Instalada Caudal Tratado
No. % l/s % l/s % Aerobio 7 0.31 34.8 0.03 25.9 0.03 Anaerobio 68 2.97 863.3 0.63 478.4 0.49 Biológico 19 0.83 397.2 0.29 331.5 0.34 Discos Biológicos o Biodiscos 10 0.44 544.0 0.4 358.0 0.37 Dual 14 0.61 5 845.5 4.26 5,043.1 5.16 Filtros Biológicos o Rociadores o Percoladores 38 1.66 6 626.7 4.83 5,676.9 5.81 Fosa Séptica 96 4.19 207.2 0.15 117.5 0.12 Fosa Séptica + Filtro Biológico 11 0.48 25.1 0.020 15.5 0.02 Fosa Séptica + Wetland 82 3.58 187.8 0.14 119.8 0.12 Humedales (Wetland) 69 3.01 674.5 0.49 513.1 0.53 Lagunas Aireadas 35 1.53 9,838.8 7.18 7,573.8 7.76 Lagunas de Estabilización 729 31.85 19 ,01.4 14.37 13,923.3 14.26 Lodos Activados 667 29.14 78,786.5 57.47 53,423.6 54.71 Primario Avanzado 13 0.57 5,310.0 3.87 4,915.0 5.03 Primario o Sedimentación 20 0.87 2,784.2 2.03 1,598.4 1.64 Rafa + Filtro Biológico 26 1.14 122.6 0.09 65.1 0.07 Rafa o Wasb 185 8.08 1,943.5 1.42 1,283.0 1.31 Rafa, Wasb + Humedal 14 0.61 124.5 0.09 89.4 0.09 Reactor Enzimático 69 3.01 158.3 0.12 130.1 0.13 Sedimentación + Wetland 18 0.79 41.2 0.03 28.2 0.03 Tanque Imhoff 52 2.27 564.6 0.41 350.8 0.36 Tanque Imhoff + Filtro Biológico 20 0.87 95.5 0.07 52.2 0.05 Tanque Imhoff + -wetland 1 0.04 10.0 0.01 5.0 0.01 Terciario 4 0.17 105.0 0.08 53.9 0.06 Zanjas de Oxidación 17 0.74 2,042.8 1.49 1,445.8 1.48 Otro 5 0.22 47.0 0.03 23.0 0.02
Total Nacional 2,289 100 137,082.1 100 97,640.2 100
6
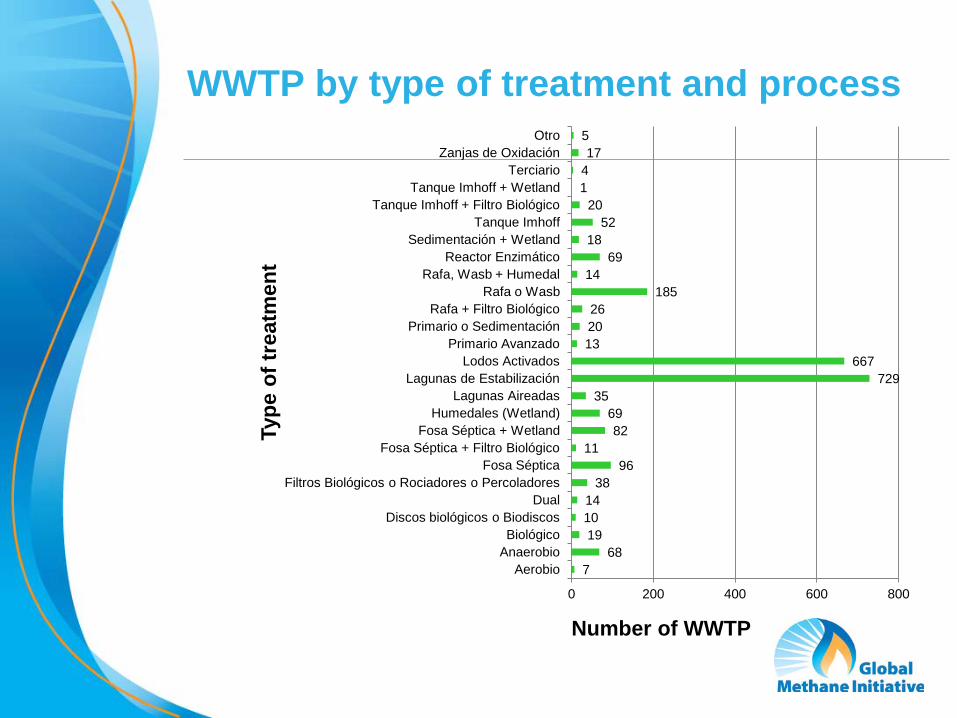
7 68
19 10 14
38 96
11 82
69 35
729 667
13 20 26
185 14
69 18
52 20
1 4 17
5
0 200 400 600 800
Aerobio Anaerobio Biológico
Discos biológicos o Biodiscos Dual
Filtros Biológicos o Rociadores o Percoladores Fosa Séptica
Fosa Séptica + Filtro Biológico Fosa Séptica + Wetland
Humedales (Wetland) Lagunas Aireadas
Lagunas de Estabilización Lodos Activados
Primario Avanzado Primario o Sedimentación
Rafa + Filtro Biológico Rafa o Wasb
Rafa, Wasb + Humedal Reactor Enzimático
Sedimentación + Wetland Tanque Imhoff
Tanque Imhoff + Filtro Biológico Tanque Imhoff + Wetland
Terciario Zanjas de Oxidación
Otro
Number of WWTP
Type
of t
reat
men
t
WWTP by type of treatment and process
7
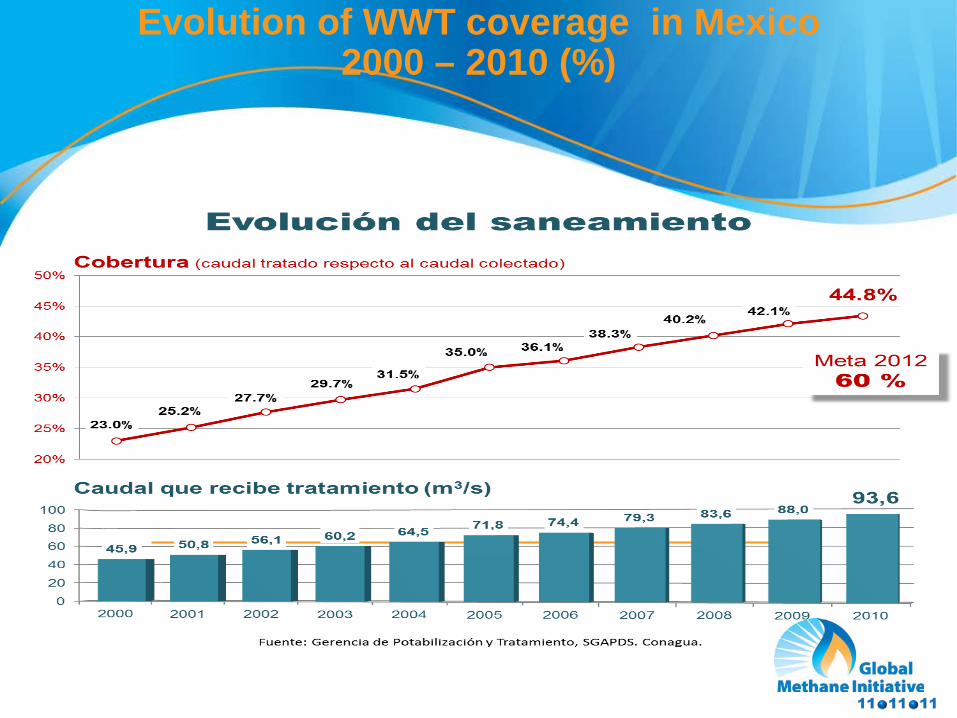
Evolution of WWT coverage in Mexico 2000 – 2010 (%)
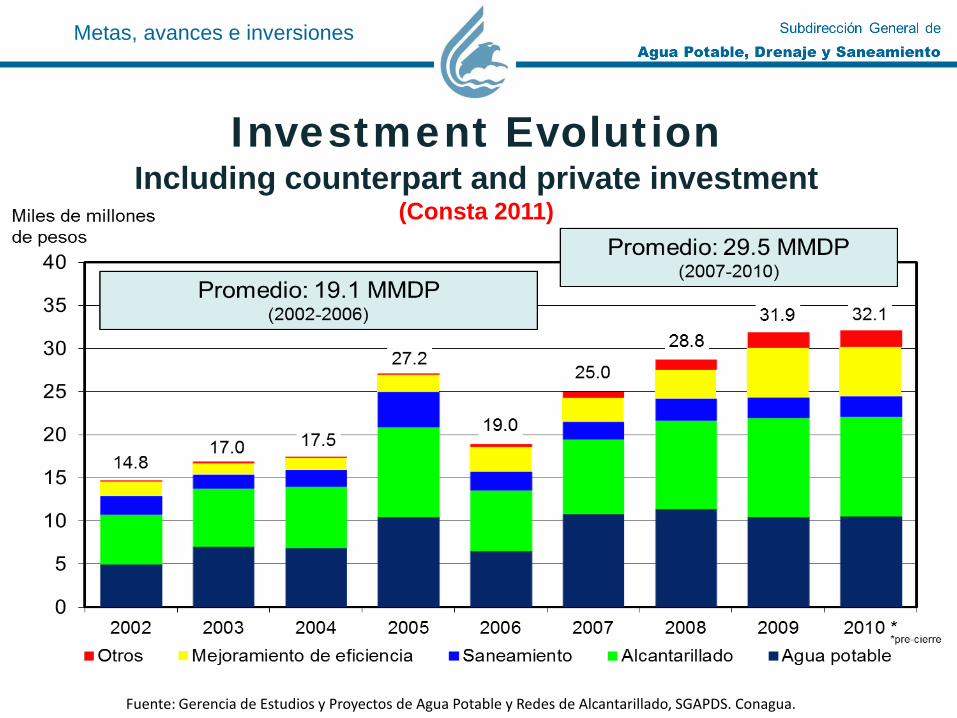
Investment Evolution Including counterpart and private investment
(Consta 2011)
Metas, avances e inversiones
Fuente: Gerencia de Estudios y Proyectos de Agua Potable y Redes de Alcantarillado, SGAPDS. Conagua.
9
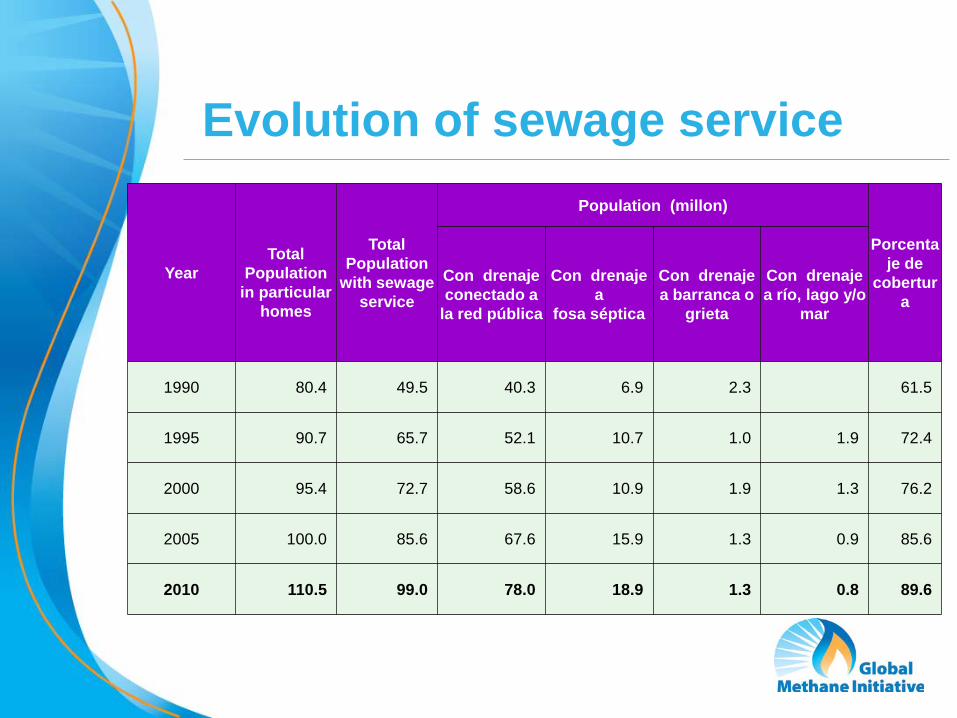
Evolution of sewage service
Year
Total
Population in particular
homes
Total Population
with sewage service
Population (millon)
Porcentaje de
cobertura
Con drenaje conectado a
la red pública
Con drenaje a
fosa séptica
Con drenaje a barranca o
grieta
Con drenaje a río, lago y/o
mar
1990 80.4 49.5 40.3 6.9 2.3 61.5
1995 90.7 65.7 52.1 10.7 1.0 1.9 72.4
2000 95.4 72.7 58.6 10.9 1.9 1.3 76.2
2005 100.0 85.6 67.6 15.9 1.3 0.9 85.6
2010 110.5 99.0 78.0 18.9 1.3 0.8 89.6
10
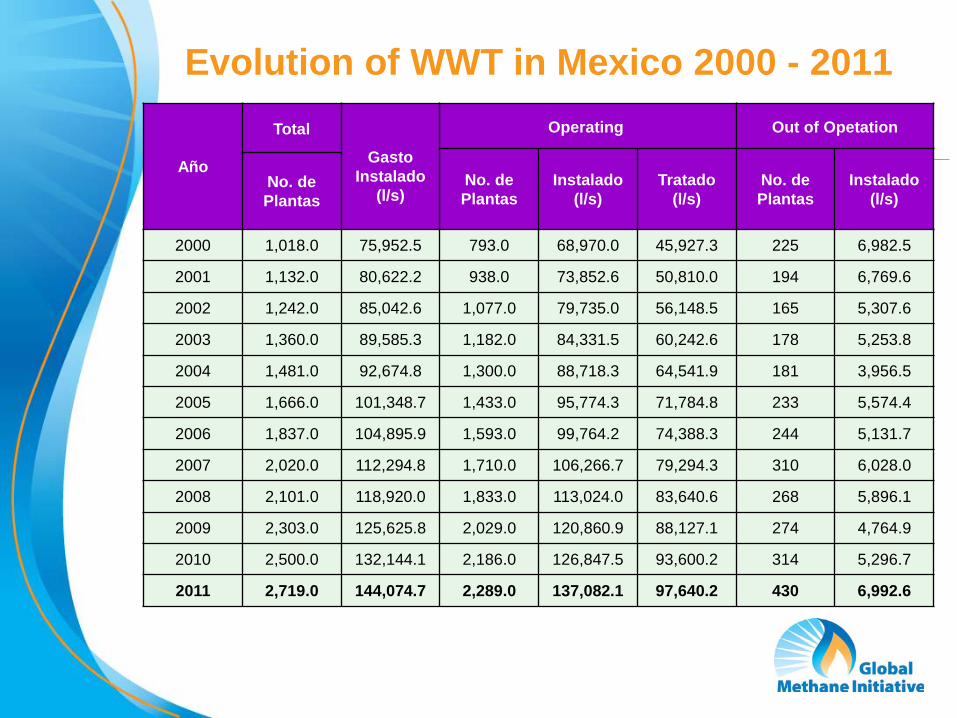
Evolution of WWT in Mexico 2000 - 2011
Año
Total Gasto
Instalado (l/s)
Operating Out of Opetation
No. de Plantas
Instalado (l/s)
Tratado (l/s)
No. de Plantas
Instalado (l/s)
No. de Plantas
2000 1,018.0 75,952.5 793.0 68,970.0 45,927.3 225 6,982.5
2001 1,132.0 80,622.2 938.0 73,852.6 50,810.0 194 6,769.6
2002 1,242.0 85,042.6 1,077.0 79,735.0 56,148.5 165 5,307.6
2003 1,360.0 89,585.3 1,182.0 84,331.5 60,242.6 178 5,253.8
2004 1,481.0 92,674.8 1,300.0 88,718.3 64,541.9 181 3,956.5
2005 1,666.0 101,348.7 1,433.0 95,774.3 71,784.8 233 5,574.4
2006 1,837.0 104,895.9 1,593.0 99,764.2 74,388.3 244 5,131.7
2007 2,020.0 112,294.8 1,710.0 106,266.7 79,294.3 310 6,028.0
2008 2,101.0 118,920.0 1,833.0 113,024.0 83,640.6 268 5,896.1
2009 2,303.0 125,625.8 2,029.0 120,860.9 88,127.1 274 4,764.9
2010 2,500.0 132,144.1 2,186.0 126,847.5 93,600.2 314 5,296.7
2011 2,719.0 144,074.7 2,289.0 137,082.1 97,640.2 430 6,992.6
11
Methane Reduction, Recovery, and Use Initiatives Examples of existing methane reduction
efforts as well as examples of recovery and use projects.
Areas where Mexico is interested to share/gain knowledge with other GMI partners.
12
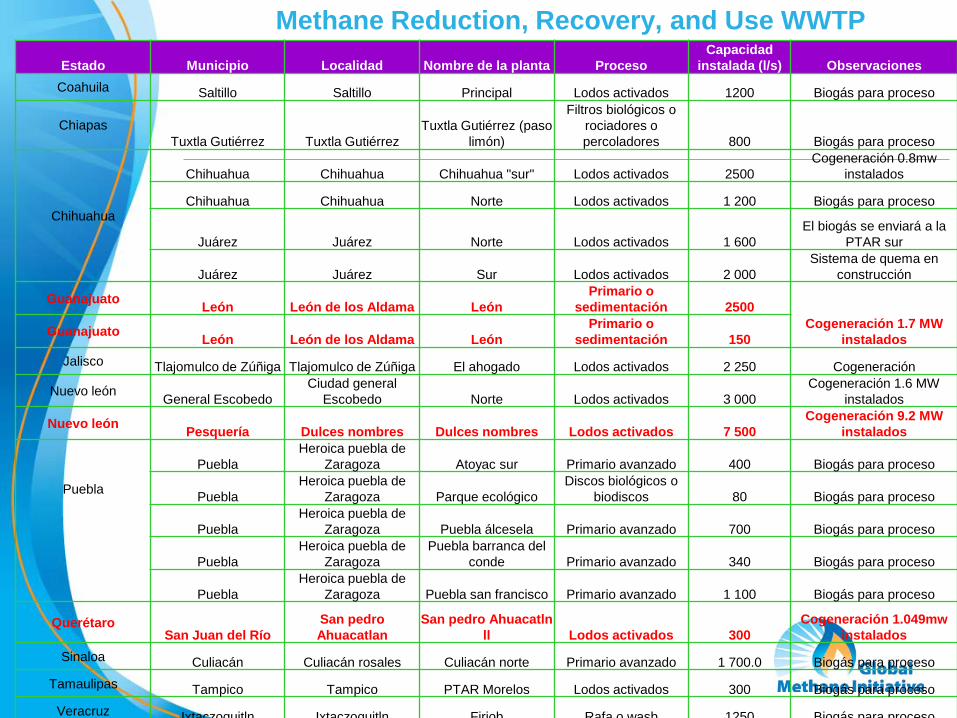
PTAR con aprovechamiento de biogás Estado Municipio Localidad Nombre de la planta Proceso Capacidad
instalada (l/s) Observaciones Coahuila Saltillo Saltillo Principal Lodos activados 1200 Biogás para proceso
Chiapas Tuxtla Gutiérrez Tuxtla Gutiérrez
Tuxtla Gutiérrez (paso limón)
Filtros biológicos o rociadores o percoladores 800 Biogás para proceso
Chihuahua
Chihuahua Chihuahua Chihuahua "sur" Lodos activados 2500 Cogeneración 0.8mw
instalados
Chihuahua Chihuahua Norte Lodos activados 1 200 Biogás para proceso
Juárez Juárez Norte Lodos activados 1 600 El biogás se enviará a la
PTAR sur
Juárez Juárez Sur Lodos activados 2 000 Sistema de quema en
construcción
Guanajuato León León de los Aldama León Primario o
sedimentación 2500 Cogeneración 1.7 MW
instalados Guanajuato León León de los Aldama León Primario o
sedimentación 150 Jalisco Tlajomulco de Zúñiga Tlajomulco de Zúñiga El ahogado Lodos activados 2 250 Cogeneración
Nuevo león General Escobedo Ciudad general
Escobedo Norte Lodos activados 3 000 Cogeneración 1.6 MW
instalados
Nuevo león Pesquería Dulces nombres Dulces nombres Lodos activados 7 500 Cogeneración 9.2 MW
instalados
Puebla
Puebla Heroica puebla de
Zaragoza Atoyac sur Primario avanzado 400 Biogás para proceso
Puebla Heroica puebla de
Zaragoza Parque ecológico Discos biológicos o
biodiscos 80 Biogás para proceso
Puebla Heroica puebla de
Zaragoza Puebla álcesela Primario avanzado 700 Biogás para proceso
Puebla Heroica puebla de
Zaragoza Puebla barranca del
conde Primario avanzado 340 Biogás para proceso
Puebla Heroica puebla de
Zaragoza Puebla san francisco Primario avanzado 1 100 Biogás para proceso
Querétaro San Juan del Río
San pedro Ahuacatlan
San pedro Ahuacatln ll Lodos activados 300
Cogeneración 1.049mw instalados
Sinaloa Culiacán Culiacán rosales Culiacán norte Primario avanzado 1 700.0 Biogás para proceso Tamaulipas Tampico Tampico PTAR Morelos Lodos activados 300 Biogás para proceso
Veracruz Ixtaczoquitln Ixtaczoquitln Firiob Rafa o wasb 1250 Biogás para proceso
Methane Reduction, Recovery, and Use WWTP
13
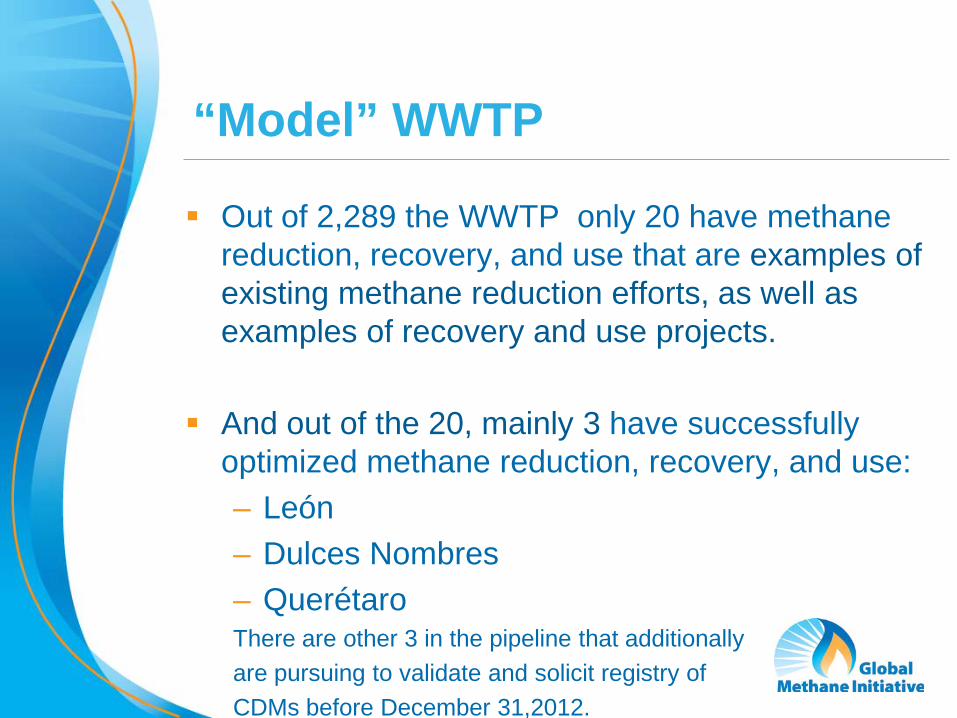
“Model” WWTP
Out of 2,289 the WWTP only 20 have methane reduction, recovery, and use that are examples of existing methane reduction efforts, as well as examples of recovery and use projects.
And out of the 20, mainly 3 have successfully optimized methane reduction, recovery, and use: – León – Dulces Nombres – Querétaro There are other 3 in the pipeline that additionally are pursuing to validate and solicit registry of CDMs before December 31,2012.
14
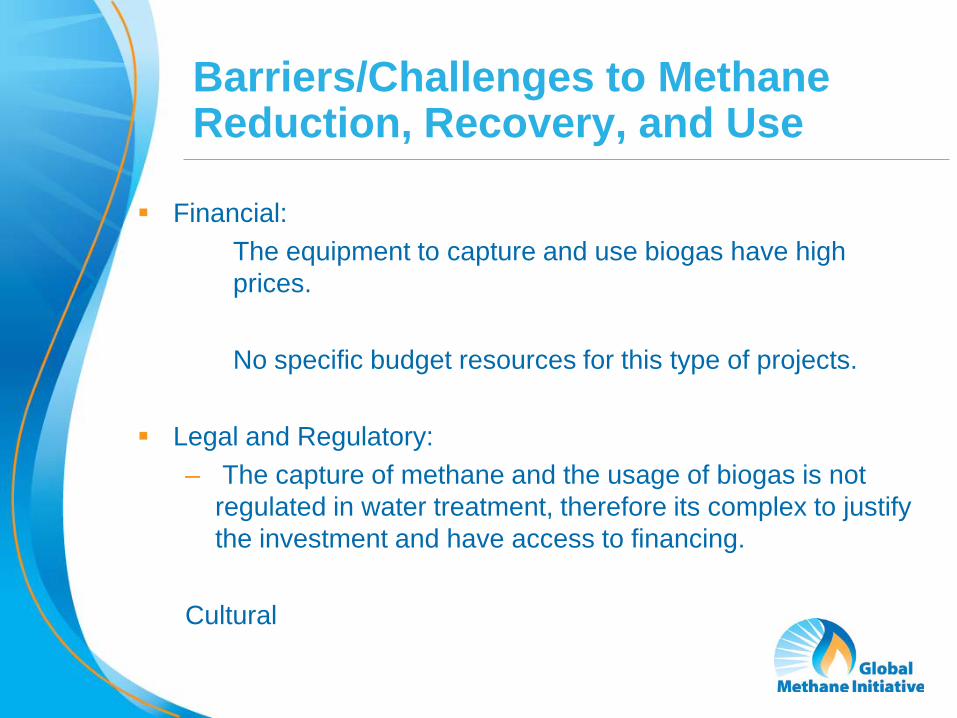
Barriers/Challenges to Methane Reduction, Recovery, and Use
Financial: The equipment to capture and use biogas have high prices. No specific budget resources for this type of projects. Legal and Regulatory:
– The capture of methane and the usage of biogas is not regulated in water treatment, therefore its complex to justify the investment and have access to financing.
Cultural
15
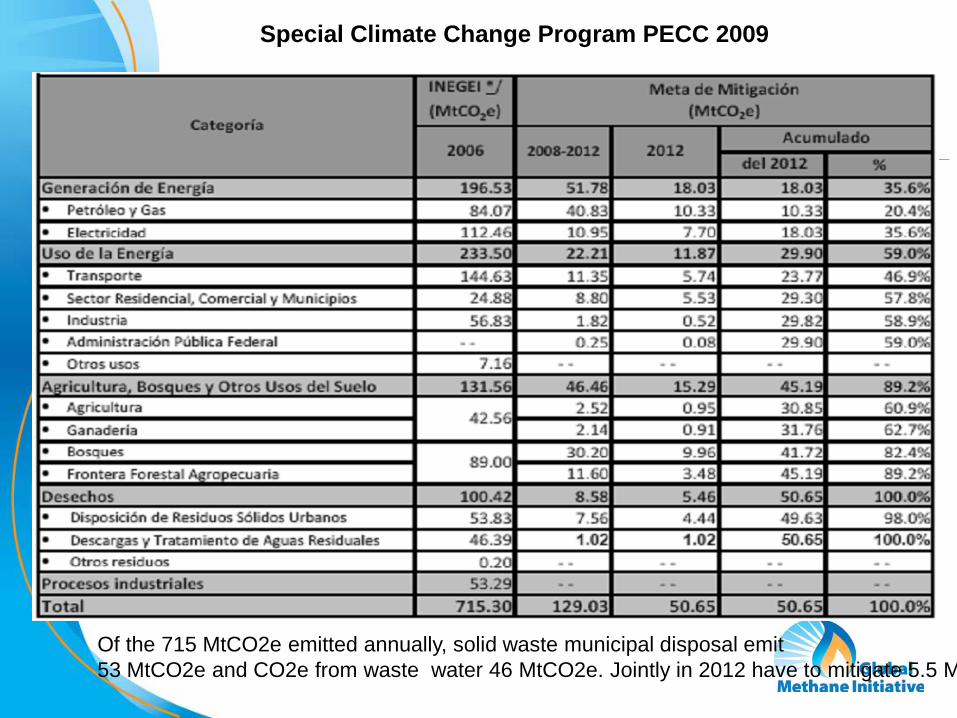
Special Climate Change Program PECC 2009
Of the 715 MtCO2e emitted annually, solid waste municipal disposal emit 53 MtCO2e and CO2e from waste water 46 MtCO2e. Jointly in 2012 have to mitigate 5.5 M
16
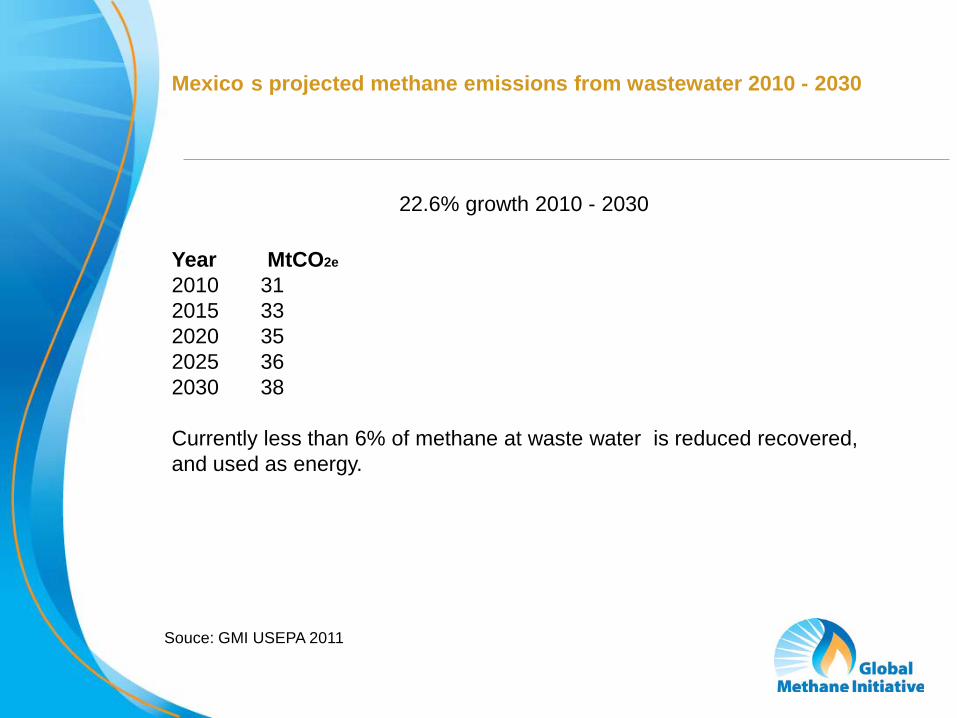
Mexico s projected methane emissions from wastewater 2010 - 2030
Year MtCO2e
2010 31 2015 33 2020 35 2025 36 2030 38 Currently less than 6% of methane at waste water is reduced recovered, and used as energy.
22.6% growth 2010 - 2030
Souce: GMI USEPA 2011
17
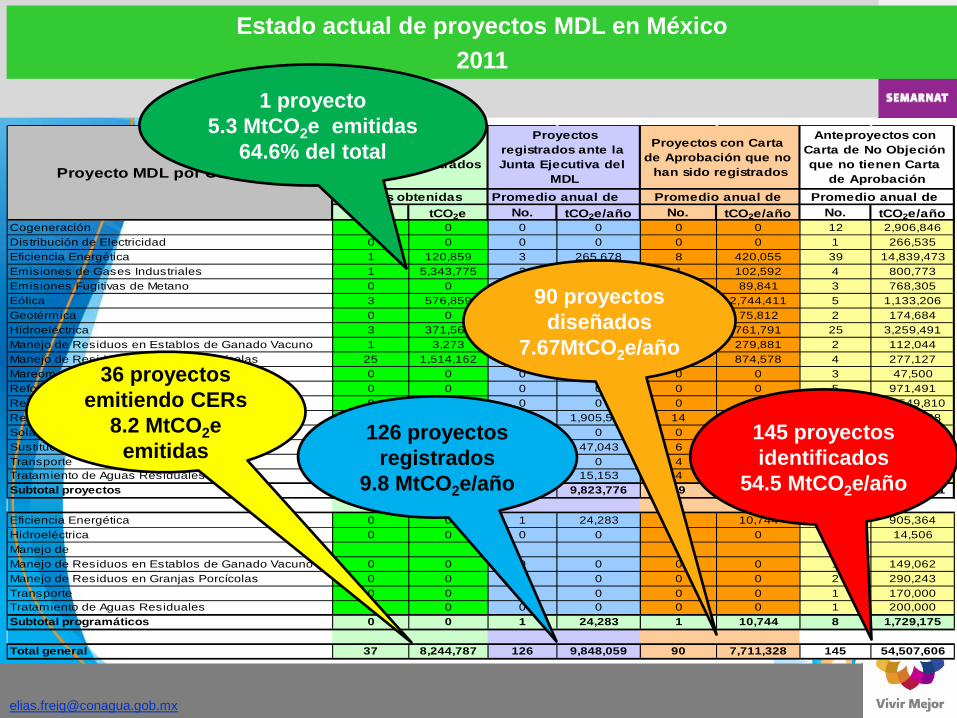
No. tCO2e No. tCO2e/año No. tCO2e/año No. tCO2e/añoCogeneración 0 0 0 0 0 0 12 2,906,846Distribución de Electricidad 0 0 0 0 0 0 1 266,535Eficiencia Energética 1 120,859 3 265,678 8 420,055 39 14,839,473Emisiones de Gases Industriales 1 5,343,775 2 2,540,280 1 102,592 4 800,773Emisiones Fugitivas de Metano 0 0 1 82,645 1 89,841 3 768,305Eólica 3 576,859 8 2,434,730 13 2,744,411 5 1,133,206Geotérmica 0 0 0 0 1 75,812 2 174,684Hidroeléctrica 3 371,567 3 118,844 8 761,791 25 3,259,491Manejo de Residuos en Establos de Ganado Vacuno 1 3,273 17 160,441 7 279,881 2 112,044Manejo de Residuos en Granjas Porcícolas 25 1,514,162 74 2,253,434 22 874,578 4 277,127Mareomotriz 0 0 0 0 0 0 3 47,500Reforestación – Forestación 0 0 0 0 0 0 5 971,491Reinyección de gas amargo en pozos petroleros 0 0 0 0 0 0 1 22,549,810Relleno Sanitario 3 314,292 15 1,905,528 14 1,569,578 20 3,293,568Solar 0 0 0 0 0 0 3 155,189Sustitución de Combustibles 0 0 1 47,043 6 377,168 4 250,381Transporte 0 0 0 0 4 294,948 1 55,102Tratamiento de Aguas Residuales 0 0 1 15,153 4 109,930 3 916,906Subtotal proyectos 37 8,244,787 125 9,823,776 89 7,700,584 137 52,778,431
Eficiencia Energética 0 0 1 24,283 1 10,744 2 905,364Hidroeléctrica 0 0 0 0 0 0 1 14,506Manejo de Manejo de Residuos en Establos de Ganado Vacuno 0 0 0 0 0 0 1 149,062Manejo de Residuos en Granjas Porcícolas 0 0 0 0 0 0 2 290,243Transporte 0 0 0 0 0 0 1 170,000Tratamiento de Aguas Residuales 0 0 0 0 0 0 1 200,000Subtotal programáticos 0 0 1 24,283 1 10,744 8 1,729,175
Total general 37 8,244,787 126 9,848,059 90 7,711,328 145 54,507,606
Anteproyectos con Carta de No Objeción que no tienen Carta
de Aprobación RCEs obtenidas Promedio anual de Promedio anual de Promedio anual de
Proyecto MDL por Categoría
RCEs* emitidas de proyectos registrados
Proyectos registrados ante la Junta Ejecutiva del
MDL
Proyectos con Carta de Aprobación que no
han sido registrados
Estado actual de proyectos MDL en México 2011
145 proyectos identificados
54.5 MtCO2e/año
90 proyectos diseñados
7.67MtCO2e/año
126 proyectos registrados
9.8 MtCO2e/año
36 proyectos emitiendo CERs
8.2 MtCO2e emitidas
1 proyecto 5.3 MtCO2e emitidas
64.6% del total
19
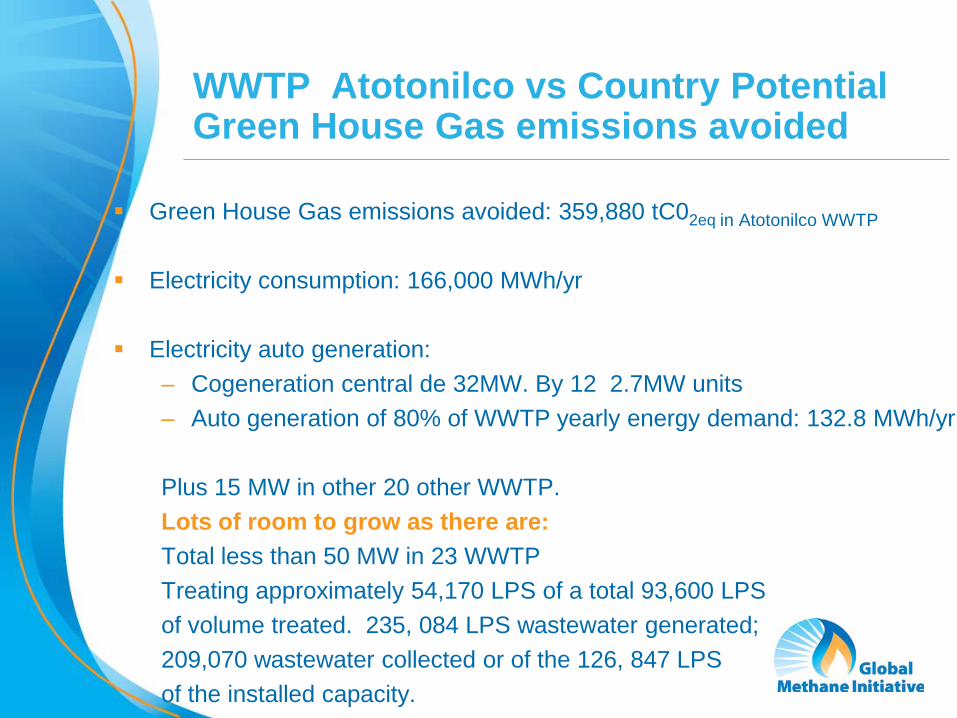
WWTP Atotonilco vs Country Potential Green House Gas emissions avoided
Green House Gas emissions avoided: 359,880 tC02eq in Atotonilco WWTP Electricity consumption: 166,000 MWh/yr
Electricity auto generation:
– Cogeneration central de 32MW. By 12 2.7MW units – Auto generation of 80% of WWTP yearly energy demand: 132.8 MWh/yr Plus 15 MW in other 20 other WWTP. Lots of room to grow as there are: Total less than 50 MW in 23 WWTP Treating approximately 54,170 LPS of a total 93,600 LPS of volume treated. 235, 084 LPS wastewater generated; 209,070 wastewater collected or of the 126, 847 LPS of the installed capacity.
23
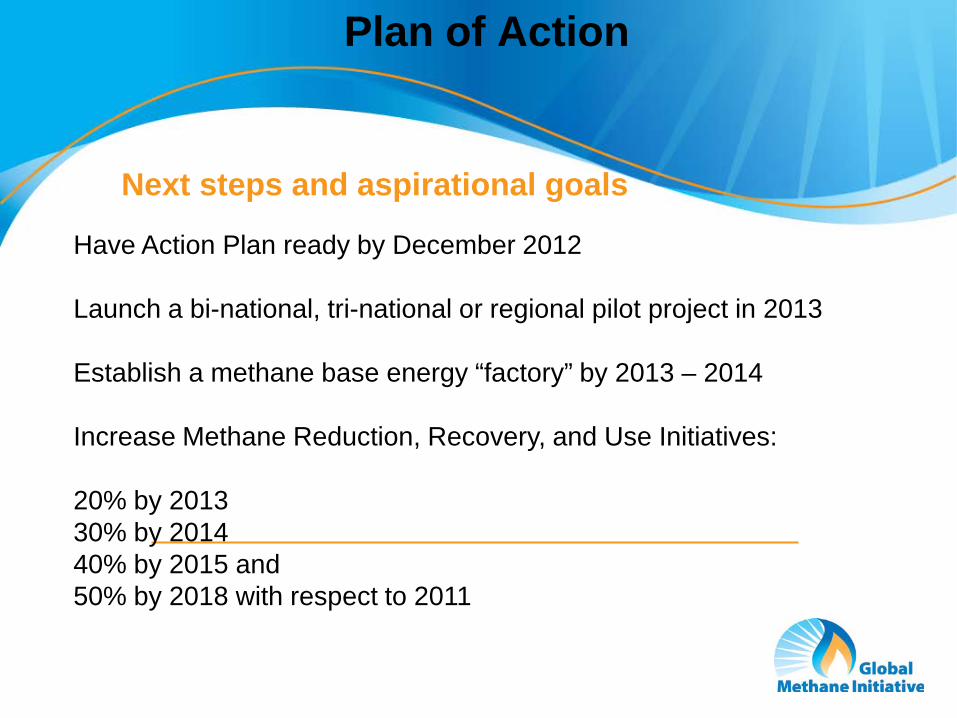
Plan of Action
Have Action Plan ready by December 2012 Launch a bi-national, tri-national or regional pilot project in 2013 Establish a methane base energy “factory” by 2013 – 2014 Increase Methane Reduction, Recovery, and Use Initiatives: 20% by 2013 30% by 2014 40% by 2015 and 50% by 2018 with respect to 2011
Next steps and aspirational goals
24
ANNEX
25
Proposed work meetings
2012 September in Washington DC October in Dominican Republic or Colombia November in Mexico City or Vancouver 2013 February in Washington DC or Vancouver
To make the most of the Methane Expo 2013 and secure having at least 10 Country Action Plans finished