Embed Size (px)
Citation preview
Swedish Meteorological and Hydrological Institute, NorrkoÈping, Sweden
Water balance modelling in the Baltic Sea drainage basin ± analysisof meteorological and hydrological approaches
L. P. Graham and S. BergstroÈm
With 11 Figures
Received November 24, 2000Revised April 4, 2001
Summary
Efforts to understand and simulate the global climate innumerical models have led to regional studies of the energyand water balance. The Baltic Basin provides a continentalscale test basin where meteorology, oceanography andhydrology all can meet. Using a simple conceptual approach,a large-scale hydrological model of the water balance of thetotal Baltic Sea Drainage Basin (HBV-Baltic) was used tosimulate the basinwide water balance components for thepresent climate and to evaluate the land surface componentsof atmospheric climate models. It has been used extensivelyin co-operative BALTEX (The Baltic Sea Experiment)research and within SWECLIM (Swedish Regional ClimateModelling Programme) to support continued regionalclimate model development. This helps to identify incon-sistencies in both meteorological and hydrological models.One result is that compensating errors are evident in thesnow routines of the atmospheric models studied. The use ofHBV-Baltic has greatly improved the dialogue betweenhydrological and meteorological modellers within the BalticBasin research community. It is concluded that conceptualhydrological models, although far from being complete, playan important role in the realm of continental scalehydrological modelling. Atmospheric models bene®t fromthe experience of hydrological modellers in developingsimpler, yet more effective land surface parameterisations.This basic modelling tool for simulating the large-scale waterbalance of the Baltic Sea drainage basin is the only existinghydrological model that covers the entire basin and willcontinue to be used until more detailed models can besuccessfully applied at this scale.
1. Introduction
The Baltic Basin is the focus of a Global Energyand Water Cycle Experiment (GEWEX) sub-programme ± the Baltic Sea Experiment (BAL-TEX). The region is unique from the other fourGEWEX regions in that it contains such a largeinland sea (BALTEX, 1995). Out¯ow and in¯owfrom the Baltic Sea to the World Ocean occursonly at the southern channels of OÈ resund and TheDanish Straits. This provides a natural test basinwhere interaction and exchange between the seaand the atmosphere, and between the atmosphereand the land surface can be studied. As anultimate long-term goal, BALTEX will improvethe capability to analyse both environmentalproblems and potential climate change over theBaltic Basin by incorporating modelling from thethree scienti®c disciplines: meteorology, oceano-graphy and hydrology.
Freshwater in¯ows of river runoff to the BalticSea play a pivotal role in the water balance of thiswater body (Gustafsson, 1997; MatthaÈus andSchinke, 1999; Omstedt and Rutgersson, 2000).It has long been noted that variations in salinityand temperature can be related to both variationsin river runoff and variations in the water
Meteorol. Atmos. Phys. 77, 45±60 (2001)

exchange with the North Sea (Hela, 1966).According to HaÊkansson et al. (1996), the ®rstdocumented need for total river runoff data to theBaltic Sea is found in Pettersson (1893), where hepresented the results of the ®rst hydrographicsurvey of the Baltic from 1879. As river runoffaffects both the salinity distribution in the sea andtransport of nutrients from land to the sea(Arheimer and Brandt, 1998; Omstedt and Axell,1998; Wulff et al., 1990), changes in river runoffcan have signi®cant impacts on the fragile eco-logical balance in the Baltic Sea. Hydrologicalmodelling is thus a critical component for the suc-cessful modelling of environmental impacts forboth the present climate and a changed climate.
Recent research has concentrated on improvingthe two-way interaction between the atmosphereand the land surface in meteorological climatemodels, as documented by numerous articlesevaluating different land surface schemes (Kosterand Milly, 1997; Lohmann et al., 1998; Robocket al., 1998; Wood et al., 1998). Contrary to pre-vious research efforts, the focus is no longersimply on achieving improvements to meteorolo-gical outputs, but on achieving real improvementsto the representation of hydrology in thesemodels. This in turn helps to close the one-waylink between the land and the ocean. This impliesthat hydrological, meteorological and oceano-graphic models must work together to resolveboth the water and energy budgets.
Both meteorological and oceanographic modelsoperate at scales that are much larger than thoseused within traditional hydrological applications.Meteorological models have their foundation inrepresenting the large-scale processes, coveringnot only whole continents, but also the entireglobe. Hydrological models have their origin inoperational applications where adequate repre-sentation on the basin and subbasin scale de®nedmodel dimensions. Thus, the two modellingcultures have previously co-existed on two quitedifferent spatial scales. As a step to bridging thescale gap between disciplines, large-scale hydro-logical modelling has an important role withinBALTEX.
The overall aim of this research was to modelthe water balance of the Baltic Sea drainage basinat a scale where both hydrology and meteorologycan meet. Working at this scale, the speci®c ob-jectives were as follows:
(i) Set up and validate a large-scale hydrologicalmodel for the Baltic Basin and carry outwater balance simulations,
(ii) Use the water balance model to evaluaterunoff generation processes in atmosphericclimate models and provide feedback formodel development,
(iii) Use the water balance model to provide riverrunoff inputs to ocean models, particularlyfor periods where river discharge observa-tions are not available,
(iv) Use the water balance model and knowledgegained from simulations for quali®ed discus-sion and recommendations on the harmoni-sation of hydrological and meteorologicalmodels.
These objectives are limited to a one-waycoupling between hydrology and meteorology anddo not include development of a two-way coupledmodelling system, although improved parameter-isation in atmospheric modelling has resulted.
2. Databases
2.1 Synoptic observations
Synoptic observations for precipitation and tem-perature covering the period 1979 to 1998 fromthe entire Baltic Basin are available in an inter-polated 1�1 degree grid database at SMHI(Omstedt et al., 1997). Figure 1 shows both thesynoptic station distribution and the grid used inthe analysis over the basin. This includes dailyobservations from 700±800 stations. The numberof stations is not constant as not all stations haverecords over 100% of the period. A much moredetailed precipitation network exists in the BalticBasin, but observations are not available for longtime periods. Rubel and Hantel (1999) used some4200 gauge stations in their work, but this coveredonly a short 4-month period.
The synoptic data were gridded with a two-dimensional univariate optimum interpolationscheme (Gustafsson, 1981), whereby the degreeof spatial ®ltering for optimum interpolation isdetermined by an isotropic autocorrelation func-tion estimated from the database. A subjectiveform of quality control from an experiencedmeteorologist was used to reject observations thatappeared erroneous. The interpolated grid values
46 L. P. Graham and S. BergstroÈm

were reduced to average values for each of thesubbasins used in the hydrological model.
2.2 River ¯ow
Observed monthly river discharge for the years1981±1991 was used for model calibration andveri®cation. These river runoff records are fromall available measurement stations on rivers¯owing into the Baltic Sea. This accounts for86% of the total drainage area. The remaining14% of drainage area outside the network of ¯owmeasurements consists of coastal zones locatedbetween river mouths. Estimation of runoff fromthese areas came from speci®c runoff calculationsusing representative neighbouring stations (Berg-stroÈm and Carlsson, 1994).
From the viewpoint of climate modelling andcoupling to atmospheric models, natural riverdischarge is desired over observed regulated riverdischarge. This is an arti®cial discharge recordthat closely resembles river ¯ow that would occurif the reservoirs were not in place. It is obtained byadding and subtracting reservoir storage andrelease records from actual river discharge obser-
vations to remove the effects of reservoirs fromthe record. This is necessary for rivers wherereservoir storage is considerable, as atmosphericmodels have no provisions for reservoir storagerouting.
For Sweden and northern Finland, recon-structed records of natural river discharge wereavailable up through 1991 for the rivers in thenorth where the effects of hydropower are mostpredominant (Carlsson and Sanner, 1996). Theyare not available for other countries in the basin,but they may not be as important there. Forinstance, the effect of regulation on the large LakeSaimaa system in southern Finland is constrainedto follow weekly natural discharge (Kuusisto,1999), so it does not generally show up in themonthly observations. No speci®c information onregulation effects was available for Lake Onega inRussia; Lake Ladoga is not regulated (personalcommunication with the State HydrologicalInstitute, St. Petersburg). Likewise, dams areknown to exist on the Vistula River in Poland,but no speci®c information as to the extent of theireffect on river ¯ow was available.
The modelling presented here is based onreconstructed natural river discharge for subbasinsin the Bothnian Bay and Bothnian Sea drainagebasins, and ¯ows of record for the rest of theBaltic Basin. There is an inconsistency introducedby this, but it is not thought to be signi®cant, asthe impact of power production is not typicallynoticeable in the monthly ¯ow records for otherbasins. An exception is Lake Onega, where theeffects of regulation were apparent in the record,but no additional information was available tocalculate natural discharge.
From the viewpoint of oceanographic model-ling, simulation of actual recorded discharge ±including the effects of regulation ± to the BalticSea may be of interest. An altered version of themodel is needed for this case, whereby the Swedishand Finnish natural river discharge records arereplaced by actual recorded discharge and reser-voir storage routing operations are included forthese subbasins. This affects only subbasins in theBothnian Bay and Bothnian Sea drainage basinsas mentioned above. This modi®cation is notincluded in the results presented here.
As a ®nal note on river ¯ows, it should bepointed out that observed records of daily riverdischarge are simply not available for the entire
Fig. 1. Synoptic observation stations for the Baltic Basin.Shown are the stations on line for 7 December 1999
Water balance modelling in the Baltic Sea drainage basin 47

Baltic Sea drainage basin. Even up-to-datemonthly ¯ows are not available for the wholebasin, although this situation is improving. Fullbasin coverage of monthly river ¯ow data did notextend beyond 1993 for this work.
2.3 Topography and land use
Topography for the entire basin was summarisedusing the Digital Chart of the World (DCW)database available through the world-wide web(EROS, 1997). Hypsographic curves for eachsubbasin were compiled with a vertical resolutionof 100 m. The HBV model adjusts temperatureand precipitation inputs in each subbasin accord-ing to these hypsographic curves. Land use datacame from GRID Arendal's GIS (geographic in-formation system) database over the Baltic region(BDBP, 2000; Sweitzer et al., 1996). Land useclassi®cations from this database were simpli®edto categories of forest, open land and water.
3. The hydrological model
3.1 Introduction to HBV
The conceptual HBV hydrological model was ®rstdeveloped in Sweden in the early 1970s (Berg-stroÈm, 1976; BergstroÈm and Forsman, 1973) andhas since then been widely used for ¯ood fore-casting, hydrological design and studies onclimate effects on water resources systems. It isa distributed conceptual model with subroutinesfor snow accumulation and melt at different alti-udes, soil moisture accounting, groundwater re-charge, runoff generation and routing in rivers andlakes (BergstroÈm, 1995). The model has so farbeen applied in more than 40 counties in a widevariety of climates and under different physio-graphic conditions (BergstroÈm, 1997). Its structureis based on drainage basins or subbasins at scalesfrom less than one to more than one millionsquare kilometres.
An introduction to the Baltic Basin WaterBalance Model ± HBV-Baltic ± including detailsof calibration/veri®cation is found in Graham(1999), which presents model results from 1980 to1994. This has since been extended to includeresults up to the end of 1998 and will hereafter bereferred to as the HBV-Baltic base condition. Asmany of the details of HBV-Baltic have been pre-
viously published (BergstroÈm and Graham, 1998;Graham, 1999; Graham and BergstroÈm, 2000),only an overview and some additional detail isgiven here. Additional discussion in the context ofcomparisons with atmospheric models is pre-sented in Sect. 4. Figure 2 shows the 25 subbasinsused in the model. They range in size from 21 000to 144 000 km2. The ®ve main drainage basins areoutlined ± Bothnian Bay, Bothnian Sea, Gulf ofFinland, Gulf of Riga and Baltic Proper. The totalarea is some 1 600 000 km2. According to obser-vations for the period 1950 to 1990, the totalmean annual river discharge from this area is14 151 m3 sÿ1 or 446 km3 yrÿ1 (BergstroÈm andCarlsson, 1994).
Within hydrological modelling, distinction ismade between conceptual and physically-basedmodels (Refsgaard, 1996). Conceptual models arebased on representing physical processes withsimpli®ed, yet physically logical algorithms,which can include semi-empirical equations. Theparameters can usually not be assessed directlyfrom measurements and calibration is typicallyrequired. Physically-based models are based
Fig. 2. Basin boundaries for HBV-Baltic. The ®ve mainBaltic Sea drainage basins are outlined with thicker lines
48 L. P. Graham and S. BergstroÈm
on complete representation of the mathematicalequations for mass, momentum and energy. Theparameters, in principle, have direct physicalsigni®cance that could be evaluated by measure-ments. However, to maintain their physicalsigni®cance, detailed geophysical data on ®nescales is required. In practice, physically basedmodels also require some calibration. The differ-ences between conceptual and physically-basedhydrological models are decreasing as the twoapproaches tend to converge. Conceptual modelsare becoming more physical at the same timethat physically-based models use conceptualapproaches as a means to overcome lack of fully-distributed physical data (Beven, 1996; Storm andRefsgaard, 1996).
An addition to the above classi®cations is themore statistically distributed approach based onvariability parameters, which is used in the HBVmodel and others. The variability approach is ofparticular interest in connection with hydrologicalmodelling at different scales. It can be used torepresent basin properties that have great spatialvariability, such as snow accumulation in wind-exposed terrain or basinwide soil moisture condi-tions. As this approach assumes a statisticaldistribution of properties rather than a completedescription, it is more likely to be valid over arange of different scales than other methods(BergstroÈm and Graham, 1998).
A relevant question to be asked here is, whyshould HBV be used? The answer is that: i) it hasshown to perform well in representing runoff pro-cesses in the Baltic Basin as well as other regionsof the world, ii) it can be run with sparse data, iii)calibration can be limited to a small number ofparameters, iv) it is computationally ef®cient, andv) it has been used over a range of scales. It hasbeen applied to a wide range of applicationsincluding analysis of extreme ¯oods, effects ofland-use change, effects of climate change, acidi-®cation of groundwater, nutrient transport andsediment transport (Arheimer and Brandt, 1998;Brandt, 1990; Harlin, 1992; LideÂn, 1999; Saelthunet al., 1998; SandeÂn and Warfvinge, 1992;VehvilaÈinen and Huttunen, 1997).
There are other conceptual hydrological modelswith similar characteristics to HBV that could alsohave been used for the analyses described below.Some of them may well have given equally satis-factory results. However, a more physically-based
model such as MIKE SHE (Refsgaard and Storm,1995) was deemed to require too much data andcomputational resources for the applications athand. Such a model is more appropriate if aprimary objective is, for example, to study indetail the spatial and temporal movement ofgroundwater. Although they offer other advan-tages over conceptual models, such as moresuitable feedback for direct coupling to atmo-spheric models, there are still many issues to beresolved before fully physically-based models canbe satisfactorily applied to such large scales as theBaltic (Beven, 1996; Refsgaard, 1998).
HBV-96 v4.5 is the most current version ofHBV (LindstroÈm et al., 1997). It has been up-graded to make it more `̀ distributed'' than pre-vious versions. The term distributed refers to thedegree of discretization that describes the terrainin the basin; it can be applied equally to eitherphysically-based or conceptual models. For thelarge subbasins of HBV-Baltic, it is probably morecorrect to use the description `̀ semi-distributed''.This refers to the fact that the distribution of eachsubbasin into different elevations and landcategories ± forest, open land and water ± is notspatially ®xed. Geographical information is takenfrom actual physical data, but it is represented ineach subbasin as a percentage of the whole forthat subbasin without keeping track of exactlywhere the percentage is located in space. Thus,model results, although integrated on their phys-ical characteristics (e.g., elevation and land use),cannot be placed at a certain location within asubbasin. More detailed spatial results are ob-tained by increasing the number of subbasins.However, this doesn't necessarily imply thatrunoff results at the out¯ow of large basins wouldbe better with smaller subbasins.
BergstroÈm and Graham (1998) discuss scaleproblems in hydrological modelling and presentarguments that HBV-Baltic performs satisfactorilyat the Baltic Basin scale for the purpose of re-solving the water balance. Independent research-ers working on large scales for the Elbe Riverhave also shown the HBV model to perform satis-factorily at large scale (Krysanova et al., 1999).
3.2 Water balance modelling
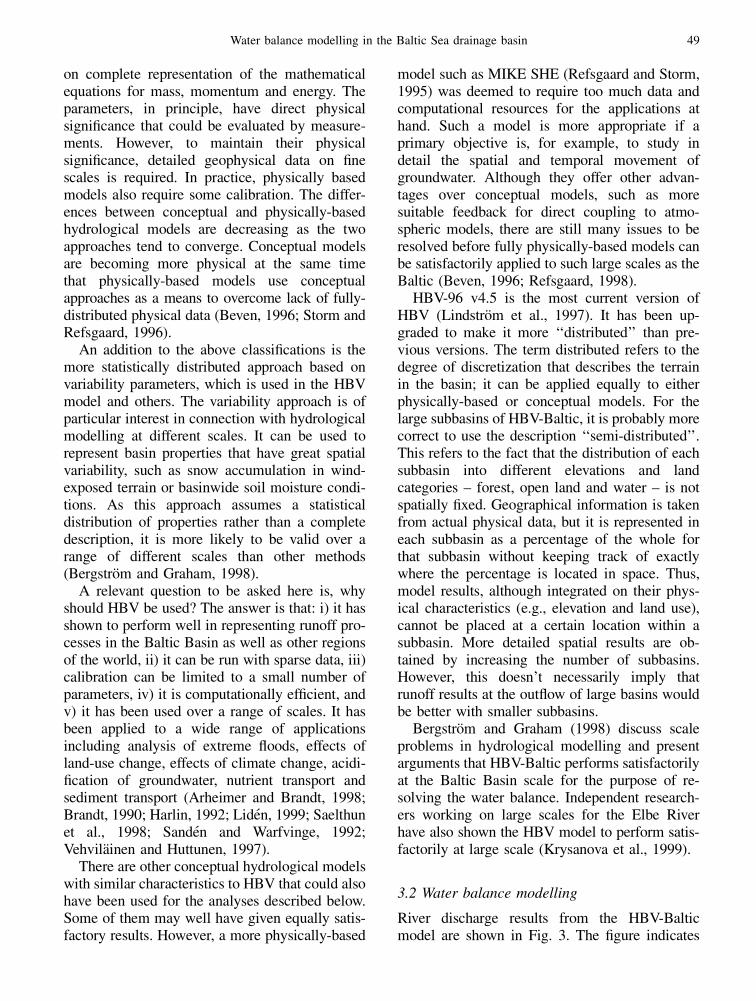
River discharge results from the HBV-Balticmodel are shown in Fig. 3. The ®gure indicates
Water balance modelling in the Baltic Sea drainage basin 49
periods for calibration, veri®cation and extensionof record. At publication date, the observed riverdischarge records for recent years were still notavailable. This is due both to lack of availability ofactual observations from all of the countries in thebasin and lack of additional reconstructed naturalriver discharge calculations from the northernmostbasins.
HBV-Baltic achieved ef®ciency criterion values,R2 (where R2 ranges from ÿ1 to 1, with 1 re-presenting a perfect match), of 0.83 for calibra-tion, 0.84 for veri®cation and 0.83 for the overallperiod for the total Baltic Basin (Graham, 1999).This is the Nash/Sutcliffe ef®ciency criterion(Nash and Sutcliffe, 1970) that rates model per-formance as a function of the initial variance inriver discharge observations to the variance incomputed river discharge. Regional variation ofR2 values range from 0.85 for the Bothnian Bay to0.67 for the Baltic Proper. These R2 values are notexactly comparable to other reference basins, asonly monthly observations were available for the
calculation with daily computed river discharge.For comparison, a strictly monthly calculationof R2 (i.e., monthly observations vs. monthlycomputed) yields values of 0.91, 0.95 and 0.73 forthe total Baltic, Bothnian Bay and Baltic Proper,respectively.
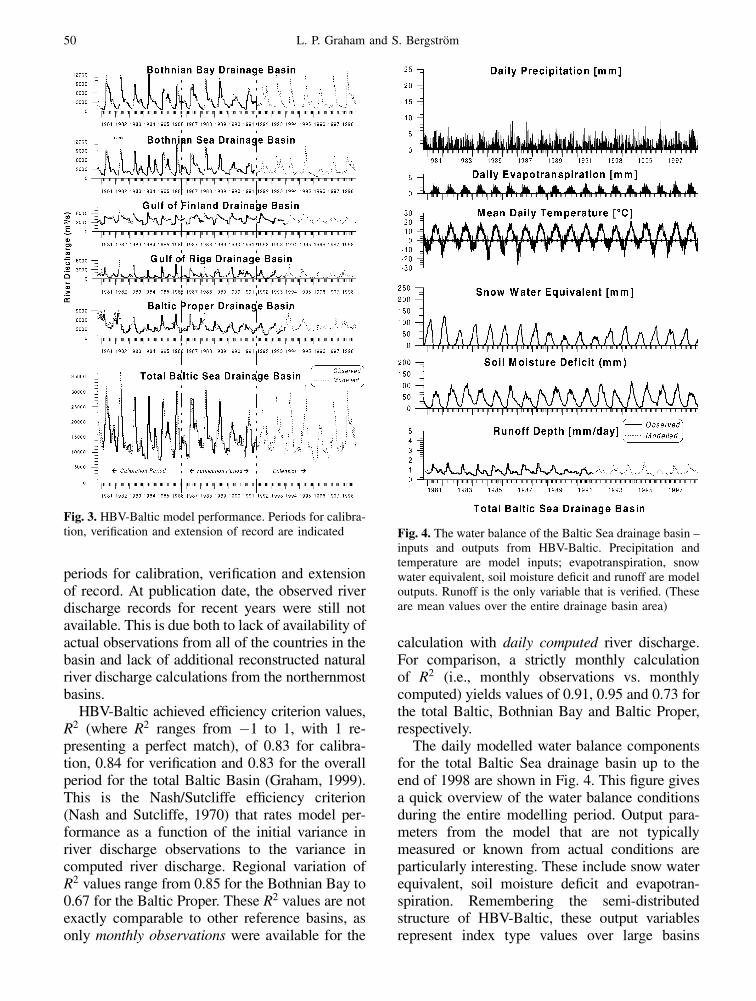
The daily modelled water balance componentsfor the total Baltic Sea drainage basin up to theend of 1998 are shown in Fig. 4. This ®gure givesa quick overview of the water balance conditionsduring the entire modelling period. Output para-meters from the model that are not typicallymeasured or known from actual conditions areparticularly interesting. These include snow waterequivalent, soil moisture de®cit and evapotran-spiration. Remembering the semi-distributedstructure of HBV-Baltic, these output variablesrepresent index type values over large basins
Fig. 3. HBV-Baltic model performance. Periods for calibra-tion, veri®cation and extension of record are indicated Fig. 4. The water balance of the Baltic Sea drainage basin ±
inputs and outputs from HBV-Baltic. Precipitation andtemperature are model inputs; evapotranspiration, snowwater equivalent, soil moisture de®cit and runoff are modeloutputs. Runoff is the only variable that is veri®ed. (Theseare mean values over the entire drainage basin area)
50 L. P. Graham and S. BergstroÈm

that can be used as relative measures of therunoff generation processes. Given that extensivemeasurements are not taken, this is perhaps thebest we can do. They can be used in operationalstudies covering the entire Baltic Basin, as aclimatological database to be compared to atmo-spheric climate models and as a basis for com-parison for climate change impact studies.
River discharge (here expressed as runoffdepth), which is measured, is also quite importantas observations are slow in coming in from thedifferent political entities of the Baltic Basin.Thus, as synoptic station data is available longbefore river observations, HBV-Baltic is used toget initial estimates for total river in¯ows to theBaltic Sea.
4. Differences between hydrologicaland meteorological approaches
Hydrology is represented in atmospheric climatemodels as runoff generation processes are in-cluded in these models. However, there areconsiderable differences between how hydrolog-ical models and atmospheric climate modelstreat the land surface. Some important detailsof how principle processes are typically repre-sented in the two types of models are listed below:
There are of course variations to this generalcomparison as there exist many different models.The ECHAM4 atmospheric model, for instance,includes aspects of a more hydrological-orientedapproach to soil moisture (DuÈmenil and Todini,1992).
In summary, the hydrological approach is oftennot very detailed in the vertical sense, but it isquite detailed in the horizontal. Such a model canbe used on large scales while taking into accountsubgrid variability. Land surface treatment inmeteorological models concentrates on verticalprocesses and pays little attention to either subgridvariability or the lateral ¯ow of water to down-stream subbasins (or grid squares). The maindifference, however, is the lack of need for anexplicit energy balance simulation in most hydro-logical applications. This is a key reason why it ispossible to keep such hydrological models withina simple vertical structure, particularly with regardto time scales. Energy balance calculations requiretime steps of minutes, compared to the morerobust daily time step often used in hydrologicalwater balance applications. This factor alonegreatly increases the complexity required forenergy balance calculations signi®cantly.
Of minor signi®cance is that hydrologicalmodels have traditionally used natural subbasinsfor horizontal boundaries, whereas atmosphericmodels use an evenly spaced grid network. Thisis more a question of practicality and applicationthan a real difference. Hydrological models canuse square subbasins, as some models currentlydo, but then one must always deal with the issue
of deciding how to distribute runoff in gridsquares that lie on the divide between naturalsubbasins. For purposes of discussion, one cancompare the processes that occur in the atmo-spheric grid square with those that occur in thehydrological subbasin.
Hydrological Approach Meteorological Approach
� large lakes are modelled explicitly, small lakes � lake storage not included in water balance, lakeare integrated into the saturated zone surface may be included in energy balance
� each subbasin is divided into elevation zones � one elevation for each grid square� each elevation zone is divided into open land � one vegetation type for each grid square or
and forestland fractions of land cover may be used� snow accumulation can be distributed � no snow distribution
statistically in each elevation zone to accountfor subbasin variability
� water is stored as interception, snow, capillary � water is stored as interception, snow, soilwater in snow, soil moisture, groundwater and lakes moisture and groundwater
� ¯ow from the saturated zone is routed through � no lateral ¯ow routinglakes and rivers
Water balance modelling in the Baltic Sea drainage basin 51

It is appropriate to point out that there issometimes confusion over terminology, partic-ularly in terms of runoff. So far the term `̀ runoffgeneration'' has been used without any speci®cde®nition. This refers to the instantaneous excesswater per surface unit ± grid square or subbasin ±without any translation or transformation foreither groundwater, lake and channel storage, ortransport time. In traditional hydrological termi-nology, this is `̀ effective precipitation'', which isavailable for routing to the subbasin outlet andincludes snowmelt. Its dimension is typicallymillimetres per unit time. This is equivalent towhat meteorological modellers often refer tosimply as `̀ runoff'', which they often divide intotwo parts, `̀ surface runoff'' and `̀ deep runoff''.This should not be confused with `̀ river runoff''or `̀ river discharge'', terms used synonymouslyfor the measured stream¯ow in a river channel atsome downstream point in the subbasin. Riverdischarge is usually expressed in units of cubicmeters per second.
5. Evaluation of climate models
As done in the BALTEX numerical experimenta-tion program and other applications, regionalclimate modelling typically consists of a globalatmospheric general circulation model (GCM)that in turn drives a regional atmospheric climatemodel (RCM) over a limited area of the globe.HBV-Baltic is used as a tool for evaluation ofthese models (Graham and BergstroÈm, 2000;Graham and Jacob, 2000). This provides a wayto use the runoff record in model development(i.e., through the calibration of HBV-Baltic). Weuse the hydrological model to transfer backwardfrom river discharge to runoff generation, andlook at other important model processes, such assnow and soil moisture, along the way. Thesestudies consist of using climate model results asforcing for HBV-Baltic. The climate-model-forcedHBV-Baltic results are then compared to corre-sponding results from the atmospheric models.Variations on this approach have been performedby other researchers (Kite, 1997; Liston et al.,1994).
The occurrence of runoff generation in a gridsquare is typically the end of the water cycle in ameteorological model. Combining ¯ows from gridsquares and further lateral routing is usually not
attempted. Thus, this off-line coupling to a hydro-logical model also provides a way to estimateriver discharge from climate model results.
Evaluation results from four different climatemodel runs are presented in Figs. 5 to 8 for snowwater equivalent, soil moisture de®cit, evapotran-spiration and runoff generation, respectively. Each®gure presents a comparison between the climatemodel run and HBV-Baltic forced with the re-spective climate model run for four different casesover the total Baltic Sea drainage basin. The ®rstcase is the ECHAM4 (Roeckner et al., 1996)global model (GCM) run on a T106 spectraltransform model with a Gaussian grid of about125 km (Stendel and Roeckner, 1998). The re-maining three cases are from the Rossby CentreRegional Atmospheric Model (RCA) (Rummu-
Fig. 5. Modelled snow water equivalent (mm) over the totalBaltic Sea drainage basin, where direct climate modeloutput (ECHAM4, RCAO, RCA88-H and RCA88-E) iscompared to output from HBV-Baltic with climate modelforcing (HBV-ECHAM4, HBV-RCAO, HBV-RCA88-H andHBV-RCA88-E). HBV-climate is the long-term averagedaily values from the HBV-Baltic base condition results(1981±1998) repeated for each year
52 L. P. Graham and S. BergstroÈm

kainen et al., 1998). RCAO is the ®rst version at44 km grid resolution and lateral boundary forcingfrom the HADCM2 global model. The latter twocases are newer results from RCA ± the secondversion ± at 88 km resolution.
The second version of RCA included manyparameterisation improvements over the ®rstversion (Rummukainen et al., 2001). Lateralboundary forcing from two different GCMs ±HADCM2 and ECHAM4 ± was used to producetwo sets of model runs, RCA88-H and RCA88-E.The GCM forcing for RCA88-H is exactly thesame as used for RCAO. The GCM forcing usedfor RCA88-E, however, is not from the sameECHAM4 run referred to above (but rather run ona T42 spectral transform model with an equivalentgrid of about 320 km). All of the cases are control
runs for the present climate, which implies thatthey can be compared against recent climatolog-ical data.
Characteristics of the different climate modelscan be seen from the plotted results shown in Figs.5 to 8. Although all of these control climate runswere driven with boundary conditions derivedfrom the present climate (e.g., sea-surface tem-peratures, typically from the 1980s), they do notsimulate a speci®c time period that can be directlycompared to either observations or each other. Forthis reason, they cannot be compared directlyto the HBV-Baltic base condition, other than tocompare long-term average values. As a type ofclimatic reference, Figs. 5 and 6 include lightdashed lines ± HBV-Climate ± that representHBV-Baltic model runs with the base condition
Fig. 6. Modelled soil moisture de®cit (mm) over the totalBaltic Sea drainage basin, where direct climate modeloutput (ECHAM4, RCAO, RCA88-H and RCA88-E) iscompared to output from HBV-Baltic with climate modelforcing (HBV-ECHAM4, HBV-RCAO, HBV-RCA88-H andHBV-RCA88-E). HBV-climate is the long-term averagedaily values from the HBV-Baltic base condition results(1981±1998) repeated for each year
Fig. 7. Modelled evapotranspiration (mm/month) over thetotal Baltic Sea drainage basin, where direct climate modeloutput (ECHAM4, RCAO, RCA88-H and RCA88-E) iscompared to output from HBV-Baltic with climate modelforcing (HBV-ECHAM4, HBV-RCAO, HBV-RCA88-H andHBV-RCA88-E)
Water balance modelling in the Baltic Sea drainage basin 53

synoptic data; these are simply the long-termaverage daily values from 1981±1998 repeated foreach year.
Figure 5 shows daily results for snow waterequivalent. Apparent from the plots is that all themodel cases show modelled snow values muchlower than in HBV-Baltic with the same forcing.The snow season appears to get off to a good startearly in the cold season, but the snowpack neverreaches the same magnitude as in HBV-Baltic.This implies that snowmelt must be more intensethan HBV-Baltic for all cases.
Figure 6 shows daily results for soil moisture,expressed in terms of soil moisture de®cit (smd),which is the most relevant quantity to compareas it re¯ects the amplitude of change for soilmoisture. Some models have absolute values forsoil moisture that are disproportionately large.
Although this may be physically wrong, it makeslittle difference if the volume is never used; itequates to a type of dead storage. Therefore, it isonly the dynamical part of the soil moisture that isof interest, particularly when comparing modeloutputs.
Interpreting the smd plots with descriptiveterms, ECHAM4 shows trends of wetter soil con-ditions (low soil moisture de®cit), whereas RCAOshows considerably drier conditions (high soilmoisture de®cit). Smd for both RCA88-H andRCA88-E re¯ects soil moisture conditions that arevery similar to HBV-Baltic results. The generalseasonality in all cases appears to be reasonable,that is highest soil moisture occurs in winter andlowest in summer.
Figure 7 shows monthly results for evapotran-spiration. This variable is perhaps the most dif®-cult to evaluate as there is so much uncertaintyregarding its true value. Widespread regionalmeasurements are not readily available and thereis no established basis to adequately determinethat one model does a better job than the other insimulating evapotranspiration. Common to allfour comparisons is that wintertime evapotran-spiration is higher in the atmospheric models thanin the HBV-Baltic. These differences in winter arenot surprising as wintertime evapotranspirationfrom snow in the HBV model is included in ageneral snowfall correction factor when theground is covered by snow. It is thus not modelledexplicitly under such periods and does not showup as evapotranspiration in model results.
Figure 8 shows monthly results for runoffgeneration. For all comparisons, the atmosphericmodels show considerably lower runoff than thehydrological model. In none of the cases do theyreach the magnitudes of runoff apparent in HBV-Baltic. This is direct evidence that the land surfaceroutines of climate models have a long way to gobefore runoff processes can be directly used forfurther analyses, such as climate change impactstudies to water resources. For the RCAO modelrun, this was an expected result as it was knownthat water was not conserved in the ®rst version ofRCA. This was corrected for the RCA88 modelruns. Some improvement can be seen for bothRCA88-H and RCA88-E. The ECHAM4 resultsshow runoff generation that comes closest to theHBV-Baltic values, but the peaks occur a littleearlier.
Fig. 8. Modelled runoff generation (mm/month) over thetotal Baltic Sea drainage basin, where direct climate modeloutput (ECHAM4, RCAO, RCA88-H and RCA88-E) iscompared to output from HBV-Baltic with climate modelforcing (HBV-ECHAM4, HBV-RCAO, HBV-RCA88-H andHBV-RCA88-E)
54 L. P. Graham and S. BergstroÈm

Of particular interest for this type of compar-ison between models is to see how changes tomodel parameterisations affect results. Taking theresults from an earlier version of a model as a ®rstiteration in continued model development, similaranalyses made after model changes can be com-pared back to the previous version or versions. Asthey were driven by the same lateral boundaryconditions (i.e., HADCM2), this can be done forRCAO and RCA88-H. Looking again at Figs. 5 to8 with this in mind, several observations can bemade. There are no dramatic changes in snowresults, which is not surprising as the snow par-ameterisation is exactly the same for the two modelversions. Both smd and evapotranspiration, how-ever, changed considerably, re¯ecting changesmade to the land surface scheme. Furthermore,runoff increased for the RCA88-H case.
A ®nal evaluation concerns the skill of theatmospheric models at representing the presentclimate. Figure 9 shows long-term precipitationand temperature averages from the total Baltic SeaDrainage Basin for the four model cases, togetherwith the synoptic data used to drive the HBV-Baltic base condition (1981±1998). Apparent fromthe ®gure is that these climate models do not do aparticularly good job at reproducing the season-ality of precipitation. In some cases the annualprecipitation is quite good, but the seasonalpatterns are wrong. The atmospheric model runsshow too much wintertime precipitation and thetypical summertime peaks are mostly missing.One should keep in mind that the base condition isa speci®c period of record and model resultsshould not be expected to match exactly. How-ever, the trends should be similar.
Annual temperature results from the climatemodels all lie either similar to the synoptic data orcolder. Seasonal results vary, but all of the climatemodels exhibit a cold bias during winter. Thecombination of high winter precipitation and coldwinter temperatures implies that snow amountsshould be higher than the present climate for allcases. This is however not the case, as shown byHBV-Climate ± the light dashed lines in Fig. 5. Allof the HBV-Baltic results with climate modelforcing show the expected trend of snow amountsthat are considerably higher than HBV-climate. Incontrast, all of the climate model results showsnow amounts that are closer to HBV-climatevalues, despite considerably higher precipitationand lower temperatures. For RCA88-E, which hasthe highest annual precipitation of all the modelcases shown in Fig. 9, snow amounts are con-sistently lower than HBV-climate. These resultspoint to an inconsistency in the atmospheric snowroutines, which is further discussed in Sect. 6.
6. Evaluation by use of re-analysis data
Interpretation of the above results entails somedif®culties, in particular concerning biases inmodelled global seasonal climatology. Therefore,a regional climate model with analysed boundaryconditions from the European Centre for Medium-Range Weather Forecasts (ECMWF) Re-analysisProject (ERA) (Gibson et al., 1999) was run andevaluated. The use of analysed boundary condi-tions is the closest we can come to using obser-vations to drive a climate model. Contrary to theruns presented above, comparisons to actual yearsof record are possible for this case.
Fig. 9. Average precipitation and temperature for the total Baltic Sea drainage basin from four atmospheric model runs (10-year present climate simulations) and from synoptic data (HBV-Baltic base condition 1981±1998). The HBV-Base seasonalvalues shown are uncorrected; the HBV-Base annual bar shows both the uncorrected value (636 mm) and the value includingcorrections for aerodynamically induced undercatch (666 mm)
Water balance modelling in the Baltic Sea drainage basin 55

As described by Jacob (2001), the simulationwas carried out with the REMO regional modelusing ECHAM4 physics and a spatial resolutionof 0.5� (some 55 km). The model was run for theperiod 1979±1988, which coincides with thebeginning of the period for the HBV-Baltic basecondition. Figure 10 summarises the results of thissimulation for water balance variables for the totalBaltic Sea drainage basin together with HBV-Baltic results forced with synoptic station datafrom the same period.
The REMO/ERA snowpack results lie closeto HBV-base snowpack, yet with slightly highervalues in all but one year. Differences inevapotranspiration occur primarily in warmermonths while wintertime differences are quitesmall, which is contrary to results from most ofthe control run comparisons. This difference inevapotranspiration is also apparent in the soil
moisture plot with drier conditions for REMO/ERA (i.e., higher smd) than for HBV-base. Runoffgeneration from REMO/ERA matches HBV-Basevalues better for peak ¯ows than for low ¯owsalthough the peaks are often too high.
Figure 11 shows precipitation from the REMO/ERA run compared to synoptic station data for thesame period. The use of analysed boundary con-ditions, instead of a global climate model, showedimprovement in the seasonal distribution ofprecipitation, although there are still considerabledifferences in late winter and early spring. Someof these differences can be attributed to aero-dynamically induced undercatch.
7. Discussion
There are considerable differences between howhydrological models and atmospheric modelsrepresent runoff generation processes. The use ofHBV-Baltic as an evaluation tool has served toimprove the dialogue between hydrological andmeteorological modellers within the BALTEXresearch community. Regardless of the accuracyof the generated results, the analysis process itselfserved as a catalyst to get both disciplines lookingat land surface interface problems together. This ishard to measure in real terms, but the experiencegained is quite valuable.
Compensating errors are a key obstacle inmodelling, a dilemma that all complex models aresubject to. Results from the climate model controlanalyses showed evidence of compensating errors
Fig. 10. Model results over the total Baltic Sea drainagebasin for the period 1979±1988. Direct climate modeloutput driven by the ECMWF re-analysis (REMO/ERA) iscompared to output from HBV-Baltic driven with synopticstation data (HBV-Base). (The plots omit the ®rst 9 monthsof 1979 to avoid spinup effects for soil moisture and snow)
Fig. 11. Average precipitation for the total Baltic Seadrainage basin from the REMO/ERA model run and fromsynoptic station data (HBV-Baltic base condition). BothREMO/ERA values and the synoptic station data are 9-yearaverages for the period 1980±1988. The seasonal synopticstation precipitation values shown are uncorrected, whereasthe annual values show the amount of correction (top layerof bar graph) added by HBV-Baltic for aerodynamicallyinduced undercatch
56 L. P. Graham and S. BergstroÈm

between snow and precipitation for all modelcases. Values for snow water equivalent in theclimate models lie closer to climatological valuesthan the respective HBV-Baltic results with thesame driving forces, while at the same timewintertime precipitation for the climate models isoverestimated. Thus, the snow routines appeartuned to the present climate, regardless of the factthat the corresponding precipitation is mismatchedwith the present climate. This leads to a suspicionof compensating errors in the snow and precipita-tion components of the climate models. Resultsfrom the REMO/ERA experiment using re-analysis boundary conditions support this suspi-cion. This run had the added advantage that actualyears from the HBV-Baltic base condition couldbe used for comparison instead of averageclimatological values. As with the control runcases, the REMO/ERA snowpack matches theHBV-Base snowpack well, although winter pre-cipitation is probably higher than synopticobservations.
The soil moisture intercomparison is stronglyrelated to how evapotranspiration is treated in thedifferent models, but also to the modelling of in-®ltration, drainage and its subgrid variabilities.Although not presented in detail here, many of thechanges made in the RCA version 2 land surfaceparameterisation scheme brought the representa-tion of water at the land surface/atmosphereinterface into much closer agreement withmethods used by hydrological modellers. Thesechanges utilised the concept of variability para-meters and were done with little added complexityto the atmospheric model. If one accepts the factthat HBV performs reasonably well at represent-ing the water balance, then changes to the waterbalance components of climate models that comecloser to HBV results with the same driving forcesought to be improvements. The change in resultsfrom RCAO to RCA88-H, which used the samelateral boundary forcing, is promising as themodelling of soil moisture follows much closerthe results from HBV-Baltic with the same forcing(Fig. 6). Evapotranspiration also showed improve-ments, as results from RCAO were shown to betoo low when compared to both climatic calcula-tions (Rummukainen et al., 1998) and the HBV-Baltic simulations. Runoff generation, althoughstill far from the values produced by HBV-Baltic,did show improvement. Part of this is attributed to
the fact that RCAO did not close the water budgetproperly and water was actually lost from thesystem in that model version.
The comparisons presented for the control runsshowed large differences in winter evapotranspira-tion between climate models and HBV-Baltic.This led to one conclusion that the hydrologicalmodel should be improved, as winter evapotran-spiration is currently implicit in a snowfall corre-ction factor. However, comparison of Figs. 7 and10 show the winter results for REMO/ERA(analysed boundary runs) to be in much closeragreement to HBV-Baltic values than for the othercases (control runs). This indicates that the winter-time problem may not have as much impact as®rst suspected. On the other hand, evapotranspira-tion is systematically higher for REMO/ERA thanHBV-Baltic during most of the year, and partic-ularly in summer.
Results from this work show that large-scalehydrological modelling on the scale of the BalticBasin can be done with relatively simple modelssuch as HBV. This is con®rmed by Krysanovaet al. (1999). As recommended by Refsgaard(1998), we have to choose a strategy that is properfor the problem we want to solve. The strategyof using HBV-Baltic as an integral part of thedevelopment process can take us quite a long waytoward eventually creating a new generation ofharmonised land-sea-atmospheric models thatprovide a balanced approach to climate modelling.As pointed out in Graham and BergstroÈm (2000),we also need to keep in mind the concept of acomplexity chain when putting model componentstogether. We should avoid the irrational process ofgoing from high levels of sophistication to lowerlevels of sophistication, and then back to highlevels of sophistication again. The details that arelost in the ®rst step (high to low) can never berecovered in the second step (low to high), unlessimportant new information is added.
Data quality is always a concern. Regionaldifferences in the quality of the synoptic databasewere noted during the original calibration/veri®-cation procedure. These are discussed by Graham(1999). In short, the precipitation records availablefor this study, primarily for Polish regions, exhibitinconsistencies that affect the quality of the calib-ration. Additional data from other precipitationstations have recently been received that con®rmthis initial suspicion and pinpoint certain years
Water balance modelling in the Baltic Sea drainage basin 57

where strong anomalies in the synoptic data occur.During the same period, signi®cant errors in theriver discharge records for the Vistula River wererecently discovered. It is thus no coincidence thatthe poorest HBV-Baltic model performance occursin these regions. These errors have been noted, buta re-calibration of the model with the new data hasyet to be performed.
Model parameter uncertainty and calibrationare also limitations. A recent study by Uhlenbrooket al. (1999) looks speci®cally at parameteruncertainty for HBV. They found a wide rangeof calibrated parameters that can lead to a `̀ good®t'' for modelling river discharge and maintainthat this can have implications for model predic-tions. Although the uncertainties pointed out byUhlenbrook et al. (1999) are a real concern, theymay not be critical as long as the model is runwithin its range of calibration. Extrapolationbeyond this range, as may be the case for climatechange impact studies, leads to greater uncer-tainty. This problem is hard to overcome in theabsence of hydrological models that are sosophisticated (or well developed from a physicalpoint of view) that they perform well withoutcalibration or tuning. Uhlenbrook et al. furthermaintain that more physical models, althoughseemingly more realistic than conceptual models,have their own uncertainties related to scale andbasin heterogeneity. They recommend that allstudies evaluating land-use or climate changeeffects should be accompanied by estimates ofparameter uncertainty.
Falling back on the original argument that theHBV model is well tested and validated, there isno reason to expect that HBV-Baltic cannotcontinue to be used for future applications toclimate modelling in the Baltic Basin, given thatwe take into account the limitations associatedwith the model and this approach. Some of theselimitations will be addressed in future research,others may not be resolvable (or will take longerto resolve) and therefore must be considered aspart of the uncertainty of the results. There is along way to go before atmospheric climate modelscan on their own adequately represent the large-scale hydrological cycle in the detail needed forboth impact studies and operational studies (use inmore detailed studies on ®ner scales is evenfurther away). However, the long-term aim shouldbe to get rid of the need to use an HBV-type
model in one-way coupling to the atmosphericmodels applied at large scale. As suggested inGraham and BergstroÈm (2000), a better solution isto build the hydrological model into the atmo-spheric model. This does not mean simplycoupling the two together, but rather incorporatingthe concepts from hydrological modelling intoatmospheric modelling in a harmonised fashion,while trying to both avoid over-parameterisationand keeping in mind the complexity chain forcoupling of different components. Off-line use ofHBV-Baltic as an analysis tool should continueunder this development process.
8. Conclusions
Two main conclusions from this research are, i)conceptual hydrological models play an importantrole in the realm of continental scale hydrologicalmodelling, and ii) atmospheric models can bene®tfrom the experience of hydrological modellers indeveloping simpler, yet effective land surface par-ameterisation. Within these two themes, there aremany more conclusions that can be drawn from thiswork, the most important of these are as follows:
(i) Scale is a minor problem for this type ofhydrological model and application.
(ii) The lack of complete energy balance par-ameterisation is the main limitation in theconceptual hydrological approach.
(iii) Meaningful studies of atmospheric modelsare conducted with large-scale hydrologicalmodels ± this helps to identify inconsisten-cies in both types of models.
(iv) Incorporation of variability parameters in thesoil moisture modelling routines of atmo-spheric models leads to better soil moistureperformance without adding unneeded com-plexity.
Furthermore, HBV-Baltic provides a simplemodelling tool for evaluation of the large-scalewater balance of the Baltic Sea drainage basin.Although it provides only index-type results overlarge subbasins, it is the only existing hydrologicalmodel that covers the entire Baltic Basin and willcontinue to be used until more detailed modelscan be successfully applied at this scale. Inoperational applications, it is particularly usefulfor updating freshwater in¯ow records to theBaltic Sea when observations are unavailable.
58 L. P. Graham and S. BergstroÈm
Acknowledgements
This work was carried out within both the NEWBALTIC IIproject with funds from the European Commission'sprogramme Environment and Climate (Contract No.ENV4-CT97-0626) and the Swedish Environmental Protec-tion Agency, and the Swedish Regional Climate ModellingProgramme (SWECLIM) with funding from the SwedishStrategic Environmental Research Foundation (MISTRA)and the Swedish Meteorological and Hydrological Institute(SMHI). The authors thank our colleagues at the Max-Planck-Institute for Meteorology, the German ClimateComputing Centre and ECMWF for making the ECHAM4/T106 and REMO/ERA simulations data available, and theRossby Centre at SMHI for making the RCA simulationsdata available.
References
Arheimer B, Brandt M (1998) Modelling nitrogen transportand retention in the catchments of southern Sweden.Ambio 27: 471±480
BALTEX (1995) Baltic Sea Experiment BALTEX ± InitialImplementation Plan. 2, International BALTEX Secretar-iat, GKSS Research Center, Geesthacht, Germany,84 pp
BDBP (2000) Baltic Sea Region GIS, Maps and StatisticalDatabase. Baltic Drainage Basin Project (BDBP: BeijerInstitute, Dept. of Systems Ecology at Stockhom Univer-sity; UNEP/GRID-Arendal). (http://www.grida.no/ baltic/)
BergstroÈm S (1976) Development and application of a con-ceptual runoff model for Scandinavian catchments. Doc-toral Thesis, Department of Water Resources Engineering,Lund Institute of Technology, Lund University, Lund, 134pp
BergstroÈm S (1995) The HBV Model. In: Singh VP (ed)Computer models of watershed hydrology. WaterResources Publications, Highlands Ranch, CO, pp 443±476
BergstroÈm S (1997) World-wide experience of applicationsof the HBV hydrological model. In: Proceedings from theInternational Symposium on Runoff Computations forWater Projects. St Petersburg, October 30±November 3,1995, Technical Documents in Hydrology, No 9, IHP-V,UNESCO, Paris
BergstroÈm S, Carlsson B (1994) River runoff to the BalticSea: 1950±1990. Ambio 23: 280±287
BergstroÈm S, Forsman A (1973) Development of a concep-tual deterministic rainfall-runoff model. Nord Hydrol 4:147±170
BergstroÈm S, Graham LP (1998) On the scale problem inhydrological modelling. J Hydrol 211: 253±265
Beven KJ (1996) A Discussion of Distributed HydrologicalModelling. In: Abbott MB, Refsgaard JC (eds), DistributedHydrological Modelling. Water Science and TechnologyLibrary. Kluwer Academic Publishers, Dordrecht, pp 255±278
Brandt M (1990) Human Impacts and Weather-DependentEffects on Water Balance and Water Quality in someSwedish River Basins. Doctoral Thesis, Department of
Land and Water Resources, Royal Institute of Technology,Stockholm, 37(�papers) pp
Carlsson B, Sanner H (1996) Modelling in¯uence of riverregulation on runoff to the Gulf of Bothnia. Nord Hydrol27: 337±350
DuÈmenil L, Todini E (1992) A rainfall-runoff scheme for usein the Hamburg climate model. In: O'Kane JP (ed)Advances in theoretical hydrology ± A tribute to JamesDooge. Elsevier, Amsterdam, pp 129±157
EROS (1997) Digital Chart of the World (DCW) Global 30Arc Second Elevation Data Set. EROS Data Center.(http://edcwww.cr.usgs.gov/landdaac/)
Gibson JK, KaÊllberg P, Uppala S, Hernandez A, Nomura A,Serano E (1999) ECMWF Re-Analysis Project ReportSeries - 1. ERA description (Version 2), European Centrefor Medium-Range Weather Forecasts, Reading, UK, 72 pp
Graham LP (1999) Modeling runoff to the Baltic Sea. Ambio28: 328±334
Graham LP, BergstroÈm S (2000) Land surface modelling inhydrology and meteorology ± lessons learned from theBaltic Basin. Hydrol Earth Sys Sci 4: 13±22
Graham LP, Jacob D (2000) Using large-scale hydrologicmodeling to review runoff generation processes in GCMclimate models. Meteorol Z 9: 49±57
Gustafsson B (1997) Dynamics of the Seas and StraitsBetween the Baltic and North Seas ± a process-orientedoceanographic study. Doctoral Thesis, Department ofOceanography, Earth Sciences Centre, GoÈteborg Univer-sity, 22(�papers) pp
Gustafsson N (1981) A Review of Methods for ObjectiveAnalysis. In: Bengtsson L, Ghil M, KaÈlleÂn E (eds)Dynamic Meteorology: Data Assimilation Methods.Applied Mathematical Sciences. Springer, pp 17±76
HaÊkansson B, Alenius P, Brydsten L (1996) Physical envir-onment in the Gulf of Bothnia. Ambio Special Report 8: 5±12
Harlin J (1992) Hydrological Modelling of Extreme Floodsin Sweden. Doctoral Thesis, Division of Hydraulic Engi-neering, Department of Civil and Environmental Engineer-ing, Royal Institute of Technology, Stockholm,61(�papers) pp
Hela I (1966) Secular changes in the salinity of the upperwaters of the northern Baltic Sea. Commentat Phys-Math,Soc Sci Fenn 31: 1±21
Jacob D (2001) A note to the simulation of the annual andinter-annual variability of the water budget over the BalticSea drainage basin. Meteorol Atmos Phys (this issue)
Kite GW (1997) Simulating Columbia river ¯ows with datafrom regional-scale climate models. Water Resour Res 33:1275±1285
Koster RD, Milly PCD (1997) The interplay betweentranspiration and runoff formulations in land surfaceschemes used with atmospheric models. J Climate 10:1578±1591
Krysanova V, Bronstert A, MuÈller-Wohlfeil D-I (1999)Modelling river discharge for large drainage basins:from lumped to distributed approach. Hydrol Sci J 44:313±331
Kuusisto E (ed), (1999) Saimaa a Living Lake. TammiPublishers, Helsinki
Water balance modelling in the Baltic Sea drainage basin 59
LideÂn R (1999) A new approach for estimating suspendedsediment yield. Hydrol Earth Sys Sci 3: 285±294
LindstroÈm G, Johansson B, Persson M, Gardelin M, Berg-stroÈm S (1997) Development and test of the distributedHBV-96 model. J Hydrol 201: 272±288
Liston GE, Sud YC, Wood EF (1994) Evaluating GCM landsurface hydrology parameterizations by computing riverdischarges using a runoff routing model: application to theMississippi basin. J Appl Met 33: 394±405
Lohmann D, Lettenmaier DP, Liang X, Wood EF, Boone A,Chang S, Chen F, Dai Y, Desborough C, Dickinson RE,Duan Q, Ek M, Gusev YM, Habets P, Irannejad P, KosterR, Mitchel KE, Nasonova ON, Noilhan J, Schaake J,Schlosser A, Shao Y, Shmakin AB, Verseghy D, WarrachK, Wetzel P, Xue Y, Yang Z-L, Zeng Q-C (1998) Theproject for intercomparison of land-surface parameteriza-tion schemes (PILPS) phase 2(c) Red-Arkansas RiverBasin experiment: 3. Spatial and temporal analysis ofwater ¯uxes. Glob Planet Change 19: 161±179
MatthaÈus W, Schinke H (1999) The in¯uence of river runoffon deep water conditions of the Baltic Sea. Hydrobiologia393: 1±10
Nash JE, Sutcliffe JV (1970) River ¯ow forecasting throughconceptual models part I ± A discussion of principles. JHydrol 10: 282±290
Omstedt A, Axell LB (1998) Modeling the seasonal, inter-annual, and long-term variations of salinity and tempera-ture in the Baltic Proper. Tellus 50A: 637±652
Omstedt A, Meuller L, Nyberg L (1997) Interannual, sea-sonal and regional variations of precipitation and evapora-tion over the Baltic Sea. Ambio 26: 484±492
Omstedt A, Rutgersson A (2000) Closing the water and heatcycles of the Baltic Sea. Meteorol Z 9: 57±64
Pettersson O (1893) Den svenska hydroga®ska expeditionen1877-II. Andra afdelningen (The Swedish hydrographicexpedition of 1877, in Swedish). Kongl Svenska Vetens-kaps-Akadamiens Handlingar Band 25, N:o 1: 73±163
Refsgaard JC (1996) Terminology, Modelling Protocol andClassi®cation of Hydrological Model Codes. In: AbbottMB, Refsgaard JC (eds), Distributed Hydrological Mod-elling. Water Science and Technology Library. KluwerAcademic Publishers, Dordrecht, pp 17±39
Refsgaard JC (1998) Conceptual versus physically-basedhydrological models: which models to be used for BAL-TEX purposes? In: Raschke E, Isemer H-J (eds), Proceed-ings from the Second Study Conference on BALTEX.RuÈgen, Germany, May 25±29, pp 180±184
Refsgaard JC, Storm B (1995) MIKE SHE. In: Singh VP (ed)Computer Models of Watershed Hydrology. WaterResources Publications, Highlands Ranch, Colorado, pp809±846
Robock A, Shlosser CA, Vinnikov KY, Speranskaya NA,Entin JK (1998) Evaluation of AMIP soil moisture simu-lations. Glob Planet Change 19: 181±208
Roeckner E, Arpe K, Bengtsson L, Christoph M, Claussen M,DuÈmenil L, Esch M, Giorgetta M, Schlese U, SchulzweidaU (1996) The Atmospheric General Circulation ModelECHAM-4: Model Description and Simulation of Present-day Climate. Report No 218, Max-Planck-Institute forMeteorology, Hamburg, 90 pp
Rubel F, Hantel M (1999) Correction of daily rain gaugemeasurements in the Baltic Sea drainage basin. NordHydrol 30: 191±208
Rummukainen M, RaÈisaÈnen J, Bringfelt B, Ullerstig A,Omstedt A, WilleÂn U, Hansson U, Jones C (2001) Aregional climate model for northern Europe: modeldescription and results from the downscaling of twoGCM control simulations. Clim Dynamics 17: 339±359
Rummukainen M, RaÈisaÈnen J, Ullerstig A, Bringfelt B,Hansson U, Graham P, WilleÂn U (1998) RCA ± RossbyCentre Regional Atmospheric Climate Model: ModelDescription and Results from the First Multi-Year Simula-tion. SMHI Reports RMK, No 83, Swedish Meteorologicaland Hydrological Institute, NorrkoÈping, 76 pp
Saelthun NR, Aittoniemi P, BergstroÈm S, Einarsson K,JoÂhannesson T, LindstroÈm G, Ohlsson P-E, Thomsen T,VehvilaÈinen B, Aamodt KO (1998) Climate ChangeImpacts on Runoff and Hydropower in the Nordic Coun-tries. TemaNord 1998:522, Nordic Council of Ministers,Copenhagen, 170 pp
SandeÂn P, Warfvinge P (eds) (1992) Modelling GroundwaterResponse to Acidi®cation. SMHI Reports RH, No 5,Swedish Meteorological and Hydrological Institute, Norr-koÈping, 201 pp
Stendel M, Roeckner E (1998) Impacts of Horizontal Reso-lution on Simulated Climate Statistics in ECHAM-4.Report No 253, Max-Planck-Institute for Meteorology,Hamburg, 55 pp
Storm B, Refsgaard A (1996) Distributed Physically-BasedModelling of the Entire Land Phase of the HydrologicalCycle. In: Abbott MB, Refsgaard JC (eds), DistributedHydrological Modelling. Water Science and TechnologyLibrary. Kluwer Academic Publishers, Dordrecht, pp 55±69
Sweitzer J, Langaas S, Folke C (1996) Land cover andpopulation density in the Baltic Sea drainage basin: aGIS database. Ambio 25: 191±198
Uhlenbrook S, Seibert J, Leibundgut C, Rodhe A (1999)Prediction uncertainty of conceptual rainfall-runoff mod-els caused by problems in identifying model parametersand structure. Hydrol Sci J 44: 779±797
VehvilaÈinen B, Huttunen M (1997) Climate change andwater resources in Finland. Boreal Environ Res 2:3±18
Wood EF, Lettenmaier DP, Liang X, Lohmann D, Boone A,Chang S, Chen F, Dai Y, Dickinson RE, Duan Q, Ek M,Gusev YM, Habets P, Irannejad P, Koster R, Mitchel KE,Nasonova ON, Noilhan J, Schaake J, Schlosser A, Shao Y,Shmakin AB, Verseghy D, Warrach K, Wetzel P, Xue Y,Yang Z-L, Zeng Q-C (1998) The project for intercompar-ison of land-surface parameterization schemes (PILPS)phase 2(c) Red-Arkansas River Basin experiment:1. Experiment description and summary intercomparisons.Glob Planet Change 19: 115±135
Wulff F, Stigebrandt A, Rahm L (1990) Nutrient dynamics ofthe Baltic Sea. Ambio 19: 126±133
Authors' address: L. P. Graham and S. BergstroÈm, Swed-ish Meteorological and Hydrological Institute, SE-60176NorrkoÈping, Sweden (E-mail: [email protected])
60 L. P. Graham and S. BergstroÈm: Water balance modelling in the Baltic Sea drainage basin