Embed Size (px)
Citation preview
BGD12, 16359–16396, 2015
Water masscharacteristics in the
southern ChukchiSea biological
hotspot
S. Nishino et al.
Title Page
Abstract Introduction
Conclusions References
Tables Figures
J I
J I
Back Close
Full Screen / Esc
Printer-friendly Version
Interactive Discussion
Discussion
Paper
|D
iscussionP
aper|
Discussion
Paper
|D
iscussionP
aper|
Biogeosciences Discuss., 12, 16359–16396, 2015www.biogeosciences-discuss.net/12/16359/2015/doi:10.5194/bgd-12-16359-2015© Author(s) 2015. CC Attribution 3.0 License.
This discussion paper is/has been under review for the journal Biogeosciences (BG).Please refer to the corresponding final paper in BG if available.
Water mass characteristics and theirtemporal changes in a biological hotspotin the southern Chukchi SeaS. Nishino1, T. Kikuchi1, A. Fujiwara1, T. Hirawake2, and M. Aoyama3,4
1Institute of Arctic Climate and Environment Research, Japan Agency for Marine-EarthScience and Technology, Yokosuka, Japan2Faculty of Fisheries Sciences, Hokkaido University, Hakodate, Japan3Research and Development Center for Global Change, Japan Agency for Marine-EarthScience and Technology, Yokosuka, Japan4Institute of Environmental Radioactivity, Fukushima University, Fukushima, Japan
Received: 23 August 2015 – Accepted: 10 September 2015 – Published: 6 October 2015
Correspondence to: S. Nishino ([email protected])
Published by Copernicus Publications on behalf of the European Geosciences Union.
16359
BGD12, 16359–16396, 2015
Water masscharacteristics in the
southern ChukchiSea biological
hotspot
S. Nishino et al.
Title Page
Abstract Introduction
Conclusions References
Tables Figures
J I
J I
Back Close
Full Screen / Esc
Printer-friendly Version
Interactive Discussion
Discussion
Paper
|D
iscussionP
aper|
Discussion
Paper
|D
iscussionP
aper|
Abstract
We analysed mooring and ship-based hydrographic and biogeochemical data obtainedfrom a Hope Valley biological hotspot in the southern Chukchi Sea. The moorings weredeployed from 16 July 2012 to 19 July 2014, and data were captured during spring andfall blooms with high chlorophyll a concentrations. Turbidity increased and dissolved5
oxygen decreased in the bottom water at the mooring site before the fall bloom, sug-gesting an accumulation of particulate organic matter and its decomposition (nutrientregeneration) at the bottom. This event may have been a trigger for the fall bloom atthis site. The bloom was maintained for 1 month in 2012 and for 2 months in 2013.The maintenance mechanism for the fall bloom was also studied by hydrographic and10
biogeochemical surveys in late summer to fall 2012 and 2013. Nutrient-rich water fromthe Bering Sea supplied nutrients to Hope Valley, although a reduction in nutrients mayhave occurred in 2012 by mixing of lower-nutrient water that would have remained onthe Chukchi Sea shelf during the spring and fall blooms. In addition, nutrient regener-ation at the bottom of Hope Valley could have increased nutrient concentrations and15
explained 60 % of its nutrient content in fall 2012. The high nutrient content with thedome-like structure of the bottom water may have maintained the high primary produc-tivity at this site during the fall bloom. Primary productivity was 0.3 in September 2012and 1.6 g C m−2 d−1 in September 2013. The lower productivity in 2012 was related tostrong stratification caused by the high fraction of surface sea ice meltwater.20
1 Introduction
The southern Chukchi Sea is one of the most biologically productive regions of theworld’s oceans because of nutrients supplied by northward flow of Pacific-originatingwater advected over the shelves from the northern Bering Sea into the Arctic Ocean(McRoy, 1993; Springer and McRoy, 1993; Hunt et al., 2013). Due to high primary25
productivity, a large quantity of organic matter descends to the sea floor as potential
16360
BGD12, 16359–16396, 2015
Water masscharacteristics in the
southern ChukchiSea biological
hotspot
S. Nishino et al.
Title Page
Abstract Introduction
Conclusions References
Tables Figures
J I
J I
Back Close
Full Screen / Esc
Printer-friendly Version
Interactive Discussion
Discussion
Paper
|D
iscussionP
aper|
Discussion
Paper
|D
iscussionP
aper|
food for benthic communities, resulting in high benthic biomass (Grebmeier et al., 1988,2006, 2015; Grebmeier, 2012). Consequently, large benthic feeders at high trophiclevels, such as grey whales and walruses, also congregate there (Feder et al., 2005).Such a region of high biological activity is called a biological hotspot.
The Arctic has rapidly lost its summer sea ice cover over recent decades (Stroeve5
et al., 2007; Comiso et al., 2008; Kwok et al., 2009), which may significantly changeocean conditions and marine biological activities. However, the effects of extreme iceretreats and delayed sea ice formation in late autumn on primary production are un-certain in the Pacific Arctic including the Chukchi Sea, whereas clear changes haveoccurred in the ranges of zooplankton, benthic organisms, and fish species in sum-10
mer, as well as through loss of sea ice as habitat and platforms for marine mammals(Grebmeier et al., 2010, 2015; Grebmeier, 2012). Primary productivity in the Arctic hasincreased in recent years, as estimated using satellite data, due to an accelerated ex-tension of the open water area and a longer ice-free season (e.g. Arrigo et al., 2008;Pabi et al., 2008). In contrast, seasonal field measurements in the Chukchi Sea during15
the ice-free season in summer/fall indicate a substantial decrease in recent primaryproductivity compared to estimates in the 1980s (Lee et al., 2007, 2013). One of thereasons for the recent low primary productivity obtained from in situ measurementsmay be the large annual variation related to spatial and temporal changes in biogeo-chemical processes (Lee et al., 2007). Therefore, long-term monitoring using moorings20
with chemical and biological sensors is necessary along with ship-based hydrographicand biogeochemical surveys to better understand the responses of marine ecosystemto ongoing environmental changes in the Chukchi Sea. The southern Chukchi Sea isa suitable location for such long-term monitoring because the site is one of the mostbiologically productive regions and thus is in a state of significant transition, with not25
only environmental but also potentially economic and social consequences.The recent loss of Arctic sea ice may also induce a second bloom in fall (fall bloom)
because the delayed freeze-up and increased exposure of the sea surface to windstress causes significant wind-driven vertical mixing and upward supply of nutrients,
16361
BGD12, 16359–16396, 2015
Water masscharacteristics in the
southern ChukchiSea biological
hotspot
S. Nishino et al.
Title Page
Abstract Introduction
Conclusions References
Tables Figures
J I
J I
Back Close
Full Screen / Esc
Printer-friendly Version
Interactive Discussion
Discussion
Paper
|D
iscussionP
aper|
Discussion
Paper
|D
iscussionP
aper|
resulting in increased phytoplankton biomass. Ardyna et al. (2014) used satellite datato show that the frequency and area of fall blooms have increased recently through-out the Arctic. Nishino et al. (2015) reported fall bloom during strong wind events inthe northern Chukchi Sea based on observational evidence. The increase in biomassduring fall bloom could accompany changes in phyto- and zooplankton communities5
and may impact higher trophic levels in the ecosystem (Yokoi et al., 2015; Matsunoet al., 2015). However, the fate of the fall bloom (e.g. when it begins, the trigger, howlong it continues, and the mechanism maintaining it) is unclear. Seasonal monitoring ofphytoplankton biomass using water mass characteristics may provide answers to suchquestions.10
Here, we analysed mooring and ship-based data obtained from a biological hotspotin the southern Chukchi Sea to understand the water mass characteristics (and tem-poral changes thereof) that influence phytoplankton biomass and productivity. Moor-ing data, including temperature (T ), salinity (S), dissolved oxygen (DO), chlorophyll a(Chl a), and turbidity near the bottom of the biological hotspot in the southern Chukchi15
Sea were collected from July 2012 to July 2014 for the first time. The data were used toexamine changes in water mass characteristics and phytoplankton biomass associatedwith spring and fall blooms in this biological hotspot. Hydrographic and biogeochemicalsurveys (conductivity-temperature-depth [CTD] and water sampling) were conductedacross the biological hotspot during late summer to fall 2012 and 2013. We focused20
on the biogeochemical parameters DO, Chl a, turbidity, and nutrients to study the bio-geochemical processes that maintain the biological hotspot until late summer and fall,and their differences between the 2 years. The effect of sea ice meltwater on primaryproductivity is also discussed in association with stratification of the water column.
16362
BGD12, 16359–16396, 2015
Water masscharacteristics in the
southern ChukchiSea biological
hotspot
S. Nishino et al.
Title Page
Abstract Introduction
Conclusions References
Tables Figures
J I
J I
Back Close
Full Screen / Esc
Printer-friendly Version
Interactive Discussion
Discussion
Paper
|D
iscussionP
aper|
Discussion
Paper
|D
iscussionP
aper|
2 Data and methods
2.1 Mooring data
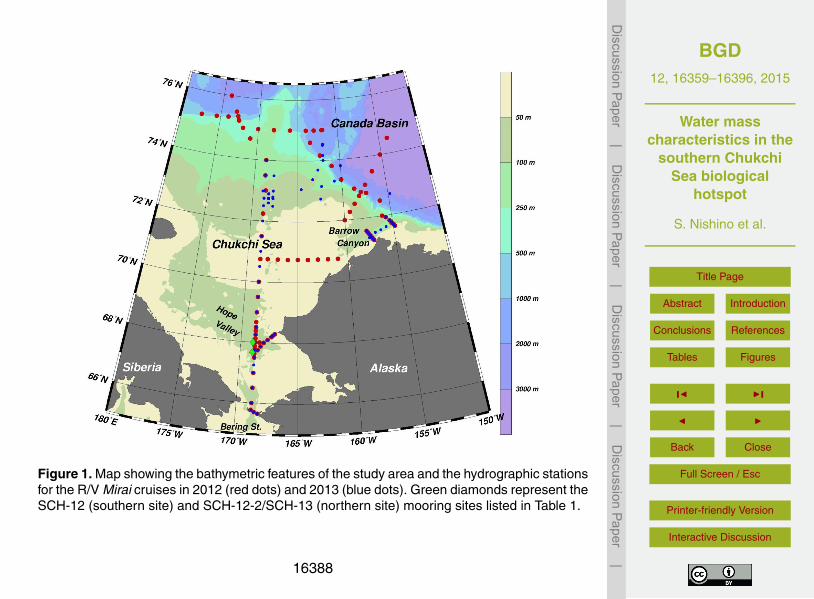
We deployed and recovered three temporally sequenced moorings (named SCH-12,SCH-12-2, and SCH-13; Table 1) from 16 July 2012 to 19 July 2014 to acquire T , S,DO, Chl a, and turbidity time-series near the bottom of a biological hotspot located in5
Hope Valley of the southern Chukchi Sea (Fig. 1). A MicroCAT C-T Recorder, SBE37-SM (Sea-Bird Electronics, Bellevue, WA, USA) was used to acquire the T and Sdata. Maximum drift in the sensors over 1 year were 0.002 ◦C for temperature and 0.01for salinity in pre- and post-calibration comparisons. The AROW-USB phosphorescentDO sensor was used (JFE Advantech Co., Ltd., Kobe, Japan). The sensor was cal-10
ibrated using oxygen-saturated and anoxic water to determine the linear relationshipbetween them with ±2 % accuracy. Fluorescence and backscatter were measured toobtain the Chl a and turbidity data, respectively, using ACLW-USB sensors (JFE Ad-vantech). Chl a nonlinearity between 0 and 200 mg m−3 was ±1 %. The turbidity sensorwas calibrated by the manufacturer using formazin standard solutions, and the results15
were expressed in formazin turbidity units (FTUs). Accuracy of the turbidity sensor was±0.3 FTU or ±2 %. The data were recorded every hour and were smoothed using arunning 24 h mean after removing spike noise. Because the DO value obtained on 1September 2013 from the third mooring (SCH-13) was much higher than that from thewater sample collected at the nearest location and time to the mooring data acquisi-20
tion, we subtracted the excess value of 69 µmol kg−1 from the SCH-13 mooring DOdata collected from 20 July 2013 to 19 July 2014.
To analyse the mooring data, we used the definitions of water masses from previousstudies. The bottom waters in the Chukchi Sea that originate from the Pacific Oceanin summer and winter are characterised by T and S. In summer, they can be classi-25
fied into three water masses: Anadyr Water (S > 32.5, T = −1.0–1.5 ◦C) in the west,Bering Shelf Water (S =31.8–32.5, T =0–4 ◦C) in the centre, and Alaskan Coastal Wa-ter (ACW; S < 31.8, T > 4 ◦C) near the Alaskan coast (Coachman et al., 1975; Coach-
16363
BGD12, 16359–16396, 2015
Water masscharacteristics in the
southern ChukchiSea biological
hotspot
S. Nishino et al.
Title Page
Abstract Introduction
Conclusions References
Tables Figures
J I
J I
Back Close
Full Screen / Esc
Printer-friendly Version
Interactive Discussion
Discussion
Paper
|D
iscussionP
aper|
Discussion
Paper
|D
iscussionP
aper|
man, 1987; Grebmeier et al., 1988). As the Anadyr and Bering Shelf Waters are usuallynot distinct in the Chukchi Sea, the combined water mass is called the Bering Shelf-Anadyr Water (BSAW). In winter, the water mass called Bering Winter Water (BWW;S =32.4–34.0 with near freezing temperature) occupies the Chukchi Sea (Coachmanand Barnes, 1961; Kinney et al., 1970).5
2.2 Ship-based data
Ship-based hydrographic and biogeochemical surveys were conducted in the ChukchiSea and Canada Basin from 13 September to 4 October 2012 and from 31 Augustto 4 October 2013 on board the R/V Mirai of the Japan Agency for Marine-Earth Sci-ence and Technology, JAMSTEC (Fig. 1). Detailed descriptions of the 2012 and 201310
R/V Mirai cruises, including the above-mentioned moorings, are provided in the cruisereports (Kikuchi 2012 and Nishino 2013, respectively), and the data will be open tothe public via the JAMSTEC website (http://www.godac.jamstec.go.jp/cruisedata/mirai/e/index.html). We also used data obtained from cruises of the R/V Mirai in 2004, 2008,and 2010 to compare to the data from 2012 and 2013, which were downloaded from15
the JAMSTEC website. The R/V Mirai survey periods for the area north of the BeringStrait in each year are listed in Table 2.
A CTD (SBE9plus; Sea-Bird Electronics) and a carousel water-sampling system with36 Niskin bottles (12 L) were used to collect data. In addition, DO, light transmission,fluorescence, and photosynthetically active radiation sensors were attached to the CTD20
system. Seawater samples were collected to measures S, DO, total alkalinity, nutrients(nitrate, nitrite, phosphate, silicate, and ammonium), Chl a, primary productivity, andother chemical and biological parameters.
Bottle S samples were analysed following the Global Ocean Ship-based Hydro-graphic Investigations Program (GO-SHIP) Repeat Hydrography Manual using a25
Guideline AUTOSAL salinometer and International Association for the Physical Sci-ences of the Oceans standard seawater as reference material (Kawano, 2010). Preci-sion values of the salinity measurements in 2012 and 2013 were 0.0060 and 0.0068,
16364
BGD12, 16359–16396, 2015
Water masscharacteristics in the
southern ChukchiSea biological
hotspot
S. Nishino et al.
Title Page
Abstract Introduction
Conclusions References
Tables Figures
J I
J I
Back Close
Full Screen / Esc
Printer-friendly Version
Interactive Discussion
Discussion
Paper
|D
iscussionP
aper|
Discussion
Paper
|D
iscussionP
aper|
respectively, for shallow-water samples (≤200 m), and 0.0003 and 0.0002, respectively,for deep-water samples (> 200 m).
DO in the samples was measured by Winkler titration following World Ocean Cir-culation Experiment Hydrographic Program operations and methods (Dickson, 1996).Precision values for the 2012 and 2013 DO measurements were both 0.12 µmol kg−1.5
Total alkalinity in the samples was measured using a spectrophotometric systemand the scheme reported by Yao and Byrne (1998). The total alkalinity values werecalibrated against certified reference material provided by Dr. Dickson (Scripps Insti-tute of Oceanography, La Jolla, CA, USA). The precision for the 2012 and 2013 totalalkalinity measurements was 0.57 and 0.80 µmol kg−1, respectively.10
Nutrient samples were analysed according to the GO-SHIP Repeat Hydrogra-phy Manual (Hydes et al., 2010) using reference materials for nutrients in seawater(Aoyama and Hydes, 2010; Sato et al., 2010). The 2012 and 2013 precision values,expressed as coefficients of variation (CVs), were 0.12 and 0.11 % for nitrate, 0.21and 0.19 % for nitrite, 0.19 and 0.11 % for phosphate, 0.11 and 0.16 % for silicate, and15
0.34 and 0.30 %, for ammonium, respectively.Chl a was measured in seawater samples using a fluorometric non-acidification
method (Welschmeyer, 1994) and a Turner Design fluorometer (10-AU-005; Sunny-vale, CA, USA). The precision of the 2013 Chl a measurements (CV) was 5.3 %. Pre-cision was not estimated in 2012 because multiple samples were not available for the20
estimate.Primary phytoplankton productivity was determined using the stable 13C isotope
method (Hama et al., 1983). We sampled seawater from seven optical depths at 100,38, 14, 7, 4, 1, and 0.6 % of surface irradiance. The seawater samples were inoculatedwith a 200 µM labelled carbon substrate (NaH13CO3) that represented ∼10 % enrich-25
ment of the total inorganic carbon in ambient water. The samples were placed in anincubator for 24 h. Incubator temperature was maintained with running water from thesea surface. After incubation, the water samples were filtered through glass fibre filters(Whatman GF/F, 25 mm in diameter; Maidstone, UK) that had been pre-combusted at
16365
BGD12, 16359–16396, 2015
Water masscharacteristics in the
southern ChukchiSea biological
hotspot
S. Nishino et al.
Title Page
Abstract Introduction
Conclusions References
Tables Figures
J I
J I
Back Close
Full Screen / Esc
Printer-friendly Version
Interactive Discussion
Discussion
Paper
|D
iscussionP
aper|
Discussion
Paper
|D
iscussionP
aper|
450 ◦C for 4 h. The 13C measurements were performed onboard using a stable-isotopeanalyser (ANCA-SL; SerCon Ltd., Gateway, Crewe, UK). The 2012 and 2013 primaryproductivity precision values (CVs) were 6.5 and 7.2 %, respectively.
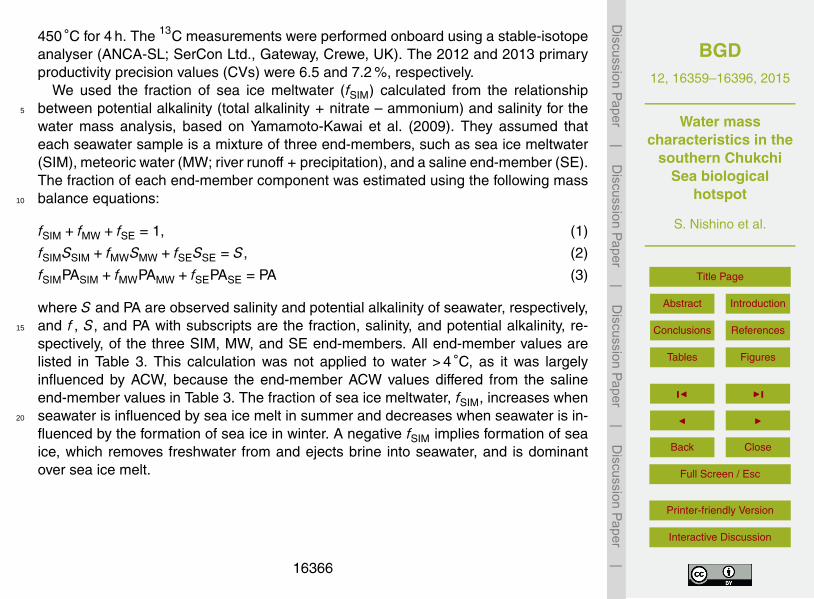
We used the fraction of sea ice meltwater (fSIM) calculated from the relationshipbetween potential alkalinity (total alkalinity + nitrate – ammonium) and salinity for the5
water mass analysis, based on Yamamoto-Kawai et al. (2009). They assumed thateach seawater sample is a mixture of three end-members, such as sea ice meltwater(SIM), meteoric water (MW; river runoff + precipitation), and a saline end-member (SE).The fraction of each end-member component was estimated using the following massbalance equations:10
fSIM + fMW + fSE = 1, (1)
fSIMSSIM + fMWSMW + fSESSE = S, (2)
fSIMPASIM + fMWPAMW + fSEPASE = PA (3)
where S and PA are observed salinity and potential alkalinity of seawater, respectively,and f , S, and PA with subscripts are the fraction, salinity, and potential alkalinity, re-15
spectively, of the three SIM, MW, and SE end-members. All end-member values arelisted in Table 3. This calculation was not applied to water > 4 ◦C, as it was largelyinfluenced by ACW, because the end-member ACW values differed from the salineend-member values in Table 3. The fraction of sea ice meltwater, fSIM, increases whenseawater is influenced by sea ice melt in summer and decreases when seawater is in-20
fluenced by the formation of sea ice in winter. A negative fSIM implies formation of seaice, which removes freshwater from and ejects brine into seawater, and is dominantover sea ice melt.
16366
BGD12, 16359–16396, 2015
Water masscharacteristics in the
southern ChukchiSea biological
hotspot
S. Nishino et al.
Title Page
Abstract Introduction
Conclusions References
Tables Figures
J I
J I
Back Close
Full Screen / Esc
Printer-friendly Version
Interactive Discussion
Discussion
Paper
|D
iscussionP
aper|
Discussion
Paper
|D
iscussionP
aper|
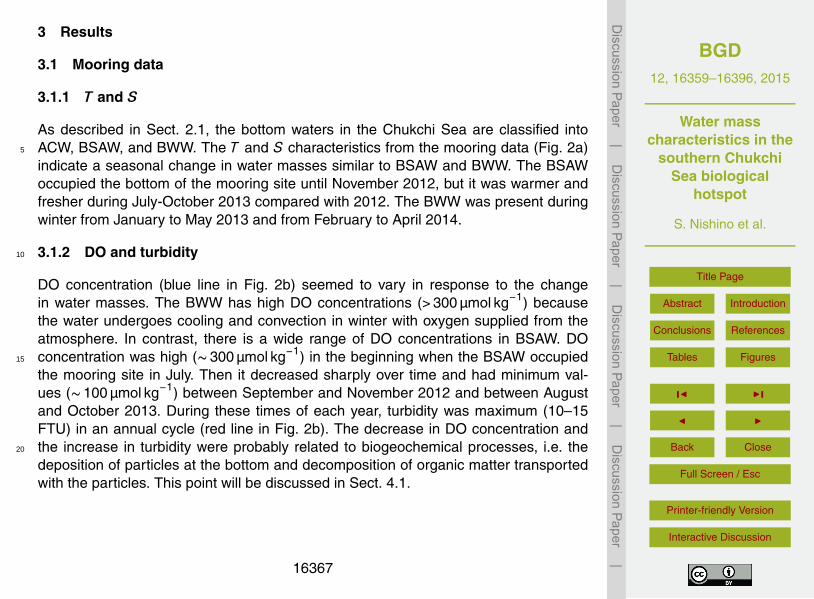
3 Results
3.1 Mooring data
3.1.1 T and S
As described in Sect. 2.1, the bottom waters in the Chukchi Sea are classified intoACW, BSAW, and BWW. The T and S characteristics from the mooring data (Fig. 2a)5
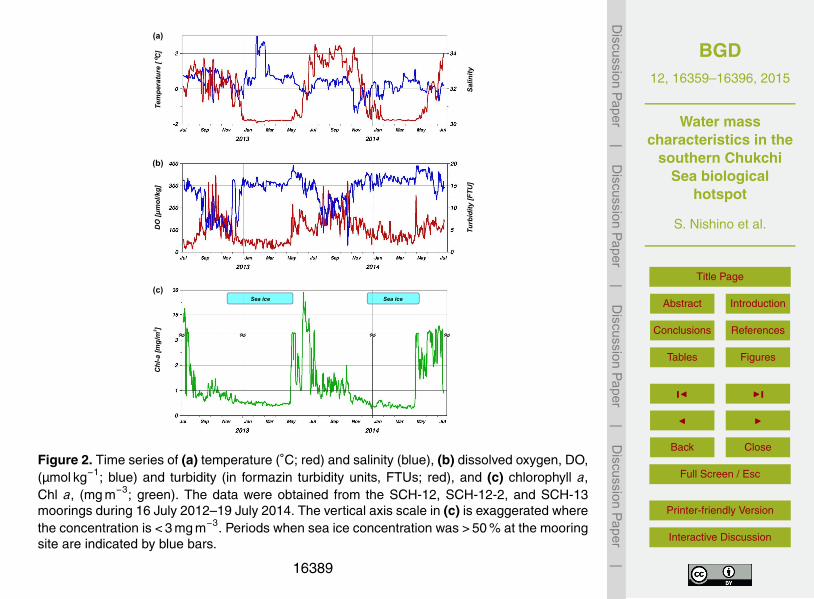
indicate a seasonal change in water masses similar to BSAW and BWW. The BSAWoccupied the bottom of the mooring site until November 2012, but it was warmer andfresher during July-October 2013 compared with 2012. The BWW was present duringwinter from January to May 2013 and from February to April 2014.
3.1.2 DO and turbidity10
DO concentration (blue line in Fig. 2b) seemed to vary in response to the changein water masses. The BWW has high DO concentrations (> 300 µmol kg−1) becausethe water undergoes cooling and convection in winter with oxygen supplied from theatmosphere. In contrast, there is a wide range of DO concentrations in BSAW. DOconcentration was high (∼300 µmol kg−1) in the beginning when the BSAW occupied15
the mooring site in July. Then it decreased sharply over time and had minimum val-ues (∼100 µmol kg−1) between September and November 2012 and between Augustand October 2013. During these times of each year, turbidity was maximum (10–15FTU) in an annual cycle (red line in Fig. 2b). The decrease in DO concentration andthe increase in turbidity were probably related to biogeochemical processes, i.e. the20
deposition of particles at the bottom and decomposition of organic matter transportedwith the particles. This point will be discussed in Sect. 4.1.
16367
BGD12, 16359–16396, 2015
Water masscharacteristics in the
southern ChukchiSea biological
hotspot
S. Nishino et al.
Title Page
Abstract Introduction
Conclusions References
Tables Figures
J I
J I
Back Close
Full Screen / Esc
Printer-friendly Version
Interactive Discussion
Discussion
Paper
|D
iscussionP
aper|
Discussion
Paper
|D
iscussionP
aper|
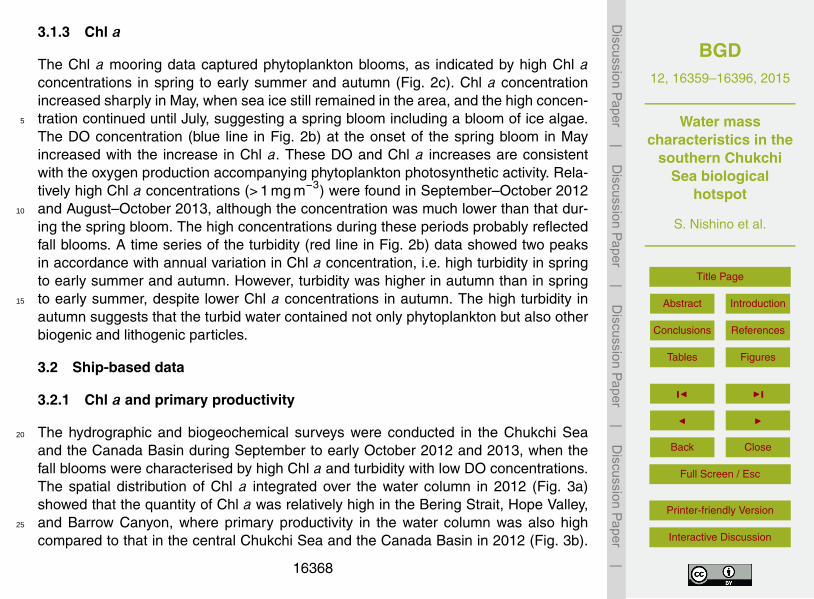
3.1.3 Chl a
The Chl a mooring data captured phytoplankton blooms, as indicated by high Chl aconcentrations in spring to early summer and autumn (Fig. 2c). Chl a concentrationincreased sharply in May, when sea ice still remained in the area, and the high concen-tration continued until July, suggesting a spring bloom including a bloom of ice algae.5
The DO concentration (blue line in Fig. 2b) at the onset of the spring bloom in Mayincreased with the increase in Chl a. These DO and Chl a increases are consistentwith the oxygen production accompanying phytoplankton photosynthetic activity. Rela-tively high Chl a concentrations (> 1 mg m−3) were found in September–October 2012and August–October 2013, although the concentration was much lower than that dur-10
ing the spring bloom. The high concentrations during these periods probably reflectedfall blooms. A time series of the turbidity (red line in Fig. 2b) data showed two peaksin accordance with annual variation in Chl a concentration, i.e. high turbidity in springto early summer and autumn. However, turbidity was higher in autumn than in springto early summer, despite lower Chl a concentrations in autumn. The high turbidity in15
autumn suggests that the turbid water contained not only phytoplankton but also otherbiogenic and lithogenic particles.
3.2 Ship-based data
3.2.1 Chl a and primary productivity
The hydrographic and biogeochemical surveys were conducted in the Chukchi Sea20
and the Canada Basin during September to early October 2012 and 2013, when thefall blooms were characterised by high Chl a and turbidity with low DO concentrations.The spatial distribution of Chl a integrated over the water column in 2012 (Fig. 3a)showed that the quantity of Chl a was relatively high in the Bering Strait, Hope Valley,and Barrow Canyon, where primary productivity in the water column was also high25
compared to that in the central Chukchi Sea and the Canada Basin in 2012 (Fig. 3b).
16368
BGD12, 16359–16396, 2015
Water masscharacteristics in the
southern ChukchiSea biological
hotspot
S. Nishino et al.
Title Page
Abstract Introduction
Conclusions References
Tables Figures
J I
J I
Back Close
Full Screen / Esc
Printer-friendly Version
Interactive Discussion
Discussion
Paper
|D
iscussionP
aper|
Discussion
Paper
|D
iscussionP
aper|
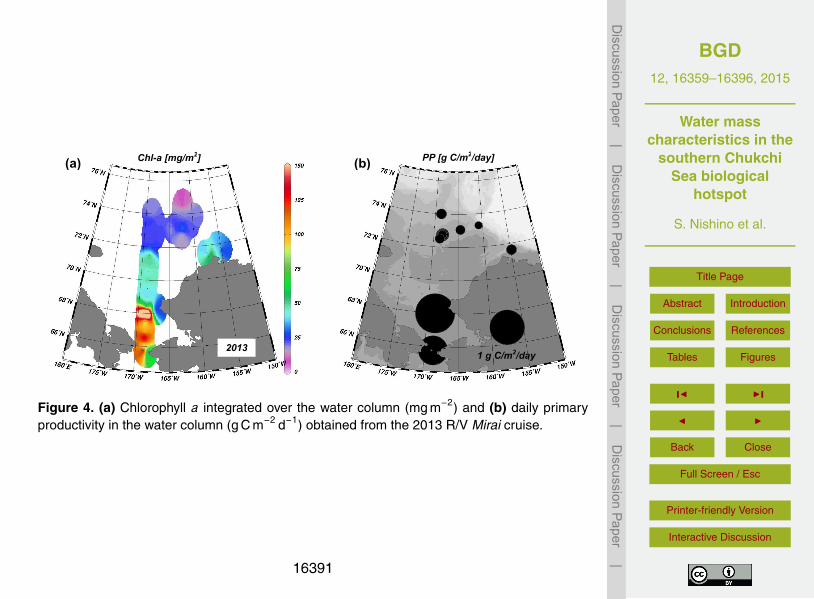
The quantity of Chl a in the water column in 2013 was higher everywhere comparedto 2012, and the highest quantity was detected in Hope Valley (Fig. 4a). Similarly,primary productivity integrated over the water column was higher in 2013 throughoutthe entire study area (Fig. 4b), and the value was highest in Hope Valley, approximatelyfive times higher than that in 2012. Despite being downstream from nutrient-rich water5
from the Bering Sea, the algal biomass and primary productivity in Hope Valley werecomparable to or higher than those in the Bering Strait during both years. The increasesin algal biomass and primary productivity from 2012 to 2013 would have been relatedto a change in water stratification, which is described in detail in Sect. 3.2.3.
3.2.2 Hotspot sections in 201210
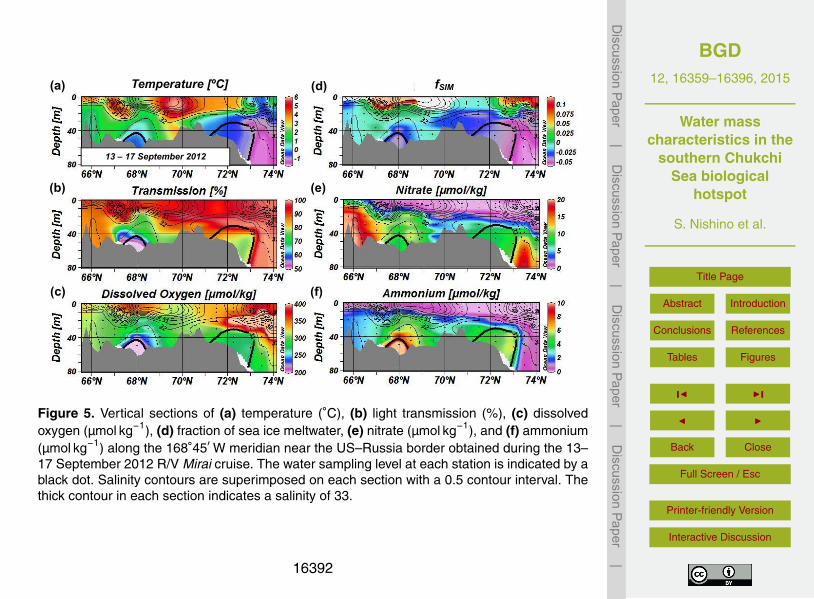
A hydrographic section was obtained from the Bering Strait to the shelf slope of theChukchi Sea along 168◦45′W across the biological hotspot of the southern ChukchiSea at ∼68◦N on 13–17 September 2012 (Fig. 5). We found a dome-like structure ofbottom water characterised by an uplifted isohaline (isopycnal) surface at ∼68◦N withlower T and higher S (Fig. 5a), lower light transmission (Fig. 5b), and lower DO (Fig. 5c)15
than those of the surroundings.We calculated fSIM to examine the influence of BWW on the bottom water (T =∼−0.4 ◦C, S =∼33.2) in the dome-like structure that was identified as BSAW. fSIM had itsminimum value north of 72◦N at depths > 30 m above the Chukchi shelf slope (Fig. 5d).The negative fSIM value means that the water was associated with brine rejection. The20
water there was characterised by near-freezing temperature and an S of ∼33, andtherefore, was identified as the BWW. The bottom water fSIM at ∼68◦N was −0.05,smaller than that of the surrounding water (fSIM ∼0), suggesting that the BSAW in thedome-like structure was largely influenced by the BWW.
The nitrate concentration in this water (∼7 µmol kg−1) was lower than that of the25
Bering Strait (∼20 µmol kg−1; Fig. 5e). In contrast, the ammonium concentration wasthe highest in this bottom water (∼12 µmol kg−1; Fig. 5f). The ammonium concentration(∼12 µmol kg−1) reached 60 % of the total inorganic nitrogen (TIN=nitrate + nitrite +
16369
BGD12, 16359–16396, 2015
Water masscharacteristics in the
southern ChukchiSea biological
hotspot
S. Nishino et al.
Title Page
Abstract Introduction
Conclusions References
Tables Figures
J I
J I
Back Close
Full Screen / Esc
Printer-friendly Version
Interactive Discussion
Discussion
Paper
|D
iscussionP
aper|
Discussion
Paper
|D
iscussionP
aper|
ammonium) concentration (∼20 µmol kg−1) in this bottom water, and it was comparableto that in the Bering Strait. Other nutrients in this bottom water, i.e. phosphate andsilicate, were also comparable to those in the Bering Strait.
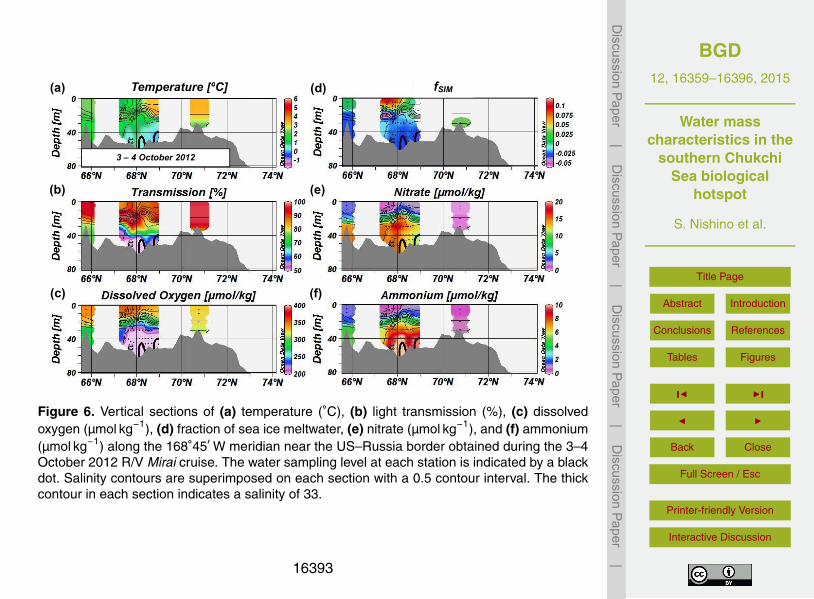
We revisited the biological hotspot in the southern Chukchi Sea and conducted hy-drographic and biogeochemical surveys on 3–4 October 2012 (Fig. 6). Similar to the5
previous survey in mid September, a dome-like structure of bottom water was foundat ∼68◦N with lower T and higher S (Fig. 6a), lower light transmission (Fig. 6b), andlower DO (Fig. 6c) than those of the surrounding water. However, bottom water T washigher (−0.4 ◦C vs. ∼0 ◦C), light transmission was lower (30 % vs. 12 %), and DO waslower (130 vs. 110 µmol kg−1) than the values from the previous survey. Although the10
negative fSIM value (∼−0.03) suggests the influence of the BWW (Fig. 6d), its contri-bution decreased because both T and fSIM increased slightly from mid September toearly October. In general, light transmission and DO are higher in the BWW than in theBSAW because of the absence of particle inputs (less turbidity) and convection due tooxygen input during winter (Fig. 2b). Therefore, the decreases in light transmission and15
DO from mid September to early October were consistent with the decrease in the con-tribution of BWW to this bottom water. These changes in water properties were foundin the mooring data when fluctuations of several days to a few weeks were detected,but the magnitudes of the fluctuations were smaller than the seasonal and significantyearly variation (Fig. 2). Therefore, the ship-based data represented the observed sea-20
son and year.The nitrate concentration in this water increased from 7 µmol kg−1 in mid September
to 16 µmol kg−1 in early October (Fig. 6e). This may have been related to the changes inwater composition described above and/or oxidation of ammonium (nitrification). Theammonium concentration remained high (∼12 µmol kg−1) in early October (Fig. 6f).25
The high ammonium level at this time suggests that ammonium production occurred atthe bottom of the dome-like structure from mid-September to early October. This am-monium production contributed to an increase in the TIN concentration (28 µmol kg−1)of the bottom water in early October 2012 in the biological hotspot of the southern
16370
BGD12, 16359–16396, 2015
Water masscharacteristics in the
southern ChukchiSea biological
hotspot
S. Nishino et al.
Title Page
Abstract Introduction
Conclusions References
Tables Figures
J I
J I
Back Close
Full Screen / Esc
Printer-friendly Version
Interactive Discussion
Discussion
Paper
|D
iscussionP
aper|
Discussion
Paper
|D
iscussionP
aper|
Chukchi Sea, which became larger than the values in the previous survey, and in theBering Strait, located upstream of the nutrient-rich BSAW.
3.2.3 Hotspot sections in 2013
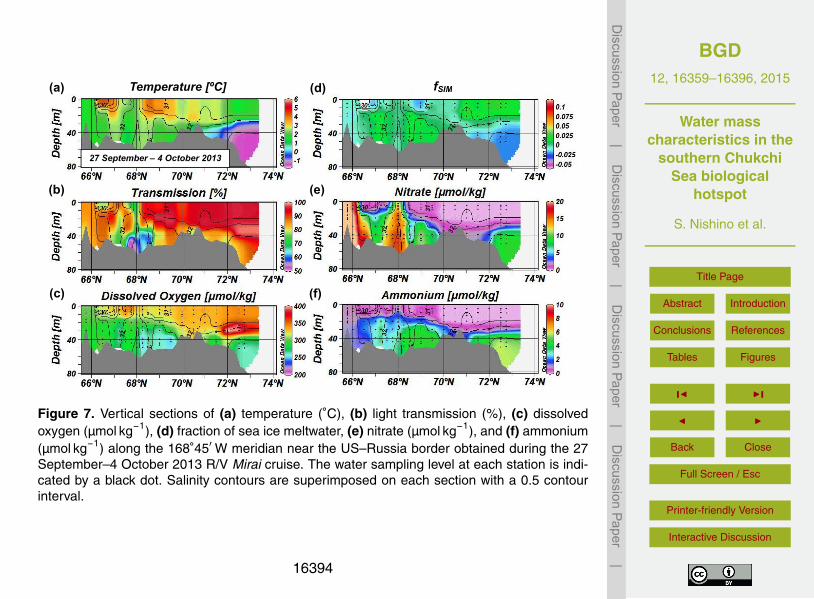
We conducted hydrographic and biogeochemical surveys from the Bering Strait to theshelf slope of the Chukchi Sea along 168◦45′W from 27 September to 4 October 20135
(Fig. 7). Although we again found a dome-like structure with higher S than the sur-roundings, T was similar to the surroundings (Fig. 7a) and higher than that in 2012(Figs. 5a and 6a). Light transmission was extremely low (Fig. 7b), whereas DO wasalmost the same as the surroundings (Fig. 7c) and higher than that in 2012 (Figs. 5cand 6c). The fSIM was nearly zero, suggesting no contribution by the BWW (Fig. 7d).10
That is, the BSAW had likely spread from the Bering Strait to the southern Chukchi Seaaround 68◦N without mixing with the BWW. This finding is consistent with the higher T(Fig. 7a) in that water than in 2012 (Figs. 5a and 6a). The nitrate distribution showed achimney of higher nitrate concentration at ∼68◦N than the surroundings (Fig. 7e), andwas higher than that in 2012 (Figs. 5e and 6e). In contrast, the ammonium concen-15
tration was ∼3 µmol kg−1 (Fig. 7f) and was markedly lower than that in 2012 (Figs. 5fand 6f).
Surface stratification in the southern Chukchi Sea was weaker in 2013 than in 2012due to the decrease in the surface layer fSIM (compare Figs. 5d, 6d, and 7d). As aresult, vertical mixing that occurred in 2013 easily lifted up the bottom water to the20
surface, which was observed as low light transmission in surface water at ∼68◦N,which seemed to be derived from the bottom (Fig. 7b). Vertical mixing could also haveincreased the DO of the bottom water there, as detected in the mooring data from theend of August 2013 (Fig. 2b) and from the ship-based data showing higher bottomwater DO in 2013 than that in 2012 (compare Figs. 5c, 6c, and 7c). Thus, the weak25
stratification in the southern Chukchi Sea enhanced vertical mixing to supply nutrientsto the surface layer, as observed in the nitrate profile (Fig. 7e), resulting in the higheralgal biomass and primary productivity in 2013 than in 2012 (compare Figs. 3 and 4).
16371
BGD12, 16359–16396, 2015
Water masscharacteristics in the
southern ChukchiSea biological
hotspot
S. Nishino et al.
Title Page
Abstract Introduction
Conclusions References
Tables Figures
J I
J I
Back Close
Full Screen / Esc
Printer-friendly Version
Interactive Discussion
Discussion
Paper
|D
iscussionP
aper|
Discussion
Paper
|D
iscussionP
aper|
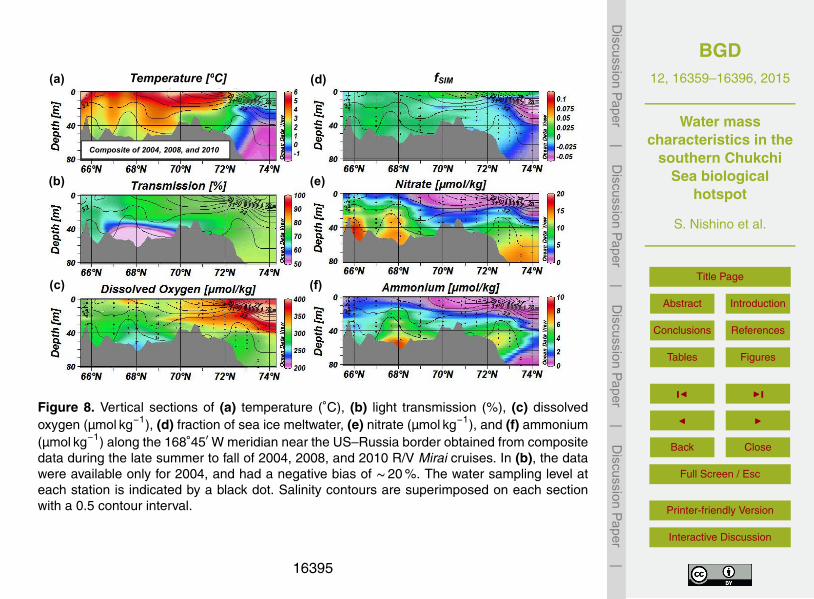
3.2.4 Hotspot sections in the previous surveys
Hydrographic and biogeochemical surveys were also conducted in the Chukchi Seaalong 168◦45′W in late summer to fall 2004, 2008, and 2010 (Table 2). The verticalsections of the water properties were all similar to those in 2013 as described below;hence, we show the mean features of the vertical sections during these years (Fig. 8).5
The dome-like structure of the Hope Valley (∼68◦N) bottom water was characterisedby an uplifted isohaline (isopycnal) surface with lower T and higher S (Fig. 8a), lowerlight transmission (Fig. 8b), and lower DO (Fig. 8c) than those of the surroundings.Although the T , S, and DO characteristics were not as significant as those in 2012,the dome-like structure was a robust feature of the biological hotspot in the southern10
Chukchi Sea.As in 2013, the bottom water fSIM value was nearly zero (Fig. 8d), suggesting that
the small contribution of the BWW did not change the characteristics of the BSAWsignificantly on its way from the Bering Strait to Hope Valley. As a result, the T ofthe bottom water in Hope Valley did not decrease significantly from that in the Bering15
Strait (Fig. 8a). Similarly, nitrate concentration at the bottom of Hope Valley was slightlylower from that in the Bering Strait but remained higher than that of the surroundings(Fig. 8e). In comparison, the ammonium concentration at Hope Valley was the highest(Fig. 8f), suggesting a large amount of ammonium production there.
4 Discussion20
4.1 Fall bloom and biogeochemical processes
The mooring data obtained with sensors installed near the bottom in the biologicalhotspot of the southern Chukchi Sea revealed two novel results regarding the annualcycle of water characteristics related to biogeochemical processes. A large decrease inbottom water DO occurred just before the fall bloom but not at the spring bloom (Fig. 2b25
16372
BGD12, 16359–16396, 2015
Water masscharacteristics in the
southern ChukchiSea biological
hotspot
S. Nishino et al.
Title Page
Abstract Introduction
Conclusions References
Tables Figures
J I
J I
Back Close
Full Screen / Esc
Printer-friendly Version
Interactive Discussion
Discussion
Paper
|D
iscussionP
aper|
Discussion
Paper
|D
iscussionP
aper|
and c). The decrease in DO was accompanied by an increase in bottom water turbidity,and DO (turbidity) had minimum (maximum) values during the fall bloom. Yamada etal. (2015) observed that the concentrations of particles and particulate organic mat-ter (POM) are extremely high at the bottom of Hope Valley in autumn, suggesting thatparticles including POM accumulate at the bottom there in autumn with an increase in5
turbidity and decrease in oxygen used to decompose accumulated POM. One conceiv-able source of such particles is an upstream region of northward currents that trans-port the BSAW through the Bering Strait (e.g. Grebmeier, 2012; Mathis et al., 2014;Grebmeier et al., 2015). This is consistent with the finding that the surface sedimentalong the BSAW pathway has a high amount of total organic carbon, including a large10
quantity of marine organic matter (phytoplankton and marine algal detritus) available tobenthic populations (Grebmeier et al., 1988, 2006). The ACW could also carry YukonRiver sediments (McManus et al., 1969). However, such terrestrial inputs would be dif-ficult for use in biological processes (Grebmeier et al., 1988, 2006). Moran et al. (2005)suggested that part of the production is exported laterally and off the Chukchi Sea15
shelf during the most productive season. Therefore, in addition to export production,lateral transport of organic particles is important for oxygen consumption by sedimentcommunities, particularly during the fall bloom season.
The DO concentration at the bottom of the mooring site in the southern Chukchi Seadid not decrease significantly during the spring bloom or soon after the bloom. However,20
oxygen was largely consumed (in June) on the bottom south of St. Lawrence Island inthe Bering Sea just after Chl a concentrations peaked in the water column (May–June)with a time lag of days to weeks for organic material to become part of the surface sed-iment (Cooper et al., 2002). In general, significant correlations are observed betweenspatial patterns of the standing stock of Chl a in the water column and the oxygen25
consumption of the underlying sediment community in the Bering and Chukchi Seashelves (Grebmeier et al., 2006; Grebmeier, 2012). However, lateral transport of or-ganic particles along northward currents of the BSAW in the southern Chukchi Seamay be important for oxygen consumption by the sediment community. The minimum
16373
BGD12, 16359–16396, 2015
Water masscharacteristics in the
southern ChukchiSea biological
hotspot
S. Nishino et al.
Title Page
Abstract Introduction
Conclusions References
Tables Figures
J I
J I
Back Close
Full Screen / Esc
Printer-friendly Version
Interactive Discussion
Discussion
Paper
|D
iscussionP
aper|
Discussion
Paper
|D
iscussionP
aper|
levels of oxygen at the bottom during the fall bloom in an annual cycle would not bedue to a local spring phytoplankton bloom but rather would result from POM decom-position including allochthonous organic particles that accumulate in the Hope Valleytopographic depression.
The mooring data in this study further suggest that the onset of particle accumulation5
and POM decomposition at the bottom of Hope Valley occurred from the end of Julyto the beginning of August in 2012 and 2013, when turbidity increased and the DOconcentration decreased with time (Fig. 2b). However, Chl a concentrations decreasedduring this period (Fig. 2c). The increase in Chl a toward the fall bloom started in mid-September in 2012 and in mid-August in 2013. Therefore, particle accumulation and10
the decomposition of POM (nutrient regeneration) may have been necessary beforethe onset of the fall bloom. The bloom continued for 1 month (mid-September to mid-October) in 2012 and for 2 months (mid-August to mid-October) in 2013. The fall bloomhas been assumed to result from fall events, such as storms, surface cooling, andformation of sea ice (Ardyna et al., 2013, 2014). However, our data suggest that the15
fall bloom is triggered by the accumulation of particles and POM decomposition thatbegin in summer (end of July to beginning of August), at least in the Hope Valley of thesouthern Chukchi Sea, and that the bloom is not an event-like phenomenon, but has atime scale of months with fluctuations that may be related to the fall events.
4.2 Dome-like structure in the southern Chukchi Sea20
We found a dome-like structure of dense and turbid bottom water in the biologicalhotspot of the southern Chukchi Sea based on hydrographic surveys during fall blooms(Figs. 5–8). The dome-like structure was associated with the Hope Valley topographicdepression where dense water may converge and particles likely accumulate. The bot-tom water characteristics depended on the influences of the BSAW and BWW. The25
water in 2012, which likely originated from the BSAW, was modified by mixing with theBWW (Figs. 5d and 6d). However, the BSAW occupied the bottom of Hope Valley with-out any contribution by the BWW in 2013 (Fig. 7d). The large influence of the BWW
16374
BGD12, 16359–16396, 2015
Water masscharacteristics in the
southern ChukchiSea biological
hotspot
S. Nishino et al.
Title Page
Abstract Introduction
Conclusions References
Tables Figures
J I
J I
Back Close
Full Screen / Esc
Printer-friendly Version
Interactive Discussion
Discussion
Paper
|D
iscussionP
aper|
Discussion
Paper
|D
iscussionP
aper|
in 2012 produced a prominent core of lower temperature and higher salinity (density)there compared to the surrounding area (Figs. 5a and 6a). However, the lack of acontribution by the BWW in 2013 resulted in a temperature and salinity similar to thesurroundings (Fig. 7a).
Nutrient concentrations there were also controlled by the influences of the BSAW and5
BWW. In general, nutrient concentrations in the BSAW increase toward the south, inregions upstream of the flow (e.g. Springer and McRoy, 1993; Grebmeier et al., 2015),and nitrate concentration is > 20 µmol kg−1 in the Gulf of Anadyr, where nutrient-richPacific waters are first advected up onto the Bering Sea shelf, which corresponds tothat in the nutrient maximum layer of the upper halocline of the Arctic (e.g. Jones and10
Anderson, 1986; Cooper et al., 1997). Similarly, the nitrate concentration in the BWWduring winter was ∼20 µmol kg−1 because nutrients in the Bering and Chukchi shelvesundergo little biological uptake during winter (Hansell et al., 1993; Cooper et al., 1997).However, if the BWW remains on the Chukchi shelf until the next summer/fall, nutrientsare supplied to the upper layer via vertical mixing and are used for biological production15
(Lowry et al., 2015; Nishino et al., 2015). As a result, this remnant BWW on the Chukchishelf may have low nutrient concentrations, as observed at 72–73◦N near the shelfslope. The nitrate concentration there was ≤10 µmol kg−1 in the fall of both 2012 and2013 (Figs. 5e and 7e). Therefore, the contribution to Hope Valley bottom water dueto the remnant BWW, such as in 2012, could reduce nutrient concentrations there. In20
fact, the nitrate concentration there, which was a mixture of the BSAW and BWW in2012 (Fig. 5e; ∼7 µmol kg−1), was lower than that of the bottom water identified as theBSAW without influence from the BWW in 2013 (Fig. 7e; ∼16 µmol kg−1).
Another important process controlling nutrient concentrations was ammonium pro-duction. Except for 2013, ammonium had maximum concentrations at the bottom of25
Hope Valley in the southern Chukchi Sea (Fig. 8f). In addition, the lowest light trans-mission and oxygen concentration were found there (Fig. 8b and c, respectively); i.e.a large amount of POM accumulated at the bottom of Hope Valley and its decom-position decreased oxygen and increased ammonium concentrations as a result of
16375
BGD12, 16359–16396, 2015
Water masscharacteristics in the
southern ChukchiSea biological
hotspot
S. Nishino et al.
Title Page
Abstract Introduction
Conclusions References
Tables Figures
J I
J I
Back Close
Full Screen / Esc
Printer-friendly Version
Interactive Discussion
Discussion
Paper
|D
iscussionP
aper|
Discussion
Paper
|D
iscussionP
aper|
nutrient regeneration. The decomposing POM consumed oxygen and produced am-monium, generating a linear relationship between DO and ammonium concentrationsin the southern Chukchi Sea (Fig. 9). The TIN at the bottom of Hope Valley in the fallof 2012 was comparable to that in the Bering Strait, which is located upstream of thenutrient-rich BSAW flow. This high concentration (∼20 µmol kg−1) was attributed to the5
high concentration of ammonium (∼12 µmol kg−1), suggesting significant nutrient re-generation at the bottom, which explained 60 % of the nutrient content. The TIN therein fall 2013 was ∼20 µmol kg−1 but ammonium was only ∼3 µmol kg−1, which does notsupport the scenario that nutrient regeneration at that time was lower than in fall 2012.The weak stratification in fall 2013 may have diluted the ammonium levels via mixing10
with ammonium-free water in the upper layer, whereas bottom water nitrate was notdiluted as much because nitrate in the upper layer was likely not depleted due to theinfluence of the BSAW. Therefore, it was difficult to estimate the contribution of nu-trient regeneration to the nutrient content in the Hope Valley bottom water for 2013.However, nutrient regeneration may have occurred significantly even in the fall 201315
because turbid water was still present, suggesting the accumulation of POM.POM was largely carried by the BSAW during the fall of 2012 and 2013 and accu-
mulated in the Hope Valley topographic depression. The nutrient regeneration causedby decay of POM at this site would help increase bottom water nutrient concentrations.Furthermore, the dome-like structure lifts up the isopycnal surface, and nutrients would20
be supplied to the surface (euphotic zone) easier than to the surroundings. Verticalnutrient supply would be enhanced when stratification was weak, such as in 2013.For example, nitrogenous compounds are usually depleted at the sea surface wherea relatively high level of ammonium (∼1 µmol kg−1) was found in fall 2013, suggestingnutrient regeneration at the bottom and vertical transport of the ammonium produced25
via vertical mixing (Fig. 7f). Indeed, the nutrient supply from the BSAW is important forthe phytoplankton bloom during spring and early summer, as discussed by Springerand McRoy (1993). However, the combination of nutrient regeneration at the bottomand the uplifted isopycnal surface accompanied by the dome-like structure played an
16376
BGD12, 16359–16396, 2015
Water masscharacteristics in the
southern ChukchiSea biological
hotspot
S. Nishino et al.
Title Page
Abstract Introduction
Conclusions References
Tables Figures
J I
J I
Back Close
Full Screen / Esc
Printer-friendly Version
Interactive Discussion
Discussion
Paper
|D
iscussionP
aper|
Discussion
Paper
|D
iscussionP
aper|
important role maintaining the high productivity of the biological hotspot in the southernChukchi Sea at least during late summer and fall.
4.3 Stratification and primary productivity
Although Hope Valley maintained high primary productivity during late summer and fall,the magnitude was controlled by stratification of the water column. Primary productivity5
there was 0.3 g C m−2 d−1 in September 2012 and 1.6 g C m−2 d−1 in September 2013(Figs. 3 and 4). The 2013 productivity was consistent with that estimated from in situmeasurements during the same season from 2002 to 2004 (1.4 g C m−2 d−1; Lee et al.,2007) and in 2007 (1.6 g C m−2 d−1; Lee et al., 2013). The lower productivity in 2012than in 2013 and in recent years was related to the strong stratification in 2012 caused10
by the high fraction of sea ice meltwater at the surface (Fig. 5d). Sea ice remained untilSeptember 2012 around Wrangel Island between the Chukchi and East Siberian Seasand may have resulted in the high fraction of sea ice meltwater at the surface of theChukchi Sea, including the Hope Valley area.
Primary productivity in the Chukchi Sea in recent years seemed to decrease from15
that reported in the 1980s (Lee et al., 2007, 2013). Lee et al. (2007) hypothesised thatthe difference in primary productivity was associated with changes in water masses,the transport of nutrients with phytoplankton and sediments, primary productivity inthe Bering Sea, and the large seasonal, annual, and geographical variation in pri-mary productivity in the Chukchi Sea. Our results further suggest a large influence20
of sea ice meltwater in September 2012 on the reduction of primary productivity inthe Chukchi Sea. Furthermore, data obtained in September 2009 indicated that highamounts of freshwater accumulated in the Chukchi Sea from Siberian coastal currentsand negatively affected primary productivity (Yun et al., 2014). Such freshwater dis-tributions, which control water column stratification, and thus primary productivity, are25
likely changed by wind- and buoyancy-forced currents on synoptic and seasonal timescales (Weingartner et al., 1999). Hence, synoptic and seasonal events could largelyimpact the fall bloom, and the frequency and magnitude of the bloom may not neces-
16377
BGD12, 16359–16396, 2015
Water masscharacteristics in the
southern ChukchiSea biological
hotspot
S. Nishino et al.
Title Page
Abstract Introduction
Conclusions References
Tables Figures
J I
J I
Back Close
Full Screen / Esc
Printer-friendly Version
Interactive Discussion
Discussion
Paper
|D
iscussionP
aper|
Discussion
Paper
|D
iscussionP
aper|
sarily increase with a delay in fall freeze-up (longer ice-free season), as expected fromsatellite data (e.g. Arrigo et al., 2008; Pabi et al., 2008; Ardyna et al., 2014).
5 Summary
We analysed mooring and ship-based data obtained from a biological hotspot in thesouthern Chukchi Sea to understand water mass characteristics and their temporal5
changes, and how they influence phytoplankton biomass and productivity there. Themooring data indicated a seasonal change in water masses, i.e. the BSAW in sum-mer/fall and BWW in winter/spring. The ship-based hydrographic and biogeochemicaldata suggested that the BSAW was largely modified by the BWW in fall 2012 but notduring a typical fall (2004, 2008, 2010, and 2013). As a result, a prominent core of bot-10
tom water, which was characterised by lower temperature and higher salinity (density)than the surrounding water, was detected in 2012. The large influence of the BWW in2012 would have reduced nutrient concentrations because nutrients in the BWW thathad remained in the Chukchi Sea until summer/fall were probably used for the springand fall blooms. In contrast, nutrient regeneration at the bottom increased nutrient con-15
centrations and explained 60 % of the nutrient levels there in 2012. This high nutrientcontent, which was supplied by the BSAW and nutrient regeneration in the dome-likestructure of the Hope Valley bottom water, maintained high primary productivity duringthe fall bloom. However, primary productivity was largely controlled by water columnstratification characterised by the distribution of freshwater from sea ice meltwater and20
river water. Thus, there was large temporal and spatial variation in primary productiv-ity and phytoplankton biomass. Therefore, long-term monitoring using moorings andchemical and biological sensors is necessary.
Although the mooring in this study was deployed only at the biological hotspot site inthe southern Chukchi Sea, the data show a temporal change in phytoplankton biomass25
and related parameters for the first time. We observed spring and fall blooms associ-ated with high Chl a concentrations. Before the fall bloom, turbidity increased and DO
16378
BGD12, 16359–16396, 2015
Water masscharacteristics in the
southern ChukchiSea biological
hotspot
S. Nishino et al.
Title Page
Abstract Introduction
Conclusions References
Tables Figures
J I
J I
Back Close
Full Screen / Esc
Printer-friendly Version
Interactive Discussion
Discussion
Paper
|D
iscussionP
aper|
Discussion
Paper
|D
iscussionP
aper|
decreased, suggesting accumulation and decomposition of POM (nutrient regenera-tion) on the bottom. This may have been a trigger for the fall bloom at this site. Themooring data further suggest that the fall bloom had a time scale of months with fluctu-ations that might have been related to fall events, such as storms, surface cooling, andthe formation of sea ice.5
Acknowledgements. We thank the captain, officers, and crew of the R/V Mirai, which was op-erated by Global Ocean Development, Inc. We also thank the staff of Marine Works Japan,Ltd., for their skilful work aboard the ship and for data processing. This study was supportedby the Green Network of Excellence Program (GRENE Program), which is funded by the ArcticClimate Change Research Project of the Ministry of Education, Culture, Sports, Science and10
Technology of Japan (MEXT). Maps and figures were drawn using Ocean Data View software(Schlitzer, 2015). The data used to prepare this study will be released from the JAMSTEC DataSite for Research Cruises (http://www.godac.jamstec.go.jp/cruisedata/mirai/e/index.html).
References
Aoyama, M. and Hydes, D. J.: How do we improve the comparability of nutrient measurements?,15
in: Comparability of Nutrients in the World’s Ocean, edited by: Aoyama, M., Dickson, A. G.,Hydes, D. J., Murata, A., Oh, J. R., Roose, P., and Woodward E. M. S., Mother Tank, Tsukuba,Japan, 1–10, 2010.
Ardyna, M., Babin, M., Gosselin, M., Devred, E., Bélanger, S., Matsuoka, A., and Tremblay,J.-É.: Parameterization of vertical chlorophyll a in the Arctic Ocean: impact of the subsur-20
face chlorophyll maximum on regional, seasonal, and annual primary production estimates,Biogeosciences, 10, 4383–4404, doi:10.5194/bg-10-4383-2013, 2013.
Ardyna, M., Babin, M., Gosselin, M., Devred, E., Rainville, L., and Tremblay, J.-É.: Recent ArcticOcean sea ice loss triggers novel fall phytoplankton blooms, Geophys. Res. Lett., 41, 6207–6212, doi:10.1002/2014GL061047, 2014.25
Arrigo, K. R., van Dijken, G., and Pabi, S.: Impact of a shrinking Arctic ice cover on marineprimary production, Geophys. Res. Lett., 35, L19603, doi:10.1029/2008GL035028, 2008.
16379
BGD12, 16359–16396, 2015
Water masscharacteristics in the
southern ChukchiSea biological
hotspot
S. Nishino et al.
Title Page
Abstract Introduction
Conclusions References
Tables Figures
J I
J I
Back Close
Full Screen / Esc
Printer-friendly Version
Interactive Discussion
Discussion
Paper
|D
iscussionP
aper|
Discussion
Paper
|D
iscussionP
aper|
Coachman, L. K.: Advection and mixing on the Bering-Chukchi Shelves, Component A, Advec-tion and mixing of coastal water on high latitude shelves, ISHTAR 1986 Progress Report,Vol. I, Inst. Mar. Sci., Univ. Alaska, Fairbanks, 1–42, 1987.
Coachman, L. K. and Barnes, C. A.: The contribution of Bering Sea water to the Arctic Ocean,Arctic, 14, 147–161, 1961.5
Coachman, L. K., Aagaard, K., and Tripp, R. B.: Bering Strait: The regional physical oceanog-raphy, Univ. of Washington Press, Seattle, 172 pp., 1975.
Comiso, J. C., Parkinson, C. L., Gersten, R., and Stock, L.: Accelerated decline in the Arcticsea ice cover, Geophys. Res. Lett., 35, L01703, doi:10.1029/2007GL031972, 2008.
Cooper, L. W., Whitledge, T. E., Grebmeier, J. M., and Weingartner, T.: The nutrient, salinity,10
and stable oxygen isotope composition of Bering and Chukchi Seas waters in and near theBering Strait, J. Geophys. Res., 102, 12563–12573, 1997.
Cooper, L. W., Grebmeier, J. M., Larsen, I. L., Egorov, V. G., Theodorakis, C., Kelly, H. P., andLovvorn, J. R.: Seasonal variation in water column processes and sedimentation of organicmaterials in the St. Lawrence Island polynya region, Bering Sea, Mar. Ecol.-Prog. Ser., 226,15
13–26, 2002.Dickson, A. G.: Determination of dissolved oxygen in sea water by Winkler titration, in: WOCE
Operations Manual, Volume 3, Section 3.1, Part 3.1.3 WHP Operations and Methods, WHPOffice Report WHPO 91-1, WOCE Report No. 68/91, Nov. 1994, Revision 1, Woods Hole,Mass., 13 pp., 1996.20
Feder, H., Jewett, S., and Blanchard, A.: Southeastern Chukchi Sea (Alaska) epibenthos, PolarBiol., 28, 402–421, 2005.
Grebmeier, J. M.: Shifting patterns of life in the Pacific Arctic and sub-Arctic seas, Annu. Rev.Mar. Sci., 4, 63–78, doi:10.1146/annurev-marine-120710-100926, 2012.
Grebmeier, J. M., McRoy, C. P., and Feder, H. M.: Pelagic-benthic coupling on the shelf of25
the northern Bering and Chukchi Seas. I. Food supply source and benthic biomass, Mar.Ecol.-Prog. Ser., 48, 57–67, 1988.
Grebmeier, J. M., Cooper, L. W., Feder, H. M., and Sirenko, B. I.: Ecosystem dynamics ofthe Pacific-influenced Northern Bering and Chukchi Seas in the Amerasian Arctic, Prog.Oceanogr., 71, 331–361, 2006.30
Grebmeier, J. M., Moore, S. E., Overland, J. E., Frey, K. E., and Gradinger, R.: Biological re-sponse to recent Pacific Arctic sea ice retreats, EOS, 91, 161–162, 2010.
16380
BGD12, 16359–16396, 2015
Water masscharacteristics in the
southern ChukchiSea biological
hotspot
S. Nishino et al.
Title Page
Abstract Introduction
Conclusions References
Tables Figures
J I
J I
Back Close
Full Screen / Esc
Printer-friendly Version
Interactive Discussion
Discussion
Paper
|D
iscussionP
aper|
Discussion
Paper
|D
iscussionP
aper|
Grebmeier, J. M., Bluhm, B. A., Cooper, L. W., Danielson, S. L., Arrigo, K. R., Blanchard, A. L.,Clarke, J. T., Day, R. H., Frey, K. E., Gradinger, R. R., Kedra, M., Konar, B., Kuletz, K. J., Lee,S. H., Lovvorn, J. R., Norcross, B. L., and Okkonen, S. R.: Ecosystem characteristics and pro-cesses facilitating persistent macrobenthic biomass hotspots and associated benthivory inthe Pacific Arctic, Prog. Oceanogr., 136, 92–114, doi:10.1016/j.pocean.2015.05.006, 2015.5
Hama, T., Miyazaki, T., Ogawa, Y., Iwakuma, T., Takahashi, M., Otsuki, A., and Ichimura, S.:Measurement of photosynthetic production of a marine phytoplankton population using astable 13C isotope, Mar. Biol., 73, 31–36, 1983.
Hansell, D. A., Whitledge, T. E., and Goering, J. J.: Patterns of nitrate utilization and new pro-duction over the Bering-Chukchi shelf, Cont. Shelf Res., 13, 601–627, 1993.10
Hunt Jr., G. L., Blanchard, A. L., Boveng, P., Dalpadado, P., Drinkwater, K. F., Eisner,L., Hopcroft, R. R., Kovacs, K. M., Norcross, B. L., Renaud, P., Reigstad, M., Renner,M., Skjoldal, H. R., Whitehouse, A., and Woodgate, R. A.: The Barents and ChukchiSeas: Comparison of two Arctic shelf ecosystems, J. Mar. Syst., 109–110, 43–68,doi:10.1016/j.jmarsys.2012.08.003, 2013.15
Hydes, D. J., Aoyama, M., Aminot, A., Bakker, K., Becker, S., Coverly, S., Daniel, A., Dickson,A. G., Grosso, O., Kerouel, R., van Ooijen, J., Sato, K., Tanhua, T., Woodward, E. M. S. andZhang, J. Z.: Determination of dissolved nutrients (N, P, Si) in seawater with high precisionand inter-comparability using gas-segmented continuous flow analysers, in: The GO-SHIPRepeat Hydrography Manual: A Collection of Expert Reports and Guidelines, IOCCP Report20
Number 14, ICPO Publication Series Number 134, edited by: Hood, E. M., Sabine, C. L., andSloyan, B. M., UNESCO-IOC, Paris, France, available at: www.go-ship.org/HydroMan.html(last access: 25 September 2015), 2010.
Jones, E. P. and Anderson, L. G.: On the origin of the chemical properties of the Arctic Oceanhalocline, J. Geophys. Res., 91, 10759–10767, 1986.25
Kawano, T.: Method for salinity (conductivity ratio) measurement, in: The GO-SHIP Repeat Hy-drography Manual: A Collection of Expert Reports and Guidelines, IOCCP Report Number14, ICPO Publication Series Number 134, edited by: Hood, E. M., Sabine, C. L., and Sloyan,B. M., UNESCO-IOC, Paris, France, available at: www.go-ship.org/HydroMan.html (last ac-cess: 25 September 2015), 2010.30
Kikuchi, T.: R/V Mirai Cruise Report MR12-E03, JAMSTEC, Yokosuka, Japan, available at:www.godac.jamstec.go.jp/cruisedata/mirai/e/index.html (last access: 25 September 2015),2012.
16381
BGD12, 16359–16396, 2015
Water masscharacteristics in the
southern ChukchiSea biological
hotspot
S. Nishino et al.
Title Page
Abstract Introduction
Conclusions References
Tables Figures
J I
J I
Back Close
Full Screen / Esc
Printer-friendly Version
Interactive Discussion
Discussion
Paper
|D
iscussionP
aper|
Discussion
Paper
|D
iscussionP
aper|
Kinney, P., Arhelger, M. E., and Burrell, D. C.: Chemical characteristics of water masses in theAmerican Basin of the Arctic Ocean, J. Geophys. Res., 75, 4097–4104, 1970.
Kwok, R., Cunningham, G. F., Wensnahan, M., Zwally, H. J., and Yi, D.: Thinning and vol-ume loss of the Arctic Ocean sea ice cover: 2003–2008, J. Geophys. Res., 114, C07005,doi:10.1029/2009JC005312, 2009.5
Lee, S. H., Whitledge, T. E., and Kang, S. H.: Recent carbon and nitrogen uptake rates ofphytoplankton in Bering Strait and the Chukchi Sea, Cont. Shelf Res., 27, 2231–2249,doi:10.1016/j.csr.2007.05.009, 2007.
Lee, S. H., Yun, M. S., Kim, B. K., Saitoh, S. I., Kang, C. K., Kang, S. H., and Whitledge, T. E.:Latitudinal carbon productivity in the Bering and Chukchi seas during the summer in 2007,10
Cont. Shelf Res., 59, 28–36, doi:10.1016/j.csr.2013.04.004, 2013.Lowry, K. E., Pickart, R. S., Mills, M. M., Brown, Z. W., vanDijken, G. L., Bates, N. R., and Arrigo,
K. R.: The influence of winter water on phytoplankton blooms in the Chukchi Sea, Deep-SeaRes. Pt. II, 62, doi:10.1016/j.dsr2.2015.06.006, 2015.
Mathis, J. T., Grebmeier, J. M., Hansell, D. A., Hopcroft, R. R., Kirchman, D. L., Lee, S. H.,15
Moran, S. B., Bates, N. R., VanLaningham, S., Cross, J. N., and Cai, W.-J.: Carbon Biogeo-chemistry of the Western Arctic: Primary Production, Carbon Export and the Controls onOcean Acidification, in: The Pacific Arctic region, Ecosystem Status and Trends in a RapidlyChanging Environment, edited by: Grebmeier, J. M. and Maslowski, W., Springer, Dordrecht,Netherlands, 223–268, doi:10.1007/978-94-017-8863-2, 2014.20
Matsuno, K., Yamaguchi, A., Nishino, S., Inoue, J., and Kikuchi, T.: Short-term changes inthe mesozooplankton community and copepod gut pigment in the Chukchi Sea in autumn:reflections of a strong wind event, Biogeosciences, 12, 4005–4015, doi:10.5194/bg-12-4005-2015, 2015.
McManus, D. A., Kelley, J. C., and Creager, J. S.: Continental Shelf Sedimentation in an Arctic25
Environment, Geol. Soc. Am. Bull., 80, 1961–1984, 1969.McRoy, C. P.: ISHTAR, the project: an overview of Inner Shelf Transfer And Recycling in the
Bering and Chukchi seas, Cont. Shelf Res., 13, 473–479, 1993.Moran, S. B., Kelly, R. P., Hagstrom, K., Smith, J. N., Grebmeier, J. M., Cooper, L. W., Cota,
G. F., Walsh, J. J., Bates, N. R., Hansell, D. A., Maslowski, W., Nelson, R. P., and Mulsow,30
S.: Seasonal changes in POC export flux in the Chukchi Sea and implications for watercolumn-benthic coupling in Arctic shelves, Deep-Sea Res. Pt. II, 52, 3324–3343, 2005.
16382
BGD12, 16359–16396, 2015
Water masscharacteristics in the
southern ChukchiSea biological
hotspot
S. Nishino et al.
Title Page
Abstract Introduction
Conclusions References
Tables Figures
J I
J I
Back Close
Full Screen / Esc
Printer-friendly Version
Interactive Discussion
Discussion
Paper
|D
iscussionP
aper|
Discussion
Paper
|D
iscussionP
aper|
Nishino, S.: R/V Mirai Cruise Report MR13-06. JAMSTEC, Yokosuka, Japan, available at: www.godac.jamstec.go.jp/darwin/datatree/e (last access: 25 September 2015), 2013.
Nishino, S., Kawaguchi, Y., Inoue, J., Hirawake, T., Fujiwara, A., Futsuki, R., Onodera, J., andAoyama, M.: Nutrient supply and biological response to wind-induced mixing, inertial motion,internal waves, and currents in the northern Chukchi Sea, J. Geophys. Res. Oceans, 120,5
1975–1992, doi:10.1002/2014JC010407, 2015.Pabi, S., van Dijken, G. L., and Arrigo, K. R.: Primary production in the Arctic Ocean, 1998–
2006, J. Geophys. Res., 113, C08005, doi:10.1029/2007JC004578, 2008.Sato, K., Aoyama, M., and Becker, S.: Reference materials for nutrients in seawater as cal-
ibration standard solution to keep comparability for several cruises in the world ocean in10
2000s, in: Comparability of Nutrients in the World’s Ocean, edited by: Aoyama, M., Dickson,A. G., Hydes, D. J., Murata, A., Oh, J. R., Roose, P., and Woodward E. M. S., Mother Tank,Tsukuba, Japan, 43–56, 2010.
Schlitzer, R.: Ocean Data View. Alfred Wegener Institute, Bremerhaven, Germany, available at:http://odv.awi.de (last access: 25 September 2015), 2015.15
Springer, A. M. and McRoy, C. P.: The paradox of pelagic food webs in the northern BeringSea-III. Patterns of primary productivity, Cont. Shelf Res., 13, 575–599, 1993.
Stroeve, J., Holland, M. M., Meier, W., Scambos, T., and Serreze, M.: Arctic sea ice decline:Faster than forecast, Geophys. Res. Lett., 34, L09501, doi:10.1029/2007GL029703, 2007.
Weingartner, T. J., Danielson, S., Sasaki, Y., Pavlov, V., and Kulakov, M.: The Siberian Coastal20
Current: A wind- and buoyancy-forced Arctic coastal current, J. Geophys. Res., 104, 29697–29713, doi:10.1029/1999JC900161, 1999.
Welschmeyer, N. A.: Fluorometric analysis of chlorophyll a in the presence of chlorophyll b andpheopigments, Limnol. Oceanogr., 39, 1985–1992, 1994.
Yamada, Y., Fukuda, H., Uchimiya, M., Motegi, C., Nishino, S., Kikuchi, T., and Na-25
gata, T.: Localized accumulation and a shelf-basin gradient of particles in the ChukchiSea and Canada Basin, western Arctic, J. Geophys. Res. Oceans, 120, 4638–4653,doi:10.1002/2015JC010794, 2015.
Yamamoto-Kawai, M., McLaughlin, F. A., Carmack, E. C., Nishino, S., Shimada, K., and Ku-rita, N.: Surface freshening of the Canada Basin, 2003–2007: River runoff versus sea ice30
meltwater, J. Geophys. Res., 114, C00A05, doi:10.1029/2008JC005000, 2009.Yao, W. and Byrne, R. H.: Simplified seawater alkalinity analysis: Use of linear array spectrom-
eters, Deep-Sea Res. Pt. I, 45, 1383–1392, 1998.
16383
BGD12, 16359–16396, 2015
Water masscharacteristics in the
southern ChukchiSea biological
hotspot
S. Nishino et al.
Title Page
Abstract Introduction
Conclusions References
Tables Figures
J I
J I
Back Close
Full Screen / Esc
Printer-friendly Version
Interactive Discussion
Discussion
Paper
|D
iscussionP
aper|
Discussion
Paper
|D
iscussionP
aper|
Yokoi, N., Matsuno, K., Ichinomiya, M., Yamaguchi, A., Nishino, S., Onodera, J., Inoue, J., andKikuchi, T.: Short-term changes in a microplankton community in the Chukchi Sea duringautumn: consequences of a strong wind event, Biogeosciences Discuss., 12, 8789–8817,doi:10.5194/bgd-12-8789-2015, 2015.
Yun, M. S., Whitledge, T. E., Kong, M., and Lee, S. H.: Low primary production in the Chukchi5
Sea shelf, 2009, Cont. Shelf Res., 76, 1–11, doi:10.1016/j.csr.2014.01.001, 2014.
16384
BGD12, 16359–16396, 2015
Water masscharacteristics in the
southern ChukchiSea biological
hotspot
S. Nishino et al.
Title Page
Abstract Introduction
Conclusions References
Tables Figures
J I
J I
Back Close
Full Screen / Esc
Printer-friendly Version
Interactive Discussion
Discussion
Paper
|D
iscussionP
aper|
Discussion
Paper
|D
iscussionP
aper|
Table 1. Mooring configurations.
Mooring Latitude Longitude Bottom Sensor Parameters PeriodDepth Depth
SCH-12 67◦42.18′ N 168◦50.01′W 52 m 45 m T , S, DO, 16 July 2012–2 October 2012Chl a, turbidity
SCH-12-2 68◦02.00′ N 168◦50.03′W 59 m 52 m T , S, DO, 3 October 2012–20 July 2013Chl a, turbidity
SCH-13 68◦02.00′ N 168◦50.03′W 60 m 53 m T , S, DO, 20 July 2013–19 July 2014Chl a, turbidity
Notes: T , S, DO, and chl a denote temperature, salinity, dissolved oxygen, and chlorophyll a, respectively.
16385
BGD12, 16359–16396, 2015
Water masscharacteristics in the
southern ChukchiSea biological
hotspot
S. Nishino et al.
Title Page
Abstract Introduction
Conclusions References
Tables Figures
J I
J I
Back Close
Full Screen / Esc
Printer-friendly Version
Interactive Discussion
Discussion
Paper
|D
iscussionP
aper|
Discussion
Paper
|D
iscussionP
aper|
Table 2. R/V Mirai survey periods.
Year Period
2004 3 September–9 October2008 28 August–6 October2010 4 September–13 October2012 13 September–4 October2013 31 August–4 October
16386
BGD12, 16359–16396, 2015
Water masscharacteristics in the
southern ChukchiSea biological
hotspot
S. Nishino et al.
Title Page
Abstract Introduction
Conclusions References
Tables Figures
J I
J I
Back Close
Full Screen / Esc
Printer-friendly Version
Interactive Discussion
Discussion
Paper
|D
iscussionP
aper|
Discussion
Paper
|D
iscussionP
aper|
Table 3. End-member values used in this study.
Salinity Potential Alkalinity(µmol kg−1)
SIM (sea ice meltwater) 4 263MW (meteoric water= river runoff+precipitation) 0 793SE (saline end-member) 32.5 2223
16387
BGD12, 16359–16396, 2015
Water masscharacteristics in the
southern ChukchiSea biological
hotspot
S. Nishino et al.
Title Page
Abstract Introduction
Conclusions References
Tables Figures
J I
J I
Back Close
Full Screen / Esc
Printer-friendly Version
Interactive Discussion
Discussion
Paper
|D
iscussionP
aper|
Discussion
Paper
|D
iscussionP
aper|
Figure 1. Map showing the bathymetric features of the study area and the hydrographic stationsfor the R/V Mirai cruises in 2012 (red dots) and 2013 (blue dots). Green diamonds represent theSCH-12 (southern site) and SCH-12-2/SCH-13 (northern site) mooring sites listed in Table 1.
16388
BGD12, 16359–16396, 2015
Water masscharacteristics in the
southern ChukchiSea biological
hotspot
S. Nishino et al.
Title Page
Abstract Introduction
Conclusions References
Tables Figures
J I
J I
Back Close
Full Screen / Esc
Printer-friendly Version
Interactive Discussion
Discussion
Paper
|D
iscussionP
aper|
Discussion
Paper
|D
iscussionP
aper|
Sea ice Sea ice
Tem
per
atu
re [ºC
] D
O [μ
mo
l/kg
]
Sal
init
y T
urb
idit
y [F
TU
]
Ch
l-a
[mg/m ] 3
(a)
(b)
(c)
Figure 2. Time series of (a) temperature (◦C; red) and salinity (blue), (b) dissolved oxygen, DO,(µmol kg−1; blue) and turbidity (in formazin turbidity units, FTUs; red), and (c) chlorophyll a,Chl a, (mg m−3; green). The data were obtained from the SCH-12, SCH-12-2, and SCH-13moorings during 16 July 2012–19 July 2014. The vertical axis scale in (c) is exaggerated wherethe concentration is < 3 mg m−3. Periods when sea ice concentration was > 50 % at the mooringsite are indicated by blue bars.
16389

BGD12, 16359–16396, 2015
Water masscharacteristics in the
southern ChukchiSea biological
hotspot
S. Nishino et al.
Title Page
Abstract Introduction
Conclusions References
Tables Figures
J I
J I
Back Close
Full Screen / Esc
Printer-friendly Version
Interactive Discussion
Discussion
Paper
|D
iscussionP
aper|
Discussion
Paper
|D
iscussionP
aper|
(a) (b) Chl-a [mg/m2] PP [g C/m2/day]
1 g C/m2/day 2012
Figure 3. (a) Chlorophyll a integrated over the water column (mg m−2) and (b) daily primaryproductivity in the water column (g C m−2 d−1) obtained from the 2012 R/V Mirai cruise.
16390
BGD12, 16359–16396, 2015
Water masscharacteristics in the
southern ChukchiSea biological
hotspot
S. Nishino et al.
Title Page
Abstract Introduction
Conclusions References
Tables Figures
J I
J I
Back Close
Full Screen / Esc
Printer-friendly Version
Interactive Discussion
Discussion
Paper
|D
iscussionP
aper|
Discussion
Paper
|D
iscussionP
aper|
(a) (b) Chl-a [mg/m2] PP [g C/m2/day]
1 g C/m2/day 2013
Figure 4. (a) Chlorophyll a integrated over the water column (mg m−2) and (b) daily primaryproductivity in the water column (g C m−2 d−1) obtained from the 2013 R/V Mirai cruise.
16391
BGD12, 16359–16396, 2015
Water masscharacteristics in the
southern ChukchiSea biological
hotspot
S. Nishino et al.
Title Page
Abstract Introduction
Conclusions References
Tables Figures
J I
J I
Back Close
Full Screen / Esc
Printer-friendly Version
Interactive Discussion
Discussion
Paper
|D
iscussionP
aper|
Discussion
Paper
|D
iscussionP
aper|
(a)
(b)
(c)
(d)
(e)
(f)
fSIM Temperature [ºC]
13 – 17 September 2012
Figure 5. Vertical sections of (a) temperature (◦C), (b) light transmission (%), (c) dissolvedoxygen (µmol kg−1), (d) fraction of sea ice meltwater, (e) nitrate (µmol kg−1), and (f) ammonium(µmol kg−1) along the 168◦45′W meridian near the US–Russia border obtained during the 13–17 September 2012 R/V Mirai cruise. The water sampling level at each station is indicated by ablack dot. Salinity contours are superimposed on each section with a 0.5 contour interval. Thethick contour in each section indicates a salinity of 33.
16392
BGD12, 16359–16396, 2015
Water masscharacteristics in the
southern ChukchiSea biological
hotspot
S. Nishino et al.
Title Page
Abstract Introduction
Conclusions References
Tables Figures
J I
J I
Back Close
Full Screen / Esc
Printer-friendly Version
Interactive Discussion
Discussion
Paper
|D
iscussionP
aper|
Discussion
Paper
|D
iscussionP
aper|
(a)
(b)
(c)
(d)
(e)
(f)
fSIM Temperature [ºC]
3 – 4 October 2012
Figure 6. Vertical sections of (a) temperature (◦C), (b) light transmission (%), (c) dissolvedoxygen (µmol kg−1), (d) fraction of sea ice meltwater, (e) nitrate (µmol kg−1), and (f) ammonium(µmol kg−1) along the 168◦45′W meridian near the US–Russia border obtained during the 3–4October 2012 R/V Mirai cruise. The water sampling level at each station is indicated by a blackdot. Salinity contours are superimposed on each section with a 0.5 contour interval. The thickcontour in each section indicates a salinity of 33.
16393
BGD12, 16359–16396, 2015
Water masscharacteristics in the
southern ChukchiSea biological
hotspot
S. Nishino et al.
Title Page
Abstract Introduction
Conclusions References
Tables Figures
J I
J I
Back Close
Full Screen / Esc
Printer-friendly Version
Interactive Discussion
Discussion
Paper
|D
iscussionP
aper|
Discussion
Paper
|D
iscussionP
aper|
(a)
(b)
(c)
(d)
(e)
(f)
fSIM Temperature [ºC]
27 September – 4 October 2013
Figure 7. Vertical sections of (a) temperature (◦C), (b) light transmission (%), (c) dissolvedoxygen (µmol kg−1), (d) fraction of sea ice meltwater, (e) nitrate (µmol kg−1), and (f) ammonium(µmol kg−1) along the 168◦45′W meridian near the US–Russia border obtained during the 27September–4 October 2013 R/V Mirai cruise. The water sampling level at each station is indi-cated by a black dot. Salinity contours are superimposed on each section with a 0.5 contourinterval.
16394
BGD12, 16359–16396, 2015
Water masscharacteristics in the
southern ChukchiSea biological
hotspot
S. Nishino et al.
Title Page
Abstract Introduction
Conclusions References
Tables Figures
J I
J I
Back Close
Full Screen / Esc
Printer-friendly Version
Interactive Discussion
Discussion
Paper
|D
iscussionP
aper|
Discussion
Paper
|D
iscussionP
aper|
(a)
(b)
(c)
(d)
(e)
(f)
fSIM Temperature [ºC]
Composite of 2004, 2008, and 2010
Figure 8. Vertical sections of (a) temperature (◦C), (b) light transmission (%), (c) dissolvedoxygen (µmol kg−1), (d) fraction of sea ice meltwater, (e) nitrate (µmol kg−1), and (f) ammonium(µmol kg−1) along the 168◦45′W meridian near the US–Russia border obtained from compositedata during the late summer to fall of 2004, 2008, and 2010 R/V Mirai cruises. In (b), the datawere available only for 2004, and had a negative bias of ∼20 %. The water sampling level ateach station is indicated by a black dot. Salinity contours are superimposed on each sectionwith a 0.5 contour interval.
16395
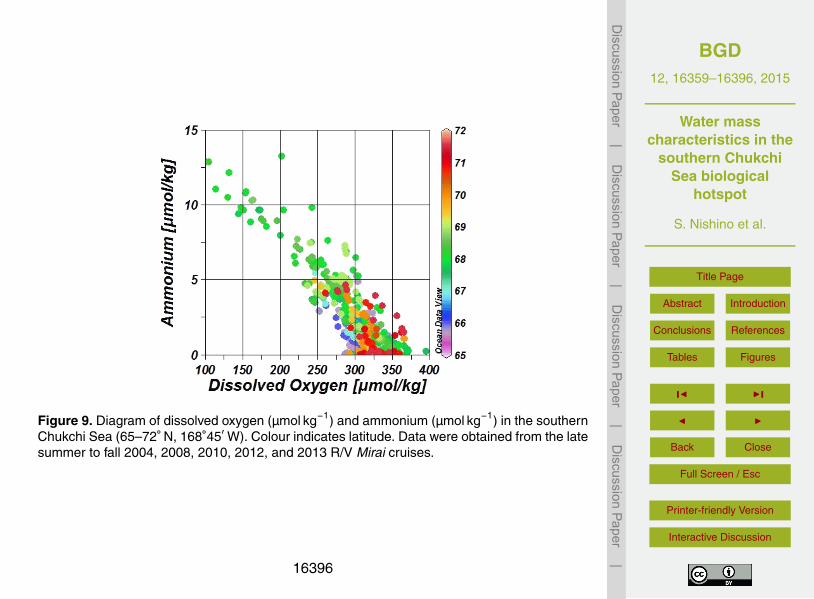
BGD12, 16359–16396, 2015
Water masscharacteristics in the
southern ChukchiSea biological
hotspot
S. Nishino et al.
Title Page
Abstract Introduction
Conclusions References
Tables Figures
J I
J I
Back Close
Full Screen / Esc
Printer-friendly Version
Interactive Discussion
Discussion
Paper
|D
iscussionP
aper|
Discussion
Paper
|D
iscussionP
aper|
Figure 9. Diagram of dissolved oxygen (µmol kg−1) and ammonium (µmol kg−1) in the southernChukchi Sea (65–72◦ N, 168◦45′W). Colour indicates latitude. Data were obtained from the latesummer to fall 2004, 2008, 2010, 2012, and 2013 R/V Mirai cruises.
16396