Embed Size (px)
Citation preview

Water Sensitive Urban Design
Guidelines
August 2005
MILDURA RURAL
CITY COUNCIL

8 August 2005
Mildura Rural City Council
2127021A 001 RPT 0002 C0 MM: amc M05249
Mildura Rural City Council - Water Sensitive Urban Design Guidelines
Parsons Brinckerhoff Australia Pty Limited ACN 078 004 798 and Parsons Brinckerhoff International (Australia) Pty Limited ACN 006 475 056 trading as Parsons Brinckerhoff ABN 84 797 323 433
Level 7 457 St. Kilda Road Melbourne Vic 3004 PO Box 7209 Melbourne Vic 3004 Australia Telephone +61 3 9861 1111 Facsimile +61 3 9861 1144 Email [email protected] ABN 84 797 323 433 NCSI Certified Quality System ISO 9001

W:\A556 - WATER\PROJECTS\2127000\2127021A - Mildura WSUD Guideline\2127021A 001 RPT 0002 CO MM amc.doc M05249
Parsons Brinckerhoff Australia Pty Limited and Parsons Brinckerhoff International (Australia) Pty Limited trading as Parsons Brinckerhoff (“PB”). [2005]
Copyright in the drawings, information and data recorded in this document (“the information”) is the property of PB. This document and the information are solely for the use of the authorised recipient and this document may not be used, copied or reproduced in whole or part for any purpose other than that for which it was supplied by PB. PB makes no representation, undertakes no duty and accepts no responsibility to any third party who may use or rely upon this document or the information. Author: DunstoneG/GrahamH Reviewer: EvangelistiM/CrawfordD
Approved by: CollettD
Signed:
Date: 8 August 2005
Distribution: MRCC, GD, DC, EM, Library

Mildura Rural City Council Water Sensitive Urban Design Guidelines
PARSONS BRINCKERHOFF 2127021A 001 RPT 0002 C0 MM: amc M05249 Page i
Contents Page Number
1. Introduction 1 1.1 Background 1 1.2 What is WSUD 2 1.3 Proponent of the guidelines 3 1.4 Purpose and use of the guidelines 4 1.5 Melbourne Water WSUD Engineering Procedures –Stormwater 4 1.6 Document structure 4
2. Key physical characteristics affecting WSUD in the Mildura Region 5 2.1 Climate 5
2.1.1 Rainfall 5 2.1.2 Evaporation 6
2.2 Geology 6 2.2.1 Geological formations 6 2.2.2 Soils 7 2.2.3 Recommendations 7
2.3 Groundwater/salinity 8 2.3.1 Salinity risk assessment and mapping 9
2.4 Stormwater management objectives 10 2.4.1 Construction phase 10 2.4.2 Post-construction phase 12
3. WSUD measures and application 13 3.1 WSUD measures 13 3.2 Relationship between WSUD measures 13 3.3 Description of WSUD measures and implementation issues 14
3.3.1 Bioretention swales 15 3.3.2 Bioretention basins 16 3.3.3 Sand filters 16 3.3.4 Vegetated swales / filter strips 17 3.3.5 Constructed wetlands 17 3.3.6 Rainwater tanks 18
4. WSUD planning and selection guide 20 4.1 WSUD planning process 20 4.2 Applicability and function of WSUD measures 21 4.3 WSUD selection and treatment train 22

Mildura Rural City Council Water Sensitive Urban Design Guidelines
Contents (continued) Page Number
PARSONS BRINCKERHOFF 2127021A 001 RPT 0002 C0 MM: amc M05249 Page ii
5. WSUD design specifications 23 5.1 Introduction 23 5.2 Design process 24
5.2.1 MUSIC design process 24 5.3 Design specification – Bioretention swales 25 5.4 Design specification – Bioretention basins 25 5.5 Design specification – sand filters 26 5.6 Design specification – vegetated swales / filter strips 27 5.7 Design specification – constructed wetlands 28 5.8 Design specification – rainwater tanks 29
6. WSUD operation and maintenance 31 6.1 Introduction 31 6.2 Operation and maintenance plan for stormwater treatment facilities 31
6.2.1 Facilities with vegetation 31 6.2.2 Facilities without vegetation 32
6.3 Rainwater tanks 32
7. Lifecycle for WSUD measures 33 7.1 Introduction 33 7.2 Construction 33 7.3 Commissioning 33 7.4 During design life 33 7.5 Decommissioning 33
8. References 34

Mildura Rural City Council Water Sensitive Urban Design Guidelines
Contents (continued) Page Number
PARSONS BRINCKERHOFF 2127021A 001 RPT 0002 C0 MM: amc M05249 Page iii
List of Tables and Figures Table 2.1: Average rainfall figures 5 Table 2.2: Average evaporation figures 6 Figure 2.1: Poorly maintained nature strip resulting in erosion of materials onto road
surface. 10 Table 2.3: Ranking of objectives for new developments 12 Table 2.4: Post construction BPEMG objectives 12 Table 3.1: WSUD Treatment Categories 14 Table 3.2: WSUD Treatment Categories for Mildura 14 Figure 4.1: WSUD planning process 20 Table 4.1: WSUD treatment applicability and performance 21 Figure 5.1: WSUD design process 23 Figure 5.2: Bioretention swale sizing chart 25 Figure 5.3: Bioretention Basin Sizing Chart 26 Figure 5.6: Constructed wetland sizing chart 29 Figure 5.7: Rainwater tank sizing chart for toilet flushing 30 Table A1: Results of monthly rainfall comparison 3 Table A2: Monthly ET Values for Mildura 3 Figure A1: 1968 Monthly rainfall compared to mean monthly rainfall 4 Figure A2: 1966 Monthly rainfall compared to mean monthly rainfall 5 Figure A3: 1987 Monthly rainfall compared to mean monthly rainfall 5 Figure A4: 1981 Monthly rainfall compared to mean monthly rainfall 6 Figure A5: Monthly rainfall regression of Mildura PO and Mildura Airport 6
Appendices Appendix A MUSIC Climatic Data Appendix B MUSIC Water Quality Data
Mildura Rural City Council Water Sensitive Urban Design Guidelines
PARSONS BRINCKERHOFF 2127021A 001 RPT 0002 C0 MM: amc M05249 Page 1
1. Introduction
1.1 Background
Water Sensitive Urban Design (WSUD) is a relatively new approach to water management in urban areas. The objective of WSUD is to maintain or replicate the pre-development water cycle through the use of design techniques to create a functionally equivalent hydrological landscape. When urban development occurs, the natural water cycle is altered to the extent that stormwater runoff from individual properties and roads intensify, flows usually increase and potential contaminants from residential and commercial activity and associated vehicle use flow into the streams and watercourses. Traditionally stormwater generated from urban areas is conveyed efficiently to designed trunk drainage systems to reduce stormwater ponding and flooding risk. The effect of this type of water management approach on natural systems has in the past included:
the intensification of flows in watercourses potentially resulting in stream bank erosion and sedimentation
an increase in contamination of receiving aquatic environments resulting in generally adverse impacts on aquatic ecosystems
an increase in the use of water resources for domestic, commercial/industrial uses as well as outdoor irrigation of gardens and open space areas
an increased tendency for more severe flooding and increased areas of flooding.
The importance of increasing the use of WSUD has been recognised by Mildura Rural City Council with growing acceptances of the longer-term environmental benefits of the application of WSUD principles. However, implementation of WSUD has been limited in the past due to the lack of understanding of WSUD measures available and suitable to the Mildura region as well as a lack of established procedures, standards and approvals within the council. This creates a perception that there are unacceptable risks involved in approving alternative approaches to water management.
In order to encourage WSUD implementation in the Mildura region this document aims to provide WSUD best management practice design specifications for a diverse range of WSUD measures at the subdivision and allotment scales. The WSUD measures provided in this document are based upon innovative WSUD methods which have proven environmental, aesthetic and economic outcomes and are applicable to the local environment of North Western Victoria. It should be noted, however, that the WSUD design specifications provided is not an exhaustive list of all possible WSUD measures that could be used in urban development. Nonetheless, the specifications do include those measures that are most likely to be used in the Mildura region.
The appropriate WSUD measures, procedures and products are generally well known, even though ongoing research is providing additional information. The challenge is to gain broad-based acceptance and application of WSUD. This requires a greatly increased level of awareness and understanding of the techniques involved. This

Mildura Rural City Council Water Sensitive Urban Design Guidelines
PARSONS BRINCKERHOFF 2127021A 001 RPT 0002 C0 MM: amc M05249 Page 2
document is aimed at achieving broad application of WSUD measures by providing best practice design specifications for a number of those measures.
1.2 What is WSUD
WSUD is the integration of various Best Planning Practices (BPPs) and Best Management Practices (BMP) for the sustainable management of the urban water cycle. WSUD is concerned with the design of urban environments to be more “sustainable” by limiting the negative impacts of urban development on the total urban water cycle. Therefore WSUD is about:
trying to more closely match the pre-development stormwater runoff regime, in both quality and quantity
reducing the amount of water transported between catchment, both in water supply import and wastewater export
optimising the use of rainwater that falls on the urban areas.
There is a wide range of approaches to WSUD, however the most commonly implemented is the improvement of stormwater management. Other approaches include management of water at the household scale such as the collection and use of rainwater from rooftops and water efficient landscape design. The key principles of WSUD as presented in the Urban Stormwater: Best Practice Environmental Management Guidelines (Victorian Stormwater Committee, 1999) are:
1. Protect natural systems (creeks, rivers and wetlands) within urban catchments.
2. Protect water quality by improving the quality of stormwater runoff draining from urban developments.
3. Integrate stormwater treatment into the landscape by using stormwater treatment systems in the landscape that incorporate multiple uses providing a variety of benefits such as water quality treatment, wildlife habitat, public open space, recreational and visual amenity for the community.
4. Reduce runoff peak flows from developments by on-site temporary storage measures (with potential for reuse) and minimise impervious areas.
5. Add long-term value while minimising development costs.
6. Reduce potable water demand by using stormwater as a resource through capture and reuse for non-potable purposes.
WSUD applications can be sized to suit most individual sites from residential house blocks through to whole subdivisions. However, appropriate planning and design are required to ensure successful outcomes. The range of applications available may be applied in the following areas:
new road/street in large or small development areas
existing streets and roadways

Mildura Rural City Council Water Sensitive Urban Design Guidelines
PARSONS BRINCKERHOFF 2127021A 001 RPT 0002 C0 MM: amc M05249 Page 3
upgrade of drainage systems or pavements
publicly owned land
new residential developments
existing residential developments, redevelopments and infill areas
commercial or industrial developments
carparks/driveways/access ways on public or private property.
It should be noted that WSUD measures cover a range of disciplines and therefore a multi-disciplinary team approach is required to promote urban design which integrates best practice water planning and management measures with attractive streetscapes and open spaces. This integration can create attractive and sustainable urban landscapes that can provide developers with a marketing advantage.
1.3 Proponent of the guidelines
This document has been prepared by Parsons Brinckerhoff Australia (PB) for the Mildura Rural City Council. The Council is working to promote WSUD in the Mildura region.
Mildura Rural City Council have produced a Management Plan for the Improvement of Urban Stormwater Quality. This plan has identified a series of management strategies for Council to meet its corporate vision of a healthy and sustainable natural environment.
Following the endorsement of the plan by Council and its various stakeholders in conjunction with the Sunraysia Drainage Strategy, funds were accessed through the Victorian Stormwater Action Program to implement strategies outlined in the plan.
Mildura Rural City Council seeks to be a regional leader in Stormwater management by working in partnership with authorities, developers, and other stakeholders to improve the quality, efficiency, and reuse of water, in residential and industrial developments.
Council aims to find ways to bring consideration of the water environment and infrastructure service design along with management opportunities earlier into the decision making processes associated with urban planning and development design.
Mildura Rural City Council has adopted the recommendations of the Management Plan for the Improvement of Urban Stormwater. The plan contains a number of Reactive Management Strategies to address the priority management issues. Objective A 8.3 states:
Determine applicability of different Water Sensitive Urban Design (WSUD) principles given unique characteristics in Mildura for all new developments (eg detention systems, re-use for watering, swales etc) and require adoption of appropriate WSUD principles for new development through reference to appropriate guidelines eg Best Practice Environment Management Guidelines.

Mildura Rural City Council Water Sensitive Urban Design Guidelines
PARSONS BRINCKERHOFF 2127021A 001 RPT 0002 C0 MM: amc M05249 Page 4
1.4 Purpose and use of the guidelines
The WSUD Technical Guidelines, incorporating the WSUD Design Specifications, are intended to provide information for those proposing development within the Mildura Rural City Council Local Government Area, however they are also applicable to areas in North Western Victoria, South Western New South Wales and some areas of South Australia. The Guidelines explain how best to incorporate and design WSUD measures into urban developments. It provides guidance to councils, master planners, developers and builders through provision of best management practice design specifications for a number of WSUD measures suitable for application in the Mildura area. It does provide guidance on water quality or quantity targets, however, such targets should be confirmed with the Council or regulatory authority.
1.5 Melbourne Water WSUD Engineering Procedures –Stormwater
This document is intended not to replace but be used in conjunction with WSUD Engineering Procedures –Stormwater, published by Melbourne Water. This document is aimed at providing an overview of the current best practice in the management of urban stormwater quality in Victoria and guidelines to the following:
procedures for the estimation of a range of urban stormwater contaminants
design of stormwater quality improvement measures
procedure for the estimation on performance of stormwater quality improvement measures
development of an integrated urban water cycle management strategy.
1.6 Document structure
The technical guidelines are organised in the following sections:
Section 2 Physical Characteristics in the Mildura Region
Section 3 WSUD Measures and Applications
Section 4 WSUD Planning and Selection Guide
Section 5 WSUD Design Specifications
Section 6 WSUD Operation and Maintenance
Section 7 Life Cycle Costs for WSUD Measures
Mildura Rural City Council Water Sensitive Urban Design Guidelines
PARSONS BRINCKERHOFF 2127021A 001 RPT 0002 C0 MM: amc M05249 Page 5
2. Key physical characteristics affecting WSUD in the Mildura Region
The key physical factors that affect the function, design and performance of WSUD measures in the Mildura Region are:
climate
geology and soils
groundwater/salinity
catchment water quantity and quality objectives.
2.1 Climate
2.1.1 Rainfall
The annual average rainfall total of 289mm is fairly evenly distributed through the year, but is more concentrated in the winter and spring months. The month of October is, on average, the year’s wettest, receiving 31mm, by contrast the year’s driest months, March and April, receive only 19mm.
Spring and summer are when thunderstorms are most frequent, 9 of the year’s 12 storms occurred during these seasons. By contrast, on average a thunderstorm affects Mildura only once every winter.
Included in Chapter 5 are charts modified to establish sizing criteria for each WSUD measure. These charts are presented in a similar format to those in the Melbourne Water WSUD Engineering Procedures manual. They have been recalculated as per the procedure outlined in Appendix A to be specific for the Mildura region. These graphs can be used in lieu of the regional sizing criteria detailed in the WSUD Engineering Procedures manual.
Table 2.1: Average rainfall figures
Month Ja
n
Fe
b
Ma
r
Ap
r
Ma
y
Ju
n
Ju
l
Au
g
Se
p
Oct
Nov
De
c
Monthly Average (mm)
20.7 21.2 18.2 18.5 26.3 23.2 26.3 27.6 28.2 31.0 23.9 23.8
Mean number of raindays
3.6 3.2 3.4 4.2 6.9 7.8 9.3 9.2 7.6 7.2 5.6 4.3

Mildura Rural City Council Water Sensitive Urban Design Guidelines
PARSONS BRINCKERHOFF 2127021A 001 RPT 0002 C0 MM: amc M05249 Page 6
2.1.2 Evaporation
Annual average evaporation in the Mildura region is over 2100mm per year.
The Table 2.2 breaks down the evaporation into monthly and daily averages.
Table 2.2: Average evaporation figures
Month Ja
n
Fe
b
Ma
r
Ap
r
May
Ju
n
Ju
l
Au
g
Se
p
Oc
t
No
v
De
c
Monthly Average (mm)
325.5 274.4 229.4 138.0 80.6 54.0 62.0 89.9 132 198.4 255.0 313.1
Daily Average (mm)
10.5 9.8 7.4 4.6 2.6 1.8 2.0 2.9 4.4 6.4 8.5 10.1
The amount of evaporation compared to rainfall during the summer and autumn months indicates extended dry periods.
2.2 Geology
There are several geological formations and soil types within the Mildura Rural City Council’s region. These geological formations and soil types are delineated into distinct groups.
2.2.1 Geological formations
The Woorinen geology formation is located in the northern area of the Mildura Rural City Council’s boundary. The soil formation in this area is predominantly aeolian deposited dune sands and calcareous clayey palaesols.
Lowan geology formation is located in the southern area of Council’s region. The soils in this area are typically aeolian deposited dune sands with a grading classified as fine to medium grained.
However geology and soil types are not limited to these geology formation and soil types. Along the Murray River the Blanchetown clay geology formation is quite prominent. The soil deposits in this area are predominantly fluvial and lacustrine clays, sands and sandy clays.
Other smaller deposits of Yamba, Paludal and Parilla sand, formations are located in isolated regions within the council’s jurisdiction. Soils in the Yamba formations are aeolian deposits of sand, silts and clays. In the location of Parilla sands formation soils are made up of marine sands and silts. The Paludal geology region is made up of lagoon and swamp soil deposits of silt and clays.
2.2.2 Soils
Soil types in the Mildura Rural City Councils jurisdiction vary and include Vertosols, Calcarosols, Sodosols, Hydrosols and Sandy soils. The following is an explanation of the properties of each soil type:
Mildura Rural City Council Water Sensitive Urban Design Guidelines
PARSONS BRINCKERHOFF 2127021A 001 RPT 0002 C0 MM: amc M05249 Page 7
Vertosols soils are cracking clay soils that display significant shrinking and swelling during wetting and drying cycles. Vertosols occur on alluvium and associated lake bed deposits; along creeks and rivers, and on broad low-lying plains in the northern Mallee. (Department of Primary Industries (DPI), 2005).
Calcarosols soils are formed on calcareous aeolian sediments of variable texture in the Mallee generally has a small, gradual increase in clay content with depth. Lime is abundant in the subsoils, either in soft form, in nodules or sometimes as blocks, and it may extend to the surface of medium to heavy textured soils. The Calcarosols in the councils region vary quite considerably in terms of soil texture - ranging from those dominated by sands to those that are clayey throughout (DPI, 2005).
Sodosols have a strong texture contrast between loamy surface horizons and clayey subsurface horizons. The subsoils are sodic (ie. exchangeable sodium percentage (ESP) is 6 or greater) and not strongly acid (ie. pH 5.5 or greater). Sodosols can be separated on the basis of the colour of the upper 20 cm of the subsoil into Red, Brown, Yellow, Grey and Black groups. In the Mallee region, Red Sodosols are the most common. Red Sodosols with loamy surface horizons abruptly overlying red sodic clays occur on older alluvial terraces which have been capped with clayey aeolian sediments. In the southern Mallee, Sodosols are found near creeks and rivers (often in areas where the original vegetation of grassy Casuarina woodlands contrasts with the surrounding Mallee scrub). Erosion has frequently removed the surface horizons to expose red, somewhat saline clays that seal over on wetting (DPI, 2005).
Hydrosols occur naturally in low-lying parts of the central and northern Mallee region, where saline regional groundwater’s outcrop. Surfaces are variably saline, depending largely on depth to the watertable. Soils which are saline to the surface are commonly red clay loams overlying gypsum (DPI, 2005).
Sandy Soils are widespread within the council region. The sandy soils include Tenosols and Rudosols. Tenosols are weakly developed soils, whilst Rudosols display minimal development and tend to be younger (DPI, 2005).
2.2.3 Recommendations
The effects of these soil types within the council’s area can have implications on the design of water quality treatment facilities. In the design of water quality treatment facilities within the Council boundaries designers should be mindful of the properties of different soil types within the area and the following should be considered in the design of treatment measures:
2.2.3.1 Soil permeability
In minimising water loss by infiltration into the underlying soils, it may be necessary that wetlands ponds and lakes be clay lined.
Bio-retention basins or swales may also require the use of liners to prevent ex-filtration into the surrounding soils
With a more permeable underlying soil, the potential for pondage areas in swales and buffers with flat longitudinal grades (ie less than 1% grade) will be decreased.
Mildura Rural City Council Water Sensitive Urban Design Guidelines
PARSONS BRINCKERHOFF 2127021A 001 RPT 0002 C0 MM: amc M05249 Page 8
2.2.3.2 Dispersive soils
In areas of dispersive soils some consideration may need to be taken to adequately treat dispersive soils prior to use in treatment facilities such as wetlands, ponds and lakes. The use of dispersive soils in these applications can lead to highly turbid water. However the treatment of dispersive soils with gypsum can help reduce the dispersion of such soils.
2.2.3.3 Stability of soils
Soils with low cohesive properties can lead to structural instability when used for construction of earth structures or embankments. Structural stability of less cohesive soils can be improved by mixing them with clayey soils.
Seepage through highly permeable soils can also lead to structural instability in their application in earth structures or embankments. Seepage must be managed to ensure that flow paths through the material do not lead to structural instability and slumping.
2.2.3.4 Soils ability to sustainability plant growth
Plant selection for use in soils which are acidic, sodic or saline can be crucial in ensuring the long term sustainability of plants within stormwater treatment facilities. Water Sensitive Urban Design (WSUD) Engineering Procedure Manual (2004) provides suggested plant species for saline areas.
2.3 Groundwater/salinity
Regional studies including geotechnical investigations and hydrogeological studies have identified two groundwater systems either present in the area or that have the potential to develop. These are the deeper regional groundwater system that underlies the whole Mildura area, and localised shallow perched groundwater, which can develop on top of a low permeability clay layer, where this is present in the soil profile.
Regional groundwater: The geology of the Mildura area consists of about 2.0 m of Woorinen Formation surficial soils overlying up to 20 m of the very low permeability Blanchetown Clay. The Blanchetown Clay acts as a confining layer to groundwater in the underlying Parilla Sands. The standing groundwater level in deep groundwater monitoring wells represents the potentiometric level of this confined groundwater in the Parilla Sands aquifer (Gallasch, 2003).
Perched groundwater: In areas where a low permeability clay horizon is present in the soil profile, excess water can accumulate on top of the clay, causing a perched groundwater table to develop. Subsurface clay occurs extensively throughout the Mildura area. This clay varies 1.5 to 2.5 m below the surface (REM Figure 5). The development of a shallow perched groundwater watertable has been managed in the past by the use of tile drainage beneath irrigated vineyards and orchards.
Any WSUD treatment technique has to consider the effect of any infiltration on both the perched groundwater as well as the regional groundwater. Any detention basin or excavation within new and existing developments should not penetrate the clay layer as
Mildura Rural City Council Water Sensitive Urban Design Guidelines
PARSONS BRINCKERHOFF 2127021A 001 RPT 0002 C0 MM: amc M05249 Page 9
regional groundwater incursion into the upper soil profiles could create more salinity issues.
Consideration will be given to using the relative impermeable clay soil layers as a base to any WSUD treatment system as long as it can be proven that the technique shall not adversely impact the local perched groundwater or the deeper regional system.
2.3.1 Salinity risk assessment and mapping
A risk assessment tool has been developed by REM, to characterise future urban areas according to their potential to develop shallow groundwater watertables, which would result in the salinisation of the surface soils, affecting vegetation and infrastructure. The level of risk is considered to range from low to very high according to the potential for shallow regional groundwater and/or perched groundwater to impact on urban development. REM defined the five levels of risk as follows (from Final Report – Site Salinity Management Plan, 5 August 2004):
Low: Groundwater below the threshold of 4 m below ground level and a clay layer does not occur shallower than 4 m below ground level. The risk of salinisation is low.
Moderate: Groundwater is below the threshold of 4 m below ground level and a clay layer is present in the upper 4 m of the soil profile. While the regional groundwater is not a concern in these areas, there is a potential for a perched watertable to develop on top of the clay layer, presenting a considerable hazard to urban development. Actions to manage groundwater are recommended, including the installation of subsurface drainage systems.
High (a): Groundwater is 2 – 4 m below ground level and the clay does not occur shallower than the 4 m threshold for perched groundwater potential. In these areas groundwater is within the zone of concern for urban development.
High (b): Groundwater is 2 –4 m below ground level and clay is present in the upper 4 m of the soil profile, with a potential for development of a perched watertable.
In both categories of high risk potential, regional groundwater is within the zone of concern for urban development and although not currently causing salinisation, poor water management could rapidly cause the onset of saline conditions. Actions to manage groundwater are essential.
Very high: Groundwater is less than 2 m below ground level, which is an immediate threat to urban development, and some land may already be salinised. No urban development should be permitted in these areas.
Each of these risk levels has a number of associated recommended specific salinity risk management actions that can ensure that urban development will not be adversely impacted in the future both onsite and offsite. Of particular relevance, it is recommended that in areas of high risk, the development of irrigated areas such as sports fields or parklands or water features in the form of lakes or wetlands, that involve the retention of water, be avoided.
Mildura Rural City Council Water Sensitive Urban Design Guidelines
PARSONS BRINCKERHOFF 2127021A 001 RPT 0002 C0 MM: amc M05249 Page 10
2.4 Stormwater management objectives
2.4.1 Construction phase
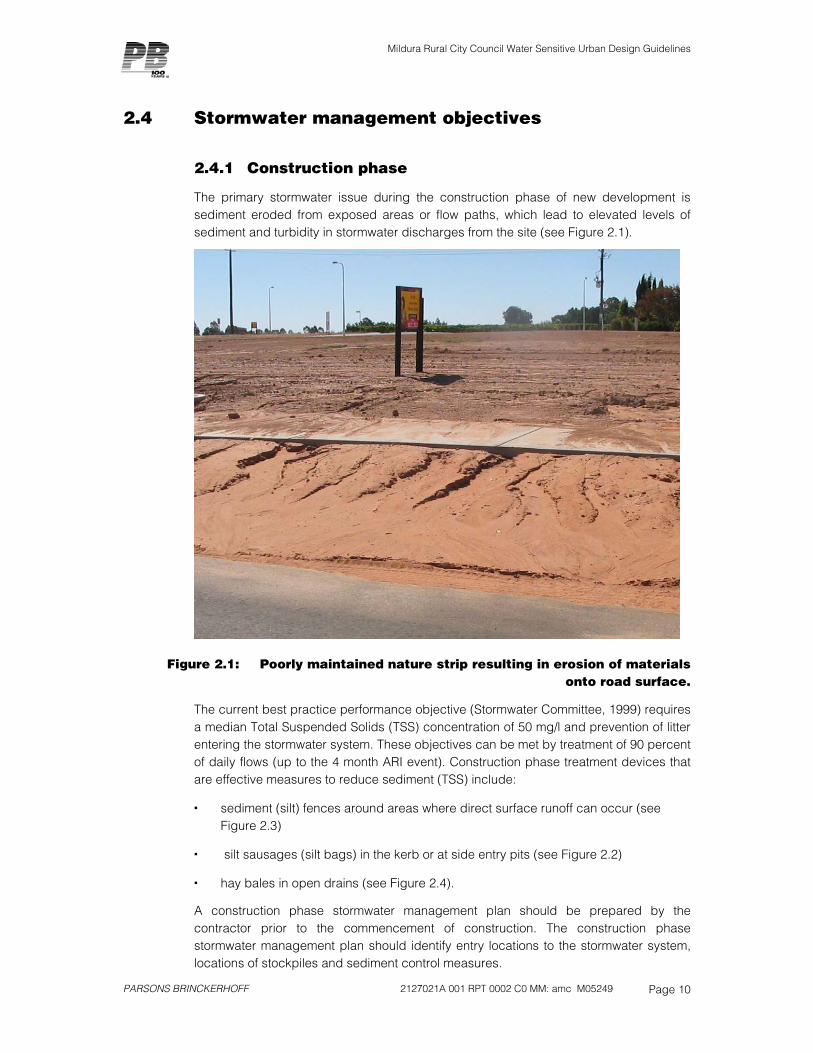
The primary stormwater issue during the construction phase of new development is sediment eroded from exposed areas or flow paths, which lead to elevated levels of sediment and turbidity in stormwater discharges from the site (see Figure 2.1).
Figure 2.1: Poorly maintained nature strip resulting in erosion of materials onto road surface.
The current best practice performance objective (Stormwater Committee, 1999) requires a median Total Suspended Solids (TSS) concentration of 50 mg/l and prevention of litter entering the stormwater system. These objectives can be met by treatment of 90 percent of daily flows (up to the 4 month ARI event). Construction phase treatment devices that are effective measures to reduce sediment (TSS) include:
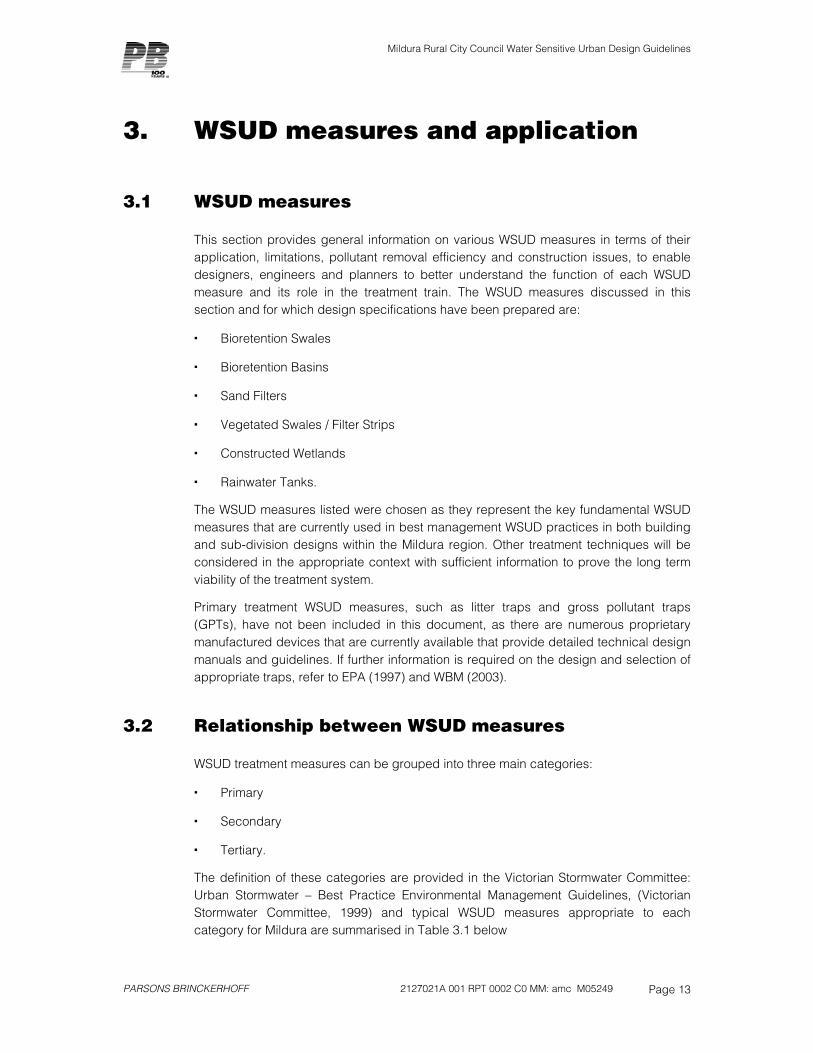
sediment (silt) fences around areas where direct surface runoff can occur (see Figure 2.3)
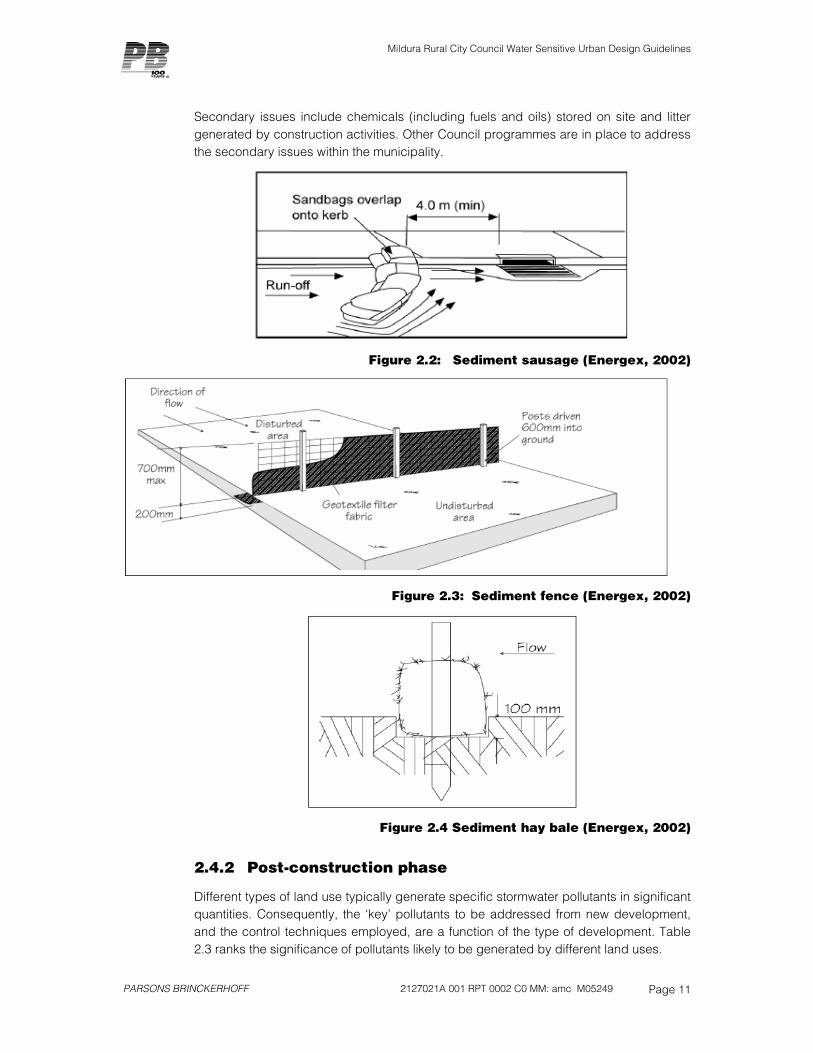
silt sausages (silt bags) in the kerb or at side entry pits (see Figure 2.2)
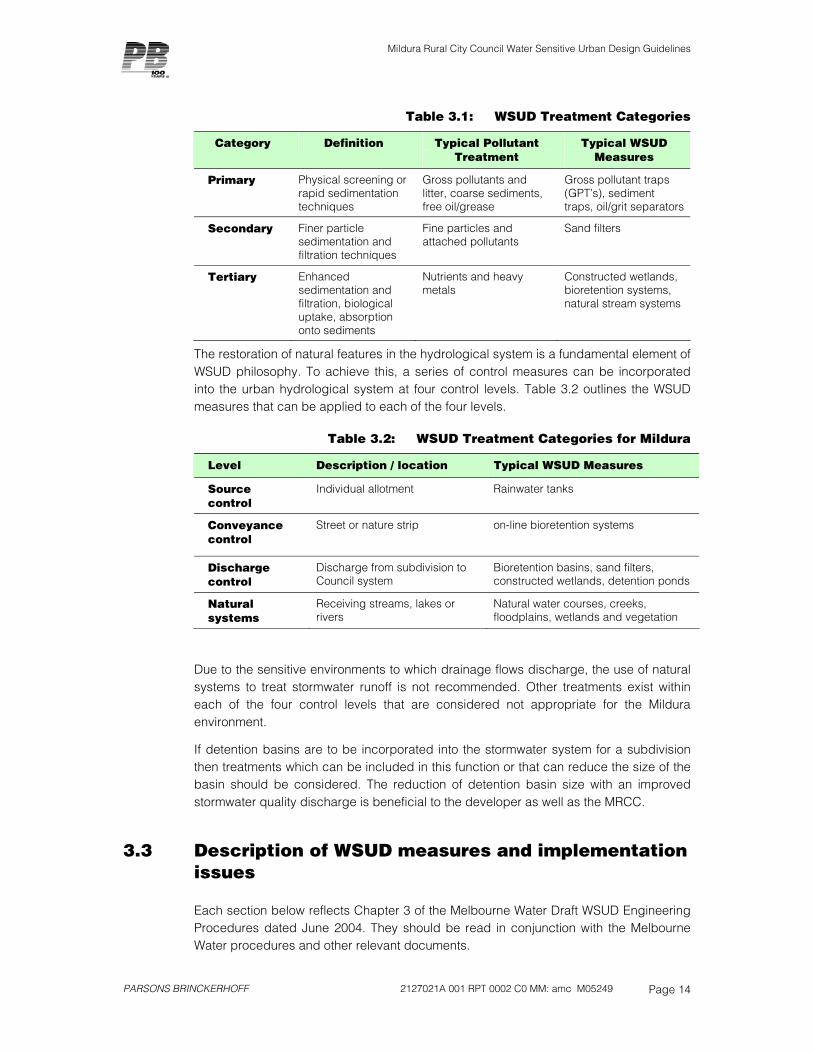
hay bales in open drains (see Figure 2.4).
A construction phase stormwater management plan should be prepared by the contractor prior to the commencement of construction. The construction phase stormwater management plan should identify entry locations to the stormwater system, locations of stockpiles and sediment control measures.
Mildura Rural City Council Water Sensitive Urban Design Guidelines
PARSONS BRINCKERHOFF 2127021A 001 RPT 0002 C0 MM: amc M05249 Page 11
Secondary issues include chemicals (including fuels and oils) stored on site and litter generated by construction activities. Other Council programmes are in place to address the secondary issues within the municipality.
Figure 2.2: Sediment sausage (Energex, 2002)
Figure 2.3: Sediment fence (Energex, 2002)
Figure 2.4 Sediment hay bale (Energex, 2002)
2.4.2 Post-construction phase
Different types of land use typically generate specific stormwater pollutants in significant quantities. Consequently, the ‘key’ pollutants to be addressed from new development, and the control techniques employed, are a function of the type of development. Table 2.3 ranks the significance of pollutants likely to be generated by different land uses.

Mildura Rural City Council Water Sensitive Urban Design Guidelines
PARSONS BRINCKERHOFF 2127021A 001 RPT 0002 C0 MM: amc M05249 Page 12
Table 2.3: Ranking of objectives for new developments
Development Style
Lit
ter
Co
ars
e
sed
ime
nt
Fin
e
pa
rtic
les
To
tal
ph
osp
ho
rus
To
tal
nit
rog
en
Hyd
roc
arb
on
s, m
oto
r fu
els
, o
ils
an
d g
rea
se
Low Density Residential
N Y Y Y Y N
High Density Residential
N Y Y Y Y ?
Commercial, Shopping & Retail Outlets (excluding carparks)
Y Y Y N N N
Industrial Y Y Y ? ? Y
Fast Food Outlets and Restaurants
Y N N N N ?
Carparks, Service Stations and Wash Bays
Y Y Y Y ? Y
Key: Y – key pollutant – needs to be addressed
? – variable – requires site-specific assessment
N – not significant
The environmental objectives of the State Environmental Protection Policy (SEPP) define the required water quality conditions of urban waterways. The current Best Practice Environmental Management Guidelines (BPEMG) objectives are given in Table 2.4.
Table 2.4: Post construction BPEMG objectives
% Retention of typical urban annual load
Pollutant
TSS TP TN Litter*
Flows
BPEMG Objective 80 45 45 70 Maintain discharges for the 1.5 year ARI at pre-development levels
* Litter is defined as anthropogenic material larger than five millimetres
Mildura Rural City Council Water Sensitive Urban Design Guidelines
PARSONS BRINCKERHOFF 2127021A 001 RPT 0002 C0 MM: amc M05249 Page 13
3. WSUD measures and application
3.1 WSUD measures
This section provides general information on various WSUD measures in terms of their application, limitations, pollutant removal efficiency and construction issues, to enable designers, engineers and planners to better understand the function of each WSUD measure and its role in the treatment train. The WSUD measures discussed in this section and for which design specifications have been prepared are:
Bioretention Swales
Bioretention Basins
Sand Filters
Vegetated Swales / Filter Strips
Constructed Wetlands
Rainwater Tanks.
The WSUD measures listed were chosen as they represent the key fundamental WSUD measures that are currently used in best management WSUD practices in both building and sub-division designs within the Mildura region. Other treatment techniques will be considered in the appropriate context with sufficient information to prove the long term viability of the treatment system.
Primary treatment WSUD measures, such as litter traps and gross pollutant traps (GPTs), have not been included in this document, as there are numerous proprietary manufactured devices that are currently available that provide detailed technical design manuals and guidelines. If further information is required on the design and selection of appropriate traps, refer to EPA (1997) and WBM (2003).
3.2 Relationship between WSUD measures
WSUD treatment measures can be grouped into three main categories:
Primary
Secondary
Tertiary.
The definition of these categories are provided in the Victorian Stormwater Committee: Urban Stormwater – Best Practice Environmental Management Guidelines, (Victorian Stormwater Committee, 1999) and typical WSUD measures appropriate to each category for Mildura are summarised in Table 3.1 below
Mildura Rural City Council Water Sensitive Urban Design Guidelines
PARSONS BRINCKERHOFF 2127021A 001 RPT 0002 C0 MM: amc M05249 Page 14
Table 3.1: WSUD Treatment Categories
Category Definition Typical Pollutant Treatment
Typical WSUD Measures
Primary Physical screening or rapid sedimentation techniques
Gross pollutants and litter, coarse sediments, free oil/grease
Gross pollutant traps (GPT’s), sediment traps, oil/grit separators
Secondary Finer particle sedimentation and filtration techniques
Fine particles and attached pollutants
Sand filters
Tertiary Enhanced sedimentation and filtration, biological uptake, absorption onto sediments
Nutrients and heavy metals
Constructed wetlands, bioretention systems, natural stream systems
The restoration of natural features in the hydrological system is a fundamental element of WSUD philosophy. To achieve this, a series of control measures can be incorporated into the urban hydrological system at four control levels. Table 3.2 outlines the WSUD measures that can be applied to each of the four levels.
Table 3.2: WSUD Treatment Categories for Mildura
Level Description / location Typical WSUD Measures
Source control
Individual allotment Rainwater tanks
Conveyance control
Street or nature strip on-line bioretention systems
Discharge control
Discharge from subdivision to Council system
Bioretention basins, sand filters, constructed wetlands, detention ponds
Natural systems
Receiving streams, lakes or rivers
Natural water courses, creeks, floodplains, wetlands and vegetation
Due to the sensitive environments to which drainage flows discharge, the use of natural systems to treat stormwater runoff is not recommended. Other treatments exist within each of the four control levels that are considered not appropriate for the Mildura environment.
If detention basins are to be incorporated into the stormwater system for a subdivision then treatments which can be included in this function or that can reduce the size of the basin should be considered. The reduction of detention basin size with an improved stormwater quality discharge is beneficial to the developer as well as the MRCC.
3.3 Description of WSUD measures and implementation issues
Each section below reflects Chapter 3 of the Melbourne Water Draft WSUD Engineering Procedures dated June 2004. They should be read in conjunction with the Melbourne Water procedures and other relevant documents.

Mildura Rural City Council Water Sensitive Urban Design Guidelines
PARSONS BRINCKERHOFF 2127021A 001 RPT 0002 C0 MM: amc M05249 Page 15
Users of this manual should make themselves aware of the design procedures involved with each of the WSUD elements and to ensure they consider the advantages and disadvantages between different elements in the Mildura region.
The discussion below outlines the relevant merits of the recommended systems for the Mildura Region..
3.3.1 Bioretention swales
Bioretention swales (or biofiltration trenches) are bioretention systems that are located within the base of a swale. They can provide efficient treatment of stormwater through fine filtration, extended detention and some biological uptake as well as providing a conveyance functions (along the swale). They also provide some flow retardation for frequent rainfall events and are particularly efficient at removing nitrogen and other soluble or fine particulate contaminants.
Bioretention swales can form attractive streetscapes and provide landscape features in an urban development. They are commonly located in the median strip of divided roads.
Runoff is filtered through a fine media layer as it percolates downwards. It is then collected via perforated pipes and flows to downstream waterways or to storages for reuse. Unlike infiltration systems, bioretention systems are well suited to a wide range of soil conditions including areas affected by soil salinity and saline groundwater as their operation is generally designed with impermeable layers to eliminate the likelihood of stormwater exfiltration from the filtration trench to surrounding soils.
In Mildura and surrounding areas the construction of such swales would assist in the reduction of nutrients entering receiving waterways. The limitations on constructing such systems relate to the initial installation and maintenance with possible degradation due to wind blown or washed sediment smothering plant life and filters during the establishment of houses in the subdivisions.
Vegetation that grows in the filter media enhances its function by preventing erosion of the filter medium, continuously breaking up the soil through plant growth to prevent clogging of the system and providing biofilms on plant roots that pollutants can adsorb to. The type of vegetation varies depending on landscape requirements and climatic conditions. The filtration process generally improves with denser and higher vegetation.
With low annual rainfall in Mildura watering of plants would be required during establishment.
Some thought is required during the masterplanning of subdivisions to reduce or eliminate driveway crossings of the swales. Although they can be accommodated within the swale the added maintenance and debris collection can become and eye sore.
Education of residents within the subdivision is required to ensure that activities do not damage the swale structure.
Mildura Rural City Council Water Sensitive Urban Design Guidelines
PARSONS BRINCKERHOFF 2127021A 001 RPT 0002 C0 MM: amc M05249 Page 16
3.3.2 Bioretention basins
Bioretention basins operate with the same treatment processes as bioretention swales except do not have a conveyance function. High flows are either diverted away from a basin or are discharged into an overflow structure.
Like bioretention swales, bioretention basins can provide efficient treatment of stormwater through fine filtration, extended detention and some biological uptake, particularly for nitrogen and other soluble or fine particulate contaminants.
Bioretention basins have an advantage of being applicable at a range of scales and shapes and can therefore have flexibility for locations within a development. They can be located along streets at regular intervals and treat runoff prior to entry into an underground drainage system, or be located at outfalls of a drainage system to provide treatment for much larger areas (eg. in the base of retarding basins).
A wide range of vegetation can be used within a bioretention basin, allowing them to be well integrated into a landscape theme of an area. Smaller systems can be integrated with traffic calming measures or parking bays, reducing their requirement for space. They are equally applicable to redevelopment as well as greenfield sites.
As with bioretention swales the establishment of vegetation is critical to ensure long term viability. The limiting of sediment loads to the basins is critical to ensure smothering of filters do not occur.
3.3.3 Sand filters
Sand filters operate in a similar manner to bioretention systems with the exception that they have no vegetation growing on their surface. This is because they are either installed underground (therefore light limits vegetation growth) or the filter media does not retain sufficient moisture. They are particularly useful in areas where space is a premium and treatment is best achieved underground. Due to the absence of vegetation, they require regular maintenance to ensure the surface of the sand filter media remains porous and does not become clogged with accumulated sediments.
Prior to entering a sand filter, flows are generally subjected to a pretreatment to remove litter, debris and coarse sediments (typically a sedimentation chamber). Following pretreatment, flows are spread over the sand filtration media and water percolates downwards to perforated pipes located at the base of the sand media. The perforated pipes collected treated water for conveyance downstream. During higher flows, water can pond of the surface of the sand filter increasing the volume of water that can be treated. Very high flows are diverted around sand filters to protect the sand media from scour.
The absence of vegetation allows the filter to work in low rainfall areas such as Mildura. The maintenance required to ensure surface remains porous is critical to the success of the treatment system.
A sand filter may be incorporated into the base of a retarding basin with appropriate flow diversion structures to direct treatable flows through the filter and to direct major flows away from the filter into the basin.
Mildura Rural City Council Water Sensitive Urban Design Guidelines
PARSONS BRINCKERHOFF 2127021A 001 RPT 0002 C0 MM: amc M05249 Page 17
3.3.4 Vegetated swales / filter strips
Vegetated swales are used to convey stormwater in lieu of pipes and provide a desirable ‘buffer’ to the receiving water (eg. creek, wetland) from impervious areas of a catchment. They use overland flows and mild slopes to slowly convey water downstream. The interaction with vegetation promotes an even distribution and slowing of flows thus encouraging coarse sediments to be retained. Swales can be incorporated in urban designs along streets or parklands and add to the aesthetic character of an area.
The longitudinal slope of a swale is the most important consideration. They generally operate best with slopes of 2% to 4%. Milder sloped swales can tend to become waterlogged and have stagnant ponding, although the use of underdrains can alleviate this problem. For slopes steeper than 4%, check banks along swales can help to distribute flows evenly across swales as well as slow velocities. Dense vegetation and drop structures can be used to serve the same function as check dams but care needs to be exercised to ensure that velocities are not excessively high.
Swales can use a variety of vegetation types. Vegetation is required to cover the whole width of a swale, be capable of withstanding design flows and be of sufficient density to provide good filtration. For best treatment performance, vegetation height should be above treatment flow water levels. If runoff enters directly into a swale, perpendicular to the main flow direction, the edge of the swale acts as a buffer and provides pre-treatment for the water entering the swale.
The limitations on installing vegetated swales are per the bioretention trenches as a lot of the same issues apply. Short vegetated swales could be used in low density residential areas to treat individual allotment runoff.
3.3.5 Constructed wetlands
Constructed wetland systems are typically shallow extensively vegetated water bodies that use enhanced sedimentation, fine filtration and pollutant uptake processes to remove pollutants from stormwater. Water levels rise during rainfall events and outlets are configured to slowly release flows, typically over three days, back to dry weather water levels. Wetlands generally consist of an inlet zone (sediment basin to remove coarse sediments), a macrophyte zone (a shallow heavily vegetated area to remove fine particulates and uptake of soluble pollutants) and a high flow bypass channel (to protect the macrophyte zone).
Wetland processes are engaged by slowly passing runoff through heavily vegetated areas. Plants filter sediments and pollutants from the water and biofilms that grow on the plants can absorb nutrients and other associated contaminants. In addition to playing an important role in stormwater treatment, wetlands can also have significant community benefits. They provide habitat for wildlife and a focus for recreation, such as walking paths and resting areas. They can also improve the aesthetics of a development and be a central feature in a landscape.
Wetlands can be constructed on many scales, from house block scale to large regional systems. In highly urban areas they can have a hard edge form and be part of a
Mildura Rural City Council Water Sensitive Urban Design Guidelines
PARSONS BRINCKERHOFF 2127021A 001 RPT 0002 C0 MM: amc M05249 Page 18
streetscape or forecourts of buildings. In regional settings they can be over 10 hectares in size and provide significant habitat for wildlife
Special consideration is required in the Mildura region when constructing wetlands with permanent pool volumes due to the high amount of evaporation that can result in the wetland drying out for extended periods of time. Constructed ephemeral wetlands have a minimal amount of permanent water and may drain completely following a rainfall event. Naturally occurring ephemeral wetlands are quite common in the Mallee region, such as King’s Billabong, Mildura. The correct selection of ephemeral wetland plant species is crucial to ensure successful wetland establishment.
The construction of wetlands also requires attention to the groundwater table as inflows of saline water may affect the long term viability of a wetland. Conversely the wetland has to be designed to exclude stormwater from infiltrating into the groundwater system. The cost and special design of wetlands lends them to be used on larger scale drainage schemes such as the Sixteenth Street Drain.
Wetlands are more likely to be sustainable in areas where there is the likelihood of inflows from irrigation areas either through outfalls from the supply system or relatively good quality drainage water. This will assist in replacing water lost due to evaporation in the wetland area.
3.3.6 Rainwater tanks
Rainwater tanks collect runoff from roof areas for subsequent reuse. In addition, they can provide a flood retardation function provided adequate temporary storage is available either through appropriate sizing (eg small tanks that are drawn down frequently can offer significant retention of roof runoff) or through temporary detention storage.
There are many forms of rainwater tanks available. They can be incorporated into building designs so they do not impact on the aesthetics of a development. They can also be located underground or some newer designs incorporate tanks into fence or wall elements or as part of a gutter system itself.
To improve the quality of the stored water, tanks can be fitted with ‘first flush diverters’. These are simple mechanical devices that divert the first portion of runoff volume (that typically carries debris) away from the tank. After the first flush diversion, water passes directly into the tank.
Collected roof water is suitable for direct use for garden irrigation or toilet flushing with no additional treatment. Tank water can also be used in hot water systems, although some additional treatment may be required to reduce the risk of pathogen depending on the design of the system. This generally involves UV disinfection and ensuring that a hot water service maintains a temperature of at least 60 degrees.
Tanks are generally sized for the demand they are intended for. For example, if tank water is intended to be used for toilet flushing and hot water systems, a desired level of reliability can be achieved with the selection of an appropriated sized tank given a site’s rainfall pattern and the area of roof draining to the tank. In most cases, where potable water is available, a connection to potable water supplies is recommended to ensure a high degree of reliability and provide a secondary source of supply.

Mildura Rural City Council Water Sensitive Urban Design Guidelines
PARSONS BRINCKERHOFF 2127021A 001 RPT 0002 C0 MM: amc M05249 Page 19
Although the use of rainwater tanks is a viable WSUD design technique the uptake and maintenance is left to the individual householder, which can mean that a subdivision has infrastructure designed to suit tanks being installed. Later when houses are constructed on the subdivision the tanks may be omitted or not connected eliminating the benefits of the tanks. Tanks may also not be installed in allotments due to the space required.
Mildura Rural City Council Water Sensitive Urban Design Guidelines
PARSONS BRINCKERHOFF 2127021A 001 RPT 0002 C0 MM: amc M05249 Page 20
4. WSUD planning and selection guide
4.1 WSUD planning process
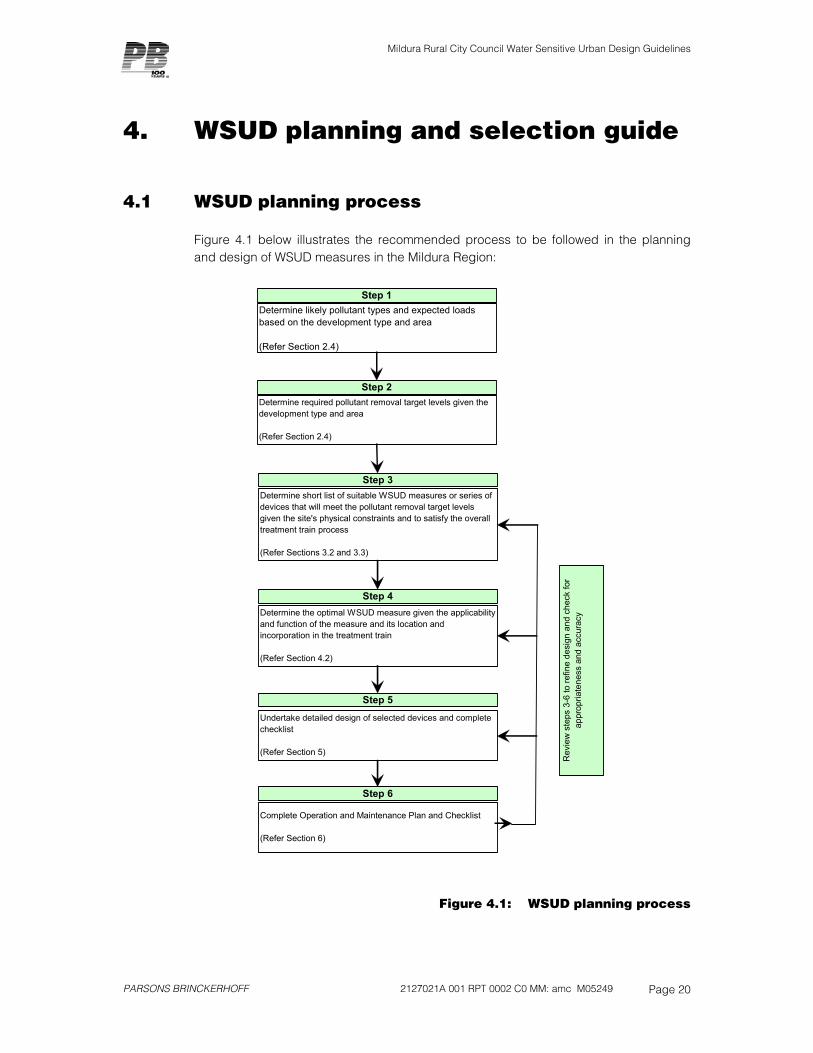
Figure 4.1 below illustrates the recommended process to be followed in the planning and design of WSUD measures in the Mildura Region:
Step 1Determine likely pollutant types and expected loads based on the development type and area
(Refer Section 2.4)
Determine required pollutant removal target levels given the development type and area
(Refer Section 2.4)
Step 2
Step 3Determine short list of suitable WSUD measures or series of devices that will meet the pollutant removal target levels given the site's physical constraints and to satisfy the overall treatment train process
(Refer Sections 3.2 and 3.3)
Step 4Determine the optimal WSUD measure given the applicability and function of the measure and its location and incorporation in the treatment train
(Refer Section 4.2)
Step 5
Undertake detailed design of selected devices and complete checklist
(Refer Section 5)
Step 6
Complete Operation and Maintenance Plan and Checklist
(Refer Section 6)
Rev
iew
ste
ps 3
-6 to
refin
e de
sign
and
che
ck fo
r ap
prop
riate
ness
and
acc
urac
y
Figure 4.1: WSUD planning process

Mildura Rural City Council Water Sensitive Urban Design Guidelines
PARSONS BRINCKERHOFF 2127021A 001 RPT 0002 C0 MM: amc M05249 Page 21
Step 1
The pollutant types for a particular land use can be determined from Table 2.3. The determination of expected pollutant loads is based on the level of detail being undertaken in the analysis. Section 5.2 details the Design Process based on the size of the development.
For single or small developments the treatment facility can be sized using adjustment factors in Table 2.1 of Melbourne Water’s WSUD Engineering Procedures: Stormwater. No estimate of pollutant loads is required for this design method.
For larger developments Section 5.2 recommends the use of the design nomographs in Section 5.3 to 5.7. No estimate of pollutant loads is required for this design method however the designer needs to determine the impervious catchment area. If further optimisation of the treatment facility is required the Model for Urban Stormwater Improvement Conceptualisation (MUSIC) can be adopted. MUSIC is used to determine expected loads from development areas. Section 5.2.1 outlines the recommended input values for MUSIC.
Step 2
The required pollutant removal target levels will be agreed with Council. In most instances the target levels will be the Best Practice Environmental Management Guidelines objectives as outlined in Section 2.4.1. Council may reduce these objectives for brownfield developments or developments where significant retrofit of stormwater treatment facilities would be required.
Steps 3-6
The type of stormwater pollutant treatment device will be governed by economics, site constraints, aesthetics, safety requirements, buildability and maintenance access. The adopted stormwater treatment facility will best satisfy each of these requirements. The design checklists for the design (Step 5) and operation and maintenance (Step 6) are published in Melbourne Water’s WSUD Engineering Procedures: Stormwater.
4.2 Applicability and function of WSUD measures
Prior to selecting the WSUD measures it is important to recognise the scale of the application and the primary role of the measure. Table 4.1 outlines the treatment scale of each of the applicable WSUD measures as well as the performance of the treatment based on water quality and flow attenuation.
Table 4.1: WSUD treatment applicability and performance
WSUD MeasureAllotment Subdivision Regional Water Quality Flow Attenuation
Bioretention Swales HIGH MEDIUMBioretention Basins HIGH MEDIUMSand Filters HIGH MEDIUMVegetated Swales / Filter Strips HIGH MEDIUMConstructed Wetlands HIGH HIGHRainwater Tanks LOW HIGH
Application Scale of Treatment Performance of Treatment
Mildura Rural City Council Water Sensitive Urban Design Guidelines
PARSONS BRINCKERHOFF 2127021A 001 RPT 0002 C0 MM: amc M05249 Page 22
The above table indicates that only rainwater tanks are restricted to use on the allotment scale. It also shows that secondary treatment of rainwater caught in tanks may be required to achieve the BPEMG water quality objectives. Further treatment of rainwater may also be required if the rainwater is to be used for domestic purposes (see Section 5.8).
The table also shows other systems that can be applied on an allotment scale. With the installation of allotment scale only treatments in a subdivision the onus for operation and maintenance is placed onto the landholder. Any allotment scale treatments require education of residents on the treatment to ensure the ongoing effectiveness is maintained. Any WSUD Measure should also take into account the implementation issues outlined in Section 3.3
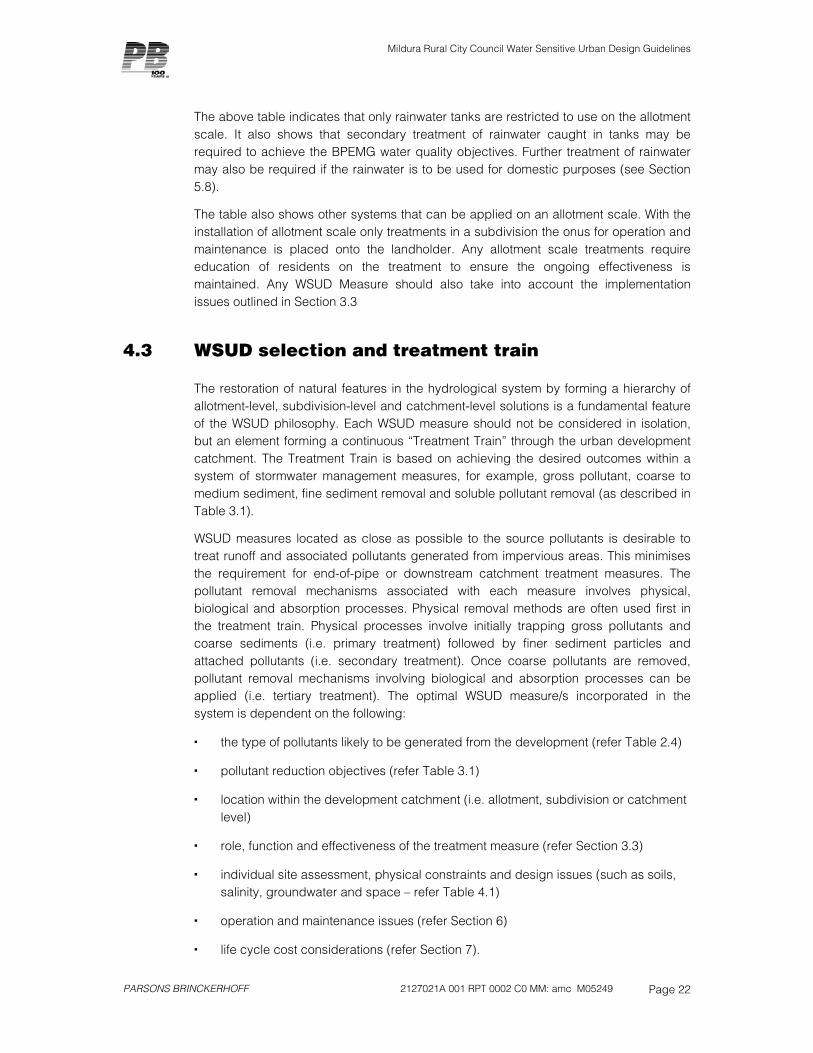
4.3 WSUD selection and treatment train
The restoration of natural features in the hydrological system by forming a hierarchy of allotment-level, subdivision-level and catchment-level solutions is a fundamental feature of the WSUD philosophy. Each WSUD measure should not be considered in isolation, but an element forming a continuous “Treatment Train” through the urban development catchment. The Treatment Train is based on achieving the desired outcomes within a system of stormwater management measures, for example, gross pollutant, coarse to medium sediment, fine sediment removal and soluble pollutant removal (as described in Table 3.1).
WSUD measures located as close as possible to the source pollutants is desirable to treat runoff and associated pollutants generated from impervious areas. This minimises the requirement for end-of-pipe or downstream catchment treatment measures. The pollutant removal mechanisms associated with each measure involves physical, biological and absorption processes. Physical removal methods are often used first in the treatment train. Physical processes involve initially trapping gross pollutants and coarse sediments (i.e. primary treatment) followed by finer sediment particles and attached pollutants (i.e. secondary treatment). Once coarse pollutants are removed, pollutant removal mechanisms involving biological and absorption processes can be applied (i.e. tertiary treatment). The optimal WSUD measure/s incorporated in the system is dependent on the following:
the type of pollutants likely to be generated from the development (refer Table 2.4)
pollutant reduction objectives (refer Table 3.1)
location within the development catchment (i.e. allotment, subdivision or catchment level)
role, function and effectiveness of the treatment measure (refer Section 3.3)
individual site assessment, physical constraints and design issues (such as soils, salinity, groundwater and space – refer Table 4.1)
operation and maintenance issues (refer Section 6)
life cycle cost considerations (refer Section 7).
Mildura Rural City Council Water Sensitive Urban Design Guidelines
PARSONS BRINCKERHOFF 2127021A 001 RPT 0002 C0 MM: amc M05249 Page 23
5. WSUD design specifications
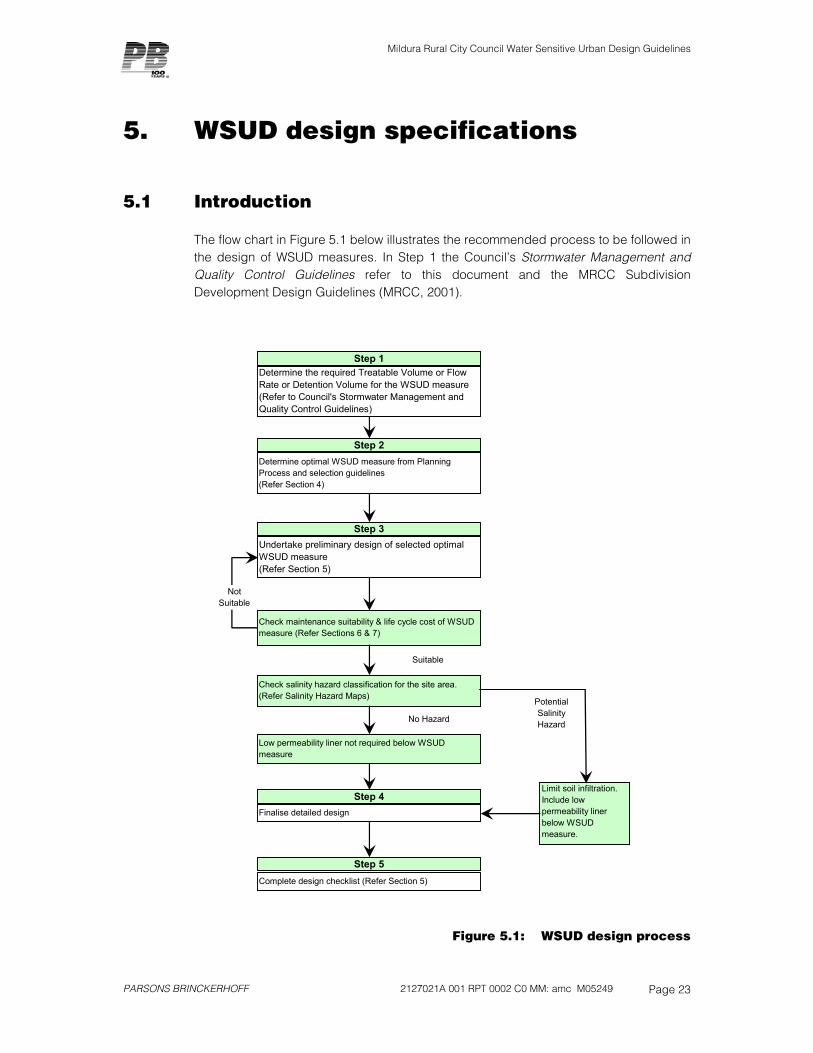
5.1 Introduction
The flow chart in Figure 5.1 below illustrates the recommended process to be followed in the design of WSUD measures. In Step 1 the Council’s Stormwater Management and Quality Control Guidelines refer to this document and the MRCC Subdivision Development Design Guidelines (MRCC, 2001).
Step 1Determine the required Treatable Volume or Flow Rate or Detention Volume for the WSUD measure (Refer to Council's Stormwater Management and Quality Control Guidelines)
Determine optimal WSUD measure from Planning Process and selection guidelines(Refer Section 4)
Step 2
Step 3Undertake preliminary design of selected optimal WSUD measure(Refer Section 5)
Check maintenance suitability & life cycle cost of WSUD measure (Refer Sections 6 & 7)
Check salinity hazard classification for the site area.(Refer Salinity Hazard Maps)
Step 4
Low permeability liner not required below WSUD measure
Finalise detailed design
Step 5Complete design checklist (Refer Section 5)
Limit soil infiltration. Include low permeability liner below WSUD measure.
Suitable
No Hazard
Potential Salinity Hazard
Not Suitable
Figure 5.1: WSUD design process

Mildura Rural City Council Water Sensitive Urban Design Guidelines
PARSONS BRINCKERHOFF 2127021A 001 RPT 0002 C0 MM: amc M05249 Page 24
5.2 Design process
This chapter has to be read in conjunction with the Melbourne Water WSUD Engineering Procedures document. The discussion in each of the following sections outlines what modifications are required for each WSUD Measure to adapt them for use in the Mildura Region.
The Melbourne Water document includes worked examples of each of the measures to assist the designer in establishing the level of detail required.
The Melbourne Water WSUD Engineering Procedures document identifies hydrologic regions to enable WSUD treatment facilities sized for Melbourne to be factored for use in other regions. The factors are applicable for small development projects (single or small clustered allotment development type). Table 2.1 of the Melbourne Water WSUD Engineering Procedures document lists the Northern adjustment factors applicable for Mildura. It is recommended that these relationships be used for the purpose of sizing treatment facilities for small projects.
For larger projects it is recommended that the design nomographs in Section 5.3 to 5.7 be used or site specific water quality models are developed. The design nomographs in Section 5.3 to 5.7 have been derived using set parameter values in the Model for Urban Stormwater Improvement Conceptualisation (MUSIC). The treatment facility designed using the nomographs will only conform to the pollutant removal performance stated if all parameter values in the derivation of the nomographs are adopted in detailed design. Further optimisation of the treatment facility can be undertaken by water quality modelling. MUSIC is the recommended water quality model to simulate the pollutant removal capabilities of treatment facilities.
5.2.1 MUSIC design process
Melbourne Water has produced a document entitled MUSIC Input Parameters. This document provides advice to practitioners on the appropriate input data for use when simulating stormwater treatment facilities in MUSIC. To avoid the use of large sets of rainfall data, Melbourne Water has identified an appropriate reference year for 10 gauging stations across Melbourne. This reference year is the closest fit to the average rainfall. Monthly evapotranspiration (ET) has also been provided for each of the 10 reference sites. A similar analysis has been undertaken by Parsons Brinckerhoff for Mildura. The results of the analysis are described in Appendix A.
The climatic data in Appendix A has been used in MUSIC to derive the design nomographs in Section 5.3 to 5.7.
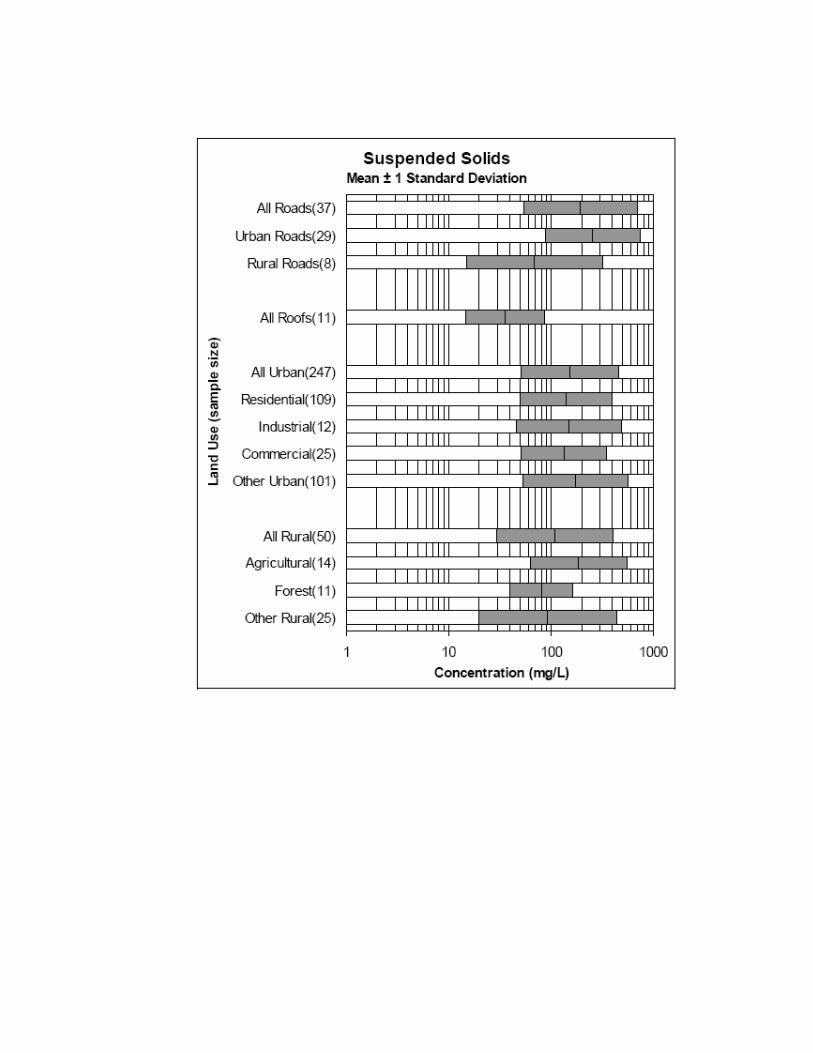
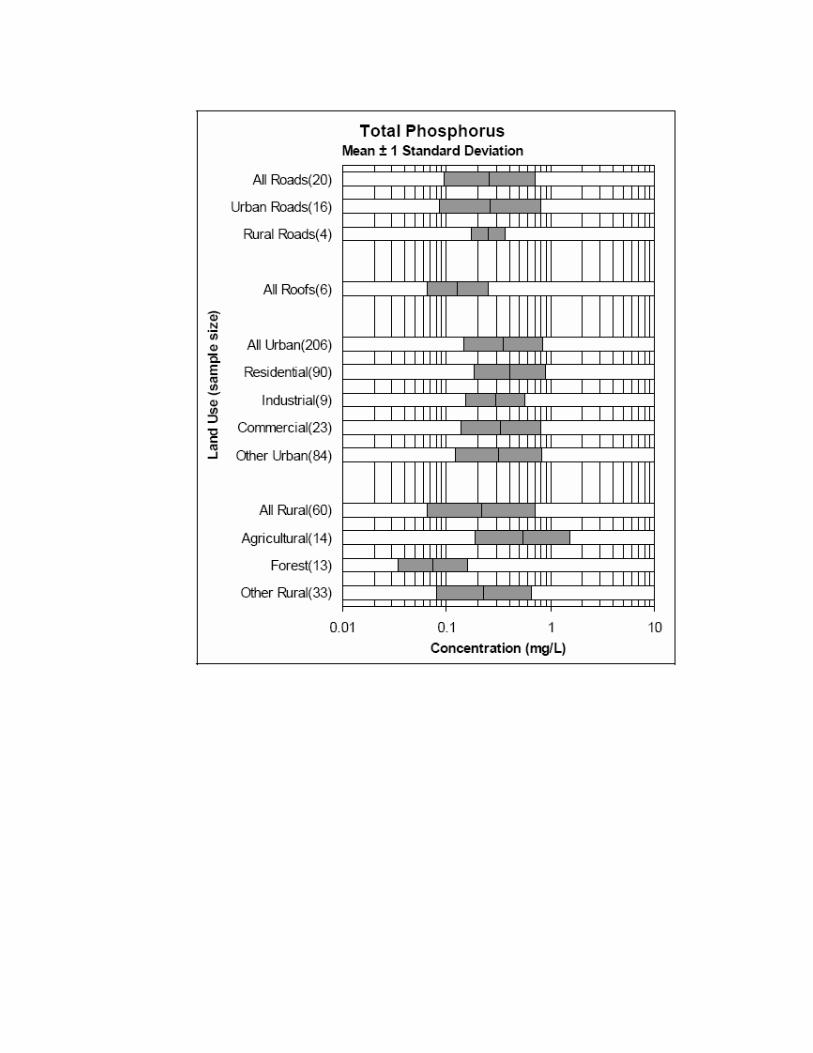
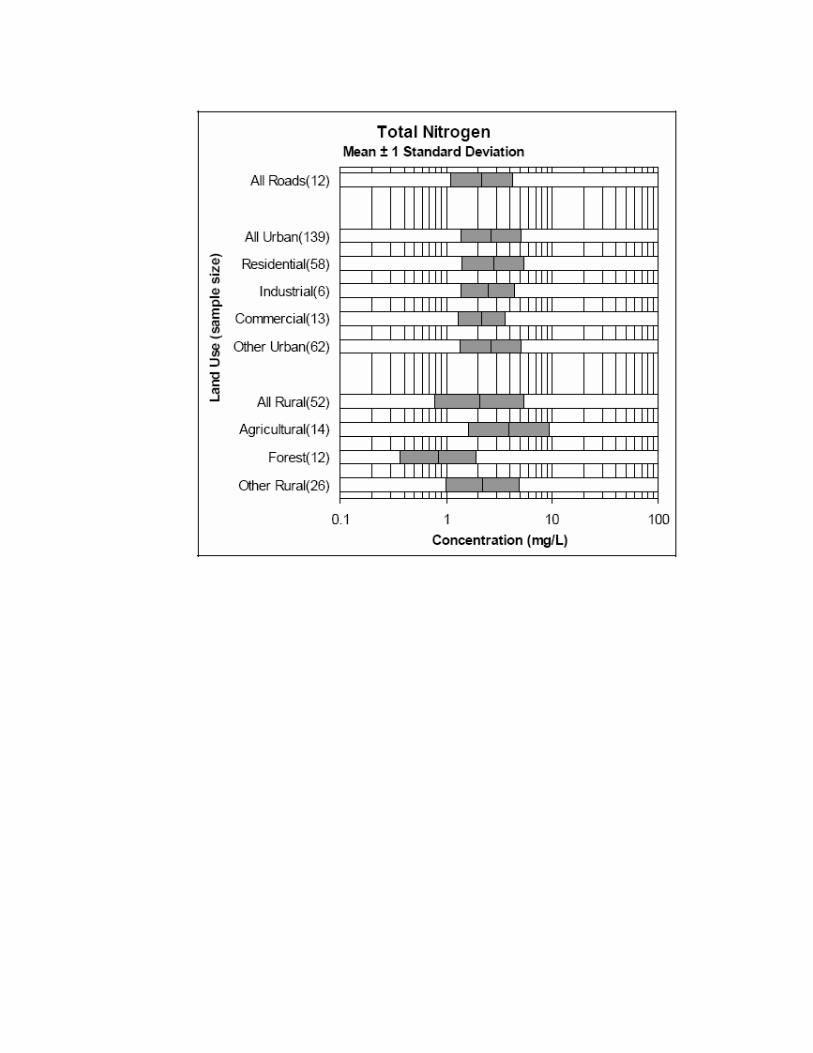
The fraction impervious for different land uses is tabulated in Appendix B.
Stochastically generated data are recommended in MUSIC. In the absence of recorded data the mean and standard deviation of pollutant concentrations for different land uses can be determined from information provided in Appendix B (after Duncan, 1999).
Mildura Rural City Council Water Sensitive Urban Design Guidelines
PARSONS BRINCKERHOFF 2127021A 001 RPT 0002 C0 MM: amc M05249 Page 25
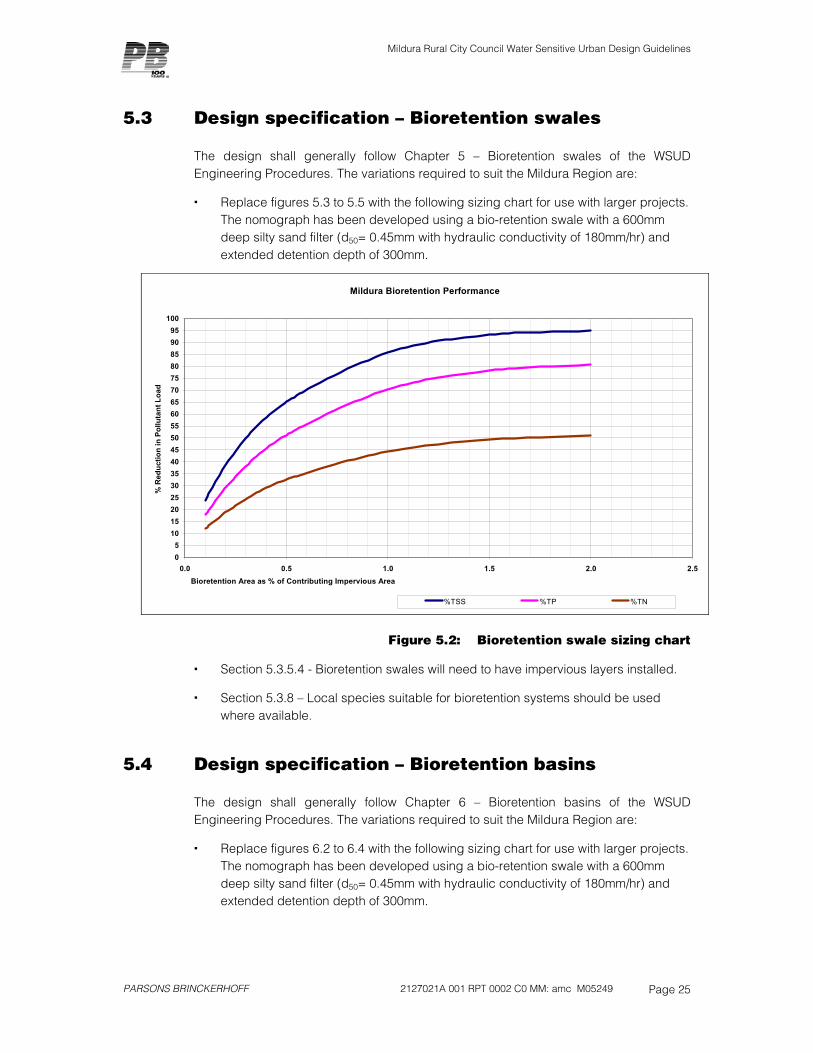
5.3 Design specification – Bioretention swales
The design shall generally follow Chapter 5 – Bioretention swales of the WSUD Engineering Procedures. The variations required to suit the Mildura Region are:
Replace figures 5.3 to 5.5 with the following sizing chart for use with larger projects. The nomograph has been developed using a bio-retention swale with a 600mm deep silty sand filter (d50= 0.45mm with hydraulic conductivity of 180mm/hr) and extended detention depth of 300mm.
Mildura Bioretention Performance
05
101520253035404550556065707580859095
100
0.0 0.5 1.0 1.5 2.0 2.5Bioretention Area as % of Contributing Impervious Area
% R
educ
tion
in P
ollu
tant
Loa
d
%TSS %TP %TN
Figure 5.2: Bioretention swale sizing chart
Section 5.3.5.4 - Bioretention swales will need to have impervious layers installed.
Section 5.3.8 – Local species suitable for bioretention systems should be used where available.
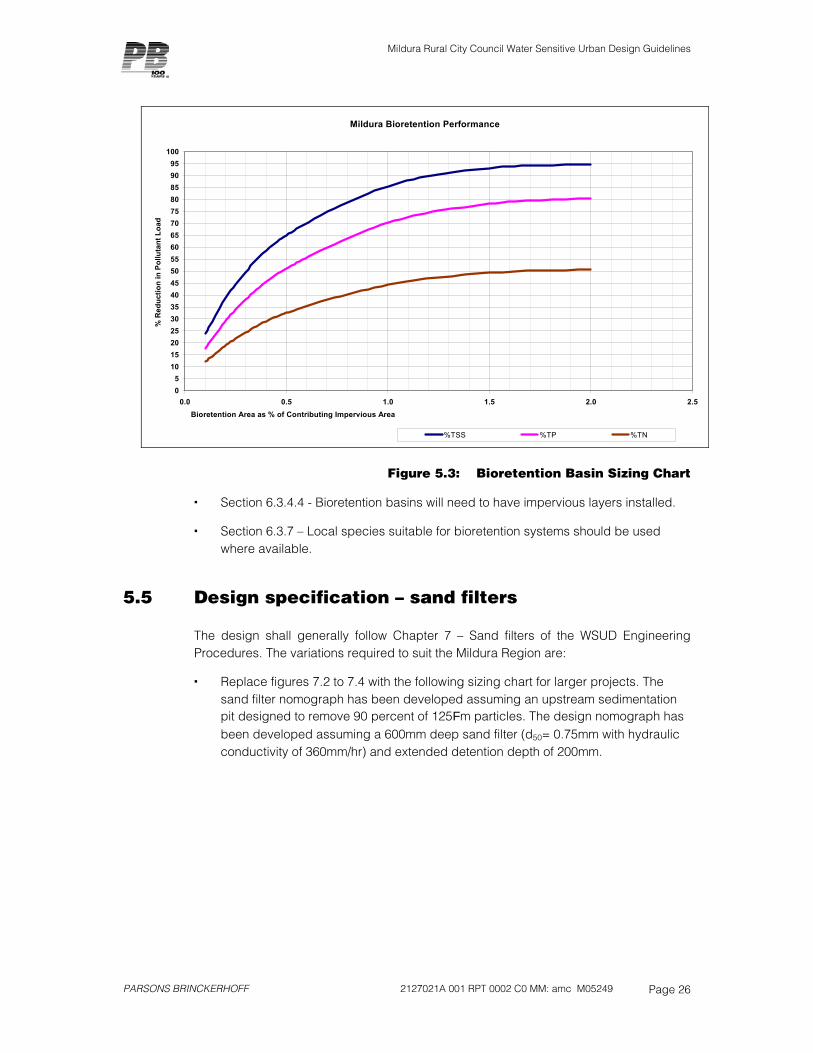
5.4 Design specification – Bioretention basins
The design shall generally follow Chapter 6 – Bioretention basins of the WSUD Engineering Procedures. The variations required to suit the Mildura Region are:
Replace figures 6.2 to 6.4 with the following sizing chart for use with larger projects. The nomograph has been developed using a bio-retention swale with a 600mm deep silty sand filter (d50= 0.45mm with hydraulic conductivity of 180mm/hr) and extended detention depth of 300mm.
Mildura Rural City Council Water Sensitive Urban Design Guidelines
PARSONS BRINCKERHOFF 2127021A 001 RPT 0002 C0 MM: amc M05249 Page 26
Mildura Bioretention Performance
05
101520253035404550556065707580859095
100
0.0 0.5 1.0 1.5 2.0 2.5Bioretention Area as % of Contributing Impervious Area
% R
educ
tion
in P
ollu
tant
Loa
d
%TSS %TP %TN
Figure 5.3: Bioretention Basin Sizing Chart
Section 6.3.4.4 - Bioretention basins will need to have impervious layers installed.
Section 6.3.7 – Local species suitable for bioretention systems should be used where available.
5.5 Design specification – sand filters
The design shall generally follow Chapter 7 – Sand filters of the WSUD Engineering Procedures. The variations required to suit the Mildura Region are:
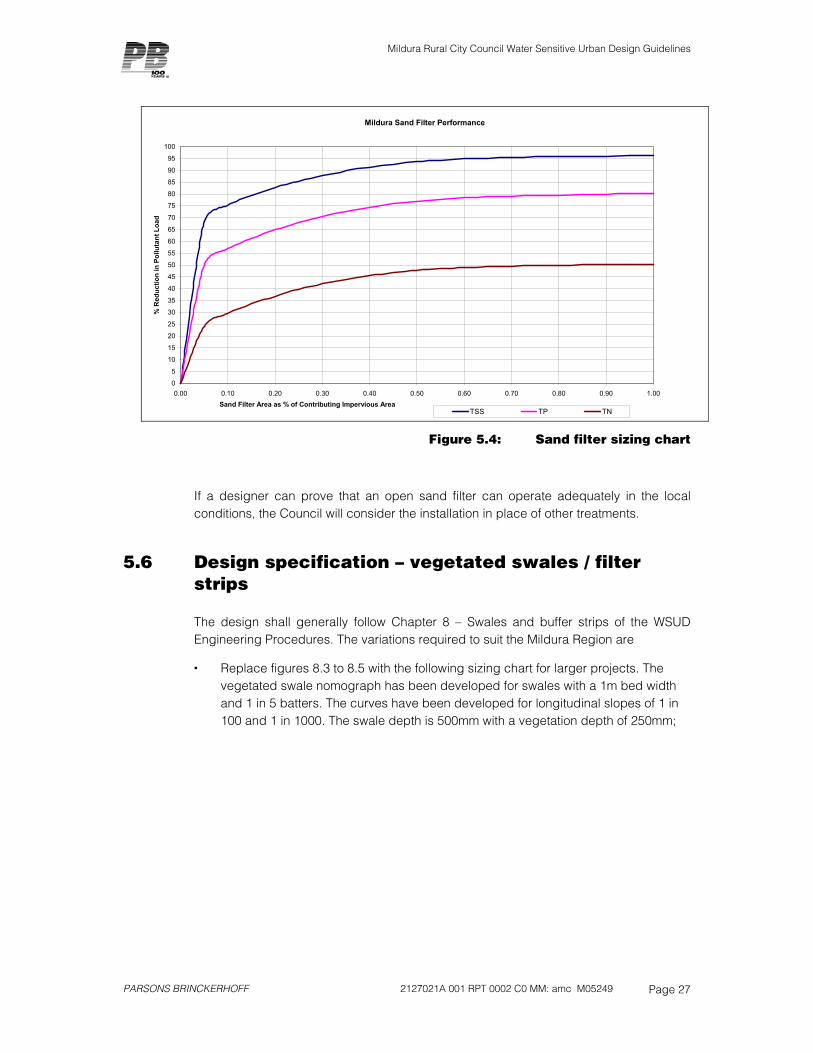
Replace figures 7.2 to 7.4 with the following sizing chart for larger projects. The sand filter nomograph has been developed assuming an upstream sedimentation pit designed to remove 90 percent of 125Fm particles. The design nomograph has been developed assuming a 600mm deep sand filter (d50= 0.75mm with hydraulic conductivity of 360mm/hr) and extended detention depth of 200mm.
Mildura Rural City Council Water Sensitive Urban Design Guidelines
PARSONS BRINCKERHOFF 2127021A 001 RPT 0002 C0 MM: amc M05249 Page 27
Mildura Sand Filter Performance
0
5
10
15
20
25
30
35
40
45
50
55
60
65
70
75
80
85
90
95
100
0.00 0.10 0.20 0.30 0.40 0.50 0.60 0.70 0.80 0.90 1.00Sand Filter Area as % of Contributing Impervious Area
% R
educ
tion
in P
ollu
tant
Loa
d
TSS TP TN
Figure 5.4: Sand filter sizing chart
If a designer can prove that an open sand filter can operate adequately in the local conditions, the Council will consider the installation in place of other treatments.
5.6 Design specification – vegetated swales / filter strips
The design shall generally follow Chapter 8 – Swales and buffer strips of the WSUD Engineering Procedures. The variations required to suit the Mildura Region are
Replace figures 8.3 to 8.5 with the following sizing chart for larger projects. The vegetated swale nomograph has been developed for swales with a 1m bed width and 1 in 5 batters. The curves have been developed for longitudinal slopes of 1 in 100 and 1 in 1000. The swale depth is 500mm with a vegetation depth of 250mm;

Mildura Rural City Council Water Sensitive Urban Design Guidelines
PARSONS BRINCKERHOFF 2127021A 001 RPT 0002 C0 MM: amc M05249 Page 28
Mildura Swale Performance
05
101520253035404550556065707580859095
100
0 0.5 1 1.5 2 2.5 3 3.5 4
Swale Area as % of Contributing Impervious Area
% R
educ
tion
in P
ollu
tant
Loa
d
%TSS(slope 1 in 100) %TP(slope 1 in 100)
%TN(slope 1 in 100) %TSS(slope 1 in 1000)
%TP(slope 1 in 1000) %TN(slope 1 in 1000)
Figure 5.5: Vegetated swale sizing chart
5.7 Design specification – constructed wetlands
The design shall generally follow Chapter 9 – Constructed wetlands of the WSUD Engineering Procedures. The variations required to suit the Mildura Region are
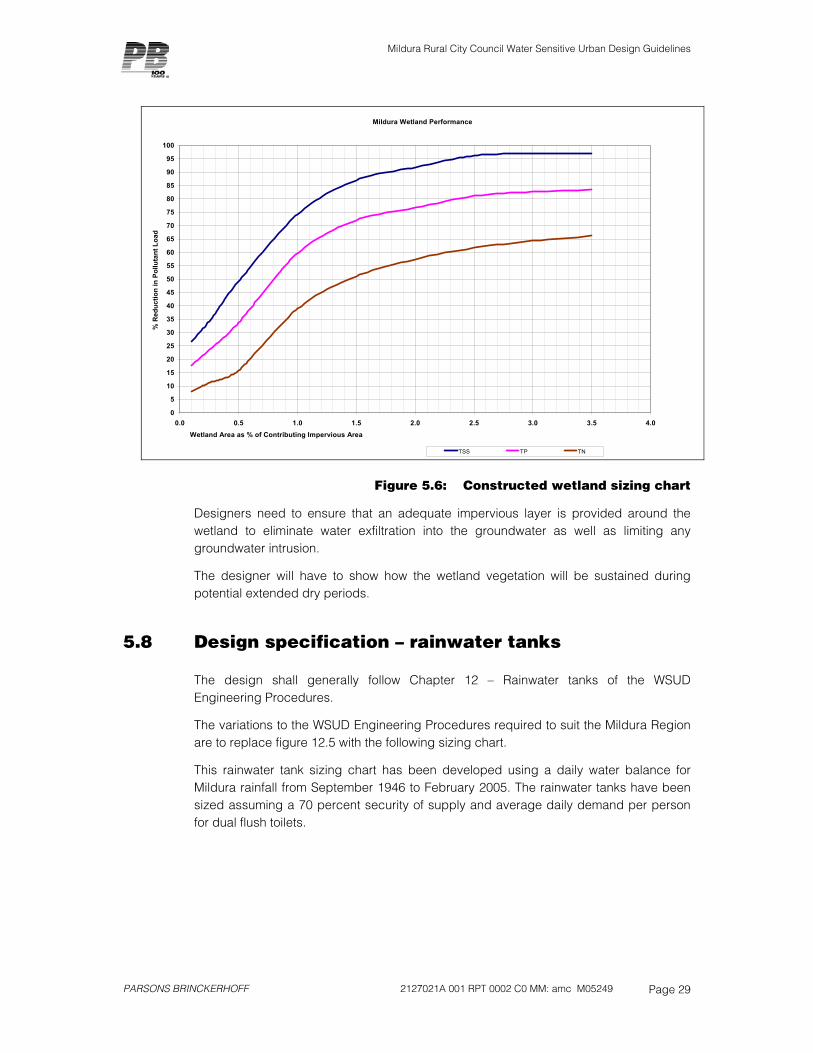
Replace Figure 9.1 with the following sizing chart. The wetland nomograph was developed for a wetland with an extended detention depth of 500mm, a permanent pool volume equal to 300mm over the total wetland area, and a notional detention time of 72 hours.
Mildura Rural City Council Water Sensitive Urban Design Guidelines
PARSONS BRINCKERHOFF 2127021A 001 RPT 0002 C0 MM: amc M05249 Page 29
Mildura Wetland Performance
0
5
10
15
20
25
30
35
40
45
50
55
60
65
70
75
80
85
90
95
100
0.0 0.5 1.0 1.5 2.0 2.5 3.0 3.5 4.0Wetland Area as % of Contributing Impervious Area
% R
educ
tion
in P
ollu
tant
Loa
d
TSS TP TN
Figure 5.6: Constructed wetland sizing chart
Designers need to ensure that an adequate impervious layer is provided around the wetland to eliminate water exfiltration into the groundwater as well as limiting any groundwater intrusion.
The designer will have to show how the wetland vegetation will be sustained during potential extended dry periods.
5.8 Design specification – rainwater tanks
The design shall generally follow Chapter 12 – Rainwater tanks of the WSUD Engineering Procedures.
The variations to the WSUD Engineering Procedures required to suit the Mildura Region are to replace figure 12.5 with the following sizing chart.
This rainwater tank sizing chart has been developed using a daily water balance for Mildura rainfall from September 1946 to February 2005. The rainwater tanks have been sized assuming a 70 percent security of supply and average daily demand per person for dual flush toilets.

Mildura Rural City Council Water Sensitive Urban Design Guidelines
PARSONS BRINCKERHOFF 2127021A 001 RPT 0002 C0 MM: amc M05249 Page 30
100 200 300 400 5001
2
3
4
00.751.52.253
3.754.55.256
6.75
Tank Size (m3)Roof Area (m2)
Occupancy
Tank Sizing for Toilet Flushing - Mildura
0-0.75 0.75-1.5
1.5-2.25 2.25-3
3.75-4.5 4.5-5.25
5.25-6 6-6.75
0.75
2.25
1.50
3.00
3.75
4.50 5.25
6.00 6.75
Figure 5.7: Rainwater tank sizing chart for toilet flushing
The above chart should be applied to determine the required tank size for a given roof area and occupancy per dwelling.
Mildura Rural City Council Water Sensitive Urban Design Guidelines
PARSONS BRINCKERHOFF 2127021A 001 RPT 0002 C0 MM: amc M05249 Page 31
6. WSUD operation and maintenance
6.1 Introduction
Melbourne Water WSUD Engineering Procedures document provides details on the maintenance requirements for each WSUD facility. Additional information for the maintenance of wetlands is available from Constructed Wetland Systems – Design Guidelines for Developers.
6.2 Operation and maintenance plan for stormwater treatment facilities
Most WSUD facilities have little or no mechanical components and accordingly the operation of the facility can be detailed on design drawings. The critical operational details to be provided on the plans include Normal Top Water Level (NTWL), plant types and densities, and the Extended Detention Depth.
An agreed Maintenance Plan between the Mildura Rural City Council and the developer is required for a period of between 12 and 24 months. Maintenance checklists for WSUD facilities are provided in Melbourne Water’s WSUD Engineering Procedures document.
A typical maintenance plan will include the following aspects:
removal of litter, debris and sediment
re-planting of vegetation and removal of weeds
structural works to repair flood damage or vandalism.
The most intensive period of maintenance is during the establishment period.
6.2.1 Facilities with vegetation
For facilities that contain vegetation water level management in the establishment period is very important. Approximately 20cm of water is generally adequate during establishment for larger species, as complete inundation restricts oxygen supply to the plant. A schedule for planting and raising levels needs to be established as part of the design plans.
Following establishment water level management is important in vegetation maintenance. An operational plan should include a water level management program that includes a drying cycle. Including a dry regime in (part of) the facility increases the diversity of plant life. Some common species, such as Typha (cumbungi), have an optimum growth environment in permanently wet conditions, and therefore varying water depth can help control invasion.
Mildura Rural City Council Water Sensitive Urban Design Guidelines
PARSONS BRINCKERHOFF 2127021A 001 RPT 0002 C0 MM: amc M05249 Page 32
Typha are quick colonisers of wetlands, in absence of strong competition, and the most effective form of control is to remove plants as soon as they are observed (Csborne 1995).
6.2.2 Facilities without vegetation
For facilities without vegetation the establishment period is also important. Often WSUD treatment facilities are constructed and operational during the continued construction or establishment of a development. The pollutant load during these times often far exceeds the design loading of the treatment facility due to construction activity, lawns still establishing and the intensive use of fertilisers.
The maintenance of the WSUD facilities during the establishment period requires monitoring of sediment build up. The monitoring of the facilities on a monthly basis (initially) enables the loading of the facilities to be determined and provides a schedule for the routine maintenance.
6.3 Rainwater tanks
The onus of maintenance for rainwater tanks typically rests with the householder. Public education regarding the routine cleaning of tanks, gutters and filters is required to ensure facilities are maintained at optimum operating level.

Mildura Rural City Council Water Sensitive Urban Design Guidelines
PARSONS BRINCKERHOFF 2127021A 001 RPT 0002 C0 MM: amc M05249 Page 33
7. Lifecycle for WSUD measures
7.1 Introduction
Life cycle costing should be considered in the design of WSUD facilities. MUSIC (version 3) released in May 2005 incorporates a life cycle costing module which is recommended for this purpose. The sections below describe critical activities for each stage of the life cycle.
7.2 Construction
During the construction period the loading on WSUD facilities is the highest for the total design life. The use of construction devices such as silt fences around development sites and silt ‘sausages’ at side entry pits prevent high pollutant loading of treatment facilities or receiving waters during construction.
7.3 Commissioning
The commissioning of treatment facilities containing vegetation requires a water level management plan and often protection of the vegetation from birds. The treatment facilities require monitoring to assess loading and requirements for routine maintenance.
7.4 During design life
The implementation of a routine maintenance schedule for the treatment facilities is paramount to ensuring the facilities have the desired design life. The primary mechanism for treatment of pollutants in the WSUD facilities described is capture. The only way to ensure optimum performance from any facility is to remove captured sediment. The loading rate of facilities will vary based on catchment type and activity. An estimate of pollutant load for a catchment can be determined from MUSIC or empirical relationships, however the best way to determine load is to continually monitor the treatment devices.
7.5 Decommissioning
Up to 70 percent of heavy metals (Lead, Cadmium) that runoff from catchments are attached to sediment. As the primary means of treatment in WSUD facilities is capture, it is recommended that soil testing be undertaken to assess any mitigation of contamination prior to facilities being decommissioned.

Mildura Rural City Council Water Sensitive Urban Design Guidelines
PARSONS BRINCKERHOFF 2127021A 001 RPT 0002 C0 MM: amc M05249 Page 34
8. References
CRCCH (2003) MUSIC User Guide Version 2.0, CRCCH
Duncan, H.P. (1999) Urban Stormwater Quality: A Statistical Overview, Report 99/3, CRCCH
Eco Eng, WBM, PB (June 2004) WSUD Engineering Procedure: Stormwater, DRAFT, Melbourne Water
Lawrence, I & Breen, P (1998) Design Guidelines: Stormwater pollution control ponds and wetlands, CRCFE
Melbourne Water (July 2003) Constructed Wetland Systems – Design Guidelines for Developers
Osborne, P.L., (1995) Operation, Monitoring and Maintenance of Constructed Wetlands. Water Research Laboratory, University of Western Sydney
SKM (1999) Design Guidelines for Constructed Wetlands in Northern Tasmania, Launceston City Council
Wong, T., Breen, P., Somes, N. & Lloyd, S (1998) Managing Urban Stormwater using Constructed Wetlands, Report 98/7, CRCCH

Appendix A
MUSIC Climatic Data
Introduction
Parsons Brinckerhoff was contracted by the Mildura Rural City Council to develop Water Sensitive Urban Design (WSUD) Guidelines for Mildura. As part of this study Parsons Brinckerhoff were required to determine pollutant types, concentration and loading for the catchments. The Model for Urban Stormwater Improvement Conceptualisation (MUSIC) was recommended for this task.
Melbourne Water has produced a document entitled MUSIC Input Parameters. This document provides advice to practitioners on the appropriate input data for use when simulating stormwater treatment facilities in MUSIC.
To avoid the use of large sets of rainfall data, Melbourne Water has identified an appropriate reference year for 10 gauging stations across Melbourne. This reference year is the closest fit to the average rainfall. Monthly evapotranspiration (ET) has also been provided for each of the 10 reference sites.
A similar analysis has been undertaken by Parsons Brinckerhoff for Mildura. The results of the analysis are described in this report and digital data provided on the disk enclosed.
Rainfall
MUSIC recommends that the computation timestep must be equal to or less than:
i. the Time of Concentration of the smallest sub-catchment
ii. the shortest detention time (under design flows) of the treatment measures being modelled.
Melbourne Water suggests that if (i) or (ii) above is less than 6 minutes, the model should be run using a 6 minute interval.
Given that the catchments being modelled are typically small urban catchments the time of concentration is usually in the order of minutes. The Bureau of Meteorology maintains rainfall data records from pluviographs in 6-minute intervals. Pluviograph records available for Mildura Airport (076031) (1946 – Present) were used for the analysis.
The average rainfall reference year was determined by an analysis of long-term daily rainfall data for two rainfall gauges in the area of interest:
076031 - Mildura Airport 1946 - Present
076032 - Mildura Post Office 1934 - 1994
Monthly data were obtained for Mildura for the period of record and the average annual rainfall determined. A year within ±10 % of the annual average rainfall for each site was selected for further assessment. The sum of the absolute value of the percentage differences was used to assess each year’s monthly rainfall totals against the average monthly rainfalls (see equation below).
nY = ∑→=
n
i 121
i
iiXµµ−
x 100

Where Yn = sum of the absolute value of the percentage differences for monthly rainfall from the average rainfall for month, i for year, n
µi = average rainfall for month, i
Xi = rainfall for month, i
i = January, February November, December.
A regression analysis was undertaken to determine the correlation between Mildura Airport and Mildura Post Office. The regression showed a relationship close to unity (0.994). The results are shown graphically in Figure A5.
The strong correlation indicated that data from Mildura Post Office 1934 – 1946 was an accurate representation of rainfall data for Mildura Airport. Mildura Airport and Mildura Post office data were combined to provide daily rainfall data for 1934 – Present.
The minimum nY , was determined for all the selected years at Mildura. Table A1 shows
the results of the analysis.
Table A1: Results of monthly rainfall comparison
Rainfall gauging station
Period of record
Annual average
(mm)
4 years with smallest departure from the
average
Mildura Airport, Post Office (Combined)
1934 – Present 283.1 1968, 1987, 1981, 1966
The analysis shows that 1968 is the ‘most’ average year on record. Comparative hyetographs for each year are depicted in Figures A1 to A4.
The 1968 pluviograph data from Mildura Airport (076031) gauge is available for the full year. Given its close proximity it is concluded Mildura Airport gauge is suitable for all sites considered.
Rainfall data from the Mildura Airport (076031) pluviograph for 1968 is provided on the enclosed disk. The files include 6-minute, hourly and six hourly rainfall data in MUSIC file format.
Evapotranspiration
Melbourne Water has provided average monthly evapotranspiration values for 10 reference sites across Melbourne. The monthly evapotranspiration (ET) values for Mildura have been taken from the former Department of Conservation and Natural Resources publication Derivation of mean monthly evapotranspiration estimates for Victoria (Nathan & Pamminger, 1995). Table 2 lists the average monthly ET values.
Table A2: Monthly ET Values for Mildura
Month
Jan Feb Mar Apr May
Jun Jul Aug Sep Oct Nov Dec
ET 175 135 105 65 40 25 30 45 70 115 140 155
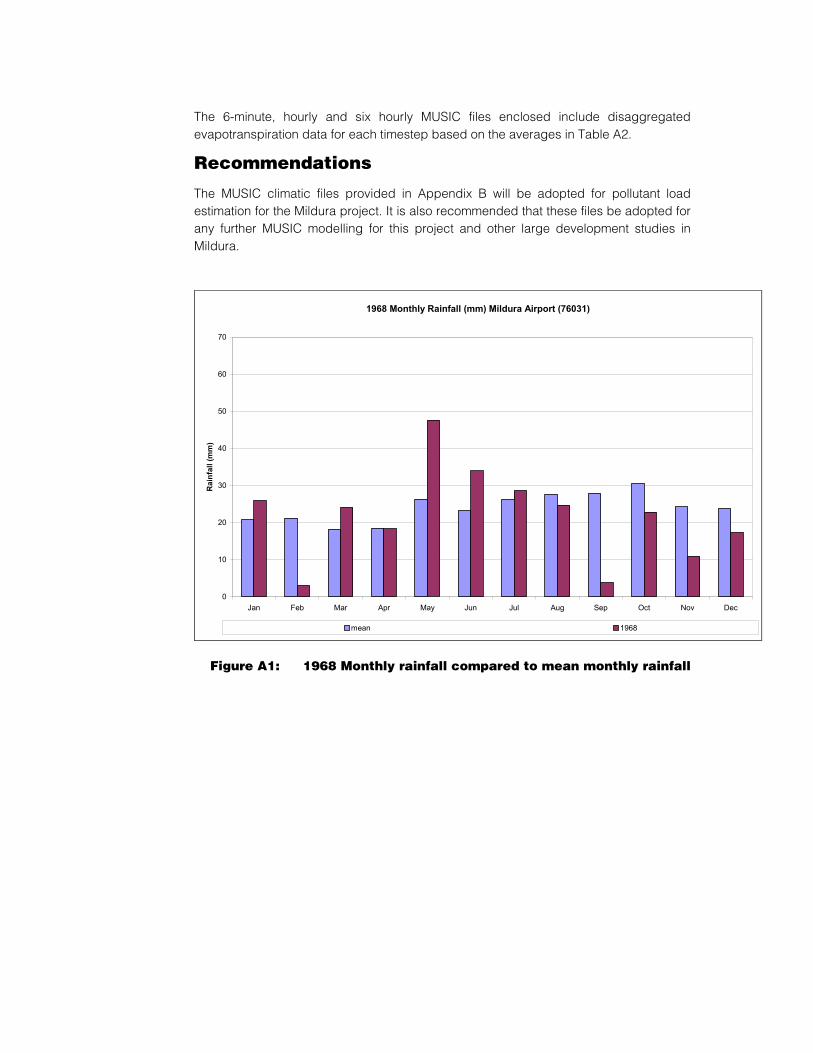
The 6-minute, hourly and six hourly MUSIC files enclosed include disaggregated evapotranspiration data for each timestep based on the averages in Table A2.
Recommendations
The MUSIC climatic files provided in Appendix B will be adopted for pollutant load estimation for the Mildura project. It is also recommended that these files be adopted for any further MUSIC modelling for this project and other large development studies in Mildura.
1968 Monthly Rainfall (mm) Mildura Airport (76031)
0
10
20
30
40
50
60
70
Jan Feb Mar Apr May Jun Jul Aug Sep Oct Nov Dec
Rai
nfal
l (m
m)
mean 1968
Figure A1: 1968 Monthly rainfall compared to mean monthly rainfall
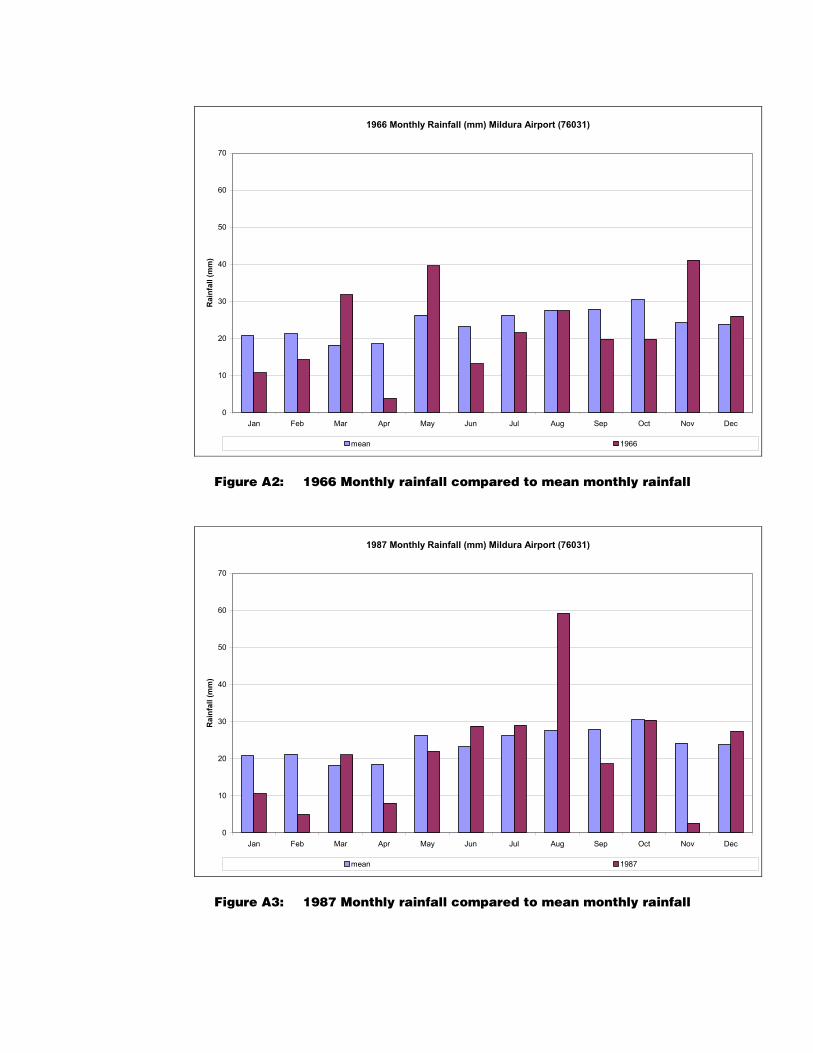
1966 Monthly Rainfall (mm) Mildura Airport (76031)
0
10
20
30
40
50
60
70
Jan Feb Mar Apr May Jun Jul Aug Sep Oct Nov Dec
Rai
nfal
l (m
m)
mean 1966
Figure A2: 1966 Monthly rainfall compared to mean monthly rainfall
1987 Monthly Rainfall (mm) Mildura Airport (76031)
0
10
20
30
40
50
60
70
Jan Feb Mar Apr May Jun Jul Aug Sep Oct Nov Dec
Rai
nfal
l (m
m)
mean 1987
Figure A3: 1987 Monthly rainfall compared to mean monthly rainfall
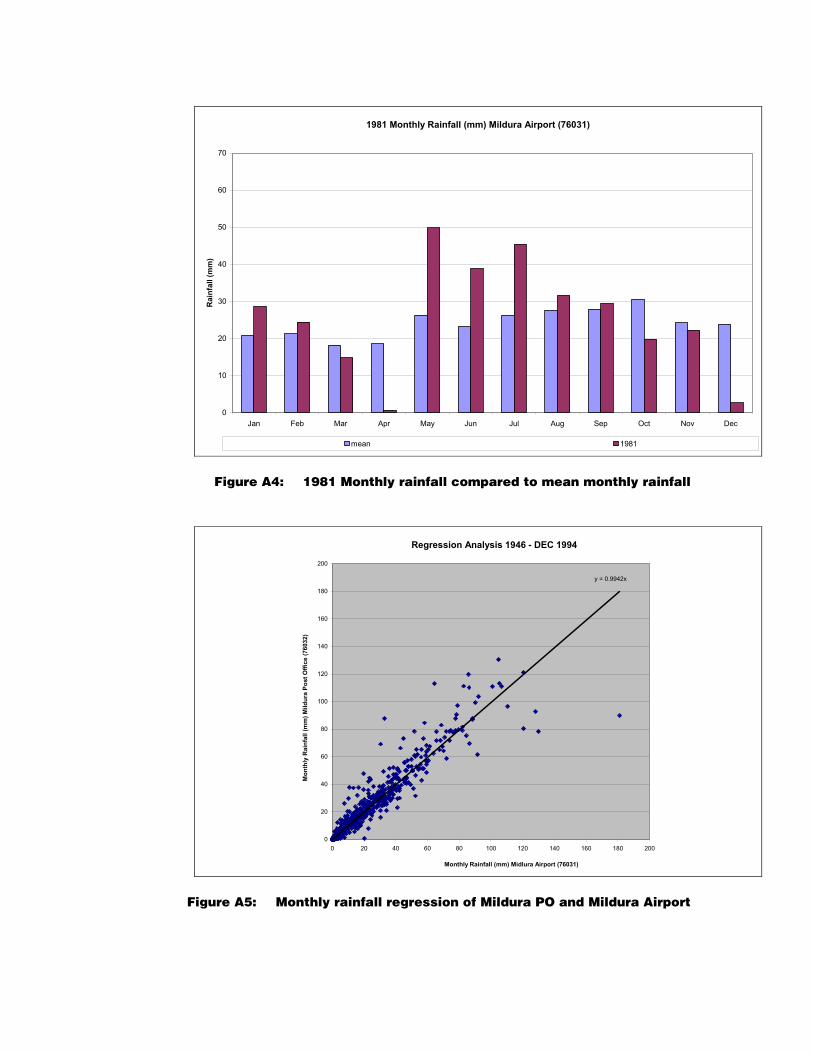
1981 Monthly Rainfall (mm) Mildura Airport (76031)
0
10
20
30
40
50
60
70
Jan Feb Mar Apr May Jun Jul Aug Sep Oct Nov Dec
Rai
nfal
l (m
m)
mean 1981
Figure A4: 1981 Monthly rainfall compared to mean monthly rainfall
Regression Analysis 1946 - DEC 1994
y = 0.9942x
0
20
40
60
80
100
120
140
160
180
200
0 20 40 60 80 100 120 140 160 180 200
Monthly Rainfall (mm) Midlura Airport (76031)
Mon
thly
Rai
nfal
l (m
m) M
ildur
a Po
st O
ffice
(760
32)
Figure A5: Monthly rainfall regression of Mildura PO and Mildura Airport

Appendix B
MUSIC Water Quality Data