Embed Size (px)
Citation preview

GEOLOGICAL SURVEY CIRCULAR 254 OF
WATER SUPPLY OF THE
BmMINGHAM AREA
ALABAMA
By W. H. Robinson, J. B. Ivey, and G. A. Billingsley
UNITED STATES DEPARTMENT OF THE INTERIOR Douglas McKay, Secretary
GEOLOGICAL SURVEY W. E. Wrather, Director
GEOLOGICAL SURVEY CIRCULAR 254
WATER SUPPLY OF THE BIRMINGHAM AREA, ALABAMA
By W. H. Robinson, J. B. Ivey, and G. A. Billingsley
Washington, D. C.,1963Free on application to the Geological Survey, Washington 25, D. C.

PREFACE
This report was prepared to provide information relative to the water resources of one of several of the Nation's centers of industry. The information pre sented will be of value in the orderly planning for mu nicipal and industrial expansion as well as a guide to the sound development of water supplies related to de fense efforts. It was prepared by the U. S. Geological Survey under the technical supervision of the Water Utilization Section of the Technical Coordination Branch and under the direct supervision of Melvin R. Williams, district engineer (Surface Water); Philip E.
LaMoreaux, district geologist (Gjround Water); and G. A. Billingsley, district chemist (Quality of Water).
Most of the surface-water data for this report have been collected over a period of years by the U. S. Geological Survey in cooperation with the Alabama Geological Survey. Acknowledgment is made to the H. W. Peerson Drilling Co., Birmingham, Ala., whose well records contributed much ground-water information, and to all individuals with whom the geol ogy and ground water of the area were discussed.
Ill

CONTENTS
Abstract..............................................Introduction.........................................
Purpose..........................................Description of area...........................
Location........................................Topography....................................Climate.........................................Mineral resources..........................
Development.....................................Water use and supply systems.................
Public water supplies.........................Birmingham Water Works...............Birmingham Industrial Water System.Quality of Birmingham public water
supplies.....................................Other public systems.......................
Private industrial supplies..................Iron and steel.................................Miscellaneous industrial supplies......
Irrigation.........................................Rural..............................................Summary of water use.......................
Future water demands...........................Quantity...........................................Quality............................................
Sources of water...................................Surface water......................................
Streamflow records...........................Records at gaging stations...............Other streamflow records...............Floods.........................................Drought........................................
Quality of surface water..................;..Potential stream developments............
Sipsey Fork..................................
Page 1 1 1 1122346779
91012121212121212121214141417242426262930
PageSurface water-Continued
Potential stream developments-Continued Mulberry Fork....................................Locust Fork........................................Trafford site.......................................Cahaba River......................................Coosa River........................................Minor streams....................................Effect of potential developments on other
uses...............................................Ground water............................................
General principles..................................Occurrence and storage........................Movement...........................................Recovery from wells and springs............
General geology.....................................The Valley and Ridge province...............The Appalachian Plateaus.....................
Water-bearing formations..... ..................Cambrian system................................Cambrian and Ordovician systems.........Ordovician system..............................Silurian system..................................Devonian system.................................Carboniferous system, Mississippian
series............................................Carboniferous system, Pennsylvanian
series............................................Mines as a source of water...................
Potential development.............................Aquifers............................................Quality of ground watei in the Birming
ham area........................................Water laws..... ..........................................Selected bibliography..................................
313132323538
434444444444454545464949505050
50
51525252
53
5353
ILLUSTRATIONS
Plate 1. Map of the Birmingham area showing source of water-resourceajdata..................................In2. Geologic map of-Birmingham area, Alabama...................................................................In
Figure 1. Generalized physiographic provinces with structural features of the Birmingham area...............2. Temperature and precipitation at Birmingham, 1896-1951....................................................3. Growth in population of Birmingham and Jefferson County.....................................................4. Industrial concentration in the Birmingham area.................................................................5. Water used in the Birmingham area, 1951.................................................... . .. .. > 6. Average daily water use in the Birmingham area, 1940-51, by Birmingham Water Works..........7. Average daily water use, 1938-50, by Birmingham Industrial Water System............................8. Trends in water use, 1941-51.........................................«..«........................... . ««» 9. Duration of published records at gaging stations in the Birmingham area.................................
10. Flood frequencies in the Black Warrior River basin, 1928-51...............................................11. Drought frequencies (precipitation)........... ........................................... .. . . > > . 12. Composition of selected surface waters in the Birmingham area............................................13. Relation of hardness to dissolved solids of surface waters in the Birmingham area...................14. Duration of daily flows, Sipsey Fork near Sipsey, 1928-51....................................................15. Discharge available without storage, Sipsey Fork near Sipsey, 1928-51..................................16.. Storage requirements, Sipsey Fork near Sipsey, 1928-51.....................................................17. Duration of daily flows, Mulberry Fork at Hanby Mill dam site, 1928-51.................................18. Discharge available without storage Mulberry Fork at Hanby Mill dam site, 1928-51.................19. Storage requirements, Mulberry Fork at Hanby Mill dam site, 1928-51..................................
Page pocket pocket
2356678
131423252829303132333435

PageFigure 20. Duration of daily flows, Locust Fork at Trafford, 1928-51.................'.,................................. 36
21. Discharge available without storage, Locust Fork at Trafford, 1928-51.................................. 3722. Storage requirements, Locust Fork at Trafford, 1928-51..................................................... 3823. Duration of daily flows, Locust Fork at Sayre, 1928-51........................................................ 3924. Discharge available without storage, Locust Fork at Sayre, 1928-51...................................... 4025. Storage requirements, Locust Fork at Sayre, 1928-51......................................................... 4126. Storage requirements, Cahaba River near Acton................................................................. 4127. Maximum number of consecutive days of lowest average discharge, Cahaba River near Acton..... 4228. Estimated duration of daily flows, Fivemile Creek 1 mile upstream from State Route 38............ 4329. Diagrammatic section, showing water-table and artesian conditions in the Birmingham area....... 4430. Composition of selected ground waters in the Birmingham area............................................. 4631. Relation of hardness to dissolved solids of ground waters in the Birmingham area.................... 49
TABLESPage
Table 1. Chemical analyses of Birmingham public water supply............................................................ 92. Duration of daily flows at gaging stations in the Birmingham area............................................. 153. Monthly and annual discharge, Big Canoe Creek near Gadsden.................................................. 17
.4. Monthly and annual discharge, Kelly Creek near Vincent......................................................... 185. Monthly and annual discharge, Cahaba River near Acton.......................................................... 186. Monthly and annual discharge, Mulberry Fork near Garden City............................................... 197. Monthly and annual discharge, Sipsey Fork near Falls City...................................................... 198. Monthly and annual discharge, Clear Creek at Falls City......................................................... 209. Monthly and annual discharge, Sipsey Fork near Arley............................................................ 20
10. Monthly and annual discharge, Sipsey Fork near Sipsey........................................................... 2111. Monthly and annual discharge, Blackwater Creek near Manchester............................................ 2112. Monthly and annual discharge. Locust Fork near Cleveland...................................................... 2113. Monthly and annual discharge. Locust Fork at Trafford........................................................... 2214. Monthly and annual discharge, Turkey Creek at Morris.......................................................... 2315. Monthly and annual discharge, Locust Fork near Warrior........................................................ 2316. Monthly and annual discharge, Locust Fork at Sayre............................................................... 2417. Chemical quality of surface water in the Birmingham area....................................................... 2718. Chemical quality of ground water in the Birmingham area........................................................ 47
VI

WATER SUPPLY OF THE BIRMINGHAM AREA, ALABAMA
ABSTRACT
Sufficient water is available in the streams of the area surrounding Birmingham to supply any foresee able demand; however, to utilize these streams im pounding reservoirs and rather long supply lines will be required. Moderate supplies of ground water are available from wells, springs, and mines.
The average water use in the area, not including reclaimed and recirculated water, was about 157 mgd during 1951. About 55 mgd was used for domestic or commercial purposes, and 102 mgd was used for in dustrial purposes. The quantity of water withdrawn would have to be much greater if a considerable a- mount of reclaimed and recirculated water had not been used. The Birmingham water-supply systems are used at almost full capacity, and plans are being considered by the city to expand its supply greatly.
An estimated 4 mgd of ground water from wells and springs is used for municipal supplies, and 8 mgd is used for industrial purposes. Smaller amounts of ground water are used for irrigation and rural supply. Individual springs in the area are capable of yielding as much as 750 gpm and wells as much as 500 gpm. Some water from worked and abandoned coal and iron mines is used for public and industrial supplies. One of the conclusions reached by the ground-water study is that ground water has not been fully developed in wells and springs of the area and that mine water which would have to be treated for most municipal and industrial purposes is a potential source of water.
Generally, the surface water in the Birmingham area is of better quality than ground water. Surface water is low in dissolved mineral matter and is ex tremely soft. Some of the streams carry excessive quantities of iron. Village and Valley Creeks carry some surface pollution making the water unsuitable for many uses. Ground water in this area is usually low in color and ranges in temperature from 62° to 72° F. Water from limestone, dolomite, and chert usually is moderately to extremely hard. Calcium, magnesium, and bicarbonate are the predominant constituents. The quantity of iron in ground water from most of the aquifers is low, except from the Pottsville formation. The Floyd shale and the Park- wood formation yield sodium bicarbonate waters high in sulfate and low in calcium, magnesium, chloride, and nitrate, ground water from the Pottsville forma tion is more variable in quality than water from other formations in the area. Water samples from the mine shafts yielding from this formation were highly min eralized and extremely hard.
INTRODUCTION
Large quantities of water are required in the Bir mingham area, principally because of the development of water-using industries in the area. The metropoli tan area is so situated that only small quantities of water are available in the immediate vicinity, and in general these easily developed supplies have already been exploited. Thus the development of additional supplies in any appreciable quantities presents a dif ficult problem, the solution of which will require much planning and a considerable expenditure of money.
The purpose of this report is to provide information on the water resources of the Birmingham area that may be useful for initial guidance in the location or expansion of water facilities for defense and nonde- fense industries and for the municipalities upon which the industries are dependent.
Information on ground water is limited to the general vicinity and is of interest to the smaller communities and to potential developers of private industrial or commercial supplies requiring moderate quantities. Information on surface water includes records on streams located an appreciable distance from Bir mingham. Most of these streams have at some time been considered as a source for additional water for the city. Other units of Government, both State and Federal, also have a potential interest in or plans for the development of these streams; thus the informa tion presented herein will also be of value to them.
Description of Area
Location
The area investigated for water use and supply in this report is that area covered by the city of Birming ham and the surrounding industrial area. In general, the area can be defined as Jefferson County which is in the north-central part of Alabama (pi. 1). It was necessary, because of lack of adequate surface-water supplies nearby, to consider a much larger area in the study of potential surface-water supplies. Surface- water data are presented for selected streams in Jef ferson, Shelby, Blount, Walker, and Winston Counties. Ground-water investigations were confined to Jefferson County with special emphasis on the ground-water po tential of the main industrial area of Birmingham val ley (pi. 2).
1

WATER SUPPLY OF THE BIRMINGHAM AREA, ALA.
Topography
Birmingham valley is 3 to 7 miles wide extending northeastward across Jefferson County. The main val ley is divided longitudinally by a low-lying ridge into two parallel flat-bottomed valleys, Jones Valley and Opossum Valley. Birmingham valley is at an eleva tion of 500 to 600 feet above mean sea level and is slightly higher than the adjoining Warrior Basin and Cahaba Valley. Streams draining the Birmingham val ley cut through the valley walls and drain into the Black Warrior River.
The Cahaba Ridges are southeast of Birmingham valley (fig. 1);' a series of sharp parallel ridges also extending northeastward across the county. The val leys have steep sides and narrow floors and are drained by the headwaters of the Cahaba River.
The Warrior Basin lies to the west and north of Bir- mfngham valley (fig. 1). The topography ranges from rolling to hilly with the streams of the area occupying steep-sided valleys. Topographic maps are available for much of the area and can be procured from the U. S. Geological Survey or from local agents.
Climate
Since 1896 climatic records in Birmingham have been kept continuously by the U. S. Weather Bureau (U. S. Weather Bureau, 1951). I/
The climate in the Birmingham area is generally pleasant the year round. There is sunshine about 60 percent of the possible time. The average wind veloc-
\J See page 53 for list of references cited.
Boundary of Birmingham areaR.6W. R.1E.
Figure 1.-Generalized physiographic provinces with structural features of the Birmingham area.

INTRODUCTION
110
100
90
80
70
60
50
40
30
20
1Q
0
-10
.<£
o
zr 1 o KPRECIPITATI
IN INCHESo i-1 ivJ co -t* tn c
Average growing season
Jan. Feb. Mar. Apr. May June July Aug. Sept. Oct. Nov. Dec.
Figure 2. Temperature and precipitation at Birmingham, 1896-1951.
ity is 7. 0 mph with high and low mean monthly veloc ities of 8. 9 and 5. 2 mph occurring in March and Aug ust, respectively. The average growing season is 239 days; November 10 and March 16 are the average dates of the first and last killing frosts.
Birmingham is in the Eastern Humid climatic divi sion of the United States (U. S. Department of Agri culture, 1941), and heat and cold are more noticeable because of the high relative humidity. There is a dif ference of 35° F between the high and low mean month ly temperatures of 80° F in July and 45° F in January.
The highest average monthly precipitation of 6. 11 inches occurs in March; the lowest average monthly precipitation of 2. 76 inches occurs in October. The high mean monthly precipitation for the winter occurs
in December and January; the high mean for the sum mer occurs in July (fig. 2). Most of the precipitation in the Birmingham area falls as rain; January is the only month with a mean monthly snowfall of as much as 1 inch.
Mineral resources
Birmingham is noted for the production of iron and iron products and is often referred to as the "Pitts burgh of the South. " Iron ore, coal, dolomite, and limestone, the essential raw materials for making iron, occur nearby; therefore routes from the mines and quarries to the furnaces are short.
Coal, iron ore, and cement, in order of their impor tance, are the most important mineral resources of the

WATER SUPPLY OF THE BIRMINGHAM AREA, ALA.
area (U. S. Bureau of Mines, 1951). Limestone is used in the cement industry, and limestone and dolomite are used as fluxing material in the smelting of iron ore. Other minerals produced in the area are sand, gravel, and clay.
Water plays an important role in the development of mineral resources in this area. It is used for washing and concentrating processes at the coal and iron ore mines and pits. Large quantities are used for the manufacture of iron products and in certain phases of the cement industry. Much of the water used in de veloping mineral resources is available for re-use; however, there is always a loss of part of the water in any industrial process, and this water must be re placed from surface- or ground-water sources.
Coal. Coal is mined underground and .in strip pits in four coal fields in the State. In order of their im portance they are the Warrior, Cahaba, Coosa, and Plateau coal fields. The Warrior field covers an area of about 4, 000 square miles (Butts, 1926 a). Most of the Warrior field lies within the limits of the area covered by this report and in all or part of Jef ferson, Walker, Tuscaloosa, Fayette, Winston, Blount, Cullman, and Lawrence Counties. The Cahaba coal field is the second largest and second most pro ductive in the State. It lies between the Birmingham valley on the northwest and the Cahaba Valley on the southeast, extends about 60 miles southeastward, and averages 5 miles wide. All except the southern quar ter of this field lies within the Birmingham area.
The Coosa field is the third largest and third most productive in the State. Most of the field lies in the southeast part of the area of this report in Shelby and St. Clair Counties. Only a small part of the Plateau field lies in the area; it is not an important coal producer.
The coal in the Alabama fields occurs in Carbonif erous rocks in the Pottsville formation which con sists of sandstone, shale, conglomerate, and coal beds collectively known as the "Coal Measures. " The Coal Measures attain a thickness of 2, 000 feet in the Warrior field, 9, 000 feet in the Cahaba field, and 7, 500 feet in the Coosa field.
Jefferson and Walker Counties are the greatest coal producers in the State. In 1948, mines in Jef ferson County produced 9. 7 million tons of coal from the Warrior and Cahaba fields including 0. 3 million tons from strip mines; mines in Walker County pro duced 5. 6 million tons from the Warrior field includ ing 1. 1 million tons from strip mines (U. S. Bureau o'f Mines, 1951).
In 1948, the 484 Alabama mines produced 18.8 million tons of coal of which 1. 9 million tons or 10. 3 percent were produced by 43 strip pits (U. S. Bureau of Mines, 1951).
Iron ore. Iron ore is the second most important mineral resource of the Birmingham area. Since the early 1860's when the Confederate Government financially aided the operators (Armes, 1910), the iron industry has grown so rapidly that Alabama was
third largest producer of iron ore in the United States in 1949 (U. S. Bureau of Mines, 1951), and fifth larg est producer of pig iron in 1950 (Statesman's Year book, 1951, p. 592). Most of the iron ore smelted in Birmingham is mined from a seam in the Red Moun tain formation which crops out along the crest of the northwest face of Red Mountain. A much smaller amount of residual limonite (brown ore) is stripped from open pits in various parts of the State. Brown ore is produced by several companies which sell the ore to iron smelting companies in Birmingham; the ore is generally mixed with hematite (red ore) for smelting.
Cement. Cement is the third most valuable mineral product in Alabama (Burchard, 1940, p. 8). Most of the cement produced in the State is manufactured in three plants in Birmingham and one in Leeds.
The raw materials for cement are found in abundance within a few miles of Birmingham. In 1949, the pro duction in Alabama was 9. 4 million barrels (376 pounds equals 1 net barrel).
Dolomite and limestone. Dolomite and limestone are important in the manufacture of pig iron; 832 pounds of fluxing material is required for the produc tion of 1 ton of pig iron (American Society for Metals, 1948, p. 318).
Three of the companies producing pig iron in the Birmingham area operate quarries in the Ketona dolomite; the fourth company, Woodward Iron Co., because of the self-fluxing property of most of the ore it mines, purchases what flux it needs rather than operate a quarry.
The Warsaw limestone is mined in Muscoda No. 5 mine of the Tennessee Coal, Iron, & Railroad Co. This limestone is almost a pure calcium carbonate and usually contains less than 2 percent impurity.
Clay and sand. Clay and sand are minor mineral resources of the Birmingham area. Refractory clay is available in quantity from coal mines where it occurs as underclay beneath the coal beds. Molding sand is produced from friable parts of the Hartselle sandstone where the bonding agent is weak and the sandstone can be easily crushed.
Development
With the occurrence, in one community, of coal, iron ore, and limestone the raw materials of the steel industry it was inevitable that the city grew as it did. From the beginning the development of the city has been tied to the success of the industries developing the resources of the area. In 1871 the site of the city of Birmingham consisted of two section houses.
Each major change of industry brought about a cor responding change in population. The first blast fur nace and rolling mills in Birmingham were built in 1880, and with that stimulus the population increased eightfold in the decade from 1880 to 1890. The con struction of modern steel mills, about 1905, resulted
INTRODUCTION
600
Data supplied by the U. S. Bureau of the Census
500
CO 400 Q
CO:D oIh-
30O»s
Z Oh-
a_ o
200
100
1880 189O 1900 1910 1920 1930 1940
Figure 3. -Growth in population of Birmingham and Jefferson County.
1950
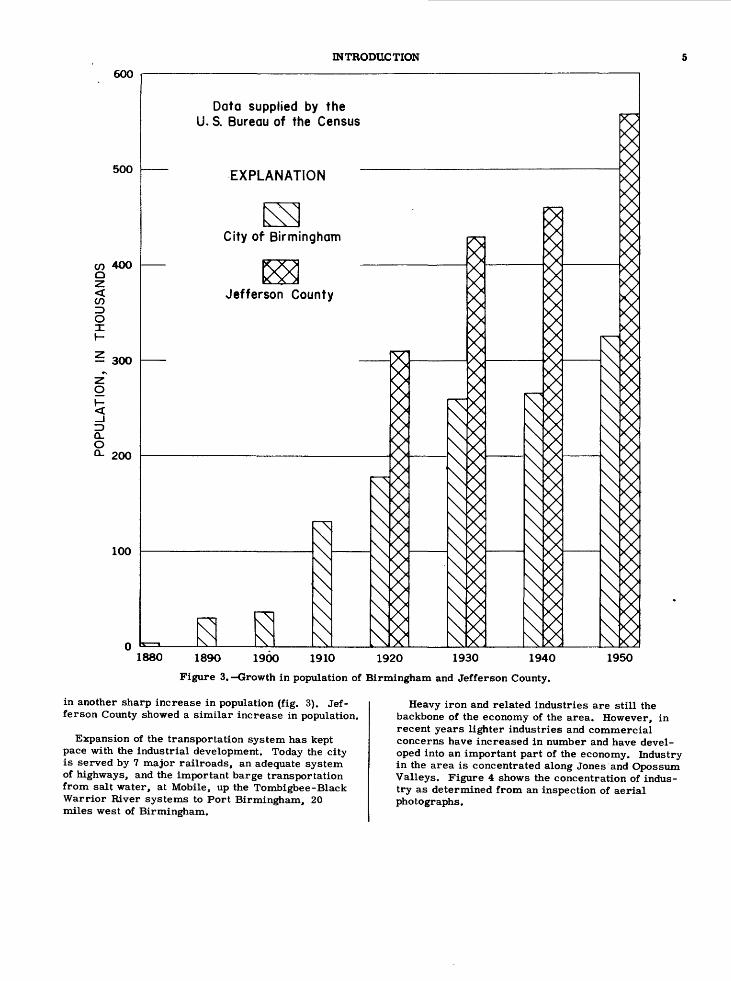
in another sharp increase in population (fig. 3). Jef ferson County showed a similar increase in population.
Expansion of the transportation system has kept pace with the industrial development. Today the city is served by 7 major railroads, an adequate system of highways, and the important barge transportation from salt water, at Mobile, up the Tombigbee-Black Warrior River systems to Port Birmingham, 20 miles west of Birmingham.
Heavy iron and related industries are still the backbone of the economy of the area. However, in recent years lighter industries and commercial concerns have increased in number and have devel oped into an important part of the economy. Industry in the area is concentrated along Jones and Opossum Valleys. Figure 4 shows the concentration of indus try as determined from an inspection of aerial photographs.

WATER SUPPLY OF THE BIRMINGHAM AREA, ALA.
Lighter concentration of industry
BESSEMER Light or no concentration of industry
Figure 4. Industrial concentration in the Birmingham area.
WATER USE AND SUPPLY SYSTEMS
The uses and demands for water are modified or controlled by many factors. Some uses and demands, such as those for household, municipal, and commer cial needs, are common to all communities and bear a relation directly to the total population. On the other hand, water for special needs, such as for in dustry or agriculture,are peculiar to each city or area and do not bear a relation to such indices as
INDUSTRIAL
population or production. Furthermore, special needs are closely related to quality as well as quantity of water. In the Birmingham area the major special need is water for industry and, more particularly, cooling water for the manufacture of ferrous products.
The importance of the industrial water needs can be readily illustrated by citing some common water re quirements for industries in the area. These show a water demand as much as 6, 000 gallons for processing
DOMESTIC
Ground water 8 percent Ground water
9 percent
Surface water 91 percent
Total 102 mgd Total 55 mgd
Figure 5. Water used in the Birmingham area, 1951.

WATER USE AND SUPPLY SYSTEMS
1 ton of coke, 1,400 gallons for smelting 1 ton of pig iron, and 100,000 gallons for manufacturing 1 net ton of rolled steel.
The needs of the population of the area are also substantial. About 460, 000 people are served by pub lic water-supply systems; and 100,000 people, mostly in rural areas or communities, are served by private supplies.
Where large quantities of water are required in a single system, surface water has been used as the source of supply; however, a number of smaller com munities and industries find it economical to develop ground-water sources which require less expensive installations and treatment. Some industries need water that conforms to certain chemical and physical requirements. These requirements must be consid
ered when selecting the most economical sources of water. Figure 5 shows the relative volume of usage by type and by source.
The following sections describe the water systems, sources of supply, principal uses, and the quality of the various waters.
Public Water Supplies
Birmingham Water Works
This system is municipally owned but was a private company from the date of its organization in 1885 until purchased by the city in 1951. In that year the system served 426, 000 people in Birmingham, Bessemer, Homewood, Mountain Brook, Fairfield, Tarrant City,
6O
5O
5Q
LU O.
COzO 40
CD
Zo_l _J5 30
LU CD
20Q
-LJCD
10
Supplied from Cahobo River
EXPLANATION
Supplied from Birmingham Industrial Water System
1940 1945 1950 1951
Figure 6. Average daily water use in the Birmingham area, 1940-51, by Birmingham Water Works.

8 WATER SUPPLY OF THE BIRMINGHAM AREA, ALA.
Graysville, Woodward,and many smaller communities. The company originally developed Fivemile Creek, but it is no longer being used as a source of supply for the city. Since 1891 water has been diverted from the Cahaba River. The dam on Little Cahaba River im pounding Lake Purdy was constructed in 1910, and raised to provide additional storage in 1928 and again in 1938. The present capacity is 5. 7 billion gallons or 15, 300 acre-feet. Water for the city system is obtained below Lake Purdy from a small reservoir formed by a low dam just below the mouth of the Little Cahaba Riv er. The point of diversion is on the Cahaba River and about 2 miles above the mouth of the Little Cahaba River. The filter plant is on Shades Mountain and has a capacity of 55 mgd. The successive steps of treat ment consist of sedimentation, prechlorination, coag ulation with alum, sedimentation, rapid sand filtra
tion, postchlorination, and lime for adjustment of pH from 8. 2 to 8. 4.
Birmingham Water Works has obtained additional water from the Birmingham Industrial System since about 1940. Water from that source is treated at the Birmingham Station Filter Plant having a capacity of 12 mgd.
The growth in water use since 1940 and the propor tion used from the two sources of supply are shown in figure 6.
There appears to be little opportunity for any sub stantial increase in diversions from the present developments.
60
50
LU Q_
§ 40
< OzO
i 30Z
uT
<f>
Q
LU
(T LU
20
10
01938 1940 1945 1950
Figure 7. Average daily water use, 1938-50, by Birmingham Industrial Water System.
WATER USE AND SUPPLY SYSTEMS
Table 1.-Chemical analyses of Birmingham public water supply
[Chemical analyses in parts per million]
Silica (SiO2)... ..................Iron (Fe)...... ...................
Sodium (Na).... .................
Bicarbonate (HCO3).. .........Carbonate (CC>3). ..............Sulfate (804)...... ..............Chloride (Cl)... ....... ..........Fluoride (F)... ..................Nitrate (NOo) ................
* O 7
Hardness as CaCC^: Total...........................
Specific conductance
pH..................................Color..............................Turbidity.........................
Cahaba River (raw water)
6910/18/51
7.8.06.00
265.95.12.0
950
162.8.2
1.2116
8911
1897.372
Cahaba River (finished water)
6910/18/51
6. 1.06.00
275.74.81.8
890
214.2.2
1.3118
9118
1937.282
Inland Lake (raw water)
5510/19/51
5.0.07.00
1.81.22.41.3902.92.2.3
1.626
92
29.36.2
231
Inland Lake (finished water)
5710/19/51
4.5.03.00
9.21.12.91.1
2907.52.2.1
1.546
274
72.68.472
Regular determinations at Shades Mountain treatment plant, 1950
Finished water....
Avg_-
Alkalinityas CaCOs
(ppm)Max
95105
Min2229
Avg7.48.3
PH
Max7.98.5
Min7.08.0
Avg_-
Hardnessas CaCO3
(ppm)Max
_100
Min_
40
Avg-0
Turbidity
Max380
0
Min15
0
Regular determinations at Birmingham treatment plant, 1950
Finished water....
Avg12
Alkalinityas CaCO3
(ppm)Max
1648
Min1019
Avg7.29.0
PH
Max7. 39.1
Min7. 18.9
Avg1230
Hardnessas CaCD3
(ppm)Max
1236
Min1224
Avg-0
Turbidity
Max30
0
Min15
0
Birmingham Industrial Water Systems
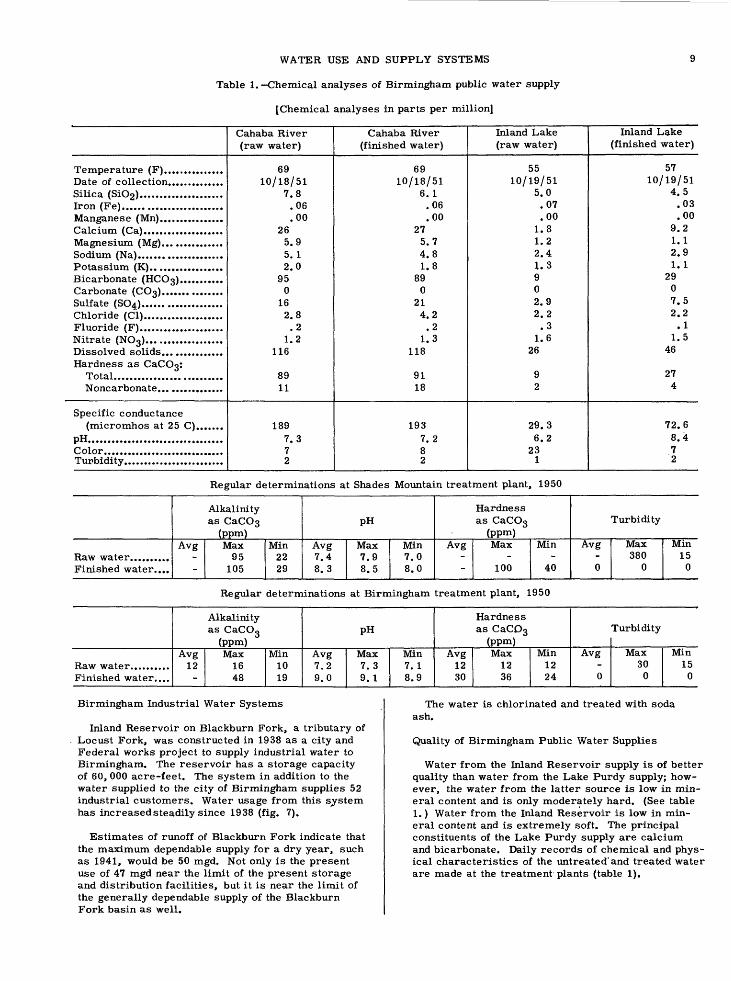
Inland Reservoir on Blackburn Fork, a tributary of Locust Fork, was constructed in 1938 as a city and Federal works project to supply industrial water to Birmingham. The reservoir has a storage capacity of 60, 000 acre-feet. The system in addition to the water supplied to the city of Birmingham supplies 52 industrial customers. Water usage from this system has increased steadily since 1938 (fig. 7).
Estimates of runoff of Blackburn Fork indicate that the maximum dependable supply for a dry year, such as 1941, would be 50 mgd. Not only is the present use of 47 mgd near the limit of the present storage and distribution facilities, but it is near the limit of the generally dependable supply of the Blackburn Fork basin as well.
The water is chlorinated and treated with soda ash.
Quality of Birmingham Public Water Supplies
Water from the Inland Reservoir supply is of better quality than water from the Lake Purdy supply; how ever, the water from the latter source is low in min eral content and is only moderately hard. (See table 1.) Water from the Inland Reservoir is low in min eral content and is extremely soft. The principal constituents of the Lake Purdy supply are calcium and bicarbonate. Daily records of chemical and phys ical characteristics of the untreated'and treated water are made at the treatment plants (table 1).

10 WATER SUPPLY OF THE BIRMINGHAM AREA, ALA.
Other public systems
Overton. Over ton is a small community about 6 miles east of Birmingham, with a population of about 900. The water supply is drawn from the Cahaba River to a filter plant, owned by Alabama Fuel & Iron Co., which has a capacity of about 86, 000 gpd. The water is treat ed with alum, a light application of soda ash, and is filtered and chlorinated. The pH is generally main tained between 7. 2 and 7. 4.
Lovick. Lovick is a small community about 10 miles east of Birmingham, with an estimated population of 145 served by the water system. The water supply is drawn from the Cahaba River to a filter plant, owned by Stephenson Brick Co., which has a capacity of 36, 000 gpd. The water is treated with alum, settled, filtered, and chlorinated.
Warrior. Warrior is a community about 20 miles north of Birmingham. The municipally owned water system draws water from the Locust Fork to a filter plant with a capacity of 150,000 gpd. The water is treated with lime, settled, filtered, and chlorinated.
Roebuck Plaza. The water works system at Roebuck Plaza, 3^ miles northeast of Birmingham, is owned and operated by Mr. A. J. Grefenkamp.
One well 320 feet deep produces water from the War saw limestone and Gasper formation. The well is pumped at the rate of 100 gpm but is capable-of a much larger yield. Another previously used well is now used in a standby capacity.
The water contains an excessive amount of iron and is moderately hard. Calcium and bicarbonate are the predominant constituents.
Irondale. Irondale, with a population of 1, 876, is on the northeast side of Birmingham. Water is furnished to the town by a well developed in the Gasper formation and Hartselle sandstone. This well yields about 125 gpm about 18 hours each day, but, according to the driller, it had a capacity of 200 gpm when the well was completed in 1949. A second well, used as a standby,
( is less than 100 feet from the producing well.
The Gasper formation and Hartselle sandstone yield a water very low in mineral content that is extremely soft (table 18). The water is aerated, treated with Calgon for pH adjustment, and chlorinated. A 172, 000-gallon reservoir is at ground level on the lot adjacent to the pump house, and a 75, 000-gallon standpipe is three blocks to the northwest on a hill overlooking the town.
Mount Pinson. Mount Pinson is 12 miles northeast of Birmingham. The waterworks system is owned and operated by a private company; about 185 custom ers purchase water from the system.
A single well developed in the Ketona dolomite sup plies the system. The well is pumped from 2 to 5 hours each day at a rate of 222 gpm, and a daily rec ord is kept of the pumpage. The water has a hardness of 146 ppm, and the dissolved solids are 148 ppm. (See table 18.) It is chlorinated before being pumped into the system.
Center Point. Center Point is about 6 miles north east of Birmingham. A water system owned and oper ated by Mr. George Scott supplies water from one well for the community.
The well is finished in the Copper Ridge dolomite and is pumped at 120 gpm for about 12 hours each day, except when abnormal quantities of water are used during dry weather. The water is low in dissolved solids but is hard (table 18). It is chlorinated before being pumped into the distribution system.
Trussville. Trussville is about 5 miles northeast of the Birmingham city limits. The Trussville Water Service operates two wells that supply water from the Fort Payne chert and Warsaw limestone for a popula tion of 1, 575.
A pumping test indicated that the wells pumping to gether yielded 336 gpm. The wells are 410 feet apart, and when either well operates alone,a noticeable draw down is observed in the other one. The analyses show that the water is moderately hard and that the dissolved mineral matter consists largely of calcium and bicar bonate (table 18). The water is aerated, filtered, and chlorinated before it is fed into the distribution system.
Greenwood. Greenwood is 4. 5 miles south of Bes semer. The Greenwood Water Association owns and operates a water system supplied by two wells.
The first well drilled did not produce the quantity of water needed but is used as a standby; the second well yielded 60 gpm. Both wells were developed in the Fort Payne chert and Warsaw limestone. The dissolved mineral matter in water from the operating well con sists essentially of calcium, bicarbonate, and sulfate, and is hard (table 18). The water is chlorinated and furnished to about 105 families, and during the school months, to 730 school children.
A water problem developed at Greenwood in 1952. The static water level in the well dropped 111 feet. A study of the ground water at Greenwood indicated that this condition was temporary and the water level would rise to its normal position after sufficient late fall rains replenished the ground-water reservoir.
Newcastle. Newcastle is 7 miles north of Birming ham in the Warrior coal field. The water system is owned and operated by the Marc Levine Realty Co.
An overflowing well drilled into a flooded mine slope in the Pottsville formation is reportedly pumped at the rate of about 30 gpm. This well was cleaned in 1950 and pumped for 12 hours at a rate of 95 gpm. Except for the excessive amount of iron, the quality of the water is good (table 18). The water is treated with alum and chlorine and is filtered.
Black Diamond. Black Diamond is a mining com munity 9 miles southwest of Bessemer in the Warrior coal field. The water system is owned and operated by the Black Diamond Coal Mining Co.
Two 500 gpm horizontal centrifugal pumps are used to pump water from the old Black Diamond mine. One of these pumps is a standby only; the other operates 12 to 24 hours a day. Water is furnished to the mining community and to coal-washing machines.
WATER USE AND SUPPLY SYSTEMS 11
At this location the Pottsville formation which is the source of water for Black Diamond yields a highly min eralized water that is extremely hard and contains an excessive amount of iron (table 18).
Johns. Johns is 8 miles west of Bessemer in south ern Jefferson County. Three wells owned by the Black Diamond Coal Mining Co. are completed in the Potts ville formation at depths of 60 to 70 feet. There is no central distribution system, but 17 familes have water piped to their homes from the wells.
Blue Creek. The water system is operated by the Blue Creek Mines at Blue Creek, 7 miles southwest of Bessemer.
Water is taken from an abandoned mine slope near the Blue Creek mines. One pump, which is about 300 feet down the mine slope, is operated about 1 hour each day. The water is chlorinated and pumped to surface reservoirs. About 65 familes use water from this system.
Hammond. Hammond is a community built around the now abandoned Hammond iron ore mine. This community is less than a mile west of Irondale and obtains water from a system owned and operated by Sloss-Sheffield Steel & Iron Co.
A flowing well drilled more than 50 years ago about half a mile south of Hammond supplies the water sys tem. Water is produced from the Fort Payne chert and Warsaw limestone; the well is constructed with 12-inch casing and is capped. Two 2-inch lines lead off from the well cap. One line leads to a pump house about 15 feet away; the other is open and water flows freely. The pump is reported to supply 30 to 40 gpm to Hammond; the flow from the open line was measured at 58 gpm on September 3, 1952. The quality of water from this well is very similar to that from the Truss- ville wells. It is a moderately hard calcium bicar bonate type (table 18). The water is chlorinated at the pump house.
Ketona. Ketona is 6 miles northeast of Birmingham. Water rights to one of the Tarrant Springs have been leased from Jefferson County by Mr. Fred Black for the past 21 years. The spring that supplies water for the community is near a fault along the southeast side of Sand Mountain and probably flows from a fissure in the Ketona dolomite.
Water flows by gravity to a pump house about 600 feet to the southeast where it is chlorinated and pumped into the distribution system. About 250 families are served by this spring.
Trafford. Trafford is about 4 miles east of Warrior in the northern part of Jefferson County. The water system is municipally owned and operated.
The supply is obtained from one well producing water from the Pottsville formation and serves a pop ulation of about 550. The well is pumped about 30 gpm; however, the driller stated that the well could be pumped 60 gpm. The water is aerated, filtered, and chlorinated.
Porter. Porter is 15 miles northwest of Birming ham near the Black Warrior River: A water system owned and operated by Adams, Rowe, & Norman Coal Co., former operators of the mine at Porter, supplies water to the town.
A well which is completed at a depth of 83 feet in the Pottsville formation supplies about 40 to 50 fami lies in this old mining camp area. It is reported to pump about 16 gpm for 8 hours a day. Water is pumped from the well to a treatment plant a quarter of a mile to the south. At this plant the water is treated with lime, filtered, and chlorinated before being used.
Brookside. Brookside is 11 miles northwest of Bir mingham in the Warrior coal field.
A municipal well completed in the Pottsville forma tion at 188 feet is reported to pump about 100 gpm. About 200 families are served by the system. Water is aerated, filtered, and chlorinated before being stored in a 100, 000-gallon storage tank.
Port Birmingham. Port Birmingham, on the Black Warrior River, is 20 miles west of Birmingham and is supplied water from a system owned and operated by the Federal Barge Lines.
A single well furnishes water for the port installa tions, a few families, and river barges. Operators estimate that an average of 150 people are served. The well is in the Pottsville formation and is pumped for 14 hours a day at 65 gpm, the capacity of the filter plant.
Robinwood. Robinwood is a small community about a mile northeast of Ketona. Water is piped to this community from Caldwell Spring, owned by Mr. J. M. Knight.
The system furnishes untreated water to about 100 families in the community. Except for hardness, which is 154 ppm, the quality of water is good (table 18).
Virginia. Virginia is a mining community about 9 miles west of Bessemer. The water system supplying the community is owned and operated by the Republic Steel Corp.
Water is pumped from two wells in the Pottsville formation. The total reported production from these wells is about 20 gpm, which supplies about 200 people. The water is filtered and chlorinated.
Raimund. Raimund is a mining community 1 mile south of Bessemer on Red Mountain. Water from the Edwards Mine of Republic Steel Corp. supplies from 800 to 900 people. Water is pumped up the slope of the mine to a reservoir on the mountain and chlorina ted before distribution.
Leeds. Leeds is a town of 3, 306 population,about 15 miles east of Birmingham. The water system, municipally owned and operated, is supplied water from a spring 1 mile northeast of Leeds. The spring is reported to flow 325 gpm from limestone of Ordo-

12 WATER SUPPLY OF THE BIRMINGHAM AREA, ALA.
vician age. In 1952 test drilling was begun to develop a supplemental supply from wells.
Private Industrial Supplies
Most of the private industrial water supplies in the area are developed and used by the iron and steel in dustry. Other industries use a relatively small amount. Information on private industrial supplies may be incomplete but probably includes most of the major supplies.
Iron and steel
The Tennessee Coal, Iron, & Railway Co. were pioneers in developing industrial water supplies in the area. About 1910, when water supply for the com pany's Ensley furnaces became acute, the company developed a system to protect themselves against a future shortage of water. The principal part of the system was a dam and impounding reservoir on Vil lage Creek having usable capacity of 1. 7 billion gal lons. The company's system is the largest privately owned industrial supply in the area. In 1949 the com pany used an average of 453 mgd of industrial water. About 50 mgd of this was prime water supplied by their own system; another 26 mgd was purchased from the Birmingham Industrial System; and the remaining 377-mgd was recirculated and reclaimed water. The prime water supplied by their system came from two sources: about 0. 6 mgd came from mines, and the remainder was drawn from the reservoir on Village Creek.
The National Cast Iron Pipe Co. uses about 360, 000 gpd from Fivemile Creek in their foundry.
Ground water has been developed from wells pene trating the Ketona dolomite at the Connors Steel Co. and the Birmingham Stove & Range Co., and from a quarry in the Ketona dolomite at the Sloss-Sheffield Steel & Iron Co. The total withdrawal from the Ketona dolomite for the manufacture of iron and steel is about 3 mgd.
Miscellaneous industrial supplies
Other industrial supplies are from wells and springs in the area and require at least 31/3 mgd. These sup plies are used for dairies, meat packing, textiles, lumber, cement, railroads, and air conditioning, and for the manufacture of chemicals, ice, and explosives.
Irrigation
Irrigation in Jefferson County, as in other humid areas, is practiced very little except for special crops and for a few pastures. About 50 acres in truck farms and from 100 to 200 acres in pasture are irrigated in Birmingham valley from private wells or from streams. Some individuals and cemeteries have de veloped wells for watering grass.
It is estimated that not more than 1 mgd of irriga tion water is used from privately developed supplies and that use is only during dry periods.
Rural
Parts of rural Jefferson County are densely popu lated. Many industrial employees live on small tracts of land, which they farm in their spare time. The most densely populated area is close to the industrial communities and thus many rural homes can obtain their water from the community system. Others ob tain their supply from wells and springs. An exten sive inventory of domestic wells and springs was not made; however, in the rural areas of Jefferson County it is estimated there are 100, 000 people who do not obtain their water from public supplies. Assuming an average per capita use of 20 gpd, the estimated do mestic use in these areas is 2 mgd.
Summary of Water Use
The total water use in Jefferson County is about 157 mgd (fig. 5). In addition a large percentage of industrial water is reused. The present systems offer little opportunity for furnishing additional supplies in appreciable quantities. Local sources or those nearby are not capable of supplying any large quantity of ad ditional water.
FUTURE WATER DEMANDS
Estimating future demands is not within the scope of this report. However, to indicate the relative mag nitude of the future demand, attention is called to an estimate made for the city by the J. W. Goodwin En gineering Co. They estimate an average annual in crease of about 5 mgd. Thus the indicated increase for each decade,is 50 mgd, a very substantial quantity of water. The rate of increase in water use in the period 1941 to 1951 (fig. 8) is not greatly different from the estimated future increase rate.
The chemical quality of the water used by various industries is so different that it is impossible to es tablish specifications to fit all of them. Water that may be suitable for one industrial process may be un- suited for another. In general, however, most indus tries require water free from color, turbidity, and suspended matter, and low in hardness, manganese, and iron.
Unlike waters used by industry, chemical specifica tions have been accepted generally for waters used domestically. These chemical specifications are in dependent of any sanitary specifications established for protection of the public health. In 1946 the U. S. Public Health Service established chemical specifica tions for drinking water used on interstate carriers. Some of the specifications follow:
Lead: Not to exceed 0.1 ppm.Fluoride: Not to exceed 1. 5 ppm.Iron and manganese together: Not to exceed 0. 3 ppm.Magnesium: Not to exceed 125 ppm.Chloride: Not to exceed 250 ppm.Sulfate: Not to exceed 250 ppm.

FUTURE WATER DEMANDS 13
160
EXPLANATION
Includes water purchased fromBirmingham Industrial Water System
Private industrialDoes not include water sold to
Birmingham Water Works
1941 1951
Figure 8. Trends in water use, 1941-51.

14 WATER SUPPLY OF THE BIRMINGHAM AREA, ALA.
Waters containing less than 500 ppm of dissolved solids generally are satisfactory for most domestic and industrial uses. However, an excessive amount of iron or hardness may cause difficulty in some uses. Waters with more than 1, 000 ppm of dissolved solids are likely to include certain constituents that make them unsuitable for domestic or industrial uses.
SOURCES OF WATER
The immediate source of all fresh water is precipi tation falling on the surface of the earth. In this area precipitation consists of rainfall and a small amount of snow. Almost all water resulting from precipitation eventually runs off in streams or is returned to the at mosphere by evapotranspiration processes.
A large part of precipitation water seeps down into the ground and becomes subsurface water.
Some of the subsurface water is used by plants and returned to the atmosphere by transpiration. When water percolates into the open spaces of the earth's crust and completely saturates them, it forms a zone of saturation; water in the zone of saturation is called ground water. The upper surface of this zone is re
ferred to as the water table, and a well must penetrate below this surface before it produces water. Where the water table intersects the land surface springs are formed. Ground water is moving most of the time, usually toward some stream channel where, during dry weather, it constitutes most of the flow of streams and rivers. Less than half the water that falls as pre cipitation runs off in the streams of the area. A large percentage of the runoff occurs immediately following heavy storms and, unless retained in storage reser voirs, is not available for later use. Although surface and ground water are frequently closely related, they are appraised and treated by different methods; thus data on each are given separately in the following sections.
SURFACE WATER
Streamflow Records
Most analyses of streamflow data are made in order to appraise future flow. Past flows are not important except as a guide to what may happen in the future. Normally the assumption is made that future flows will follow the pattern of the past.
Reference letter
plate I
m
w
o o
WATER YEARS ENDING SEPTEMBER 30
o o>
o a>
oCMa>
ofOa>
olOa> GAGING STATION
Big Canoe Creek near Gadsden
Coosa River at Riverside
Coosa River near Crokwell
Kelly Creek near Vincent
Coosa River at Childersburg
Gahaba River near Acton Shades Creek at Homewood
Mulberry Fork near Garden City
Sipsey Fork near Falls City
Clear Creek at Falls City Sipsey Fork near Arley
Sipsey Fork near Sipsey
Blackwater Creek near Manchester Mulberry Fork near Cordova
Locust Fork near Cleveland
Locust Fork at Trafford
Turkey Creek at Morris Locust Fork near Warrior
Locust Fork at Sayre Five mile Creek at Ketona
Locust Fork at Palos
Village Creek at Ensley
Village Creek near Mulga>% Valley Creek near Bessemer
Valley Creek near Oak Grove* Discharge measurements made during year. t Fragmentary record.
Figure 9. Duration of published records at gaging stations in the Birmingham area.

SURFACE WATER 15
Table 2. -Duration of daily flows at gaging stations in the Birmingham area
[Discharge in cubic feet per second per square mile]
Percentof time
dischargeindicated
was equaledor exceeded
12357
101520253040506070758085909395979899
Big Canoe Creeknear
Gadsden
Water years1940 to 1951
21.114.511.38.006.254.603.112.281.641.22.725.460.304.206.168. 140.112.0920.0815.0745.0675.0640.0600
Water years1928 to 1951(estimated)
21.114.510.97.605.804. 302.852.091.581.22.800.515.336.228. 187.153.126.102.0900.0810.07310.0675.0625
Coosa Rivernear
Cropwell
Water years1943 to 19511/
10.69.088.026.605.604.453.202.401.951.601.18.870.675.540.495.455.414.380.364. 348.328.314.297
Water years1928 to 19511/(estimated)
10.69.047.856.425.404.172.902.251.821.511.09.840.675.540.495.455.410.365.338.316.288.272.250
Kelly Creeknear
Vincent
Water years1928 to 1950(estimated)
0.42.23.11.076.050.033.021.016.014.011.010.0088
Mulberry Forknear
Garden City
Water years1928 to 1951
18.812.49.56.75.44.23.12.451.911.50.95.56.31. 165. 116.080.054.036.029.025.0210.0189.0160
Percentof time
dischargeindicated
was equaledor exceeded
12357
101520253040506070758085909395979899
Sipsey Fork near Falls City
Water years1944 to 1951
18.812.29.36.65.23.952.812.141.671.31.850.495.308.204.165.135.109.086.074.065.056.052.047
Water years1928 to 1951(estimated)
15.810.78.36.04.63.402.401.781.361.10.700.430.280. 186.150.123.100.080.068.060.052.047.042
Clear Creek at Falls City
Water years1940 to 1951
16.411.18.66.24.953.752.702.081.651.33.91.66.50.375.326.282.244.206.184.169.150.139.125
Water years1928 to 1951(estimated)
17.411.99.36.75.254.002.852.141.741.411.00.72.54.405. 350. 300.256.216.192.175.156.145.130
Sipsey Fork near Arley
Water years1937 to 1945
12.89.27.45.54.43.42.351.701.26.98.62.41.28.198.167.143. 123. 107.096.088.079.073.066
Water years1928 to 1951(estimated)
16.211.28.96.55.13.82.61.931.501.18.78.52.36.245.200
.166
.138
.115
. 100
.092
.082
.076
.070
See footnotes at end of table.

16 WATER SUPPLY OF THE BIRMINGHAM AREA, ALA.
Table 2. Duration of daily flows at gaging stations in the Birmingham area-Continued
Percentof time
Ql SCll 3,1*^6
indicatedwas equaledor exceeded
12357
101520253040506070758085909395979899
Sipsey Forknear Sipsey
Water years1928 to 1937
17.512.09.36.44.93.62.62.051.601.30.85.54.33.212.164.127.098.074.061.053.043.038.032
Water "years1928 to 1951(estimated)
16.510.88.46.04.93.72.72.051.601.27.78.51.33.215.175. 140.110.083.069.060.049.043.035
Blackwater Creeknear Manchester
Water years1938 to 1951
16.212.09.97.56.04.553.302.431.841.42.89.542.345.224.176.141.111.085.071.062.052.0465.0396
Water years1928 to 1951(estimated)
16.212.09.97.56.04.503.162.331.771.40.89.564. 364.225.176.141.111.085.071.062.052.0465.0396
Locust Fork nearCleveland
Water years1938 to 1951
18.712.79.97.05.64.43.12.351.801.38.81.48.286.174.136. 102.077.055.043.0355.0283.0244.0204
Water years1928 to 1951(estimated)
18.712.79.97.05.64.43.22.501.951.48.86.51.310.178.136. 102.073.051.038.0310.0246.0214.0180
Percentof time
dischargeindicated
was equaled or exceeded
12357
101520253040506070758085909395979899
Locust Forkat Trafford
Water years1928 to 1951 2/ (estimated)
18.412.19.507.005.604.353.102.351.851.41.885.560.360.228.180.141.111.0845.0695.0590.0475.0408.0323
Turkey Creek at Morris
Water years1945 to 1951
17.011.28.856.455.154.002.872.201.761.41.950.640.450.333.290.255.227.198.182.170.156.149.141
Water years1928 to 1951 (estimated)
14.610.07.955.654.573.542.451.831.441. 13.800.565.416.316.280.250.225.199.184.171.156.146.136
Locust Forkat Sayre
Water years1928 to 1951 2/ (estimated)
19.212.59.56.85.24.02.82.11.621.25.78.51.33.22.179.147.119.096.081.071.060
' .052.047
J^lecords for 1951 water year adjusted to eliminate effect of regulation from operation of Allatoona Reservoir. 2^2stimated flows at the gage if there had been no diversion or regulation.

SURFACE WATER 17
Records at gaging stations
Streamflow records of all streams that are probable potential sources of water supply for the area have been compiled and analyzed. These records include streams in the upper Black Warrior River Basin, the upper Cahaba River basin, some streams tributary to the Coosa River, and one station on the Coosa River (pi. 1).
Few records were collected in the area before 1928 (fig. 9), and those collected were of fairly short dura tion and at places not closely related to later gaging stations. It is probable, however, that the period 1928 to 1951 can be considered a fairly representative period of streamflow as it included periods of drought and floods and years of normal and extremes of runoff. This period (1928-51) was considered to be indicative of expected future flows and was used as the base period for analysis of the records.
This report contains a table of average monthly dis charge, a tabulation of daily flow duration data, and a brief description of each gaging station in or near the area.
The further development of appreciable quantities of water from the streams in the area will require holding water in storage for several months or even several years. Monthly average discharges may be used to compute the storage requirements for periods of this length; therefore, the monthly average dis charges are an important part of this report.
The duration table shows the percent of the time the daily average streamflow equaled or exceeded the in dicated flow. Duration of daily flow data are given for the period of record for each station. If the period of record does not coincide with the base period, 1928- 51, values for'the base period are also shown. Where necessary, records for short periods were extended to the base period. Thus all records were made to cover the base period.
Duration data are shown in cubic feet per second per square mile of drainage area. Assuming equal
yield from all parts of the drainage area, these data may be used to estimate the flow at any place on the stream. For example, information is desired on Locust Fork at a place where the drainage area is 200 square miles. Flow-duration data can be esti mated from data on Locust Fork near Cleveland (table 2). A daily flow of 3. 6 cfs (200 square miles x . 018 cfs) may be expected to be equaled or exceeded 99 percent of the time, and a daily flow of 102 cfs (200 square miles x . 51 cfs) may be expected to be equaled or exceeded 50 percent of the time. The esti mated flow per square mile for the period 1928-51 was used because that period was more nearly repre sentative of average conditions than the period of rec ord 1938-51.
Care should be exercised in using this method be cause all parts of most drainage areas do not have equal yields or the same runoff characteristics. (See table 2.)
In general, the possible error increases with an in crease in the distance between the gaging station and the places where discharge information is desired.
Big Canoe Creek near Gadsden. Big Canoe Creek drains a flat valley northeast of Birmingham, which could be considered an extension of/Birmingham val ley. The stream flows northeastward into the Coosa River.
The gaging station is in the SWV4 sec. 15, T. 13 S., R. 5 E., at bridge on U. S. Highway 11, 5 miles up stream from the mouth and about 50 miles northeast of Birmingham. Discharge records have been col lected at this site since January 1938. (See table 3.) The drainage area at the gage is 238 square miles. The average discharge for the 12-year period of rec ord (1939-51) is 447 cfs and for the base period (1928- 51) 430 cfs (estimated).
Coosa River near Cropwell. The Coosa River rises in the mountains of North Georgia. It flows through eastern and central Alabama and its waters eventually reach the Gulf of Mexico by way of the Alabama and Mobile Rivers and Mobile Bay. The river passes east
Table 3. Monthly and annual discharge, Big Canoe Creek near Gadsden
[Cubic feet per second]
Year
1937-381938-391939-401940-411941-42
1942-431943-441944-451945-461946-47
1947-481948-491949-501950-51
Oct.
_-
31.126.019.9
75.819.220.064.565.9
20.419. 5
15978. 1
Nov.
_-
28.510846.9
39.623.825.0
137213
63.52,366
12784.7
Dec.
_-
54.8307474
2,47036.9
107592388
338786253290
Jan.
637-
588458211
353243508
1,7582,168
4192, 191
582449
Feb.
2571,1161,609
3351,096
5031,3131,2872, 533
334
1,8051,597
639848
Mar.
1,606929795437966
1,3661,518945
1,1491,147
989686
1,5101,876
Apr.
2,207533412347166
1,0611,244784250927
1,024552234
1,014
May
19437589.670.2
174
82.0208411383266
58.8340199126
June
20141329529.931.2
34.650.0
111153160
48.610110095.6
July
532303
1,17337037.3
34.735.051.8
19741.3
66.3285549217
Aug.
53838282. S
509236
61.825.044.651.834.9
16411211858.4
Sept.
_12231.023.3
387
26.174.219.5
22217.8
34.493.0
432150
Annual
--
429252316
511395353613483
413754409438
18 WATER SUPPLY OF THE BIRMINGHAM AREA, ALA.
Table 4. Monthly and annual discharge, Kelly Creek near Vincent
[Cubic feet per second]
Year
1951-52
Oct.
-
Nov.
-
Dec.
1,282
Jan.
599
Feb.
459
Mar.
1,081
Apr.
191
May
40. 1
June
16.3
July
7.32
Aug.
114
Sept.
28.3
Annual
-
of Birmingham coming within about 30 miles at the nearest point. Discharge at this point is very nearly the same as the flow at the gaging station at Cropwell.
The gaging station is in the SB 1/! sec. 33, T. 17 S. , R. 4 E., at the bridge on State Route 48, 4 miles southeast of Cropwell. Discharge records have been collected at this site since March 1942. The drainage area at the gage is 7,690 square miles. Monthly dis charges were computed for the period 1896 to 1942 to show the relation of streamflow for the base period (1928-51) to that for the longer period (1896-1951). Monthly mean discharges for the period 1914-42 were computed on the basis of records for the station at Childersburg (drainage area, 8, 390 square miles); and for the period 1896-1914 on the basis of records for the station at Riverside (drainage area, 7, 060 square miles).
Average discharge for the period of record (1942-51) is 13,900 cfs. The estimated discharge for the base period (1928-51) is 13,000 cfs and for the longer pe riod (1896-1951) is 13,500 cfs.
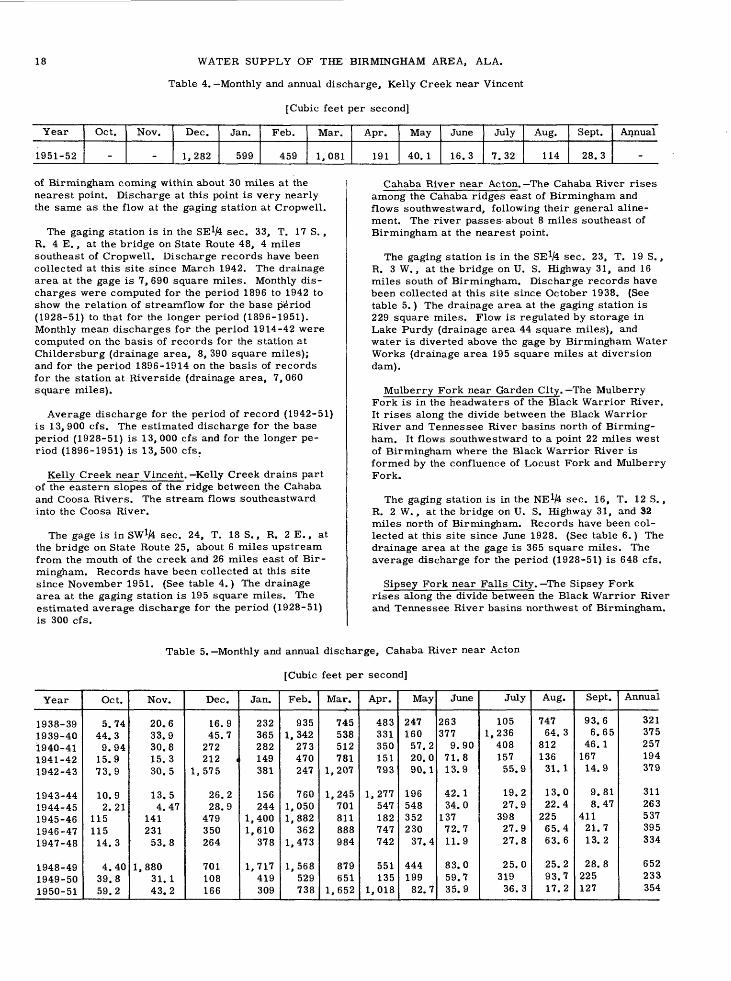
Kelly Creek near Vincent. Kelly Creek drains part of the eastern slopes of the ridge between the Cahaba and Coosa Rivers. The stream flows southeastward into the Coosa River.
The gage is in SWx/4 sec. 24, T. 18 S., R. 2 E., at the bridge on State Route 25, about 6 miles upstream from the mouth of the creek and 26 miles east of Bir mingham. Records have been collected at this site since November 1951. (See table 4.) The drainage area at the gaging station is 195 square miles. The estimated average discharge for the period (1928-51) is 300 cfs.
Cahaba River near Acton. The Cahaba River rises among the Cahaba ridges east of Birmingham and flows southwestward, following their general aline- ment. The river passes-about 8 miles southeast of Birmingham at the nearest point.
The gaging station is in the SE 1/* sec. 23, T. 19 S., R. 3 W., at the bridge on U. S. Highway 31, and 16 miles south of Birmingham. Discharge records have been collected at this site since October 1938. (See table 5.) The drainage area at the gaging station is 229 square miles. Flow is regulated by storage in Lake Purdy (drainage area 44 square miles), and water is diverted above the gage by Birmingham Water Works (drainage area 195 square miles at diversion dam).
Mulberry Fork near Garden City. The Mulberry Fork is in the headwaters of the Black Warrior River. It rises along the divide between the Black Warrior River and Tennessee River basins north of Birming ham. It flows southwestward to a point 22 miles west of Birmingham where the Black Warrior River is formed by the confluence of Locust Fork and Mulberry Fork.
The gaging station is in the NE 1/* sec. 16, T. 12 S., R. 2 W., at the bridge on U. S. Highway 31, and 32 miles north of Birmingham. Records have been col lected at this site since June 1928. (See table 6.) The drainage area at the gage is 365 square miles. The average discharge for the period (1928-51) is 648 cfs.
Sipsey Fork near Falls City. The Sipsey Fork rises along the divide between the Black Warrior River and Tennessee River basins northwest of Birmingham.
Table 5. Monthly and annual discharge, Cahaba River near Acton
[Cubic feet per second]
Year
1938-391939-401940-411941-421942-43
1943-441944-451945-461946-471947-48
1948-491949-501950-51
Oct.
5.7444.39.9415.973.9
10.92.21
11511514.3
4.4039.859.2
Nov.
20.633.930.815. 330.5
13.54.47
14123153.8
1,88031.143.2
Dec.
16.945.7272212 ,
1,575
26.228.9
479350264
701108166
Jan.
232365282149381
156244
1,4001,610
378
1,717419309
Feb.
9351,342
273470247
7601,0501,882
3621,473
1,568529738
Mar.
745538512781
1,207
1,245701811888984
879651
1,652
Apr.
483331350151793
1,277547182747742
551135
1,018
May
24716057.220.090.1
19654835223037.4
44419982.7
June
263377
9.9071.813.9
42.134.0
13772.711.9
83.059.735.9
July
1051,23640815755.9
19.227.9
39827.927.8
25.031936.3
Aug.
74764. 3
81213631.1
13.022.4
22565.463.6
25.293.717.2
Sept.
93.66.65
46.116714.9
9.818.47
41121.713. 2
28.8225127
Annual
321375257194379
311263537395334
652233354

SURFACE WATER
Table 6.-Monthly and annual discharge. Mulberry Fork near Garden City
[Cubic feet per second]
19
Year
1927-281928-291929-301930-311931-32
1932-331933-341934-351935-361936-37
1937-381938-391939-401940-411941-42
1942-431943-441944-451945-461946-47
1947-481948-491949-501950-51
Oct.
13427018.751.8
1,0709.29
74329.822.7
2486.819.312.6
115
38.29.6
25.413.184.5
62.85. 83
40944.3
Nov.
1043,590
31694.8
54722.4
356246
8.7
62.719611.651.4
123
79.919.217.167. 1
1,206
1801,729
33370.5
Dec.
801,060
3781,850
3,600105416256161
19412245.0
192816 .
1,99448.0208640795
3271,267
567310
Jan.
1,230754747
1,770
1,000889906
2,8613, 160
5891,027
353626630
704380
1,1382,8953,046
4153,0212, 200T
990
Feb.
1, 140693659
2,650
1,530285
1,0912, 1221,262
3023,4431,693
4431, 130
9662,2901,8752,862
677
3, 3042,3831,6211,809
Mar.
3,3601,350
588649
9491,6432, 135
998636
1,4351,3041,498
7141,366
1,8552,6691,5881,1451,468
1,2831,2172,3842,647
Apr.
894351647-
1,020449
1,0342,050
999
1,943822
1,072432276
9271,5831,013
5021,059
1,209774308
1,450
May
1,6201,050
158-
58714672571.6
991
15421316275.674.2
149404491731348
131518260166
June
16616929.7-
4158312436.988.8
12177210718.432.9
88.5167144418244 .
137482590124
July
33472.810449.5
1,250
181613106460127
459203
1,60054653.3
72.857.939.4
68340.8
41.5729502268
Aug.
44420.268.3130455
8150867.5162143
52728258.5
1,334465
75.148.450.446.343.4
76.390.5
21654.4
Sept.
55718384.05.4
112
6359.88.2
40.9127
25.513440.663.168.0
11764.014.4
37821.4
10.114126971.4
Annual
752794308
889446642772643
506690552378427
589638542854755
5861,021
803660
Table 7. -Monthly and annual discharge, Sipsey Fork near Falls City
[Cubic feet per second]
Year
1943-441944-451945-461946-47
1947-481948-491949-501950-51
Oct.
20.133.524.7
121
29.029.869.086.0
Nov.
38.344.491.1
966
1261,278
87.8150
Dec.
76.8273508632
208750384277
Jan.
192855
3, 3282,600
1823,8672,553
879
Feb.
1,7031,7912,974
738
2,8021,9032,0602,263
Mar.
2,5481,4041,0331,207
1,9501,2542,1002,735
Apr.
1,617865415
1, 382
, 989817411
1,151
May
556325554329
194747504196
June
253103232152
55.977838279.7
July
59.758.7
33950.7
46.1531305120
Aug.
13766.5
23445.2
34.511524840.4
Sept.
11930.9
53627. 1
32.927542661.2
Annual
605479844688
S4S
1,024789660
20 WATER SUPPLY OF THE BIRMINGHAM AREA, ALA.
Table 8. Monthly and annual discharge, Clear Creek at Falls City
[Cubic feet per second]
Year
1939-401940-411941-421942-431943-44
1944-451945-461946-471947-481948-49
1949-501950-51
Oct.
51.642.738.825.924. 1
36.533.587.829.327. 1
63.861.1
Nov.
47.791.152.439.138.5
45.278.8
427105508
61.691.1
Dec.
67.519314736450.2
184258294137373
207134
Jan.
154312139125112
4211,271
970124
1,516
1,019330
Feb.
604180289240597
7671,135
3031,083
773
941883
Mar.
489332407507981
590443540745570
839998
Apr.
325219132251698
411165555399356
207507
May
12165.365.894.0
249
197202191119278
218128
June
11338.641.246.3135
10010011360.7348
17573.7
July
82510729.840.057.3
84.528950.748.1176
17772.6
Aug.
82.612613339.0
127
54.011248.942.992.8
11235.0
Sept.
45.729.932.262.3
125
38.628330.631.4
182
20050.1
Annual
243145125153265
241360301240431
349276
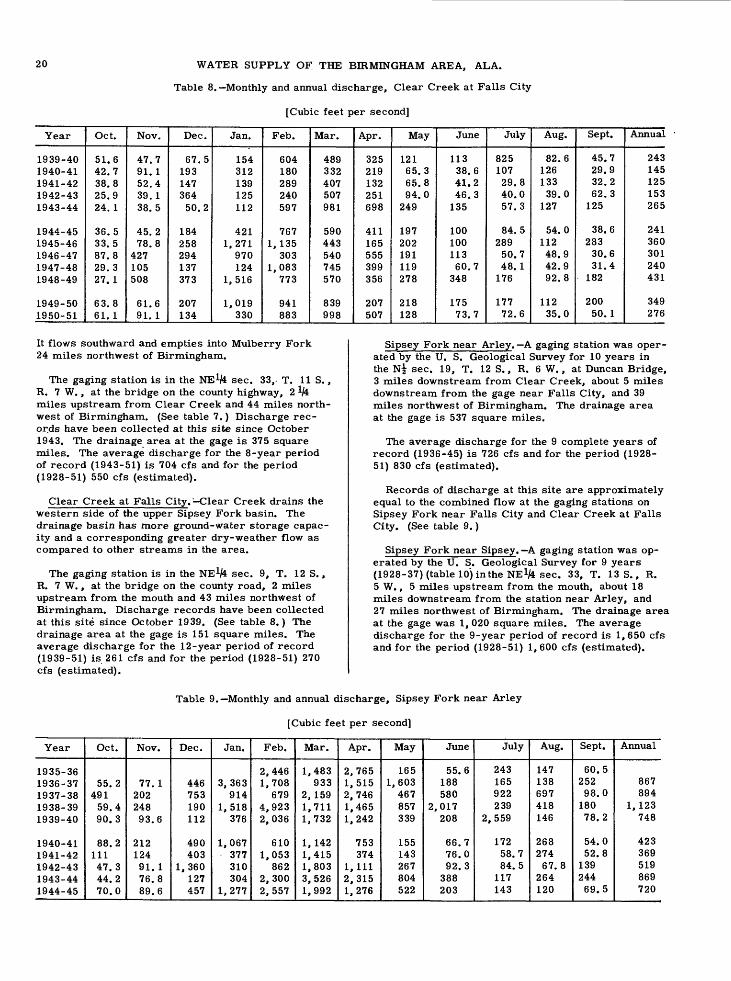
It flows southward and empties into Mulberry Fork 24 miles northwest of Birmingham.
The gaging station is in the NE 1/* sec. 33, T. US., R. 7 W., at the bridge on the county highway, 2 1/4 miles upstream from Clear Creek and 44 miles north west of Birmingham. (See table 7.) Discharge rec ords have been collected at this site since October 1943. The drainage area at the gage is 375 square miles. The average discharge for the 8-year period of record (1943-51) is 704 cfs and for the period (1928-51) 550 cfs (estimated).
Clear Creek at Falls City.' Clear Creek drains the western side of the upper Sipsey Fork basin. The drainage basin has more ground-water storage capac ity and a corresponding greater dry-weather flow as compared to other streams in the area.
The gaging station is in the NE 1/* sec. 9, T. 12 S., R. 7 W., at the bridge on the county road, 2 miles upstream from the mouth and 43 miles northwest of Birmingham. Discharge records have been collected at this site since October 1939. (See table 8.) The drainage area at the gage is 151 square miles. The average discharge for the 12-year period of record (1939-51) is 261 cfs and for the period (1928-51) 270 cfs (estimated).
Sipsey Fork near Arley. A gaging station was oper ated by the U. S. Geological Survey for 10 years in the N| sec. 19, T. 12 S., R. 6 W., at Duncan Bridge, 3 miles downstream from Clear Creek, about 5 miles downstream from the gage near Falls City, and 39 miles northwest of Birmingham. The drainage area at the gage is 537 square miles.
The average discharge for the 9 complete years of record (1936-45) is 726 cfs and for the period (1928- 51) 830 cfs (estimated).
Records of discharge at this site are approximately equal to the combined flow at the gaging stations on Sipsey Fork near Falls City and Clear Creek at Falls City. (See table 9.)
Sipsey Fork near Sipsey. A gaging station was op erated by the U. S. Geological Survey for 9 years (1928-37) (table 10) in the NE 1/* sec. 33, T. 13 S., R. 5 W., 5 miles upstream from the mouth, about 18 miles downstream from the station near Arley, and 27 miles northwest of Birmingham. The drainage area at the gage was 1, 020 square miles. The average discharge for the 9-year period of record is 1, 650 cfs and for the period (1928-51) 1, 600 cfs (estimated).
Table 9. Monthly and annual discharge, Sipsey Fork near Arley
[Cubic feet per second]
Year
1935-361936-371937-381938-391939-40
1940-411941-421942-431943-441944-45
Oct.
55.249159.490.3
88.211147.344.270.0
Nov.
77.120224893.6
21212491.176.889.6
Dec.
446753190112
490403
1,360127457
Jan.
3,363914
1,518376
1,067377310304
1,277
Feb.
2,4461,708
6794,9232,036
6101,053
8622,3002,557
Mar.
1,483933
2,1591,7111,732
1,1421,4151,8033,5261,992
Apr.
2,7651,5152,7461,4651,242
753374
1,1112,3151,276
May
1651,603467857339
155143267804522
June
55.6188580
2,017208
66.776.092.3
388203
July
243165922239
2,559
17258.784.5
117143
Aug.
147138697418146
26827467.8
264120
Sept.
60.525298.018078.2
54.052.8
13924469.5
Annual
867894
1,123748
423369519869720

SURFACE WATER
Table 10. Monthly and annual discharge, Sipsey Fork near Sipsey
[Cubic feet per second]
21
Year
1928-291929-301930-311931-321932-33
1933-341934-351935-361936-37
Oct.
64839911449.6
3,890
98.31,123
91.869.0
Nov.
6878,3801,270
1151,810
12946143186.4
Dec.
4402,6801,1203,6508,070
433832516549
Jan.
2,6701,5801,6905,0702,400
1,4722,0884,6007,801
Feb.
2,6101,4901,7406,7903,720
7241,9595,4793,206
Mar.
9,4502,7102,1401,9402,580
4,1015,5362,5931,888
Apr.
1,740903
2,160b2, 0003,040
1,1302,1175,1242,566
May
4,3203,720
587bl,0001,120
3981,768
4163,254
June
533a316153
b500241
61849679.9
268
July
322a!09172
2,150403
828155468210
Aug.
126327215525295
365128260247
Sept.
451491562438266
10843.8108429
Annual
2,010al,922
9462,0202,320
8721,3941,6631,712
a Revised for this report. b Estimated.
Table 11. Monthly and annual discharge, Blackwater Creek near Manchester
[Cubic feet per second]
Year
1938-391939-401940-411941-421942-43
1943-441944-451945-461946-471947-48
1948-491949-501950-51
Oct.
13.036.714.226.814.7
7.2919.723.690.610.2
11.948.944.0
Nov.
45.922.642.839.531.5
15.522.363.8
63171.0
56148.066.2
Dec.
56.451.2147207502
30. 1117361347144
733220149
Jan.
476236351183204
104483
1,5171,334
169
1,6381,260
419
Feb.
1,598872228376339
624970
1,349360
1,342
9741,1131,027
Mar.
676563406531820
1,069795544838819
6071,0911,125
Apr.
416436202140294
953461178600502
431211807
May
30511942.144.874.5
26722222423690.5
253191107
June
66485.515.819.420.2
73.977. 198.5
14874.3
41813953.4
July
86.896172.223.515.4
28.756.4
27235.429.8
18725978.8
Aug.
23142.315413915.8
77.387.3
17130.315.4
51.817923.3
Sept.
89.122.217.237.048.1
74.625.5
39213.510.8
17238930.7
Annual
379286141146198
275274428389268
501426323
Table 12.-Monthly and annual discharge, Locust Fork near Cleveland
[Cubic feet per second]
Year
1936-371937-381938-391939-401940-41
1941-421942-431943-441944-451945-46
1946-471947-481948-491949-501950-51
Oct.
_256
7.015.020.0
14454.110.018.920.4
81.16.8512.5
12345.4
Nov.
_70.0
14415.059.7
15977.214.010. &86.1
96635.1
2,12319355< 9*
Dec.
40015184.830.0
286
7532,448
24.672.7
573
677141
1,131367356
Jan.
3,084586709240472
497789225718
2,399
3,158339
2,8831,614
745
Feb.
1,108345
2, 1651,693
288
1,0911,0032,0401,7312,700
5102,3751,9861,2651,122
Mar.
5251,3071,3281,129
361
1,0761,4652,0231,4531,369
1,2611,123
8082,1432,382
Apr.
5082,164
588934290
214851
1,294686531
8291,294
781310
1,177
May
1,06713622410270.4
60.0148302338692
21075.6
445242136
June
13921127012719.0
40.096.650.775.6191
11275.1164179191
July
92.2401103650236
30.013917.543.8284
70.995.1134609389
Aug.
14728723282.4
1,030
36158.621.219.461.0
30.568.030.5
243119
Sept.
45.826.150.030.750.5
17235.940.18.63
219
13.817.875.5
48366.0
Annual
-495481415267
380597499423750
663461873646563
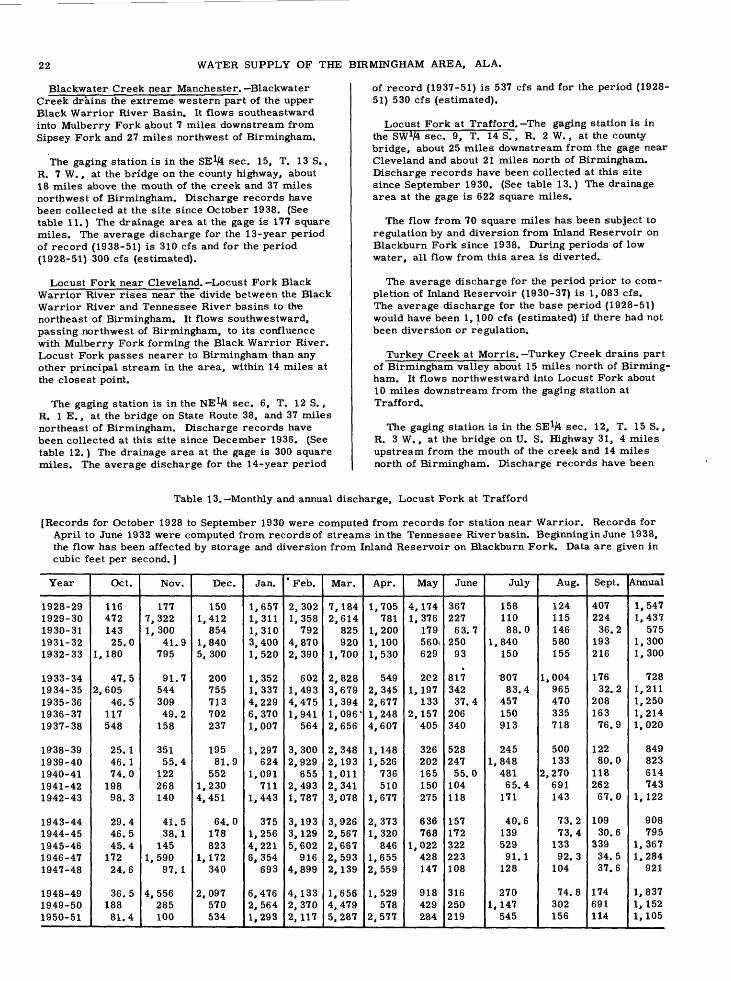
22 WATER SUPPLY OF THE BIRMINGHAM AREA, ALA.
Blackwater Creek near Manchester. Blackwater Creek drains the extreme western part of the upper Black Warrior River Basin. It flows southeastward into Mulberry Fork about 7 miles downstream from Sipsey Fork and 27 miles northwest of Birmingham.
The gaging station is in the SE 1/* sec. 15, T. 13 S., R. 7 W., at the bridge on the county highway, about 18 miles above the mouth of the creek and 37 miles northwest of Birmingham. Discharge records have been collected at the site since October 1938. (See table 11.) The drainage area at the gage is 177 square miles. The average discharge for the 13-year period of record (1938-51) is 310 cfs and for the period (1928-51) 300 cfs (estimated).
Locust Fork near Cleveland. Locust Fork Black Warrior River rises near the divide between the Black Warrior River and Tennessee River basins to the northeast of Birmingham. It flows southwestward, passing northwest of Birmingham, to its confluence with Mulberry Fork forming the Black Warrior River. Locust Fork passes nearer to Birmingham than any other principal stream in the area, within 14 miles at the closest point.
The gaging station is in the NE 1/* sec. 6, T. 12 S., R. IE., at the bridge on State Route 38, and 37 miles northeast of Birmingham. Discharge records have been collected at this site since December 1936. (See table 12.) The drainage area at the gage is 300 square miles. The average discharge for the 14-year period
of record (1937-51) is 537 cfs and for the period (1928- 51) 530 cfs (estimated).
Locust Fork at Trafford.-The gaging station is in the SWx/4 sec. 9, T. 14 S., R. 2 W., at the county bridge, about 25 miles downstream from the gage near Cleveland and about 21 miles north of Birmingham. Discharge records have been collected at this site since September 1930. (See table 13.) The drainage area at the gage is 622 square miles.
The flow from 70 square miles has been subject to regulation by and diversion from Inland Reservoir on Blackburn Fork since 1938. During periods of low water, all flow from this area is diverted..
The average discharge for the period prior to com pletion of Inland Reservoir (1930-37) is 1, 083 cfs. The average discharge for the base period (1928-51) would have been 1, 100 cfs (estimated) if there had not been diversion or regulation.
Turkey Creek at Morris. Turkey Creek drains part of Birmingham valley about 15 miles north of Birming ham. It flows northwestward into Locust Fork about 10 miles downstream from the gaging station at Trafford.
The gaging station is in the SE 1/* sec. 12, T. 15 S., R. 3 W., at the bridge on U. S. Highway 31, 4 miles upstream from the mouth of the creek and 14 miles north of Birmingham. Discharge records have been
Table 13. Monthly and annual discharge, Locust Fork at Trafford
[Records for October 1928 to September 1930 were computed from records for station near Warrior. Records for April to June 1932 were computed from records of streams in the Tennessee River basin. Beginning in June 1938, the flow has been affected by storage and diversion from Inland Reservoir on Blackburn Fork. Data are given in cubic feet per second. ]
Year
1928-291929-301930-311931-321932-33
1933-341934-351935-361936-371937-38
19^38-391939-401940-411941-421942-43
1943-441944-451945-461946-471947-48
1948-491949-501950-51
Oct.
11647214325.0
1,180
47.52,605
46.5117548
25.146.174.019898. 3
29.446.545.417224.6
36.518881.4
Nov.
1777,3221,300
41.9795
91.754430949.2158
35155.4
122268140
41.538.1
1451,590
97.1
4,556285100
Dec.
1501,412
8541,8405,300
200755713702237
19581.9
5521,2304,451
64.0178823
1,172340
2,097570534
Jan.
1,6571,3111,3103,4001,520
1,3521,3374,2296,3701,007
1,297624
1,091711
1,443
3751,2564,2216,354
693
6,4762,5641,293
"Feb.
2,3021,358
7924,8702,390
6021,4934,4751,941
564
3,3002,929
6552,4931,787
3,1933,1295,602
9164,899
4,1332,3702,117
Mar.
7,1842,614
825920
1,700
2,8283,6791,3941,096'2,656
2,3482,1931,0112,3413,078
3,9262,5672,6672,5932,139
1,6564,4795,287
Apr.
1,705781
1,2001,1001,530
5492,3452,6771,2484,607
1,1481,526
736510
1,677
2,3731,320
8461,6552,559
1,529578
2,577
May
4,1741,376
179560i629
2021,197
1332,157
405
326202165150275
636768
1,022428147
918429284
June
36722763.7
25093
81734237.4
206340
52824755.0
104118
157172322223108
316250219
July
15811088.0
1,840150
807
83.4457150913
2451,848
48165.4
171
40.613952991.1128
2701,147
545
Aug.
124115146580155
1,004965470335718
500133
2,270691143
73.273.4
13392.3104
74.8302156
Sept.
40722436.2
193216
17632.2
20816376.9
12280.0
11826267.0
10930.6
33934.537.6
174691114
Annual
1,5471,437
5751,3001,300
7281,2111,2501,2141,020
849823614743
1,122
908795
1,3671,284
921
1,8371, 1521,105

CD
CO
CO
CO
tO
tO
DO
DO
i-> o
co
co
1 1
1 1
tO
tO
tO
DO
M
H-
O
CO
H- e
n H-
co
en
o i
t*,
co o
it*,
-a
00
H>
CO
en
it*,
toit*
00
01
CO
CO O
O
00
oo JO
H
- H
-
to H
- co
H-
o o
H-
co
o o
o o
it*
H-
H-
M
Ji.
O3
O3
l->
-4
CO
00 it*
o o
o o
-J I-
1 !-
C
O »
< %
%
H- o
-a
coCO
O
W
-3
o o
o o
i->
i->
oa c
o*
»
* *
H- o
w c
o-J
DO
~
J CO
O
O
Q
O
H*
l->
M
-3 O
M
O3
O
O
00
0
^
"tO
~
J 03
H-
O3
CO
to o
o
to i
t*,
oo
oo e
n-J
00 -J
i >
H-
H-
Mto
to
o
m
co o
tO
H-
H-
H-r
fi.cn
I-1
-3
00
M
W
*>
CO
DO
rf*
rf^_
rf^
en
I »
h-»
-j o
o co
01
w
co-J
0
0
Water
year § 2! s s? o CH
fu
? *1
0> cr E £ ^ I 1 0> g vj £
era CO
(V o Annual
FLO
OD
D
ISC
HA
RG
E,
IN
CU
BIC
F
EE
T
PE
R
SE
CO
ND
P
ER
S
QU
AR
E
MIL
E
tf
co c
o co
o c
o oo
i i
iUl
01
it*
*- o c
o
I-*
CO
l->
ui o
o co
-J CO
I-
*
!-
CO H-
co i
t* 01 CO
<n i
t* 01
ui H
- to
<n -
a
l-»
l->
OJco i
f. co
-3 O3 O
»O H- 01
-j e
n H-
to t
o oo
01
it*
tO
tO -J
O
CO
H-co e
n -q
00
rf*
00
CO
to *
* rf*
-J 01
1 * 00
rf*
co c
o 01
00 0
1 01
oo 0
1 to
en t
o co
o -
J co
CD 00 O
co t
o to
O CO
£>
Oi H- 00
H»
CO
co c
o to
ui t
o co
0
co c
o co c
o co
-q e
n 01 i
t* to
i i
i i
ioo -
<3 en 0
1 rf*
I tO tO H»
to e
n co >
->oo e
n to ~
j
to 0
1 en H
- co i
» en i
t*o
01 c
o
CO CO O3 CO
co t
o co j
^jl-
> Ol
1-1 e
n rf*
i
01 to 00 tO
it*
0
01 H
- -q t
o co
O t
o co c
o -q
en o 0
1 en t
o
to t
o co c
o it*
rf*
-j
oo c
o to
o o
o -j 0
1 to
tO CO
1 DO
to o
o -j e
n co
i »
it* i
t* co c
o co
01 0
1 to o
o oo
CO
CO Ol
CO -J -J tO rf
*01 o
o o H
* to
co o i
-* i 0
1
CO CO 00 CO CO
oo -
q 01 0
1 i-*
i-> O to Ol -J
CO
rf* -J
1 CO
co 0
1 co ~
j co
01 o H
- H- t
o
rf* 01 -J
Ol -J
co ~
1 o c
o 01
to -
j oo c
orf
* H-
rf* CO
CO
s 0
o 2! o 1 cr | f ! % 9 C, ^ & UU CO o I
O
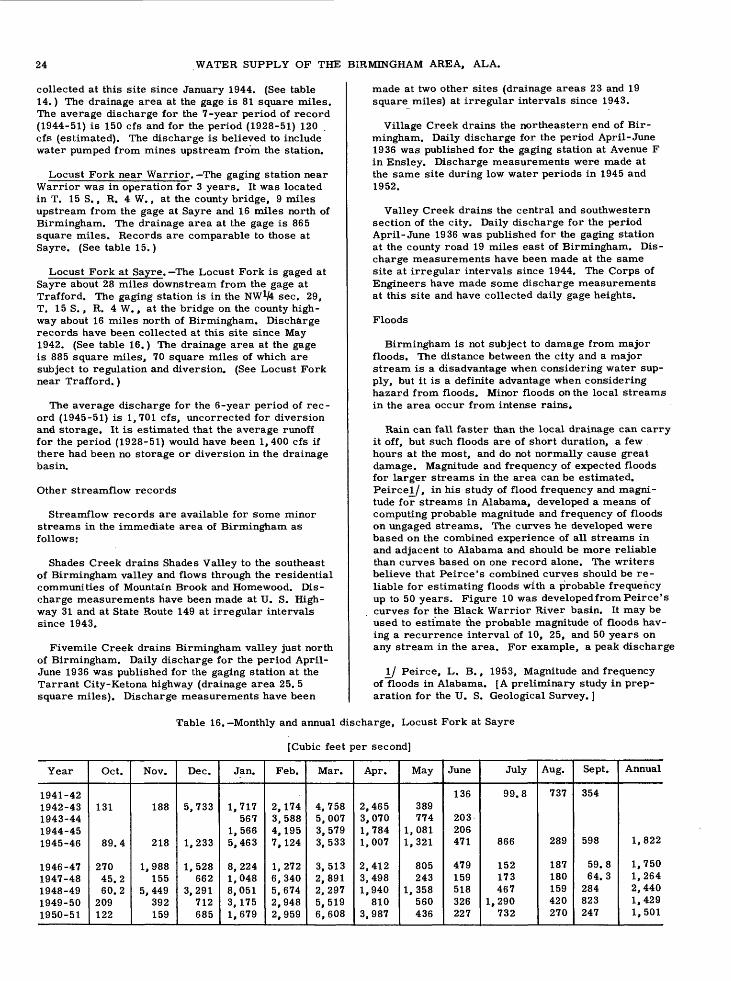
24 WATER SUPPLY OF THE BIRMINGHAM AREA, ALA.
collected at this site since January 1944. (See table 14.) The drainage area at the gage is 81 square miles. The average discharge for the 7-year period of record (1944-51) is 150 cfs and for the period (1928-51) 120 . cfs (estimated). The discharge is believed to include water pumped from mines upstream from the station.
Locust Fork near Warrior. The gaging station near Warrior was in operation for 3 years. It was located in T. 15 S., R. 4 W., at the county bridge, 9 miles upstream from the gage at Sayre and 16 miles north of Birmingham. The drainage area at the gage is 865 square miles. Records are comparable to those at Sayre. (See table 15.)
Locust Fork at Sayre. The Locust Fork is gaged at Sayre about 28 miles downstream from the gage at Trafford. The gaging station is in the NW*M sec. 29, T. 15 S., R. 4 W., at the bridge on the county high way about 16 miles north of Birmingham. Discharge records have been collected at this site since May 1942. (See table 16.) The drainage area at the gage is 885 square miles, 70 square miles of which are subject to regulation and diversion. (See Locust Fork near Trafford.)
The average discharge for the 6-year period of rec ord (1945-51) is 1,701 cfs, uncorrected for diversion and storage. It is estimated that the average runoff for the period (1928-51) would have been 1,400 cfs if there had been no storage or diversion in the drainage basin.
Other streamflow records
Streamflow records are available for some minor streams in the immediate area of Birmingham as follows:
Shades Creek drains Shades Valley to the southeast of Birmingham valley and flows through the residential communities of Mountain Brook and Homewood. Dis charge measurements have been made at U. S. High way 31 and at State Route 149 at irregular intervals since 1943.
Fivemile Creek drains Birmingham valley just north of Birmingham. Daily discharge for the period April- June 1936 was published for the gaging station at the Tarrant City-Ketona highway (drainage area 25. 5 square miles). Discharge measurements have been
made at two other sites (drainage areas 23 and 19 square miles) at irregular intervals since 1943.
Village Creek drains the northeastern end of Bir mingham. Daily discharge for the period April-June 1936 was published for the gaging station at Avenue F in Ensley. Discharge measurements were made at the same site during low water periods in 1945 and 1952.
Valley Creek drains the central and southwestern section of the city. Daily discharge for the period April-June 1936 was published for the gaging station at the county road 19 miles east of Birmingham. Dis charge measurements have been made at the same site at irregular intervals since 1944. The Corps of Engineers have made some discharge measurements at this site and have collected daily gage heights.
Floods
Birmingham is not subject to damage from major floods. The distance between the city and a major stream is a disadvantage when considering water sup ply, but it is a definite advantage when considering hazard from floods. Minor floods on the local streams in the area occur from intense rains*
Rain can fall faster than the local drainage can carry it off, but such floods are of short duration, a few hours at the most, and do not normally cause great damage. Magnitude and frequency of expected floods for larger streams in the area can be estimated. Peirceiy, in his study of flood frequency and magni tude for streams in Alabama, developed a means of computing probable magnitude and frequency of floods on ungaged streams. The curves he developed were based on the combined experience of all streams in and adjacent to Alabama and should be more reliable than curves based on one record alone. The writers believe that Peirce's combined curves should be re liable for estimating floods with a probable frequency up to 50 years. Figure 10 was developed from Peirce's curves for the Black Warrior River basin. It may be used to estimate the probable magnitude of floods hav ing a recurrence interval of 10, 25, and 50 years on any stream in the area. For example, a peak discharge
1^1 Peirce, L. B., 1953, Magnitude and frequency of floods in Alabama. [A preliminary study in prep aration for the U. S. Geological Survey. ]
Table 16. Monthly and annual discharge, Locust Fork at Sayre
[Cubic feet per second]
Year
1941-421942-431943-441944-451945-46
1946-471947-481948-491949-501950-51
Oct.
131
89.4
27045.260.2
209122
Nov.
188
218
1,988155
5,449392159
Dec.
5,733
1,233
1,528662
3,291712685
Jan.
1,717567
1,5665,463
8,2241,0488,0513,1751,679
Feb.
2,1743,5884,1957,124
1,2726,3405,6742,9482,959
Mar.
4,7585,0073,5793,533
3,5132,8912,2975,5196,608
Apr.
2,4653,0701,7841,007
2,4123,4981,940
8103,987
May
389774
1,0811,321
805243
1, 358560436
June
136
203206471
479159518326227
July
99.8
866
152173467
1,290732
Aug.
737
289
187180159420270
Sept.
354
598
59.864.3
284823247
Annual
1,822
1,7501,2642,4401,4291,501

SURFACE WATER 25
X I-
UJa.
(O UJXo
oUJI- < O
o oa:UJa.
ou_
< u_
UJ O <crUJ
I- coUJ
3,0
2.0
1.0
0 8 10 12CONSECUTIVE MONTHS
Figure 11. Drought frequencies (precipitation).
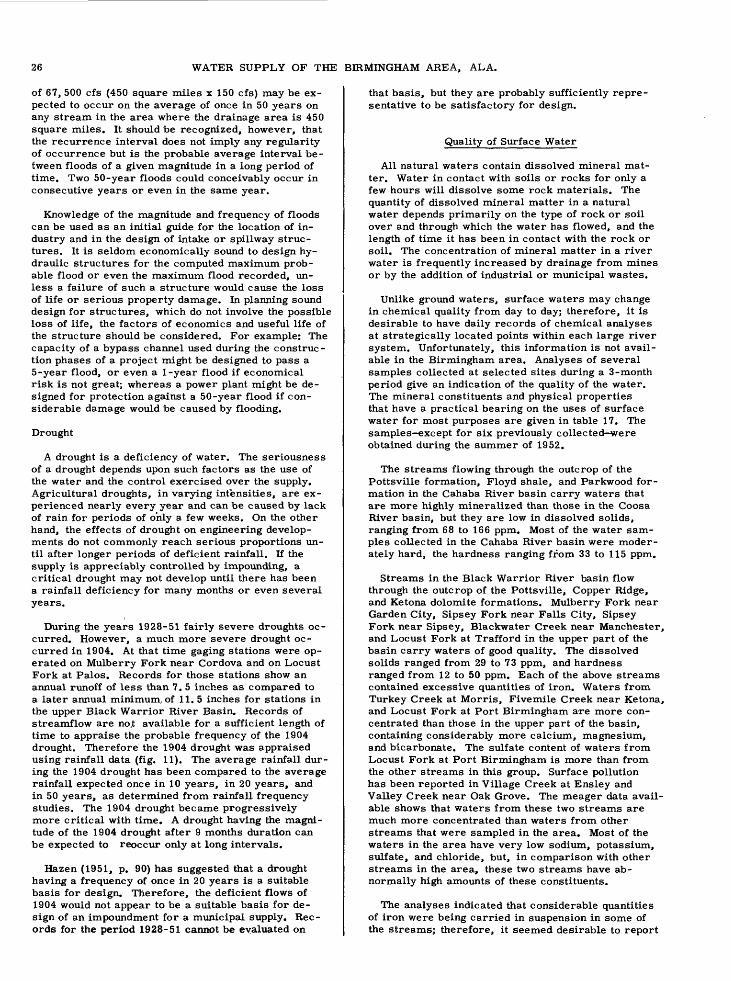
26 WATER SUPPLY OF THE BIRMINGHAM AREA, ALA.
of 67, 500 cfs (450 square miles x 150 cfs) may be ex pected to occur on the average of once in 50 years on any stream in the area where the drainage area is 450 square miles. It should be recognized, however, that the recurrence interval does not imply any regularity of occurrence but is the probable average interval be tween floods of a given magnitude in a long period of time. Two 50-year floods could conceivably occur in consecutive years or even in the same year.
Knowledge of the magnitude and frequency of floods can be used as an initial guide for the location of in dustry and in the design of intake or spillway struc tures. It is seldom economically sound to design hy draulic structures for the computed maximum prob able flood or even the maximum flood recorded, un less a failure of such a structure would cause the loss of life or serious property damage. In planning sound design for structures, which do not involve the possible loss of life, the factors of economics and useful life of the structure should be considered. For example: The capacity of a bypass channel used during the construc tion phases of a project might be designed to pass a 5-year flood, or even a 1-year flood if economical risk is not great; whereas a power plant might be de signed for protection against a 50-year flood if con siderable damage would be caused by flooding.
Drought
A drought is a deficiency of water. The seriousness of a drought depends upon such factors as the use of the water and the control exercised over the supply. Agricultural droughts, in varying intensities, are ex perienced nearly every year and can be caused by lack of rain for periods of only a few weeks. On the other hand, the effects of drought on engineering develop ments do not commonly reach serious proportions un til after longer periods of deficient rainfall. If the supply is appreciably controlled by impounding, a critical drought may not develop until there has been a rainfall deficiency for many months or even several years.
During the years 1928-51 fairly severe droughts oc curred. However, a much more severe drought oc curred in 1904. At that time gaging stations were op erated on Mulberry Fork near Cordova and on Locust Fork at Palos. Records for those stations show an annual runoff of less than 7. 5 inches as compared to a later annual minimum, of 11. 5 inches for stations in the upper Black Warrior River Basin. Records of streamflow are noj: available for a sufficient length of time to appraise the probable frequency of the 1904 drought. Therefore the 1904 drought was appraised using rainfall data (fig. 11). The average rainfall dur ing the 1904 drought has been compared to the average rainfall expected once in 10 years, in 20 years, and in 50 years, as determined from rainfall frequency studies. The 1904 drought became progressively more critical with time. A drought having the magni tude of the 1904 drought after 9 months duration can be expected to reoccur only at long intervals.
Hazen (1951, p. 90) has suggested that a drought having a frequency of once in 20 years is a suitable basis for design. Therefore, the deficient flows of 1904 would not appear to be a suitable basis for de sign of an impoundment for a municipal supply. Rec ords for the period 1928-51 cannot be evaluated on
that basis, but they are probably sufficiently repre sentative to be satisfactory for design.
Quality of Surface Water
All natural waters contain dissolved mineral mat ter. Water in contact with soils or rocks for only a few hours will dissolve some rock materials. The quantity of dissolved mineral matter in a natural water depends primarily on the type of rock or soil over and through which the water has flowed, and the length of time it has been in contact with the rock or soil. The concentration of mineral matter in a river water is frequently increased by drainage from mines or by the addition of industrial or municipal wastes.
Unlike ground waters, surface waters may change in chemical quality from day to day; therefore, it is desirable to have daily records of chemical analyses at strategically located points within each large river system. Unfortunately, this information is not avail able in the Birmingham area. Analyses of several samples collected at selected sites during a 3-month period give an indication of the quality of the water. The mineral constituents and physical properties that have a practical bearing on the uses of surface water for most purposes are given in table 17. The samples-except for six previously collected-were obtained during the summer of 1952.
The streams flowing through the outcrop of the Pottsville formation, Floyd shale, and Parkwood for mation in the Cahaba River basin carry waters that are more highly mineralized than those in the Coosa River basin, but they are low in dissolved solids, ranging from 68 to 166 ppm. Most of the water sam ples collected in the Cahaba River basin were moder ately hard, the hardness ranging from 33 to 115 ppm.
Streams in the Black Warrior River basin flow through the outcrop of the Pottsville, Copper Ridge, and Ketona dolomite formations. Mulberry Fork near Garden City, Sipsey Fork near Falls City, Sipsey Fork near Sipsey, Blackwater Creek near Manchester, and Locust Fork at Trafford in the upper part of the basin carry waters of good quality. The dissolved solids ranged from 29 to 73 ppm, and hardness ranged from 12 to 50 ppm. Each of the above streams contained excessive quantities of iron. Waters from Turkey Creek at Morris, Fivemile Creek near Ketona, and Locust Fork at Port Birmingham are more con centrated than those in the upper part of the basin, containing considerably more calcium, magnesium, and bicarbonate. The sulfate content of waters from Locust Fork at Port Birmingham is more than from the other streams in this group. Surface pollution has been reported in Village Creek at Ensley and Valley Creek near Oak Grove. The meager data avail able shows that waters from these two streams are much more concentrated than waters from other streams that were sampled in the area. Most of the waters in the area have very low sodium, potassium, sulfate, and chloride, but, in comparison with other streams in the area, these two streams have ab normally high amounts of these constituents.
The analyses indicated that considerable quantities of iron were being carried in suspension in some of the streams; therefore, it seemed desirable to report
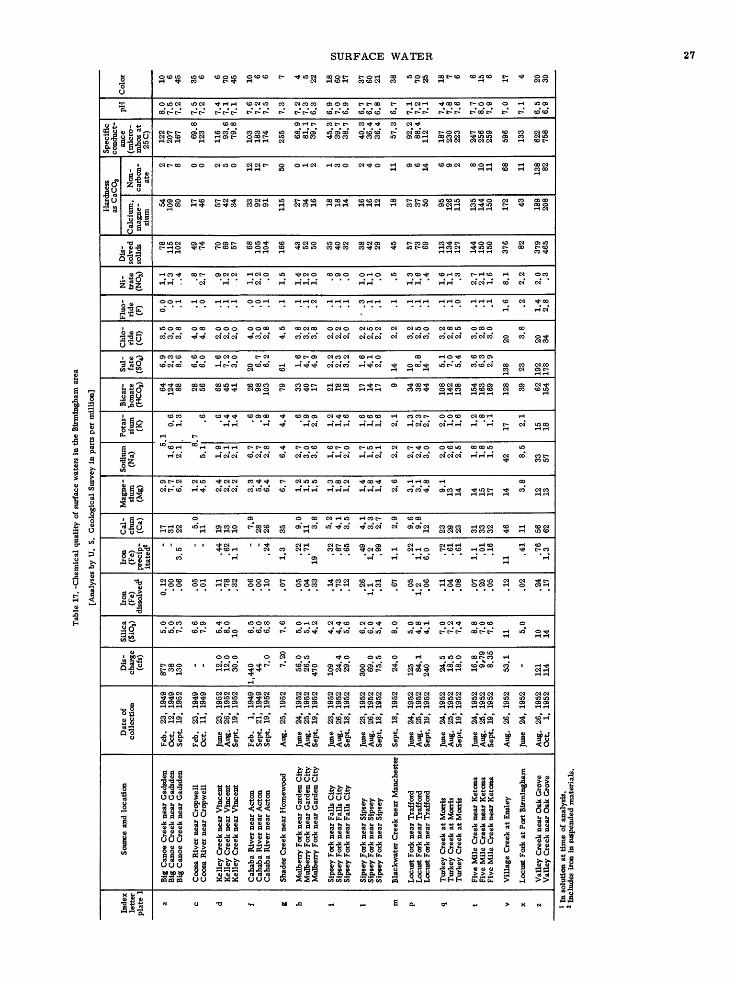
Tab
le 1
7. -
Che
mic
al q
uali
ty o
f su
rfac
e w
ater
s in
the
Bir
min
gham
are
a
[Ana
lyse
s by
U.
S.
Geo
logi
cal
Surv
ey i
n pa
rts
per
mil
lion
]
Inde
x le
tter
pl
ate
1
a c d f g h i 1 m P q t V X z
Sour
ce a
nd l
ocat
ion
Big
Can
oe C
reek
nea
r G
adsd
en
Big
Can
oe C
reek
nea
r G
adsd
en
Big
Can
oe C
reek
nea
r G
adsd
en
Coo
sa R
iver
nea
r C
ropw
ell
Coo
sa R
iver
nea
r C
ropw
ell
Kel
ley
Cre
ek n
ear
Vin
cent
K
elle
y C
reek
nea
r V
ince
ntK
elle
y C
reek
nea
r V
ince
nt
Cah
aba
Riv
er n
ear
Act
onC
ahab
a R
iver
nea
r A
cton
Cah
aba
Riv
er n
ear
Act
on
Shad
es C
reek
nea
r H
omew
ood
Mul
berr
y Fo
rk n
ear
Gar
den
Cit
yM
ulbe
rry
Fork
nea
r G
arde
n C
ity
Mul
berr
y Fo
rk n
ear
Gar
den
Cit
y
Sips
ey F
ork
near
Fal
ls C
ity
Sips
ey F
ork
near
Fal
ls C
ity
Sips
ey F
ork
near
Fal
ls C
ity
Sips
ey F
ork
near
Sip
sey
Sips
ey F
ork
near
Sip
sey
Sips
ey F
ork
near
Sip
sey
Bla
ckw
ater
Cre
ek n
ear
Man
ches
ter
Loc
ust
Fork
nea
r T
raff
ord
Loc
ust
Fork
nea
r T
raff
ord
Loc
ust
Fork
nea
r T
raff
ord
Tur
key
Cre
ek a
t M
orri
sT
urke
y C
reek
at
Mor
ris
Tur
key
Cre
ek a
t M
orri
s
Five
Mil
e C
reek
nea
r K
eton
aFi
ve M
ile
Cre
ek n
ear
Ket
ona
Five
Mil
e C
reek
nea
r K
eton
a
Vil
lage
Cre
ek a
t E
nsle
y
Loc
ust
Fork
at
Port
Bir
min
gham
Val
ley
Cre
ek n
ear
Oak
Gro
ve
Val
ley
Cre
ek n
ear
Oak
Gro
ve
Dat
e of
co
llec
tion
Feb.
23
, 19
49
Oct
. 12
, 19
49
Sept
. 19
, 19
52
Feb
. 23
, 19
49O
ct.
11,
1949
June
23
, 19
52
Aug
. 26
, 19
52S
ept.
19,
1952
Feb.
1,
19
49S
ept.
21,
1949
Sep
t. 19
, 19
52
Aug
. 25
, 19
52
June
24
, 19
52A
ug.
25,
1952
Sep
t. 19
, 19
52
June
23
, 19
52A
ug.
26,
1952
Sep
t. 18
, 19
52
June
23
, 19
52A
ug.
26,
1952
Sep
t. 18
, 19
52
Sep
t. 18
, 19
52
June
24
, 19
52A
ug.
25,
1952
Sep
t. 19
, 19
52
June
24
, 19
52A
ug.
25,
1952
Sep
t. 19
; 19
52
June
24
, 19
52A
ug.
25,
1952
Sep
t. 19
, 19
52
Aug
. 26
, 19
52
June
24
, 19
52
Aug
. 26
, 19
52
Oct
. 1,
19
52
Dis
ch
arge
(c
fs)
877 38
13
0 . - 12.0
12
.030
.0
1,44
0 44 7.0
7.20
56.0
26.5
470
109 24
.429
.0
300 69
.075
.5
24.0
125 84
.124
0 24.5
18.5
18.0
16.8
9,79
8.35
53.1 -
121
114
Sil
ica
(SiO
s)
5.0
5.0
7.3
6.6
7.9
5.4
8.
010 6
.5 6.0
6.8
7.6
5.0
5.1
4.2
4.2
4.4 5.6
6.2
6.0
5.4 8.0
5.0
4.8
4.1 7.0 7.2
7.4
8.8
7.0
7.6
11 5.0
10
14
Iron
(F
e)
diss
olve
d^
0.12
.0
0 .0
6
.05
.01
.11
.78
.32
.06
.00
.10
.07
.05
.04
.33
.14
.73
.12
.26
1.1 .31
.67
.05
1.2 .06
.11
.04
.08
.07
.20
.05
.12
.02
.24
.17
Iron
(F
e)
prec
ip
itat
ed2
3.5
- -
.44
.62
1.1
. -.2
4
1.3 .22
.71
19
.32
.87
.65
.49
1.2 .99
1.1 .2
21.
16.
0 .72
.61
.61
1.1 .01
.16
11
.41
.76
1.3
Cal
ci
um
(Ca)
17
31
22 5.0
11 19
13 10 7.9
28 26 35 9.0
11 3.8 5.2
4.1
3.5
4.1
3.3 2.7
2.9
9.6
9.8
12 23 29 23 31 33 32 46 11 56
62
Mag
ne
sium
(M
g) 2.9
7.7
6.2 1.2
4.5 2.4
2.2
2.2
3.3 5.4
6.4
6.7
1.2
1.5
1.5 1.3
1.8
1.2
1.4
1.8
1.4
2.6
3.1
3.1
4.8
9.1
13 14 14 15 17 14 3.8
12
13
Sodi
um
(Na)
5 1.
6 2.1
85.1 1.9
2.1
2.1 6.7
2.7
2.8
6.4
2.7
3.0
3.6 1.6
1.7
2.0 1.7
1.5
2.1 2.2
2.7
2.4
3.0 2.0
2.6
2.5
1.8
1.8
1.5
42 8.5
33
57
Pot
as
sium
(K
)
.1
0.6
1.3
7.6 .6
1.4
1.4 .6 .9 1.8
4.4 .6 1.9
2.9
1.2
1.4
1.6
1.6
1.6
1.6 2.1
1.3
2.3
2.7
2.0 1.0
1.6
1.2 .8 1.1
17 2.1
15
18
Bic
ar
bona
te
(HC
Os) 64
12
4 88 28 56 68
45 41 26 98 103 79 33 40 17 21 18 18 17 14 17 9 34 38 44 108
142
138
154
163
169
128 39 62
15
4
Sul
- fa
te
(SC-
4)
6.9
2.3
8.
6
6.6
6.0
1.6
7.2
3.0
20 6.7
6.2
61 1.6
4.7
4.9
2.2 2.3
3.2 1.6
4.1 2.0
14 10 8.8
14 5.1 7.0
5.4
3.6 6.3
2.9
138 23 192
178
Chl
o
ride
(C
l) 3.5
3.0
3.8
4.0
4.8 2.0
2.0
2.0
4.0 3.0
2.8
4.5
3.8
3.2
3.8 2.0
2.2
2.0
2.2
2.5
2.2 2.2
3.2 2.5
3.0
3.2 2.8 2.5
3.0 2.8
3.0
20 3.8
20
34
Flu
o-
ride
(F
) 0.0
.0 .1 .1 .0 .1
.1 .1 .0 .0 .1 .1 .1 .1 .2 .1 .1 .1
.3 .1 .1 .1 .1 .1 .1 .1 .1 .0 .1 .1 .1 1.6 .2 1.4
2.8
Ni
tr
ate
(N03
)
1.1
1.3
..4 .8 2.7 .9
1.2 .2 1.1
2.2 .0 1.5
1.4
1.2
1.0 .8 .9 .0 1.0
1.1 .0 .5 1.3
1.6 .4 1.6
1.1 .3 2.7
2.1 1.6
8.1 2.2
2.0 .3
Dis
so
lved
so
lids 78
11
5 10
2 49 74 70
69 57 68 105
104
166 43 52 50 35 40 32 38 42 29 45 57 73 69 113
134
127
144
150
150
376 82 379
465
Har
dnes
s as
CaC
Oj
Cal
cium
, m
agne
si
um
54
109 80 17 46 57
42 34 33 92 91 115 27 34 16 18 18 14 16 16 12 18 37 37 50 95 126
115
135
144
150
172 43 189
208
Non
- ca
rbon
at
e
2 7 8 0 0 2 5 0 12 12 7 50 0 1 2 1 3 0 2 4 0 11 9 6 14 6 9 2 8 10 11 68 11 138 82
Spe
cifi
c co
nduc
t
ance
(m
icro
- m
hos
at
25 C
)
122
207
167 69
.812
3
116 93
.679
.8
103
183
174
255 68
.981
.139
.7
45.3
39.7
38.7
40
.33
6.4
36.4
57.3
92.2
88
.411
2
187
230
223
247
256
259
596
133
622
758
PH 8.0
7.5
7.2
7.5
7.2
7.4
7
.17
.1 7.6
7.2
7.5
7.3
7.2
7.3
6.3
6.9 7.0
6.9
6.7
6.7
6.8 6.7
7.1 7.2
7.1
7.4
7.8
7.6 7.7
8.0
7.9
7.0
7.1
6.5
6.
9
Col
or 10 6 45 35 6 6 70 45 10 6 6 7 4 5 22 18 60 17 37 60 21 38 5 70 25 18 7 6 6 15 6 17 4 20
30
1 In
sol
utio
n at
tim
e of
ana
lysi
s.2
Incl
udes
iro
n in
sus
pend
ed m
ater
ials
.

28 WATER SUPPLY OF THE BIRMINGHAM AREA, ALA.
Figure 12.-Composition of selected surface waters in the Birmingham area.
both precipitated iron and iron in solution. Compari son of the mineral constituents in solution for each stream is given in figure 12 k The relation of the dis solved solids to the hardness is given in figure 13. Generally, the surface waters in the Birmingham area are of good quality ranging in dissolved solids from 29 to 465 ppm but us-ually less than 150 ppm. Most of the waters are extremely soft. In the Coosa
River basin the waters flow through the outcrops of the Conasuaga limestone and Copper Ridge dolomite formations. The waters of the Coosa River are pre dominantly the calcium bicarbonate type being low in dissolved solids, and the hardness of five samples ranged from 17 to 109 ppm. One sample collected from Big Canoe Creek near Gadsden contained 3. 5 ppm of precipitated iron.

SURFACE WATER 29
Figure 13. Relation of hardness to dissolved solids of surface waters in the Birmingham area.
Potential Stream Developments
Information previously presented indicates a need for greatly increased water supplies within a few years and the lack of surface water for developing any large supplies in the immediate vicinity of Bir mingham. Records of streamflow show that only the Coosa River, many miles east of Birmingham, has sufficient natural flow at all times to satisfy the growing demand. Besides the distance to that source, there are other important objections to using the Coosa River. Thus an impoundment on one of the headwater streams of the Black Warrior River basin appears to offer the best and perhaps the only source for additional water for the Birmingham area.
The Corps of Engineers and the Federal Power Commission have studied the possibilities for devel opment of the Black Warrior River basin. In connec tion with their studies, sites believed suitable for con structing dams have been selected. Several of these sites also seem to offer a suitable location for the construction of a reservoir for supplying water to the
Birmingham area. Data relating to specific sites are presented to assist in appraising their relative desirability.
Information on streamflows given earlier in this report was presented for the point of collection, that is, for the gaging station. In this section of the re port, data will be extended to cover the base period (1928-51) and transferred to the location of the pro posed dam. Three curves are presented for the sites proposed by the Corps of Engineers and are as follows:
1. Flow-duration curve: This curve shows the per centage of time that the flow equals or exceeds a given amount.
2. Days of deficient discharge: This curve shows the longest periods of consecutive days or months for which the streamflow was less than the indicated amount.
3. Storage requirements for selected flows: This curve shows the amount of storage capacity needed for an assured flow of various amounts.
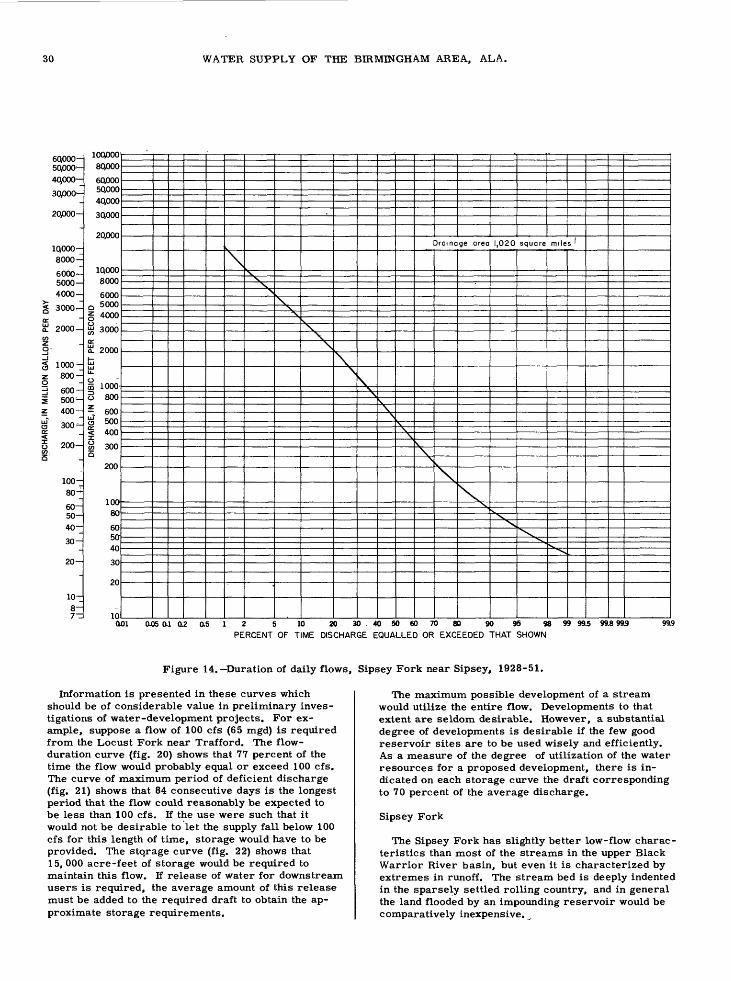
30 WATER SUPPLY OF THE BIRMINGHAM AREA, ALA.
g looo^:
O iiUU
50000-
40.000
30000-
20000-
10,000-8000-
6000-5000- 4000-
3000^
2000-
1000-800-
600-500- 400-
300-
200-
100-
80 4
60- 50- 40-
30-
20-
10-8- 7~
80,000
60,000 50,000
40,000
3QOOO
20000
10,000 8000
6000 Q 5000 § 4000
$ 3000
S 2000
tiLU U.
o 5 1000'o 800
- 600 tt 500DISCHARI
Qrti
60 5040
20
10
\N^
X,N
S,X. \
V\
\
\
\\\-\
yss\\
Drainage area 1,020 square miles '
V
Av
\\
X^
^^^N"x^
^^^ s,
aos ai 0.2 0.5 2 5 10 20 30 40 50 60 70 80 90 95 98PERCENT OF TIME DISCHARGE EQUALLED OR EXCEEDED THAT SHOWN
99 99.5 99.899.9
Figure 14. Duration of daily flows, Sipsey Fork near Sipsey, 1928-51.
Information is presented in these curves which should be of considerable value in preliminary inves tigations of water-development projects. For ex ample, suppose a flow of 100 cfs (65 mgd) is required from the Locust Fork near Trafford. The flow- duration curve (fig. 20) shows that 77 percent of the time the flow would probably equal or exceed 100 cfs. The curve of maximum period of deficient discharge (fig. 21) shows that 84 consecutive days is the longest period that the flow could reasonably be expected to be less than 100 cfs. If the use were such that it would not be desirable to let the supply fall below 100 cfs for this length of time, storage would have to be provided. The stqrage curve (fig. 22) shows that 15, 000 acre-feet of storage would be required to maintain this flow. If release of water for downstream users is required, the average amount of this release must be added to the required draft to obtain the ap proximate storage requirements.
The maximum possible development of a stream would utilize the entire flow. Developments to that extent are seldom desirable. However, a substantial degree of developments is desirable if the few good reservoir sites are to be used wisely and efficiently. As a measure of the degree of utilization of the water resources for a proposed development, there is in dicated on each storage curve the draft corresponding to 70 percent of the average discharge.
Sipsey Fork
The Sipsey Fork has slightly better low-flow charac teristics than most of the streams in the upper Black Warrior River basin, but even it is characterized by extremes in runoff. The stream bed is deeply indented in the sparsely settled rolling country, and in general the land flooded by an impounding reservoir would be comparatively inexpensive.

SURFACE WATER 31
A dam site has been proposed a short distance below the mouth of Ryan Creek, 34 miles northwest of Bir mingham. The flow at the former gaging station on SLpsey Fork near Sipsey is nearly the same as the flow at the dam site. The following curves flow duration (fig. 14), maximum period of.deficient dis charge (fig. 15), and storage requirements (fig. 16) are based on records for the former stations near Sipsey and near Arley, and, for recent years, on the records for the station near Falls City combined with records for Clear Creek at Falls City.
Mulberry Fork
The Mulberry Fork has very little ground-water storage to sustain the flow during dry periods. At Garden City, it has the lowest dry-weather flow per square mile of any gaged stream in the upper Black Warrior River basin.
A dam has been proposed at Hanby Mill, 25 miles northwest of Birmingham. Drainage area at the dam site is 494 square miles. The following curves flow duration (fig. 17), maximum period of deficient dis charge (fig. 18), and storage requirements (fig. 19) are based on records for the gaging station at Garden City which was in operation for the entire base period (1928-51).
Locust Fork
The Locust Fork has low-flow characteristics which are slightly better than those of Mulberry Fork. The stream is deeply indented and the country rolling. Damage to coal mines in some areas would increase the cost of developing impounding reservoir.
Dam sites at Trafford and at Sayre have been pro- posed, and data on both sites are presented.
3000-
2000-
1000-
800-
600-
500-
400-
< ° 300-
CO1 200-
<C3Zg ^ 100-
? 80-UJ C3
1 6°"
1 50-Q
40-
30-
20-
10-
a-7-
5000
4000
3000
2000
1000
800
600
§ 500 ow 40°OL
S 300
UJ U-
o 200CD
O
Z
uT
< 100
5 80
60.
50.
40-
sa
20
10-
^«^- ^-~ ^> ^
Drain
S^
age
fjf
area 1
/1
D20 sq
^///
uare
/'
mil
/
es
/
//
/
I//
/1
1f
f
56 8 10 5 6 7 8 9 10 12 18 24 36 48
CONSECUTIVE DAYS CONSECUTIVE MONTHS
LONGEST PERIOD OF TIME FLOW WAS LESS THAN THAT SHOWN
Figure 15.-Discharge available without storage, Sipsey Fork near Sipsey, 1928-51.
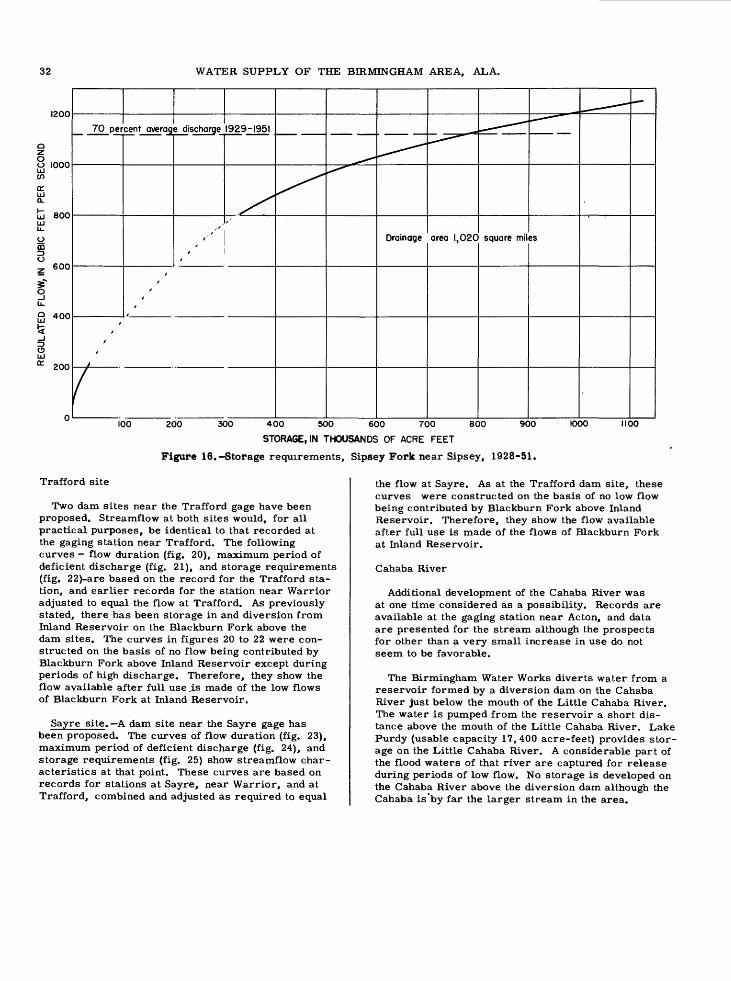
32 WATER SUPPLY OF THE BIRMINGHAM AREA, ALA.
1200
Q
8 1000</5
ccUJ CL
uj 800UJ U.
O CD
Oz 600
1U.
S 40°!5_ioUJ
°= 200
0
70 per
/ /
cent averag e discharge
/
1929-1951
^^
^-*-^^
^^
Drainage area I,02C
.- --
square mil
^~ ~
JS
- -- ~
100 200 300 400 500 600 700 800 900 1000 1100
STORAGE, IN THOUSANDS OF ACRE FEET
Figure 16.-Storage requirements, Sipsey Fork near Sipsey, 1928-51.
Trafford site
Two dam sites near the Trafford gage have been proposed. Streamflow at both sites would, for all practical purposes, be identical to that recorded at the gaging station near Trafford. The following curves - flow duration (fig. 20), maximum period of deficient discharge (fig. 21), and storage requirements (fig. 22)-are based on the record for the Trafford sta tion, and earlier records for the station near Warrior adjusted to equal the flow at Trafford. As previously stated, there has been storage in and diversion from Inland Reservoir on the Blackburn Fork above the dam sites. The curves in figures 20 to 22 were con structed on the basis of no flow being contributed by Blackburn Fork above Inland Reservoir except during periods of high discharge. Therefore, they show the flow available after full use .is made of the low flows of Blackburn Fork at Inland Reservoir.
Sayre site. A dam site near the Sayre gage has been proposed. The curves of flow duration (fig. 23), maximum period of deficient discharge (fig. 24), and storage requirements (fig. 25) show streamflow char acteristics at that point. These curves are based on records for stations at Sayre, near Warrior, and at Trafford, combined and adjusted as required to equal
the flow at Sayre. As at the Trafford dam site, these curves were constructed on the basis of no low flow being contributed by Blackburn Fork above Inland Reservoir. Therefore, they show the flow available after full use is made of the flows of Blackburn Fork at Inland Reservoir.
Cahaba River
Additional development of the Cahaba River was at one time considered as a possibility. Records are available at the gaging station near Acton, and data are presented for the stream although the prospects for other than a very small increase in use do not seem to be favorable.
The Birmingham Water Works diverts water from a reservoir formed by a diversion dam on the Cahaba River just below the mouth of the Little Cahaba River. The water is pumped from the reservoir a short dis tance above the mouth of the Little Cahaba River. Lake Purdy (usable capacity 17, 400 acre-feet) provides stor age on the Little Cahaba River. A considerable part of the flood waters of that river are captured for release during periods of low flow. No storage is developed on the Cahaba River above the diversion dam although the Cahaba is by far the larger stream in the area.
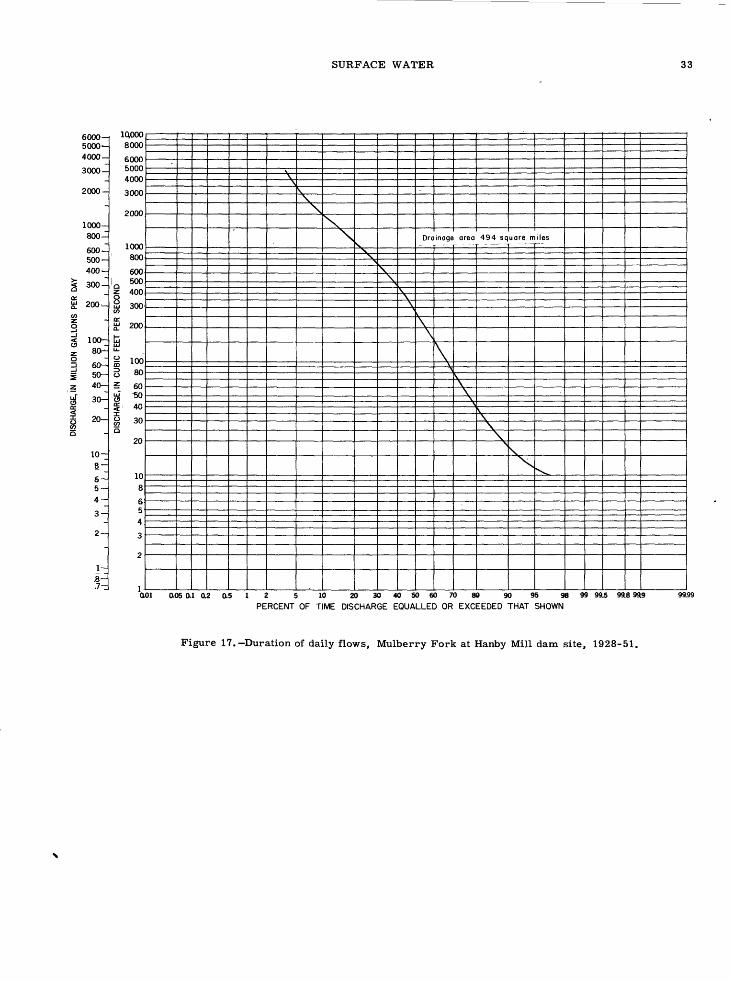
SURFACE WATER 33
6000-1 5000- 4000
3000-
2000-
800-
600- 500- 400 300-
200
100- 80^
60- 50- 40-
30-
20-
10- 3-
6-
4-
3-
2-
1-Q__'.7-
10,000 8000
6000 5000 4000
3000
2000
1000 800
600 500 400 300'
200
80
60
40
30
20
108
654
3
2
v' \
v\^\ kv
N -vs.\Vr \
Drainage
\V
\ s
area
^\\
494 sq
vv-\^
uare m
\^
iles
^
0.01 0.05 0.1 Q.2 0.5 1 2 g 10 20 30 40 50 60 70 80 90 95 98 99 99.5 99.8 99.9 99.PERCENT OF TIME DISCHARGE EQUALLED OR EXCEEDED THAT SHOWN
Figure 17.-Duration of daily flows. Mulberry Fork at Hanby Mill dam site, 1928-51.
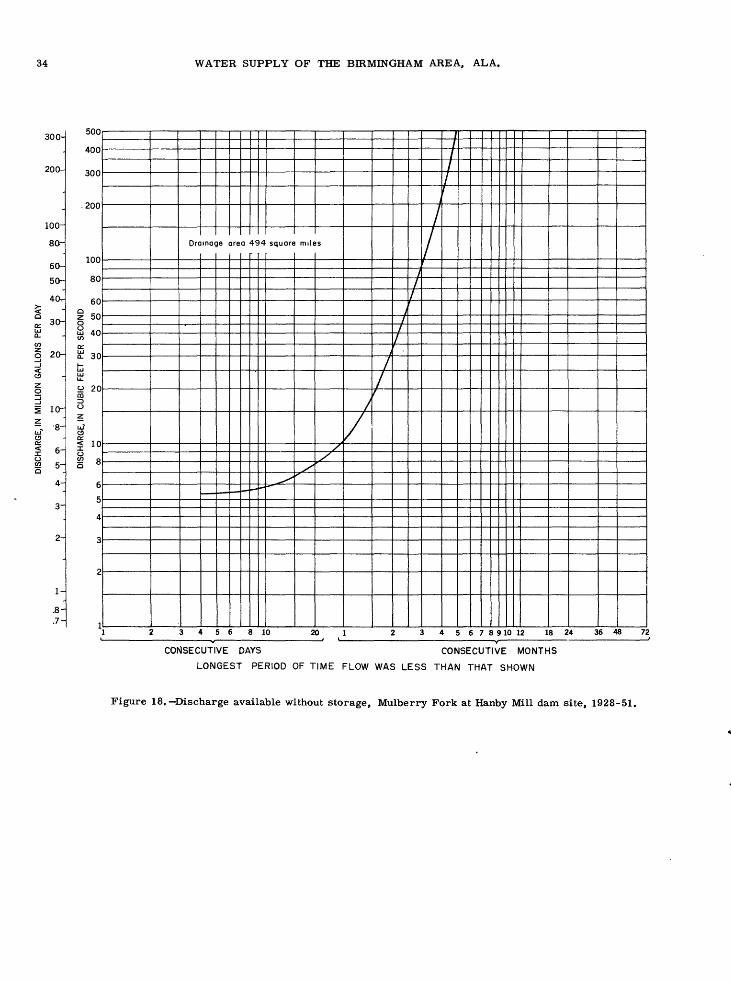
DIS
CH
AR
GE
, IN
M
ILLI
ON
G
ALL
ON
S
PER
D
AY
I
CONSECUTI
LON 0
<m
m
c/> -«
o
s §
33 0 O o
-n -i
CONSECUT
IME
FLOW
WAS
LESS
THAN
THAT
IVE
MONTHS
SHOWN
ro b> * Ul
0)
00 o Is ro b> *. Ul
O)
VI oo
u> o
to oo 8 bl
O)
£ M
. .
, i
i\j
o)*»oia
iooo
o
o
vi
oo
«-
r\j
oo
-p»
01
01
oo
o
r>
oo
pp
oo
o
oi
i ,L
i.. ,
, i
, ,1
,i,T
,
T
i 1
i i
i 1
T
, T
i
1,1
DIS
CH
AR
GE
, IN
C
UB
IC
FEE
T PE
R S
EC
ON
D
>-*
ro
GO
-p.
u
«-
M
oo
-p»
ai
01
oo
o
o
ooc
- i\j
w
*»oiaiooo
o
oo
oo
oo
o
ooc
~\
\ s \ \ s X*x
^s ^
^ ^>^
"*- V
. v.
*v. ^
^
o o ID 3 O *.
JO c. 0 3
"^^,
^^^
I - -
--.-~
. -

SURFACE WATER 35
600
8 50°
<rUJ OL
I- 400UJUJ
oCO
0 300z
Q 200 UJ
UJCC 100
70 percent overage discharge 1929-1951
SDrainage area 494 square miles
50 100 150 200 250 STORAGE, IN THOUSANDS OF ACRE FEET
300 350
Figure 19.-Storage requirements. Mulberry Fork at Hanby Mill dam site, 1928-51.
Flow at the gaging station at Acton is very nearly equal to the water that passes over the diversion dam. Little or no water is wasted during the summer and fall, but a considerable flow passes the dam during months of heavy precipitation and higher runoff.
Reservoir sites have not been proposed for the Cahaba River. Present developments in the head waters of the basin preclude the ready development of a reservoir in that area. Thus the opportunity for any substantial increase in storage would seem to be limited to a development at or below the diversion dam. Daily discharge, a storage-requirements curve (fig. 26), and a curve of maximum consecutive days of lowest average discharge (fig. 27) are available for the site at the gaging station near Acton. The storage curve was developed for this site to show the maximum utilization possible at the present point of diversion. It is not implied that a dam at this site is desirable. The same amount of storage at any point
upstream would yield less dependable flow at the point of diversion.
The curve of maximum consecutive days of lowest average discharge (fig. 27) has less meaning at this place because it does not represent natural flow. However, it does show that storage for a long period would be required for even a small additional draft.
Coosa River
The unregulated dry-weather flow of the Coosa River is substantially greater than any additional quantity needed in the Birmingham area in the future. Therefore, a reservoir would not be required if diversion from that stream was feasible or desirable. Installation and operating costs created by the dis tance from the city, the rugged terrain, and the high pumping head are disadvantages which might be suf ficient to bar serious consideration of such a proposal.

DIS
CH
ARG
E, IN
M
ILLI
ON
GAL
LON
S PE
R DA
Y
M
tU
*.
01 <
JI
00 £
sooo
o
popooo
8 i
i i
. i
i T .
i i
i . i
! i
!g
DIS
CH
ARG
E,IN
CU
BIC
FEE
T PE
R SE
CO
ND
l-i
N5
W
.p.
0101
00
g p s p tn
"0
O m o -n
0
20304050607080 90
95
98
99
99.5
99.8
9a9
ME
DISCHARGE
EQUALLED OR
EXCEEDED THAT
SHOWN
5 8
gS
S§
3§
8
8 8
88
88
8
8 8
88
88
8
8 8
88
88
8
/
/
, '
,t
y
/
/^
/ ^
/ c r
/ t
Z.
o
o
cr
i I
. ""
"5 c c
'
m & I o s B o.
/^
/t
/
/
/
'*
t
/t
a.
o
o
yi3 1 1
a 5
°-°
-T
Q
JB
Is
0 1 9-.'
§
3 i- /i 3 3
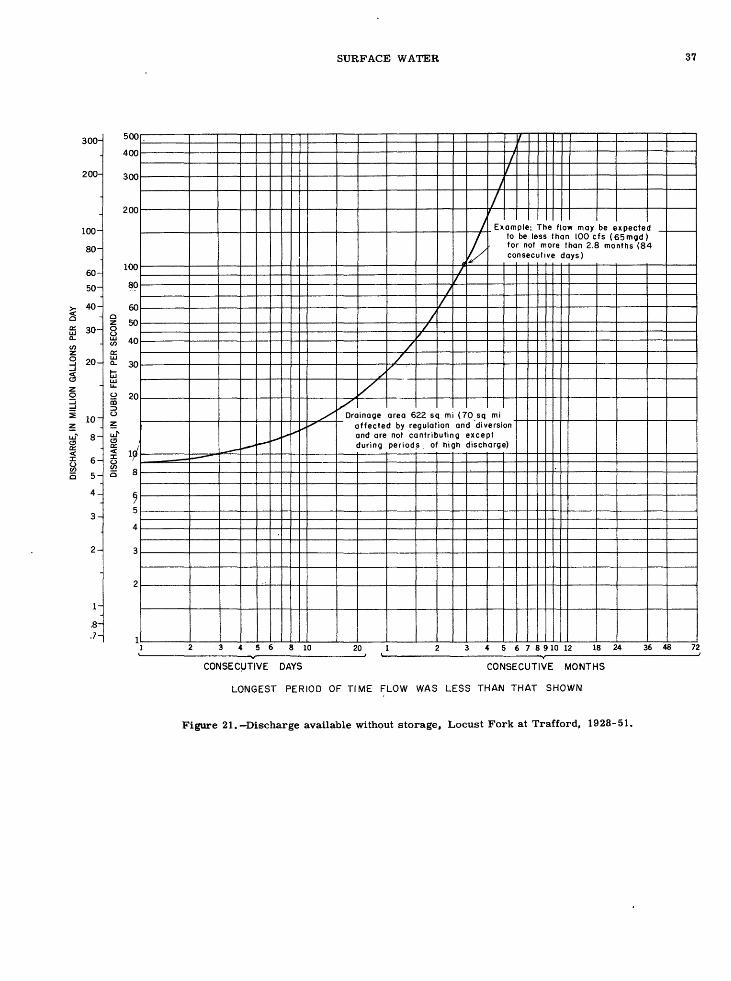
DIS
CH
ARG
E, IN
M
ILLI
ON
G
ALL
ON
S
PER
DAY
§ (D CO » *
CO 0 er H DO
(D <! S-
£ o ^ rt- ET O 01 g ? r o o 01 Ktl
0 W P *"* H p Mj
O a *
LONGES
-l -o
m o 0 o -n i m -n r o S CO r
m CO
CO -i X Z H X ^ H CO X o 2
O o en ECUTIVE
o § o o
z m 0 c H m S O z
kj
00
1-
M
CO
*>
. U
1
1 1
i l
i 1
1 i
1 i
1O
^
00
1 ,
1
o,
1
DIS
CH
AR
GE,
IN
CU
BIC
t_j
hO
U
J
4*
Ul
XJJ1
00
-s~.
8
ISJ
O,
1
FEET
PER
iS
5S
§i III
SEC
ON
D
§ 3
g
3 g
.11, »_.
:§
8
§ 8
i i
i ,
ISJ 8
ISJ 1
CO 8
, £" 8
CO R i U
l 8
0 H* 8 (7)
S ^4
1 y \ \ \ \ \ -A C
3 5
3
0
0.|D
3 «
-.-*
><
..|-
S «
01 =«
°
s °
z§-.§
X
o 'S
. <o
\ A 0
10
(D 0 (D
O ro
ro o in
o 3
\ \s\
Sy
sX
Nx
s,i ^x
^
. o
o o
1 =8
"5
. n
U
l _
3
u
j
' *
3 ?
3 *
o C
1
« 3
\
m X O 3 o -H o 3 0 «£ CT
(D o (D
^V
N,^
'"*>
">
.
^
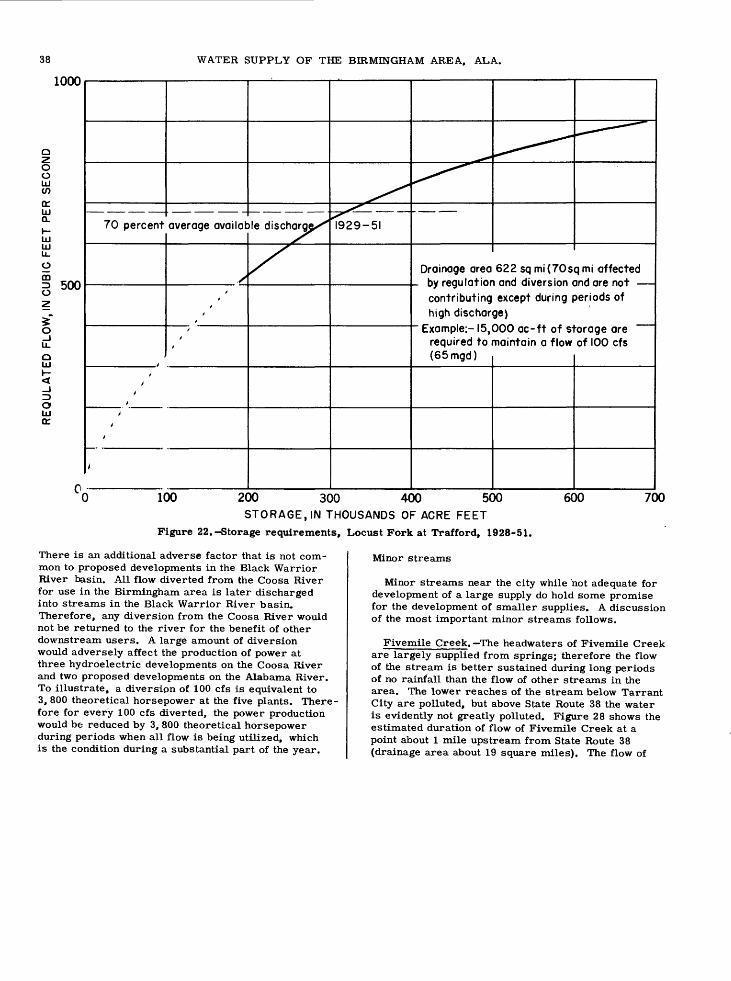
38 WATER SUPPLY OF THE BIRMINGHAM AREA. ALA.
1000
70 percent
'
average availat
y
/
i i
ii
i i
i
)le discharge^
X
^1929-51
_^***^^
Drainage area by regulatiorcontributing high dischar
Example:- 15, required to (65mgd)
^^
622 sq mi (70s \ and diversion ( except during f
96)
000 ac-ft of s1 maintain a flow
^
q mi effected and ore not >eriods of
orage are of IOO cfs
o o ui
ui u_o mZ3 O
O_1 u_oUI
O UIor
500
100 200 300 400 500STORAGE, IN THOUSANDS OF ACRE FEET
Figure 22.-Storage requirements. Locust Fork at Trafford, 1928-51.
600 700
There is an additional adverse factor that is not com mon to proposed developments in the Black Warrior River basin. All flow diverted from the Coosa River for use in the Birmingham area is later discharged into streams in the Black Warrior River basin. Therefore, any diversion from the Coosa River would not be returned to the river for the benefit of other downstream users. A large amount of diversion would adversely affect the production of power at three hydroelectric developments on the Coosa River and two proposed developments on the Alabama River. To illustrate, a diversion of 100 cfs is equivalent to 3, 800 theoretical horsepower at the five plants. There fore for every 100 cfs diverted, the power production would be reduced by 3, 800 theoretical horsepower during periods when all flow is being utilized, which is the condition during a substantial part of the year.
Minor streams
Minor streams near the city while not adequate for development of a large supply do hold some promise for the development of smaller supplies. A discussion of the most important minor streams follows.
Fivemile Creek. -The headwaters of Fivemile Creek are largely supplied from springs; therefore the flow of the stream is better sustained during long periods of no rainfall than the flow of other streams in the area. The lower reaches of the stream below Tarrant City are polluted, but above State Route 38 the water is evidently not greatly polluted. Figure 28 shows the estimated duration of flow of Fivemile Creek at a point about 1 mile upstream from State Route 38 (drainage area about 19 square miles). The flow of

g S
SS
§
8I
i I I
I i I
.1
DIS
CH
ARG
E, IN
M
ILLI
ON
GA
LLO
NS
PER
DAY
h->
hO
0>
41.
Ul
CT>
CO J
E>
I .
I 11
I ?l
1.1
I I
I ?l?
I ?
. I
?
h-"
' 5
DIS
CH
ARG
E, IN
CU
BIC
FEE
T PE
R SE
CO
ND
i-
W
O)
4s.
01 O
l 00
,JS
s gg
§ §
°S
°3
o'o
e «

DIS
CH
AR
GE
, IN
M
ILLI
ON
G
ALL
ON
S
PER
D
AY
g S
S S
8 8
8D
ISC
HA
RG
E, I
N
CU
BIC
FE
ET
PER
S
EC
ON
D
S S
§ 8
8 8
N\\
1 a
g 31
5 °
S "m
£ §
§£o
?o
°s
-«
CT
=>
S
<
* C
O.
O
^ 5
Q
. 3
C
O
mo
<'
r- 0
3 S
2
0»
r "
13
-
*
3 ^
. <I
> O
= i|a
- _
, Q
. 3
5
*-i
CT
<
* U
3 (D
vc
U>

SURFACE WATER 41
REGULATED FLOW, IN CUBIC FEET PER SECOND
§
^s C
70 percent
//
//
average avc
/
liable discru
X/
3rge 1929-
^
/
51 _^^-
^
^^
Drain affe
and duri
^-^
age area 88! cted by stor are not contr ng periods o
^~^
5sq mi (70s age and dive ibuting exct [ high discha
_~ -- '
qmi
>pt rge)
_-- ' ~~~
S 200 400 600 800 1000
STORAGE, IN THOUSANDS OF ACRE FEET
Figure 25. Storage requirements, Locust Fork at Sayre, 1928-51.
50
40
30
20
Drainage area 195 sq mi (flow from 44 sq mi affected by storage and diversion)
10
5 10 15REQUIRED STORAGE,IN THOUSANDS OF ACRE FEET
20
Figure 26.-Storage requirements, Cahaba River near Acton, 1928-51.
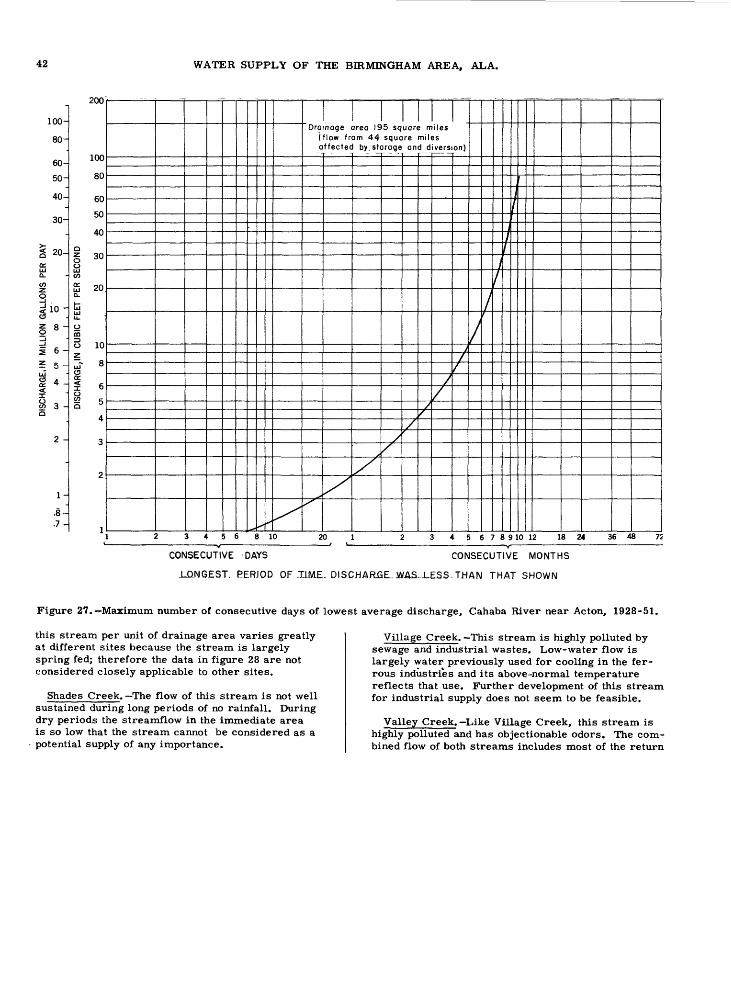
42 WATER SUPPLY OF THE BIRMINGHAM AREA, ALA.
100-
80-
60-
50-
40-
30-
20-
8 ~
3
2 -
1-
.8-
.7-
200
100
80
60
50
40
30
20
10
8
6
5
4
3
2
1 ** x- ^^
1Drainage area 195 square miles
(flow from 44 square miles affected by. storage and diversion)
y/[/
>
X/
/
//
/
A/
//
/
/
i
T«r1 2 3 4 5 6 8 10 20 1 2 3 4 5 6 7 8 9 10 12 18 Z4 36 48 75
CONSECUTIVE 'DAYS CONSECUTIVE MONTHS
.LONGEST. PERIOD OF J1M.E, DISCHARGE. WAS-J_ESS THAN THAT SHOWN
Figure 27. Maximum number of consecutive days of lowest average discharge, Cahaba River near Acton, 1928-51.
this stream per unit of drainage area varies greatly at different sites because the stream is largely spring fed; therefore the data in figure 28 are not considered closely applicable to other sites.
Shades Creek. The flow of this stream is not well sustained during long periods of no rainfall. During dry periods the streamflow in the immediate area is so low that the stream cannot be considered as a potential supply of any importance.
Village Creek. This stream is highly polluted by sewage and industrial wastes. Low-water flow is largely water previously used for cooling in the fer rous industries and its above-normal temperature reflects that use. Further development of this stream for industrial supply does not seem to be feasible.
Valley Creek. Like Village Creek, this stream is highly polluted and has objectionable odors. The com bined flow of both streams includes most of the return
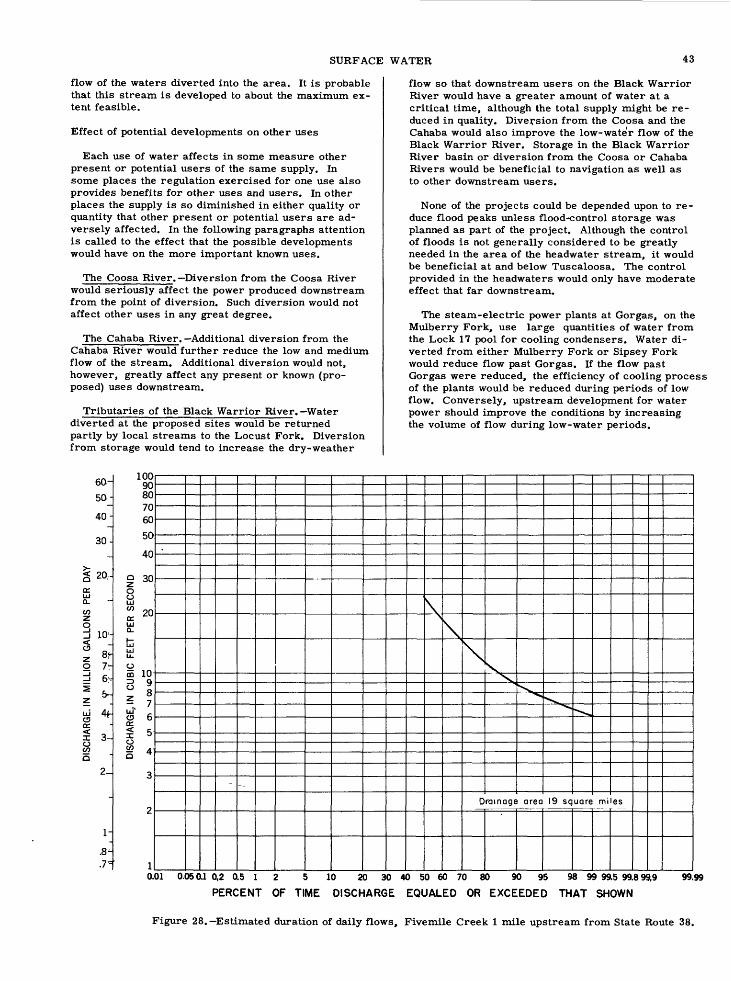
SURFACE WATER 43
flow of the waters diverted into the area. It is probable that this stream is developed to about the maximum ex tent feasible.
Effect of potential developments on other uses
Each use of water affects in some measure other present or potential users of the same supply. In some places the regulation exercised for one use also provides benefits for other uses and users. In other places the supply is so diminished in either quality or quantity that other present or potential users are ad versely affected. In the following paragraphs attention is called to the effect that the possible developments would have on the more important known uses.
The Coosa River. Diversion from the Coosa River would seriously affect the power produced downstream from the point of diversion. Such diversion would not affect other uses in any great degree.
The Cahaba River. Additional diversion from the Cahaba River would further reduce the low and medium flow of the stream. Additional diversion would not, however, greatly affect any present or known (pro posed) uses downstream.
Tributaries of the Black Warrior River. Water diverted at the proposed sites would be returned partly by local streams to the Locust Fork. Diversion from storage would tend to increase the dry-weather
flow so that downstream users on the Black Warrior River would have a greater amount of water at a critical time, although the total supply might be re duced in quality. Diversion from the Coosa and the Cahaba would also improve the low-water flow of the Black Warrior River. Storage in the Black Warrior River basin or diversion from the Coosa or Cahaba Rivers would be beneficial to navigation as well as to other downstream users.
None of the projects could be depended upon to re duce flood peaks unless flood-control storage was planned as part of the project. Although the control of floods is not generally considered to be greatly needed in the area of the headwater stream, it would be beneficial at and below Tuscaloosa. The control provided in the headwaters would only have moderate effect that far downstream.
The steam-electric power plants at Gorgas, on the Mulberry Fork, use large quantities of water from the Lock 17 pool for cooling condensers. Water di verted from either Mulberry Fork or Sipsey Fork would reduce flow past Gorgas. If the flow past Gorgas were reduced, the efficiency of cooling process of the plants would be reduced during periods of low flow. Conversely, upstream development for water power should improve the conditions by increasing the volume of flow during low-water periods.
60-
50-
40-
30,-
20,-
ui 4f- cs n o:I 3-
lUU90 80 70 60
50
40
§ 30
8UIs»UIQ.
fc UIu.0m 10 ^ 9s ?w - o 6 a:2 5o% 4"
3
2
1
-^
X\
NX
X *\^v
Drainage area
ls>^1_^^»»
-^,
19 square miles
0.01 0.050.1 0,2 0.5 1 2 5 10 20 30 40 50 60 70 80 90 95 98 99 99.5 99.899,9 99.99
PERCENT OF TIME DISCHARGE EQUALED OR EXCEEDED THAT SHOWN
Figure 28. Estimated duration of daily flows, Fivemile Creek 1 mile upstream from State Route 38.

44 WATER SUPPLY OF THE BIRMINGHAM AREA, ALA.
GROUND WATER
General Principles
Occurrence and storage
Ground water is water that occurs in the zone of saturation below the surface of the earth the zone where all open spaces in the earth material are filled (saturated) with water. Ground water occurs in the pores, crevices, solution cavities, and other openings formed by weathering and structural stresses on the rocks.
Porosity is the amount or percentage of open spaces or voids in rocks.
Permeability is the ability of porous material to transmit water under pressure. A rock formation may have a high porosity, but, if the pore spaces are small or not connected, it would be difficult, if not impossible, for water to flow through the rocks.
The character and structure of rocks control their porosity and permeability and therefore their ability to contain and yield ground water to wells and springs. In the Birmingham area ground water occurs in pore spaces, along bedding planes, and in fractures in the sandstone; and in solution cavities in limestone and dolomite. Ground water moves under the force of gravity in these rocks along the path of least resis tance the zones of greatest permeability. Rock for mations through which ground water is moving in suf ficient quantities to supply wells or springs are called aquifers.
Movement
Water-table conditions. The water table or surface of the zone of saturation is not level or stationary. It varies in slope and height with the topography, the geologic structure, and the rate of withdrawal of water, and with daily, seasonal, and yearly variations in rain fall. Under natural conditions in a year of above- normal rainfall the water table is unusually high and in a drought year it is low.
In the Birmingham area the highest water levels in wells occur during February, March, and April be cause of the continuous and large amount of recharge to the water table during the heavy winter rains and the low evaporation during cold weather. The lowest water level is usually reached during the latter part of October or early November at the end of the dry fall season.
Recharge area
Artesian conditions. If water moving laterally in an aquifer passes between and becomes confined above and below by impermeable strata, it is called artesian ground water. The pressure exerted on water in a confined, or artesian, aquifer by the weight of water at higher levels in the same aquifer is known as hydrostatic pressure. When a well pene trates a confined aquifer, the pressure causes the water to rise up the well above the bottom of the over lying confining or impermeable bed. If the land sur face is low enough and the artesian pressure great enough, the well will flow. Such a well is called a flowing artesian well. The height that a column of water can be supported by the artesian pressure is called the pressure head. The imaginary surface to which artesian water will rise in tightly cased wells is called the piezometric surface. Water-table and artesian conditions are illustrated in figure 29. Flow ing artesian wells can be developed in the Fort Payne chert in the Warsaw limestone and in the Hartselle sandstone beneath Shades Valley.
Recovery from wells and springs
Wells in the Birmingham area are commonly drilled by the cable-tool method. Test drilling is needed in development of a ground-water supply in the area. Test wells are drilled until one or more water-bearing fractures, solution cavities, or other openings are penetrated that will yield an adequate water supply. The depth to which test drilling in the area is carried varies with the kind of underlying formations and the geologic structure.
Pumping in a well lowers the water level, creates a cone of depression (a, b, c, fig. 29), and draws water from the water-bearing formation immediately around the well. The area around the well affected by pumping is known as the area of influence. As the pumping increases or continues, the area of influence becomes larger and the cone of depression deeper un til sufficient recharge water is intercepted to balance the amount being pumped. If recharge water is avail able, the well will continue to yield water; if recharge is inadequate, the well eventually will go dry.
Overpumping of wells in an area causes overlapping cones of depression, progressive decline in water levels, and consequent decline in the pumping yields of wells in the area being depleted. In the Birming ham area muddying of water from wells in limestone sometimes indicates overpumping. The complex net work of horizontal and vertical solution cavities in limestone and dolomite weakens the rocks. Where these networks are near the surface and wells drilled.
Figure 29. Diagrammatic section, showing water-table and artesian conditions in the Birmingham area.
GROUND WATER 45
into them are overpumped, there is increased velocity of ground-water movement in the area of influence. This increased velocity causes collapse of the rock and clay filling between cavities, and sinkholes are formed at the surface, usually near the well. After the sinkholes have formed, the water is muddied and the yield from wells is usually decreased,owing to blocking of solution cavities.
Wells in the area range from dug wells as much as f 50 feet deep that generally yield as much as 25 gpm to deep drilled wells more than 600 feet deep that yield as much as 500 gpm. Industrial and municipal wells usually 6 to 12 inches in diameter have casing set on bedrock, and the hole is drilled into the rock to intersect the water-bearing zones.
Several large springs, such as Caldwell and Tarrant, have been developed for municipal and domestic water supplies. The users of these springs have constructed concrete retaining walls around the springs and roofs over them.
Springs studied for this report ranged in yield from 50 to as much as 750 gpm.
General Geology
Geologic events can be dated by a calendar which geologists call the geologic time scale. Geologic time is divided into four main eras, Proterozoic, Paleo zoic, Mesozoic, and Cenozoic. Rocks that crop out in the Birmingham area are of Paleozoic age. Eras are divided into periods. In the Paleozoic era these periods are:
Permian period (youngest) Pennsylvanian epoch )
Carboniferous periodMississippian epoch ) Devonian period Silurian period Ordovician period Cambrian period (oldest)
Rocks deposited during a geologic period comprise a system of rocks, such as the Carboniferous system and the Ordovician system. The rocks of an epoch make up a series, such as the Pennsylvanian series.
The rock formations exposed in the Birmingham area were deposited in seas. Each time the sea flooded the area sediments were laid down and later cemented and compacted to form rocks. Deposition of these rocks began about 550 million years ago in the Cambrian period and continued until some time during the Pennsylvanian epoch about 220 million years ago. The area was not covered by the sea throughout the 300 million years; evidence of erosion and areas of nondeposition indicate that some areas were dry land while the rest was under water.
The area of this report lies in two physiographic provinces (fig. 1): The Valley and Ridge province in the southeastern third of the area and the Appalachian Plateaus province in the northwestern two-thirds of the area.
Between 185 and 220 million years ago great stresses occurred in the crust of the earth in a belt extending from Newfoundland southwestward to Ala bama, where this belt is 25 to 50 miles wide. In Ala bama these stresses acted from the southeast, push ing the rocks into great upwarps (anticlines) and downwarps (synclines). Faults formed where the earth's crust fractured and there was movement of the rocks. The stress that warped these rock forma tions was so great that long faults were formed on the northwest sides of the major anticlines. Older rocks on the southeast were brought upward adjacent to younger rocks on the northwest sides of the faults. The greatest stresses caused folds in what is now the Valley and Ridge province. The Appalachian Plateaus province, a less-disturbed broad syncline, formed to the northwest where the stresses were less intense. As these two physiographic provinces form two natural geologic provinces, the geology of each will be discussed.
The Valley and Ridge province
About the southeastern third of the area of this re port lies within the Valley and Ridge province. While the folding of rocks took place, the streams cut down ward through the Coosa, Cahaba, and Birmingham anticlines (fig. 1). The Coosa River, Cahaba River and Cahaba Valley Creek, Valley and Village Creeks, and their tributaries eroded through the sandstone, shale, and coal of the Pennsylvanian rocks to the easily eroded underlying limestone, dolomite, and shale exposed in the long valley systems of the area. On either side of the Cahaba anticline (fig. 1) sand stone, shale, and coal beds of the Pottsville formation of Pennsylvanian age were folded into two subdivisions, the Cahaba Ridges and the Coosa Ridges. These rocks were folded into parallel northeast-trending bands. Faulting occurred, and locally the rocks have steep dips. Double and Shades Mountains are examples of sandstone ridges formed by folding of the sandstone and subsequent erosion by streams. Both the Cahaba Ridges and the Coosa Ridges have faults along their southeast boundaries where older rocks have been pushed into contact with the younger Pottsville forma tion. North of Pinson the Birmingham valley divided; the northwest division formed Murphrees Valley which extends to a point a few miles northeast of Aurora in Etowah County; the southeast part connected with Big Canoe Valley, forming the Birmingham-Big Canoe Valley (Johnston, 1933, p. 15). The Blount Mountain syncline lies between the two extensions of Birming ham valley. Rocks in this syncline are sandstone, shale, and coal beds of the Pottsville formation. Un like the Cahaba and Coosa Ridges areas, the Blount Mountain syncline has a boundary fault on the north west side rather than on the southeast side.
The Appalachian Plateaus
The northwestern two-thirds of the area of this re port lies northwest of Birmingham valley within the Appalachian Plateaus province. This area is under lain by sandstone, shale, and coal beds of the Potts ville formation. A fault on the southeast side of Sand Mountain separates the Warrior Basin and the Bir mingham valley, and the Valley and Ridge and Appa lachian Plateaus provinces (fig. 1).

46 WATER SUPPLY OF THE BIRMINGHAM AREA, ALA.
Within the Warrior Basin there are local structural features, such as smaller basins, anticlines, syn- clines, and faults; however, the rocks in this basin are generally much less folded and faulted than those in the Coosa and Cahaba Ridges areas. The Warrior Basin is drained mainly by the Locust and Mulberry Forks of the Black Warrior River.
The southern part of a prominent anticlinal valley, the Sequatchie, or Browns, Valley, projects into the northeast part of the Warrior Basin, and part of this valley lies within the area of this report. This valley is similar to the Coosa, Cahaba, and Birmingham Valleys.
Water-Bearing Formations
The water-bearing formations in the area' of ground- water studies for this report crop out in parallel bands trending northeast (pi. 2). The geologic structure of the area controls the outcrop patterns of the forma tions, and thereby the areas of recharge of the aquifers.
The main geologic structure is a large anticline, the crest of which has been eroded away, exposing lime
stone and dolomite in a great valley and sandstone and chert in the adjacent ridges. (See pi. 2.)
The important aquifers are the limestones and dolo mites because they contain many fractures and. solution cavities and are exposed in Opossum and Jones Valleys under conditions favorable to recharge. Of lesser im portance as aquifers are the chert, limestone, and sandstone in Shades Valley and in the ridges adjacent to the valleys.
The general description of the geologic formations and their water-bearing characteristics is based on the reconnaissance study of the geology and occurrence of ground water for this report. The thicknesses of the formations are mostly from Butts (1926 b).
Generally a single water sample from a well is re garded as being representative of the chemical quality of water from the aquifer developed by the well be cause the concentration of the dissolved minerals in water from a well seldom shows large variations. Samples were collected from 22 wells, 2 springs, and 5 mine shafts to determine the chemical character of the ground-water supplies in the Birmingham area. (See table 18.) The chemical characteristics of the ground waters in the area have been considered pri-
SAMPLING SITES SHOWN ON PLATE I
Figure 30. Composition of selected ground waters in the Birmingham area.

Tab
le 1
8. -
Che
mic
al q
uali
ty o
f gr
ound
wat
er i
n th
e B
irm
ingh
am a
rea
[Use
of
wel
l: P
s, p
ubli
c su
pply
; D
, do
mes
tic;
In,
ind
ustr
ial:
I,
irri
gati
on;
N,
none
. C
hem
ical
ana
lyse
s in
par
ts p
er m
illi
on]
Inde
x no
. pl
ate
1 1 2 3 4 5 6 7 8 9 10 11 12 13 14 15 16 17 18 19 20 21 22 23 24 25 26
Loc
atio
n an
d ow
ner
Gre
enw
ood
- G
reen
woo
d.
Cen
ter
Poi
nt -
Geo
rge
Sco
tt.
Tru
ssvi
lle
- T
russ
vill
e.
Pins
on -
Wil
der
Con
stru
ctio
nC
o.Ir
onda
le -
Iro
ndal
e.
Roe
buck
Pla
za -
A.
J.G
refe
nkam
p.
Ham
mon
d -
(Slo
ss-S
heff
ield
Ste
el &
Iro
n C
o. w
eU 1
).C
aldw
eU S
prin
g -
J. M
.K
nigh
t (R
obin
woo
dsu
pply
).H
arve
y Sp
ring
.
Tel
-Hop
Dri
ve-i
n.
Bla
ck D
iam
ond
(Bla
ckD
iam
ond
Coa
l M
inin
gC
o.)
.N
ewca
stle
(M
arc
Lev
ine
Rea
lty
Co
.).
Slos
s Ir
on O
re m
ine
(Slo
ss-
She
ffie
ld S
teel
& I
ron
Co.)
.Ir
onda
le I
ce C
o.
Bir
min
gham
Ice
& C
old
Sto
rage
Co.
Con
nors
Ste
el C
o.
Sou
ther
n D
airi
es,
Inc.
Hom
e-w
ood
Dai
ry P
rodu
cts
Co.
W.
B.
Bak
er D
airy
Arm
our
& C
o. (
mea
tpa
cker
s).
Sou
ther
n R
ailw
ay S
yste
m(E
rnes
t Nor
ris
Yar
d).
Elm
woo
d C
emet
ery.
H.
J. T
iUia
.
B.
G.
Wis
enhu
nt.
Slo
ss-S
heff
ield
Ste
el &
Iron
Co.
flo
win
gw
ell
2.
Fla
ttop
coa
l m
ine
(Slo
ss-
She
ffie
ld S
teel
& I
ron
Co.
Use
of
w
eU
Ps Ps Ps Ps Ps Ps Ps Ps D - Ps Ps Ps - In - In In In In In - I I D N-
N
Dat
e of
co
llec
tion
Aug
. 29
, 19
52
Aug
. 28
, 19
52
Aug
. 29
, 19
52
Sep
t. 2.
195
2
Sep
t. 4,
195
2
Sep
t. 17
, 19
52
Oct
. 1,
195
2
Oct
. 2,
195
2
Oct
. 1.
19
52
Sep
t. 4,
19
52
Sep
t. 17
, 19
52
Sep
t. 26
, 19
52
Sep
t. 8,
195
2
Sep
t. 3,
195
2
Sep
t. 26
, 19
52
Oct
. 14
, 19
52
Sep
t. 2,
195
2
Sep
t. 25
, 19
52
Oct
. 10
, 19
52
Oct
. 3,
195
2
Sep
t. 23
, 19
52
Sep
t. 17
, 19
52
Sep
t. 19
, 19
52
Sep
t. 17
, 19
52O
ct.
9, 1
952
Oct
. 7,
19
52
Dep
th
(fee
t)
294
159
186.
5
208.
5
250
320
-
Spri
ng
Spri
ng
118
Min
esh
aft
Min
esh
aft1
Min
esh
aft'
210
-
335
440
113
126
310
295
350
175 67
- -
Wat
er-b
eari
ng
form
atio
n
For
t Pa
yne
cher
tan
d W
arsa
wli
mes
tone
.C
oppe
r R
idge
dolo
mit
e.Fo
rt P
ayne
che
rtan
d W
arsa
wli
mes
tone
.K
eton
a do
lo
mit
e.G
aspe
r fo
rma
tion
Har
tsel
lesa
ndst
one.
Gas
per
form
ati
on a
nd W
ar
saw
lim
est
one.
Fort
Pay
ne c
hert
Ket
ona
dolo
m
ite.
Cop
per
Rid
gedo
lom
ite.
Red
Mou
ntai
nfo
rmat
ion.
Potts
viU
efo
rmat
ion.
Potts
viU
efo
rmat
ion.
-
Ban
gor
lim
esto
ne.
Con
asau
gali
mes
tone
.K
eton
a do
lo
mit
e.C
onas
auga
lim
esto
ne.
Ban
gor
lim
est
one.
Ban
gor
lim
est
one.
Con
asau
gali
mes
tone
.H
arts
elle
sand
ston
e.K
eton
a do
lo
mit
e L
ittl
eSh
ades
san
dst
one
ofPo
or.
Park
woo
d an
dPo
ttsvi
Ue
form
atio
ns.
Floy
d sh
ale.
War
saw
Um
e-st
one
and
Har
tsel
lesa
ndst
one.
Potts
viU
efo
rmat
ion.
SU
ica
(SiO
,,)
10 8.4
5.1
8.9
8.2
13 11 9.7
9.2
9.4
12 14 17 10 .11 9.8
11 14 11 11 8.8
10 9.8
14 10 18
Iron
(F
e)
0.7
5
.02
.10
.12
.16
2.1 .5
5
.47
.34
.71
1.9 2.9
1.4 .1
4
.11
.68
.81
.17
.33
1.4 .4
7
.19
2.5 .2
2.1
7
1.4
Cal
ci
um
(Ca)
65 29 48 32 1.6
49 43 32 34 30 64 24 17 58 64 45 100 66 55 96 21 32 2
.8 1.4
31 112
Mag
ne
sium
(M
g) 7.2
14 2.7
16
.9 3.9
1.7
18 14 3.8
38 11 5.6
3.2
27 22 19 10 2.7
37 1.6
17 1.9
1.1
1.2
75
Sod
ium
(N
a) 6.3 .8 1.5
1.2
2.6
1.9
2.0 1.2
2.0 1.2
147 75
1,03
0 3.4
26 3.7
20 14 2.4
61
.8 2.1
3.6
242 2
.4
518
Pot
as
sium
(K
) 1.0 .2 .7 .4 .7 .8 .4 .6 .6 .5 3
.8 3.1
20
.6 2.4 .6 1.9
1.6 .4 1.2 .6 .9 .9 1.1 .7 5.6
Bic
ar
bona
te
(HC
Os)
171
145
152
166 4
170
131
175
160
110
403
287
1,52
0
164
246
214
281
204
164
291 62 161 14
*473 95 30
8
Sul
- fa
te
(SO
,)
45 1.2
2.2
2.0
1.4
3.4
2.2 1.6
3.7
1.5
277 28 292 7
.0
52 12 69 27 9.5
91 3.6 1.2
5.6
112 6
.5
1,32
0
Chl
o
ride
(C
l)
8.5
2.8
3.2
2.5
4.2 2.5
2.2
2.8
2.5
2.5
3.0
3.8
550 7
.5
36 9.5
31 20 5.2
112 3.0 5.2
4.0
20 2.8
14
Flu
o-
ride
(F
) 0.0 .1 .1 .0 .1 .0 .0 .1 .1 .0 .0 .0 .9 .1 .0 .0 .0 .1 .0 .1 .0 .0 .0
2.0 .1 .3
Ni
tr
ate
(NO
,)
0.4
3.4 .9 3.2
5.1
1.1 .7 .5 3.2 . i .2 .4 .7 8.9
20 5.3
17 13 1.5
20 1.8
10 1.1 .0 1.0
3.1
Dis
so
lved
so
Uds 23
7
131
143
148 28 160
128
153
149
103
756
305
2,69
0
186
372
213
425
281
169
582 77 159 37 639
103
2,22
0
Har
dnes
s as
CaC
O,
Cal
cium
, m
agne
si
um
192
130
131
146 8
138
114
154
142 90 316
105 66 158
270
203
328
206
148
392 59 150 15 8 82 588
Non
- ca
rbon
at
e
52 11 6 10 4 0 7 10 11 0 0 0 0 23 69 27 98 39 14 153 8 18 3 0 4
336
Spe
cifi
c co
nduc
t
ance
(m
icro
- m
hos
at
25 C
)
377
235
245
268 36
.9
268
218
278
259
177
1.09
0
491
4.25
0
301
613
366
633
448
278
963
123
271 69
.2
994
161
2,91
0
PH 7.5
7.6
7.6
7.6
5.0
7.6
7.5 8.0
7.5
7.1 7.0 8.0
7.9
7.5 7.3
7.8
7.2
7.3
7.6 7.3
6.6 7.7
5.6
8.8
7.4
6.9
Col
or 5 5 5 6 4 3 5 5 6 5 6 5 45 4 5 7 5 6 5 5 4 3 6 6 5 7
Tem
per
a
ture
(F
) 70 64 63 64
64 67 65 62 62
9 eO
69
O ^
68
2 O ^65
§
. 1-3 KJ SO
64 65 65 68 65 62 62 63 68 66 - 63 72
S

Tab
le 1
8. -
Che
mic
al q
uali
ty a
t gr
ound
wat
er i
n th
e B
irm
ingh
am a
rea-
Con
tinu
ed
Inde
x no
.pl
ate
1 27
28
29
Loc
atio
n an
d ow
ner
Dol
omit
e co
al m
ine
(Woo
d
war
d Ir
on C
o.).
So
ngo
iron
ore
min
e (W
ood
w
ard
Iron
Co
.).
Flow
ing
wel
l, s
ec.
5, T
. 19
S.
, R
. 3
W.
Use
of
w
ell
N
N
Dat
e of
co
llec
tion
Oct
. 9,
195
2
Oct
. 11
, 19
52
Sep
t. 25
, 19
52
Dep
th
(fee
t)
Min
e sh
aft1
Min
e sh
aft5
+1
, 100
Wat
er-b
eari
ng
form
atio
n
Potts
viU
e fo
rmat
ion.
Park
woo
d fo
rmat
ion.
Sil
ica
(SiO
,) 14
14
18
Iron
(F
e)
.25
62.5
1.1
Cal
ci
um
(Ca) 11
1 13
10
Mag
ne
sium
(M
g) 74 2.4
2.5
Sodi
um
(Na) 60
3 67
59
Pot
as
sium
(K
) 8.5
4.0
1.0
Bic
ar
bona
te
(HC
O,)
324
nee
178
Sul
- fa
te
(SO
,)
1,54
0 30
11
Chl
o
ride
(C
l) 9.0
7.0
6.2
Flu
o-
ride
(F
) .5
1.0 .1
Ni
tr
ate
(NO
,)
2.5
6.0 .0
Dis
so
lved
so
lids
2,52
0
274
200
Har
dnes
s as
CaC
O,
Cal
cium
, m
agne
si
um
582 42
35
Non
- ca
rbon
at
e 316 0 0
Spe
cifi
c co
nduc
t
ance
(m
icro
- m
hos
at
25 Q 3,23
0
372
309
pH 7.5
8.5
7.6
Col
or 7 7
Tem
per
a
ture
(F
) 'es 67
62
1 D
rille
d in
to m
ine
shaf
t.*
Slos
s ir
on o
re m
ines
1 a
nd 2
(co
mpo
site
sam
ple)
.s
Incl
udes
equ
ival
ent
of 2
3 pp
m o
f ca
rbon
ate
(CO
j).
4 N
ot r
epre
sent
ativ
e.s
Sam
ple
rem
aine
d tu
rbid
for
one
mon
th.
Una
ble
to f
ilte
r sa
mpl
e.6
Tot
al i
ron:
41
ppm
.7
Incl
udes
equ
ival
ent
of 4
ppm
of
carb
onat
e (C
Oj)
.

GROUND WATER 49
SAMPLING SITES SHOWN ON PLATE I '
Figure 31. Relation of hardness to dissolved solids of ground waters in the Birmingham area.
marily in relation to formations from which they are derived. The chemical characteristics of water taken from each water-bearing formation are shown in fig ure 30. Figure 31 shows the relation of total hardness to dissolved solids of ground waters in the area.
Cambrian system
Conasauga limestone. The Conasauga limestone crops out in Jones and Opossum Valleys and is about 1,900 feet thick. This limestone is generally dark blue gray and massively bedded, but locally it is thin bedded and shaly. Good exposures of the Cona sauga limestone can be seen a mile north of North Birmingham in the Lone Star Cement quarry.
The Conasauga limestone is a good aquifer, and wells are usually productive where extensive systems of solution cavities are penetrated. The Birmingham Ice & Cold Storage Co. at Avenue E and 22d Street South has a well yielding 300 gpm from this limestone.
Another well in this aquifer formerly yielded about 200 gpm at the Air Reduction Sales Co. at the south- side plant.
Water samples were obtained from three wells in the Conasauga limestone. The concentration of dis solved solids was moderately high, ranging from 372 to 582 ppm; the water was hard, ranging from 270 to 392 ppm. The hardness of the water was principally of a calcium and magnesium bicarbonate type (fre quently referred to as temporary hardness), and the sulfate content was high. Each sample contained a larger amount of nitrate than is usually found in most waters, which may indicate pollution. The iron con tent of the three samples was 0.81, 0.1L, and 1.4 ppm.
Cambrian and Ordovician systems
Ketona dolomite. The Ketona dolomite crops out in Jones and Opossum Valleys. It is generally gray to tan, fine grained, locally dense, and massively
50 WATER SUPPLY OF THE BIRMINGHAM AREA, ALA.
bedded1. The Ketona dolomite is well exposed at the Dolcito quarry, a mile north of Tarrant City, and is 400 to 600 feet thick in the Birmingham area.
The dolomite is a good aquifer, and wells at the Connors Steel Co., Armour & Co. (north-side plant), and at Elmwood Cemetery are each reported to pump more than 300 gpm from it. The formation is the source of the larger springs in the area that are used for industrial and municipal supply.
Chemical analyses were made of water samples from the Ketona dolomite collected from three wells, 208, 335, and 350 feet deep, and from one spring. The waters were fairly uniform in composition and were lower in mineral content than those from wells tapping the Conasauga limestone. Dissolved solids in the four water samples from the Ketona dolomite ranged from 148 to 213 ppm. The water was hard, 146, 154, 150, and 203 ppm. Samples collected from the Ketona dolomite showed that the water was low in iron, chloride, and sulfate.
Copper Ridge dolomite. The Copper Ridge dolomite is about 2, 000 feet thick. It is a light-gray fine grained dolomite; in weathered outcrops it contains compact, dense, brittle angular chert. The thick mantle of angular fractured cherty residuum forms an excellent reservoir for ground water and feeds solution cavities in the underlying fresh dolomite. Good ex posures of chert of the Copper Ridge dolomite can be seen on the road from Huffman north to Mount Pinson.
This formation is a good aquifer. Some wells de veloped in the cherty residuum and in solution cavities in the dolomite yield more than 150 gpm.
Two water samples from wells in the Copper Ridge dolomite were analyzed. The two samples had similar mineral contents, dissolved solids (131 and 149 ppm), and hardness (130 and 142 ppm). The quantities of sodium, chloride, sulfate, and iron were low.
Ordovician system
Attalla chert conglomerate member. The Attalla chert conglomerate member of the Chickamauga lime stone is a conglomerate consisting of angular to sub- angular sand-size to cobble-size chert particles with siliceous cement. It crops out in small scattered patches. Data were not obtained for any wells in this formation.
Chickamauga limestone. The Chickamauga lime stone crops out along Red Mountain from the vicinity of Bessemer northeastward past Irondale. This lime stone is about 250 feet thick, light gray to dove colored, fine grained, dense, and hard. It is well ex posed in the bluff southeast of Gate City where at one time it was quarried for flux. This limestone is not an important aquifer because of its extremely narrow outcrop and the fact that, where buried, it lies be neath the relatively impervious Red Mountain formation.
Silurian system
Red Mountain formation. The main exposures of the Red Mountain formation are in Red Mountain. This formation consists of sandstone, shale, and calcareous and siliceous iron-ore beds; it is 200 to 300 feet thick in this area. Most of the iron ore smelted in the fur naces in the Birmingham area is mined or stripped from Red Mountain. This formation is not generally considered a good aquifer because of the relatively large thickness of impervious shale and the prevailing low permeability of the sandstone.
One water sample was collected from the Red Moun tain formation from the well at the Tel-Hop Drive-In near Irondale. This sample contained 103 ppm of dis solved solids and had a hardness of 90 ppm. The water was predominantly of the calcium bicarbonate type and was low in sodium, sulfate, and chloride. The iron content (0. 71 ppm) was higher than desirable for most uses.
Devonian system
Frog Mountain sandstone. The Frog Mountain sand stone crops out along Red Mountain above the Red Mountain formation and in some places along west Red Mountain where it has not been removed by faulting and erosion. This sandstone is brown and yellow, fine grained, and massively bedded. The formation is not a good aquifer because the sandstone is well cemented and 22 feet or less in total thickness.
Chattanooga shale. The Chattanooga shale in the Birmingham area is not more than 1 foot thick. It is varicolored, and clayey in the upper 4 to 5 inches. It is important as a geologic marker to use in test drilling.
Carboniferous system, Mississippian series
Fort Payne chert. The Fort Payne chert is exposed along Red Mountain and west Red Mountain. The chert is varicolored, commonly iron stained, and thin to medium bedded. Many weathered outcrops contain chert which shows bedding and well-developed solution cavities containing sandy clay filling. Sample logs indicate that the Fort Payne is about 100 feet thick in this area. The Fort Payne chert is a good aquifer and is often developed with the overlying Warsaw lime stone. Several wells yield more than 100 gpm of water from these formations. Both formations contain solu tion cavities and fractures which allow the ready pas sage of water. The municipal wells at Trussville and Greenwood tap these two formations.
The Fort Payne chert and Warsaw limestone yield waters which predominate in calcium bicarbonate. Other mineral constituents are usually very low. The water samples contained from 128 to 237 ppm of dis solved solids. The quantities of chloride, nitrate, and fluoride were low; the iron was less than 0. 80 ppm.

GROUND WATER 51
Warsaw limestone. The Warsaw limestone crops out on the southeast of Red Mountain between the Fort Payne chert and a ridge formed by the Hartselle sand stone. An incomplete exposure of the Warsaw lime stone is found in a railroad cut between Irondale and Gate City where it is light gray, coarse grained, crystalline, and thick bedded. Sample logs indicate that the Warsaw is about 100 feet thick in the Birming ham area. This limestone is a good aquifer because of well-developed solution cavities and fractures.
One sample was collected from a well reported to be yielding from both the Gasper formation and the Warsaw limestone. The chemical content of this water sample was similar to that from the Fort Payne and Warsaw formations it was predominantly of the cal cium bicarbonate type, and low in magnesium, sodium, sulfate, chloride, and nitrate. The iron content of the water, however, was above the acceptable limit for municipal use.
Gasper formation. The Gasper formation crops out above the Warsaw limestone along the southeast slope of Red Mountain. This formation is about 100 feet thick and consists of shale and thin beds of sandstone. A good exposure of the Gasper formation is at Walker Gap where it is a predominantly light-gray sandy massively bedded shale.
In the immediate vicinity of Birmingham the Gasper formation is predominantly shale and is not a good aquifer. Near Roebuck Plaza the Gasper contains beds of limestone with solution cavities in which a well capa ble of yielding 230 gpm has been developed.
Hartselle sandstone. The Hartselle sandstone forms a prominent ridge trending northeast from the vicinity of Bessemer past Trussville. This sandstone is 75 to 100 feet thick. It consists of white to tan, locally iron-stained, thin-bedded to massively bedded fine- to medium-grained sandstone. Good exposures of this sandstone may be seen along Sandstone Ridge from Walker Gap to Irondale.
The Hartselle sandstone is a good aquifer where it is friable, and many wells have been developed in this formation. A flowing well yielding water from the Hartselle and the underlying Warsaw limestone has been flowing for more than 50 years. The municipal well at Irondale, capable of yielding 200 gpm, pro duces from this formation and possibly from the Gas per formation. One of the wells drilled for the Ernest Norris Yard of the Southern Railway System at Iron- dale was developed in this formation and the Fort Payne and Warsaw formations. This well flowed 50 gpm and has been pumped at 495 gpm.
Water from these three wells was only slightly min eralized and hardness was less than 100 ppm.
Bangor limestone. The Bangor limestone forms a valley similar to that formed by the Warsaw lime stone. The Bangor limestone is 100 to 300 feet thick and is light gray, coarsely crystalline, and thick bedded. It is a good aquifer. A well at the W. B. Baker Dairy on Montevallo Road is capable of yielding 200 gpm, and two wells at the Homewood Dairy Prod ucts Co. furnish about 50 and 60 gpm.
Water samples from these three wells showed that this limestone yields typical calcium bicarbonate type water which contains 169 to 281 ppm of dissolved solids. The waters were hard, 148, 158, and 206 ppm. The quantities of magnesium, sodium, sulfate, chloride, and nitrate were low.
Floyd shale. The Floyd shale is well exposed in road cuts in the vicinity of Bessemer in Shades Val ley. Northward this shale grades laterally into the Gasper formation, the Hartselle sandstone, and the Bangor limestone. The Floyd is about 1, 200 feet thick and is tan and brown with occasional iron stains. It is flaky and soft, and it contains scattered silty sandstone layers 1 to 2 inches thick.
The shale is not a good aquifer, but many domestic wells yield water from sandstone beds in this forma tion. The B. G. Wisenhunt well, about a mile south of Muscoda, is reported to be capable of yielding 30 gpm from a sandstone bed in the shale. Water from this formation generally has a strong odor of hydrogen sulfide.
A sample of water from the Floyd shale showed that the water yielded by this formation differs greatly from that of other formations in the area the water was predominantly of the sodium bicarbonate type with a high sulfate and a low calcium, magnesium, chloride, and nitrate content. The water was extremely soft. It had a fluoride content of 2. 0 ppm and a comparatively high amount of dissolved solids, 639 ppm.
Parkwood formation. The Parkwood formation is exposed along the base of Shades Mountain and oc cupies the lower part of an escarpment overlooking Shades Valley. This formation consists of about 2, 000 feet of sandstone and shale, the shale generally predominating. The shale is dark gray, weathering to various shades of brown, very fine- grained, dense, hard, and flaky. It contains scattered sandstone ledges. The sandstone is olive drab, fine grained, and bonded with tough siliceous cement. The Little Shades sandstone (Poor, 1940), 70 to 80 feet thick, lies at the base of the Parkwood (Mississippi Geolog ical Society, 1940). Wells in this formation generally do not yield more than enough water for home use.
The Parkwood formation yields water similar in quality to that of the Floyd shale. It is a sodium bicar bonate type water in which the sulfate exceeds the chloride, and it is low in calcium and magnesium. The sample collected was reported to have a slight odor of hydrogen sulfide. The analysis does not show the iron content to be abnormally high.
Carboniferous system, Pennsylvanian series
Pottsville formation. The Pottsville formation is exposed at the crest of Shades Mountain and to the southeast. This formation contains several units of conglomerate, sandstone, shale, and coal in the War rior, Cahaba, and Coosa coal fields where it is 2,600, 9, 000, and 7, 500 feet thick, respectively.
The sandstones and conglomerates in the Pottsville formation may be considered fair aquifers where weathering has loosened sand grains from their ce-

52 WATER SUPPLY OF THE BIRMINGHAM AREA, ALA.
meriting material. The shale beds in this formation are not good aquifers. The H. J. Tillia well on the crest of Shades Mountain, about a quarter of a mile northeast of where U. S. Highway 31 crosses Shades Mountain, was reported by the driller to be capable of producing 165 gpm. This well received water from a sandstone at the bottom of the Pottsville formation and from the Parkwood formation below. It is most prob able that the well penetrated a large fissure in the sandstone which is fed by ground water passing through other connecting fissures. Except for the excessive quantity of iron, this well yields water of excellent quality that is extremely soft; however, water samples taken from coal mines were of much poorer quality. (See below.)
Several wells in the Warrior coal field, such as the municipal wells at Brookside and Trafford, are re ported to yield 100 gpm or more from the Pottsville. The yield of wells in this formation, however, is ex tremely variable.
Mines as a source of water
Worked and abandoned coal and iron-ore mines are a potential source of large quantities of ground water. During the active life of the mines this water is pumped to the surface and is used for small public or industrial supplies or is discharged as waste.
Coal mines. Large areas have been mined out and abandoned in the Warrior coal field and have filled, or are filling up, with water. Several groups of mines have been pumped, or are being pumped, to dewater for mining activities. Water was pumped from one group of mines at a rate of about 5 mgd before it was closed down.
The amount of water available in the mines is not known. The areas that will be mined out in the future will greatly enlarge the storage capacity. Faults and other fractures in the rocks exposed by the mine workings have variable water-bearing characteristics. Detailed studies of the geology and occurrence of ground water in the mine areas would be necessary to determine the quantity of water available.
Water samples collected from the coal mines yield ing from the Pottsville formation showed a great vari ation in quality. Dissolved solids in the samples were 305, 756, 2, 220, and 2, 520 ppm, and the iron content was 1. 9, 2. 9, 1. 4, and . 25 ppm. The waters are pre dominantly of the sodium bicarbonate and sulfate type. Although the waters contain large quantities of sodium, usually they are extremely hard. As these waters were from coal-mine shafts, the high sulfate concen tration was probably derived by the oxidation of the pyrite contained in the coal. The pH of the four sam ples was 7. 0, 8. 0, 6. 9, and 7. 5.
Iron-ore mines. The general area mined for iron ore extends from the crest of Red Mountain southeast ward under Shades Valley and Shades Mountain. This area has not been completely mined out. Several mil lion gallons of water is pumped from the mines each day. Most of this water .is pumped into creeks in Shades Valley and Jones Valley, and a small part is used in the mining camps. Water pumped into Valley
Creek in Jones Valley is available for industrial uses downstream. The exact amount of water pumped from iron-ore mines was not known at the time of writing this report.
Water in the mines probably is not from the Red Mountain formation, and mining engineers in the area generally assume that water is supplied to the mines through fractures extending from the mines into the water-bearing Fort Payne chert and Warsaw limestone.
A safe estimate indicates that much more than 10 mgd is pumped from the iron-ore mines. The quantity of water available from the ore mines in the future will depend on hydrologic conditions in the aquifers supplying ground water to the mines.
Two water samples were collected from iron-ore mines. The sample collected on the second day of pumping after the Songo mine had been flooded was highly colored and turbid, and it remained turbid for more than a month after collection. Except for the turbidity and the iron content which was 41 ppm, the quality of the water was good. Sodium, bicarbonate, and sulfate were the principal constituents in solution. A composite was made of water samples from Sloss mines 1 and 2. The composite sample contained mostly sodium bicarbonate but had high sulfate and chloride contents.
Potential Development
Aquifers
A reconnaissance survey of the ground water in the Birmingham area indicates that this resource has not been fully developed.
The Ketona dolomite and Conasauga limestone are good aquifers. Wells in these formations yield as much as 350 gpm. Additional wells in these forma tions could be drilled in the area. The Copper Ridge dolomite would be expected to have yields comparable to the Ketona and Conasauga. The only way to deter mine whether 350 gpm represents the maximum po tential yield of a well in any of these formations is to conduct a test-drilling and test-pumping program. Such a program would determine pumping rates and spacing of wells so that interfering cones of depres sion could be avoided. The Fort Payne chert and Warsaw limestone together compose an aquifer from which wells yield 180 gpm or more. Additional wells could be developed in these formations. Test drilling and pumping would indicate the best development pro gram for ground-water supplies from this aquifer. The Hartselle sandstone and sandstone in the Pottsville formation generally do not yield large quantities of water. However, the Hartselle alone yields more than 100 gpm to some wells, and a larger amount in com bination with other aquifers. The Hartselle can be de veloped with the Fort Payne and Warsaw formations and the Bangor limestone in many areas. Several wells having yields in excess of 100 gpm have been finished in the Pottsville formation; however, these wells seem to be exceptional. From the information available, most wells in the Pottsville yield less than 60 gpm.

.SELECTED BIBLIOGRAPHY 53
These formations, in order of importance as sources of ground water, are as follows: Ketona dolo mite, Conasauga limestone, Copper Ridge dolomite, Fort Payne chert and Warsaw limestone, Hartselle sandstone, and Pottsville formation.
Abandoned coal mines and iron-ore mines in the area contain large quantities of water that is limited in use by its chemical content. Large amounts of water have been pumped from the mines, and they must be considered a potential source of ground water. The most extensive abandoned mines are in the War rior coal field and in the Red Mountain iron-ore area; little is known of the ground-water potential in mines in the Cahaba and Coosa coal fields. Whether this source of water will ever be developed to any extent, will depend on economic factors.
The best areas for ground-water development are in the outcrop of the Conasauga limestone and Ketona dolomite in Jones and Opossum Valleys. Flowing wells could be drilled in the Fort Payne chert, Warsaw limestone, Hartselle sandstone, and Bangor limestone in Shades Valley. In the part of the valley southeast of Sand Ridge and Sandstone Ridge flowing wells can be developed under favorable topographic conditions. The areas in which mine water could be developed are defined by the extent of abandoned and worked mines.
Quality of ground water in the Birmingham area
Generally the ground waters in the Birmingham area are of poorer quality than the surface waters. Waters from the Conasauga limestone, Ketona dolo mite, Copper Ridge dolomite, Fort Payne chert and Warsaw limestone, Bangor limestone, Gasper forma tion and Warsaw limestone, and Pottsville formation are usually moderately hard to extremely hard; cal cium and magnesium bicarbonate are the predominant constituents. In some waters the hardness nearly equals the dissolved solids (fig. 31). Iron is usually low in most of the water-bearing formations; an ex ception to this is the Pottsville formation. The Floyd shale and the Parkwood formation yield sodium bicar bonate type waters that are high in sulfate and low in calcium, magnesium, chloride, and nitrate. The wa ter from the Pottsville formation is generally charac terized by high sodium bicarbonate and sulfate, and it is extremely hard.
WATER LAWS
The State of Alabama exercises some control over pollution of streams but has no laws controlling the use of water and none that requires supervision or ap proval of water diversion projects. Thus the common- law riparian doctrine is the only one that may be said to govern the use of water in the State.
This doctrine as applied to Alabama recognizes the right of the owner of land that is adjacent to a stream to make reasonable use of the water. He may use it for domestic and household purposes and for watering stock. In most places, also, he is entitled to make such use of it for irrigation as may be reasonable in
relation to the similar requirements of riparian land owners. Strictly speaking, he is entitled to have the stream flow along his property undiminished in quan tity and unimpaired in quality by upstream uses, but he is obligated to his downstream neighbor in the same way.
The Federal Government, however, has very sub stantial control over streams in the Birmingham area. This control stems from various powers which the Federal Government has retained for its protection in areas where Federal development programs exist or have been authorized. Thus the development of a major diversion in the Black Warrior River basin, where Federal developments now exist, or in the Coosa River basin, where Federal developments have been author ized, would require the consent of the Federal Govern ment before such a development could be initiated.
SELECTED BIBLIOGRAPHY
Alabama Department of Industrial Relations, Division of Safety and Inspection, Annual Statistical Rept., 1950-1951.
American Society for Metals, 1948, Metals Handbook.Armes, Ethel, 1910, The story of coal and iron in
Alabama.Burchard, E. F., 1940, The cement industry in Ala
bama: Alabama Geol. Survey Circ. 14.Butts, Charles, 1926 a, Analyses of Alabama coals:
Alabama Geol. Survey Bull. 31.____ 1926 b, The Paleozoic rocks, in Geology of
Alabama: Alabama Geol. Survey Special Rept. 14.Congressional documents, 1933, 73rd Cong., 1st sess.
H. Doc. 56, (U. S. Army, Chief of Engineers, War rior and Tombigbee Rivers and tributaries, Alabama and Mississippi).
Hall, B. M., and Hall, M. R., 1916, Water powers of Alabama: Alabama Geol. Survey Bull. 17.
Hazen, Richard, 1951, Proceedings conference on wa ter resources: Illinois Water Survey Div. Bull. 41.
Johnston, W. D., 1933, Ground waters of northern Alabama: Alabama Geol. Survey Special Rept. 16.
Lohr, E. W., Billingsley, G. A., Geurin, J. W., and Lamar, W. L., 1952, The industrial utility of public water supply in the East South Central States: U. S. Geol. Survey Circ. 197.
Poor, R. S., 1940, Road log, first day, December 6, 1940, Birmingham, Ala., and vicinity, in The fourth field trip of the Mississippi Geological Society, De cember 6, 7, 8, 1940, Northwest Alabama Paleozoics.
Rothrock, H. E., 1949, Geology and coal resources of the northwest part of the Coosa coal field, St. Clair County; Ala.: Alabama Geol. Survey Bull. 61, pt. 1.
Statesman's Yearbook, 1951, Macmillian Co., New York.
U. S. Bureau of the Census, 1951, United States Census of Population: 1950.
U. S. Bureau of Mines, 1951, Minerals Yearbook.U. S. Department of Agriculture, 1941, Climate and
Man.U. S. Weather Bureau, 1951, Local climatological
summary, Birmingham, Ala.
IHT.-OOP. SEC.. «»SH.,
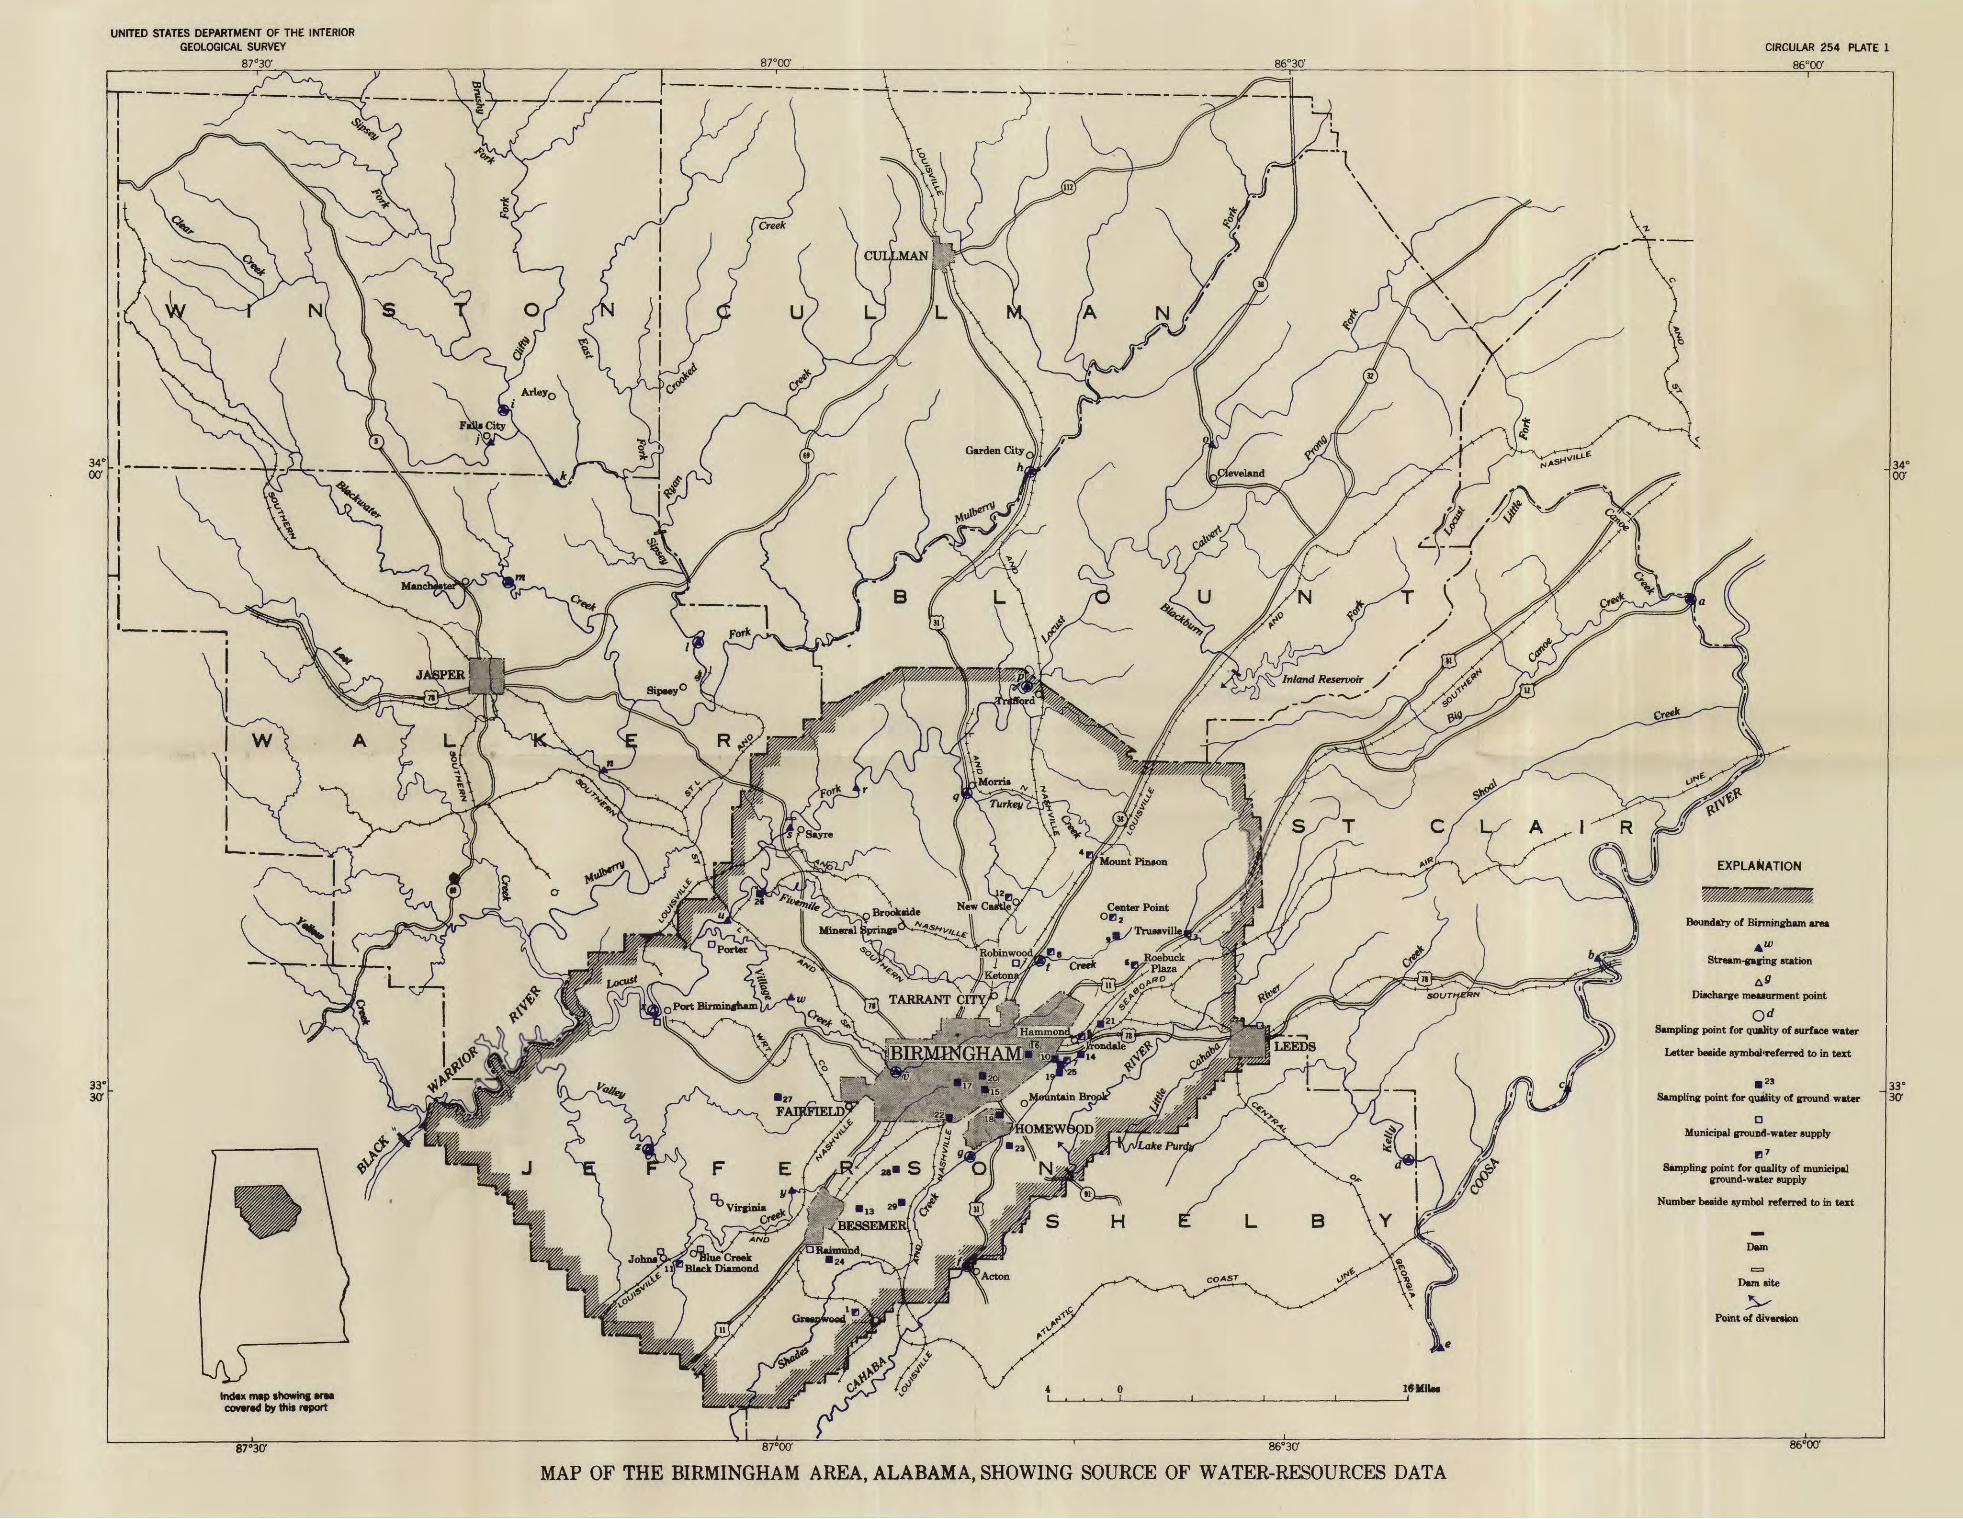
UNITED STATES DEPARTMENT OF THE INTERIOR GEOLOGICAL SURVEY
87*30' 87°00'CIRCULAR 254 PLATE 1
86°00'
Inland Reservoir ./
EXPLANATION
Center PointOB 2
TrussvilleBoundary of Birmingham area
Stream-gaging station
Discharge meaturment pointTARRANT CITYo Port Birmingham
Sampling point for quality of surface water
Letter beside symboJTeferred to in text
Sampling point for quality of ground water
OMEW6Dill\
Municipal ground-water supply
B 7 Sampling point for quality of municipal
ground-water supply
Number beside symbol referred to in text 13
BESSEMER
Creek l« Black Diamond
Point of diversion
lnd«x map showing art* covtrad by this rtport
87°30' 87°00' ' 86°30'
MAP OF THE BIRMINGHAM AREA, ALABAMA, SHOWING SOURCE OF WATER-RESOURCES DATA

UNITED STATES DEPARTMENT OF THE INTERIOR GEOLOGICAL SURVEY ^ . 8
CIRCULAR 254 PLATE 2
Geology modified from Charles Butts
EXPLANATION
SEDIMENTARY ROCKS
Sandstone, shale, coal, and conglomerate
Gray shale and sandstone, with LittleShades sandstone (of Poor) is at
Floyd shaleShale with scattered sandstone beds..
Setween Bessemer and Trussville grades into Cghb, Gasper formation, Hartselle sandstone, and Ban- gor limestone. Floyd shale is a poor aquifer; Gasper formation alone is a poor aquifer but with Hartselle or Warsaw formation is a good aquifer; Hartselle and Sangor formations are good aquifers
Fort Payne chert and Warsaw limestoneBedded and fractured chert overlatn by cavernous
Good aquifer usually considered as
Frog Mountain sandstone and Chattanooga shale Dense sandstone overlain by thin shale. Not aquifers
Red Mountain formationSandstone, shale, and iron-ore (hematite) beds
Generally a poor aquifer
Chickamauga limestoneMassive dense limestone with Oa, Attalla chert
conglomerate member locally at base.developed as an aquifer
Copper Ridge dolomiteCherty dolomite forming very cherty soil.
Fine-grained massive dolomite. Good aquifer
Conasauga limestoneThin-bedded and massive limestone.
Good aquifer
o z z
zu
mo<0 o
Contact
Fault
APPROXIMATE MEAN DECLINATION 1932
GEOLOGIC MAP OF BIRMINGHAM AREA, ALABAMA