Embed Size (px)
Citation preview
Weather information for the Olympic and Paralympic Games in Rio de Janeiro
January 2015
RIO 2016 | Weather information for the Olympic and Paralympic Games in Rio de Janeiro 2016 | Jan 2015
The National Institute of Meteorology (INMET), under the coordination of Alaor Dall’Antonia, produced this brochure with the intention of assisting the many clients who are preparing to take part in the Rio 2016 Olympic and Paralympic Games.
The following pages are the result of a joint effort overseen by the Olympic Public Authority (APO) and a collaboration of various organizations, such as:
Sistema Alerta Rio da Prefeitura do Rio de Janeiro (Alerta Rio);
Centro de Hidrografia da Marinha do Brasil (CHM-MB);
Departamento de Controle do Espaço Aéreo (DECEA);
Subsecretaria Adjunta de Gerenciamento de Projetos do Governo do Rio de Janeiro (EGP–Rio);
Instituto Estadual do Ambiente (INEA);
Instituto Nacional de Meteorologia (INMET);
Ministério do Esporte (ME);
Comitê Organizador dos Jogos Olímpicos e Paralímpicos Rio 2016
RIO 2016 | Weather information for the Olympic and Paralympic Games in Rio de Janeiro 2016 | Jan 2015
January 2015
National Institute of Meteorology - INMET
1 | Introduction: Meteorological systems in Brazil ................................ 3
2 | Host city of the 2016 Olympic and Paralympic Games: Rio de Janeiro . …5 A) Temperature ........................................................................... 7
B) Precipitation ......................................................................... 10
C) Relative humidity ................................................................... 14
D) Atmospheric pressure .............................................................. 16
E) Wind .................................................................................. 16
3 | Co-host cities of Rio 2016 Olympic football competition .................. 30 1. Southeast ............................................................................. 31
Belo Horizonte ..................................................................... 32
São Paulo ........................................................................... 34
2. Northeast ............................................................................. 35
Salvador ............................................................................ 35
3. Midwest ............................................................................... 37
Brasília .............................................................................. 37
Annex ...................................................................................... 39
RIO 2016 | Weather information for the Olympic and Paralympic Games in Rio de Janeiro 2016 | Jan 2015
1 | INTRODUCTION: METEOROLOGICAL SYSTEMS IN BRAZIL
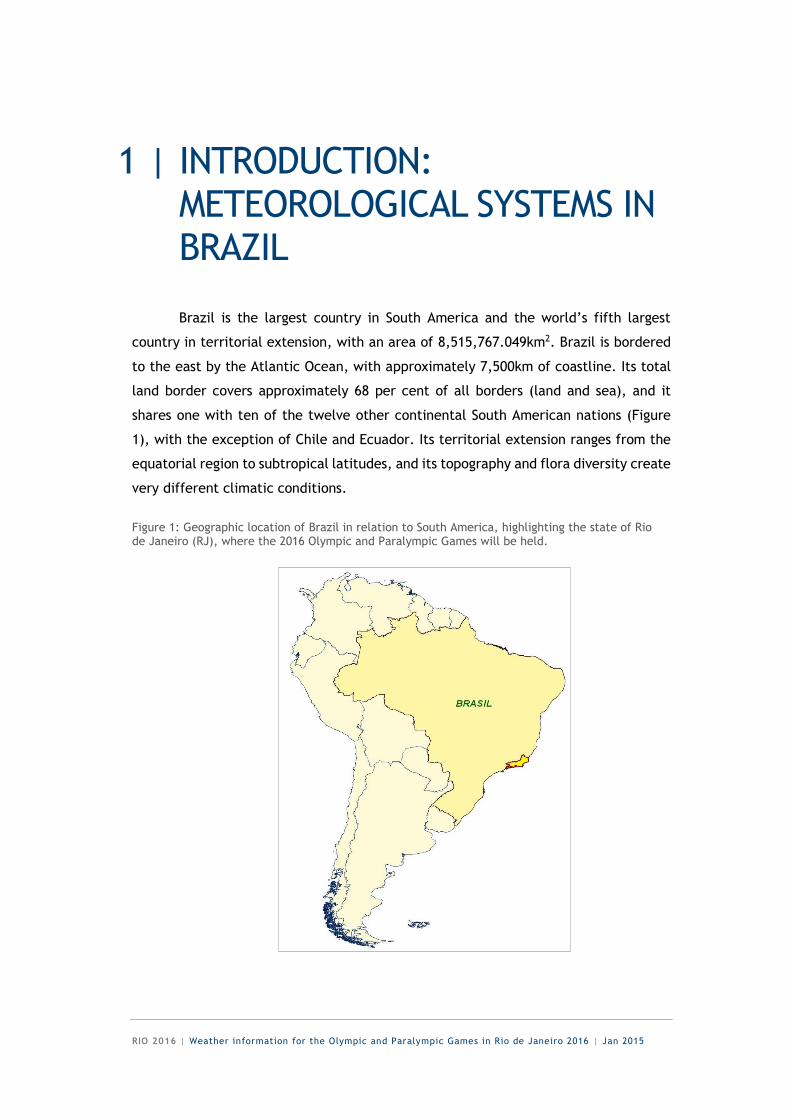
Brazil is the largest country in South America and the world’s fifth largest
country in territorial extension, with an area of 8,515,767.049km2. Brazil is bordered
to the east by the Atlantic Ocean, with approximately 7,500km of coastline. Its total
land border covers approximately 68 per cent of all borders (land and sea), and it
shares one with ten of the twelve other continental South American nations (Figure
1), with the exception of Chile and Ecuador. Its territorial extension ranges from the
equatorial region to subtropical latitudes, and its topography and flora diversity create
very different climatic conditions.
Figure 1: Geographic location of Brazil in relation to South America, highlighting the state of Rio de Janeiro (RJ), where the 2016 Olympic and Paralympic Games will be held.
RIO 2016 | Weather information for the Olympic and Paralympic Games in Rio de Janeiro 2016 | Jan 2015
The continental territorial dimensions, with geographical and topographical
developments in north-south and east-west directions, favor a wide variety of climates
that have distinct regional characteristics. The north of the country presents a humid
equatorial climate with a short dry season. The dry season in the northeast is limited
to only a few months, featuring a semi-arid climate. It presents low levels of rainfall,
especially in sectors farther away from the coast. There is a greater abundance of
rainfall on the coast, usually associated with the east pulse, a common climatic
phenomenon that occurs during the autumn-winter seasons in the south Atlantic.
The southeast and midwest are influenced by tropical and mid-latitude
systems, with a well-defined dry season during winter and a rainy season in the
summer. An atmospheric blockade conditioning generates prolonged droughts for the
winter, with clear skies, mild temperatures at night and at dawn, high temperatures
during the day and calm seas. There is also a predominance of weather systems
originating in mid-latitudes in this season, notably cold fronts responsible for a sharp
drop in temperature and dry periods, especially in the southern and southeastern
coastal regions.
Local weather systems predominate during the summer, characterised by the
high incidence of convective rains. These systems produce heavy rains that could cause
flash floods in urban centres and landslides on the slopes of the hills in these regions.
Southern Brazil is generally more strongly affected by mid-latitude systems, where
cold fronts are more frequent and cause rainfall year-round, in addition to recurring
freezing temperatures and occasional snow in Rio Grande do Sul and Santa Catarina.
Below is a list of the numerous mechanisms associated with the most recurrent
weather systems that make up the meteorological system operating in Brazil:
Permanent atmospheric pressure systems, such as the South Atlantic Subtropical Anticyclone, or Santa Elena High;
Chaco Low and Bolivia High, usually associated with diurnal warming in the spring and summer months;
Low pressures in the equatorial region, a response to intense heating and convergence of trade winds, generating the Intertropical Convergence Zone (ITCZ);
Cold, hot and stationary fronts;
High migratory polar pressures responsible for the masses of cold air in the country’s south-central region, and even in some regions of the Brazilian Amazon;
RIO 2016 | Weather information for the Olympic and Paralympic Games in Rio de Janeiro 2016 | Jan 2015
South Atlantic Convergence Zone, commonly observed in the spring and summer months.
Please note that the Andes mountain range, which extends from Patagonia to
Colombia, forms a huge north-south barrier that strongly influences the weather and
climate conditions in Brazil, in addition to causing global climatic phenomena such as
El Niño and La Niña, as well as anomalous warming of the Atlantic. This creates
considerable climatic effects on the continental areas, especially during the rainy
season.
Intense convective mechanisms are responsible for high rainfall levels and act
as sources of energy in the atmosphere. Along the coastlines, a distinctive ocean-
continent warming forms the breezes, which, associated with other phenomena and
geographical factors, contribute to the formation of rains. Air mass movements in
zonal and southern directions are associated with faster displacement and the blocking
of frontal systems, promoting heavy rains or long drought periods.
2 | HOST CITY OF THE 2016 OLYMPIC AND PARALYMPIC GAMES: RIO DE JANEIRO
Data from the municipality’s meteorological stations was used to analyse a set
of meteorological parameters, aiming to characterise the weather and climate
conditions. With an average monitoring period from 2007 to 2013, automatic stations
were used as reference for the analysis of weather conditions recorded in recent years
in the city of Rio de Janeiro. Information from the main climatological conventional
station of Rio de Janeiro in the Central Zone was used to study the climate from 1973
to 1991 (located in Aterro do Flamengo), and from 2002 to 2013 (located in the
neighborhood Saúde). Table 1 and Figure 2 indicate the locations and spatial
distribution of the meteorological stations used in the study.
RIO 2016 | Weather information for the Olympic and Paralympic Games in Rio de Janeiro 2016 | Jan 2015
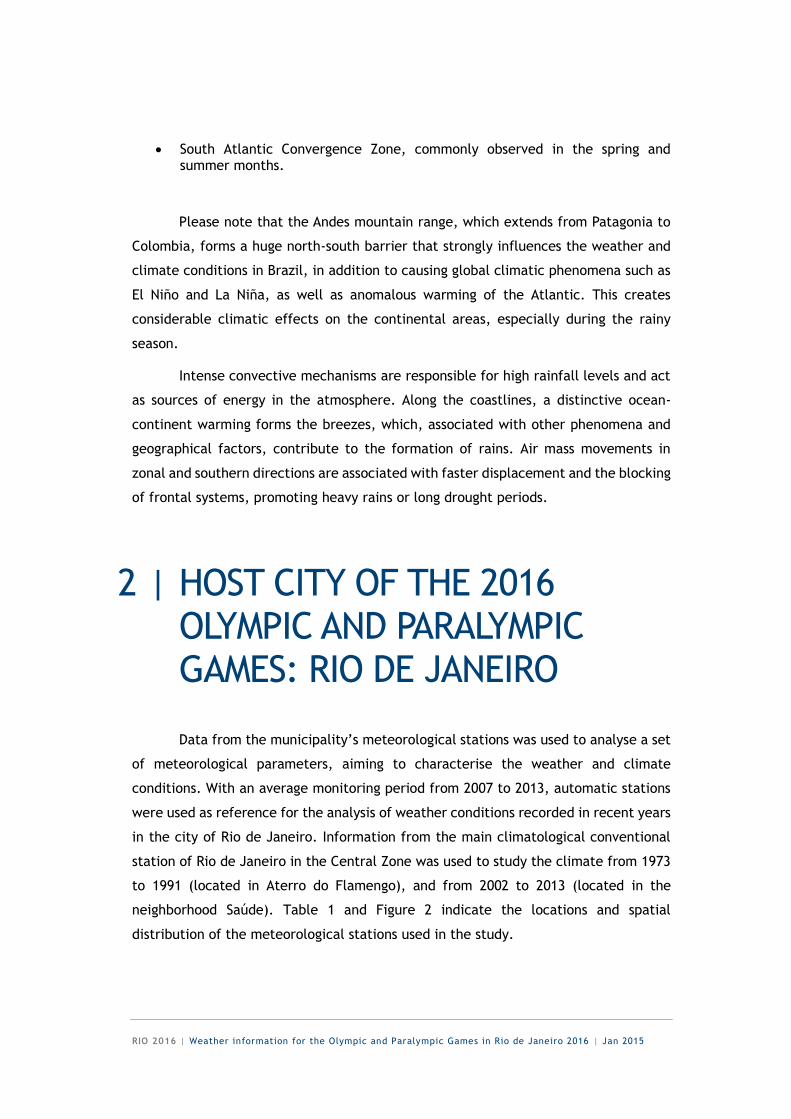
Table 1: Location of meteorological stations used for climate and weather characterisation
Station OMM Code
INMET Code
Latitude Longitude Altitude
Aterro do Flamengo Saúde
83743 - 22º55'16,43''S 22º53'43,30''S
43º10'07,44''W 43º11'10,90''W
5.50 m 11.10 m
Vila Militar 86879 A621 22º51'40,76''S 43º24'41,00''W 22.50 m
Forte de Copacabana 86887 A652 22º59'17,80''S 43º11'25,60''W 10.00 m
Jacarepaguá 86884 A654 22º59'12,90''S 43º22'12,00''W 9.00 m
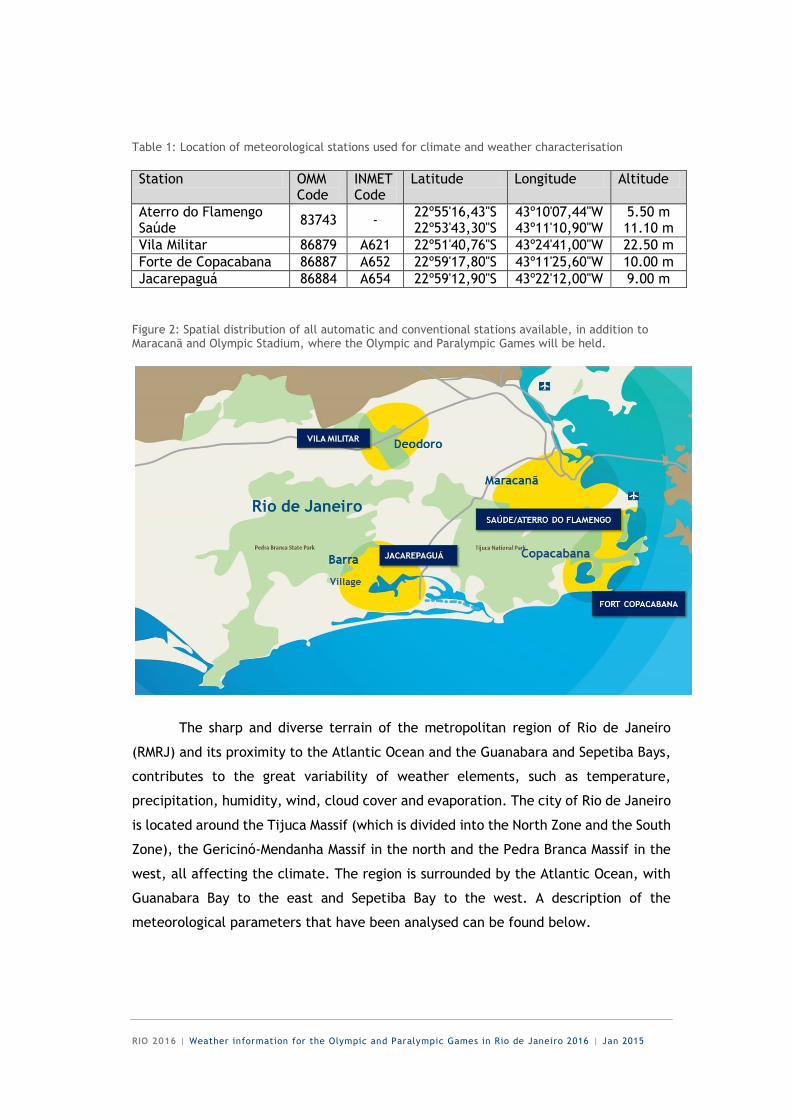
Figure 2: Spatial distribution of all automatic and conventional stations available, in addition to Maracanã and Olympic Stadium, where the Olympic and Paralympic Games will be held.
The sharp and diverse terrain of the metropolitan region of Rio de Janeiro
(RMRJ) and its proximity to the Atlantic Ocean and the Guanabara and Sepetiba Bays,
contributes to the great variability of weather elements, such as temperature,
precipitation, humidity, wind, cloud cover and evaporation. The city of Rio de Janeiro
is located around the Tijuca Massif (which is divided into the North Zone and the South
Zone), the Gericinó-Mendanha Massif in the north and the Pedra Branca Massif in the
west, all affecting the climate. The region is surrounded by the Atlantic Ocean, with
Guanabara Bay to the east and Sepetiba Bay to the west. A description of the
meteorological parameters that have been analysed can be found below.
RIO 2016 | Weather information for the Olympic and Paralympic Games in Rio de Janeiro 2016 | Jan 2015
A) TEMPERATURE
Rio de Janeiro is a coastal city located on the western shore of Guanabara Bay,
near coordinates 22°54'S and 43°12'W, at an altitude of about 10m in relation to the
mean sea level. According to the Köppen climate classification system, its climatic
condition is Atlantic tropical (Aw), characterised by being megathermal with an
average air temperature of 16°C throughout the year and a dry season in which the
average monthly precipitation is less than 60mm for at least one month of the year.
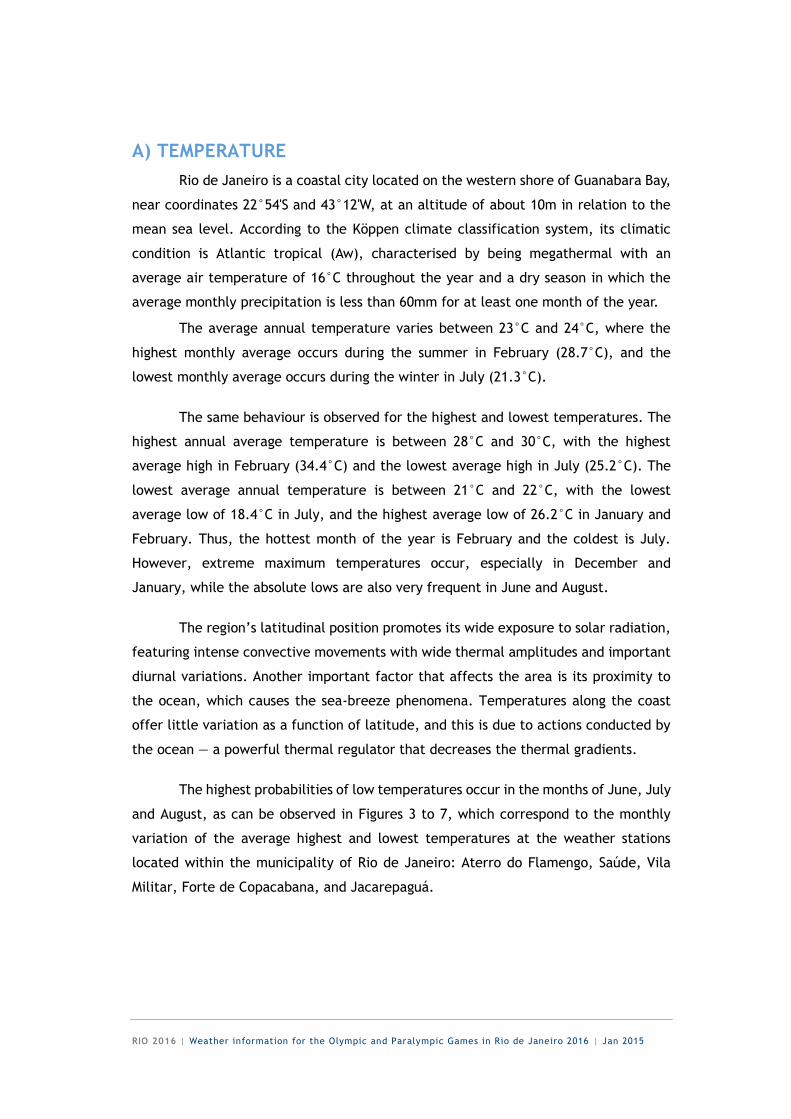
The average annual temperature varies between 23°C and 24°C, where the
highest monthly average occurs during the summer in February (28.7°C), and the
lowest monthly average occurs during the winter in July (21.3°C).
The same behaviour is observed for the highest and lowest temperatures. The
highest annual average temperature is between 28°C and 30°C, with the highest
average high in February (34.4°C) and the lowest average high in July (25.2°C). The
lowest average annual temperature is between 21°C and 22°C, with the lowest
average low of 18.4°C in July, and the highest average low of 26.2°C in January and
February. Thus, the hottest month of the year is February and the coldest is July.
However, extreme maximum temperatures occur, especially in December and
January, while the absolute lows are also very frequent in June and August.
The region’s latitudinal position promotes its wide exposure to solar radiation,
featuring intense convective movements with wide thermal amplitudes and important
diurnal variations. Another important factor that affects the area is its proximity to
the ocean, which causes the sea-breeze phenomena. Temperatures along the coast
offer little variation as a function of latitude, and this is due to actions conducted by
the ocean — a powerful thermal regulator that decreases the thermal gradients.
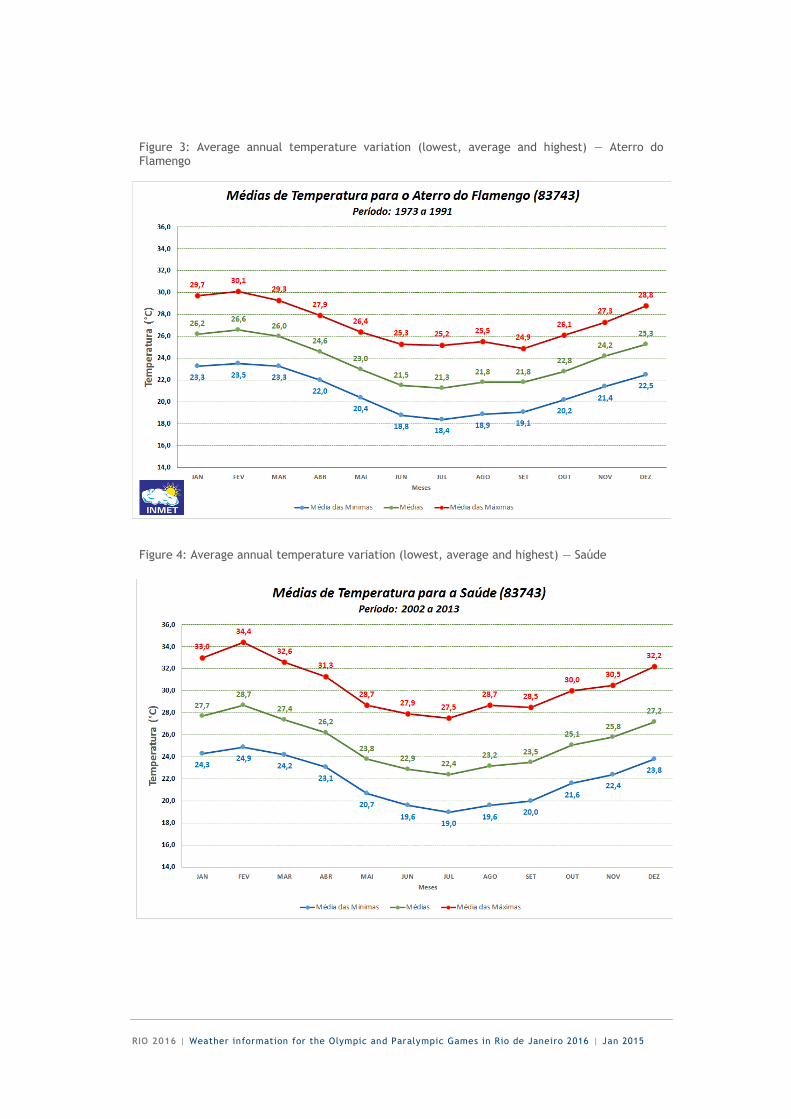
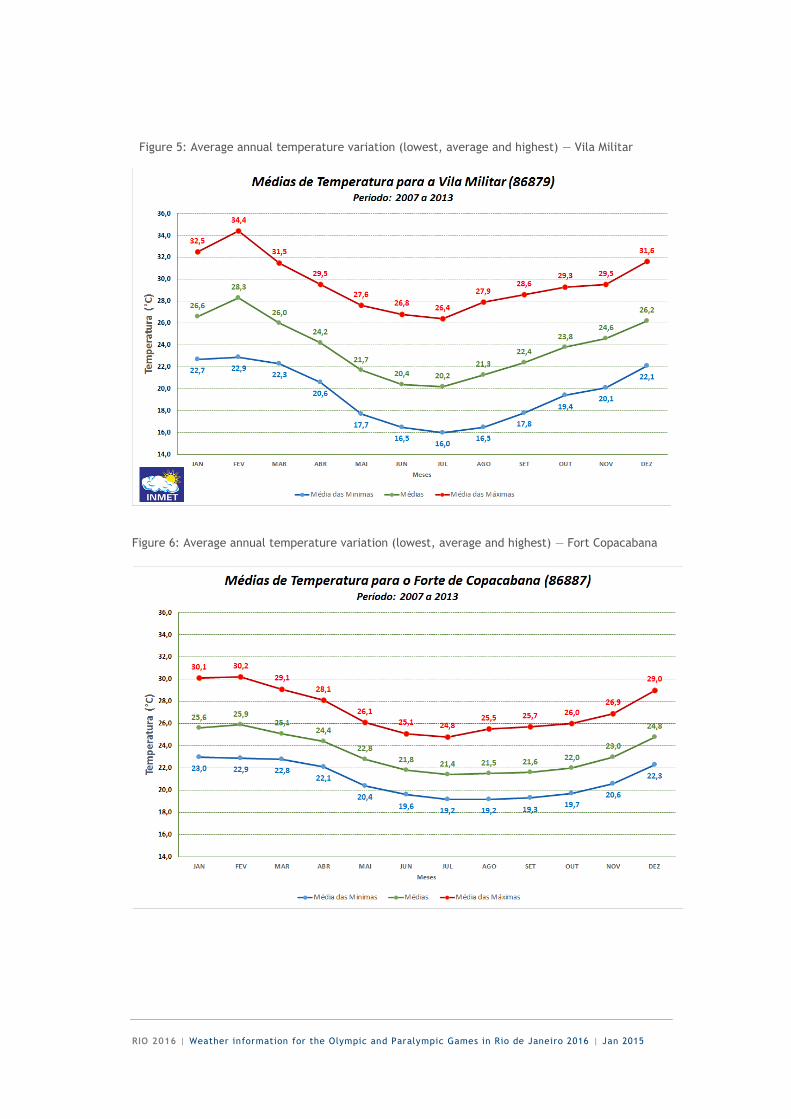
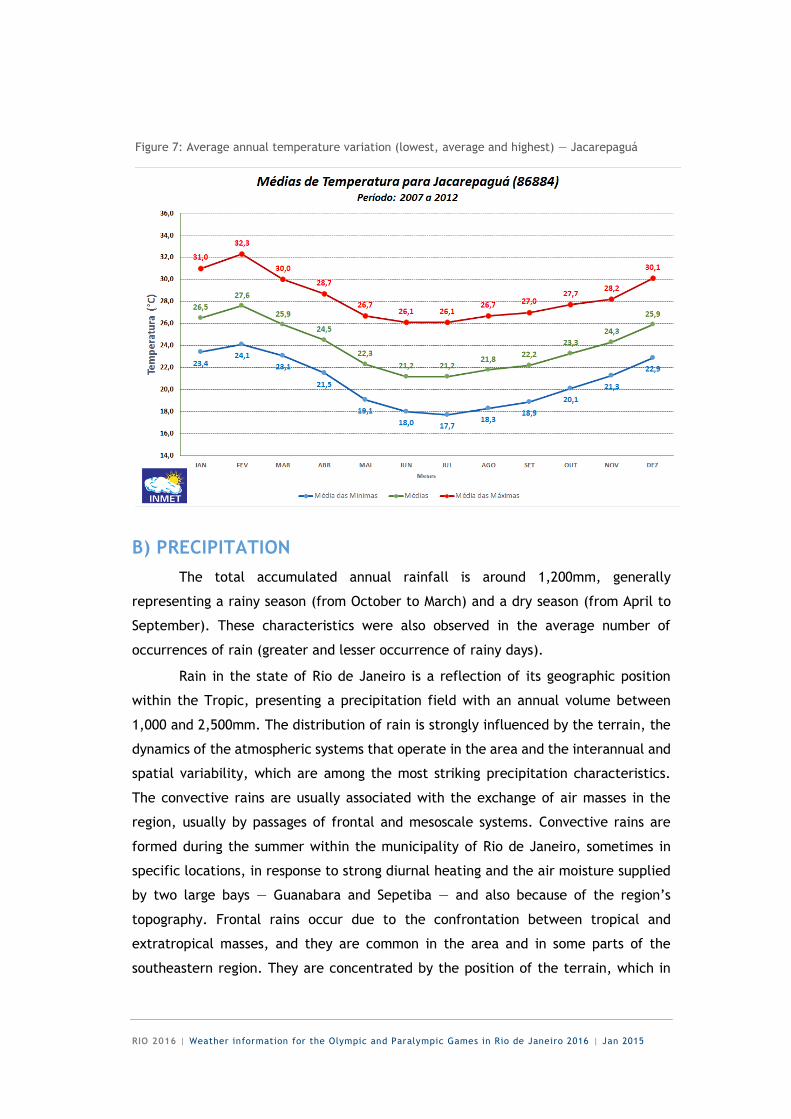
The highest probabilities of low temperatures occur in the months of June, July
and August, as can be observed in Figures 3 to 7, which correspond to the monthly
variation of the average highest and lowest temperatures at the weather stations
located within the municipality of Rio de Janeiro: Aterro do Flamengo, Saúde, Vila
Militar, Forte de Copacabana, and Jacarepaguá.
RIO 2016 | Weather information for the Olympic and Paralympic Games in Rio de Janeiro 2016 | Jan 2015
Figure 3: Average annual temperature variation (lowest, average and highest) — Aterro do Flamengo
Figure 4: Average annual temperature variation (lowest, average and highest) — Saúde
RIO 2016 | Weather information for the Olympic and Paralympic Games in Rio de Janeiro 2016 | Jan 2015
Figure 5: Average annual temperature variation (lowest, average and highest) — Vila Militar
Figure 6: Average annual temperature variation (lowest, average and highest) — Fort Copacabana
RIO 2016 | Weather information for the Olympic and Paralympic Games in Rio de Janeiro 2016 | Jan 2015
Figure 7: Average annual temperature variation (lowest, average and highest) — Jacarepaguá
B) PRECIPITATION
The total accumulated annual rainfall is around 1,200mm, generally
representing a rainy season (from October to March) and a dry season (from April to
September). These characteristics were also observed in the average number of
occurrences of rain (greater and lesser occurrence of rainy days).
Rain in the state of Rio de Janeiro is a reflection of its geographic position
within the Tropic, presenting a precipitation field with an annual volume between
1,000 and 2,500mm. The distribution of rain is strongly influenced by the terrain, the
dynamics of the atmospheric systems that operate in the area and the interannual and
spatial variability, which are among the most striking precipitation characteristics.
The convective rains are usually associated with the exchange of air masses in the
region, usually by passages of frontal and mesoscale systems. Convective rains are
formed during the summer within the municipality of Rio de Janeiro, sometimes in
specific locations, in response to strong diurnal heating and the air moisture supplied
by two large bays — Guanabara and Sepetiba — and also because of the region’s
topography. Frontal rains occur due to the confrontation between tropical and
extratropical masses, and they are common in the area and in some parts of the
southeastern region. They are concentrated by the position of the terrain, which in
RIO 2016 | Weather information for the Olympic and Paralympic Games in Rio de Janeiro 2016 | Jan 2015
this area is opposite to the advancement of tropical systems when they have a more
maritime path.
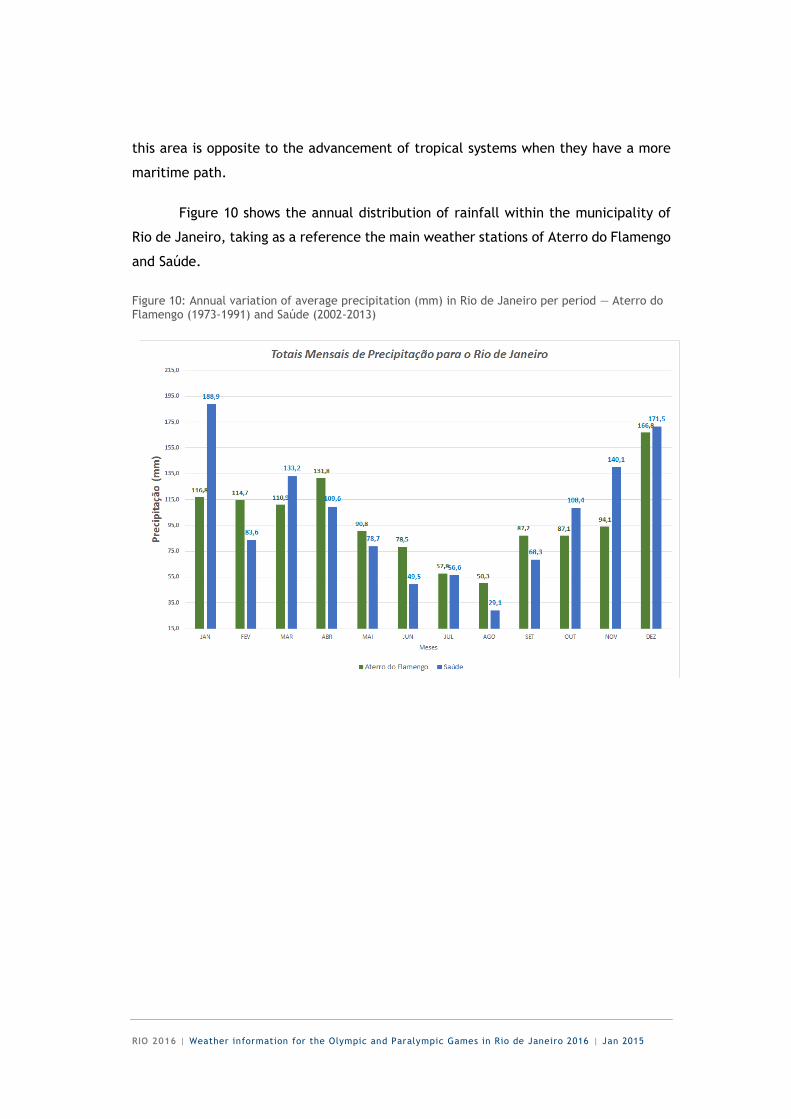
Figure 10 shows the annual distribution of rainfall within the municipality of
Rio de Janeiro, taking as a reference the main weather stations of Aterro do Flamengo
and Saúde.
Figure 10: Annual variation of average precipitation (mm) in Rio de Janeiro per period — Aterro do Flamengo (1973-1991) and Saúde (2002-2013)
RIO 2016 | Weather information for the Olympic and Paralympic Games in Rio de Janeiro 2016 | Jan 2015
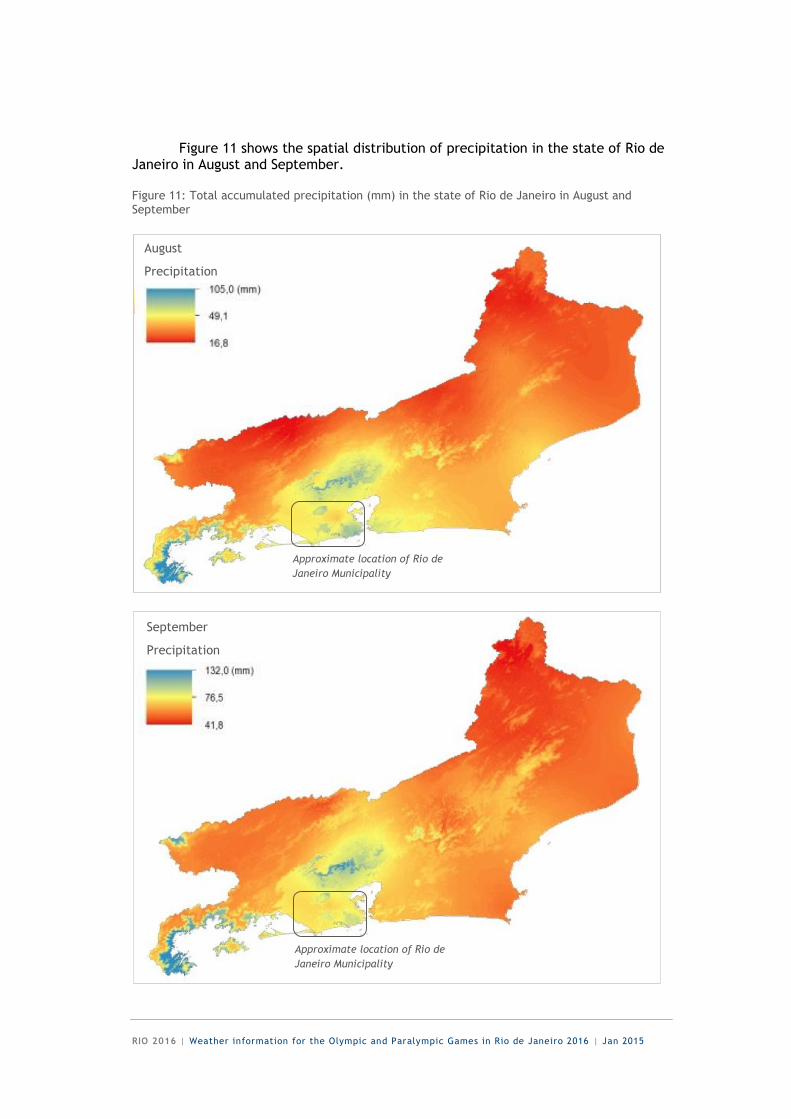
Figure 11 shows the spatial distribution of precipitation in the state of Rio de Janeiro in August and September.
Figure 11: Total accumulated precipitation (mm) in the state of Rio de Janeiro in August and September
Approximate location of Rio de
Janeiro Municipality
August
Precipitation
Approximate location of Rio de
Janeiro Municipality
September
Precipitation
RIO 2016 | Weather information for the Olympic and Paralympic Games in Rio de Janeiro 2016 | Jan 2015
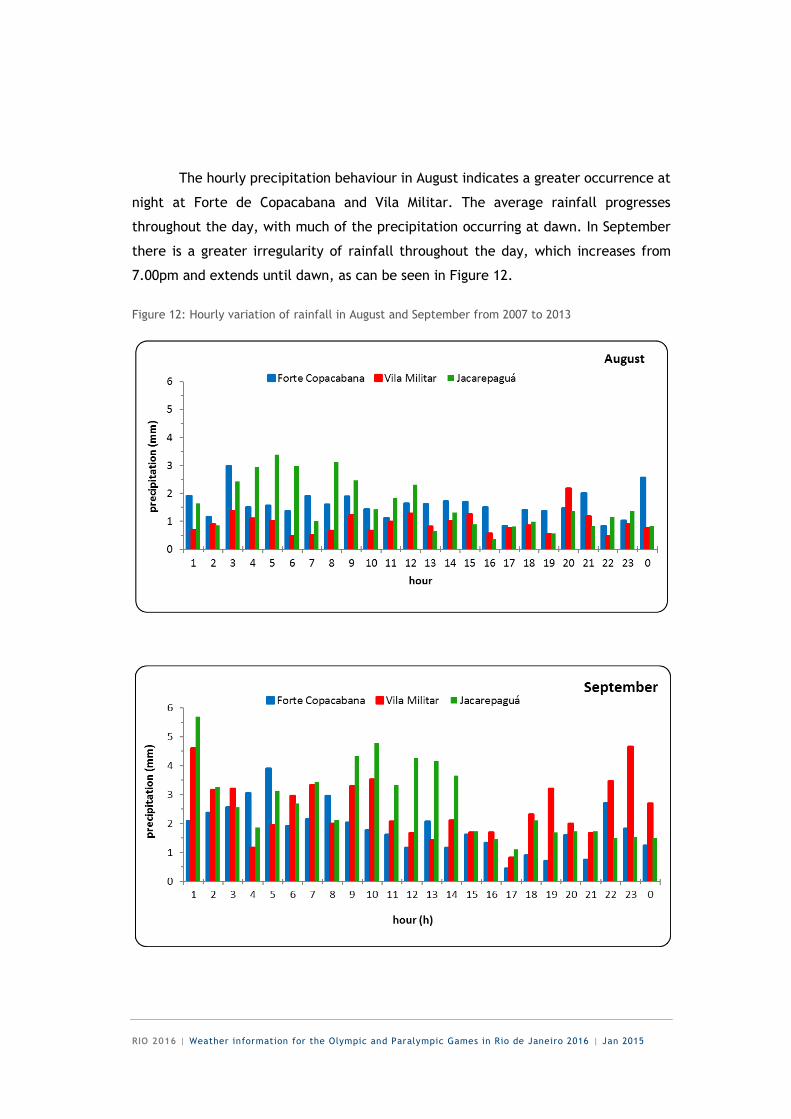
The hourly precipitation behaviour in August indicates a greater occurrence at
night at Forte de Copacabana and Vila Militar. The average rainfall progresses
throughout the day, with much of the precipitation occurring at dawn. In September
there is a greater irregularity of rainfall throughout the day, which increases from
7.00pm and extends until dawn, as can be seen in Figure 12.
Figure 12: Hourly variation of rainfall in August and September from 2007 to 2013
RIO 2016 | Weather information for the Olympic and Paralympic Games in Rio de Janeiro 2016 | Jan 2015
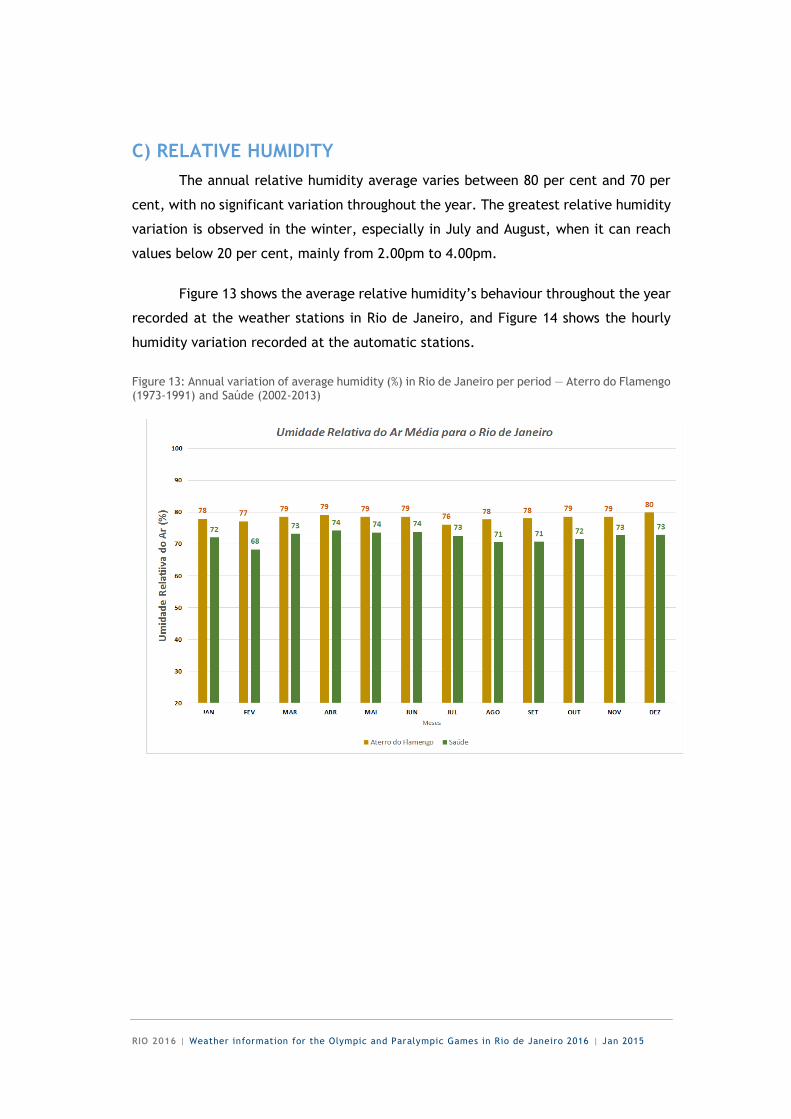
C) RELATIVE HUMIDITY
The annual relative humidity average varies between 80 per cent and 70 per
cent, with no significant variation throughout the year. The greatest relative humidity
variation is observed in the winter, especially in July and August, when it can reach
values below 20 per cent, mainly from 2.00pm to 4.00pm.
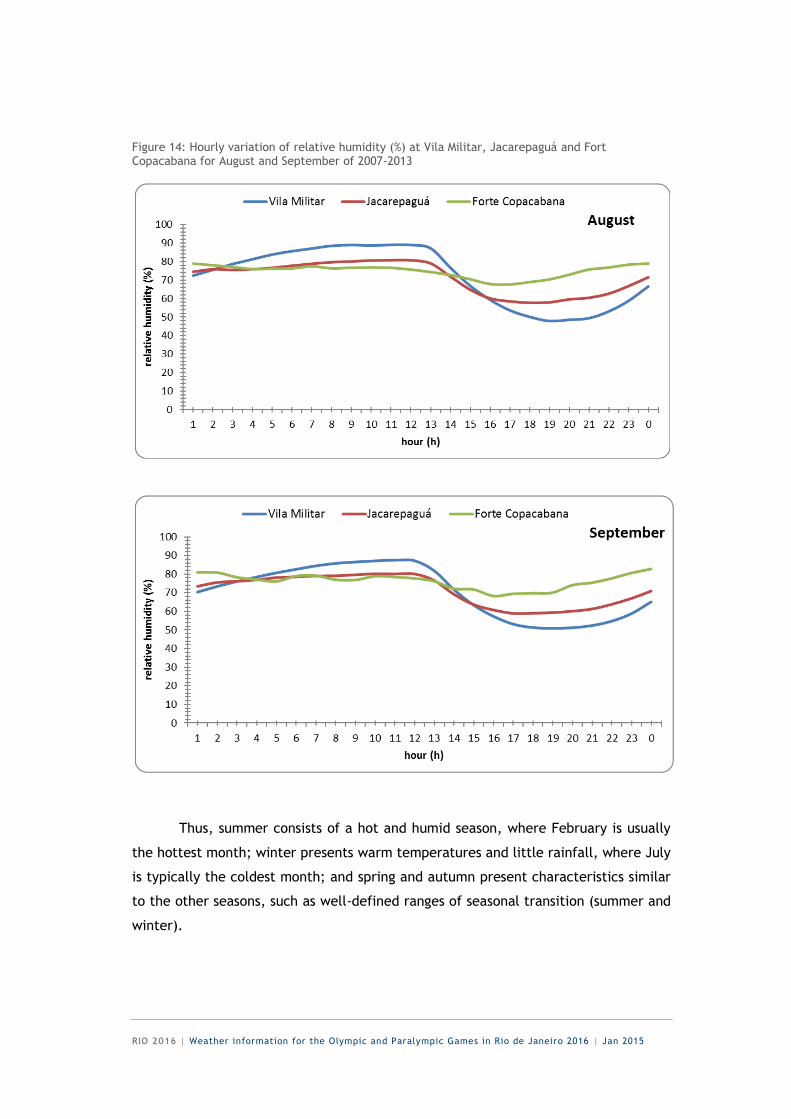
Figure 13 shows the average relative humidity’s behaviour throughout the year
recorded at the weather stations in Rio de Janeiro, and Figure 14 shows the hourly
humidity variation recorded at the automatic stations.
Figure 13: Annual variation of average humidity (%) in Rio de Janeiro per period — Aterro do Flamengo (1973-1991) and Saúde (2002-2013)
RIO 2016 | Weather information for the Olympic and Paralympic Games in Rio de Janeiro 2016 | Jan 2015
Figure 14: Hourly variation of relative humidity (%) at Vila Militar, Jacarepaguá and Fort Copacabana for August and September of 2007-2013
Thus, summer consists of a hot and humid season, where February is usually
the hottest month; winter presents warm temperatures and little rainfall, where July
is typically the coldest month; and spring and autumn present characteristics similar
to the other seasons, such as well-defined ranges of seasonal transition (summer and
winter).
RIO 2016 | Weather information for the Olympic and Paralympic Games in Rio de Janeiro 2016 | Jan 2015
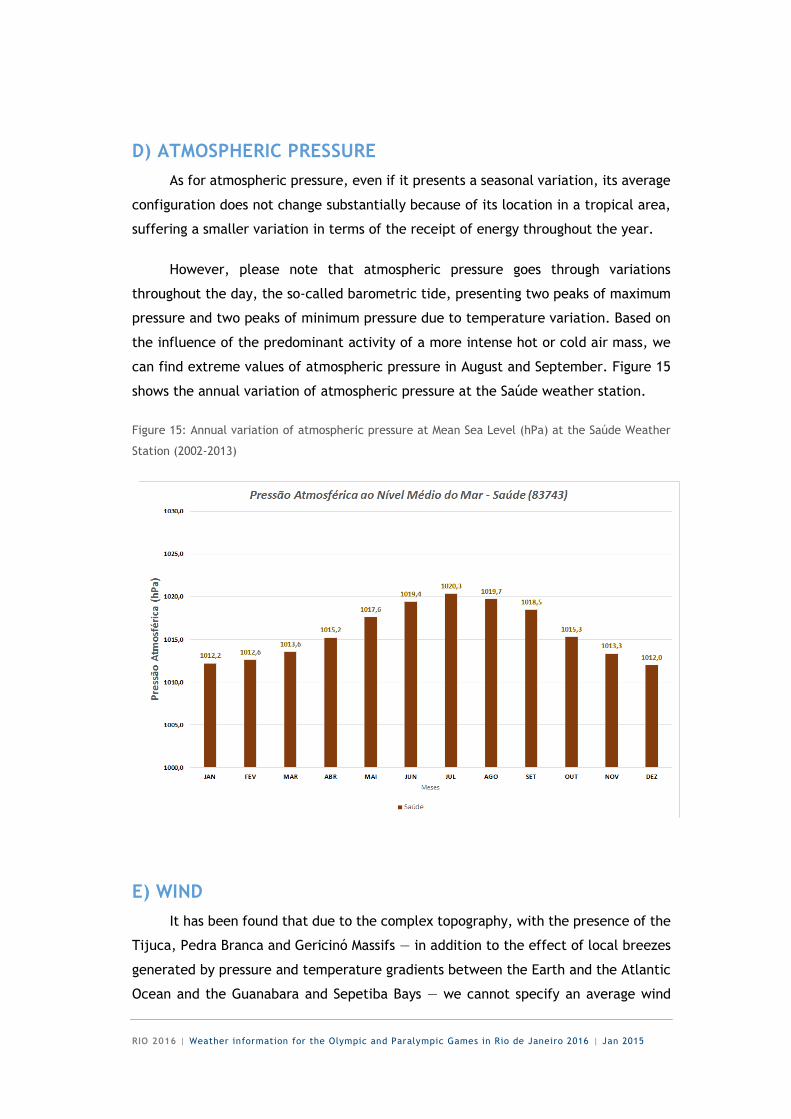
D) ATMOSPHERIC PRESSURE
As for atmospheric pressure, even if it presents a seasonal variation, its average
configuration does not change substantially because of its location in a tropical area,
suffering a smaller variation in terms of the receipt of energy throughout the year.
However, please note that atmospheric pressure goes through variations
throughout the day, the so-called barometric tide, presenting two peaks of maximum
pressure and two peaks of minimum pressure due to temperature variation. Based on
the influence of the predominant activity of a more intense hot or cold air mass, we
can find extreme values of atmospheric pressure in August and September. Figure 15
shows the annual variation of atmospheric pressure at the Saúde weather station.
Figure 15: Annual variation of atmospheric pressure at Mean Sea Level (hPa) at the Saúde Weather
Station (2002-2013)
E) WIND
It has been found that due to the complex topography, with the presence of the
Tijuca, Pedra Branca and Gericinó Massifs — in addition to the effect of local breezes
generated by pressure and temperature gradients between the Earth and the Atlantic
Ocean and the Guanabara and Sepetiba Bays — we cannot specify an average wind
RIO 2016 | Weather information for the Olympic and Paralympic Games in Rio de Janeiro 2016 | Jan 2015
speed for the municipality of Rio de Janeiro, because each location presents a
different type of wind.
According to information from the main weather stations of Rio de Janeiro, the
predominant average wind at Aterro do Flamengo comes from the southwest to the
southeast, while at Saúde it comes from the northeast to the southeast. Aiming to
better characterise the regime of winds, hourly meteorological data from the
automatic stations at Vila Militar, Fort Copacabana and Jacarepaguá were used in
order to generate compass roses for the months of August and September at 9.00am,
11.00am, 3.00pm and 7.00pm, shown in Figures 16 to 21. It is important to note that
in addition to the predominant wind directions, the compass roses also indicate the
frequency of calm conditions and average wind speed, distributed into six classes of
intensity in metres per second (m/s): 0.3 - 1.6; 1.6 - 5.5; 5.5 - 8.0; 8.0 - 13.9; 13.9 -
20.8 and greater than 20.8, as indicated in Table 2.
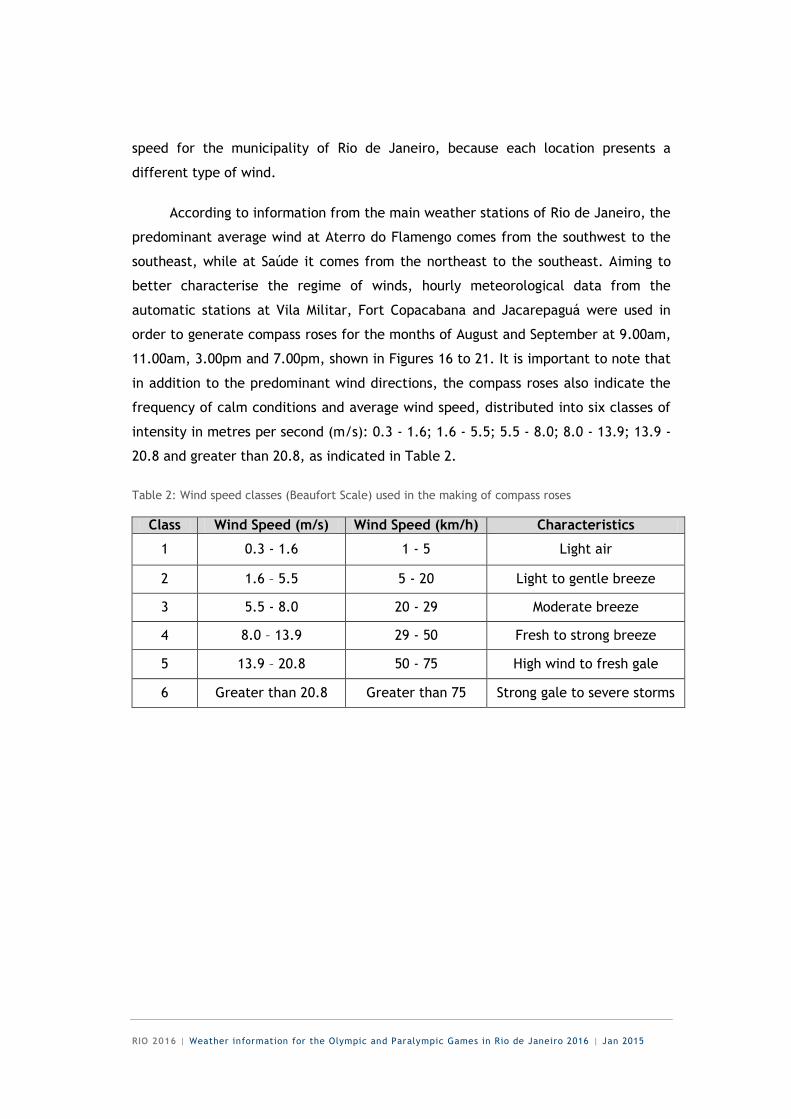
Table 2: Wind speed classes (Beaufort Scale) used in the making of compass roses
Class Wind Speed (m/s) Wind Speed (km/h) Characteristics
1 0.3 - 1.6 1 - 5 Light air
2 1.6 – 5.5 5 - 20 Light to gentle breeze
3 5.5 - 8.0 20 - 29 Moderate breeze
4 8.0 – 13.9 29 - 50 Fresh to strong breeze
5 13.9 – 20.8 50 - 75 High wind to fresh gale
6 Greater than 20.8 Greater than 75 Strong gale to severe storms
RIO 2016 | Weather information for the Olympic and Paralympic Games in Rio de Janeiro 2016 | Jan 2015
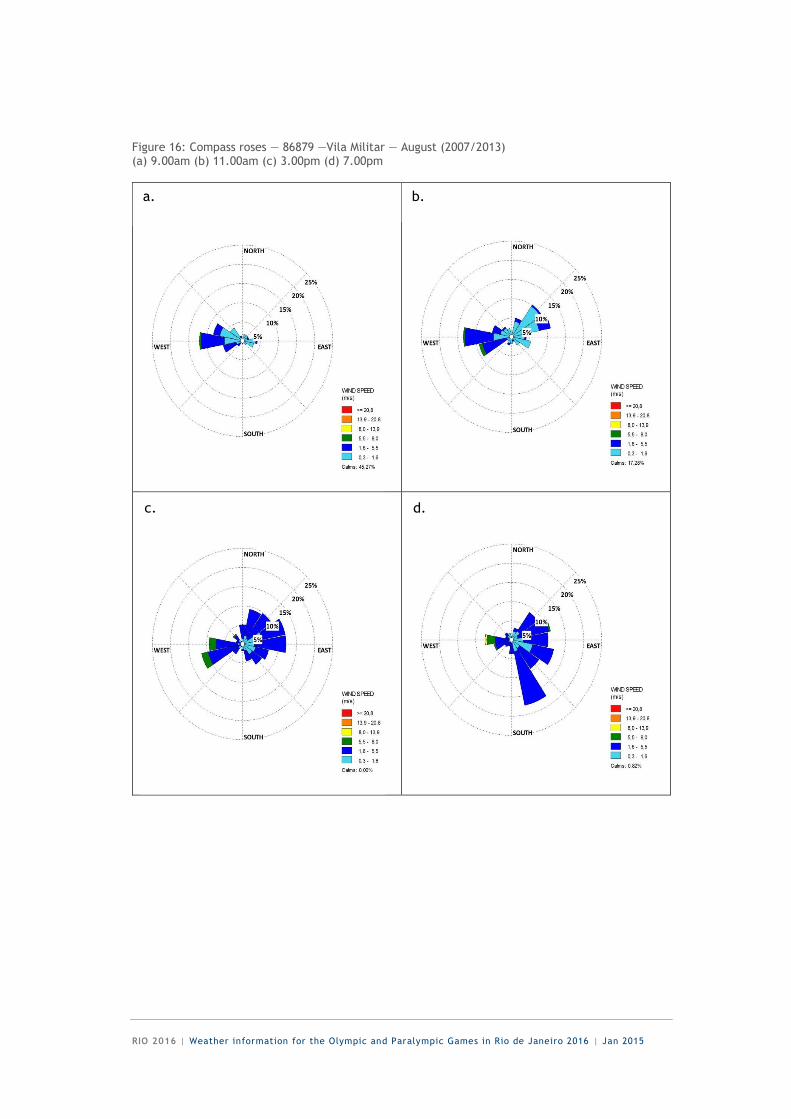
Figure 16: Compass roses — 86879 —Vila Militar — August (2007/2013) (a) 9.00am (b) 11.00am (c) 3.00pm (d) 7.00pm
a. b.
c. d.
RIO 2016 | Weather information for the Olympic and Paralympic Games in Rio de Janeiro 2016 | Jan 2015
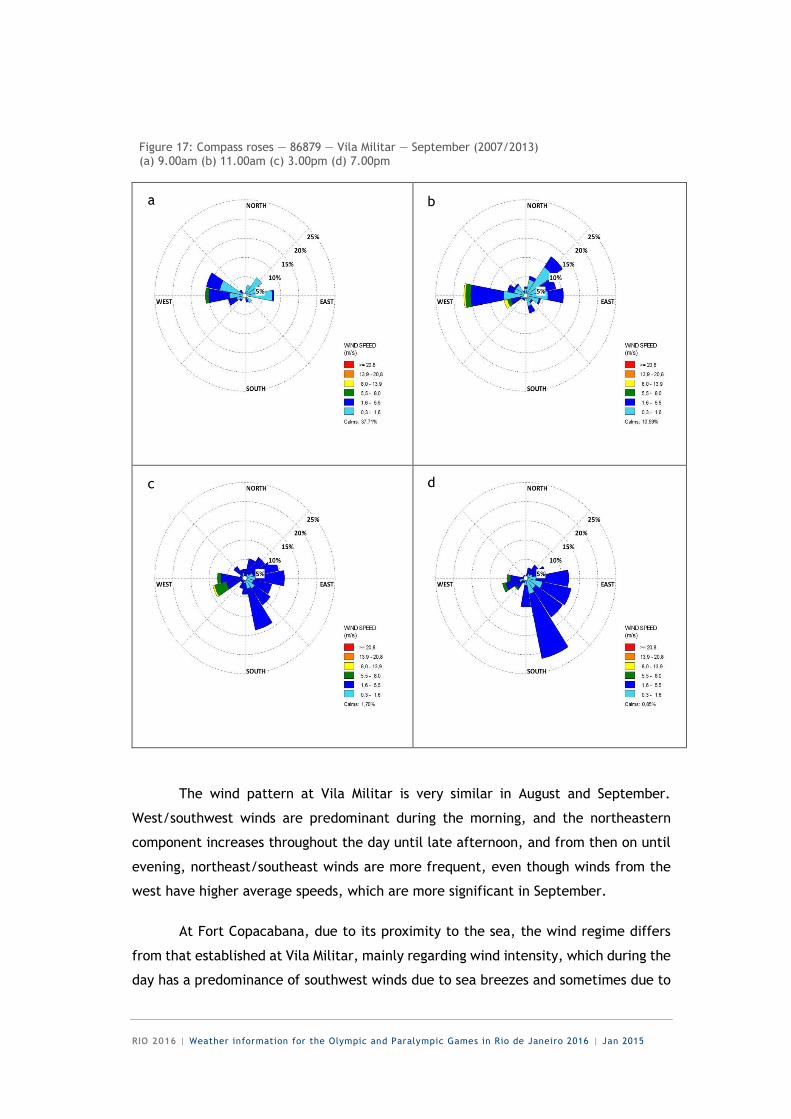
Figure 17: Compass roses — 86879 — Vila Militar — September (2007/2013) (a) 9.00am (b) 11.00am (c) 3.00pm (d) 7.00pm
The wind pattern at Vila Militar is very similar in August and September.
West/southwest winds are predominant during the morning, and the northeastern
component increases throughout the day until late afternoon, and from then on until
evening, northeast/southeast winds are more frequent, even though winds from the
west have higher average speeds, which are more significant in September.
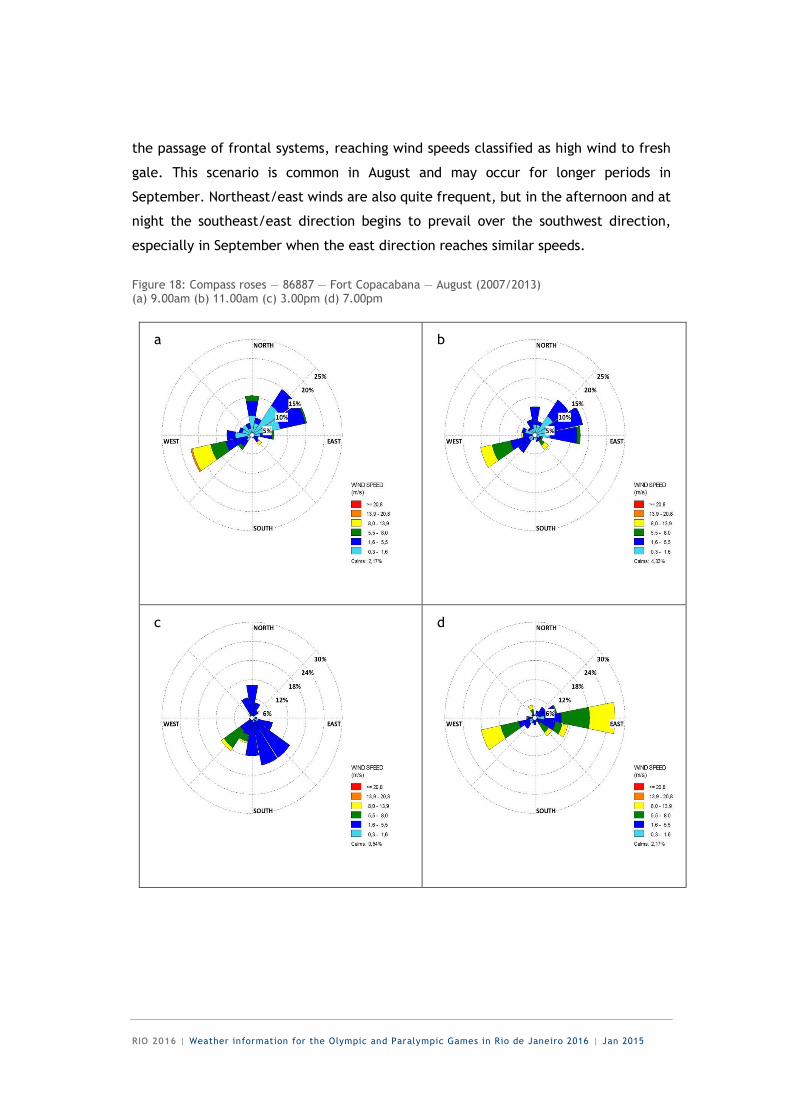
At Fort Copacabana, due to its proximity to the sea, the wind regime differs
from that established at Vila Militar, mainly regarding wind intensity, which during the
day has a predominance of southwest winds due to sea breezes and sometimes due to
a b
c d
RIO 2016 | Weather information for the Olympic and Paralympic Games in Rio de Janeiro 2016 | Jan 2015
the passage of frontal systems, reaching wind speeds classified as high wind to fresh
gale. This scenario is common in August and may occur for longer periods in
September. Northeast/east winds are also quite frequent, but in the afternoon and at
night the southeast/east direction begins to prevail over the southwest direction,
especially in September when the east direction reaches similar speeds.
Figure 18: Compass roses — 86887 — Fort Copacabana — August (2007/2013) (a) 9.00am (b) 11.00am (c) 3.00pm (d) 7.00pm
a b
c d
RIO 2016 | Weather information for the Olympic and Paralympic Games in Rio de Janeiro 2016 | Jan 2015
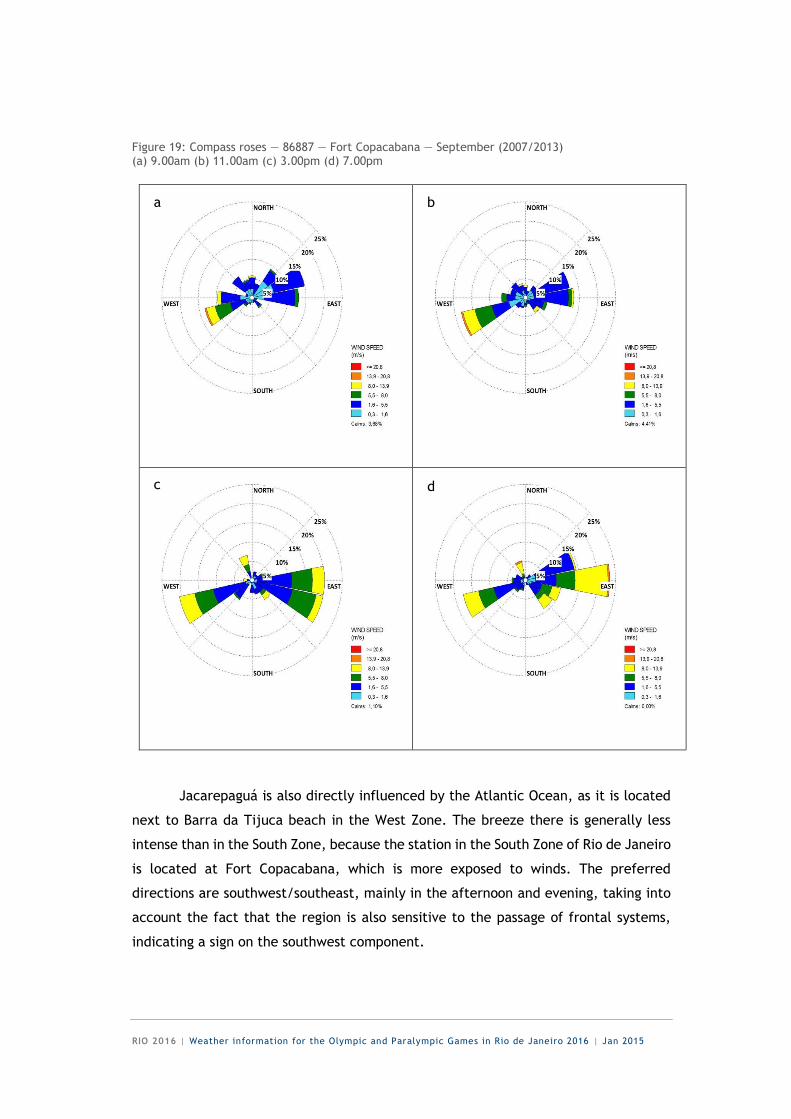
Figure 19: Compass roses — 86887 — Fort Copacabana — September (2007/2013) (a) 9.00am (b) 11.00am (c) 3.00pm (d) 7.00pm
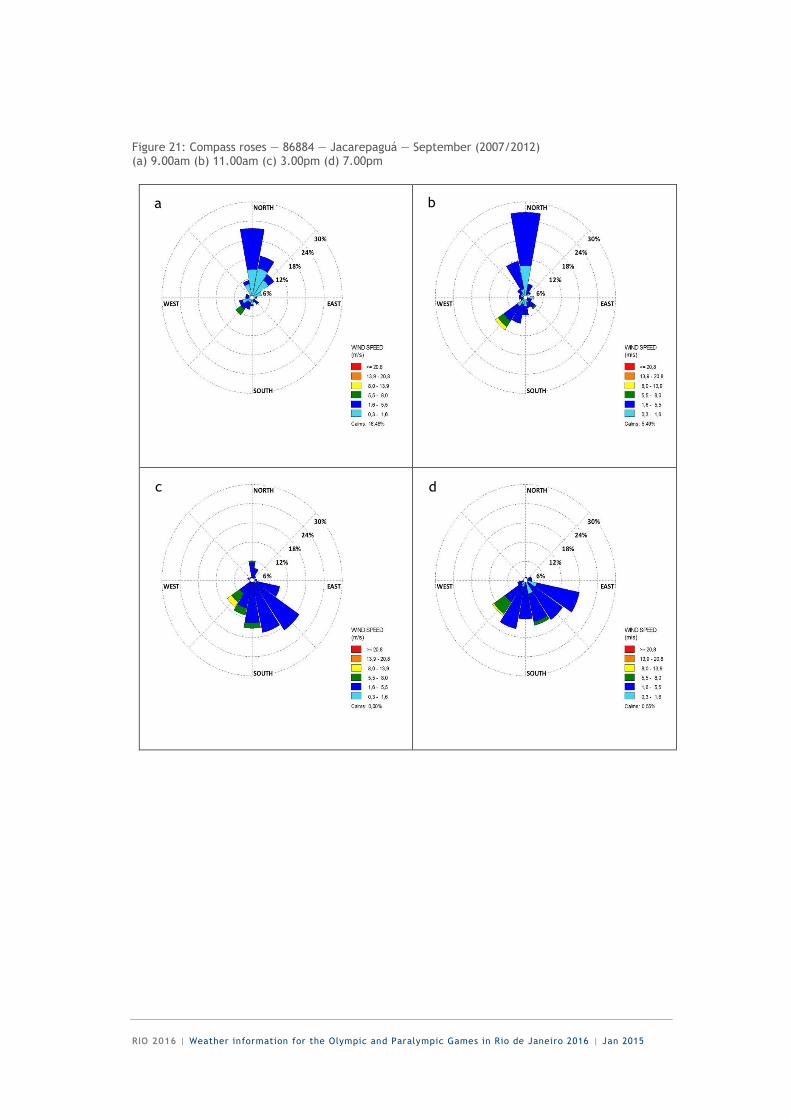
Jacarepaguá is also directly influenced by the Atlantic Ocean, as it is located
next to Barra da Tijuca beach in the West Zone. The breeze there is generally less
intense than in the South Zone, because the station in the South Zone of Rio de Janeiro
is located at Fort Copacabana, which is more exposed to winds. The preferred
directions are southwest/southeast, mainly in the afternoon and evening, taking into
account the fact that the region is also sensitive to the passage of frontal systems,
indicating a sign on the southwest component.
a b
c d
RIO 2016 | Weather information for the Olympic and Paralympic Games in Rio de Janeiro 2016 | Jan 2015
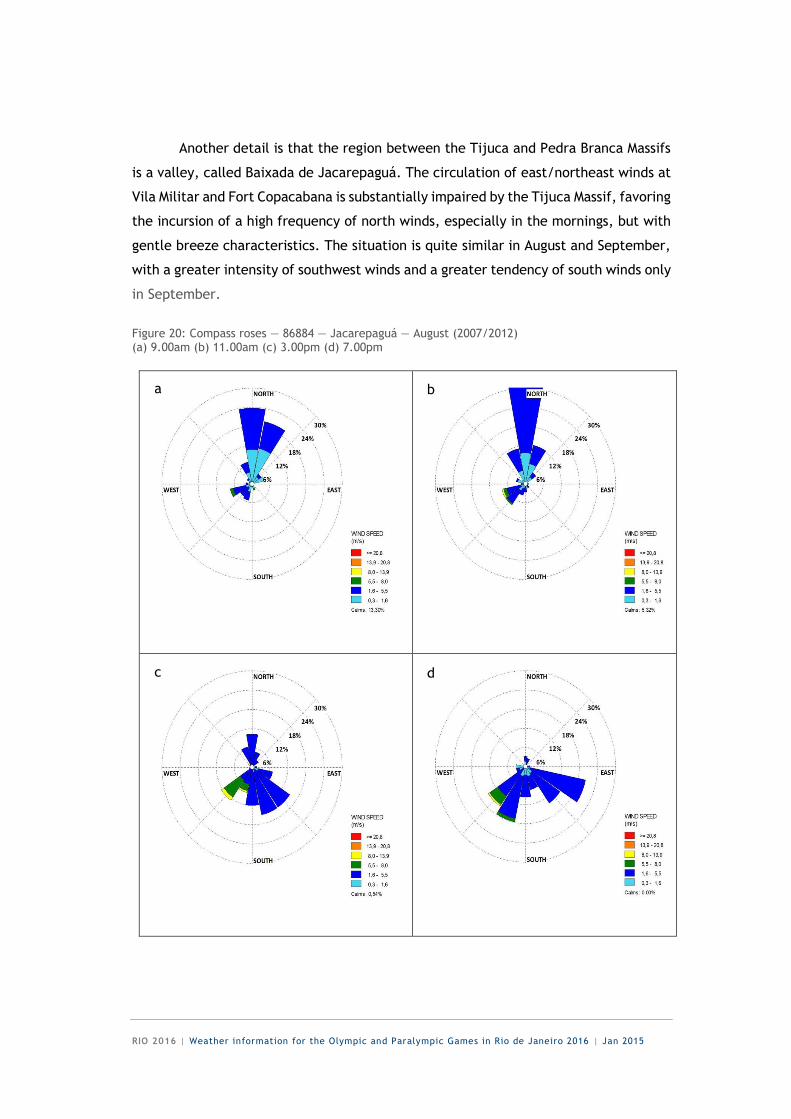
Another detail is that the region between the Tijuca and Pedra Branca Massifs
is a valley, called Baixada de Jacarepaguá. The circulation of east/northeast winds at
Vila Militar and Fort Copacabana is substantially impaired by the Tijuca Massif, favoring
the incursion of a high frequency of north winds, especially in the mornings, but with
gentle breeze characteristics. The situation is quite similar in August and September,
with a greater intensity of southwest winds and a greater tendency of south winds only
in September.
Figure 20: Compass roses — 86884 — Jacarepaguá — August (2007/2012) (a) 9.00am (b) 11.00am (c) 3.00pm (d) 7.00pm
a b
c d
RIO 2016 | Weather information for the Olympic and Paralympic Games in Rio de Janeiro 2016 | Jan 2015
Figure 21: Compass roses — 86884 — Jacarepaguá — September (2007/2012) (a) 9.00am (b) 11.00am (c) 3.00pm (d) 7.00pm
a b
c d
RIO 2016 | Weather information for the Olympic and Paralympic Games in Rio de Janeiro 2016 | Jan 2015
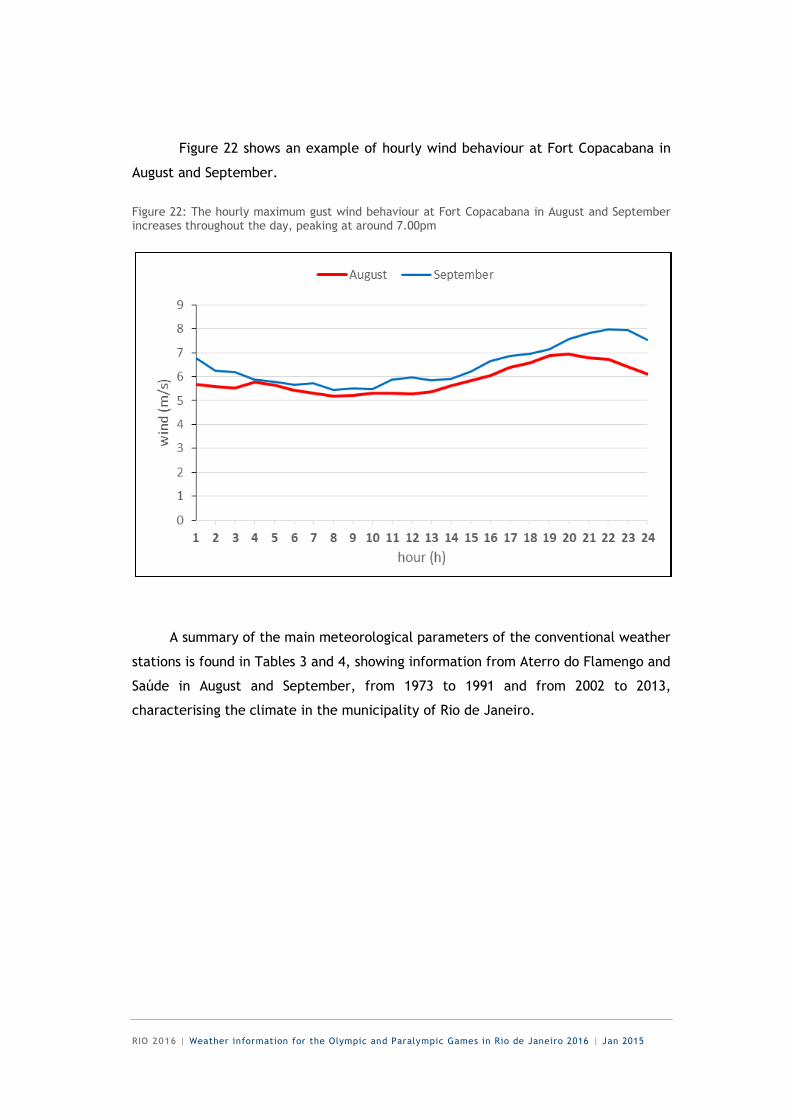
Figure 22 shows an example of hourly wind behaviour at Fort Copacabana in
August and September.
Figure 22: The hourly maximum gust wind behaviour at Fort Copacabana in August and September increases throughout the day, peaking at around 7.00pm
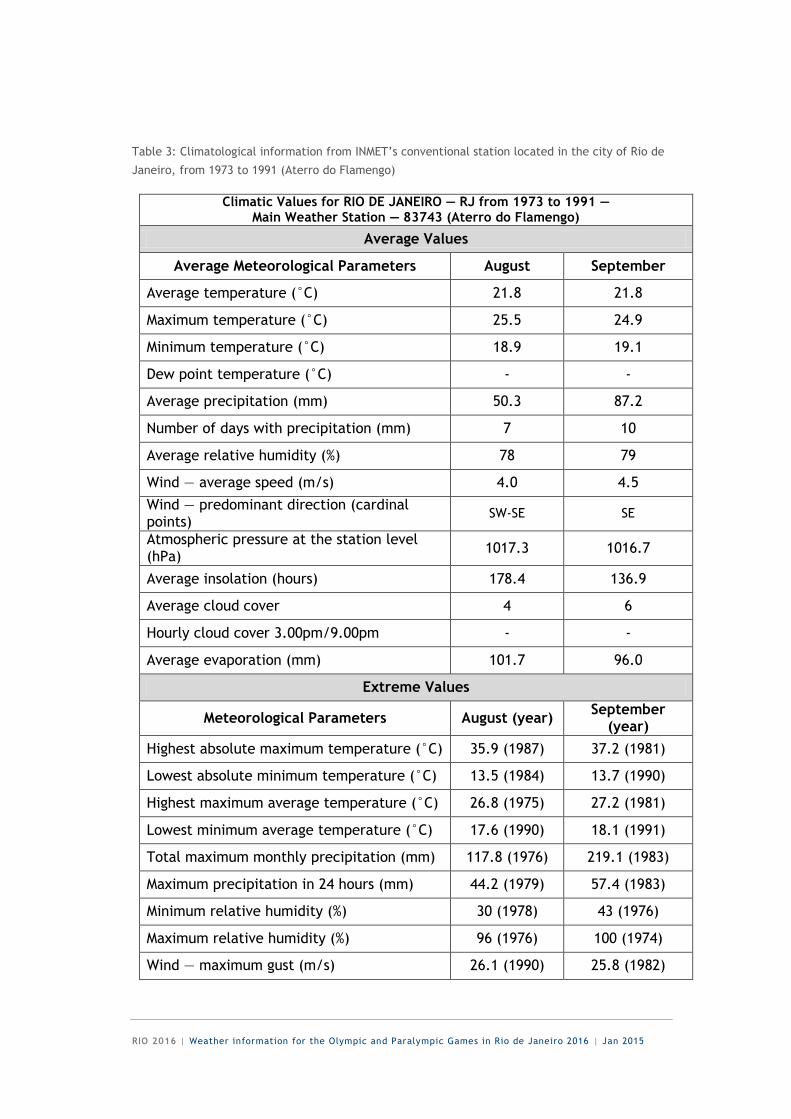
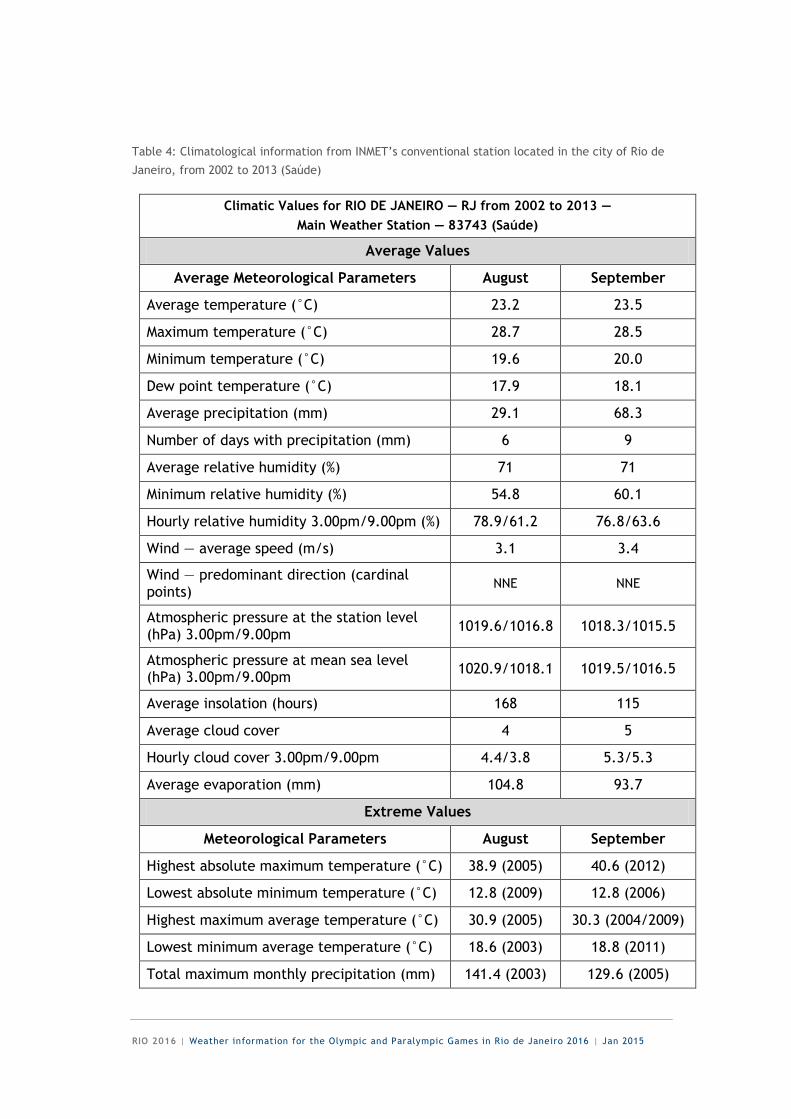
A summary of the main meteorological parameters of the conventional weather
stations is found in Tables 3 and 4, showing information from Aterro do Flamengo and
Saúde in August and September, from 1973 to 1991 and from 2002 to 2013,
characterising the climate in the municipality of Rio de Janeiro.
RIO 2016 | Weather information for the Olympic and Paralympic Games in Rio de Janeiro 2016 | Jan 2015
Table 3: Climatological information from INMET’s conventional station located in the city of Rio de
Janeiro, from 1973 to 1991 (Aterro do Flamengo)
Climatic Values for RIO DE JANEIRO — RJ from 1973 to 1991 — Main Weather Station — 83743 (Aterro do Flamengo)
Average Values
Average Meteorological Parameters August September
Average temperature (°C) 21.8 21.8
Maximum temperature (°C) 25.5 24.9
Minimum temperature (°C) 18.9 19.1
Dew point temperature (°C) - -
Average precipitation (mm) 50.3 87.2
Number of days with precipitation (mm) 7 10
Average relative humidity (%) 78 79
Wind — average speed (m/s) 4.0 4.5
Wind — predominant direction (cardinal points)
SW-SE SE
Atmospheric pressure at the station level (hPa)
1017.3 1016.7
Average insolation (hours) 178.4 136.9
Average cloud cover 4 6
Hourly cloud cover 3.00pm/9.00pm - -
Average evaporation (mm) 101.7 96.0
Extreme Values
Meteorological Parameters August (year) September
(year)
Highest absolute maximum temperature (°C) 35.9 (1987) 37.2 (1981)
Lowest absolute minimum temperature (°C) 13.5 (1984) 13.7 (1990)
Highest maximum average temperature (°C) 26.8 (1975) 27.2 (1981)
Lowest minimum average temperature (°C) 17.6 (1990) 18.1 (1991)
Total maximum monthly precipitation (mm) 117.8 (1976) 219.1 (1983)
Maximum precipitation in 24 hours (mm) 44.2 (1979) 57.4 (1983)
Minimum relative humidity (%) 30 (1978) 43 (1976)
Maximum relative humidity (%) 96 (1976) 100 (1974)
Wind — maximum gust (m/s) 26.1 (1990) 25.8 (1982)
RIO 2016 | Weather information for the Olympic and Paralympic Games in Rio de Janeiro 2016 | Jan 2015
Table 4: Climatological information from INMET’s conventional station located in the city of Rio de
Janeiro, from 2002 to 2013 (Saúde)
Climatic Values for RIO DE JANEIRO — RJ from 2002 to 2013 —
Main Weather Station — 83743 (Saúde)
Average Values
Average Meteorological Parameters August September
Average temperature (°C) 23.2 23.5
Maximum temperature (°C) 28.7 28.5
Minimum temperature (°C) 19.6 20.0
Dew point temperature (°C) 17.9 18.1
Average precipitation (mm) 29.1 68.3
Number of days with precipitation (mm) 6 9
Average relative humidity (%) 71 71
Minimum relative humidity (%) 54.8 60.1
Hourly relative humidity 3.00pm/9.00pm (%) 78.9/61.2 76.8/63.6
Wind — average speed (m/s) 3.1 3.4
Wind — predominant direction (cardinal points)
NNE NNE
Atmospheric pressure at the station level (hPa) 3.00pm/9.00pm
1019.6/1016.8 1018.3/1015.5
Atmospheric pressure at mean sea level (hPa) 3.00pm/9.00pm
1020.9/1018.1 1019.5/1016.5
Average insolation (hours) 168 115
Average cloud cover 4 5
Hourly cloud cover 3.00pm/9.00pm 4.4/3.8 5.3/5.3
Average evaporation (mm) 104.8 93.7
Extreme Values
Meteorological Parameters August September
Highest absolute maximum temperature (°C) 38.9 (2005) 40.6 (2012)
Lowest absolute minimum temperature (°C) 12.8 (2009) 12.8 (2006)
Highest maximum average temperature (°C) 30.9 (2005) 30.3 (2004/2009)
Lowest minimum average temperature (°C) 18.6 (2003) 18.8 (2011)
Total maximum monthly precipitation (mm) 141.4 (2003) 129.6 (2005)
RIO 2016 | Weather information for the Olympic and Paralympic Games in Rio de Janeiro 2016 | Jan 2015
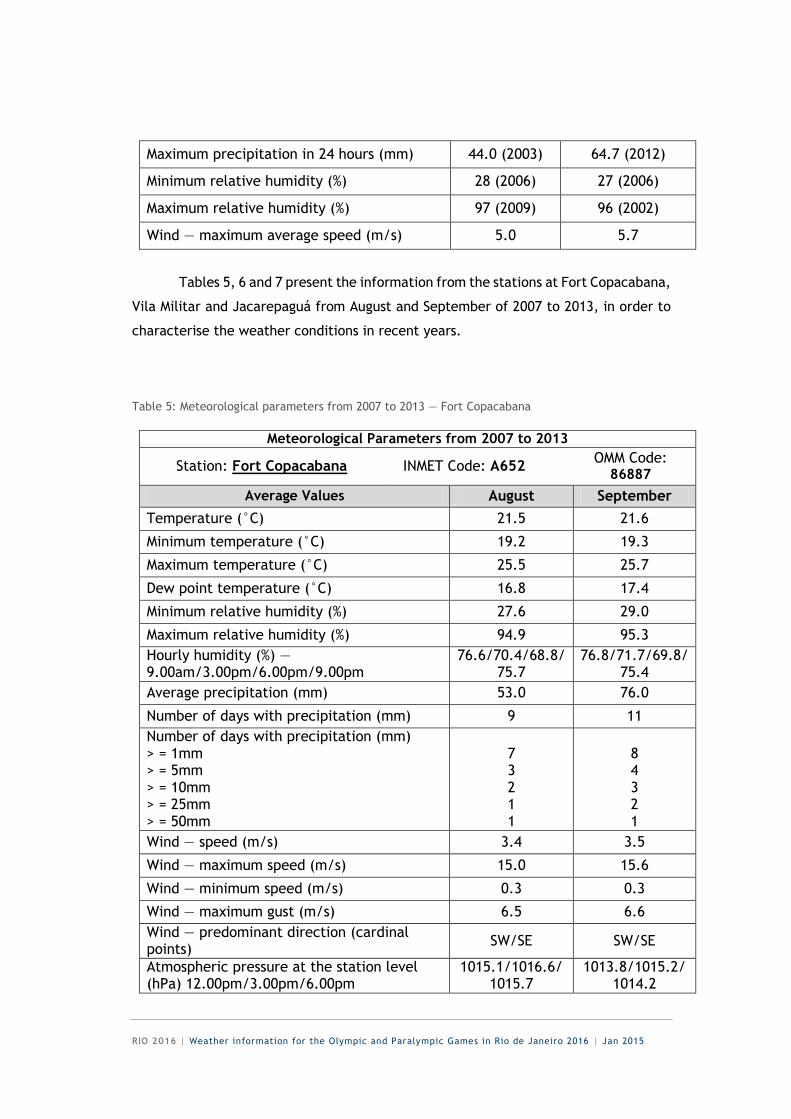
Maximum precipitation in 24 hours (mm) 44.0 (2003) 64.7 (2012)
Minimum relative humidity (%) 28 (2006) 27 (2006)
Maximum relative humidity (%) 97 (2009) 96 (2002)
Wind — maximum average speed (m/s) 5.0 5.7
Tables 5, 6 and 7 present the information from the stations at Fort Copacabana,
Vila Militar and Jacarepaguá from August and September of 2007 to 2013, in order to
characterise the weather conditions in recent years.
Table 5: Meteorological parameters from 2007 to 2013 — Fort Copacabana
Meteorological Parameters from 2007 to 2013
Station: Fort Copacabana INMET Code: A652 OMM Code:
86887
Average Values August September
Temperature (°C) 21.5 21.6
Minimum temperature (°C) 19.2 19.3
Maximum temperature (°C) 25.5 25.7
Dew point temperature (°C) 16.8 17.4
Minimum relative humidity (%) 27.6 29.0
Maximum relative humidity (%) 94.9 95.3
Hourly humidity (%) — 9.00am/3.00pm/6.00pm/9.00pm
76.6/70.4/68.8/75.7
76.8/71.7/69.8/75.4
Average precipitation (mm) 53.0 76.0
Number of days with precipitation (mm) 9 11
Number of days with precipitation (mm) > = 1mm > = 5mm > = 10mm > = 25mm > = 50mm
7 3 2 1 1
8 4 3 2 1
Wind — speed (m/s) 3.4 3.5
Wind — maximum speed (m/s) 15.0 15.6
Wind — minimum speed (m/s) 0.3 0.3
Wind — maximum gust (m/s) 6.5 6.6
Wind — predominant direction (cardinal points)
SW/SE SW/SE
Atmospheric pressure at the station level (hPa) 12.00pm/3.00pm/6.00pm
1015.1/1016.6/1015.7
1013.8/1015.2/1014.2
RIO 2016 | Weather information for the Olympic and Paralympic Games in Rio de Janeiro 2016 | Jan 2015
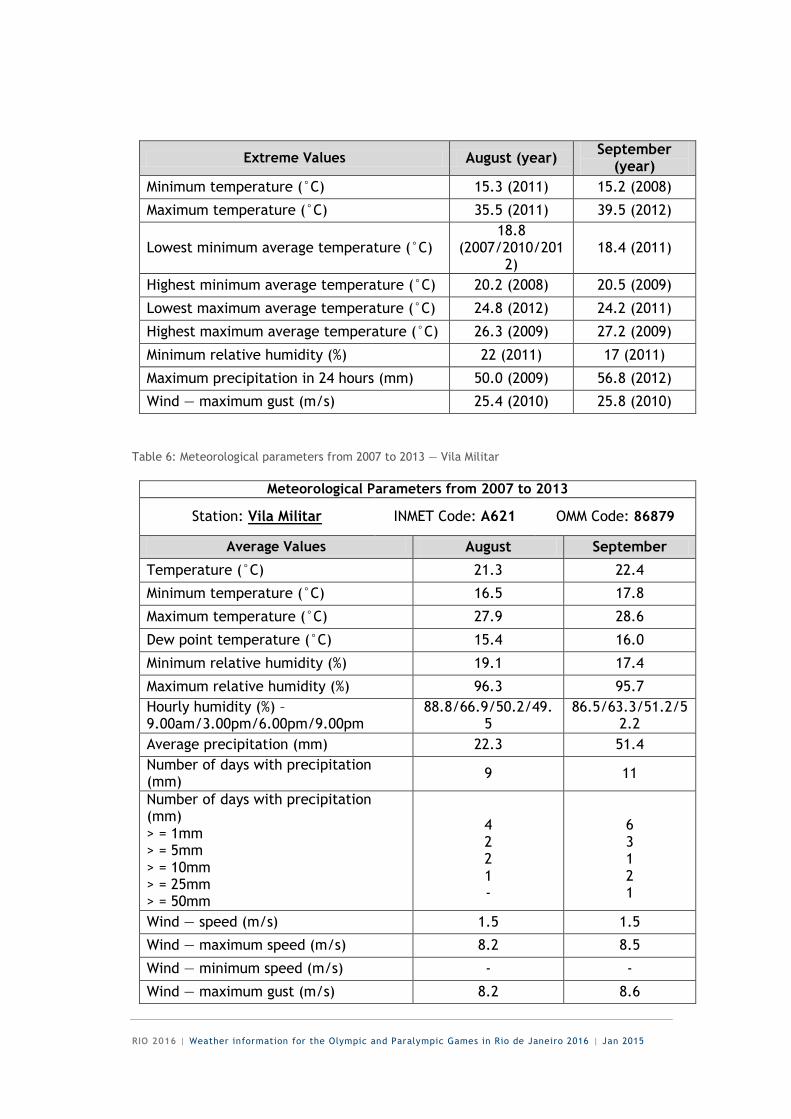
Extreme Values August (year) September
(year)
Minimum temperature (°C) 15.3 (2011) 15.2 (2008)
Maximum temperature (°C) 35.5 (2011) 39.5 (2012)
Lowest minimum average temperature (°C) 18.8
(2007/2010/2012)
18.4 (2011)
Highest minimum average temperature (°C) 20.2 (2008) 20.5 (2009)
Lowest maximum average temperature (°C) 24.8 (2012) 24.2 (2011)
Highest maximum average temperature (°C) 26.3 (2009) 27.2 (2009)
Minimum relative humidity (%) 22 (2011) 17 (2011)
Maximum precipitation in 24 hours (mm) 50.0 (2009) 56.8 (2012)
Wind — maximum gust (m/s) 25.4 (2010) 25.8 (2010)
Table 6: Meteorological parameters from 2007 to 2013 — Vila Militar
Meteorological Parameters from 2007 to 2013
Station: Vila Militar INMET Code: A621 OMM Code: 86879
Average Values August September
Temperature (°C) 21.3 22.4
Minimum temperature (°C) 16.5 17.8
Maximum temperature (°C) 27.9 28.6
Dew point temperature (°C) 15.4 16.0
Minimum relative humidity (%) 19.1 17.4
Maximum relative humidity (%) 96.3 95.7
Hourly humidity (%) – 9.00am/3.00pm/6.00pm/9.00pm
88.8/66.9/50.2/49.5
86.5/63.3/51.2/52.2
Average precipitation (mm) 22.3 51.4
Number of days with precipitation (mm)
9 11
Number of days with precipitation (mm) > = 1mm > = 5mm > = 10mm > = 25mm > = 50mm
4 2 2 1 -
6 3 1 2 1
Wind — speed (m/s) 1.5 1.5
Wind — maximum speed (m/s) 8.2 8.5
Wind — minimum speed (m/s) - -
Wind — maximum gust (m/s) 8.2 8.6
RIO 2016 | Weather information for the Olympic and Paralympic Games in Rio de Janeiro 2016 | Jan 2015
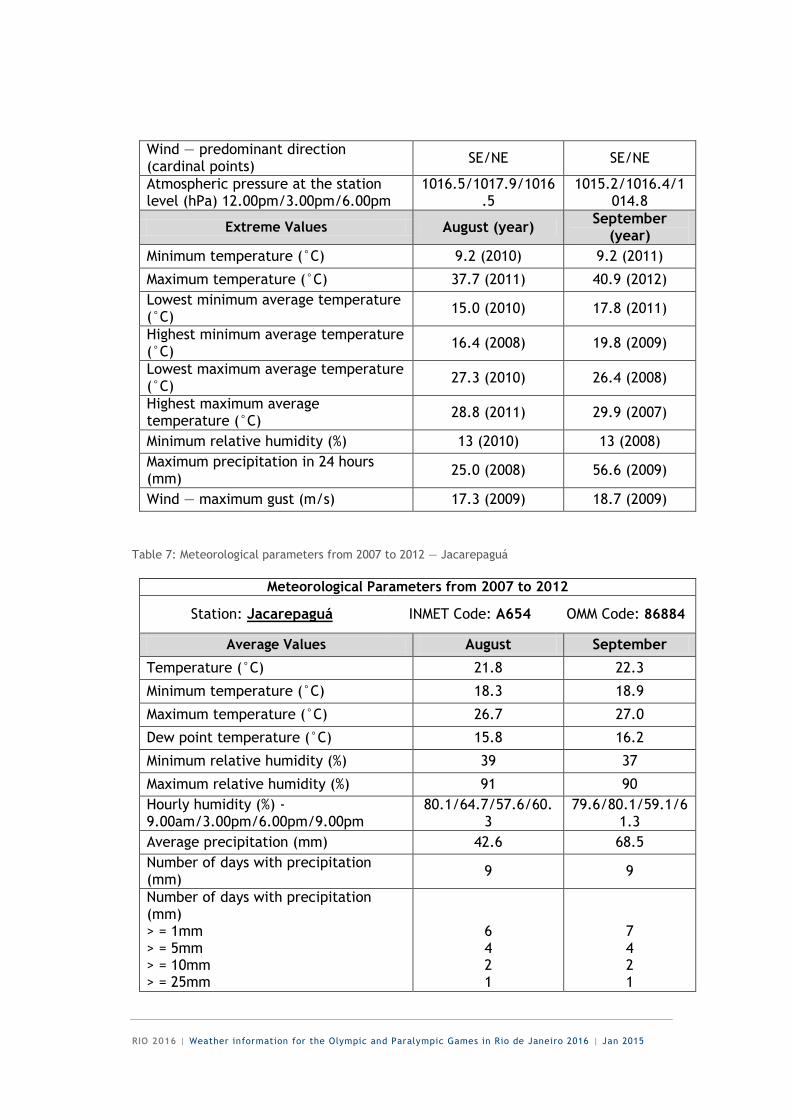
Wind — predominant direction (cardinal points)
SE/NE SE/NE
Atmospheric pressure at the station level (hPa) 12.00pm/3.00pm/6.00pm
1016.5/1017.9/1016.5
1015.2/1016.4/1014.8
Extreme Values August (year) September
(year)
Minimum temperature (°C) 9.2 (2010) 9.2 (2011)
Maximum temperature (°C) 37.7 (2011) 40.9 (2012)
Lowest minimum average temperature (°C)
15.0 (2010) 17.8 (2011)
Highest minimum average temperature (°C)
16.4 (2008) 19.8 (2009)
Lowest maximum average temperature (°C)
27.3 (2010) 26.4 (2008)
Highest maximum average temperature (°C)
28.8 (2011) 29.9 (2007)
Minimum relative humidity (%) 13 (2010) 13 (2008)
Maximum precipitation in 24 hours (mm)
25.0 (2008) 56.6 (2009)
Wind — maximum gust (m/s) 17.3 (2009) 18.7 (2009)
Table 7: Meteorological parameters from 2007 to 2012 — Jacarepaguá
Meteorological Parameters from 2007 to 2012
Station: Jacarepaguá INMET Code: A654 OMM Code: 86884
Average Values August September
Temperature (°C) 21.8 22.3
Minimum temperature (°C) 18.3 18.9
Maximum temperature (°C) 26.7 27.0
Dew point temperature (°C) 15.8 16.2
Minimum relative humidity (%) 39 37
Maximum relative humidity (%) 91 90
Hourly humidity (%) - 9.00am/3.00pm/6.00pm/9.00pm
80.1/64.7/57.6/60.3
79.6/80.1/59.1/61.3
Average precipitation (mm) 42.6 68.5
Number of days with precipitation (mm)
9 9
Number of days with precipitation (mm) > = 1mm > = 5mm > = 10mm > = 25mm
6 4 2 1
7 4 2 1
RIO 2016 | Weather information for the Olympic and Paralympic Games in Rio de Janeiro 2016 | Jan 2015
> = 50mm - -
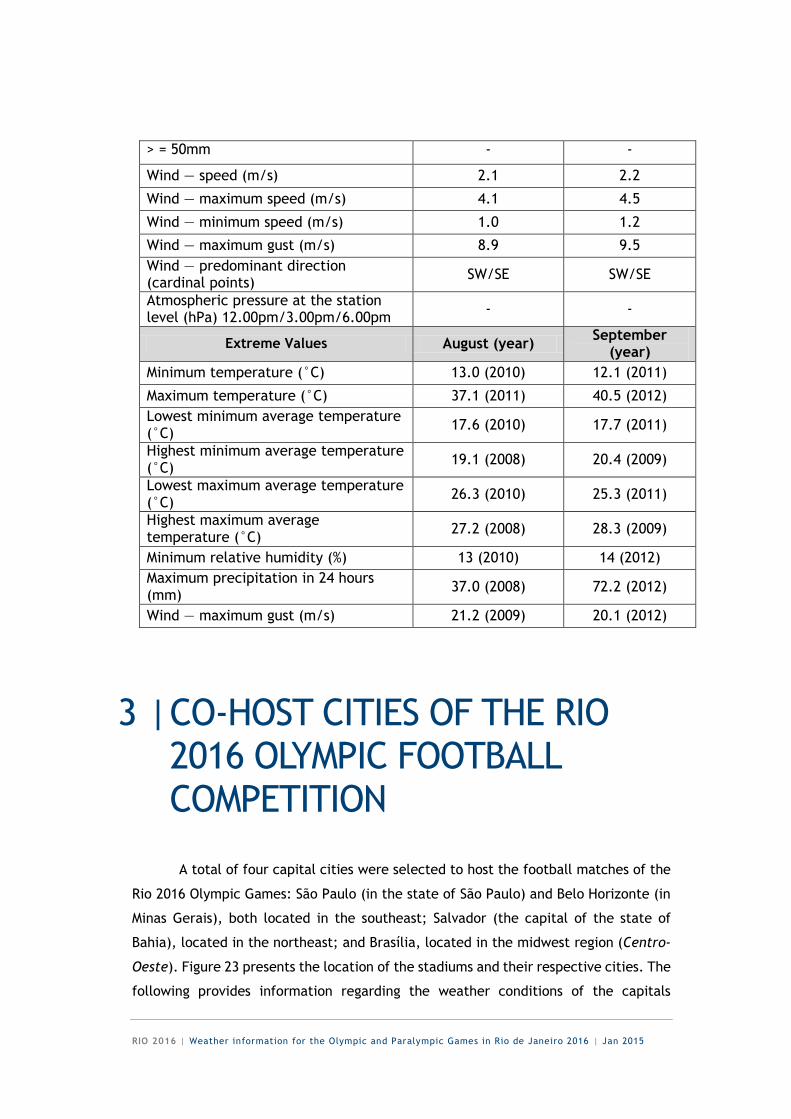
Wind — speed (m/s) 2.1 2.2
Wind — maximum speed (m/s) 4.1 4.5
Wind — minimum speed (m/s) 1.0 1.2
Wind — maximum gust (m/s) 8.9 9.5
Wind — predominant direction (cardinal points)
SW/SE SW/SE
Atmospheric pressure at the station level (hPa) 12.00pm/3.00pm/6.00pm
- -
Extreme Values August (year) September
(year)
Minimum temperature (°C) 13.0 (2010) 12.1 (2011)
Maximum temperature (°C) 37.1 (2011) 40.5 (2012)
Lowest minimum average temperature (°C)
17.6 (2010) 17.7 (2011)
Highest minimum average temperature (°C)
19.1 (2008) 20.4 (2009)
Lowest maximum average temperature (°C)
26.3 (2010) 25.3 (2011)
Highest maximum average temperature (°C)
27.2 (2008) 28.3 (2009)
Minimum relative humidity (%) 13 (2010) 14 (2012)
Maximum precipitation in 24 hours (mm)
37.0 (2008) 72.2 (2012)
Wind — maximum gust (m/s) 21.2 (2009) 20.1 (2012)
3 | CO-HOST CITIES OF THE RIO 2016 OLYMPIC FOOTBALL COMPETITION
A total of four capital cities were selected to host the football matches of the
Rio 2016 Olympic Games: São Paulo (in the state of São Paulo) and Belo Horizonte (in
Minas Gerais), both located in the southeast; Salvador (the capital of the state of
Bahia), located in the northeast; and Brasília, located in the midwest region (Centro-
Oeste). Figure 23 presents the location of the stadiums and their respective cities. The
following provides information regarding the weather conditions of the capitals
RIO 2016 | Weather information for the Olympic and Paralympic Games in Rio de Janeiro 2016 | Jan 2015
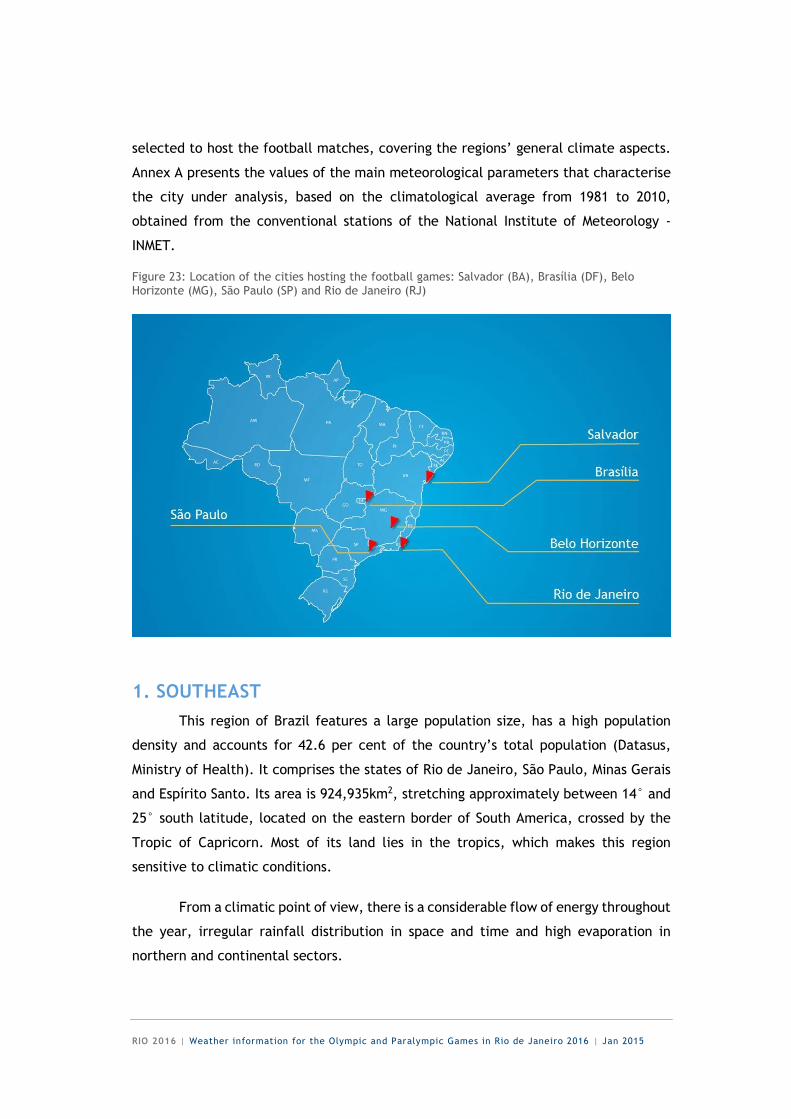
selected to host the football matches, covering the regions’ general climate aspects.
Annex A presents the values of the main meteorological parameters that characterise
the city under analysis, based on the climatological average from 1981 to 2010,
obtained from the conventional stations of the National Institute of Meteorology -
INMET.
Figure 23: Location of the cities hosting the football games: Salvador (BA), Brasília (DF), Belo Horizonte (MG), São Paulo (SP) and Rio de Janeiro (RJ)
1. SOUTHEAST
This region of Brazil features a large population size, has a high population
density and accounts for 42.6 per cent of the country’s total population (Datasus,
Ministry of Health). It comprises the states of Rio de Janeiro, São Paulo, Minas Gerais
and Espírito Santo. Its area is 924,935km2, stretching approximately between 14° and
25° south latitude, located on the eastern border of South America, crossed by the
Tropic of Capricorn. Most of its land lies in the tropics, which makes this region
sensitive to climatic conditions.
From a climatic point of view, there is a considerable flow of energy throughout
the year, irregular rainfall distribution in space and time and high evaporation in
northern and continental sectors.
RIO 2016 | Weather information for the Olympic and Paralympic Games in Rio de Janeiro 2016 | Jan 2015
Belo Horizonte
The capital of the state of Minas Gerais (MG) has a diverse geography of hills
and valleys, surrounded by the Serra do Curral mountain range. It is located near
coordinates 19°49'S and 43°57'W, at an altitude of about 850m in relation to the mean
sea level. The city occupies a strategic position in geopolitical maps in Brazil and Latin
America. It is located about 720km from Brasília, 586km from São Paulo and 444km
from Rio de Janeiro.
Belo Horizonte’s climate has two well-defined periods each year: the rainy
season from October to March, and the dry season from April to September. However,
extreme events are common during the transition phase in April and September,
especially the dry to the rainy season.
Due to the striking difference between the months of the rainy and dry seasons,
we can observe that the prolonged absence of constant rains that begin in mid-April
and extend until mid-October favors the occurrence of low levels of relative humidity
during the winter months. According to the climatological average for the city from
1981 to 2010, the annual average accumulated precipitation is 1,586.7mm, with
rainfall exceeding 100mm from October to March, maximum levels in December
(354.7mm), and a dry winter with minimum levels in July (7.94mm). The average
annual number of days with precipitation is 98, with the highest average in December
(20 days) and the lowest average during the winter (three days). Thus, the city’s
climate features a dry winter with mild temperatures and a hot and rainy summer
(February is the hottest month). September and May are transition months.
The annual average relative humidity is 67.3 per cent. Humidity is highest in
December (74.5 per cent) and lowest in August (58.4 per cent). However, humidity
may reach values lower than 20 per cent in some situations, remaining on average
between 20 per cent and 30 per cent during the hours of greatest heat in June, July,
August and early September.
Temperature inversion is common during the winter months, associated with
the presence of a cold air mass over the central region of Minas Gerais. This
phenomenon favors a greater concentration of pollutants, particularly during the
business days, i.e., Monday to Friday, due to the large number of vehicles transiting
and emitting particulate matter. The annual average temperature is 21.8°C, with the
RIO 2016 | Weather information for the Olympic and Paralympic Games in Rio de Janeiro 2016 | Jan 2015
highest average in February (23.8°C) and the lowest in July (19.1°C). The same
behaviour is observed regarding maximum temperature, where February reaches the
maximum (29°C) and July reaches the minimum (24.7°C), with an annual average of
27.2°C. As for the minimum temperature, the highest average is in the summer,
reaching 19.9°C in February. The lowest average is in July (14.7°C). The annual
average of total insolation is 2,424.9 hours, with the highest average found in August
(241.4 hours) and the lowest average found in December (153.3 hours). As for the
wind, the average annual prevailing wind direction (cardinal and collateral points) is
predominantly from the east.
According to the Köppen classification system, Belo Horizonte’s climate is
classified as tropical on high altitude (Cwa), due to its average elevation of
approximately 860m above sea level. The winter is predominantly mild and dry, and
summers are hot and rainy.
RIO 2016 | Weather information for the Olympic and Paralympic Games in Rio de Janeiro 2016 | Jan 2015
São Paulo
The capital of the state of São Paulo (SP) is located between 23°33'S and
46°38'W, at an average altitude of 760m in relation to the mean sea level. The state
of São Paulo borders the states of Minas Gerais, Mato Grosso do Sul, Paraná and Rio de
Janeiro. Sao Paulo has an area of 248,176.69km². Its terrain features a narrow coastal
plain bordered by the Serra do Mar mountain range, with plateaus and depressions
covering the remainder of the territory. São Paulo’s climate is relatively well-defined,
presenting a cold and dry period from May to September, and a warm and rainy period
from November to March.
In winter the climate is generally dry and cold, with frequent consecutive sunny
days without rain. However, it commonly presents cold fronts that can cause sudden
variation in temperature and brief rain showers, with the occurrence of the traditional
São Paulo drizzle, especially in neighborhoods located in the southern and eastern
regions of the city.
As for climatology from 1981 to 2010, the annual average temperature in São
Paulo is 20.1°C, with monthly averages ranging between 16.6°C in July and 23.2°C in
February. The highest average maximum temperature occurs in January and February
(28.2°C and 28.7°C), and the lowest occurs in July (22.3°C). The minimum
temperature reaches its highest average in February (19.5°C), and the lowest averages
occur in June and July (13°C and 12.3°C). In these two months, rainfall stays between
50.3mm and 47.8mm, with an average of six days of rain each month. The highest
average is in January, at 19 days, and the lowest average occurs between June, July
and August. As for total monthly precipitation, July is the second driest month of the
year, being surpassed only by August.
The average total annual precipitation is 1,579.1mm. There is a significant
contrast in rainfall distribution throughout the year, with a greater concentration in
the spring and summer months, and a lower concentration during the winter. The
highest monthly average occurs in January at 288.2mm, and the lowest in August at
36mm. The monthly average relative humidity is high throughout the year. The highest
average occurs in March at 77.1 per cent, and the lowest in August at 69.4 per cent.
Please note that in some years the relative humidity can be below 50 per cent during
a few days of the year, mainly in August and September.
RIO 2016 | Weather information for the Olympic and Paralympic Games in Rio de Janeiro 2016 | Jan 2015
According to the Köppen classification system, São Paulo’s climate is
subtropical, with mild temperatures during the winter and intense rainfall during the
spring and summer.
2. NORTHEAST
The northeast of Brazil (NEB) has a total area of 1,558,196km2 and is located
in the extreme northeastern region of South America, east of the great Amazon
rainforest. To the north and east lies the Atlantic Ocean, and the region borders
approximately meridian 47ºW to the west and parallel 18ºS to the south. Climatically,
this region is associated with high temperatures throughout the year and great spatial
and temporal rainfall variability. Annual precipitation on the coast exceeds 1,600mm,
while in the countryside it does not exceed 400mm in certain areas, being considered
an anomalous region with floods followed by droughts. The region has three main
climate types: coastal humid climate — from the coast of Bahia (BA) to Rio Grande do
Norte (RN) — with annual precipitation ranging from 300mm to 2,000mm; tropical
climate — in areas of the states of Bahia (BA), Ceará (CE), Maranhão (MA) and Piauí
(PI); and semi-arid tropical climate (throughout the arid northeast). This diversity of
climates in the NEB is due to the activity of various physical mechanisms that interact
with and are responsible for the distribution of rainfall in this region, such as: Hadley-
Walker circulations, the Intertropical Convergence Zone (ITCZ), high-surface albedo,
presence of frontal systems, temperature anomalies of the oceanic waters from the
Atlantic and the Pacific, mechanisms of sea and land breezes, waves from the east,
instability lines, etc. The region’s topography is key on a local scale, and windward
rains are notably more abundant than leeward rains; in some areas, circulation from
mountains and valleys seems to be significant.
Salvador
The capital of the state of Bahia (BA) was founded in 1549, and it was the
country’s first capital. Its area covers 709.5km², located in the northeastern coastal
region of Brazil between the Tropic of Capricorn and the Equator at latitude 13°01'S
and longitude 38°31'W, with an altitude of 51.41m.
RIO 2016 | Weather information for the Olympic and Paralympic Games in Rio de Janeiro 2016 | Jan 2015
Its climate is tropical, predominantly hot. The rainy season extends throughout
the year, where April and May present the highest accumulated volume and an average
of 20 days of rainfall per month. However, as a coastal city, it rains on average above
100mm per month throughout the year, as it is located under the domain of the
Tropical and Equatorial Atlantic Masses. Rainfall typically occurs at dawn, in the
morning and in the evening. The temperature in Salvador varies according to several
factors, including: season, cloud cover, relative humidity, pressure, wind and
proximity to the ocean. The average annual temperature is 25.7°C, and monthly
averages vary between 23.7°C in August and 27.1°C in February and March. The
highest monthly average maximum temperature is 31°C in February, while the lowest
average occurs in July, at 26.5°C. The annual average minimum temperature is
22.9°C, where the lowest average occurs in August (21.1°C) and the highest in March
(24.2°C). The annual average insolation is 2,437.5 hours, where the highest monthly
average occurs in January (246.9 hours), and the lowest monthly average occurs in
June (147.8 hours). Its average annual accumulated rainfall is the second highest of
the NEB (1871.1mm), and the months with the highest average rainfall are April
(295.7mm) and May (279.8mm). On average there are a total of 183 days of rainfall,
where May (21 days) and June (23 days) present the highest numbers, and December
(10 days) has the lowest. Relative humidity is high throughout the year, with an annual
average of about 80 per cent, where February is less humid (79.2 per cent) and May is
the most humid (83.9 per cent), reaching a maximum humidity of 94.6 per cent.
In Salvador, the Maritime Equatorial and Tropical Masses cause most
precipitation events, as do the cold fronts and easterly wave disturbances. These occur
in the form of showers associated with thunderstorms at the beginning of the rainy
season. The rainy season starts in the autumn; from April to July rainfall is
characterised by its continuity, with short drought intervals.
According to the Köppen climate classification system, Bahia’s coastline is
located within the tropical humid climate that constitutes the so-called “second Af
zone” in the general Brazilian classification, with occurrences of precipitation every
month of the year and the lack of a defined dry season.
RIO 2016 | Weather information for the Olympic and Paralympic Games in Rio de Janeiro 2016 | Jan 2015
3. MIDWEST
The midwest is Brazil’s second largest region, located in the central plateau
with an area of approximately 1,606,371.505km². It is the only region that does not
border the Atlantic Ocean and presents very contrasting conditions between the
summer and winter seasons. Summers are essentially warm and rainy (December to
March), while winters are dry and less warm (June to September). Its climatic
characteristics suffer influences from systems from the north and south of the
continent. In summer, the region is dominated by the Chaco Low on the surface and
the Bolivia High at higher levels. These dynamically coupled systems move to the north
during the winter. The winter season is characterised by a period of drought, with
warm days and mild temperatures at night.
Brasília
The federal capital of Brazil headquarters the Government of the Federal
District (DF). It is the fourth most populous city in the country, with coordinates
between 15°48'S and 47°51'W, and an altitude of approximately 1,100m in relation to
sea level. The annual average temperature is 21°C, with the highest average recorded
in October (22.4°C), and the lowest average recorded in June and July (19°C). The
average annual maximum temperature is 26.6°C, reaching a maximum temperature of
28.4°C in September and minimum temperature of 25°C in June. The average annual
minimum temperature is 16.8°C. October, January and March present the highest
average (18.1°C), and July presents the lowest average (13.7°C). July is the coldest
month and September is normally the hottest. The annual average of total insolation
is 2,370.7 hours, with values exceeding 200 hours from April to September, and the
highest average recorded in July (268.9 hours) and the lowest in December (126.8
hours).
The annual average accumulated precipitation is 1,448.9mm, and its rainy
season extends from September through May under the Continental Equatorial Mass,
supplying the city and region with generally cloudy weather conditions that progress
in the afternoon to overcast conditions with rain showers and thunderstorms. The
maximum value (236.6mm) was recorded in December. Another typically dry season is
in June, July and August (winter) and September. June is the driest month, with 4.9mm
of precipitation. The average annual number of days with precipitation greater or
RIO 2016 | Weather information for the Olympic and Paralympic Games in Rio de Janeiro 2016 | Jan 2015
equal to 1mm is 111 days, with the highest average in December (18 days) and the
lowest during the winter (one day). May and October are transition months for these
well-defined seasons.
The annual average relative humidity is 65.9 per cent. Humidity is highest in
December (78.2 per cent) and lowest in August (46.7 per cent). As for the wind, the
average prevailing wind direction (cardinal and collateral points) is predominantly
from the east-northeast.
According to the Köppen climate classification system, the region is described
as a tropical wet savanna with a dry winter that constitutes what is known as the
“second Aw zone – 2.” Temperatures rarely exceed 30°C during the summer, which is
humid and rainy. Winters are dry and relatively cold.
RIO 2016 | Weather information for the Olympic and Paralympic Games in Rio de Janeiro 2016 | Jan 2015
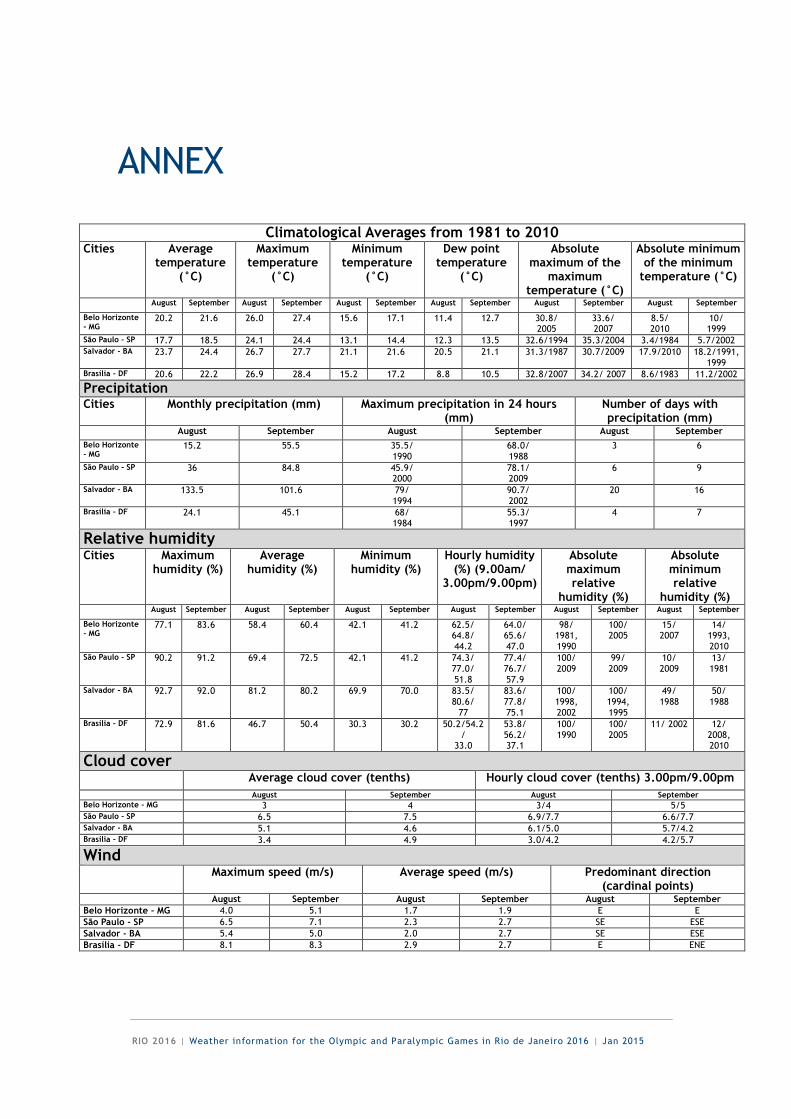
ANNEX
Climatological Averages from 1981 to 2010 Cities Average
temperature (°C)
Maximum temperature
(°C)
Minimum temperature
(°C)
Dew point temperature
(°C)
Absolute maximum of the
maximum temperature (°C)
Absolute minimum of the minimum
temperature (°C)
August September August September August September August September August September August September
Belo Horizonte - MG
20.2 21.6 26.0 27.4 15.6 17.1 11.4 12.7 30.8/ 2005
33.6/ 2007
8.5/ 2010
10/ 1999
São Paulo - SP 17.7 18.5 24.1 24.4 13.1 14.4 12.3 13.5 32.6/1994 35.3/2004 3.4/1984 5.7/2002 Salvador - BA 23.7 24.4 26.7 27.7 21.1 21.6 20.5 21.1 31.3/1987 30.7/2009 17.9/2010 18.2/1991,
1999 Brasília - DF 20.6 22.2 26.9 28.4 15.2 17.2 8.8 10.5 32.8/2007 34.2/ 2007 8.6/1983 11.2/2002
Precipitation Cities Monthly precipitation (mm) Maximum precipitation in 24 hours
(mm) Number of days with precipitation (mm)
August September August September August September
Belo Horizonte - MG
15.2 55.5 35.5/ 1990
68.0/ 1988
3 6
São Paulo - SP 36 84.8 45.9/ 2000
78.1/ 2009
6 9
Salvador - BA 133.5 101.6 79/ 1994
90.7/ 2002
20 16
Brasília - DF 24.1 45.1 68/ 1984
55.3/ 1997
4 7
Relative humidity Cities Maximum
humidity (%) Average
humidity (%) Minimum
humidity (%) Hourly humidity
(%) (9.00am/ 3.00pm/9.00pm)
Absolute maximum relative
humidity (%)
Absolute minimum relative
humidity (%)
August September August September August September August September August September August September
Belo Horizonte - MG
77.1 83.6 58.4 60.4 42.1 41.2 62.5/ 64.8/ 44.2
64.0/ 65.6/ 47.0
98/ 1981, 1990
100/ 2005
15/ 2007
14/ 1993, 2010
São Paulo - SP 90.2 91.2 69.4 72.5 42.1 41.2 74.3/ 77.0/ 51.8
77.4/ 76.7/ 57.9
100/ 2009
99/ 2009
10/ 2009
13/ 1981
Salvador - BA 92.7 92.0 81.2 80.2 69.9 70.0 83.5/ 80.6/
77
83.6/ 77.8/ 75.1
100/ 1998, 2002
100/ 1994, 1995
49/ 1988
50/ 1988
Brasília - DF 72.9 81.6 46.7 50.4 30.3 30.2 50.2/54.2/
33.0
53.8/ 56.2/ 37.1
100/ 1990
100/ 2005
11/ 2002 12/ 2008, 2010
Cloud cover
Average cloud cover (tenths) Hourly cloud cover (tenths) 3.00pm/9.00pm
August September August September
Belo Horizonte - MG 3 4 3/4 5/5 São Paulo - SP 6.5 7.5 6.9/7.7 6.6/7.7 Salvador - BA 5.1 4.6 6.1/5.0 5.7/4.2 Brasília - DF 3.4 4.9 3.0/4.2 4.2/5.7
Wind
Maximum speed (m/s) Average speed (m/s) Predominant direction (cardinal points)
August September August September August September
Belo Horizonte - MG 4.0 5.1 1.7 1.9 E E
São Paulo - SP 6.5 7.1 2.3 2.7 SE ESE
Salvador - BA 5.4 5.0 2.0 2.7 SE ESE
Brasília - DF 8.1 8.3 2.9 2.7 E ENE
RIO 2016 | Weather information for the Olympic and Paralympic Games in Rio de Janeiro 2016 | Jan 2015
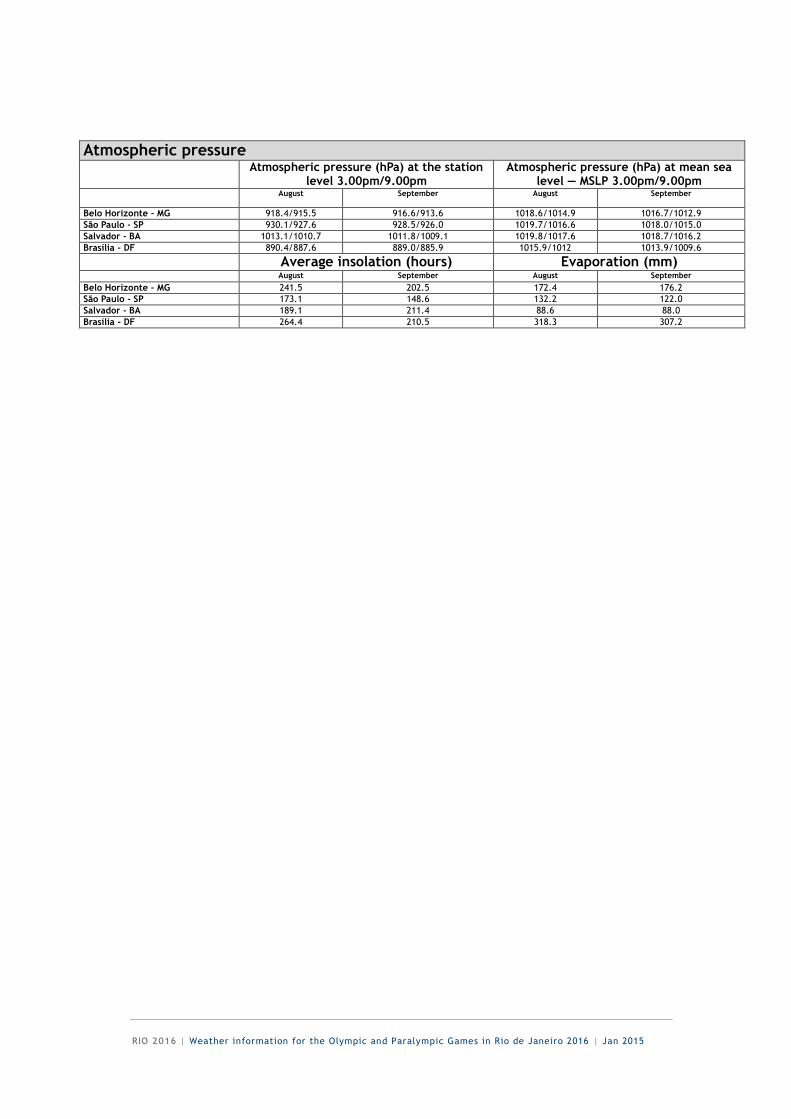
Atmospheric pressure Atmospheric pressure (hPa) at the station
level 3.00pm/9.00pm Atmospheric pressure (hPa) at mean sea
level — MSLP 3.00pm/9.00pm
August September August September
Belo Horizonte - MG 918.4/915.5 916.6/913.6 1018.6/1014.9 1016.7/1012.9
São Paulo - SP 930.1/927.6 928.5/926.0 1019.7/1016.6 1018.0/1015.0
Salvador - BA 1013.1/1010.7 1011.8/1009.1 1019.8/1017.6 1018.7/1016.2
Brasília - DF 890.4/887.6 889.0/885.9 1015.9/1012 1013.9/1009.6
Average insolation (hours) Evaporation (mm) August September August September
Belo Horizonte - MG 241.5 202.5 172.4 176.2
São Paulo - SP 173.1 148.6 132.2 122.0
Salvador - BA 189.1 211.4 88.6 88.0
Brasília - DF 264.4 210.5 318.3 307.2
RIO 2016 | Weather information for the Olympic and Paralympic Games in Rio de Janeiro 2016 | Jan 2015
This publication was made possible thanks to the efforts and dedication of the following people:
APO — Cleusa Yoshida, Superintendente
APO — Luiz Pedro de Melo Cesar, Superintendente
APO — Luiz Zanetti, Supervisor
APO — Myrthes Martins Ferreira, Assessora
APO — Fernando Alberto G da Costa, Supervisor
Alerta Rio — Pedro Jourdan, Meteorologista
CHM-MB — Angela Maria V. Fernandes, Eng. Prev. Ambient.
CHM-MB — Flávia Rodrigues Pinheiro, Meteorologista
CHM-MB — Nilza Barros da Silva, Estatística
CML-EB — José Roberto R de Alencar, Adjunto
DECEA — Cláudio Alves Vieira, Auxiliar DPLN3
DECEA — José Eduardo Platenik, Previsor Met
EGP-Rio — Alane Ribeiro, Analista
INEA — Alzira S. A. Gomes, Chefe de Serviço
INEA — Cinthia Avellar Martins, Meteorologista
INEA — Mariana Palagano Ramalho Silva, Gerente de Qualidade do Ar
INEA — Ricardo Marcelo, Coordenador
INMET — Alaor Dall’Antonia, Coordenador Geral
INMET — Anderson B. S. Cunha, Meteorologista
INMET — Márcia dos Santos Seabra, Meteorologista
INMET — Marilene Carvalho, Meteorologista
INMET — Maria Helena R. Rocha, Secretária CGA-INMET
INMET — Andrea Malheiros Ramos, Meteorologista
ME – RJ — Marcos Ebenezer Costa, Assessor Técnico
Rio 2016 Organising Committee for the Olympic and Paralympic Games

RIO 2016 | Weather information for the Olympic and Paralympic Games in Rio de Janeiro 2016 | Jan 2015

RIO 2016 | Weather information for the Olympic and Paralympic Games in Rio de Janeiro 2016 | Jan 2015
1.2015