Embed Size (px)
Citation preview

Weather Observation & Analysis Project
Report Requirements & Writing Tips
See Course Manual Part III, pages 10+
2
What Makes a Bad Report?Unclear thoughts & expression
Doesn’t meet objectives
Findings are not supported
Irrelevant /off-topic material
Badly organized3
Weather Observation & Analysis Project
What Makes a Bad Report? (continued)
Too long / too short
Unprofessional writing, too much jargon
Poor grammar & spelling
Figures & captions are unclear
Incorrect / inadequate referencing4
Weather Observation & Analysis Project
What Makes a Good Report?► Message is clear & concise
► Meets report objectives & information is relevant
► Findings are well supported by data & explanations
► Report logically leads the reader though content 5
Weather Observation & Analysis Project

What Makes a Good Report? (continued)
► Length is appropriate
► Writing is professional, precise, organized & easily understood
► Figures, graphs & Tables enhance & explain points
► Referencing is sufficient & correct6
Weather Observation & Analysis Project
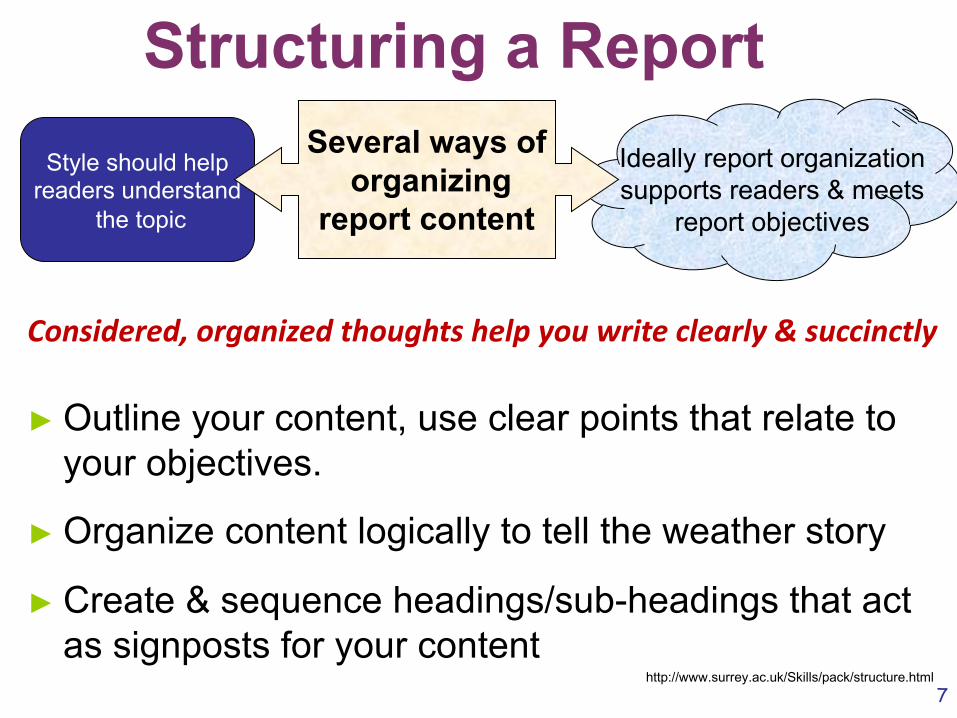
Structuring a Report
► Outline your content, use clear points that relate to your objectives.
► Organize content logically to tell the weather story
► Create & sequence headings/sub-headings that act as signposts for your content
http://www.surrey.ac.uk/Skills/pack/structure.html7
Ideally report organization supports readers & meets
report objectives
Style should helpreaders understand
the topic
Several ways oforganizing
report content
Considered, organized thoughts help you write clearly & succinctly

Consider report elements: See Appendix A pp. 10+•Materials & Methods – discuss briefly as these are well documented in Appendix A. Reference.
Especially: Your Report Body integrates Results & Discussion information
Choose an organization, headings /subheadings that aids your telling of this case (i.e. weather story)
• Best done as an event based account (usually storm by storm, or day by day)
Decide based on:
• our week’s weather &
• how you tell the story
8
Weather Observation & Analysis Project Our Report: A Case Study -- No hypothesis to test!
But these heading don’t work for case studies

WxPrj report: Case study of weather & its cause(s) during our 4-day period
WHAT happened? [when?] Why?
Organize by: weather event(s)? day by day? day verses night? specific similar time periods?…
What makes the most sense? What are the major sections?
• use working headings /subheadings…….
• list key points…..with evidence from …source(s)
• then write from your points…..9
Weather Observation & Analysis Project

Make a realistic time-plan Writing always takes longer than expected…
Allow time for analysisKnow what to write before you start! Determine your case (weather story + evidence).• understand the local weather from local data (two graphs & diary)
• understand the synoptic controls on our 4-days of weather; identify & follow storm(s) patterns on synoptic images.
– organize the synoptic data (satellite images & surface maps) by time.
– view them in time sequence (view all satellite images in order by time; view all surface maps by time);
– pair a satellite image & a surface map for the same time, then view the paired images in order by time 10
Weather Observation & Analysis Project
• consider patterns – look for weather data linkages & relationships. Visually integrate specific local & synoptic information by time; your interpretation(s) tell your weather story.
• identify and use specific supporting evidence for your interpretations. Support your analysis with evidence from your local &/or synoptic data; use multiple evidence sources when possible.
• state how the evidence you identify supports your ideas. For our observation period support what weather happened & why. Make your best case!
11
Weather Observation & Analysis Project

Write & make time for Editing! Get your thoughts on paper, but then revise & edit Plan multiple edits, each with a specific /different purpose!
Key edit types & stages. 1) Revise for content, meaning & structure; Get
your information right. Put it in a logical order. Communicate it well. Check for clarity of thought & expression. Needs multiple edits.
2) Edit for grammar, punctuation, word choice, proper citations /referencing & other stylistic aspects of the report at the very end.
Weather Observation & Analysis Project
12
Table of ContentsLists report sections & page numbers (Don’t forget to number your pages)
Use report headings & subheadings
Outline when you start
Finalize last13
Weather Observation & Analysis Project
Wx Proj Report Contents:

IntroductionStates report objectivesGives a context for your report
What should be included?
Often best to write it last14
Weather Observation & Analysis Project
Report Contents continued:

Methods - How the project was done• section is minimal BUT has enough to show the
reader what was done.
• overview methods; always refer to original /published sources for method details whenever possible (only detail methods when they are not available elsewhere)
Course Manual Part III is our method. Consider it a published document. Provide an overview of the project then cite and reference Part III so readers can find the details. Indicate specific page numbers in your citations when sources are longer than 30 pages.
15
Weather Observation & Analysis Project Report Contents continued:
Report Body ß Not an experiment •,No Results /Discussion sections!• create your own descriptive headings &
subheadings to guide the reader• case studies are an analysis & explanation of
events & their cause(s) based on evidence► start with main events & their explanation► look for patterns, look at larger then finer time & spatial
scales ► support your statements with evidence; use multiple
sources of evidence whenever possible
16
Weather Observation & Analysis Project
How much detail? What evidence? How to decide?
Report Contents continued:
Figures (graphs, maps, images, tables, etc.)
Summarize & efficiently communicate
• 1 good figure = 1 kiloword!
• provides evidence
• must be mentioned in the report body
• located close to where they are first discussed; ideally, readers should view a figure when reading about it
• are numbered in order of their appearance in the report (Figure 1 is the first figure discussed in the text...)
• have captions17
Weather Observation & Analysis Project Report Contents continued:
Figures (continued)
• should have a purpose & impact - modify /annotate /create: – use colours to indicate points or features of
interest to your “story”. (Hand drawn is fine for this report –we are not evaluating your use of graphics packages / artistic skills. Ensure each image clearly provides your message.
– crop /pair /overlay / highlight weather maps, satellite images, graphs. Locate points of interest, PG, province of BC, fronts, etc.
– create original images when helpful
• compared figures are on the same page18
Weather Observation & Analysis Project Report Contents continued:
Figures (continued)….
Embedded in the text versus in an Appendix
A report style issue - we require embedded figures! All figures (graphs, maps, tables, etc.) are located where they are first discussed in the report body.
Only use appendices for required, but less applicable information /data that would detract from the case study if it were inserted in the report body (e.g. the required Appendix I and II: weather diary, data rationalization)
Other than the required two appendices, we generally recommend not using additional appendices
19
Weather Observation & Analysis Project Report Contents continued:
Figure Captions• introduce the figure
• make a figure’s content & purpose clear BUTdoesn’t discuss or interpret the figure
• often refers to figure elements or annotations to aid understanding /discussion /interpretation in the report body
• includes a citation where needed
• are placed consistently with respect to the figure (usually on the bottom) 20
Weather Observation & Analysis Project Report Contents continued:
21
Conclusion(s)A brief report synopsis
• based on information already presented in the report body
• briefly restates your key findings & evidence
• your report’s “take-home message”
References
Weather Observation & Analysis Project Report Contents continued:
Why Cite & Reference?• Identifies where to find more information on a topic
• Provides credibility for an argument or statement
• Properly credits the work / ideas of others
• Shows you know related literature
• Streamlines. By summarizing & referring to other material you avoid plagiarism /redundant information
• Don’t cite your own work unless it’s published elsewhere
• Others? Boosts your writing marks
Weather Observation & Analysis Project
22
Referencing:
All sources must be cited in the report body (where you discuss the source’s information in your report)
Each citation has a complete reference (and is listed in your References section)
Complete citations & references allow readers to find your sources and know what information to expect from them
Citation & reference requirements /details are defined by the referencing style
Weather Observation & Analysis Project
23
Referencing: (continued)
Use American Psychological Association (APA) 6th Edition style: References & in-text citations are (author year) format; longer references require specific page number(s)
What information needs to be included?
• Find APA-6 information (good short synopsis) on the UNBC Academic Success Centre, Handouts webpage: https://www2.unbc.ca/sites/default/files/sections/academic-success-centre/apa-6th-02-2013.pdf
• What about website references?
Weather Observation & Analysis Project
24
Referencing: (continued)

APA-6 reference for a website that hosts a pdf of a document written by an organization:
Food and Agricultural Organization of the United States. (2015). Agriculture under a climate change regime. Washington (DC): FAO Press. Retrieved from http://www.fao.org/agri-clim-change/en/pdf-booklet [online report]
[Note: Include the date of retrieval only if the content of the page is likely to change over time.]
Example text & accompanying APA-6 citation for the above source, assuming that “FAO” had been defined previously in the text:
This report analyses Prince George weather over a four-day period. Though climate doesn't determine the weather experienced in any time period, generally Prince George can have both cold wet years and warm drier ones (FAO, 2015, pp.78-85).
Weather Observation & Analysis Project
25
APA-6 Referencing Examples:
Primary vs Secondary Sources• Primary: information from the original source
• Secondary: information from a source that relays information from the original source
Primary referencing is correct.
Important for our weather maps & images if you used the wxviewer (cirrus) website. The cirrus server is a secondary source as it relays materials from their original sources.
Correct references include the URL of a material’s original source
Weather Observation & Analysis Project
26
Referencing: (continued)
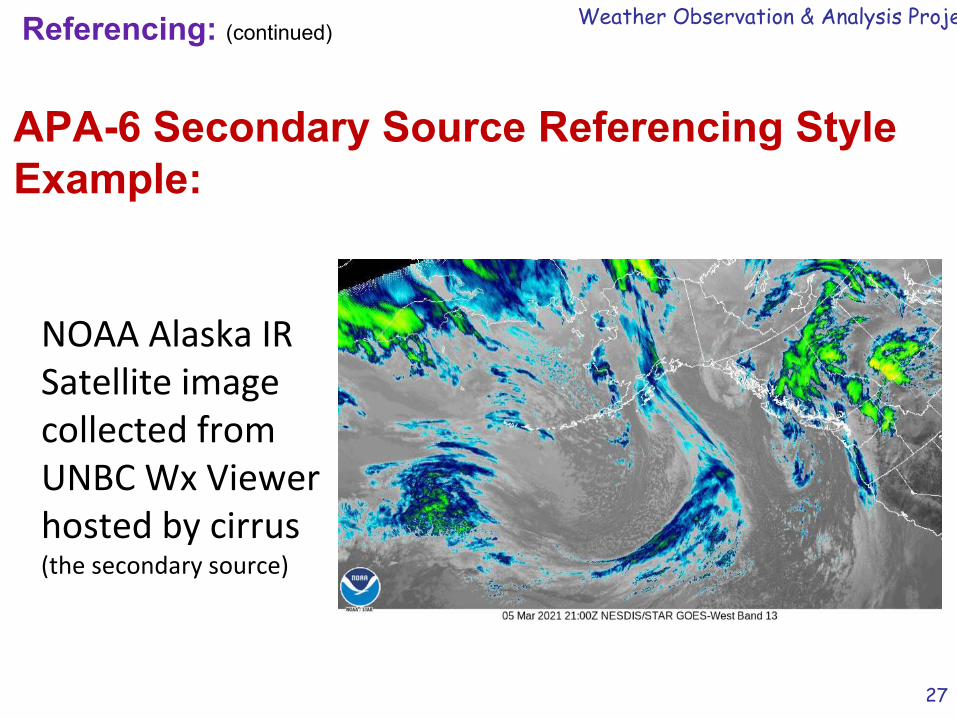
NOAA Alaska IR Satellite image collected from UNBC Wx Viewer hosted by cirrus (the secondary source)
27
APA-6 Secondary Source Referencing Style Example:
Weather Observation & Analysis Project Referencing: (continued)

Collected from (the secondary website): http://cirrus.unbc.ca/cgi-bin/cgi-bin2/fetch_loops_simple.pl?SUBHEADING=SATELLITE_IR_Goes-W_Alaska
Primary source (image provider – this is the one you must cite): https://www.star.nesdis.noaa.gov/GOES/sector.php?sat=G17§or=np
APA-6 reference:National Oceanic and Atmospheric Administration of the United States. (2021). GOES-
West – Sector view: Northern Pacific, Band 13. [satellite image] Retrieved March 9, 2021 from https://www.star.nesdis.noaa.gov/GOES/sector.php?sat=G17§or=np
[Note, because the image is changing, the access date is needed. If you use multiple images from the same general site, then you might instead list a range of dates… “Retrieved March 4-9, 2021 from…” to avoid having to enter a separate reference list item for each image.]
APA-6 in-text citation, needs the day & time as there are multiple images per day, assumes
NOAA has been previously defined in the text: (NOAA, 2021, March 9, 06Z).
28
APA-6 Secondary Source Referencing Example:Weather Observation & Analysis Project

Avoid Academic Misconduct
cheating....copying…plagiarismOnly work with others to brainstorm ideas, discuss what happened, etc.. The report must be independently written
This means DO NOT SHARE your:• writing • annotated graphs, maps, or figures you created
Properly cite & reference anything that you did not create, including figures, maps, graphs, and images
29
D O N ’ T

• See your instructors if you’re not sure about something
• The Academic Success Centre (ASC) offers support for writing…but get involved with them early
Be clear, readers can’t read between the lines.Well written reports are usually impressive.
We give bonus marks!
Weather Observation & Analysis Project
30
Last Words
• During the week of March 22 you will have a 15 minute face-to-face interview with an instructor on your Wx Proj Report during your lab time.
• This is a marked activity – come prepared with a well-planned outline for your report, notes on what your “weather story” is, and the evidence you plan to use to support it.
• Come with questions!
Weather Observation & Analysis Project
31
Last Words…. continued