Embed Size (px)
Citation preview
Michael E. Moore Executive Director
NACCSA
VP Energy Commodities and Advisory Services FearnOil, Inc. a division of Astrup-Fearnleys
September 30, 2014 SSEB Annual Meeting-Mobile, AL.
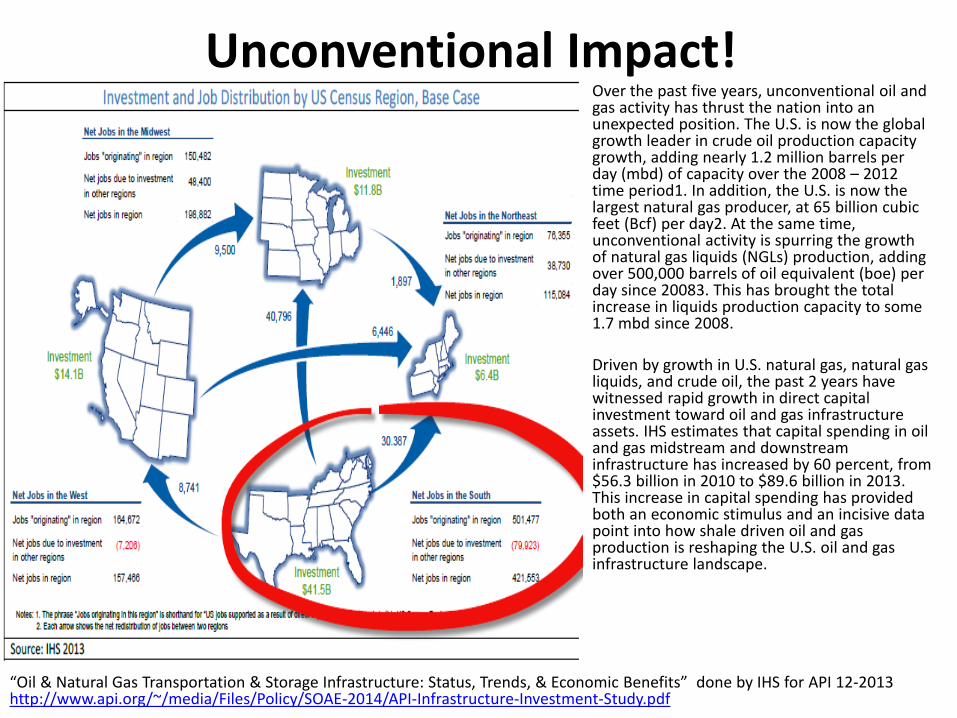
Unconventional Impact!
“Oil & Natural Gas Transportation & Storage Infrastructure: Status, Trends, & Economic Benefits” done by IHS for API 12-2013 http://www.api.org/~/media/Files/Policy/SOAE-2014/API-Infrastructure-Investment-Study.pdf
Over the past five years, unconventional oil and gas activity has thrust the nation into an unexpected position. The U.S. is now the global growth leader in crude oil production capacity growth, adding nearly 1.2 million barrels per day (mbd) of capacity over the 2008 – 2012 time period1. In addition, the U.S. is now the largest natural gas producer, at 65 billion cubic feet (Bcf) per day2. At the same time, unconventional activity is spurring the growth of natural gas liquids (NGLs) production, adding over 500,000 barrels of oil equivalent (boe) per day since 20083. This has brought the total increase in liquids production capacity to some 1.7 mbd since 2008. Driven by growth in U.S. natural gas, natural gas liquids, and crude oil, the past 2 years have witnessed rapid growth in direct capital investment toward oil and gas infrastructure assets. IHS estimates that capital spending in oil and gas midstream and downstream infrastructure has increased by 60 percent, from $56.3 billion in 2010 to $89.6 billion in 2013. This increase in capital spending has provided both an economic stimulus and an incisive data point into how shale driven oil and gas production is reshaping the U.S. oil and gas infrastructure landscape.
Areas to be Covered
• Coal-CCUS-CO2 EOR
• Unconventional Oil/Gas
• Changing US Power Generation
• Petchem and Refining
• Infrastructure
• Some Things to Think About
Coal-CCUS-CO2 EOR
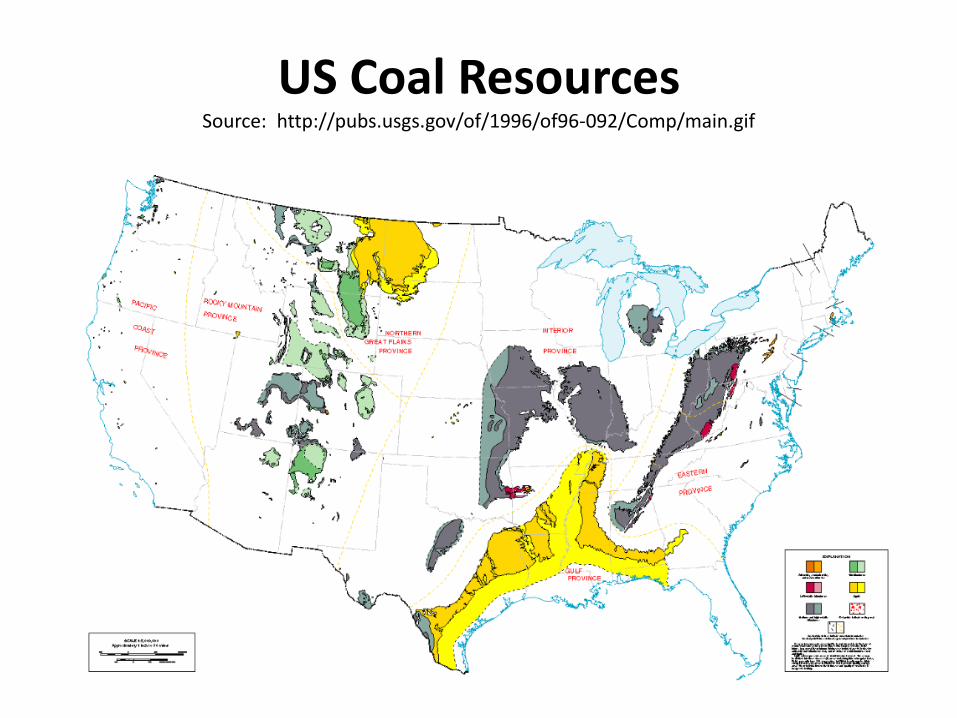
US Coal Resources Source: http://pubs.usgs.gov/of/1996/of96-092/Comp/main.gif
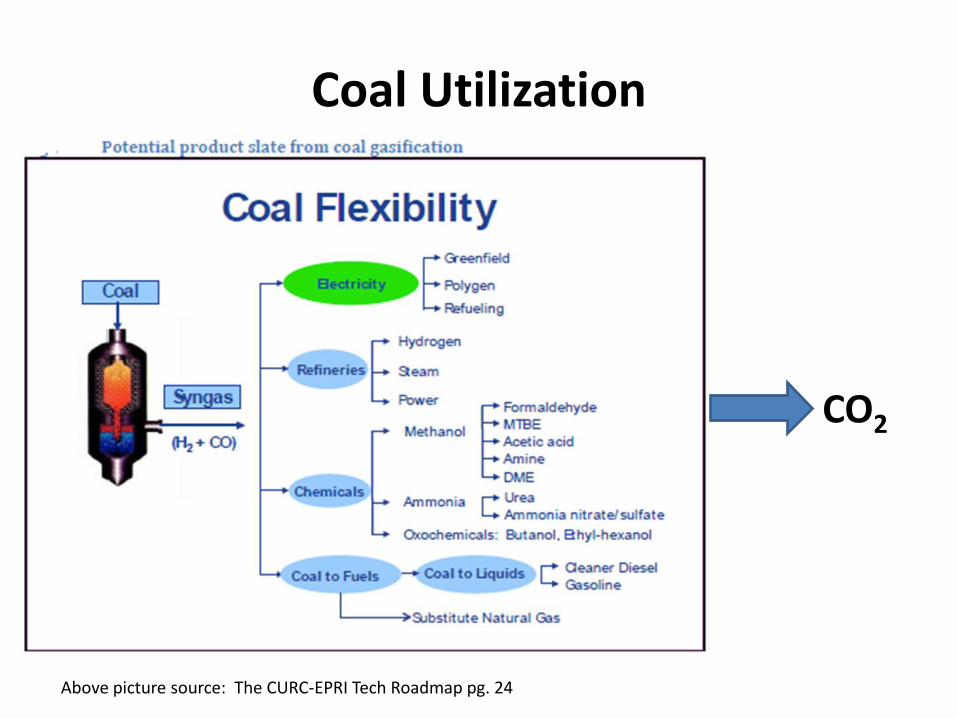
Coal Utilization
CO2
Above picture source: The CURC-EPRI Tech Roadmap pg. 24
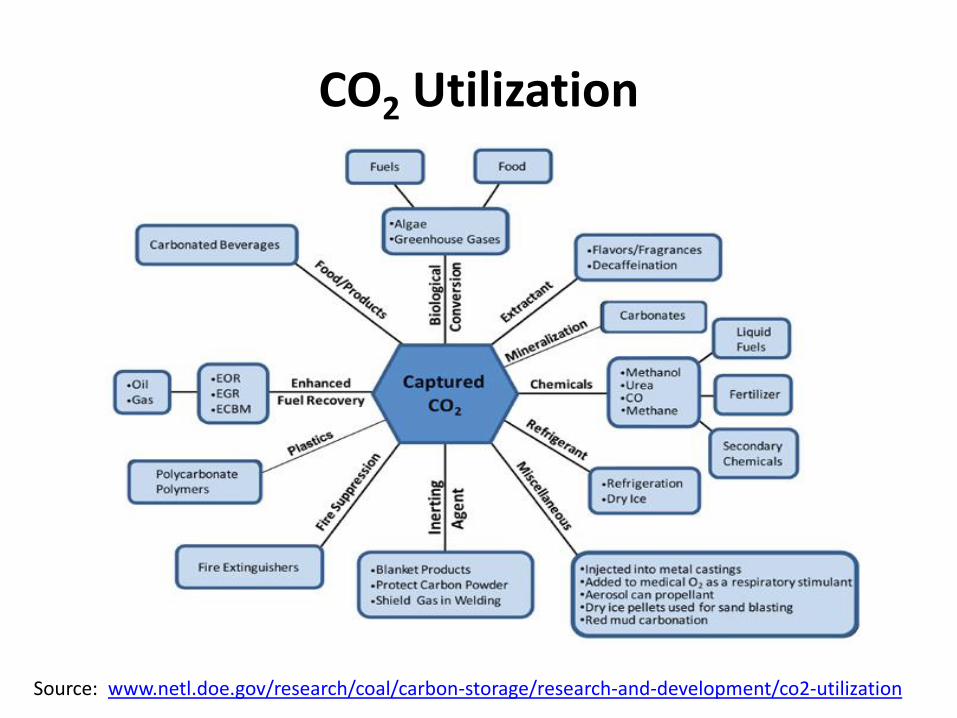
CO2 Utilization
Source: www.netl.doe.gov/research/coal/carbon-storage/research-and-development/co2-utilization
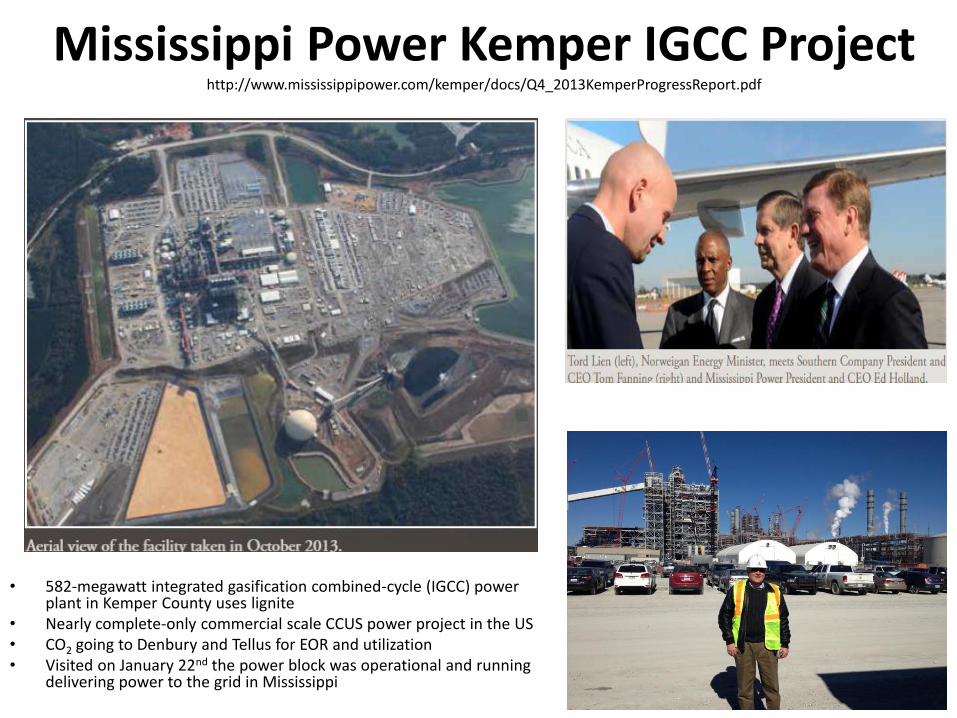
Mississippi Power Kemper IGCC Project http://www.mississippipower.com/kemper/docs/Q4_2013KemperProgressReport.pdf
• 582-megawatt integrated gasification combined-cycle (IGCC) power plant in Kemper County uses lignite
• Nearly complete-only commercial scale CCUS power project in the US • CO2 going to Denbury and Tellus for EOR and utilization • Visited on January 22nd the power block was operational and running
delivering power to the grid in Mississippi
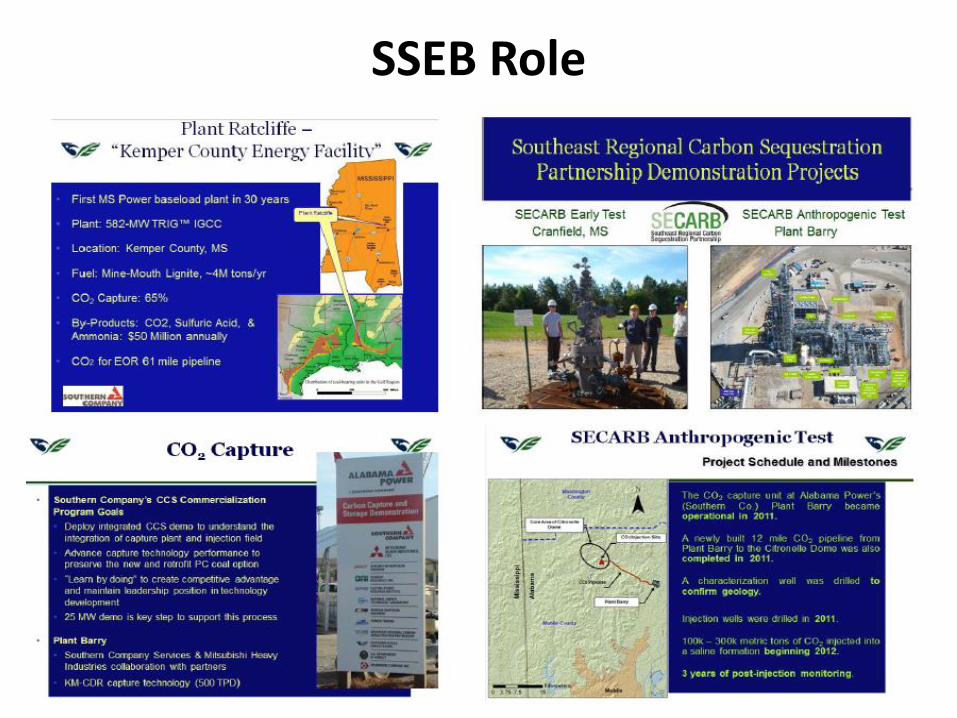
SSEB Role
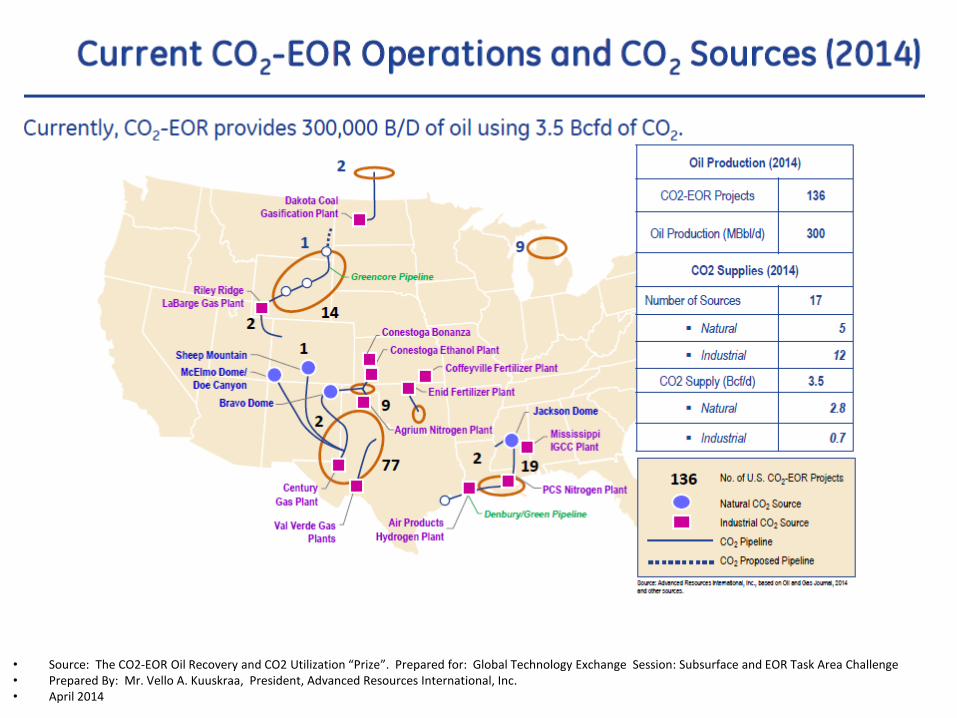
• Source: The CO2-EOR Oil Recovery and CO2 Utilization “Prize”. Prepared for: Global Technology Exchange Session: Subsurface and EOR Task Area Challenge • Prepared By: Mr. Vello A. Kuuskraa, President, Advanced Resources International, Inc. • April 2014
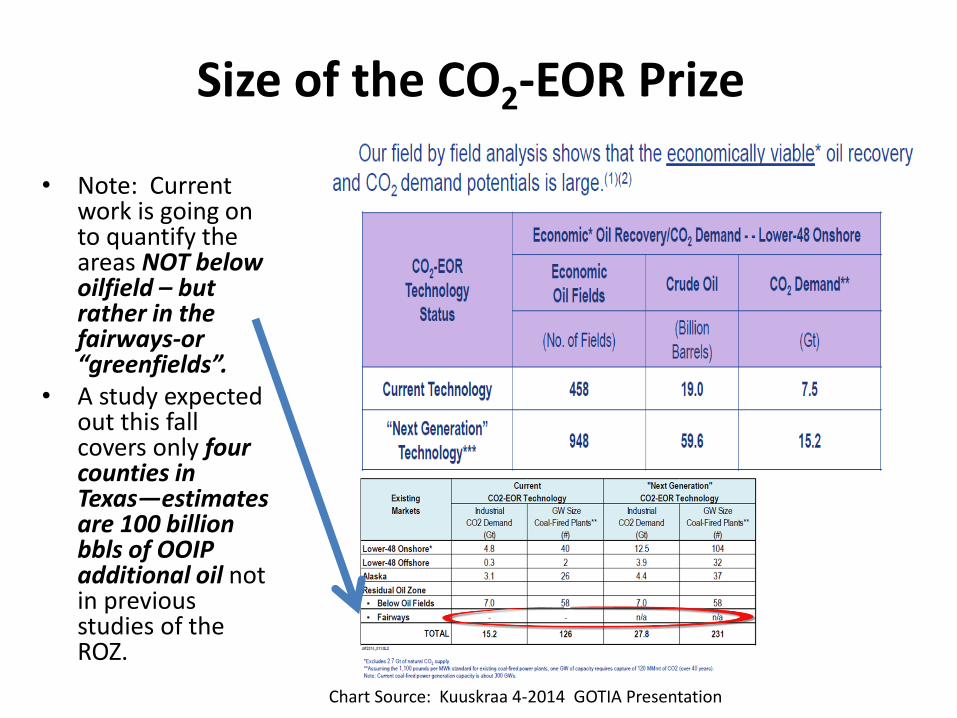
Size of the CO2-EOR Prize
• Note: Current work is going on to quantify the areas NOT below oilfield – but rather in the fairways-or “greenfields”.
• A study expected out this fall covers only four counties in Texas—estimates are 100 billion bbls of OOIP additional oil not in previous studies of the ROZ.
Chart Source: Kuuskraa 4-2014 GOTIA Presentation
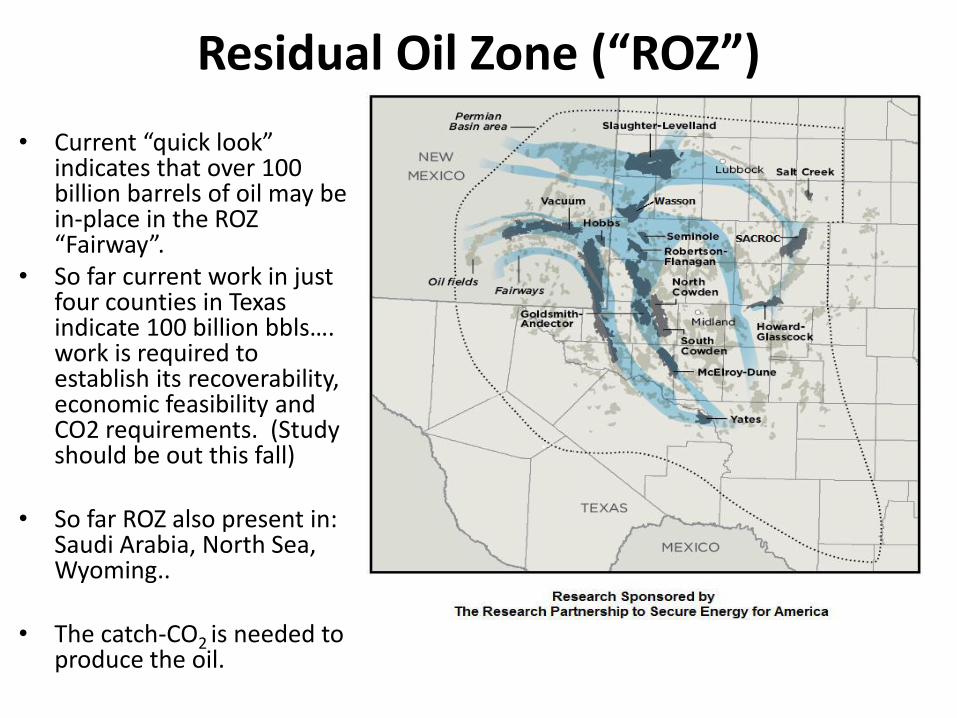
Residual Oil Zone (“ROZ”)
• Current “quick look” indicates that over 100 billion barrels of oil may be in-place in the ROZ “Fairway”.
• So far current work in just four counties in Texas indicate 100 billion bbls…. work is required to establish its recoverability, economic feasibility and CO2 requirements. (Study should be out this fall)
• So far ROZ also present in:
Saudi Arabia, North Sea, Wyoming..
• The catch-CO2 is needed to
produce the oil.
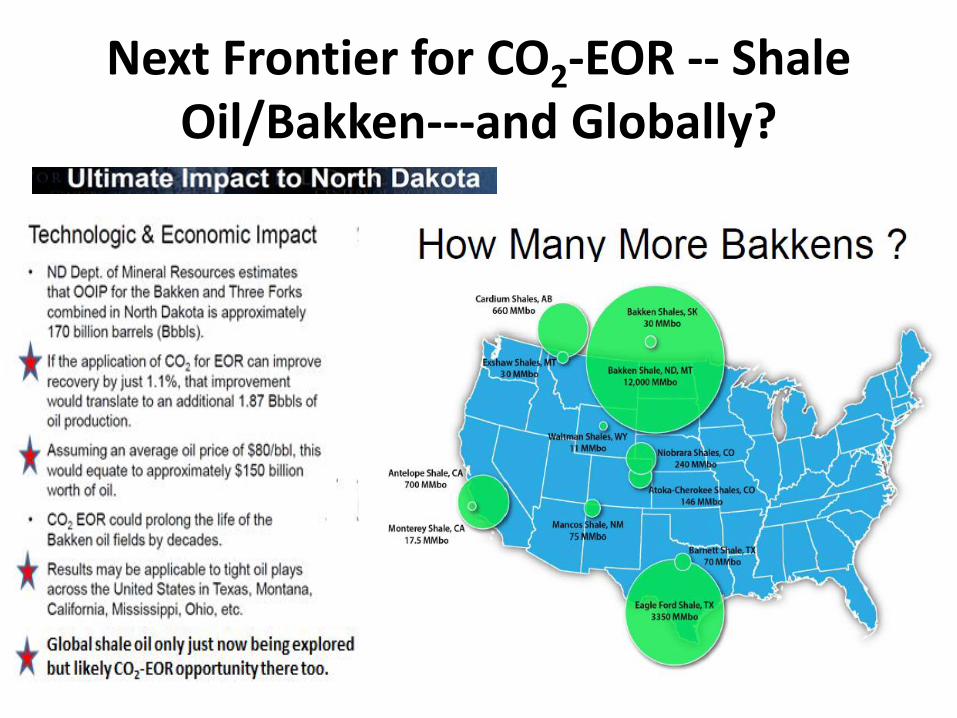
Next Frontier for CO2-EOR -- Shale Oil/Bakken---and Globally?
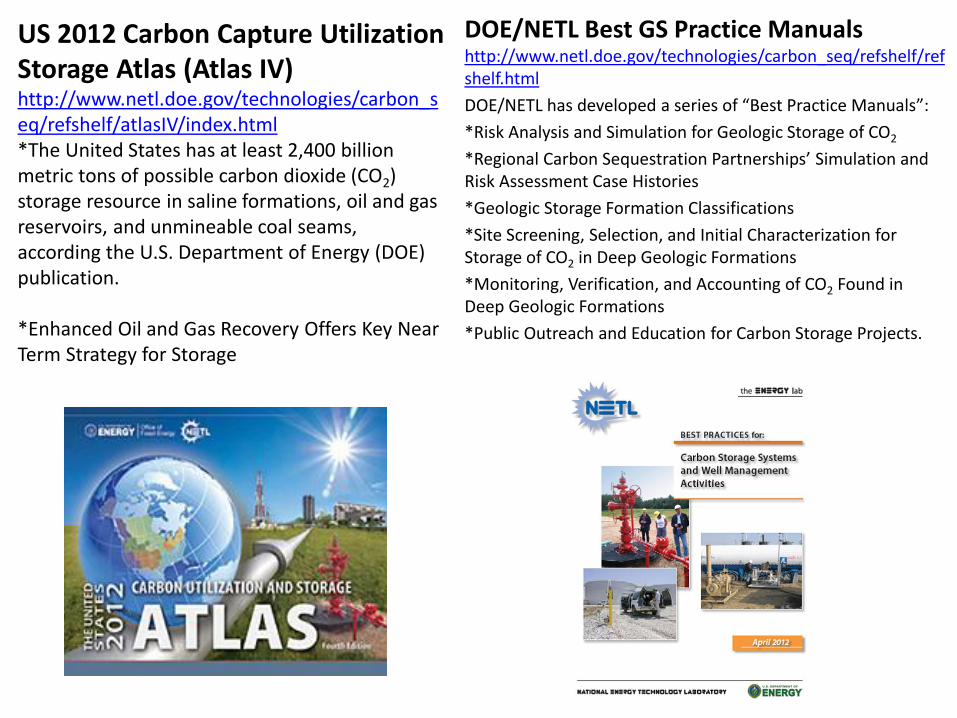
US 2012 Carbon Capture Utilization Storage Atlas (Atlas IV) http://www.netl.doe.gov/technologies/carbon_seq/refshelf/atlasIV/index.html *The United States has at least 2,400 billion metric tons of possible carbon dioxide (CO2) storage resource in saline formations, oil and gas reservoirs, and unmineable coal seams, according the U.S. Department of Energy (DOE) publication. *Enhanced Oil and Gas Recovery Offers Key Near Term Strategy for Storage
DOE/NETL Best GS Practice Manuals http://www.netl.doe.gov/technologies/carbon_seq/refshelf/refshelf.html
DOE/NETL has developed a series of “Best Practice Manuals”:
*Risk Analysis and Simulation for Geologic Storage of CO2
*Regional Carbon Sequestration Partnerships’ Simulation and Risk Assessment Case Histories
*Geologic Storage Formation Classifications
*Site Screening, Selection, and Initial Characterization for Storage of CO2 in Deep Geologic Formations
*Monitoring, Verification, and Accounting of CO2 Found in Deep Geologic Formations
*Public Outreach and Education for Carbon Storage Projects.
Unconventional Oil/Gas
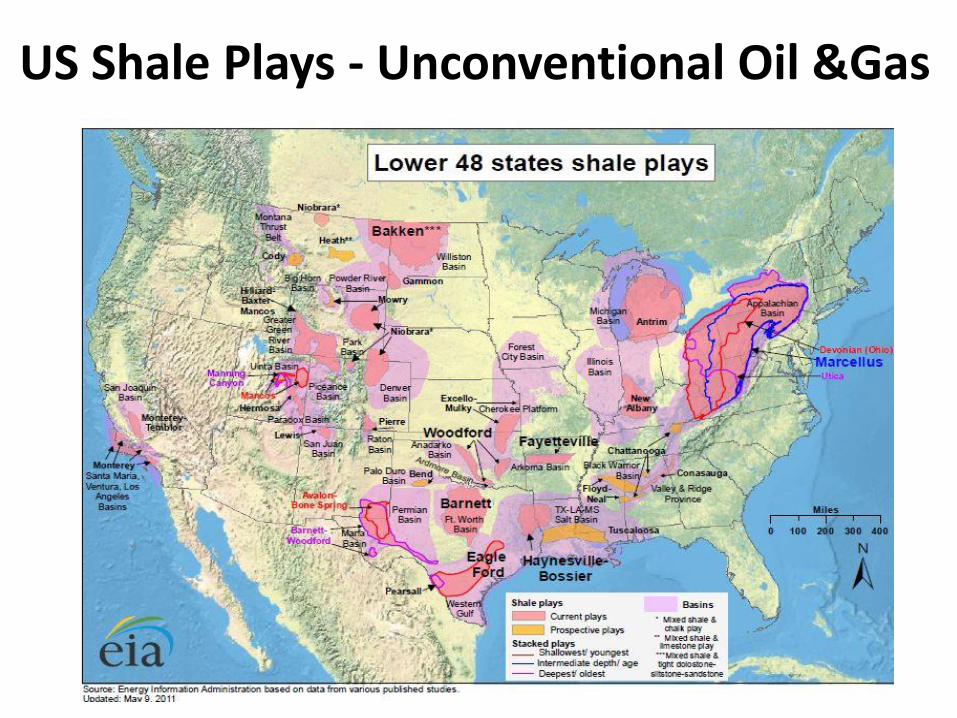
US Shale Plays - Unconventional Oil &Gas
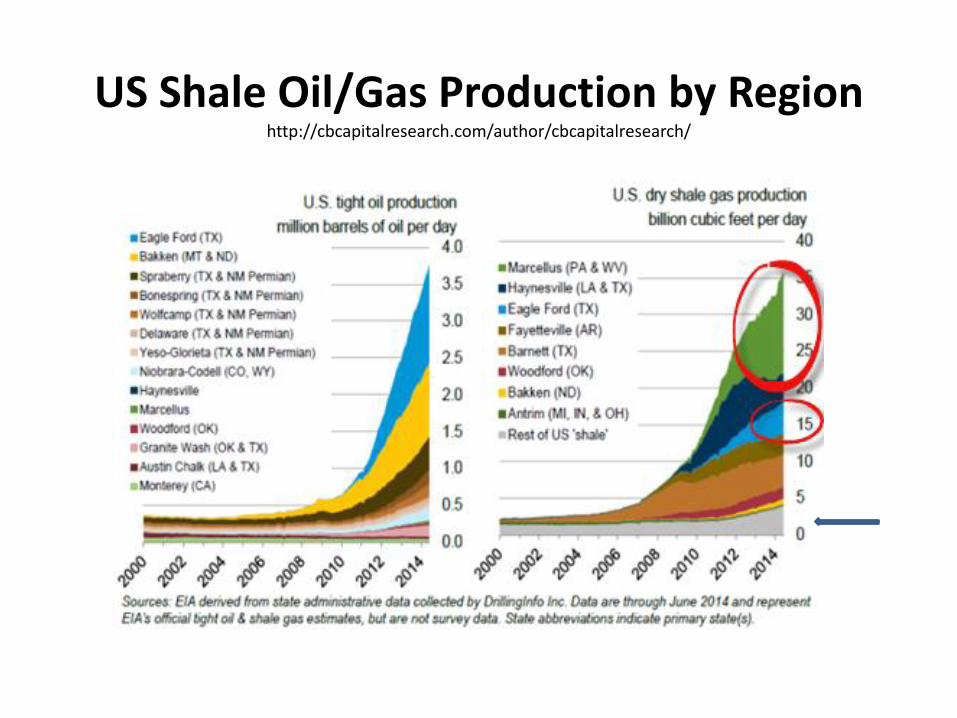
US Shale Oil/Gas Production by Region http://cbcapitalresearch.com/author/cbcapitalresearch/

Changing US Power Generation
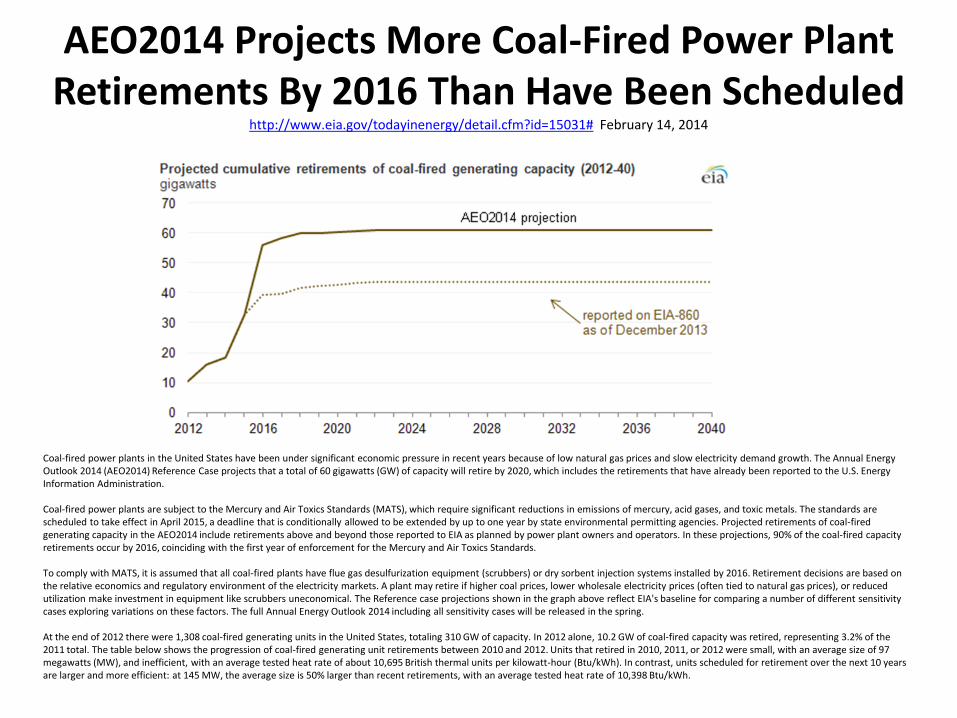
AEO2014 Projects More Coal-Fired Power Plant Retirements By 2016 Than Have Been Scheduled
http://www.eia.gov/todayinenergy/detail.cfm?id=15031# February 14, 2014
Coal-fired power plants in the United States have been under significant economic pressure in recent years because of low natural gas prices and slow electricity demand growth. The Annual Energy Outlook 2014 (AEO2014) Reference Case projects that a total of 60 gigawatts (GW) of capacity will retire by 2020, which includes the retirements that have already been reported to the U.S. Energy Information Administration. Coal-fired power plants are subject to the Mercury and Air Toxics Standards (MATS), which require significant reductions in emissions of mercury, acid gases, and toxic metals. The standards are scheduled to take effect in April 2015, a deadline that is conditionally allowed to be extended by up to one year by state environmental permitting agencies. Projected retirements of coal-fired generating capacity in the AEO2014 include retirements above and beyond those reported to EIA as planned by power plant owners and operators. In these projections, 90% of the coal-fired capacity retirements occur by 2016, coinciding with the first year of enforcement for the Mercury and Air Toxics Standards. To comply with MATS, it is assumed that all coal-fired plants have flue gas desulfurization equipment (scrubbers) or dry sorbent injection systems installed by 2016. Retirement decisions are based on the relative economics and regulatory environment of the electricity markets. A plant may retire if higher coal prices, lower wholesale electricity prices (often tied to natural gas prices), or reduced utilization make investment in equipment like scrubbers uneconomical. The Reference case projections shown in the graph above reflect EIA's baseline for comparing a number of different sensitivity cases exploring variations on these factors. The full Annual Energy Outlook 2014 including all sensitivity cases will be released in the spring. At the end of 2012 there were 1,308 coal-fired generating units in the United States, totaling 310 GW of capacity. In 2012 alone, 10.2 GW of coal-fired capacity was retired, representing 3.2% of the 2011 total. The table below shows the progression of coal-fired generating unit retirements between 2010 and 2012. Units that retired in 2010, 2011, or 2012 were small, with an average size of 97 megawatts (MW), and inefficient, with an average tested heat rate of about 10,695 British thermal units per kilowatt-hour (Btu/kWh). In contrast, units scheduled for retirement over the next 10 years are larger and more efficient: at 145 MW, the average size is 50% larger than recent retirements, with an average tested heat rate of 10,398 Btu/kWh.
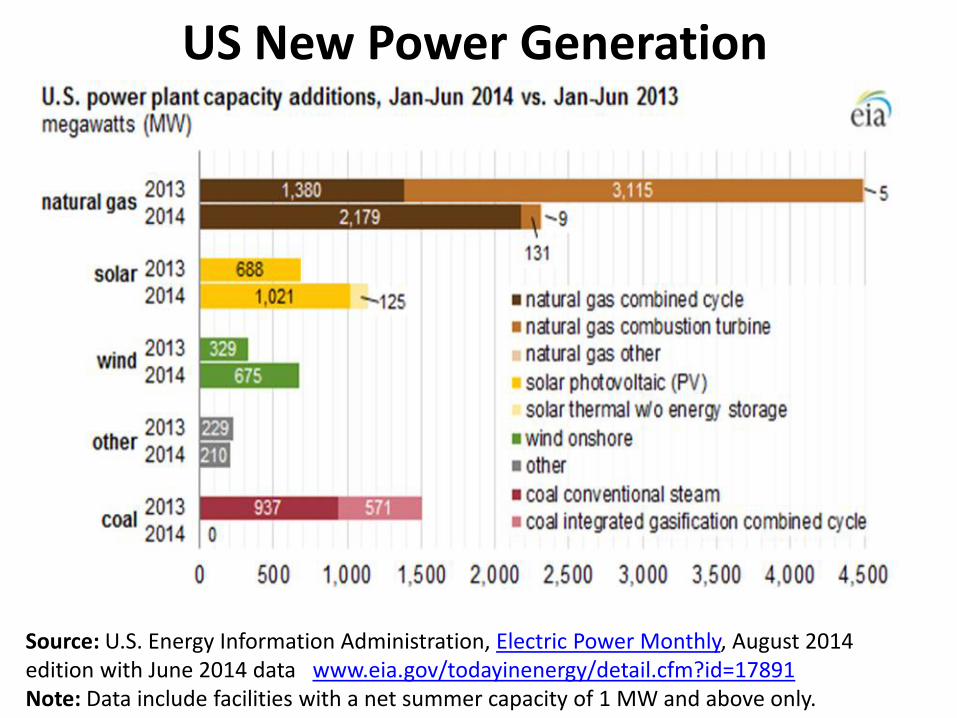
US New Power Generation
Source: U.S. Energy Information Administration, Electric Power Monthly, August 2014 edition with June 2014 data www.eia.gov/todayinenergy/detail.cfm?id=17891 Note: Data include facilities with a net summer capacity of 1 MW and above only.
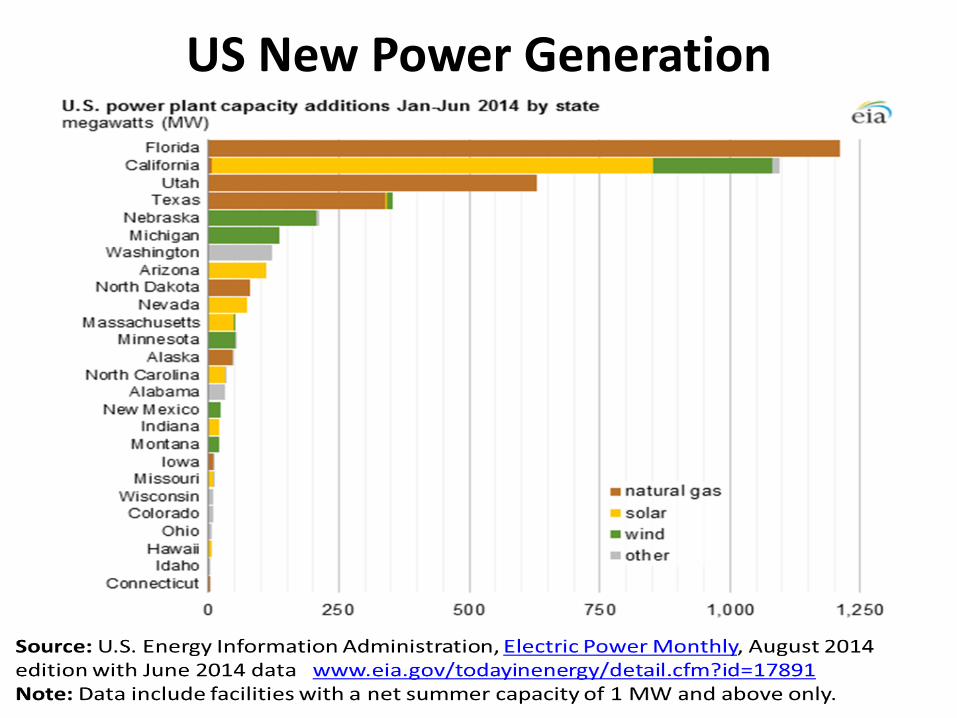
US New Power Generation

Petchem and Refining
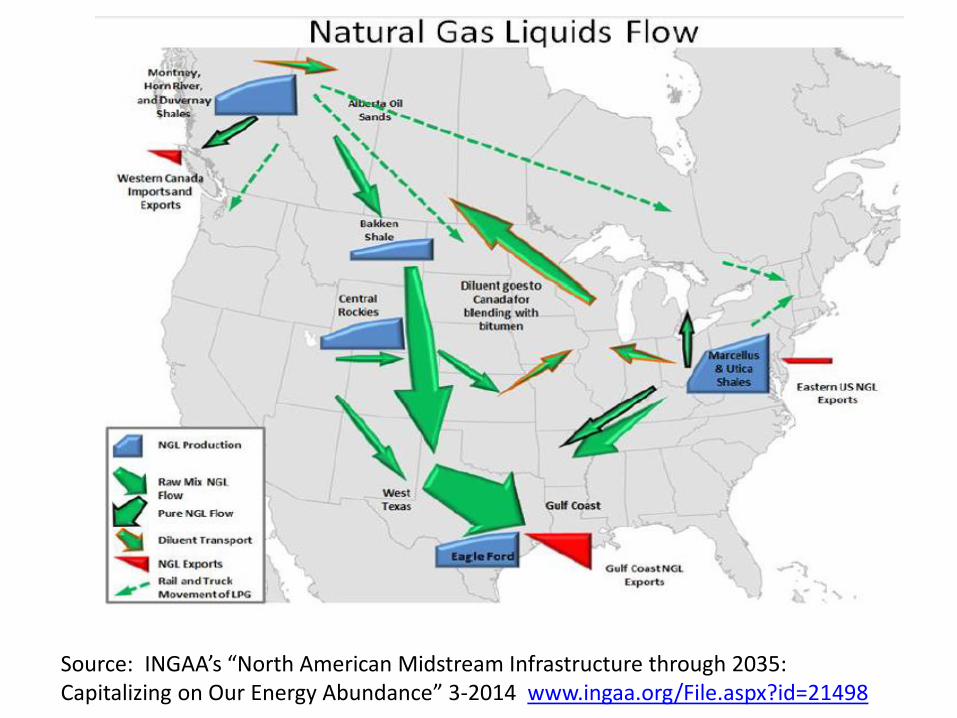
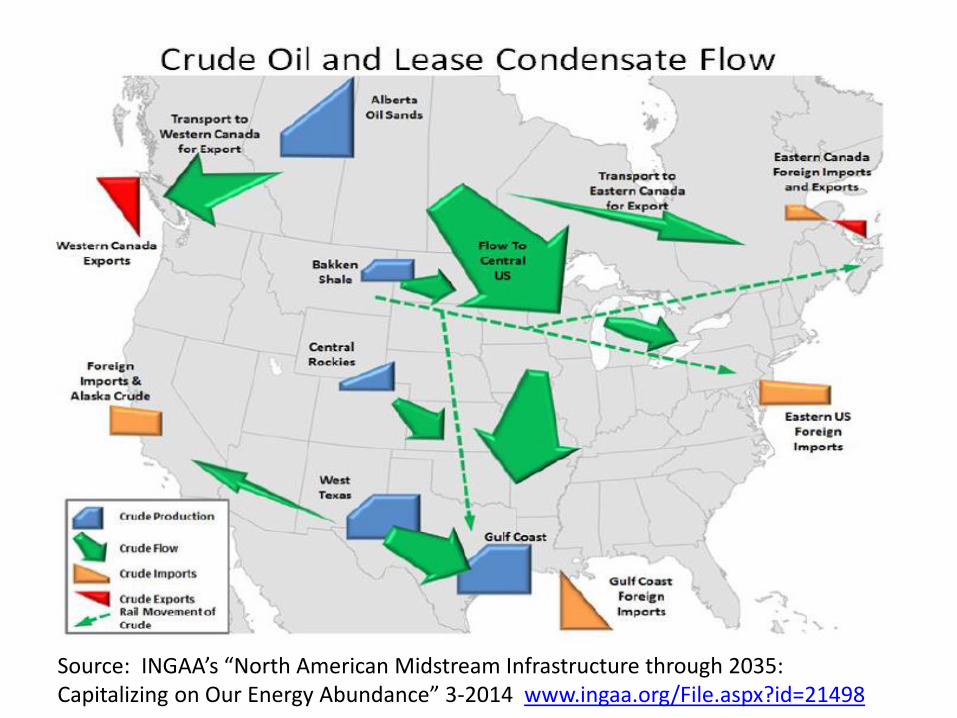
Source: INGAA’s “North American Midstream Infrastructure through 2035: Capitalizing on Our Energy Abundance” 3-2014 www.ingaa.org/File.aspx?id=21498
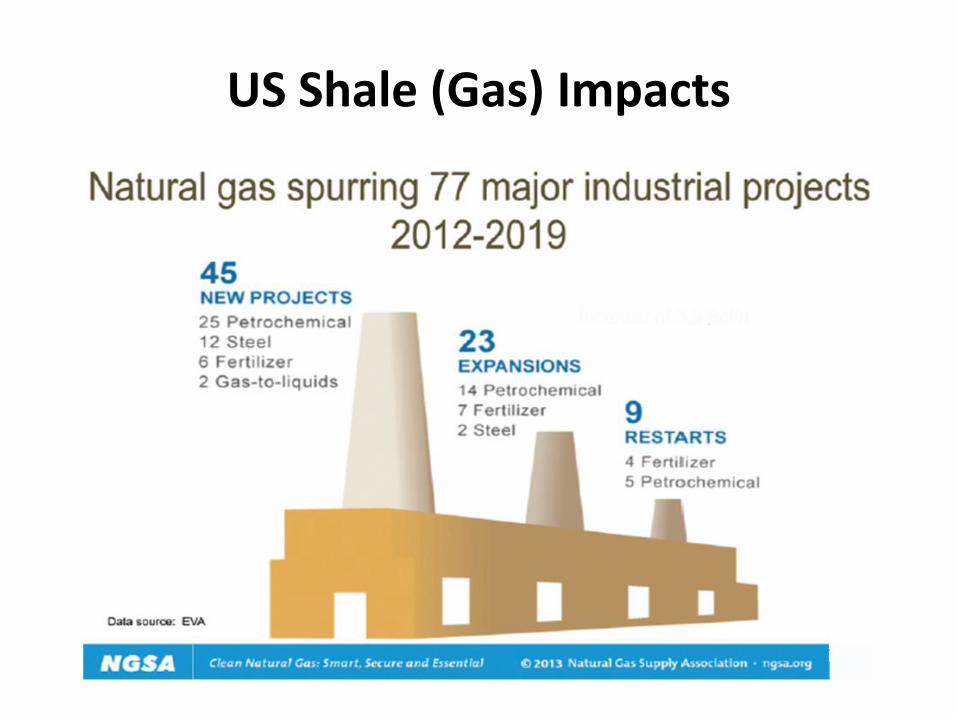
US Shale (Gas) Impacts
Source: INGAA’s “North American Midstream Infrastructure through 2035: Capitalizing on Our Energy Abundance” 3-2014 www.ingaa.org/File.aspx?id=21498
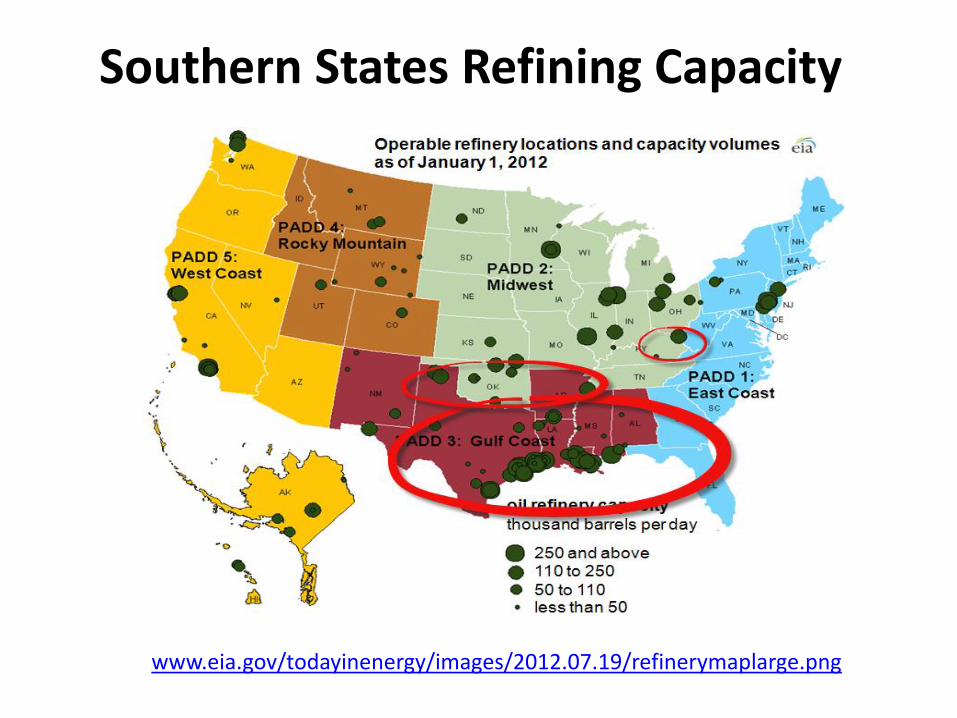
Southern States Refining Capacity
www.eia.gov/todayinenergy/images/2012.07.19/refinerymaplarge.png
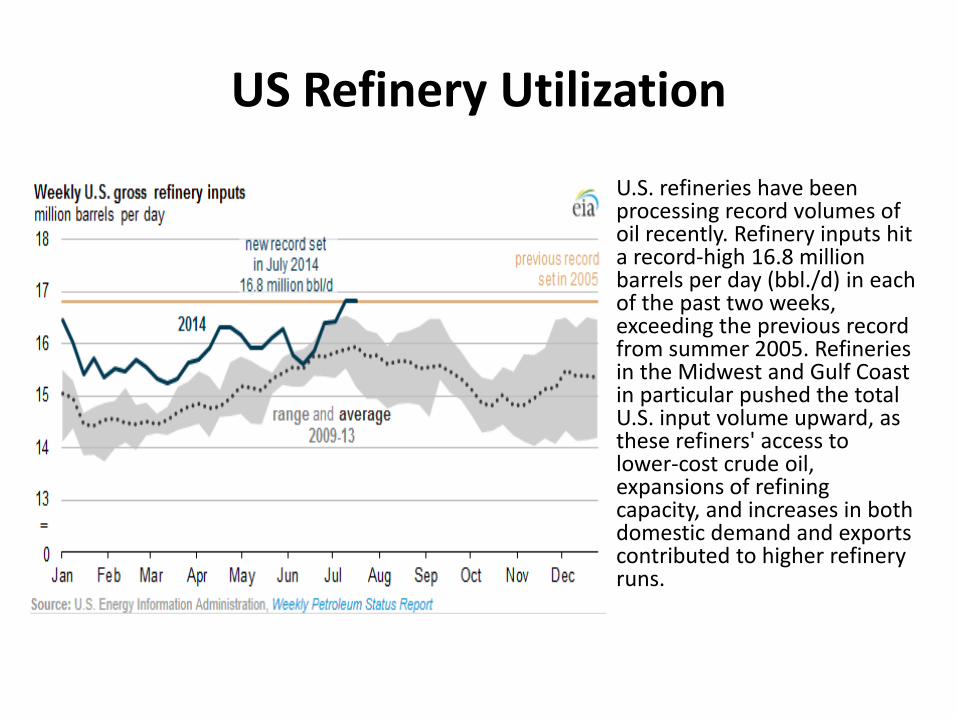
US Refinery Utilization
U.S. refineries have been processing record volumes of oil recently. Refinery inputs hit a record-high 16.8 million barrels per day (bbl./d) in each of the past two weeks, exceeding the previous record from summer 2005. Refineries in the Midwest and Gulf Coast in particular pushed the total U.S. input volume upward, as these refiners' access to lower-cost crude oil, expansions of refining capacity, and increases in both domestic demand and exports contributed to higher refinery runs.
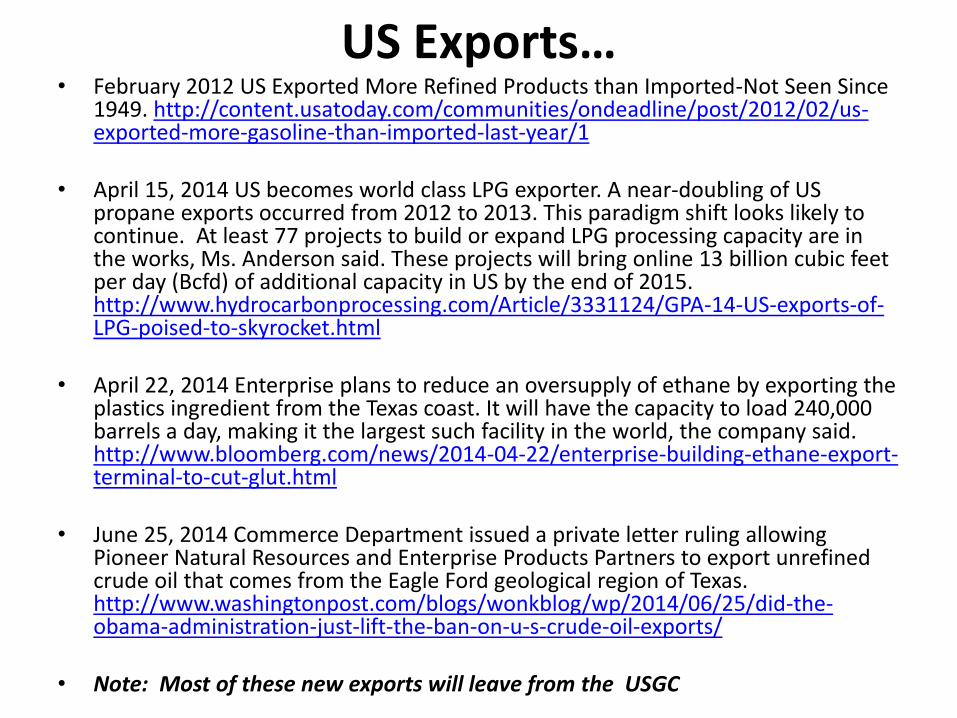
US Exports… • February 2012 US Exported More Refined Products than Imported-Not Seen Since
1949. http://content.usatoday.com/communities/ondeadline/post/2012/02/us-exported-more-gasoline-than-imported-last-year/1
• April 15, 2014 US becomes world class LPG exporter. A near-doubling of US propane exports occurred from 2012 to 2013. This paradigm shift looks likely to continue. At least 77 projects to build or expand LPG processing capacity are in the works, Ms. Anderson said. These projects will bring online 13 billion cubic feet per day (Bcfd) of additional capacity in US by the end of 2015. http://www.hydrocarbonprocessing.com/Article/3331124/GPA-14-US-exports-of-LPG-poised-to-skyrocket.html
• April 22, 2014 Enterprise plans to reduce an oversupply of ethane by exporting the plastics ingredient from the Texas coast. It will have the capacity to load 240,000 barrels a day, making it the largest such facility in the world, the company said. http://www.bloomberg.com/news/2014-04-22/enterprise-building-ethane-export-terminal-to-cut-glut.html
• June 25, 2014 Commerce Department issued a private letter ruling allowing Pioneer Natural Resources and Enterprise Products Partners to export unrefined crude oil that comes from the Eagle Ford geological region of Texas. http://www.washingtonpost.com/blogs/wonkblog/wp/2014/06/25/did-the-obama-administration-just-lift-the-ban-on-u-s-crude-oil-exports/
• Note: Most of these new exports will leave from the USGC

Infrastructure
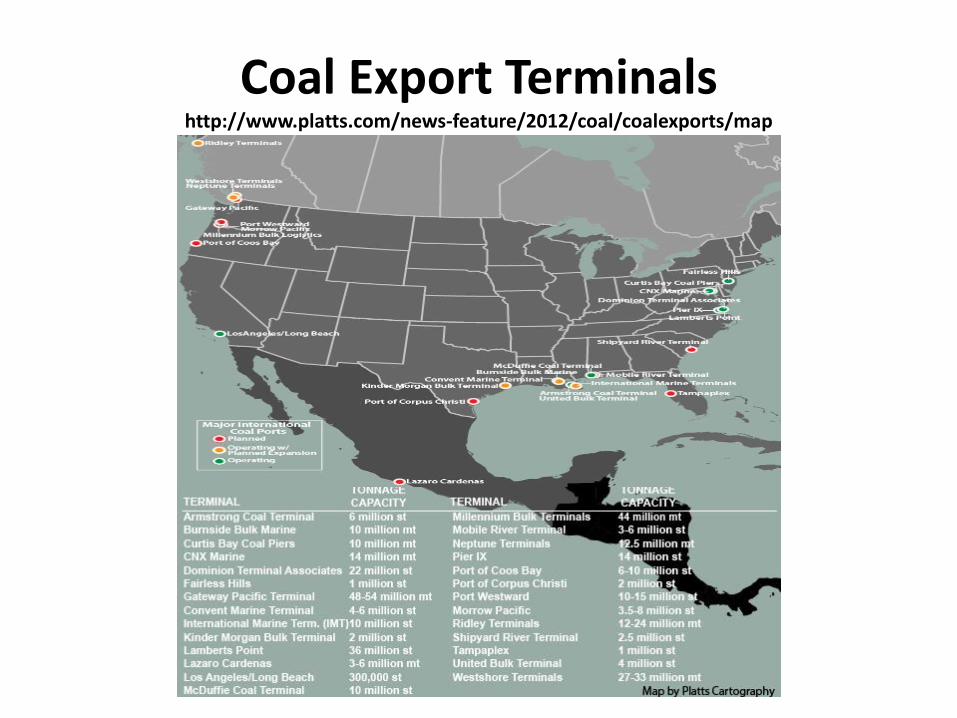
Coal Export Terminals http://www.platts.com/news-feature/2012/coal/coalexports/map
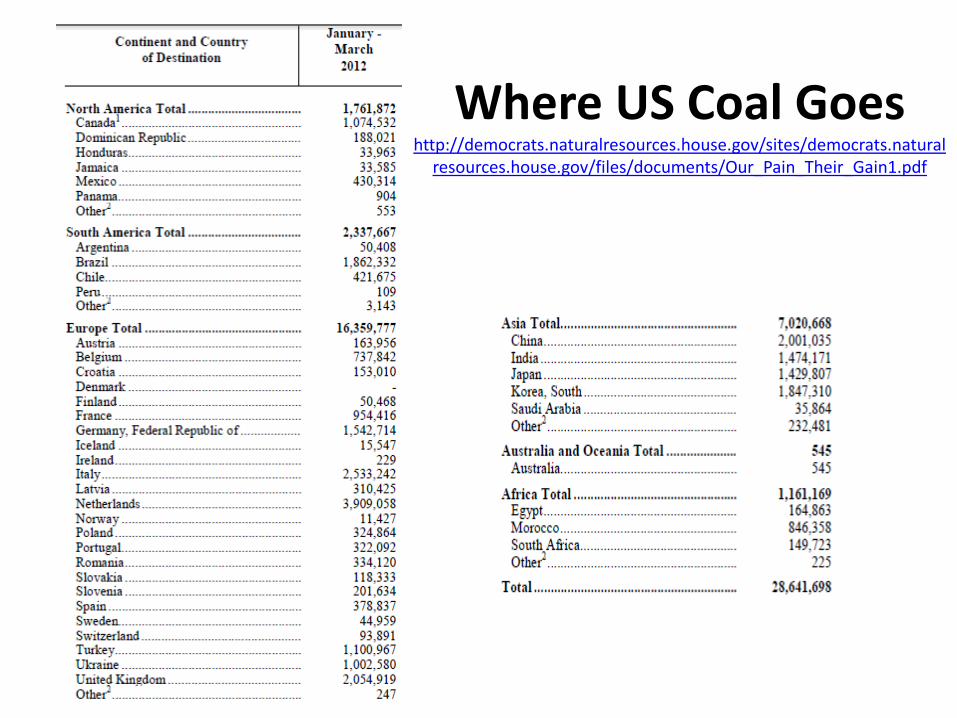
Where US Coal Goes http://democrats.naturalresources.house.gov/sites/democrats.natural
resources.house.gov/files/documents/Our_Pain_Their_Gain1.pdf
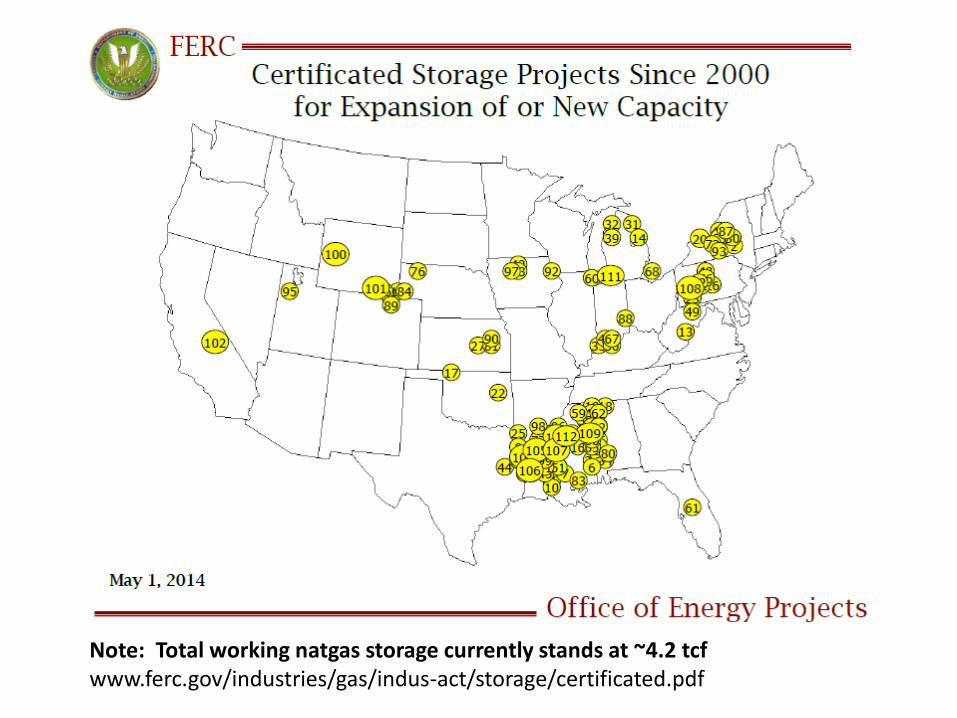
Note: Total working natgas storage currently stands at ~4.2 tcf www.ferc.gov/industries/gas/indus-act/storage/certificated.pdf
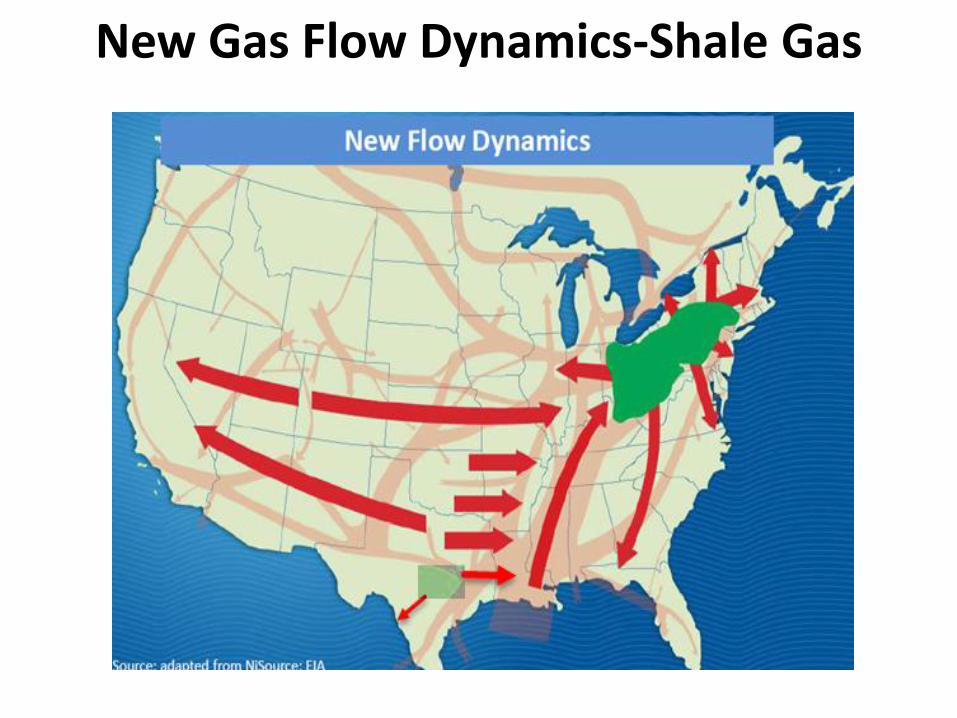
New Gas Flow Dynamics-Shale Gas
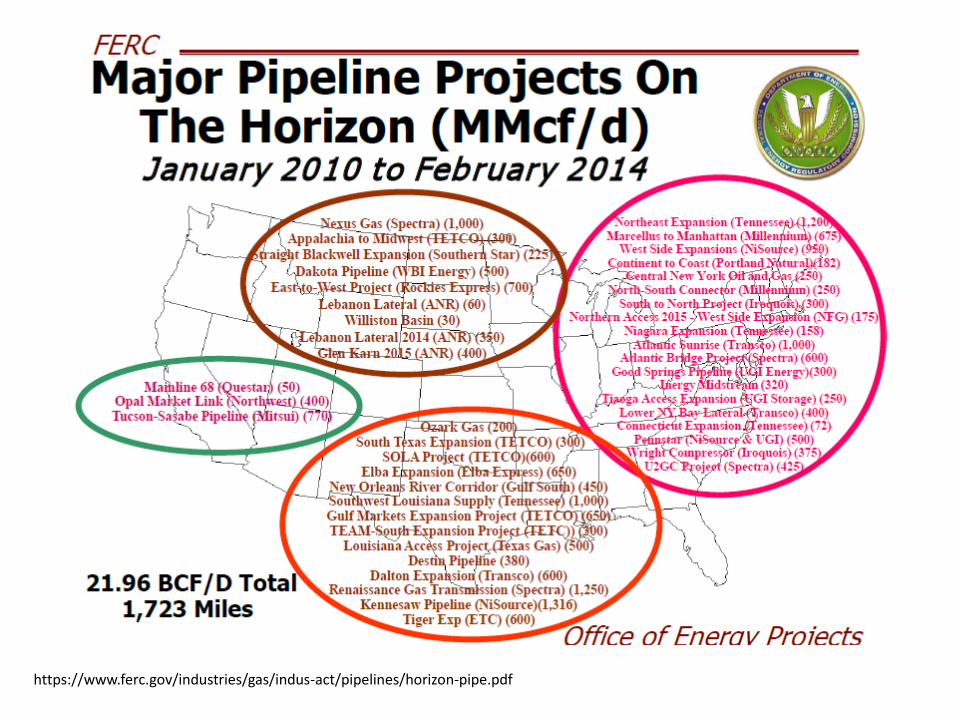
https://www.ferc.gov/industries/gas/indus-act/pipelines/horizon-pipe.pdf
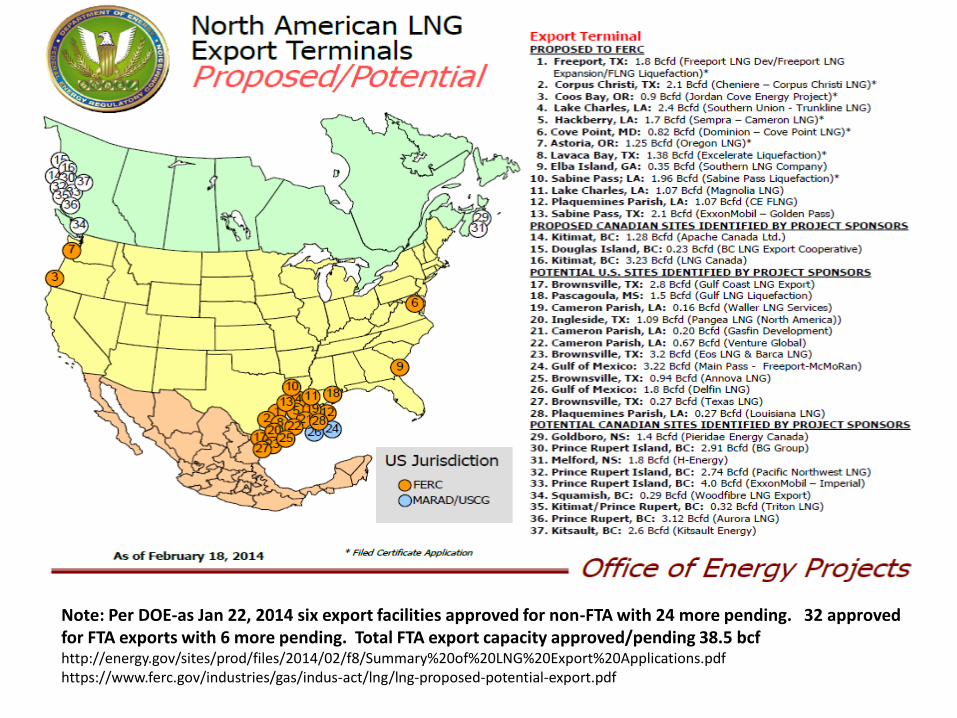
Note: Per DOE-as Jan 22, 2014 six export facilities approved for non-FTA with 24 more pending. 32 approved for FTA exports with 6 more pending. Total FTA export capacity approved/pending 38.5 bcf http://energy.gov/sites/prod/files/2014/02/f8/Summary%20of%20LNG%20Export%20Applications.pdf https://www.ferc.gov/industries/gas/indus-act/lng/lng-proposed-potential-export.pdf
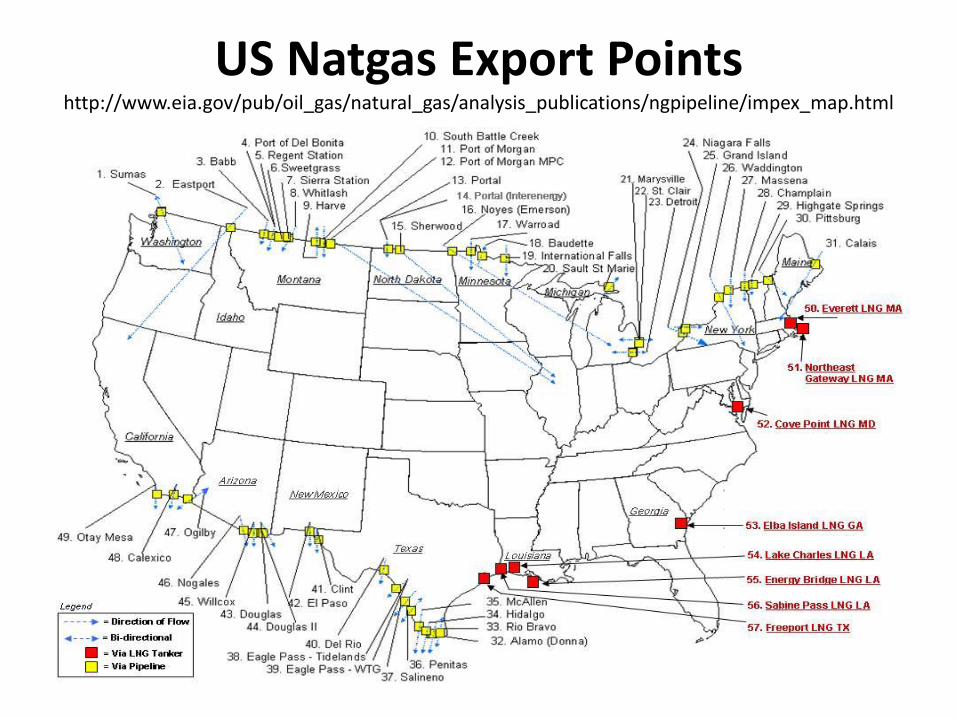
US Natgas Export Points http://www.eia.gov/pub/oil_gas/natural_gas/analysis_publications/ngpipeline/impex_map.html
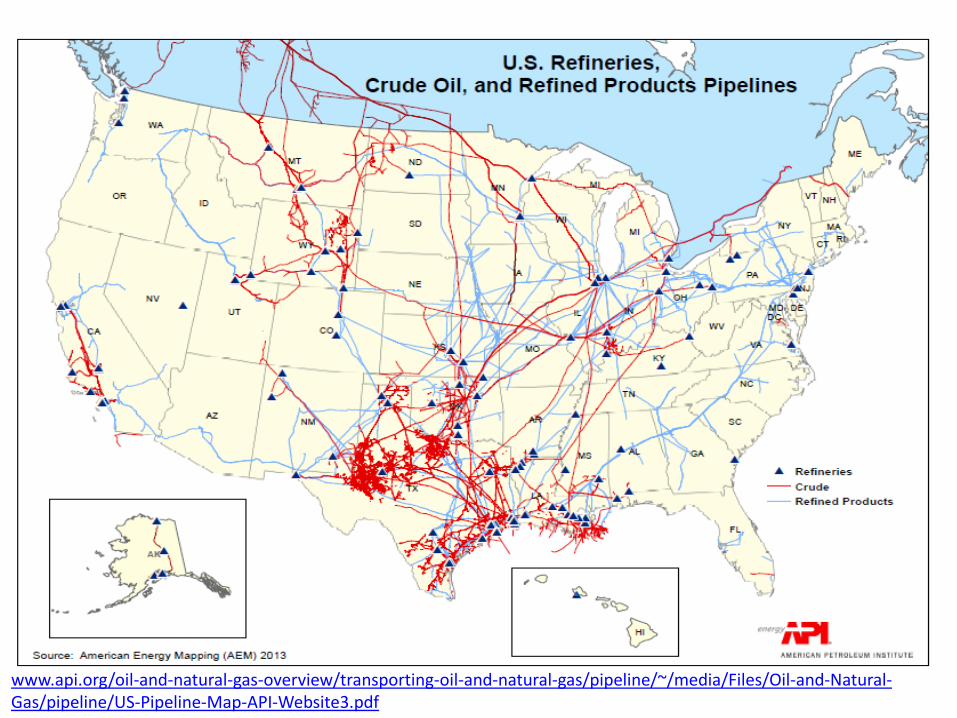
www.api.org/oil-and-natural-gas-overview/transporting-oil-and-natural-gas/pipeline/~/media/Files/Oil-and-Natural-Gas/pipeline/US-Pipeline-Map-API-Website3.pdf
Refinery Crude and Condensate Additions
• 17 additions planned or already operational between 2014 and 2016
• Adds ~590,000 b/day of new capacity
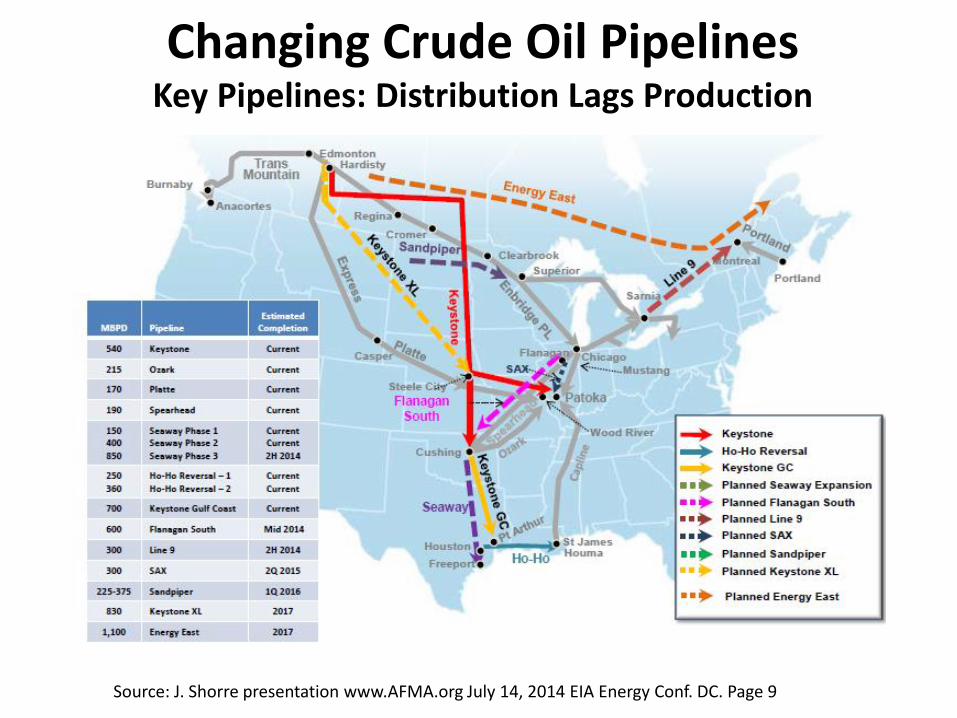
Changing Crude Oil Pipelines Key Pipelines: Distribution Lags Production
Source: J. Shorre presentation www.AFMA.org July 14, 2014 EIA Energy Conf. DC. Page 9
Crude Oil by Rail
• USGC 24 operating and planned crude by rail terminals by end of 2015
• ~1.5 million b/day of capacity
Panama Canal Expansion and It’s Impacts
It could be the single biggest game changer for the export of US energy and related commodities to the Far East. • LNG Exports –first US export facility online in 2015. Canal will
be able to provide passage for up to 80% of global shipping of liquefied natural gas (LNG). It currently allows passage of only a small percentage of LNG shipping and only shipping by the smallest of LNG tankers.
• Coal Exports – major expansions of GC terminals • NGL Exports – long term export contracts • Transportation Fuels Exports-from foreign/US crude, GTL and
CTL projects • Crude Oil Exports – talk to open up lower 48 export
restrictions-- ship size moves from 400,000-550,000 bbls to up to 680,000 bbls
• Petrochemical Exports – world scale export facilities and expansions underway in the GC

Some Things to Think About
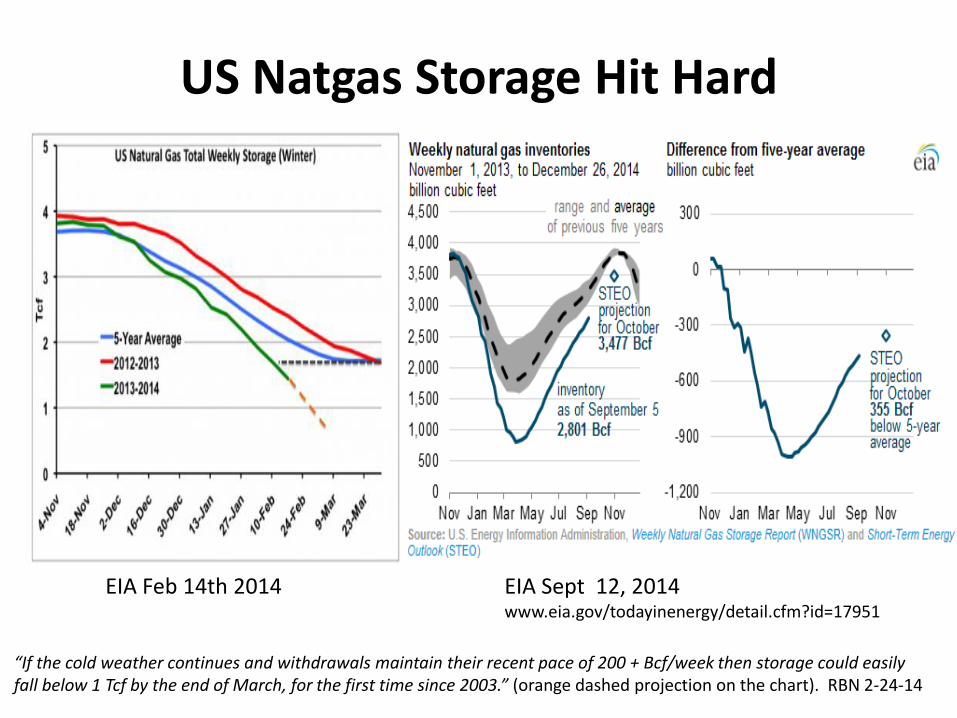
US Natgas Storage Hit Hard
“If the cold weather continues and withdrawals maintain their recent pace of 200 + Bcf/week then storage could easily fall below 1 Tcf by the end of March, for the first time since 2003.” (orange dashed projection on the chart). RBN 2-24-14
EIA Feb 14th 2014 EIA Sept 12, 2014 www.eia.gov/todayinenergy/detail.cfm?id=17951
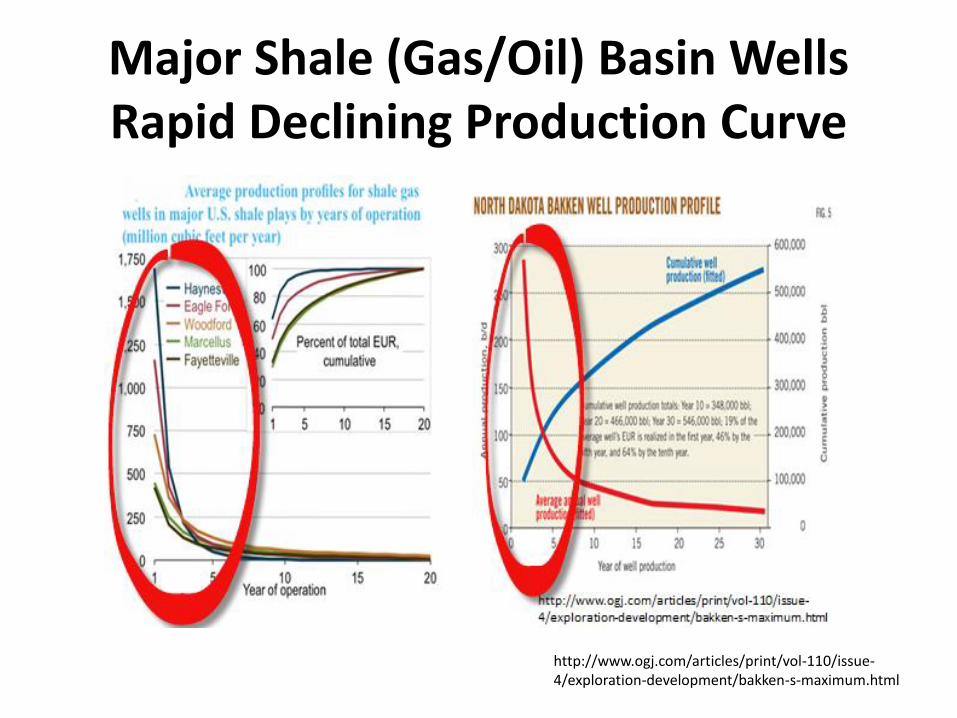
Major Shale (Gas/Oil) Basin Wells Rapid Declining Production Curve
http://www.ogj.com/articles/print/vol-110/issue-4/exploration-development/bakken-s-maximum.html
Impacts and Impactors • 2012 Lower power costs in US vs. Europe creating competitive industrial tensions.
http://www.cnbc.com/id/101365772 • Feb. 2014 Natgas shortage in California-Stephanie McCorkle, a spokeswoman for the grid operator,
said Southern California has become increasingly dependent on natural gas-fired plants since the decision last year to shutter the troubled San Onofre nuclear power plant, which is located between Los Angeles and San Diego. http://bigstory.ap.org/article/natural-gas-shortage-affects-calif-power-supply
• February 21st , 2014 East Coast runs short of natgas.. With heating demands for gas soaring, gas
prices at two points on the Transco pipeline running through the mid-Atlantic region averaged more than $120 per million British thermal units on Jan. 21 with a high mark of $140 per million Btu, -- prices that pushed some generators' costs to more than $1,200 per MWh. Energy & Environment News 2/24/14
• October 31, 2012 US coal displaces Germany’s natgas, shutting down new natgas generation and
raising their GHG emissions. http://www.bloomberg.com/news/2012-10-31/gas-golden-age-darkens-in-europe-on-u-s-coal-energy-markets.html
• November 7th 2013'Unburnable' carbon fuels investment concerns-Investors group with €7.3tn of assets asks energy giants about their exposure and response to the risk of falling demand for oil and coal. http://www.theguardian.com/sustainable-business/unburnable-carbon-investment-agenda
• June 12th 2013 Obama Quietly Raises 'Carbon Price' as Costs to Climate Increase. The increase of the so-called social cost of carbon, to $38 a metric ton in 2015 from $23.80, adjusts the calculation the government uses to weigh costs and benefits of proposed regulations. The figure is meant to approximate losses from global warming such as flood damage and diminished crops. http://www.bloomberg.com/news/2013-06-12/tougher-regulations-seen-from-obama-change-in-carbon-cost.html
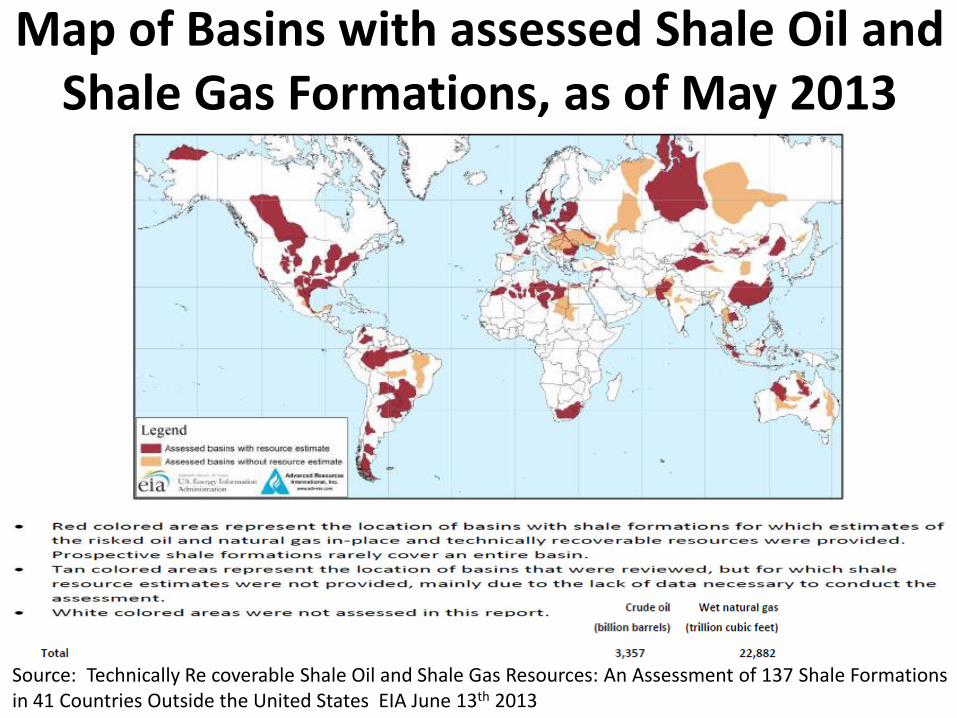
Map of Basins with assessed Shale Oil and Shale Gas Formations, as of May 2013
Source: Technically Re coverable Shale Oil and Shale Gas Resources: An Assessment of 137 Shale Formations in 41 Countries Outside the United States EIA June 13th 2013
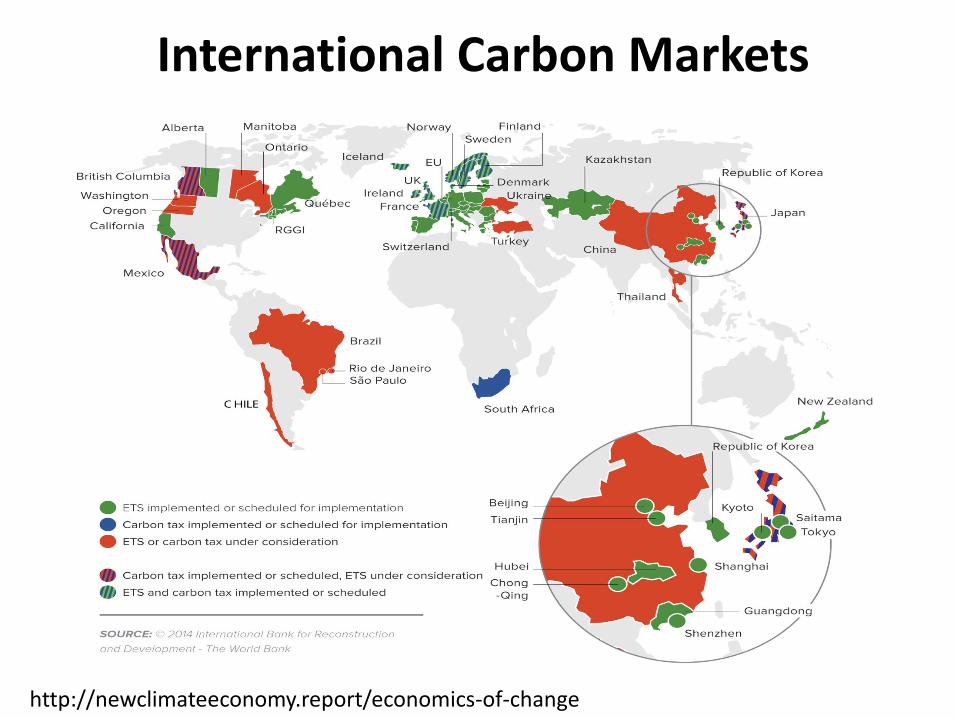
International Carbon Markets
http://newclimateeconomy.report/economics-of-change
Questions & Thank You! Michael E. Moore
• VP Energy Commodities and Advisory Services
• FearnOil Inc. (a division of Astrup-Fearnleys)
• www.fearnleys.com
• Executive Director
• North American Carbon Capture Storage Association
• www.naccsa.org
• [email protected] Tel: 281-759-0245
• The Astrup Fearnley group represents over a century of history, growth and excellence in the area of shipping services. This fascinating legacy is a success story created by generation after generation of the Astrup Fearnley family. We believe it is a story worth telling.
• Fearnleys traces its history back to the year 1869 when its founder, Thomas Fearnley, established a shipbroking and agency business in Christiania, as the city of Oslo was known in those days. The little company soon prospered and engaged in, among others, the trade in lumber, wine, pitch and ice.
• In connection with its trading activities the company bought shares in vessels and chartered vessels. Although the company began by chartering sailing vessels, by 1880 the age of the steamship had clearly begun. By 1881 the partnership of Fearnley & Eger established the Christiania Steamship Company which contracted two newbuildings at the the Kockums Shipyard in Malmø, the 1235 deadweight ‘Oslo’ and the 1215 deadweight ‘Bygdøy’.
• By the end of the 1880s the company had contracted a further six units. In the beginning of the 1900s Fearnley & Eger became, more or less, a shipowning company and invested in ever larger units. The company engaged in both liner and tramp activities and survived the two world wars. In addition to these shipowning activities, the firm continued to engage in developing its skills in the area of shipping services and was engaged primarily in the area of dry cargo shipbroking. As the tanker industry started to develop at the beginning of the 20th century, Fearnleys became enthusiastically involved in this new field of endeavour. Later on, when the transportation of gas by sea became an important area of commerce, Fearnleys developed a broking department which specialized in this new commodity. All in all, the history of the company has been closely focused on the concept of innovation; whenever new ideas and new industries developed which required seaborne transportation, Fearnleys was quickly on the scene.
• As the 20th century progressed, the need for brokerage services for the transportation industry became so great that Fearnleys began to develop these (along with related ancillary services) as its principal business area. Always on the cutting edge of new trends, the company became involved in car carrier transportation in the 1960s, offshore and rig broking in the 1970s, coinciding with the onset of the development of the Norwegian continental shelf offshore oil fields, and energy trading and financial services in the 1980s. Fearnleys was also a pioneer in the development of transportation industry research and consultancy services, and has been involved in monitoring and analysing shipping markets since the early 1960s when Fearnresearch was first established. Now at the dawn of the 21st century the little company which started in Christiania in 1869 is firmly established in every corner of the world and assumes a global perspective on transportation much to the benefit of its worldwide customer base.
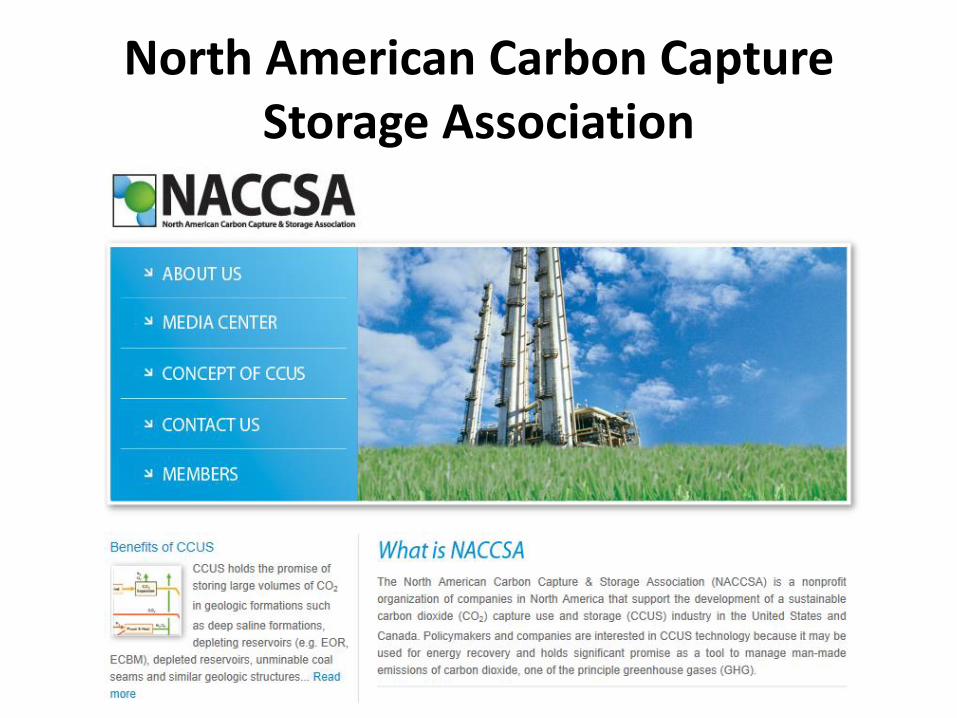
North American Carbon Capture Storage Association
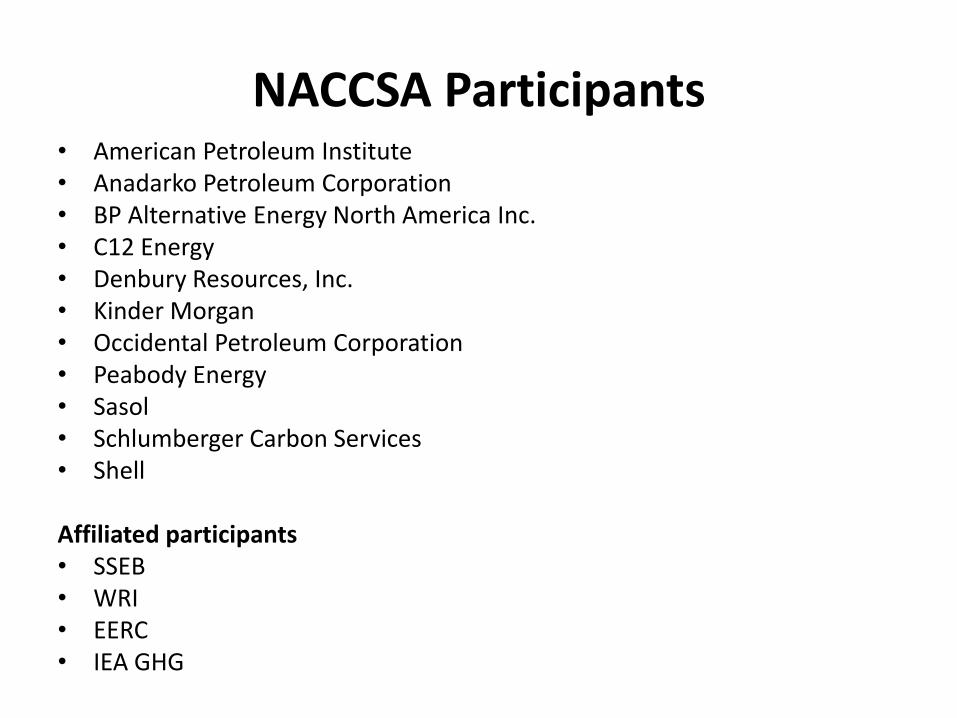
NACCSA Participants • American Petroleum Institute • Anadarko Petroleum Corporation • BP Alternative Energy North America Inc. • C12 Energy • Denbury Resources, Inc. • Kinder Morgan • Occidental Petroleum Corporation • Peabody Energy • Sasol • Schlumberger Carbon Services • Shell Affiliated participants • SSEB • WRI • EERC • IEA GHG