Embed Size (px)
Citation preview

Ahlstrom Investor presentation
October 2014

Contents
– Ahlstrom in brief
– Summary of Q3/2014 and future prospects
– Business area financials
– Strategic agenda for 2020
– Long-term financial targets
– Sustainability
– Key financials 2009-2013
– Debt financing
– Global sourcing
10/28/2014 © 2014 Ahlstrom Corporation Page 2
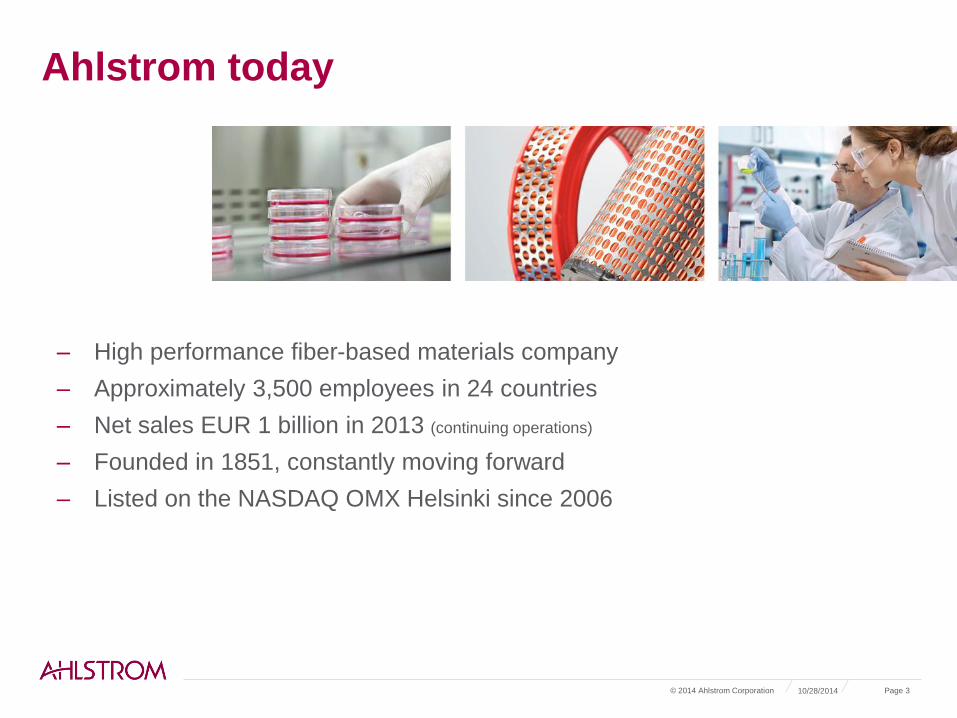
Ahlstrom today
– High performance fiber-based materials company
– Approximately 3,500 employees in 24 countries
– Net sales EUR 1 billion in 2013 (continuing operations)
– Founded in 1851, constantly moving forward
– Listed on the NASDAQ OMX Helsinki since 2006
10/28/2014 © 2014 Ahlstrom Corporation Page 3

10/28/2014 © 2014 Ahlstrom Corporation Page 4
Business areas
is one of the
leading players
globally for
materials used in
wall coverings,
floorings and
windmill blades
is one of the
leading players
globally for
materials used in
tea bags, coffee
pods, molds,
trays, food
packaging and
masking tape
is the global
leader in
transportation
filtration materials
is a global
supplier of air and
liquid filtration
materials, with a
leading market
position in life
science and gas
turbine filtration
is one of the
leading players
globally for
materials used in
medical gowns
and drapes,
apparel and
sterile barrier
systems
Building and
Energy
Food
Transportation
Filtration
Advanced
Filtration
Medical

Creating value 1. Primary production
– Natural fibers: wood, cotton, hemp
– Oil and petrochemicals
2. Raw material supplier – Pulp producers
– Synthetic fiber producers (PET, PP, glass)
– Chemical suppliers
5. Marketer / seller – World class consumer
or industrial brands
6. Consumers
3. Ahlstrom – Other roll goods producers
4. Converters and industrial customers – Healthcare and consumer goods suppliers
– Transportation industry suppliers
– Air and liquid filter manufacturers
– Packaging industry
– Wallcover printers and designers
10/28/2014 © 2014 Ahlstrom Corporation Page 5
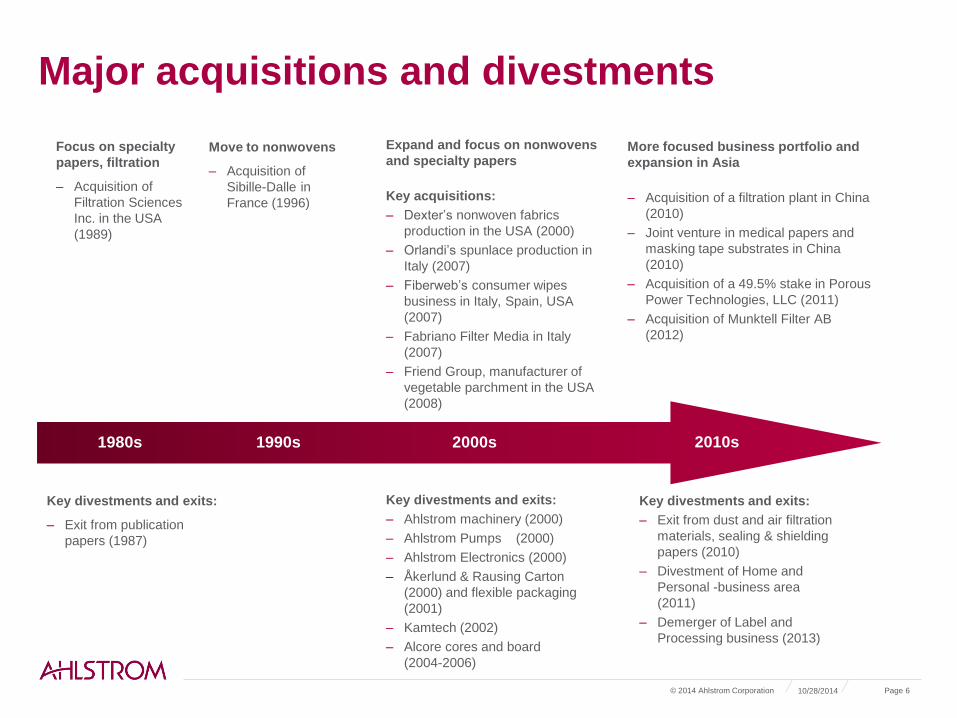
Major acquisitions and divestments
1980s 1990s 2010s 2000s
Focus on specialty
papers, filtration
‒ Acquisition of
Filtration Sciences
Inc. in the USA
(1989)
Move to nonwovens
‒ Acquisition of
Sibille-Dalle in
France (1996)
Expand and focus on nonwovens
and specialty papers
Key acquisitions:
‒ Dexter’s nonwoven fabrics
production in the USA (2000)
‒ Orlandi’s spunlace production in
Italy (2007)
‒ Fiberweb’s consumer wipes
business in Italy, Spain, USA
(2007)
‒ Fabriano Filter Media in Italy
(2007)
‒ Friend Group, manufacturer of
vegetable parchment in the USA
(2008)
More focused business portfolio and
expansion in Asia
‒ Acquisition of a filtration plant in China
(2010)
‒ Joint venture in medical papers and
masking tape substrates in China
(2010)
‒ Acquisition of a 49.5% stake in Porous
Power Technologies, LLC (2011)
‒ Acquisition of Munktell Filter AB
(2012)
Key divestments and exits:
‒ Ahlstrom machinery (2000)
‒ Ahlstrom Pumps (2000)
‒ Ahlstrom Electronics (2000)
‒ Åkerlund & Rausing Carton
(2000) and flexible packaging
(2001)
‒ Kamtech (2002)
‒ Alcore cores and board
(2004-2006)
10/28/2014 © 2014 Ahlstrom Corporation Page 6
Key divestments and exits:
‒ Exit from dust and air filtration
materials, sealing & shielding
papers (2010)
‒ Divestment of Home and
Personal -business area
(2011)
‒ Demerger of Label and
Processing business (2013)
Key divestments and exits:
‒ Exit from publication
papers (1987)

Summary Q3/2014& future prospects
28/10/2014 © 2014 Ahlstrom Corporation Page 7

Page
Executive Management Team as of October 24, 2014
CEO
Marco Levi
CFO
Sakari Ahdekivi
EVP Building and Energy
Fulvio Capussotti
EVP Filtration
Jari Koikkalainen
EVP Food and Medical
Omar Hoek
EVP HR
Päivi Leskinen
EVP Legal
Ulla Bono
EVP Commercial Excellence & Customer
Service
Nadia Stoykov
–8

Page
Business areas as of January 1, 2015
–9
Building and Energy Filtration Food and Medical
One of the leading players
globally for materials used in
wallcoverings, floorings and
windmill blades.
A global supplier of
transportation, air and liquid
filtration materials, with a
leading market position in life
science and gas turbine
filtration.
One of the leading players
globally for materials used in
beverage and food
packaging, masking tape and
medical gowns and drapes.
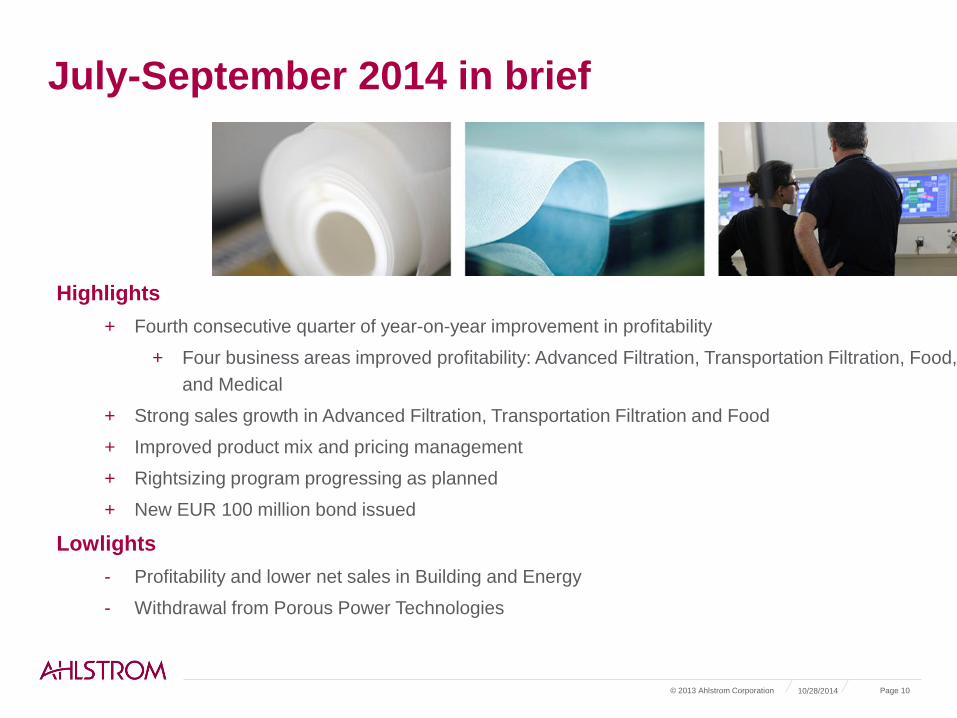
July-September 2014 in brief
10/28/2014 © 2013 Ahlstrom Corporation Page 10
Highlights
+ Fourth consecutive quarter of year-on-year improvement in profitability
+ Four business areas improved profitability: Advanced Filtration, Transportation Filtration, Food,
and Medical
+ Strong sales growth in Advanced Filtration, Transportation Filtration and Food
+ Improved product mix and pricing management
+ Rightsizing program progressing as planned
+ New EUR 100 million bond issued
Lowlights
- Profitability and lower net sales in Building and Energy
- Withdrawal from Porous Power Technologies

Key figures
10/28/2014 © 2013 Ahlstrom Corporation Page 11
*Excluding non-recurring items
**Including discontinued operations
EUR million Q3/2014 Q3/2013
Change,
%
Q1-
Q3/2014
Q1-
Q3/2013
Change,
%
Net sales 252.0 251.1 0.3 754.1 771.4 -2.2
EBITDA* 22.6 14.4 57.5 67.1 54.8 22.5
% of net sales 9.0 5.7 8.9 7.1
Operating profit excl.
NRI 9.7 1.5 N/A 30.4 15.9 91.0
% of net sales 3.9 0.6 4.0 2.1
Gearing** 88.4 74.2 88.4 74.2
ROCE, % -8.0 0.7 0.2 2.3
10/28/2014 © 2013 Ahlstrom Corporation Page 12
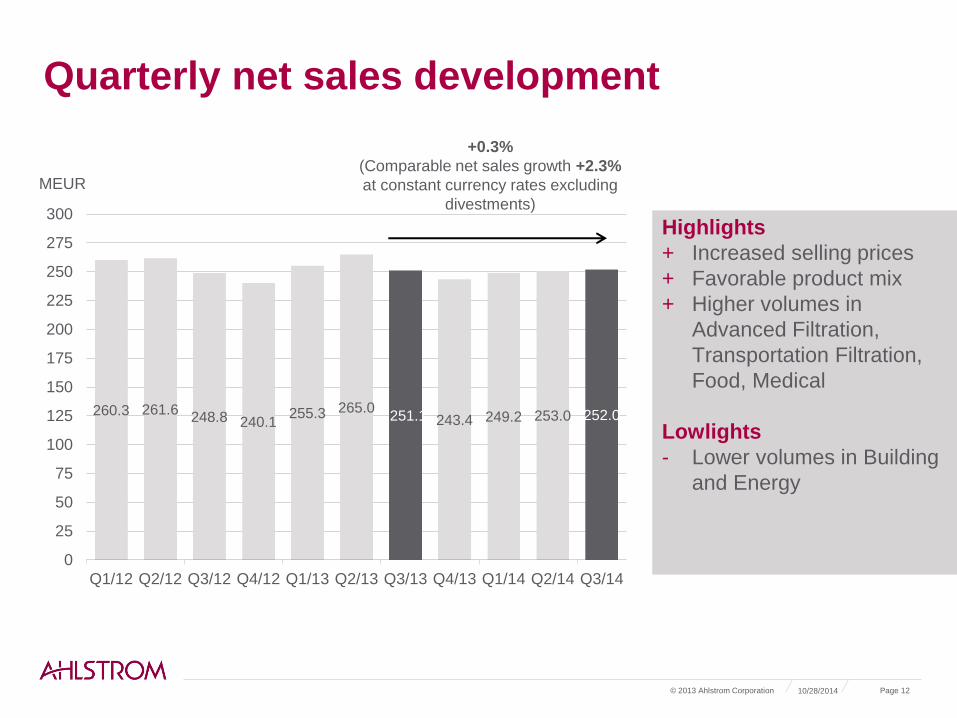
Quarterly net sales development
260.3 261.6 248.8 240.1
255.3 265.0 251.1 243.4 249.2 253.0 252.0
0
25
50
75
100
125
150
175
200
225
250
275
300
Q1/12 Q2/12 Q3/12 Q4/12 Q1/13 Q2/13 Q3/13 Q4/13 Q1/14 Q2/14 Q3/14
MEUR
+0.3%
(Comparable net sales growth +2.3%
at constant currency rates excluding
divestments)
Highlights
+ Increased selling prices
+ Favorable product mix
+ Higher volumes in
Advanced Filtration,
Transportation Filtration,
Food, Medical
Lowlights
- Lower volumes in Building
and Energy
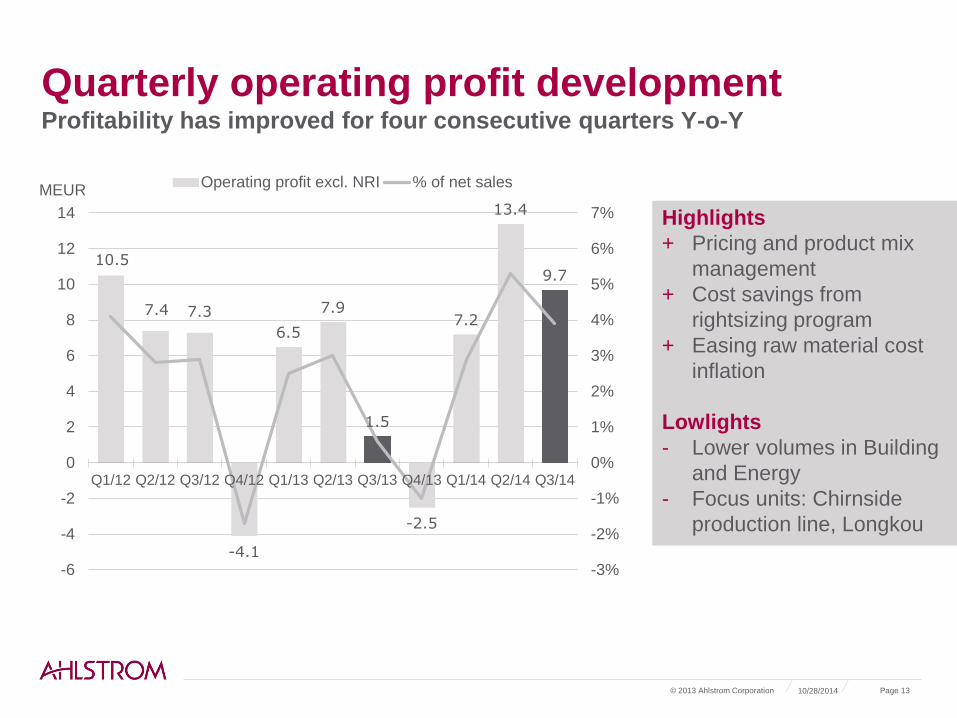
Quarterly operating profit development Profitability has improved for four consecutive quarters Y-o-Y
10.5
7.4 7.3
-4.1
6.5
7.9
1.5
-2.5
7.2
13.4
9.7
-3%
-2%
-1%
0%
1%
2%
3%
4%
5%
6%
7%
-6
-4
-2
0
2
4
6
8
10
12
14
Q1/12 Q2/12 Q3/12 Q4/12 Q1/13 Q2/13 Q3/13 Q4/13 Q1/14 Q2/14 Q3/14
MEUR Operating profit excl. NRI % of net sales
Highlights
+ Pricing and product mix
management
+ Cost savings from
rightsizing program
+ Easing raw material cost
inflation
Lowlights
- Lower volumes in Building
and Energy
- Focus units: Chirnside
production line, Longkou
10/28/2014 © 2013 Ahlstrom Corporation Page 13

Operating profit* supported by higher selling
prices / product mix and lower costs
10/28/2014 © 2013 Ahlstrom Corporation Page 14
1.5
9.7
3.7
1.3 2.4
2.7
0.9
0
1
2
3
4
5
6
7
8
9
10
11
OP excl. NRIQ3/2013
Selling price &mix
Volume RM andEnergy
Other costs FX OP excl. NRIQ3/2014
MEUR
*Continuing operations, excluding non-recurring items
+ Price increases and
favorable product mix
+ Lower raw material
costs in some pulp
grades
+ Cost savings from the
rightsizing program
– Lower sales volumes
in Building and
Energy

Update on rightsizing program
– Target to reach annual costs savings of EUR 39 million in continuing operations by the end
2015
• Approximately EUR 50 million including costs transferred to Munksjö Oyj
– Personnel reductions of about 400 globally
– Ahlstrom to book non-recurring items of approximately EUR 15 million in 2013-15
– Achieved by the end of Q3/2014:
• Approximately EUR 22 million in cost savings have been achieved in continuing operations
• Personnel reductions of approximately 355
• Non-recurring costs: EUR 13.2 million, of which EUR 10.1 million in Q1-Q3/2014
10/28/2014 © 2013 Ahlstrom Corporation Page 15

Income statement
10/28/2014 © 2013 Ahlstrom Corporation Page 16
Q3/2014 Q3/2013
EUR million
Net sales 252.0 251.1
Cost of goods sold -221.8 -218.1
Gross profit
30.2
33.0
Sales, administrative and research & development
expenses
Other income and expenses
-31.6
-12.1
-31.4
-0.1
Operating profit
-13.4
1.5
Operating profit excl. NRI
Net financial expenses
Share of profit / loss of equity accounted investments
9.7
-6.3
-0.2
1.5
-5.4
-0.6
Profit / loss before taxes
Income taxes
Profit / loss for the period from continuing
operations
Earnings per share
-19.9
3.2
-16.7
-0.30
-4.4
0.7
-3.7
-0.09
NRIs: EUR -23.2 million in Q3/14*
SGA costs excluding NRI continued to
decrease in Q3/14, but were impacted
by one-time pension cost in the U.K.
and set-up costs related to the shared
service center in Vilnius
Costs related to new bond issue,
tender of an outstanding bond
Tax credit related to PPT impairment
loss
– *Impairment loss of approximately EUR 11.6
million from the PPT withdrawal. Net of tax
approximately EUR 8 million.
– *Additional depreciation of approximately EUR
5.3 million on the Chirnside production line
– *Additional depreciation of approximately EUR
2.9 million on glassfiber production assets
– *Non-recurring cost of approximately EUR 1.7
million related to the transfer of IT operations

Balance sheet
10/28/2014 © 2013 Ahlstrom Corporation Page 17
Sept. 30, 2014 Dec. 31, 2013
EUR million
Total non-current assets
Inventories
Trade and other receivables
Income tax receivables
Cash and cash equivalents
Assets classified as held for sale and
distribution to owners
Total assets
Total equity
Provisions
Interest bearing loans and borrowings
Employee benefit obligations
Trade and other payables
Others
Liabilities classified as held for sale and
distribution to owners
Total equity and liabilities
614.4
123.6
183.7
1.2
63.8
-
986.8
327.8
11.3
353.5
76.9
207.2
10.0
-
986.8
633.4
106.6
173.0
0.6
38.2
18.9
970.6
341.4
8.3
330.4
76.1
200.2
8.3
5.9
970.6
Gearing
88.4
85.5
– Impact from non-recurring items in
Q3/14
– Includes EUR 100 million hybrid
bond.
– Market value of shareholding in
Munksjö Oyj EUR 42.6 million (Sept.
30, 2014)
– Shareholding in Suominen Oyj
included, shares sold in October
2014
10/28/2014 © 2013 Ahlstrom Corporation Page 18
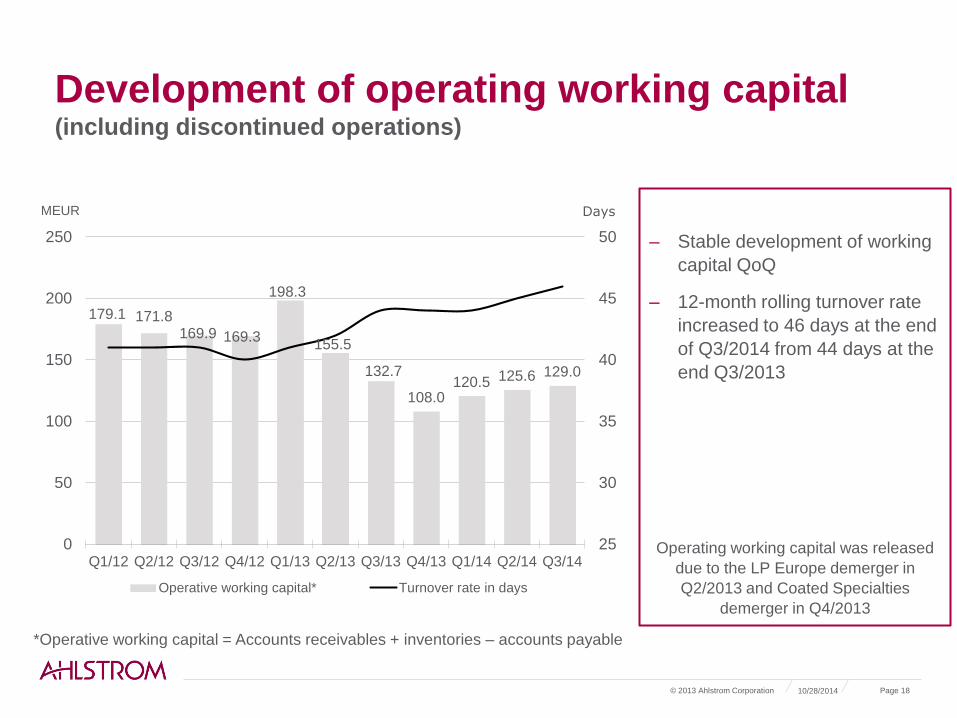
Development of operating working capital (including discontinued operations)
179.1 171.8 169.9 169.3
198.3
155.5
132.7
108.0 120.5 125.6 129.0
25
30
35
40
45
50
0
50
100
150
200
250
Q1/12 Q2/12 Q3/12 Q4/12 Q1/13 Q2/13 Q3/13 Q4/13 Q1/14 Q2/14 Q3/14
Days MEUR
Operative working capital* Turnover rate in days
– Stable development of working
capital QoQ
– 12-month rolling turnover rate
increased to 46 days at the end
of Q3/2014 from 44 days at the
end Q3/2013
Operating working capital was released
due to the LP Europe demerger in
Q2/2013 and Coated Specialties
demerger in Q4/2013
*Operative working capital = Accounts receivables + inventories – accounts payable

Net cash from operating activities (including discontinued operations)
14.6
27.5
21.2 15.5
-21.4
35.5
23.2
3.7
-6.1
14.2 8.4
-25
-20
-15
-10
-5
0
5
10
15
20
25
30
35
40
Q1/12 Q2/12 Q3/12 Q4/12 Q1/13 Q2/13 Q3/13 Q4/13 Q1/14 Q2/14 Q3/14
10/28/2014 © 2013 Ahlstrom Corporation Page 19
MEUR
10/28/2014 © 2013 Ahlstrom Corporation Page 20
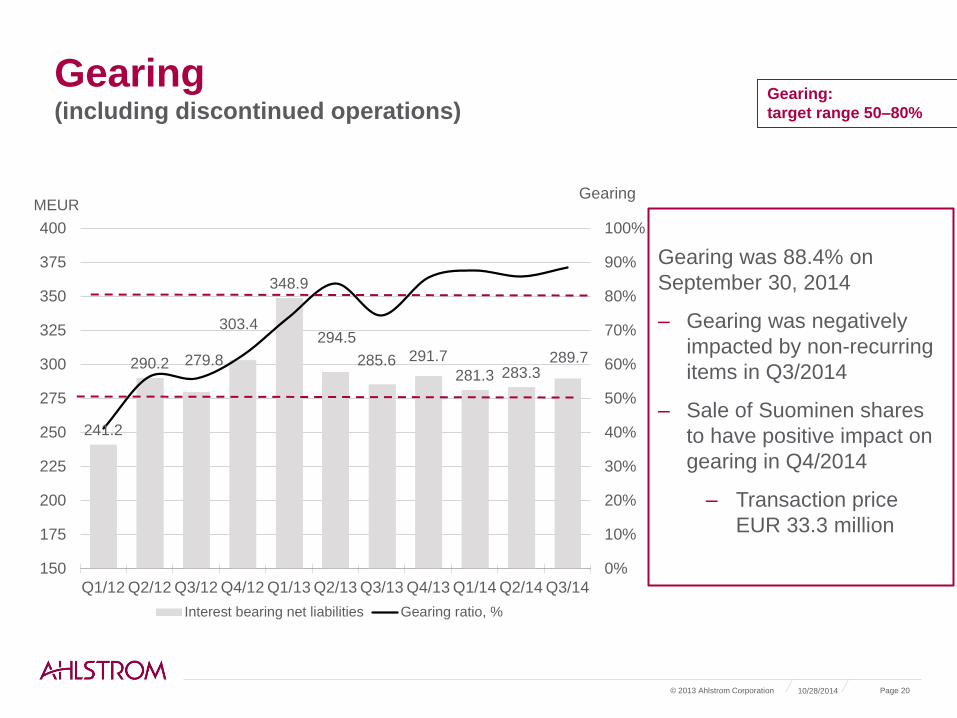
Gearing (including discontinued operations)
Gearing was 88.4% on
September 30, 2014
– Gearing was negatively
impacted by non-recurring
items in Q3/2014
– Sale of Suominen shares
to have positive impact on
gearing in Q4/2014
– Transaction price
EUR 33.3 million
241.2
290.2 279.8
303.4
348.9
294.5
285.6 291.7
281.3 283.3 289.7
0%
10%
20%
30%
40%
50%
60%
70%
80%
90%
100%
150
175
200
225
250
275
300
325
350
375
400
Q1/12 Q2/12 Q3/12 Q4/12 Q1/13 Q2/13 Q3/13 Q4/13 Q1/14 Q2/14 Q3/14
MEUR
Interest bearing net liabilities Gearing ratio, %
Gearing:
target range 50–80%
Gearing

Outlook for 2014
© 2013 Ahlstrom Corporation Page 21
– Ahlstrom narrows its outlook range for net sales and operating profit margin
excluding non-recurring items in 2014
– Net sales are expected to be EUR 960-1,020 million
– Operating profit margin excluding non-recurring items is expected to be 2.5-4% of
net sales
– Previous outlook:
– Net sales are expected to be EUR 930-1,090 million
‒ Operating profit margin excluding non-recurring items is expected to be 2-5% of net
sales
‒ Investments excluding acquisitions are still estimated to amount to
approximately EUR 50 million
10/28/2014

Business area autopsy
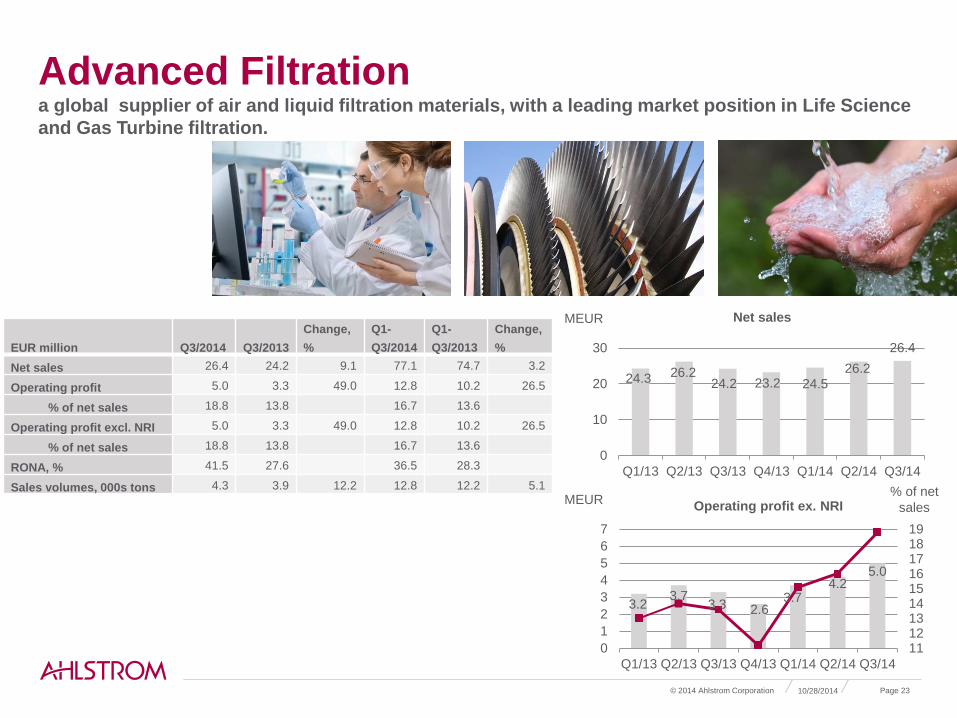
Advanced Filtration a global supplier of air and liquid filtration materials, with a leading market position in Life Science
and Gas Turbine filtration.
© 2014 Ahlstrom Corporation Page 23 10/28/2014
24.3 26.2 24.2 23.2 24.5
26.2
26.4
0
10
20
30
Q1/13 Q2/13 Q3/13 Q4/13 Q1/14 Q2/14 Q3/14
Net sales
3.2 3.7
3.3 2.6 3.7
4.2 5.0
111213141516171819
0
1
2
3
4
5
6
7
Q1/13 Q2/13 Q3/13 Q4/13 Q1/14 Q2/14 Q3/14
Operating profit ex. NRI MEUR
MEUR
% of net
sales
EUR million Q3/2014 Q3/2013
Change,
%
Q1-
Q3/2014
Q1-
Q3/2013
Change,
%
Net sales 26.4 24.2 9.1 77.1 74.7 3.2
Operating profit 5.0 3.3 49.0 12.8 10.2 26.5
% of net sales 18.8 13.8 16.7 13.6
Operating profit excl. NRI 5.0 3.3 49.0 12.8 10.2 26.5
% of net sales 18.8 13.8 16.7 13.6
RONA, % 41.5 27.6 36.5 28.3
Sales volumes, 000s tons 4.3 3.9 12.2 12.8 12.2 5.1

Building and Energy one of the leading players globally for materials used in wall coverings, floorings and windmill
blades
© 2014 Ahlstrom Corporation Page 24 10/28/2014
73.4 71.0 67.5
63.8 68.8 65.5 61.5
0
20
40
60
80
Q1/13 Q2/13 Q3/13 Q4/13 Q1/14 Q2/14 Q3/14
Net sales
2.5 1.6
-0.4
-0.9 1.3
2.0
-2.3
-4-3-2-101234
-4-3-2-101234
Q1/13 Q2/13 Q3/13 Q4/13 Q1/14 Q2/14 Q3/14
Operating profit ex. NRI
% of net
sales MEUR
MEUR
EUR million Q3/2014 Q3/2013
Change,
%
Q1-
Q3/2014
Q1-
Q3/2013
Change,
%
Net sales 61.5 67.5 -8.9 195.9 212.0 -7.6
Operating profit -4.5 -0.4 N/A -0.8 3.6 N/A
% of net sales -7.4 -0.6 -0.4 1.7
Operating profit excl.
NRI -2.3 -0.4 N/A 1.0 3.6 -73.1
% of net sales -3.8 -0.6 0.5 1.7
RONA, % -17.8 -1.8 -1.1 5.4
Sales volumes, 000s
tons 32.1 35.5 -9.7 101.9 112.7 -9.6

Food one of the leading players globally for materials used in tea bags, coffee pods, molds, trays, food
packaging and masking tape
© 2014 Ahlstrom Corporation Page 25 10/28/2014
60.1 63.7 58.1 61.8 59.0 58.4 60.6
0
20
40
60
80
Q1/13 Q2/13 Q3/13 Q4/13 Q1/14 Q2/14 Q3/14
Net sales
0.8 1.4
0.3
1.7 2.3 2.5
4.2
0
1
2
3
4
5
6
7
0
1
2
3
4
5
6
7
Q1/13 Q2/13 Q3/13 Q4/13 Q1/14 Q2/14 Q3/14
Operating profit ex. NRI % of net
sales MEUR
MEUR
EUR million Q3/2014 Q3/2013
Change,
%
Q1-
Q3/2014
Q1-
Q3/2013
Change,
%
Net sales 60.6 58.1 4.2 178.0 181.9 -2.1
Operating profit -1.1 0.3 N/A 2.9 1.5 96.2
% of net sales -1.8 0.5 1.6 0.8
Operating profit excl. NRI 4.2 0.3 N/A 9.0 2.5 N/A
% of net sales 6.9 0.5 5.1 1.4
RONA, % -4.8 1.4 4.4 2.1
Sales volumes, 000s tons 22.4 21.3 5.0 67.8 67.0 1.2

Medical one of the leading players globally for materials used in medical gowns and drapes, apparel and
sterile barrier systems
© 2014 Ahlstrom Corporation Page 26 10/28/2014
36.5 38.5
34.6 33.3 30.1
32.8 33.9
0
10
20
30
40
Q1/13 Q2/13 Q3/13 Q4/13 Q1/14 Q2/14 Q3/14
Net sales
0.0 0.3
-1.6 -1.8 -1.8 -0.8
-0.3
-8
-6
-4
-2
0
2
-2
-1
0
1
2
3
Q1/13 Q2/13 Q3/13 Q4/13 Q1/14 Q2/14 Q3/14
Operating profit ex. NRI
% of net
sales MEUR
MEUR
EUR million Q3/2014 Q3/2013
Change,
%
Q1-
Q3/2014
Q1-
Q3/2013
Change,
%
Net sales 33.9 34.6 -1.9 96.9 109.5 -11.5
Operating profit -0.3 -1.6 79.0 -4.5 -1.3 N/A
% of net sales -1.0 -4.7 -4.7 -1.2
Operating profit excl.
NRI -0.3 -1.6 80.0 -3.0 -1.3 -130.6
% of net sales -1.0 -4.7 -3.1 -1.2
RONA, % -1.8 -8.0 -7.9 -2.1
Sales volumes, 000s
tons 9.9 9.4 4.7 29.1 30.0 -3.0

Transportation Filtration the global leader in transportation filtration materials
© 2014 Ahlstrom Corporation Page 27 10/28/2014
74.6 81.0 77.7
73.4 77.9
82.9 83.0
0
20
40
60
80
100
Q1/13 Q2/13 Q3/13 Q4/13 Q1/14 Q2/14 Q3/14
Net sales
4.1 4.6 3.6
1.9
5.0
7.3 7.3
0
2
4
6
8
10
0
2
4
6
8
10
Q1/13 Q2/13 Q3/13 Q4/13 Q1/14 Q2/14 Q3/14
Operating profit ex. NRI % of net
sales MEUR
MEUR
EUR million Q3/2014 Q3/2013
Change,
%
Q1-
Q3/2014
Q1-
Q3/2013
Change,
%
Net sales 83.0 77.7 6.8 243.8 233.3 4.5
Operating profit 7.3 3.6 104.4 19.5 12.3 59.0
% of net sales 8.8 4.6 8.0 5.3
Operating profit excl. NRI 7.3 3.6 104.4 19.5 12.3 59.0
% of net sales 8.8 4.6 8.0 5.3
RONA, % 18.7 9.5 17.0 11.0
Sales volumes, 000s tons 28.5 28.1 1.3 85.4 83.5 2.3

Strategic agenda for 2014-2020

Strategy statement
10/28/2014 © 2014 Ahlstrom Corporation Page 29
We will grow with a high
performance product offering for
a clean and healthy environment

We have successfully executed our
transformation strategy during 2009-2013
10/28/2014 © 2014 Ahlstrom Corporation Page 30
2009 2013
Demerger of Label and
Processing business
Divestment of small non-
core businesses
One Ahlstrom,
common processes
Focus on
key customers
and Asia
Divestment of
Home and
Personal business
New
Ahlstrom

Food
Beverage
Materials used in food and
beverage packaging, water
filtration and other consumer
goods
Medical Care
Life Science
Materials used in medical fabrics,
diagnostics as well as laboratory
and life science applications
Transportation Materials used in automotive and
heavy-duty air, oil and fuel
filtration, reinforcements and
other transportation applications
Energy
Environment
Materials used in energy
production, gas turbines and
other environment-specific
applications
Building
Materials used in construction
and decoration applications such
as wallcovers, flooring and
masking tape
We have selected our key markets
10/28/2014 © 2014 Ahlstrom Corporation Page 31
Customer markets Applications Served by
Business
areas:
Advanced
Filtration
Building and
Energy
Food
Medical
Transportation
Filtration

10/28/2014 © 2014 Ahlstrom Corporation Page 32
Global megatrends drive our growth
Resource scarcity, energy and environment
• We design products that minimize environmental impacts
• We are the global leader in environmentally friendly transportation, offering a
comprehensive range of filtration media enable reduced emissions
• Our production processes allow more efficient use of raw materials, energy
and water
Emerging needs in healthcare
• We focus on laboratory and point-of-care medical testing and diagnostics
• We offer a comprehensive range of single-use medical materials that enable
safe medical care
Demographics and urbanization
• We are a leading provider of high quality functional materials for construction
and home decoration
• We provide safe, convenient and innovative food and beverage packaging

10/28/2014 © 2014 Ahlstrom Corporation Page 33
Our strategic enablers
A high performance product offering for a clean and healthy environment
Technology and manufacturing platforms Unique know-how of fibers, chemistry and materials technology
Flexible manufacturing capabilities
Environmentally sound technologies utilizing renewable materials
Co-creation and open innovation Competent people with a passion for results
Differentiated products to meet specific customer needs
Deep partnerships with customers, partners and suppliers
Global reach and local insights Global operations, local sales and technical service
Global product offering, customized to market needs
Resource-efficient value chains

10/28/2014 © 2014 Ahlstrom Corporation Page 34
We have sustainable and profitable
growth opportunities
CURRENT AND FUTURE
BUSINESS – IMPACT
ON SOCIETY
Clean drinking water
Clean air
Energy efficiency
Well-being and quality of life
Safe medical care
Light and durable structures
GROWTH 2020: HIGH
GROWTH AREAS
Clean Water
Medical Diagnostics
Composites
CURRENT BUSINESS
Laboratory and life science
Wallcovers
Specialty reinforcements
Medical fabrics
Food and beverages
packaging
Air, oil, and fuel filtration
Tapes
10/28/2014 © 2014 Ahlstrom Corporation Page 35
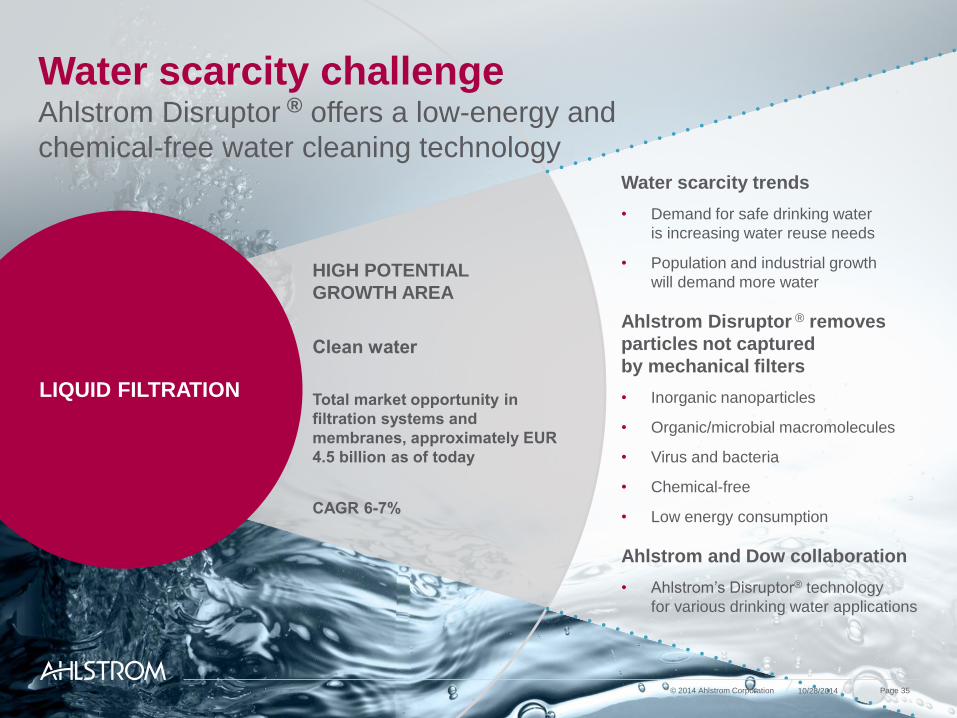
Water scarcity challenge Ahlstrom Disruptor ® offers a low-energy and
chemical-free water cleaning technology Water scarcity trends
• Demand for safe drinking water
is increasing water reuse needs
• Population and industrial growth
will demand more water
Ahlstrom Disruptor ® removes
particles not captured
by mechanical filters
• Inorganic nanoparticles
• Organic/microbial macromolecules
• Virus and bacteria
• Chemical-free
• Low energy consumption
Ahlstrom and Dow collaboration
• Ahlstrom’s Disruptor® technology
for various drinking water applications
LIQUID FILTRATION
HIGH POTENTIAL
GROWTH AREA
Clean water
Total market opportunity in
filtration systems and
membranes, approximately EUR
4.5 billion as of today
CAGR 6-7%

10/28/2014 © 2014 Ahlstrom Corporation Page 36
Medical diagnostics challenge Fiber-based components enable
improved specimen collection Market and technology trends
• Medical diagnostics grow
due to e.g. aging population
• Need for personalized medical
treatment, diagnostics at home
• Increased focus on new technology
development in diagnostics
• Regulatory development favoring
point-of-care (POC) diagnostics
Ahlstrom offers
• Easy sample collections and handling
• Cost-effective diagnostics
Alliances and M&A
• In addition to media, expand
offering towards device solutions
• Partnering with key customers
HIGH POTENTIAL
GROWTH AREA
Medical Diagnostics
Total market opportunity in
medical diagnostics and specimen
collection approximately EUR 1.6
billion as today
CAGR 5-6%
LABORATORY
AND LIFE SCIENCE
APPLICATIONS

TRANSPORTATION
AND CONSTRUCTION
APPLICATIONS
10/28/2014 © 2014 Ahlstrom Corporation Page 37
Energy efficiency challenge Lightweight, bio-based composites are gaining
market share from steel and aluminium
HIGH POTENTIAL
GROWTH AREA
Composites
Total market opportunity in
transportation and construction
related applications
approximately EUR 21 billion
as of today
CAGR 7-9%
Growth drivers
• Growing middle-class and wealth
in emerging countries drive demand
for cars, construction, infrastructure
and consumer goods
• Energy efficiency requirements and
more stringent CO2 emission regulation
drive demand for lightweight materials
• Sustainability requirements drive demand
for bio-based materials and recyclability
Demand for composite materials
is growing
• Composites are gaining market share
due to benefits such as more efficient
construction process, corrosion resistance,
lighter weight, multi-functionality, and better
weight-strength ratio
Ahlstrom is reinforcing product
& technology development and
preparing entry into new segments
• Bio-composites for transportation
and construction applications
Alliances and M&A

Ahlstrom
is a high
performance
materials
company,
partnering
with leading
businesses
around the
world to help
them stay ahead.
Act
responsibly
Create
value
Learn
and renew
Inspiring people,
passionate about new ideas, growing with our customers
Performance, Improvement, Certainty, Simplicity
Core
Purpose Values
Vision
Brand
Promise
10/28/2014 © 2014 Ahlstrom Corporation Page 38

Long-term financial targets

Long-term financial targets over the economic cycle
10/28/2014 © 2014 Ahlstrom Corporation Page 40
Net sales At least 5% underlying growth
Sales from new
products * At least 20%
Operating profit **
7% of net sales by 2016 • Implies ROCE 13%
10% of net sales beyond 2016
• Implies ROCE 15%
Gearing To be maintained within 50–80% range
*Developed in the last three years
**Excluding non-recurring items
Page
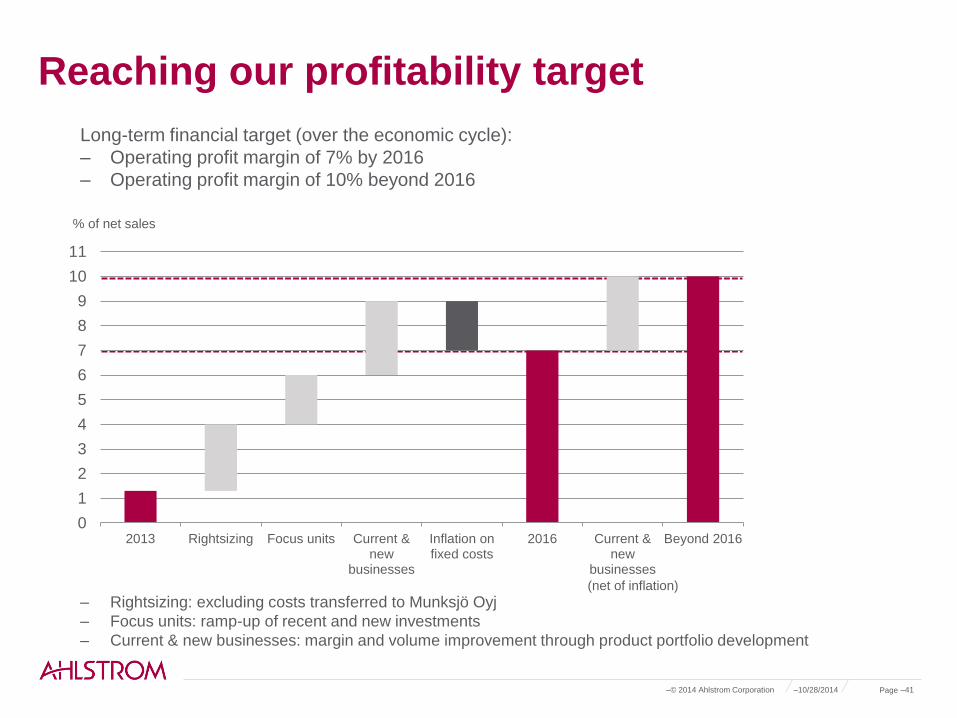
Reaching our profitability target
–10/28/2014 –© 2014 Ahlstrom Corporation –41
0
1
2
3
4
5
6
7
8
9
10
11
2013 Rightsizing Focus units Current &new
businesses
Inflation onfixed costs
2016 Current &new
businesses
Beyond 2016
Long-term financial target (over the economic cycle):
‒ Operating profit margin of 7% by 2016
‒ Operating profit margin of 10% beyond 2016
‒ Rightsizing: excluding costs transferred to Munksjö Oyj
‒ Focus units: ramp-up of recent and new investments
‒ Current & new businesses: margin and volume improvement through product portfolio development
% of net sales
(net of inflation)

Performance against long-term targets
10/28/2014 © 2014 Ahlstrom Corporation Page 42
2013 2012 2011 2010 2009
Net sales 1,336.1 1,598.6 1,852.6 1,894.2 1,596.1
Net sales - continuing operations 1,014.8 1,010.8 1,025.8
Net sales from new products 13.0 11.0 18.0 N/A N/A
Operating profit** 28.6 56.5 55.8 74.2 39.8
% of net sales 2.1 3.5 3.0 3.9 2.5
Operating profit - continuing
operations** 13.4 21.1 27.6
% of net sales 1.3 2.1 2.7
Gearing 85.5 62.5 40.9 46.9 57.7
*Developed in the last three years
**Excluding non-recurring items

‒ Aim is to pay a dividend of not less than
one third of net cash from operating
activities after operative investments,
calculated as three-year rolling average.
0.55 0.88 0.87
0.63 0.30
0.43
0,0
0,5
1,0
1,5
2,0
2009 2010 2011* 2012 2013
Dividend per share (€)
26
41
61
29
14.0
0
25
50
75
2009 2010 2011 2012 2013
Total amount of dividends paid (EUR million)
Dividend policy
*Consisting of a dividend of EUR 0.87 per share and an extra
dividend of EUR 0.43 per share.
10/28/2014 © 2014 Ahlstrom Corporation Page 43
– The AGM held on March 25, 2014 resolved that
dividend in the aggregate maximum amount of
EUR 14.0 million, or EUR 0.30 per share, shall be
paid as follows:
– (i) Dividend payable in Munksjö Oyj’s
shares: Each 26 Ahlstrom’s shares entitle
their holder to receive 1 share in Munksjö
Oyj as a dividend. Ahlstrom shall distribute
to its shareholders as dividend a maximum
of 1,795,023 shares of Munksjö.
– (ii) Dividend payable in cash: A dividend of
approximately EUR 0.09 per share be paid
in cash from the retained earnings. As per
January 30, 2014, the number of shares of
the Company amounts to 46,670,608
based on which the maximum amount to be
distributed as dividend payable in cash
would be approximately EUR 4.3 million.
– Ahlstrom intends to pay dividends in cash and
Munksjö shares also in the future.

Shareholders
5.1 1.1 1.7
2.4
14.8
20.9
54.0
Public sector institutions
Financial and insurance institutions
Non-profit institutions
Nominee registered
Corporations
Foreign holders
Finnish private investors
Major shareholders (30/9/2014)
1. Vimpu Intressenter Ab 11.0%
2. AC Invest Six BV 10.2%
3. Varma Mutual Pension
Insurance Company 3.28%
4. Huber Mona Lilly 2.68%
5. Tracewski Jacqueline 2.16%
6. Nahi Kai Anders 1.71%
7. Kylmälä Tauno Kim 1.65%
8. Lund Niklas Roland 1.49%
9. Studer Anneli 1.43%
10. Kylmälä Kasper Johannes 1.40%
Shareholder structure (30/9/2014)
In total 46.7 million shares outstanding
Ahlström family members hold approximately 2/3 of the
shares*
*Ahlstrom Corporation is not aware of any shareholders’
agreements relating to its share
10/28/2014 © 2014 Ahlstrom Corporation Page 44
Sustainability
10/28/2014 © 2014 Ahlstrom Corporation Page 45
Link to Ahlstrom sustainability report 2013:
http://www.ahlstrom.com/globalassets/files/publications/sustainability-
report-2013.pdf

Sustainability as a key driver in product development
EcoDesign approach is based on
life-cycle assessment
The target is to minimize the
environmental impacts of a product
over its whole life-cycle
EcoDesign approach is a
continuous improvement process
focusing on:
• Technical performance
• Cost efficiency
• Environment
© 2014 Ahlstrom Corporation Page 46 10/28/2014

Our approach to sustainability
PRODUCT
DEVELOPMENT RESPONSIBLE
SOURCING
MANUFACTURING
SALES AND
MARKETING
– Minimized
environmental
impacts of the
products over
their life cycle
(LCA)
– Social impacts
of products
– Certified fiber
sources
– Supplier Code of
Conduct
– Water use
– Waste
minimization
– Resource
efficiency
– Energy use
– Minimized
emissions to air,
water and soil
– Product
stewardship
– Sustainable
value
propositions
– Helping
customers to
solve their
sustainability
challenges
Safety in workplace, human rights, leadership and management practices
Economic, social and environmental focus areas in Ahlstrom's value chain
10/28/2014 © 2014 Ahlstrom Corporation Page 47
Key financials 2009-2013

LP Europe included until May
27, 2013. Brazilian parts of
Label and Processing and
Home and Personal and two
production lines in Osnabrûck
included throughout.
Includes Home and
Personal, Label and
Processing
Includes Label and
Processing,
Brazilian part of
Home and
Personal
1,596.1
1,031.1 1,025.8 1,010.8 1,014.8
0
200
400
600
800
1000
1200
1400
1600
1800
2000
2009 2010 2011 2012 2013
Continuing ops. Discontinued ops.
10/28/2014 © 2014 Ahlstrom Corporation Page 49
Net sales development More focused portfolio
MEUR

123.2
79.3
70.3 74.1 64.6
0
1
2
3
4
5
6
7
8
0
20
40
60
80
100
120
140
160
2009 2010 2011 2012* 2013
Continuing ops. Discontinued ops. % of net sales (Cont. ops.)
%
10/28/2014 © 2014 Ahlstrom Corporation Page 50
EBITDA and operating profit
39.8
74.2
27.6
21.1 13.4
0
1
2
3
4
5
6
7
8
0
10
20
30
40
50
60
70
80
2009 2010 2011 2012* 2013
Continuing ops. Discontinued ops. % of net sales (Cont. ops.)
MEUR
EBITDA Operating profit ex. NRI
*2012 figures are restated and 2013 figures reported according to new
IFRS standard on employee benefits.
MEUR %

Net cash from operating activities (including discontinued operations)
209.6
167.5
83.7 78.7
41.0
0
25
50
75
100
125
150
175
200
225
2009 2010 2011 2012 2013
MEUR
10/28/2014 © 2014 Ahlstrom Corporation Page 51
Operative working capital
reduction project in 2009-
2010
Cash flow
stabilized following
the project
- Negative cash flow in
Q1/2013 due to increase in
operative working capital
- Adjustment of operative
working capital had a
negative impact on cash
flow in Q4/2013

10/28/2014 © 2014 Ahlstrom Corporation Page 52
Gearing ratio (including discontinued operations)
395.9
330.1
237.8
303.4
348.9
294.5 285.6 291.7
0%
10%
20%
30%
40%
50%
60%
70%
80%
90%
100%
0
50
100
150
200
250
300
350
400
450
500
2009 2010 2011 2012 Q1/13 Q2/13 Q3/13 Q4/13
MEUR
Interest bearing net liabilities Gearing ratio, %
Gearing ratio:
target range 50–80%
Gearing
Gearing ratio negatively affected in 2013 by:
– Impairment losses in discontinued operations
– Fair valuation of Munksjö Oyj shares held by Ahlstrom
– Adjustment of operative working capital
Net debt lower due to the Label and Processing demerger

Investments 2008-2012
63.8
51.1 49.8
74.1 76.1
50
63.8 62.3 50.8
95,4
76.1
0
20
40
60
80
100
120
2009 2010 2011* 2012* 2013* 2014E
Capex, excl. acquisitions Capex, incl. acquisitions Depreciation
– Annual maintenance
investments approximately
EUR 25-30 million
– Major acquisitions
– 2010: Filtration plant in
Binzhou, China from
Purico Group
– 2012: Munktell Filter AB
MEUR
10/28/2014 © 2014 Ahlstrom Corporation Page 53
*Continuing operations

Personnel (number of employees, year-end)
5841
3792 3918 3829 3536
0
1000
2000
3000
4000
5000
6000
7000
2009 2010 2011 2012 2013
Continuing ops. Discontinued ops.
10/28/2014 © 2014 Ahlstrom Corporation Page 54

Debt financing
10/28/2014 © 2014 Ahlstrom Corporation Page 55

10/28/2014 © 2014 Ahlstrom Corporation Page 56
Debt structure Main debt securities and facilities
EUR millions Total amount Outstanding* Interest rate Maturity
Bond issued in 2014 EUR 100 EUR 100 4.125% 2019
Bond issued in 2010 EUR 100 EUR 54 4.50% 2015
Hybrid bond** issued in
2013 EUR 100 EUR 100 7.875% Perpetual***
Revolving credit facility EUR 200 EUR 0 - 2016
Commercial paper
program EUR 300
EUR 77 - - * September 30, 2014
**Subordinated to debt, treated
as equity
***Callable in 2017
As of September 30, 2014, Ahlstrom's interest-bearing liabilities amounted to EUR
353.5 million (EUR 330.4 million at the end of 2013).
– The capital weighted average interest rate was 3.85%
– The modified interest rate duration of the loan portfolio (average interest rate
fixing period) was 19.8 months
– The average maturity of the long-term loan portfolio and committed credit
facilities was 31.6 months
44%
22%
33%
1 %
Debt structure (interest-bearing liabilities of EUR 353.5 million as Sept. 30, 2014)
Bonds
Commercial papers
Loans from banks and financial institutions
Commitments under financial leasesMain financial arrangements
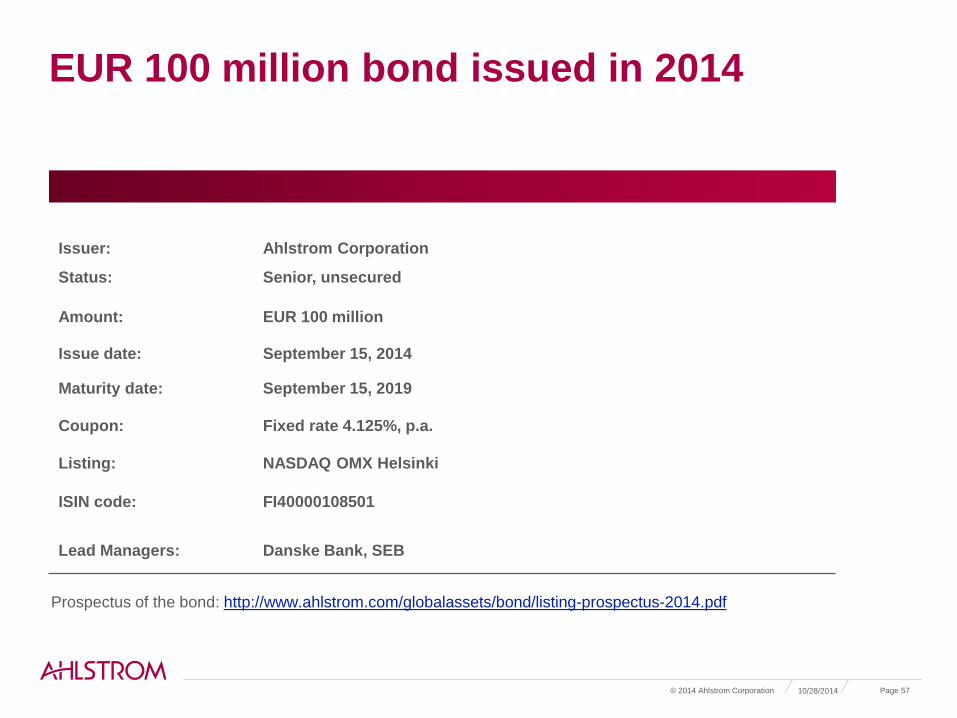
EUR 100 million bond issued in 2014
Issuer:
Ahlstrom Corporation
Status: Senior, unsecured
Amount: EUR 100 million
Issue date: September 15, 2014
Maturity date: September 15, 2019
Coupon: Fixed rate 4.125%, p.a.
Listing: NASDAQ OMX Helsinki
ISIN code: FI40000108501
Lead Managers: Danske Bank, SEB
10/28/2014 © 2014 Ahlstrom Corporation Page 57
Prospectus of the bond: http://www.ahlstrom.com/globalassets/bond/listing-prospectus-2014.pdf

EUR 100 million bond issued in 2010
EUR 45.8 million tendered in 2014, EUR 54.2 million maturing in 2015
Issuer:
Ahlstrom Corporation
Status: Senior, unsecured
Amount: EUR 100 million
Issue date: November 10, 2010
Maturity date: November 10, 2015
Coupon: Fixed rate 4.50%, p.a.
Listing: NASDAQ OMX Helsinki
ISIN code: FI4000019120
Lead Managers: Nordea Markets, Pohjola Bank
10/28/2014 © 2014 Ahlstrom Corporation Page 58
Prospectus of the bond: http://www.ahlstrom.com/Global/files/Investors-other-files/Listing-Prospectus-Ahlstrom-FINAL-
15122010.pdf

Hybrid bond*
– EUR 100 million hybrid bond
• Issued in October 2013
• Pays an annual coupon of 7.875%
• Callable in October 2017
*A hybrid bond is an instrument which is subordinated to the company's other debt obligations and which is treated as equity in the IFRS financial statements. Hybrid bonds do not confer to their holders the right to vote at shareholder meetings and do not dilute the holdings of the current shareholders.
10/28/2014 © 2014 Ahlstrom Corporation Page 59

Maturity profile of medium/long-term credit
facilities
10/28/2014 © 2013 Ahlstrom Corporation Page 60
– Total liquidity, including cash and
unused committed credit facilities
was EUR 317.6 million at the
end of Q3/2014
– In addition, Ahlstrom had
undrawn uncommitted credit
facilities and cash pool overdraft
limits of EUR 144.4 million
available
0
25
50
75
100
125
150
175
200
225
2014 2015 2016 2017 2018 2019
Mid-term / long-term loans Undrawn credit facilities
EUR 100 million bond (Issued in 2010) EUR 100 million bond (Issued in 2014)

Debt servicing figures (including discontinued operations)
10/28/2014 © 2014 Ahlstrom Corporation Page 61
0
1
2
3
4
2009 2010 2011 2012 2013
Net debt/Ebitda
0
1
2
3
4
5
6
7
8
9
2009 2010 2011 2012 2013
Ebitda/interest coverage

Interest-bearing loans and borrowings
0
50
100
150
200
250
300
200
9
201
0
201
1
201
2
201
3
Long-term loans EUR
million
10/28/2014 © 2014 Ahlstrom Corporation Page 62
0
20
40
60
80
100
120
140
160
180
200
2009 2010 2011 2012 2013
Current portion of non-current loans Other short-term debt
Commercial papers
EUR
million Short-term loans

Global sourcing

Total costs EUR 950 mil. (excl. NRI) in 2013*
‒ Natural fibers
• Pulp (NBSK, BHKP, specialty pulps)
• Abaca
• Viscose rayon
‒ Synthetic fibers
• Polyester
• Polypropylene
‒ Chemicals
• Latex
• Starch
• Liquid solvents
‒ Main sources of energy
• Natural gas
• Electricity
10/28/2014 © 2014 Ahlstrom Corporation Page 64
23%
13%
18% 9% 3%
23%
14%
Total costs*
Wood pulp, other natural fibers Synthetic fibers
Chemicals Energy
Delivery costs Production direct and indirect costs
SGA costs
*Continuing operations

48%
35%
12%
2% 2% 1%
Raw materials (595,327 tons in total)*
Woodpulp ChemicalsSynthetic fibers PackagingAnnual fibers Recycled paper
10/28/2014 © 2014 Ahlstrom Corporation Page 65
Raw materials used in 2013*
Key raw materials 2013*
Wood pulp Tons 293,000
Synthetic fibers Tons 69,582
Chemicals Tons 212,850
– 83% of the fiber material used in 2013 was
from renewable sources
*Continuing operations

10/28/2014 © 2014 Ahlstrom Corporation Page 66
Energy usage in 2013*
Fuels 2013*
Coal TJ 471
Oil TJ 200
Gas TJ 3,928
Solid Waste TJ 755
Other TJ 343
Total 5,697
Electricity 2013*
Purchased TJ 1,785
Own production TJ 190
Other TJ 0
Total 1,975
Process heat 2013*
Steam, own
production TJ 3,296
Steam,
purhcased TJ 1,054
Gas (IR) TJ 1,613
Electric energy (IR) TJ 13
Total 5,975
*continuing operations
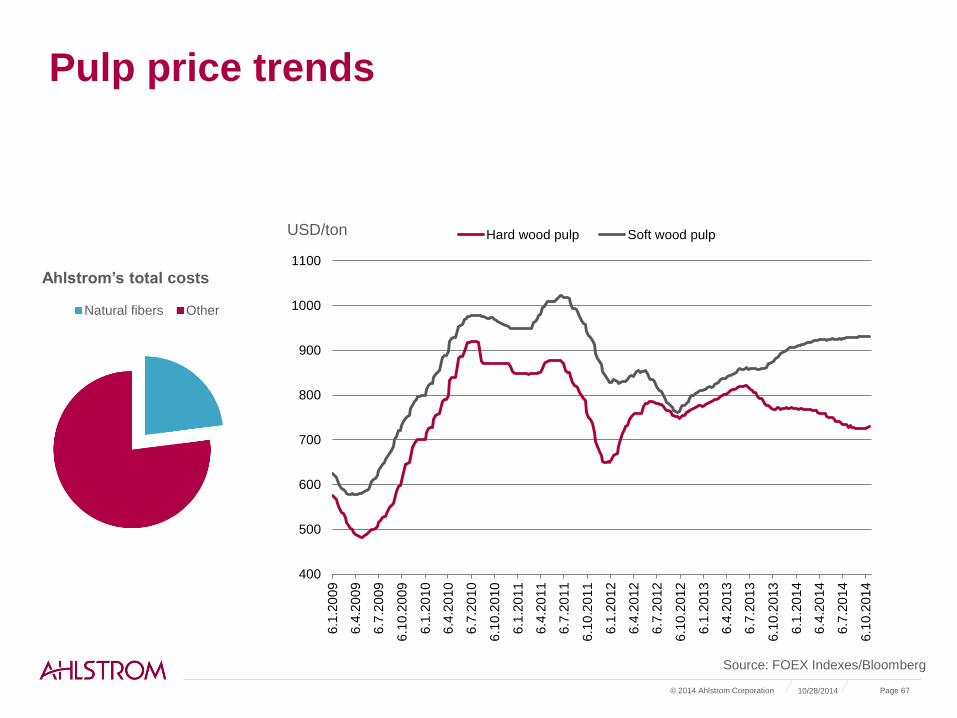
Pulp price trends
10/28/2014 © 2014 Ahlstrom Corporation Page 67
Ahlstrom’s total costs
Natural fibers Other
USD/ton
Source: FOEX Indexes/Bloomberg
400
500
600
700
800
900
1000
1100
6.1
.20
09
6.4
.20
09
6.7
.20
09
6.1
0.2
009
6.1
.20
10
6.4
.20
10
6.7
.20
10
6.1
0.2
010
6.1
.20
11
6.4
.20
11
6.7
.20
11
6.1
0.2
011
6.1
.20
12
6.4
.20
12
6.7
.20
12
6.1
0.2
012
6.1
.20
13
6.4
.20
13
6.7
.20
13
6.1
0.2
013
6.1
.20
14
6.4
.20
14
6.7
.20
14
6.1
0.2
014
Hard wood pulp Soft wood pulp

Thank you
For further information:
Juho Erkheikki
Manager, Financial Communications & Investor Relations
T: +358 50 413 4583
10/28/2014 © 2014 Ahlstrom Corporation Page 68