Embed Size (px)
Citation preview
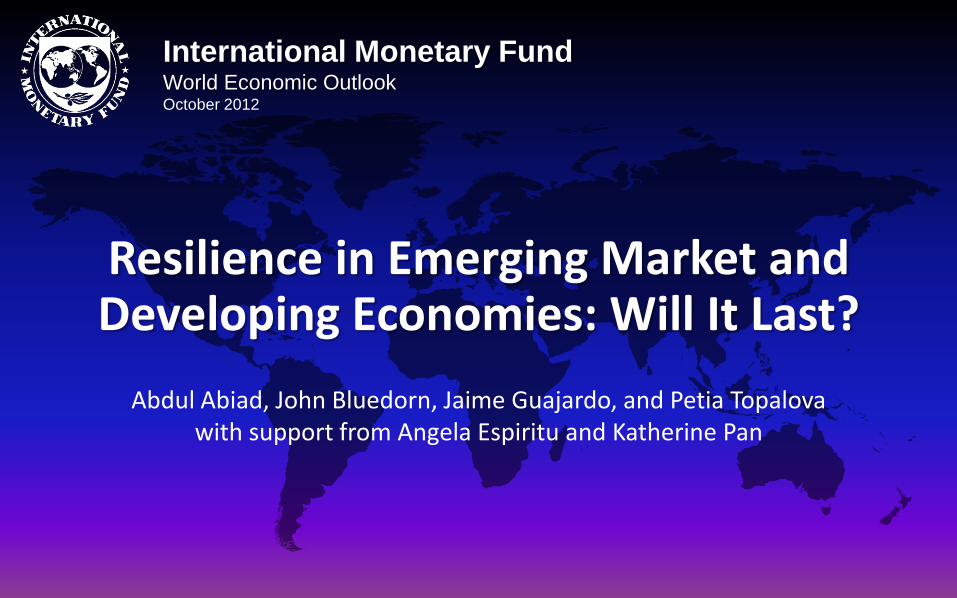
International Monetary Fund World Economic Outlook October 2012
Resilience in Emerging Market and Developing Economies: Will It Last?
Abdul Abiad, John Bluedorn, Jaime Guajardo, and Petia Topalova with support from Angela Espiritu and Katherine Pan
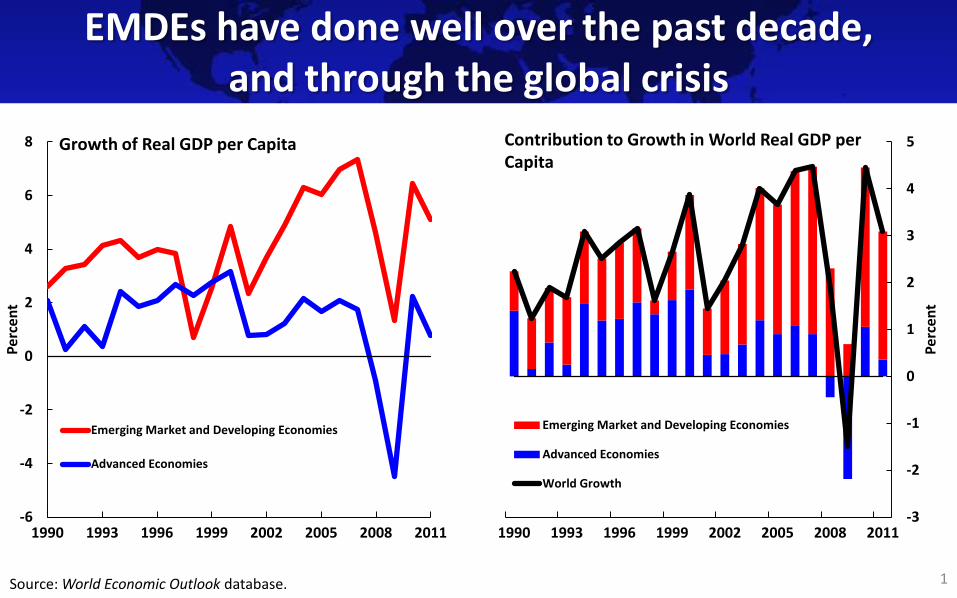
EMDEs have done well over the past decade, and through the global crisis
1
-6
-4
-2
0
2
4
6
8
1990 1993 1996 1999 2002 2005 2008 2011
Per
cen
t
Growth of Real GDP per Capita
Emerging Market and Developing Economies
Advanced Economies
-3
-2
-1
0
1
2
3
4
5
1990 1993 1996 1999 2002 2005 2008 2011
Per
cen
t
Emerging Market and Developing Economies
Advanced Economies
World Growth
Contribution to Growth in World Real GDP per Capita
Source: World Economic Outlook database.
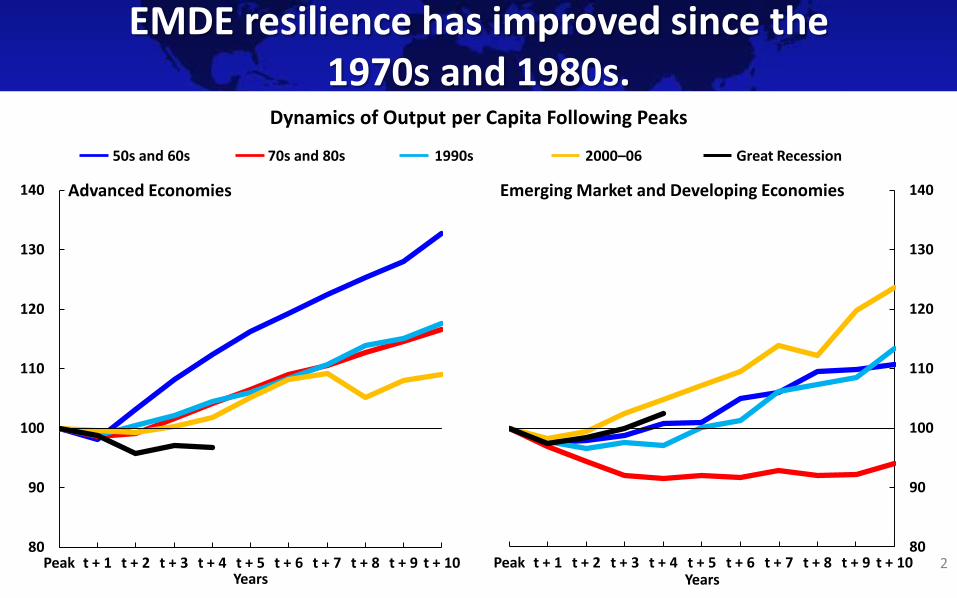
EMDE resilience has improved since the 1970s and 1980s.
2 80
90
100
110
120
130
140
Peak t + 1 t + 2 t + 3 t + 4 t + 5 t + 6 t + 7 t + 8 t + 9 t + 10
Emerging Market and Developing Economies
80
90
100
110
120
130
140
Peak t + 1 t + 2 t + 3 t + 4 t + 5 t + 6 t + 7 t + 8 t + 9 t + 10
Advanced Economies
Dynamics of Output per Capita Following Peaks
50s and 60s 70s and 80s 1990s Great Recession 2000–06
Years Years
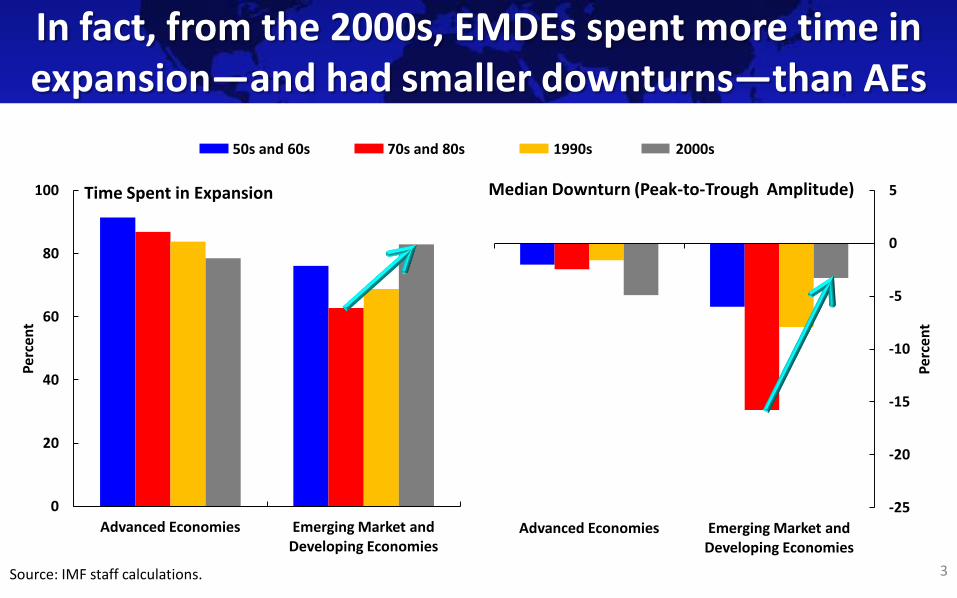
In fact, from the 2000s, EMDEs spent more time in expansion—and had smaller downturns—than AEs
3
0
20
40
60
80
100
Advanced Economies Emerging Market and Developing Economies
Per
cen
t
Time Spent in Expansion
-25
-20
-15
-10
-5
0
5
Advanced Economies Emerging Market and Developing Economies
Per
cen
t
Median Downturn (Peak-to-Trough Amplitude)
50s and 60s 70s and 80s 1990s 2000s
Source: IMF staff calculations.
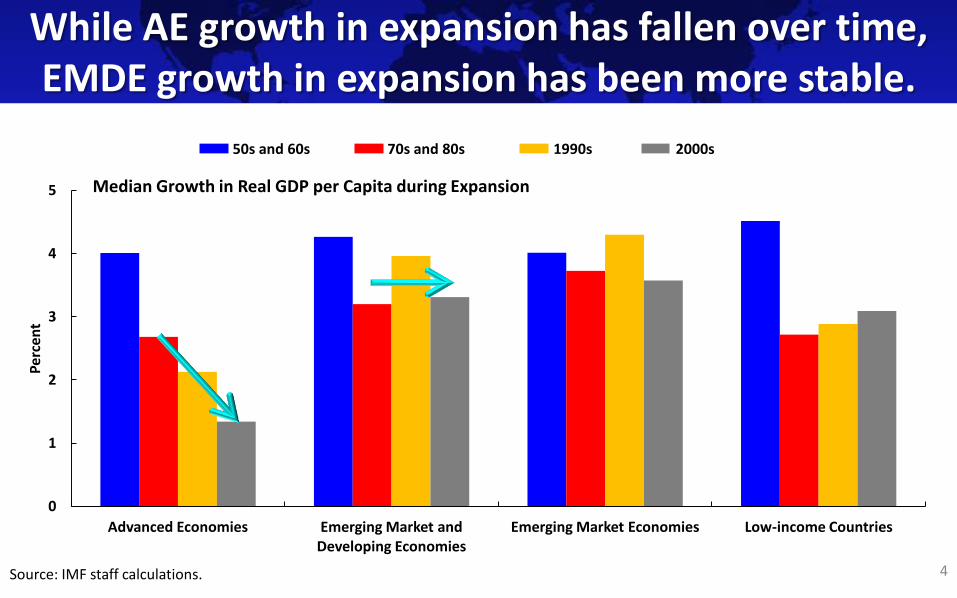
While AE growth in expansion has fallen over time, EMDE growth in expansion has been more stable.
4
0
1
2
3
4
5
Advanced Economies Emerging Market and Developing Economies
Emerging Market Economies Low-income Countries
Per
cen
t
Median Growth in Real GDP per Capita during Expansion
Source: IMF staff calculations.
50s and 60s 70s and 80s 1990s 2000s
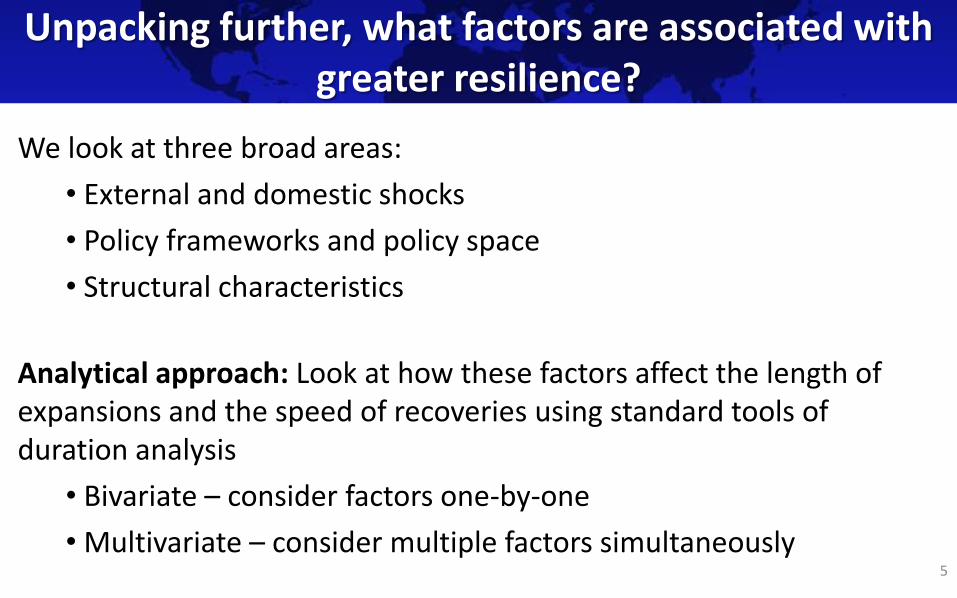
Unpacking further, what factors are associated with greater resilience?
5
We look at three broad areas:
• External and domestic shocks
• Policy frameworks and policy space
• Structural characteristics
Analytical approach: Look at how these factors affect the length of expansions and the speed of recoveries using standard tools of duration analysis
• Bivariate – consider factors one-by-one
• Multivariate – consider multiple factors simultaneously
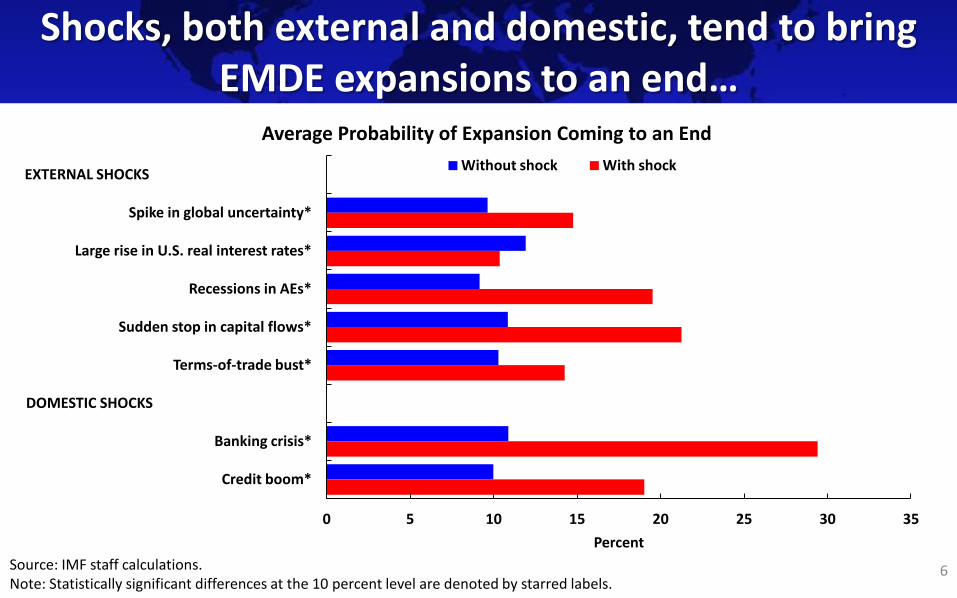
Shocks, both external and domestic, tend to bring EMDE expansions to an end…
6
Average Probability of Expansion Coming to an End
0 5 10 15 20 25 30 35
EXTERNAL SHOCKS
Spike in global uncertainty*
Large rise in U.S. real interest rates*
Recessions in AEs*
Sudden stop in capital flows*
Terms-of-trade bust*
DOMESTIC SHOCKS
Banking crisis*
Credit boom*
Percent
Without shock With shock
Source: IMF staff calculations. Note: Statistically significant differences at the 10 percent level are denoted by starred labels.
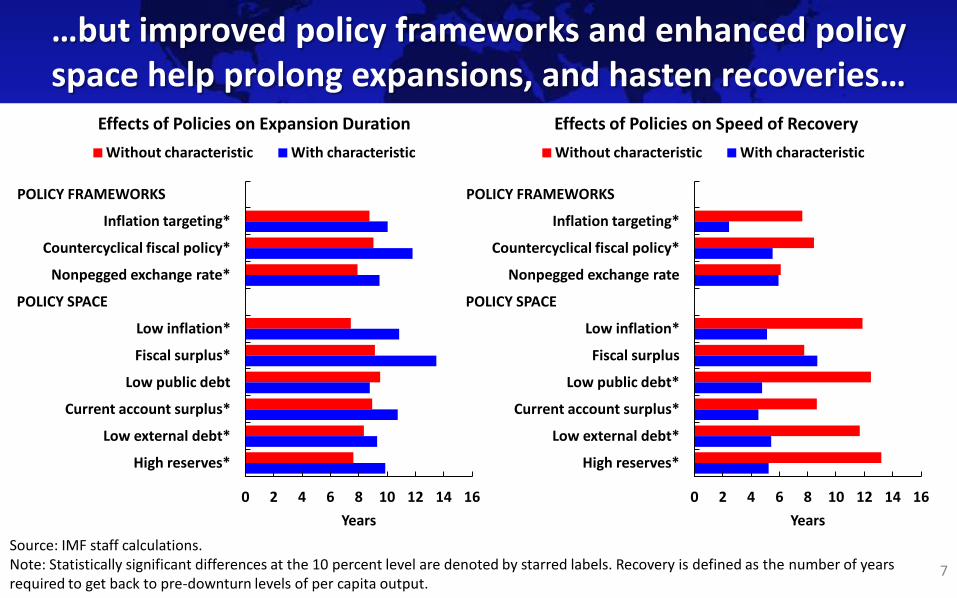
…but improved policy frameworks and enhanced policy space help prolong expansions, and hasten recoveries…
7
Effects of Policies on Expansion Duration
0 2 4 6 8 10 12 14 16
POLICY FRAMEWORKS
Inflation targeting*
Countercyclical fiscal policy*
Nonpegged exchange rate*
POLICY SPACE
Low inflation*
Fiscal surplus*
Low public debt
Current account surplus*
Low external debt*
High reserves*
Years
Without characteristic With characteristic
Effects of Policies on Speed of Recovery
0 2 4 6 8 10 12 14 16
POLICY FRAMEWORKS
Inflation targeting*
Countercyclical fiscal policy*
Nonpegged exchange rate
POLICY SPACE
Low inflation*
Fiscal surplus
Low public debt*
Current account surplus*
Low external debt*
High reserves*
Years
Without characteristic With characteristic
Source: IMF staff calculations. Note: Statistically significant differences at the 10 percent level are denoted by starred labels. Recovery is defined as the number of years required to get back to pre-downturn levels of per capita output.
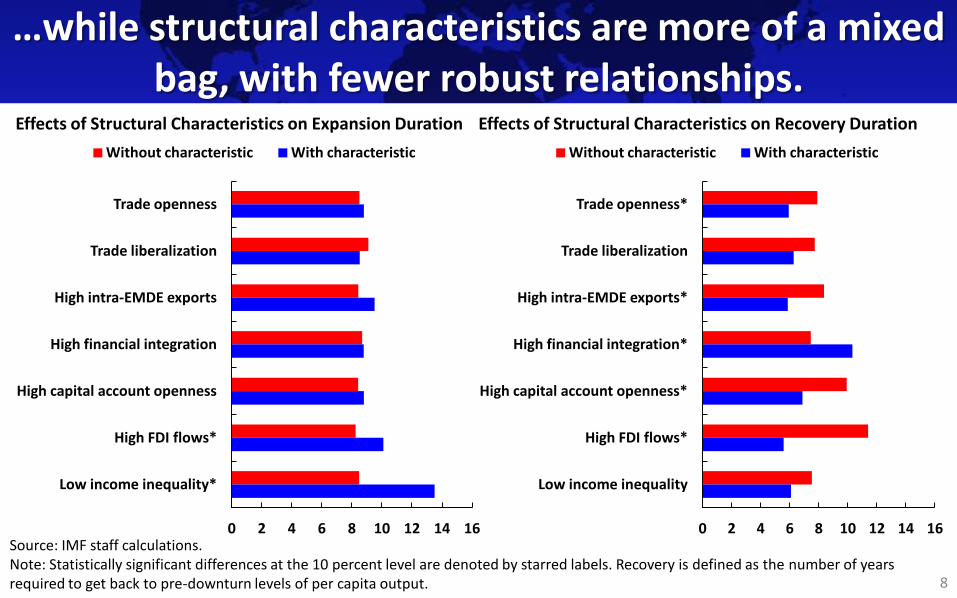
…while structural characteristics are more of a mixed bag, with fewer robust relationships.
8
Effects of Structural Characteristics on Expansion Duration
0 2 4 6 8 10 12 14 16
Trade openness
Trade liberalization
High intra-EMDE exports
High financial integration
High capital account openness
High FDI flows*
Low income inequality*
Without characteristic With characteristic
Effects of Structural Characteristics on Recovery Duration
0 2 4 6 8 10 12 14 16
Trade openness*
Trade liberalization
High intra-EMDE exports*
High financial integration*
High capital account openness*
High FDI flows*
Low income inequality
Without characteristic With characteristic
Source: IMF staff calculations. Note: Statistically significant differences at the 10 percent level are denoted by starred labels. Recovery is defined as the number of years required to get back to pre-downturn levels of per capita output.
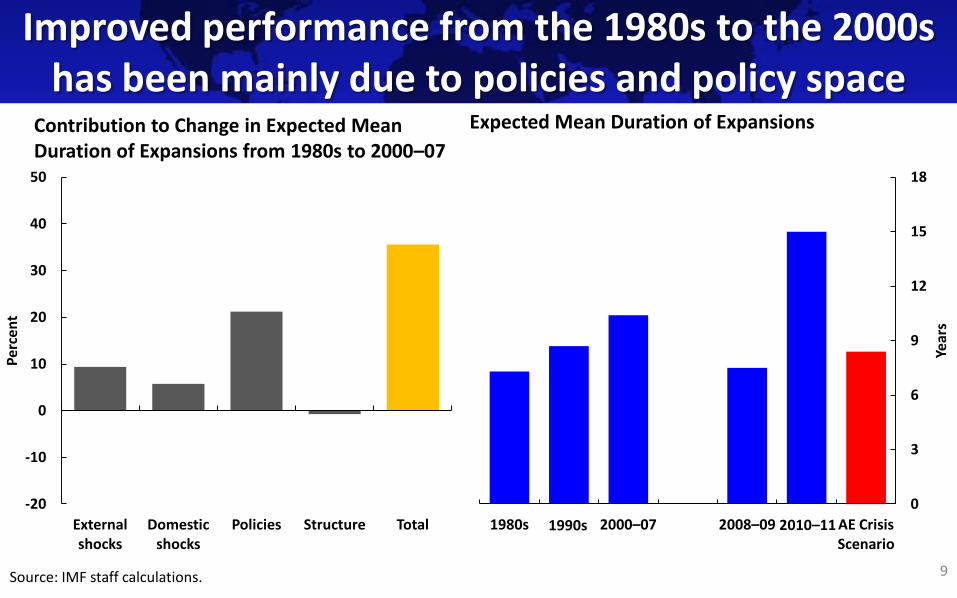
Improved performance from the 1980s to the 2000s has been mainly due to policies and policy space
9
-20
-10
0
10
20
30
40
50
External shocks
Domestic shocks
Policies Structure Total
Per
cen
t
Contribution to Change in Expected Mean Duration of Expansions from 1980s to 2000–07
Source: IMF staff calculations.
0
3
6
9
12
15
18
1980s 2000–07 2008–09 AE Crisis Scenario
Year
s
Expected Mean Duration of Expansions
1990s 2010–11
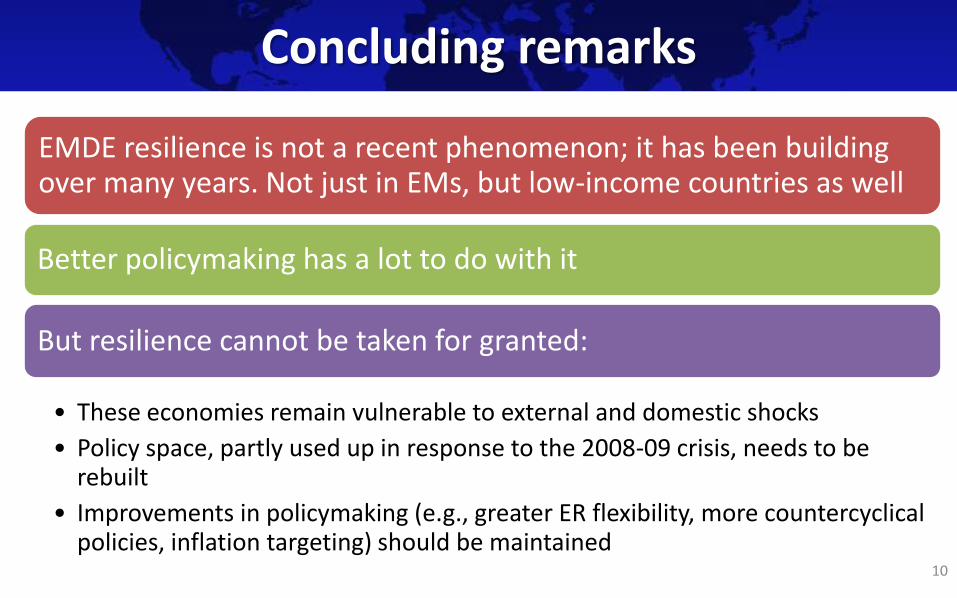
Concluding remarks
10
EMDE resilience is not a recent phenomenon; it has been building over many years. Not just in EMs, but low-income countries as well
Better policymaking has a lot to do with it
But resilience cannot be taken for granted:
• These economies remain vulnerable to external and domestic shocks
• Policy space, partly used up in response to the 2008-09 crisis, needs to be rebuilt
• Improvements in policymaking (e.g., greater ER flexibility, more countercyclical policies, inflation targeting) should be maintained

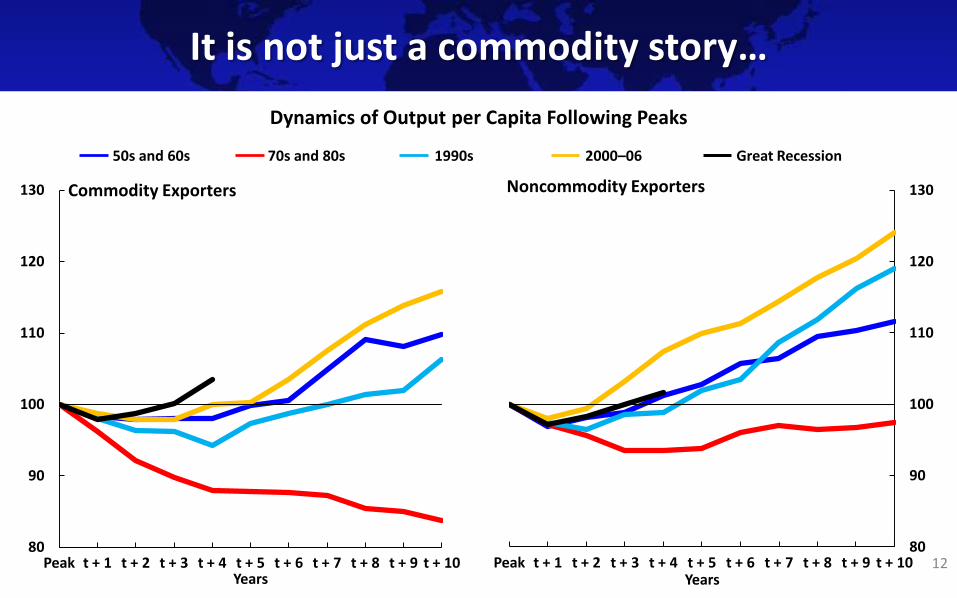
It is not just a commodity story…
12 80
90
100
110
120
130
Peak t + 1 t + 2 t + 3 t + 4 t + 5 t + 6 t + 7 t + 8 t + 9 t + 10
Noncommodity Exporters
80
90
100
110
120
130
Peak t + 1 t + 2 t + 3 t + 4 t + 5 t + 6 t + 7 t + 8 t + 9 t + 10
Commodity Exporters
Dynamics of Output per Capita Following Peaks
Years Years
50s and 60s 70s and 80s 1990s Great Recession 2000–06
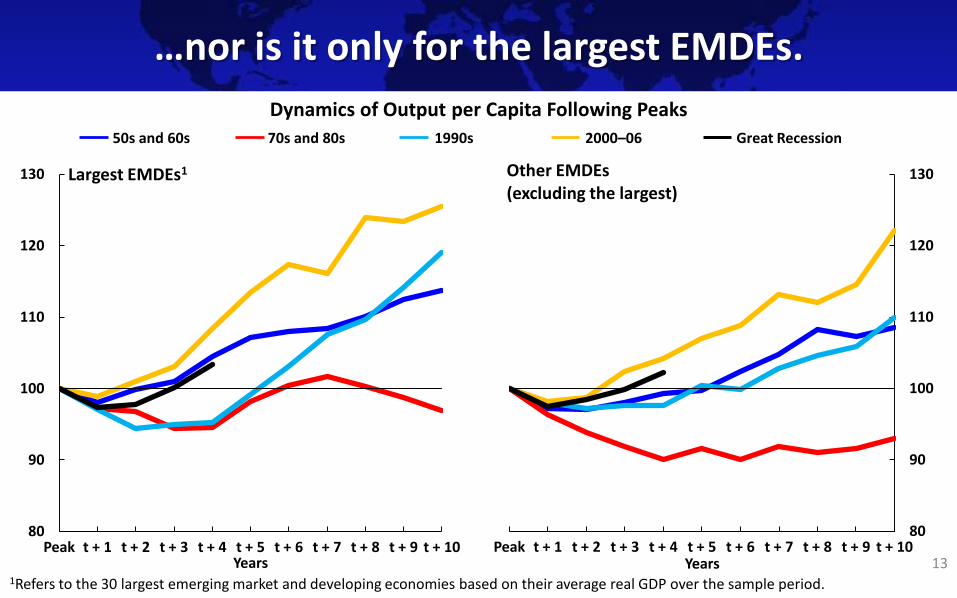
…nor is it only for the largest EMDEs.
13
80
90
100
110
120
130
Peak t + 1 t + 2 t + 3 t + 4 t + 5 t + 6 t + 7 t + 8 t + 9 t + 10
Other EMDEs (excluding the largest)
80
90
100
110
120
130
Peak t + 1 t + 2 t + 3 t + 4 t + 5 t + 6 t + 7 t + 8 t + 9 t + 10
Largest EMDEs1
Dynamics of Output per Capita Following Peaks
1Refers to the 30 largest emerging market and developing economies based on their average real GDP over the sample period.
Years Years
50s and 60s 70s and 80s 1990s Great Recession 2000–06
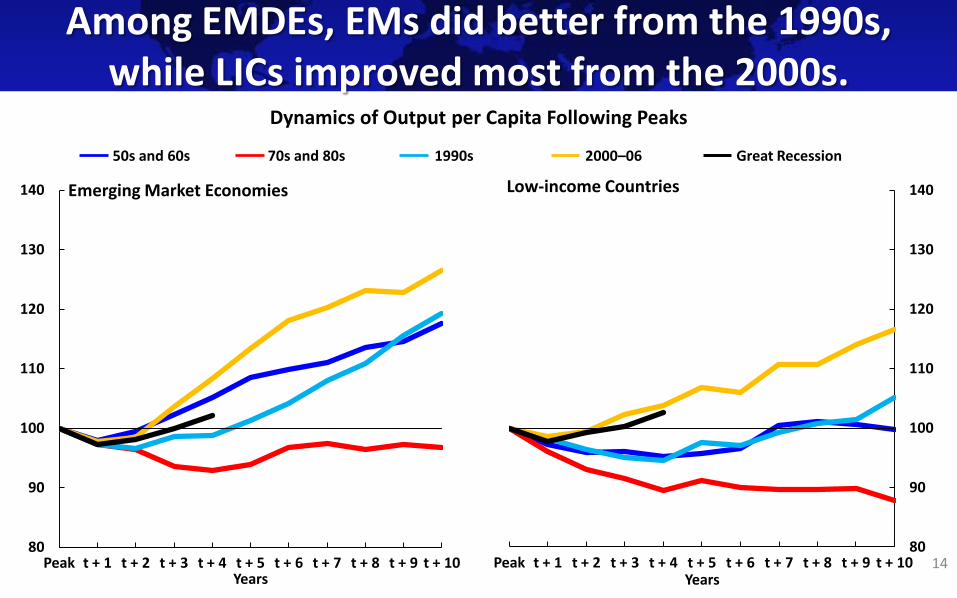
Among EMDEs, EMs did better from the 1990s, while LICs improved most from the 2000s.
14 80
90
100
110
120
130
140
Peak t + 1 t + 2 t + 3 t + 4 t + 5 t + 6 t + 7 t + 8 t + 9 t + 10
Low-income Countries
80
90
100
110
120
130
140
Peak t + 1 t + 2 t + 3 t + 4 t + 5 t + 6 t + 7 t + 8 t + 9 t + 10
Emerging Market Economies
Dynamics of Output per Capita Following Peaks
Years Years
50s and 60s 70s and 80s 1990s Great Recession 2000–06
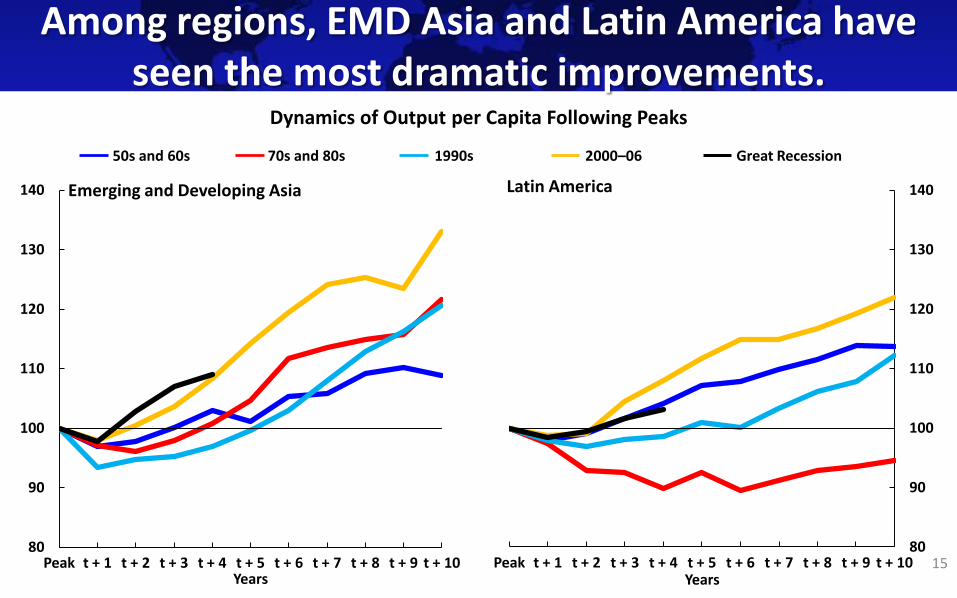
Among regions, EMD Asia and Latin America have seen the most dramatic improvements.
15 80
90
100
110
120
130
140
Peak t + 1 t + 2 t + 3 t + 4 t + 5 t + 6 t + 7 t + 8 t + 9 t + 10
Latin America
80
90
100
110
120
130
140
Peak t + 1 t + 2 t + 3 t + 4 t + 5 t + 6 t + 7 t + 8 t + 9 t + 10
Emerging and Developing Asia
Dynamics of Output per Capita Following Peaks
Years Years
50s and 60s 70s and 80s 1990s Great Recession 2000–06
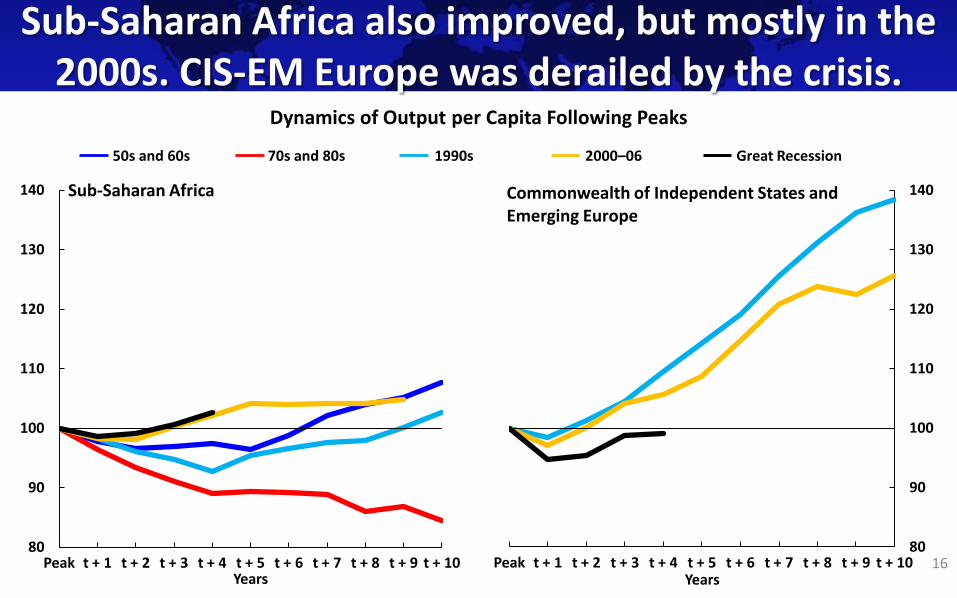
Sub-Saharan Africa also improved, but mostly in the 2000s. CIS-EM Europe was derailed by the crisis.
16 80
90
100
110
120
130
140
Peak t + 1 t + 2 t + 3 t + 4 t + 5 t + 6 t + 7 t + 8 t + 9 t + 10
Commonwealth of Independent States and Emerging Europe
80
90
100
110
120
130
140
Peak t + 1 t + 2 t + 3 t + 4 t + 5 t + 6 t + 7 t + 8 t + 9 t + 10
Sub-Saharan Africa
Dynamics of Output per Capita Following Peaks
Years Years
50s and 60s 70s and 80s 1990s Great Recession 2000–06
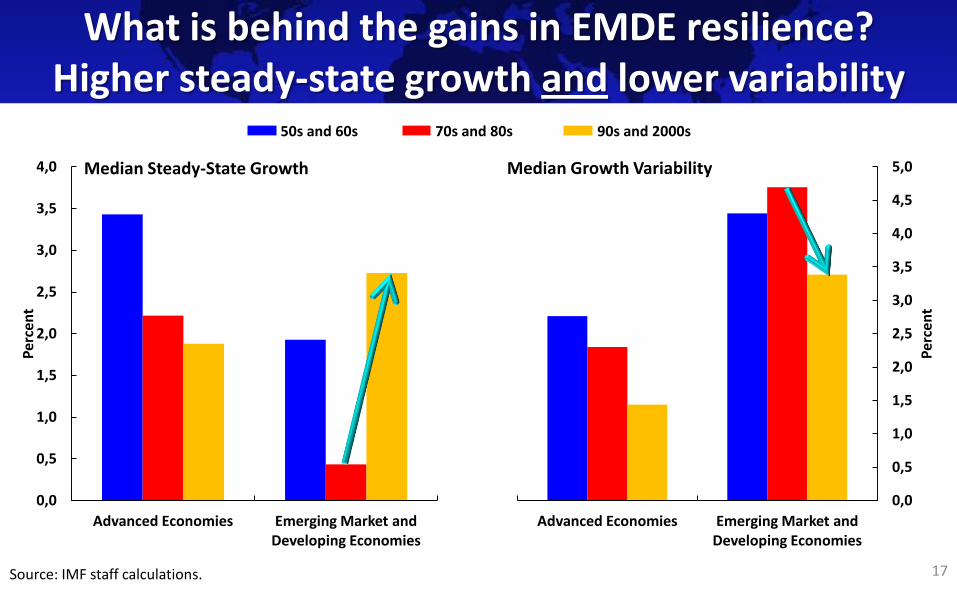
What is behind the gains in EMDE resilience? Higher steady-state growth and lower variability
17
0,0
0,5
1,0
1,5
2,0
2,5
3,0
3,5
4,0
Advanced Economies Emerging Market and Developing Economies
Per
cen
t
Median Steady-State Growth
0,0
0,5
1,0
1,5
2,0
2,5
3,0
3,5
4,0
4,5
5,0
Advanced Economies Emerging Market and Developing Economies
Per
cen
t
Median Growth Variability
50s and 60s 70s and 80s 90s and 2000s
Source: IMF staff calculations.
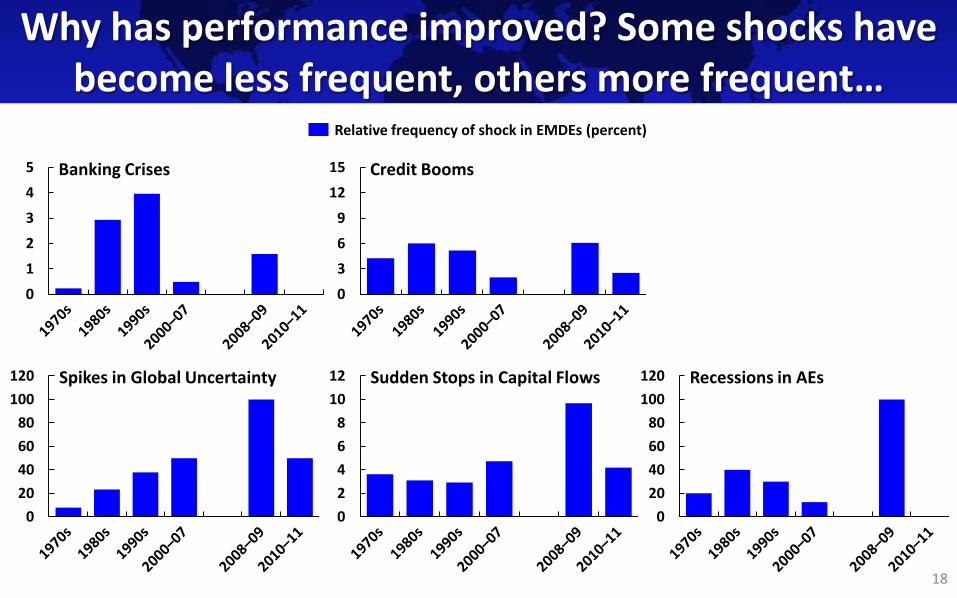
Why has performance improved? Some shocks have become less frequent, others more frequent…
18
Relative frequency of shock in EMDEs (percent)
0
20
40
60
80
100
120 Spikes in Global Uncertainty
0
1
2
3
4
5 Banking Crises
0
3
6
9
12
15 Credit Booms
0
2
4
6
8
10
12 Sudden Stops in Capital Flows
0
20
40
60
80
100
120 Recessions in AEs
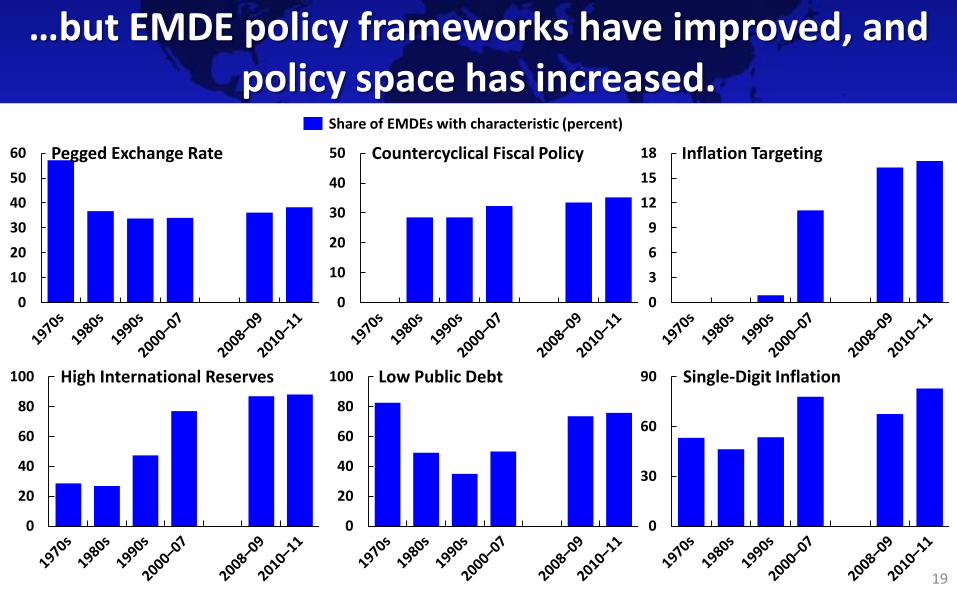
…but EMDE policy frameworks have improved, and policy space has increased.
19
Share of EMDEs with characteristic (percent)
0
10
20
30
40
50
60 Pegged Exchange Rate
0
10
20
30
40
50 Countercyclical Fiscal Policy
0
3
6
9
12
15
18 Inflation Targeting
0
20
40
60
80
100 High International Reserves
0
20
40
60
80
100 Low Public Debt
0
30
60
90 Single-Digit Inflation
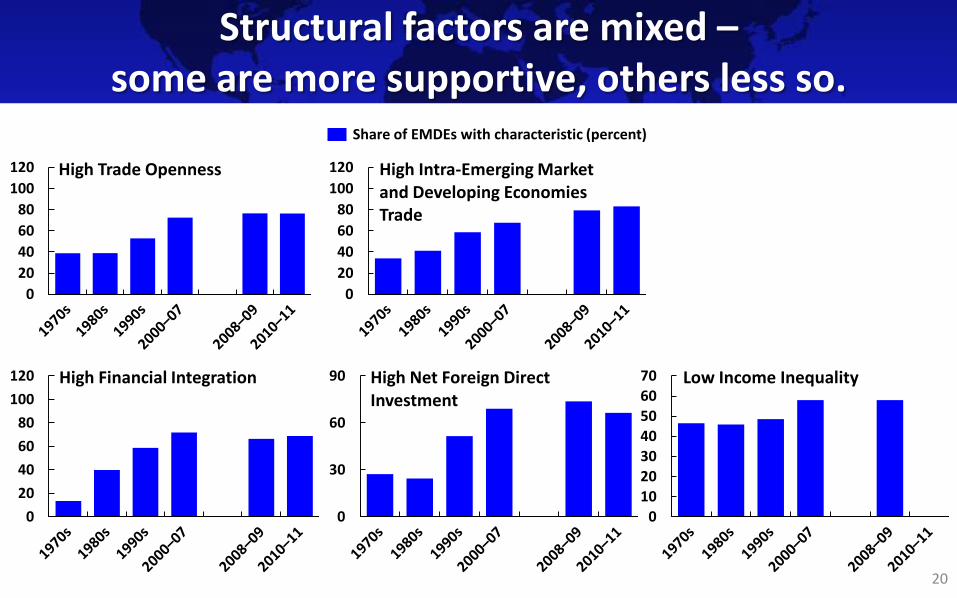
Structural factors are mixed – some are more supportive, others less so.
20
0
20
40
60
80
100
120 High Financial Integration
0
20
40
60
80
100
120 High Trade Openness
0
20
40
60
80
100
120 High Intra-Emerging Market and Developing Economies Trade
0
30
60
90 High Net Foreign Direct Investment
0
10
20
30
40
50
60
70 Low Income Inequality
Share of EMDEs with characteristic (percent)
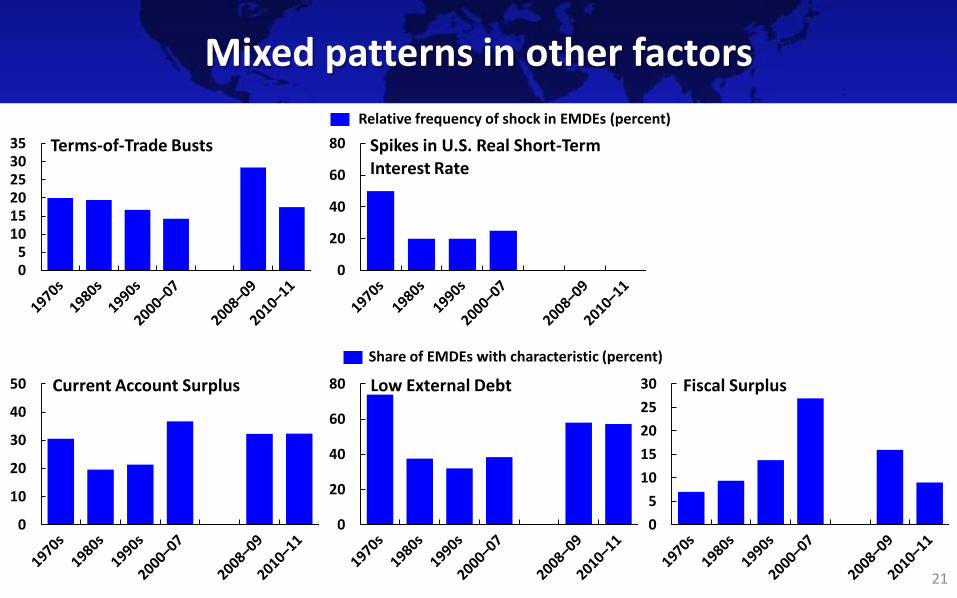
Mixed patterns in other factors
21
Relative frequency of shock in EMDEs (percent)
0
10
20
30
40
50 Current Account Surplus
0 5
10 15 20 25 30 35 Terms-of-Trade Busts
0
20
40
60
80 Spikes in U.S. Real Short-Term Interest Rate
0
20
40
60
80 Low External Debt
0
5
10
15
20
25
30 Fiscal Surplus
Share of EMDEs with characteristic (percent)
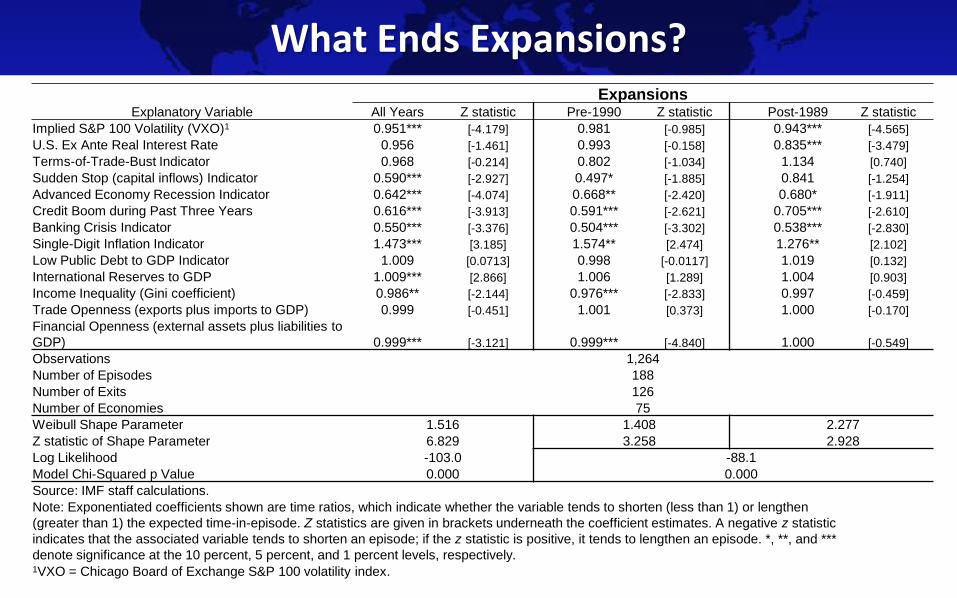
What Ends Expansions?
Explanatory Variable
Expansions All Years Z statistic Pre-1990 Z statistic Post-1989 Z statistic
Implied S&P 100 Volatility (VXO)1 0.951*** [-4.179] 0.981 [-0.985] 0.943*** [-4.565]
U.S. Ex Ante Real Interest Rate 0.956 [-1.461] 0.993 [-0.158] 0.835*** [-3.479]
Terms-of-Trade-Bust Indicator 0.968 [-0.214] 0.802 [-1.034] 1.134 [0.740]
Sudden Stop (capital inflows) Indicator 0.590*** [-2.927] 0.497* [-1.885] 0.841 [-1.254]
Advanced Economy Recession Indicator 0.642*** [-4.074] 0.668** [-2.420] 0.680* [-1.911]
Credit Boom during Past Three Years 0.616*** [-3.913] 0.591*** [-2.621] 0.705*** [-2.610]
Banking Crisis Indicator 0.550*** [-3.376] 0.504*** [-3.302] 0.538*** [-2.830]
Single-Digit Inflation Indicator 1.473*** [3.185] 1.574** [2.474] 1.276** [2.102]
Low Public Debt to GDP Indicator 1.009 [0.0713] 0.998 [-0.0117] 1.019 [0.132]
International Reserves to GDP 1.009*** [2.866] 1.006 [1.289] 1.004 [0.903]
Income Inequality (Gini coefficient) 0.986** [-2.144] 0.976*** [-2.833] 0.997 [-0.459]
Trade Openness (exports plus imports to GDP) 0.999 [-0.451] 1.001 [0.373] 1.000 [-0.170]
Financial Openness (external assets plus liabilities to
GDP) 0.999*** [-3.121] 0.999*** [-4.840] 1.000 [-0.549]
Observations 1,264
Number of Episodes 188
Number of Exits 126
Number of Economies 75
Weibull Shape Parameter 1.516 1.408 2.277
Z statistic of Shape Parameter 6.829 3.258 2.928
Log Likelihood -103.0 -88.1
Model Chi-Squared p Value 0.000 0.000
Source: IMF staff calculations.
Note: Exponentiated coefficients shown are time ratios, which indicate whether the variable tends to shorten (less than 1) or lengthen
(greater than 1) the expected time-in-episode. Z statistics are given in brackets underneath the coefficient estimates. A negative z statistic
indicates that the associated variable tends to shorten an episode; if the z statistic is positive, it tends to lengthen an episode. *, **, and ***
denote significance at the 10 percent, 5 percent, and 1 percent levels, respectively. 1VXO = Chicago Board of Exchange S&P 100 volatility index.
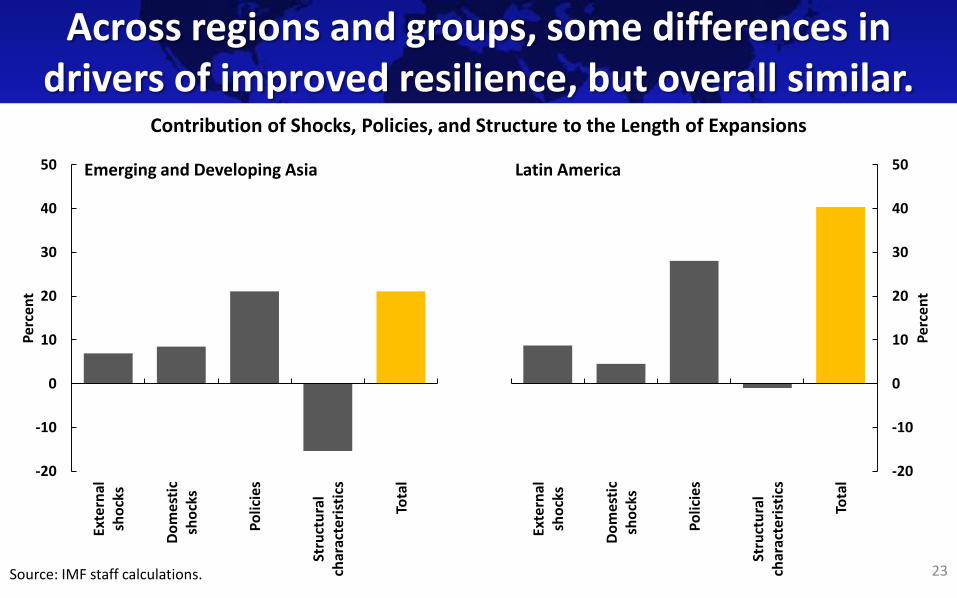
Across regions and groups, some differences in drivers of improved resilience, but overall similar.
23
-20
-10
0
10
20
30
40
50
Exte
rnal
sh
ock
s
Do
me
stic
sh
ock
s
Po
licie
s
Stru
ctu
ral
char
acte
rist
ics
Tota
l
Per
cen
t
Latin America
Source: IMF staff calculations.
Contribution of Shocks, Policies, and Structure to the Length of Expansions
-20
-10
0
10
20
30
40
50
Exte
rnal
sh
ock
s
Do
me
stic
sh
ock
s
Po
licie
s
Stru
ctu
ral
char
acte
rist
ics
Tota
l
Per
cen
t
Emerging and Developing Asia
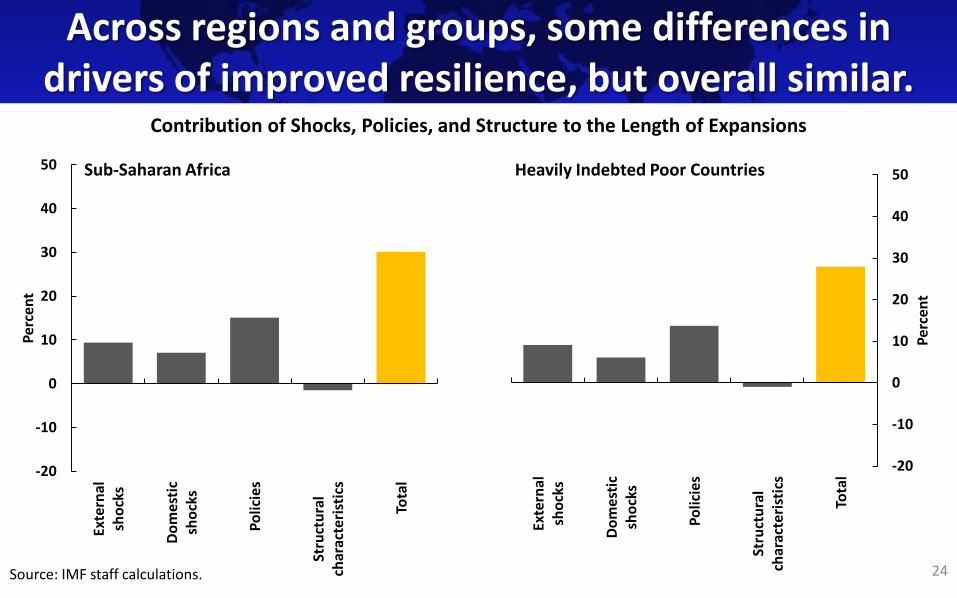
Across regions and groups, some differences in drivers of improved resilience, but overall similar.
24 Source: IMF staff calculations.
Contribution of Shocks, Policies, and Structure to the Length of Expansions
-20
-10
0
10
20
30
40
50
Exte
rnal
sh
ock
s
Do
me
stic
sh
ock
s
Po
licie
s
Stru
ctu
ral
char
acte
rist
ics
Tota
l
Per
cen
t
Sub-Saharan Africa
-20
-10
0
10
20
30
40
50
Exte
rnal
sh
ock
s
Do
mes
tic
sho
cks
Po
lici
es
Stru
ctu
ral
char
acte
rist
ics
Tota
l
Per
cen
t
Heavily Indebted Poor Countries
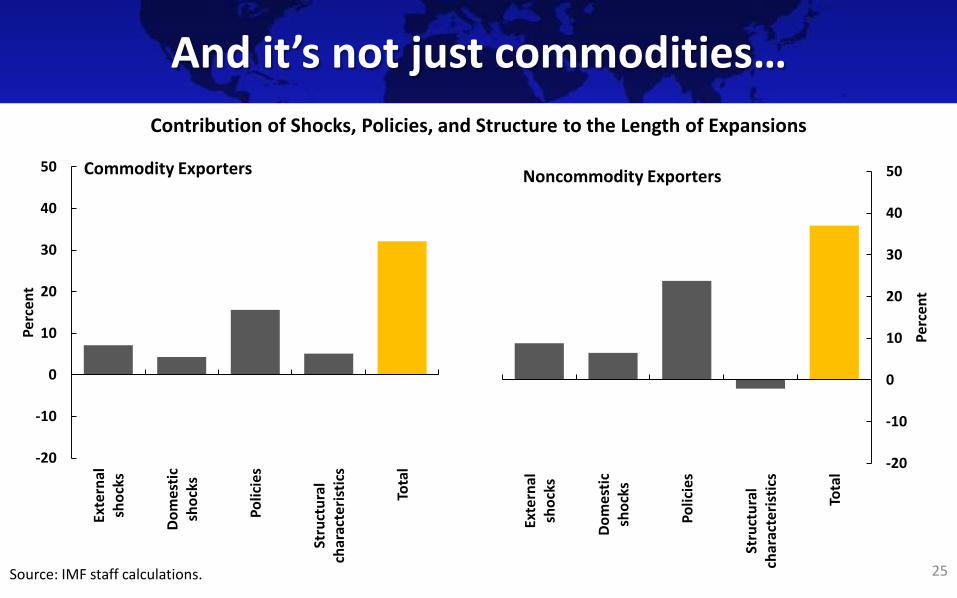
And it’s not just commodities…
25 Source: IMF staff calculations.
Contribution of Shocks, Policies, and Structure to the Length of Expansions
-20
-10
0
10
20
30
40
50
Exte
rnal
sh
ock
s
Do
me
stic
sh
ock
s
Po
licie
s
Stru
ctu
ral
char
acte
rist
ics
Tota
l
Per
cen
t
Noncommodity Exporters
-20
-10
0
10
20
30
40
50
Exte
rnal
sh
ock
s
Do
mes
tic
sho
cks
Po
lici
es
Stru
ctu
ral
char
acte
rist
ics
Tota
l
Per
cen
t
Commodity Exporters