Embed Size (px)
Citation preview

What comorbidity should we adjust for in RRT patients?
James Fotheringham
School ofHealth andRelatedResearch
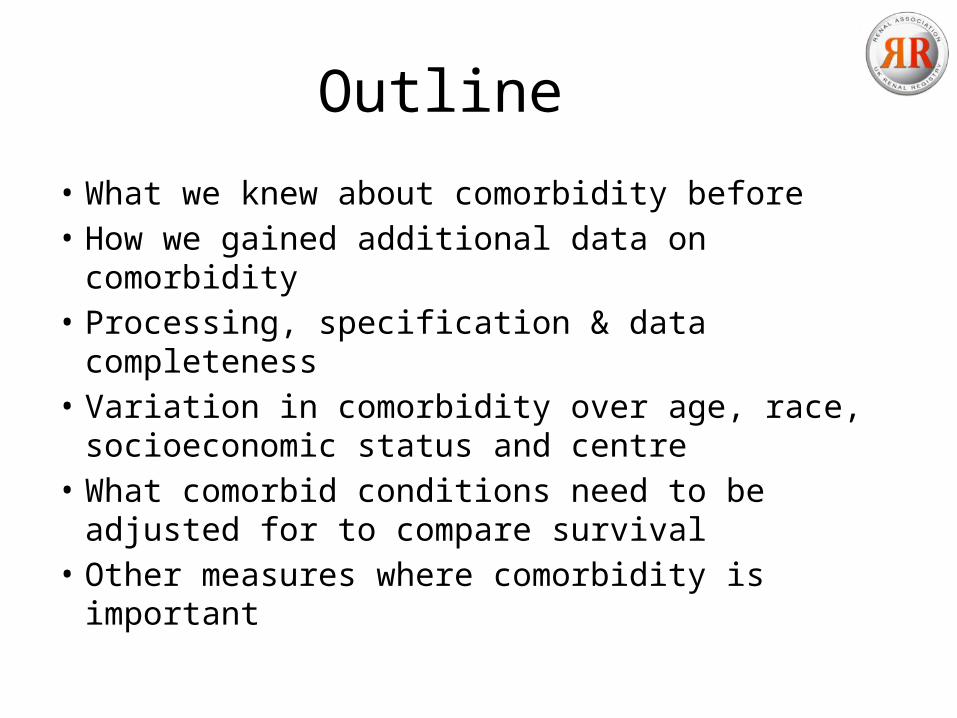
Outline
• What we knew about comorbidity before• How we gained additional data on comorbidity• Processing, specification & data completeness• Variation in comorbidity over age, race,
socioeconomic status and centre• What comorbid conditions need to be adjusted
for to compare survival• Other measures where comorbidity is important
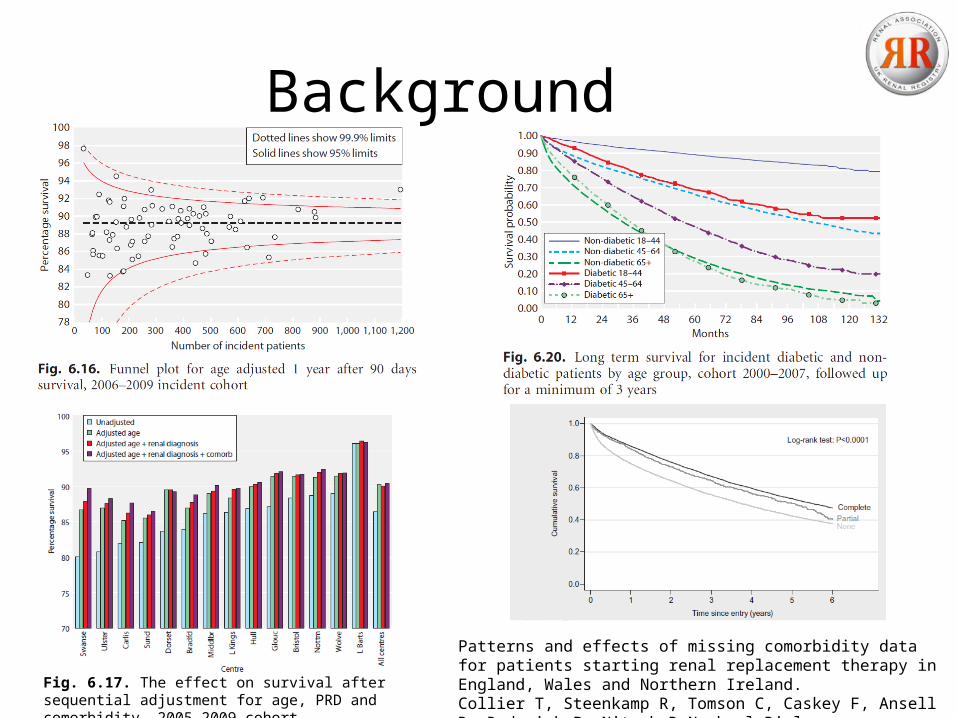
Background
Fig. 6.17. The effect on survival after sequential adjustment for age, PRD and comorbidity, 2005–2009 cohort
Patterns and effects of missing comorbidity data for patients starting renal replacement therapy in England, Wales and Northern Ireland.Collier T, Steenkamp R, Tomson C, Caskey F, Ansell D, Roderick P, Nitsch D Nephrol Dial Transplant. 2011 Nov;26(11):3651-8. Epub 2011 Mar 24.
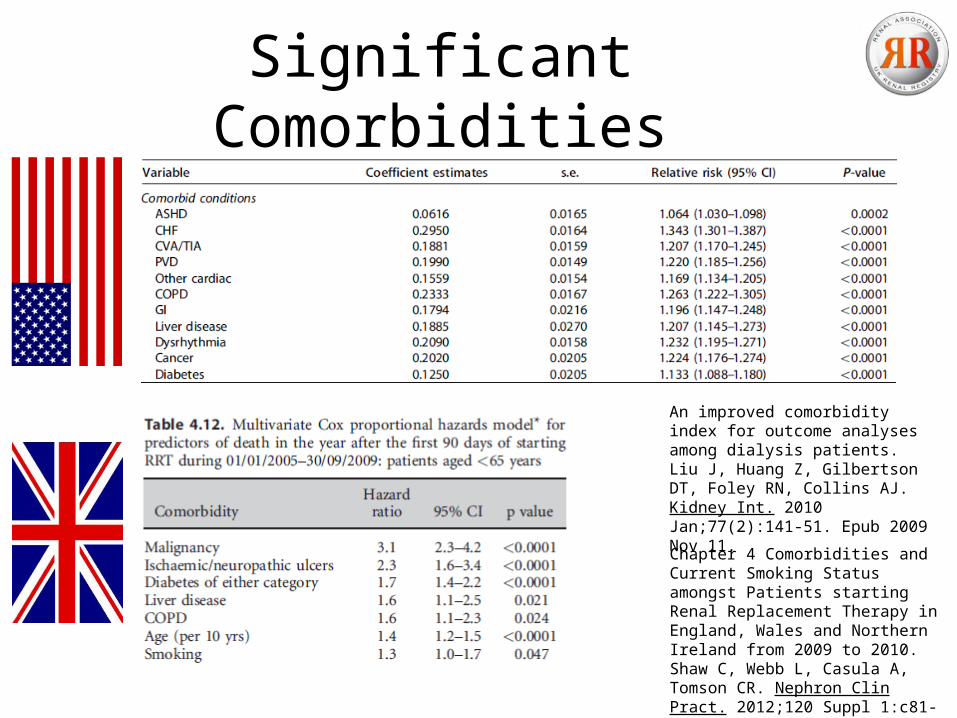
Significant Comorbidities
An improved comorbidity index for outcome analyses among dialysis patients.Liu J, Huang Z, Gilbertson DT, Foley RN, Collins AJ. Kidney Int. 2010 Jan;77(2):141-51. Epub 2009 Nov 11.
Chapter 4 Comorbidities and Current Smoking Status amongst Patients starting Renal Replacement Therapy in England, Wales and Northern Ireland from 2009 to 2010.Shaw C, Webb L, Casula A, Tomson CR. Nephron Clin Pract. 2012;120 Suppl 1:c81-91. Epub 2012 Sep 1.
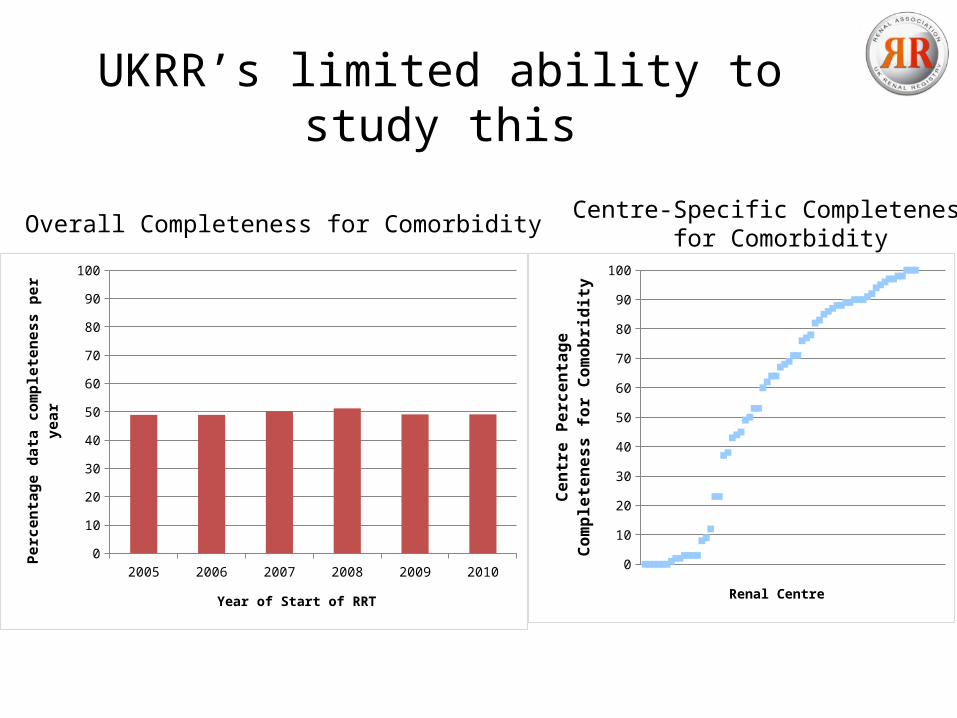
UKRR’s limited ability to study this
2005 2006 2007 2008 2009 20100
10
20
30
40
50
60
70
80
90
100
Year of Start of RRT
Perc
enta
ge d
ata
com
plet
enes
s pe
r yea
r
0
10
20
30
40
50
60
70
80
90
100
Renal Centre
Cent
re P
erce
ntag
e Co
mpl
eten
ess
for
Com
obri
dity
Overall Completeness for Comorbidity Centre-Specific Completeness for Comorbidity
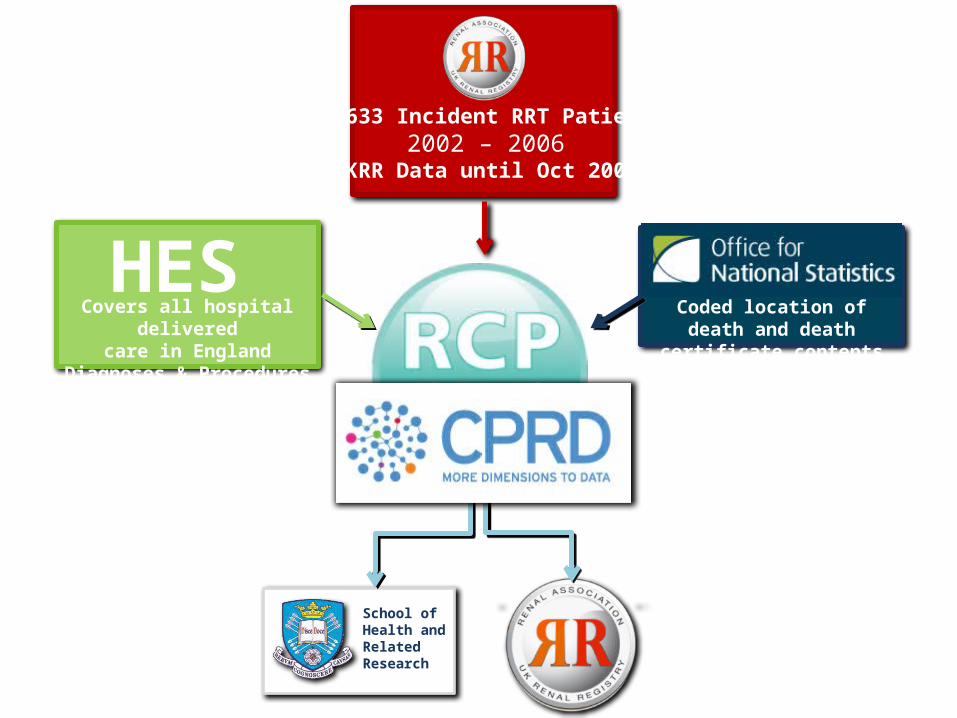
21,633 Incident RRT Patients2002 – 2006
UKRR Data until Oct 2009
Coded location of death and death certificate contents
Covers all hospital deliveredcare in England
Diagnoses & Procedures
HES
School ofHealth andRelatedResearch
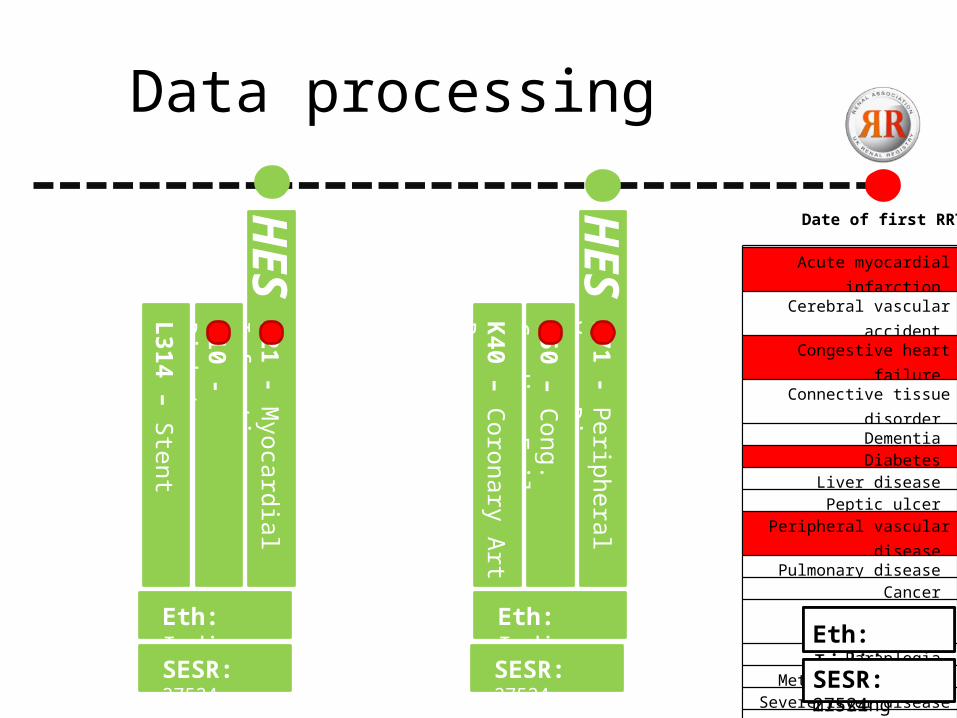
Data processing
Date of first RRT
Acute myocardial infarction Cerebral vascular accident
Congestive heart failure Connective tissue disorder
Dementia Diabetes
Liver disease Peptic ulcer
Peripheral vascular disease Pulmonary disease
Cancer Diabetes complications
Paraplegia Metastatic cancer
Severe liver disease HIV
Acute myocardial infarction Cerebral vascular accident
Congestive heart failure Connective tissue disorder
Dementia Diabetes
Liver disease Peptic ulcer
Peripheral vascular disease Pulmonary disease
Cancer Diabetes complications
Paraplegia Metastatic cancer
Severe liver disease HIV
HES
I21 - Myocardial Infarction
E10 - Diabetes
L314 – Stent
Eth: Indian
SESR: 27524
HES
I71 - Peripheral Vasc. Dis.
I50 – Cong. Cardiac Failure
K40 – Coronary Art Bypass
Eth: Indian
SESR: 27524
Eth: missing
SESR: missing
Eth: Indian
SESR: 27524
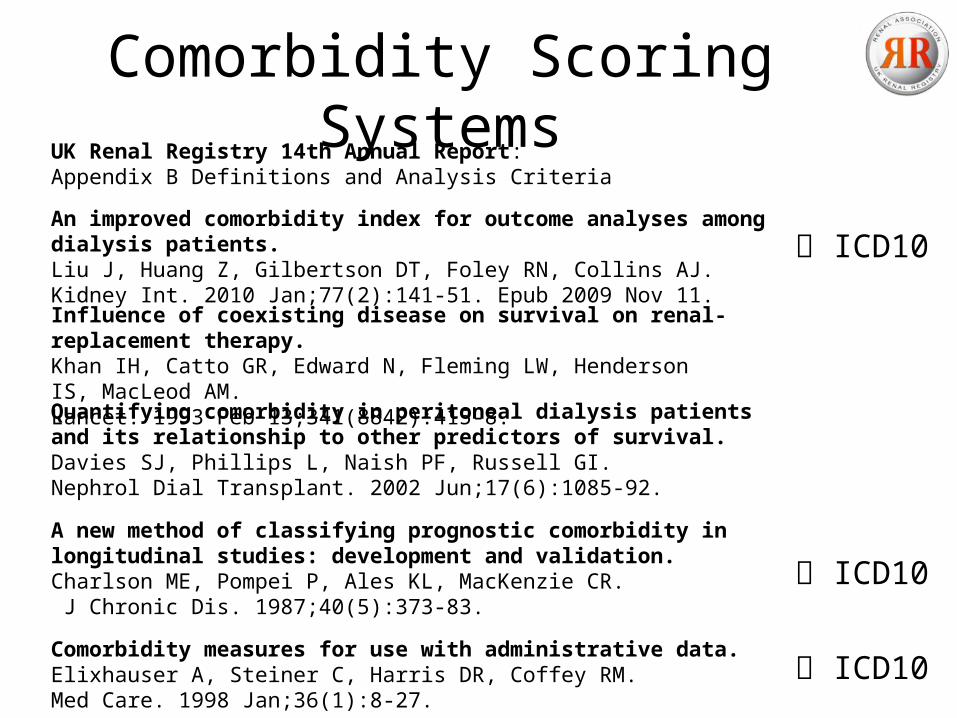
Comorbidity Scoring Systems
Comorbidity measures for use with administrative data.Elixhauser A, Steiner C, Harris DR, Coffey RM.Med Care. 1998 Jan;36(1):8-27.
A new method of classifying prognostic comorbidity in longitudinal studies: development and validation.Charlson ME, Pompei P, Ales KL, MacKenzie CR. J Chronic Dis. 1987;40(5):373-83.
UK Renal Registry 14th Annual Report:Appendix B Definitions and Analysis Criteria
Influence of coexisting disease on survival on renal-replacement therapy.Khan IH, Catto GR, Edward N, Fleming LW, Henderson IS, MacLeod AM.Lancet. 1993 Feb 13;341(8842):415-8.
Quantifying comorbidity in peritoneal dialysis patients and its relationship to other predictors of survival.Davies SJ, Phillips L, Naish PF, Russell GI.Nephrol Dial Transplant. 2002 Jun;17(6):1085-92.
An improved comorbidity index for outcome analyses among dialysis patients.Liu J, Huang Z, Gilbertson DT, Foley RN, Collins AJ. Kidney Int. 2010 Jan;77(2):141-51. Epub 2009 Nov 11.
ICD10
ICD10
ICD10
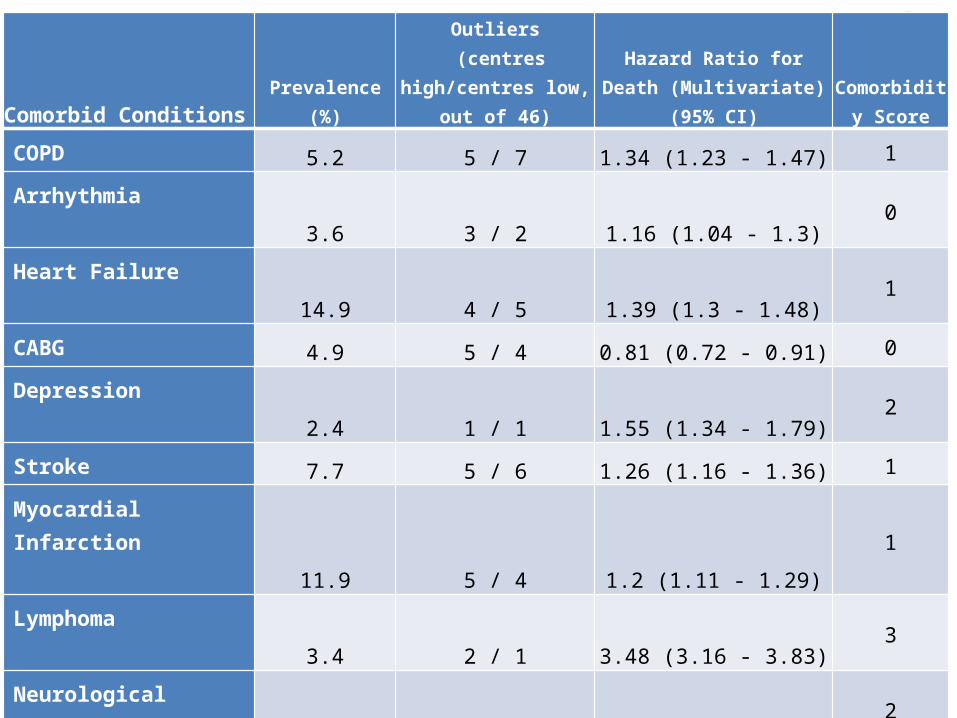
Comorbid Conditions Prevalence (%)
Outliers (centres high/centres
low, out of 46)Hazard Ratio for Death (Multivariate) (95% CI)
Comorbidity Score
COPD 5.2 5 / 7 1.34 (1.23 - 1.47) 1
Arrhythmia 3.6 3 / 2 1.16 (1.04 - 1.3) 0
Heart Failure 14.9 4 / 5 1.39 (1.3 - 1.48) 1
CABG 4.9 5 / 4 0.81 (0.72 - 0.91) 0
Depression 2.4 1 / 1 1.55 (1.34 - 1.79) 2
Stroke 7.7 5 / 6 1.26 (1.16 - 1.36) 1
Myocardial Infarction 11.9 5 / 4 1.2 (1.11 - 1.29)
1
Lymphoma 3.4 2 / 1 3.48 (3.16 - 3.83) 3
Neurological Disease 3.8 3 / 3 1.52 (1.35 - 1.71)
2
Vascular Procedure 3.5 3 / 4 1.27 (1.13 - 1.42) 1
Valvular Heart Disease 3.7 5 / 5 1.3 (1.16 - 1.45)
1
Cancer 6.8 2 / 2 1.39 (1.28 - 1.51) 1
Connective Tissue Disease 3.4 3 / 1 1.34 (1.18 - 1.53)
1
Peptic Ulcer Disease 4.7 6 / 2 1.17 (1.06 - 1.29)
0
Claudication 7.1 7 / 6 1.19 (1.09 - 1.29) 0
Diabetes 31.6 7 / 5 1.44 (1.36 - 1.52) 1
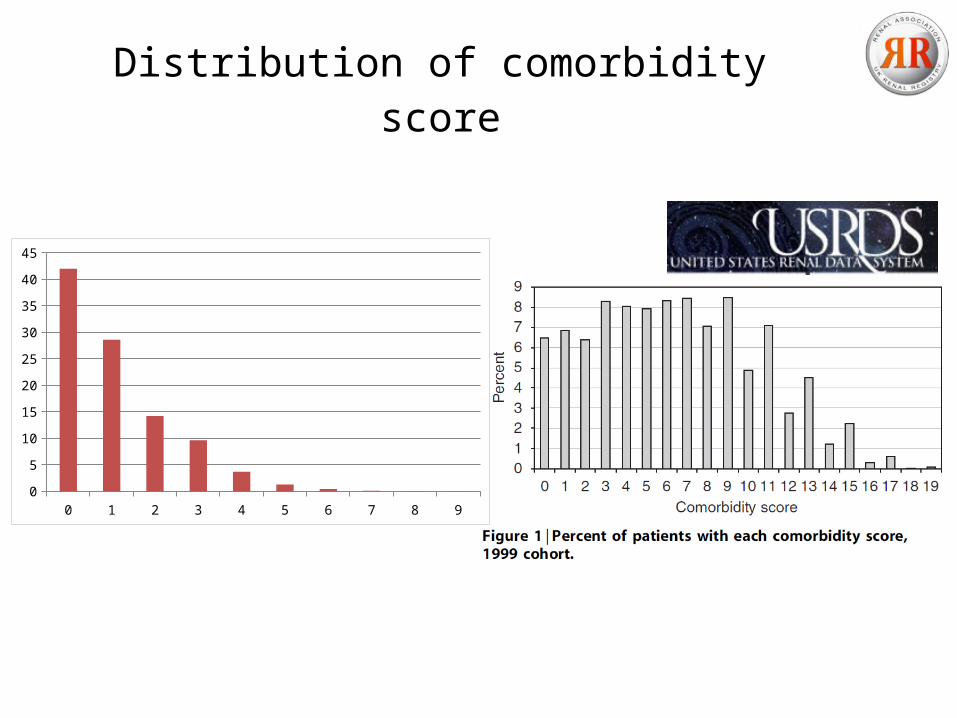
Distribution of comorbidity score
0 1 2 3 4 5 6 7 8 90
5
10
15
20
25
30
35
40
45
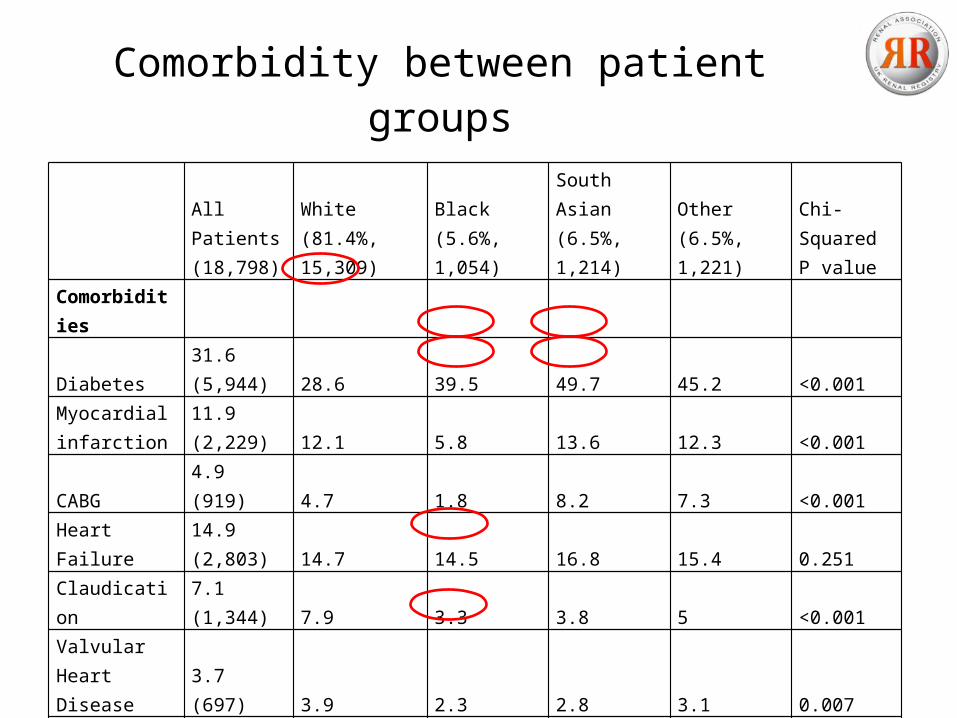
Comorbidity between patient groups
All Patients (18,798)
White(81.4%, 15,309)
Black(5.6%, 1,054)
South Asian(6.5%, 1,214)
Other (6.5%, 1,221)
Chi-Squared P value
Comorbidities
Diabetes 31.6 (5,944) 28.6 39.5 49.7 45.2 <0.001
Myocardial infarction 11.9 (2,229) 12.1 5.8 13.6 12.3 <0.001
CABG 4.9 (919) 4.7 1.8 8.2 7.3 <0.001
Heart Failure 14.9 (2,803) 14.7 14.5 16.8 15.4 0.251
Claudication 7.1 (1,344) 7.9 3.3 3.8 5 <0.001
Valvular Heart Disease 3.7 (697) 3.9 2.3 2.8 3.1 0.007
Stroke 7.7 (1,446) 7.7 7.5 7.9 7.2 0.904
COPD 5.2 (978) 5.8 0.9 3.3 3.8 <0.001
Comorbid Score (mean, 95% CI)
1.11 (1.09 - 1.13)
1.12 (1.1 - 1.14)
0.99 (0.91 - 1.07)
1.11 (1.05 - 1.17)
1.15(1.07 - 1.23)
1.15 (1.07 - 1.23)
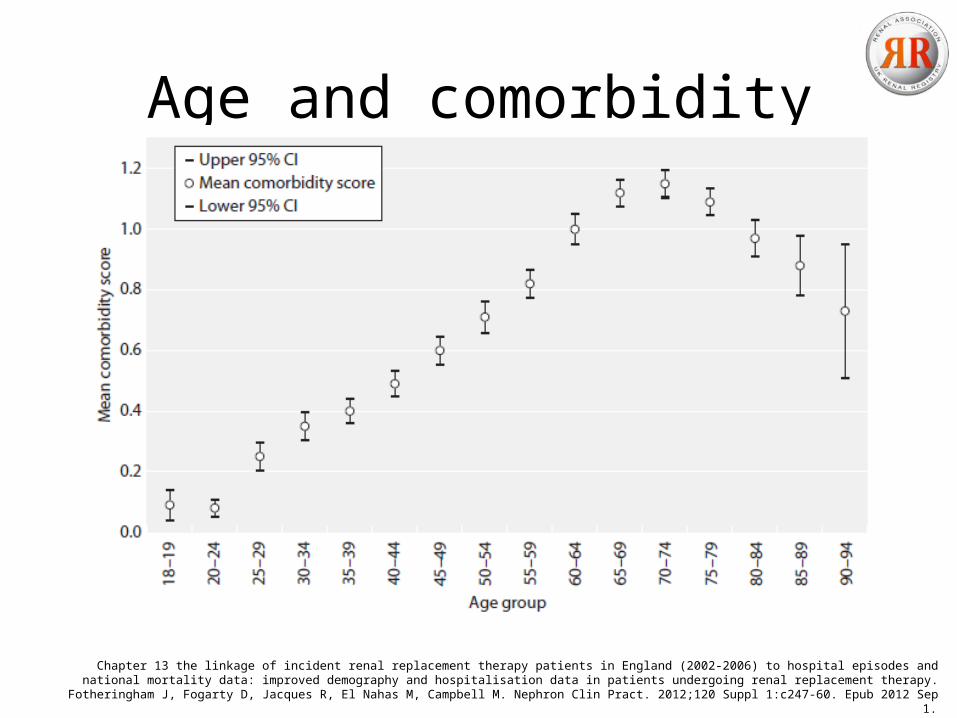
Age and comorbidity
Chapter 13 the linkage of incident renal replacement therapy patients in England (2002-2006) to hospital episodes and national mortality data: improved demography and hospitalisation data in patients undergoing renal replacement therapy.
Fotheringham J, Fogarty D, Jacques R, El Nahas M, Campbell M. Nephron Clin Pract. 2012;120 Suppl 1:c247-60. Epub 2012 Sep 1.
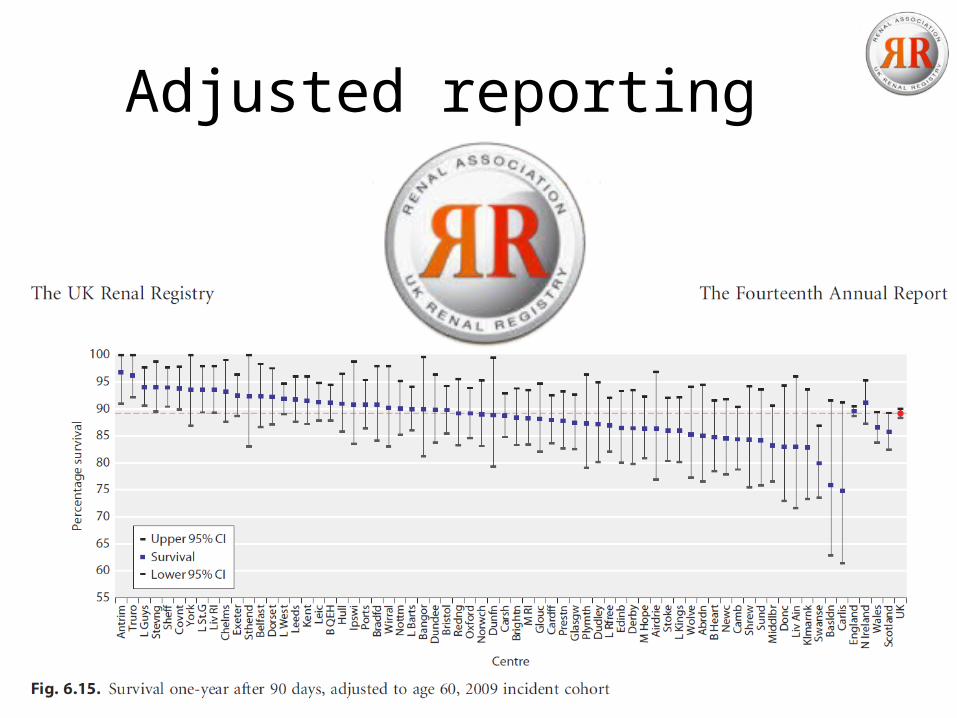
Adjusted reporting
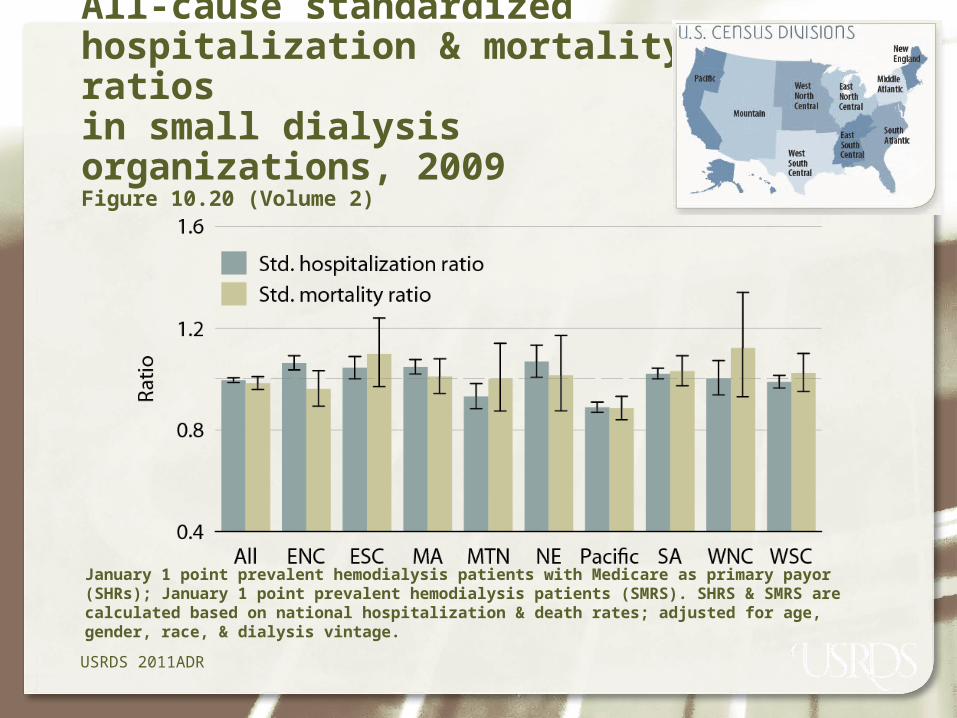
USRDS 2011ADR
All-cause standardized hospitalization & mortality ratios in small dialysis organizations, 2009Figure 10.20 (Volume 2)
January 1 point prevalent hemodialysis patients with Medicare as primary payor (SHRs); January 1 point prevalent hemodialysis patients (SMRS). SHRS & SMRS are calculated based on national hospitalization & death rates; adjusted for age, gender, race, & dialysis vintage.
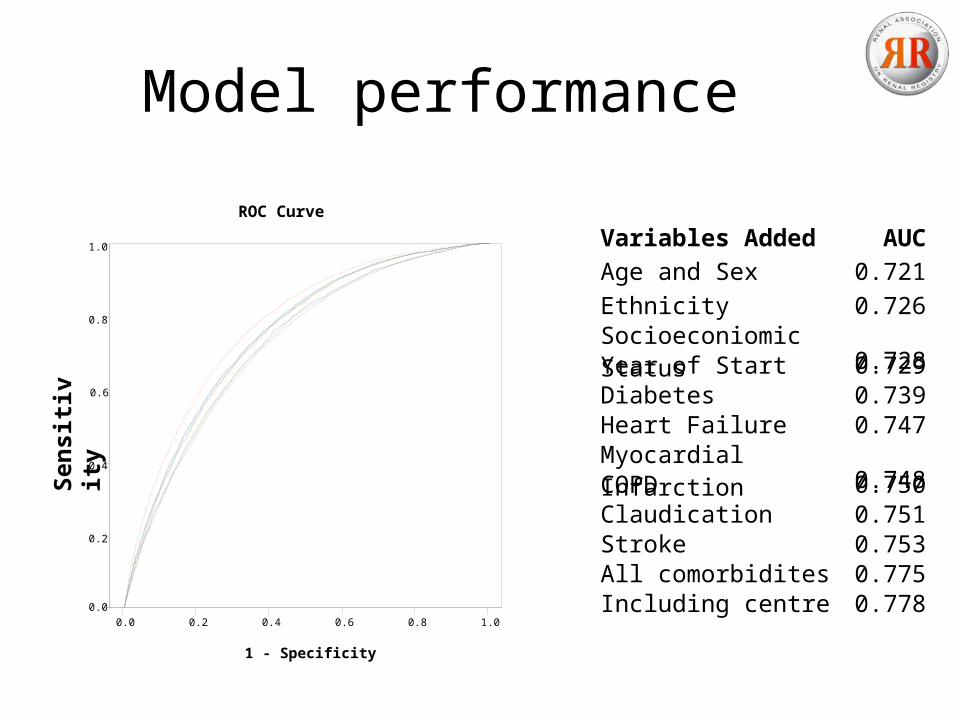
Model performance
Variables Added AUCAge and Sex 0.721
1 - Specificity
1.00.80.60.40.20.0
Sen
siti
vity
1.0
0.8
0.6
0.4
0.2
0.0
ROC Curve
Including centre 0.778All comorbidites 0.775Stroke 0.753Claudication 0.751COPD 0.750Myocardial Infarction 0.748Heart Failure 0.747Diabetes 0.739Year of Start 0.729Socioeconiomic Status 0.728Ethnicity 0.726
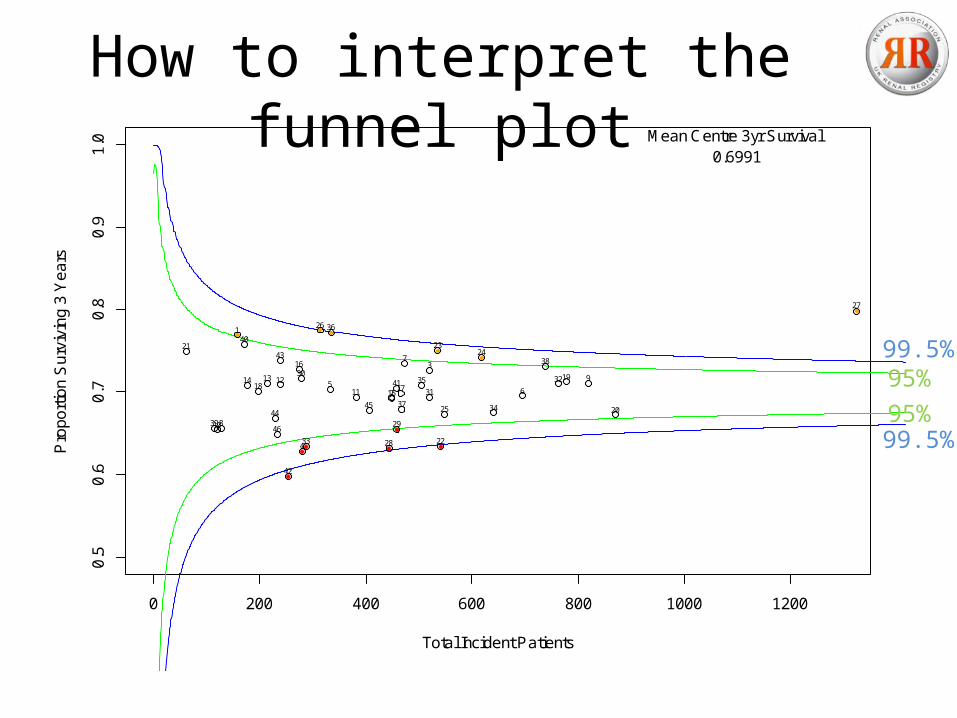
How to interpret the funnel plot
0 200 400 600 800 1000 1200
0.5
0.6
0.7
0.8
0.9
1.0
Total Incident Patients
Pro
po
rtio
n S
urv
ivin
g 3
Ye
ars
Mean Centre 3yr Survival0.6991
1
2
3
4
56
7
8
9
10
11
121314
15
16
171819
20
21
22
2324
25
26
27
28
29
30
31
32
33
34
35
36
37
38
39
40
41
42
43
4445
4695%99.5%
95%99.5%
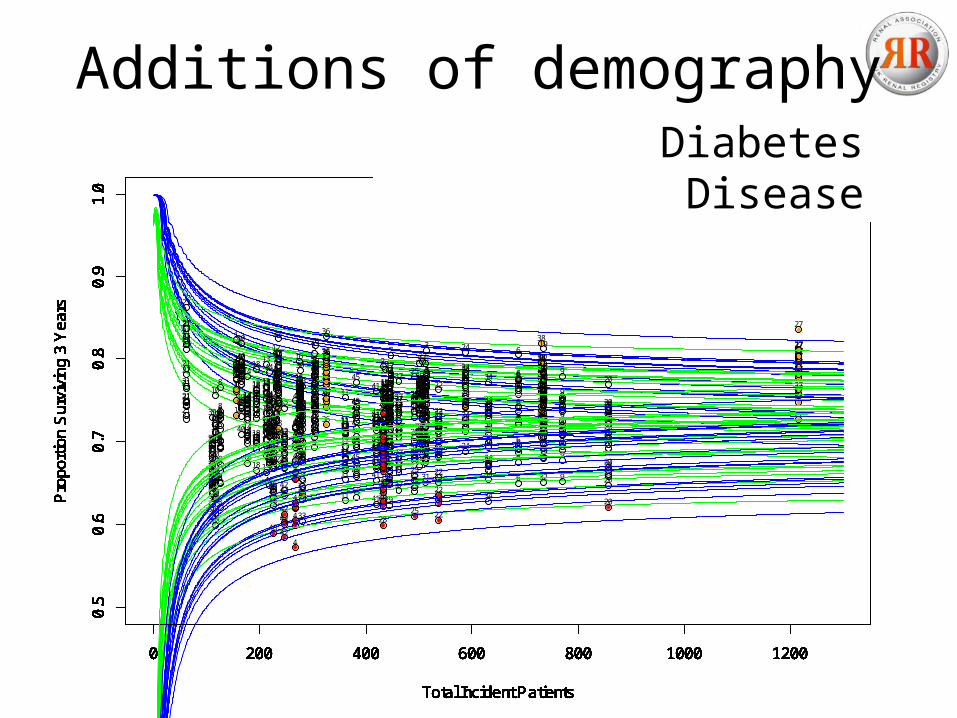
Additions of demography
0 200 400 600 800 1000 1200
0.5
0.6
0.7
0.8
0.9
1.0
Total Incident Patients
Pro
po
rtio
n S
urv
ivin
g 3
Ye
ars
Mean Centre 3yr Survival0.6971
1
2
3
4
5
6
7
8
9
10
11
121314
15
16
1718
19
20
21
22
23 24
25
26
27
28
29
30
31
32
33
34
35
36
37
38
39
40
41
42
43
4445
46
0 200 400 600 800 1000 1200
0.5
0.6
0.7
0.8
0.9
1.0
Total Incident Patients
Pro
po
rtio
n S
urv
ivin
g 3
Ye
ars
Mean Centre 3yr Survival0.6872
1
2
3
4
5
6
7
8
9
10
11
121314
15
16
1718
19
20
21
22
2324
25
26
27
28
29
30
31
32
33
34
35
36
37
38
39
40
41
42
43
44
45
46
0 200 400 600 800 1000 1200
0.5
0.6
0.7
0.8
0.9
1.0
Total Incident Patients
Pro
po
rtio
n S
urv
ivin
g 3
Ye
ars
Mean Centre 3yr Survival0.6561
1
2
3
4
5
6
7
8
9
10
11
1213
14
15
16
1718
19
20
21
22
23 24
25
26
27
28
29
30
31 32
33
34
35
36
37
38
39
40
41
42
43
44
45
46
0 200 400 600 800 1000 1200
0.5
0.6
0.7
0.8
0.9
1.0
Total Incident Patients
Pro
po
rtio
n S
urv
ivin
g 3
Ye
ars
Mean Centre 3yr Survival0.6788
1
2
3
4
5
6
7
8
9
10
11
1213
14
15
16
1718
19
20
21
22
23
24
25
26
27
28
29
3031 32
33
34
35
36
37
38
39
40
41
42
43
4445
46
0 200 400 600 800 1000 1200
0.5
0.6
0.7
0.8
0.9
1.0
Total Incident Patients
Pro
po
rtio
n S
urv
ivin
g 3
Ye
ars
Mean Centre 3yr Survival0.6908
1
2
3
4
5
6
7
8
9
10
11
1213
14
15
16
1718
19
20
21
22
23
24
25
26
27
28
29
3031 32
33
34
35
36
37
38
39
40
41
42
43
4445
46
0 200 400 600 800 1000 1200
0.5
0.6
0.7
0.8
0.9
1.0
Total Incident Patients
Pro
po
rtio
n S
urv
ivin
g 3
Ye
ars
Mean Centre 3yr Survival0.6954
1
2
3
4
5
6
7
8
9
10
11
121314
15
16
1718
19
20
21
22
23
24
25
26
27
28
29
3031 32
33
34
35
36
37
38
39
40
41
42
43
4445
46
0 200 400 600 800 1000 1200
0.5
0.6
0.7
0.8
0.9
1.0
Total Incident Patients
Pro
po
rtio
n S
urv
ivin
g 3
Ye
ars
Mean Centre 3yr Survival0.7155
1
2
3
4
5
6
7
8
9
10
11
1213
1415
16
1718
19
20
21
22
23
24
25
26
27
28
29
3031 32
33
34
35
36
37
38
39
40
41
42
43
4445
46
0 200 400 600 800 1000 1200
0.5
0.6
0.7
0.8
0.9
1.0
Total Incident Patients
Pro
po
rtio
n S
urv
ivin
g 3
Ye
ars
Mean Centre 3yr Survival0.7146
1
2
3
4
5
6
7
8
9
10
11
1213
1415
16
1718
19
20
21
22
23
24
25
26
27
28
29
3031 32
33
34
35
36
37
38
39
40
41
42
43
4445
46
0 200 400 600 800 1000 1200
0.5
0.6
0.7
0.8
0.9
1.0
Total Incident Patients
Pro
po
rtio
n S
urv
ivin
g 3
Ye
ars
Mean Centre 3yr Survival0.7188
1
2
3
4
5
6
7
8
9
10
11
1213
1415
16
1718
19
20
21
22
23
24
25
26
27
28
29
3031 32
33
34
35
36
37
38
39
40
41
42
43
4445
46
0 200 400 600 800 1000 1200
0.5
0.6
0.7
0.8
0.9
1.0
Total Incident Patients
Pro
po
rtio
n S
urv
ivin
g 3
Ye
ars
Mean Centre 3yr Survival0.7265
1
2
3
4
56
7
8
9
10
11
1213
14 15
16
1718
19
20
21
22
2324
25
26
27
28
29
30 31 32
33
34
35
36
37
38
39
40
41
42
43
4445
46
0 200 400 600 800 1000 1200
0.5
0.6
0.7
0.8
0.9
1.0
Total Incident Patients
Pro
po
rtio
n S
urv
ivin
g 3
Ye
ars
Mean Centre 3yr Survival0.7323
1
2
3
4
56
7
8
9
10
11
121314 15
16
1718
19
20
21
22
2324
25
26
27
28
29
30 31 32
33
34
35
36
37
38
39
40
41
42
43
44 45
46
0 200 400 600 800 1000 1200
0.5
0.6
0.7
0.8
0.9
1.0
Total Incident Patients
Pro
po
rtio
n S
urv
ivin
g 3
Ye
ars
Mean Centre 3yr Survival0.7433
1
2
3
4
5 67
8
9
1011
1213
1415
16
1718
19
20
21
22
2324
25
26
27
28
29
30 31 32
3334
35
36
37
38
39
40
41
42
43
4445
46
0 200 400 600 800 1000 1200
0.5
0.6
0.7
0.8
0.9
1.0
Total Incident Patients
Pro
po
rtio
n S
urv
ivin
g 3
Ye
ars
Mean Centre 3yr Survival0.7471
1
2
3
4
5 67
8
9
10 11
1213
14 1516
1718
19
20
21
22
2324
25
26
27
28
29
30 31 32
3334
35
36
37
38
39
40
41
42
43
4445
46
0 200 400 600 800 1000 1200
0.5
0.6
0.7
0.8
0.9
1.0
Total Incident Patients
Pro
po
rtio
n S
urv
ivin
g 3
Ye
ars
Mean Centre 3yr Survival0.7504
1
2
3
4
5 67
8
9
10 11
1213
1415
16
1718
19
20
21
22
2324
25
26
27
28
29
30 31 32
3334
35
36
37
38
39
40
41
42
43
4445
46
0 200 400 600 800 1000 1200
0.5
0.6
0.7
0.8
0.9
1.0
Total Incident Patients
Pro
po
rtio
n S
urv
ivin
g 3
Ye
ars
Mean Centre 3yr Survival0.7517
1
2
3
4
5 67
8
9
10 11
1213
1415
16
1718
19
20
21
22
2324
25
26
27
28
29
30 3132
3334
35
36
37
38
39
40
41
42
43
4445
46
0 200 400 600 800 1000 1200
0.5
0.6
0.7
0.8
0.9
1.0
Total Incident Patients
Pro
po
rtio
n S
urv
ivin
g 3
Ye
ars
Mean Centre 3yr Survival0.7581
1
2
3
4
5 67
8
9
10 11
1213
141516
1718
19
20
21
22
2324
25
26
27
28
29
30 31 32
33 34
35
36
37
38
39
40
41
42
43
4445
46
0 200 400 600 800 1000 1200
0.5
0.6
0.7
0.8
0.9
1.0
Total Incident Patients
Pro
po
rtio
n S
urv
ivin
g 3
Ye
ars
Mean Centre 3yr Survival0.7588
1
2
3
4
5 67
8
9
10 11
1213
14
1516
1718
19
20
21
22
2324
25
26
27
28
29
3031 32
33 34
35
36
37
38
39
40
41
42
43
4445
46
0 200 400 600 800 1000 1200
0.5
0.6
0.7
0.8
0.9
1.0
Total Incident Patients
Pro
po
rtio
n S
urv
ivin
g 3
Ye
ars
Mean Centre 3yr Survival0.7607
1
2
3
4
5 67
8
9
1011
1213
14
1516
1718
19
20
21
22
23
24
25
26
27
28
29
3031 32
33 34
35
36
37
38
39
40
41
42
43
4445
46
0 200 400 600 800 1000 1200
0.5
0.6
0.7
0.8
0.9
1.0
Total Incident Patients
Pro
po
rtio
n S
urv
ivin
g 3
Ye
ars
Mean Centre 3yr Survival0.7875
1
2
3
4
5 67
89
10 11
1213
1415
161718
19
20
21
22
2324
25
26
27
28
29
3031 32
33 34
35
36
37
38
39
40
41
42
43
4445
46
EthnicitySocioeconomic StatusYear of StartCOPDArrhythmiaHeart FailureCABGDepressionCerebrovascular DiseaseMyocardial InfarctionLymphomaNeurological DiseaseVascular ProcedureValvular Heart DiseaseCancerConnective Tissue DiseasePeptic Ulcer DiseaseClaudicationDiabetes

Why are there so few changes in outliers with additions of comorbidity?
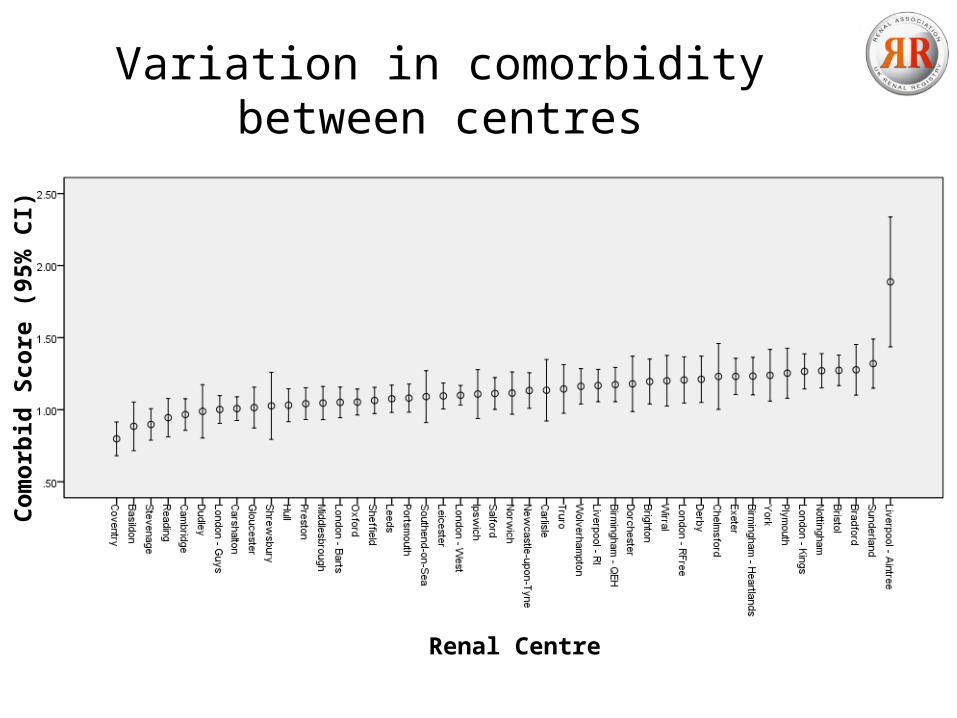
Variation in comorbidity between centres
Renal Centre
Com
orbi
d Sc
ore
(95%
CI)
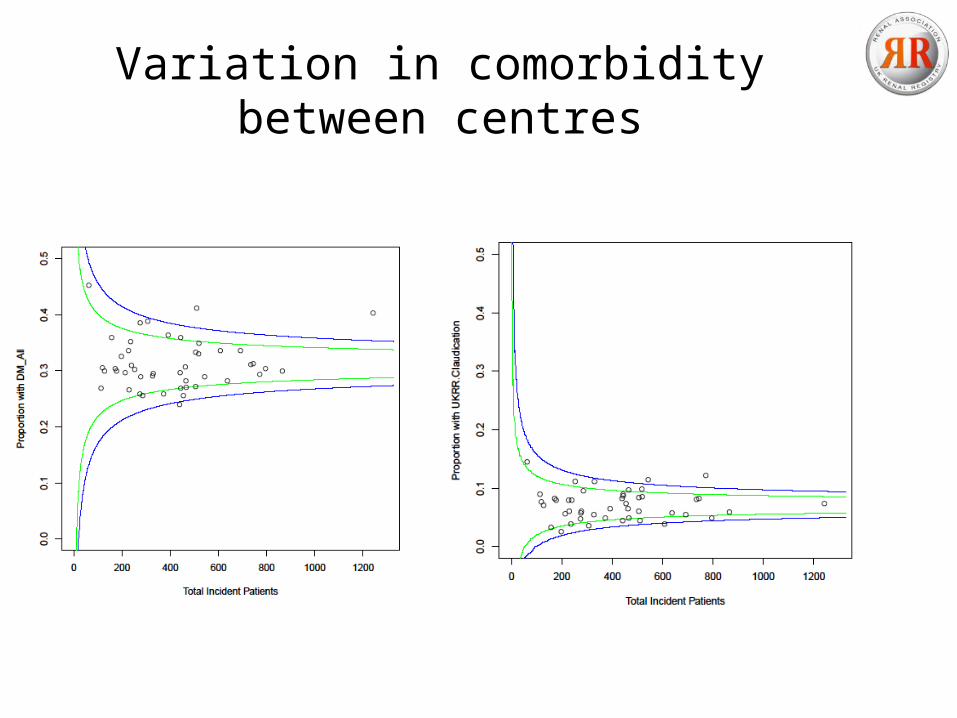
Variation in comorbidity between centres
Cent
re P
reva
lenc
e of
Dia
bete
s
Cent
re P
reva
lenc
e of
Cla
udic
ation
Summary at this point
• Linked data can allow us to collect ethnicity and comorbidity data in 96.4% of patients
• A large proportion of variation was explained by age, ethnicity and socioeconomic status
• Comorbidity has a significant effect on individual survival
• Due to similar comorbidity prevalence across centres, comorbidity has a modest impact on centre specific outcomes
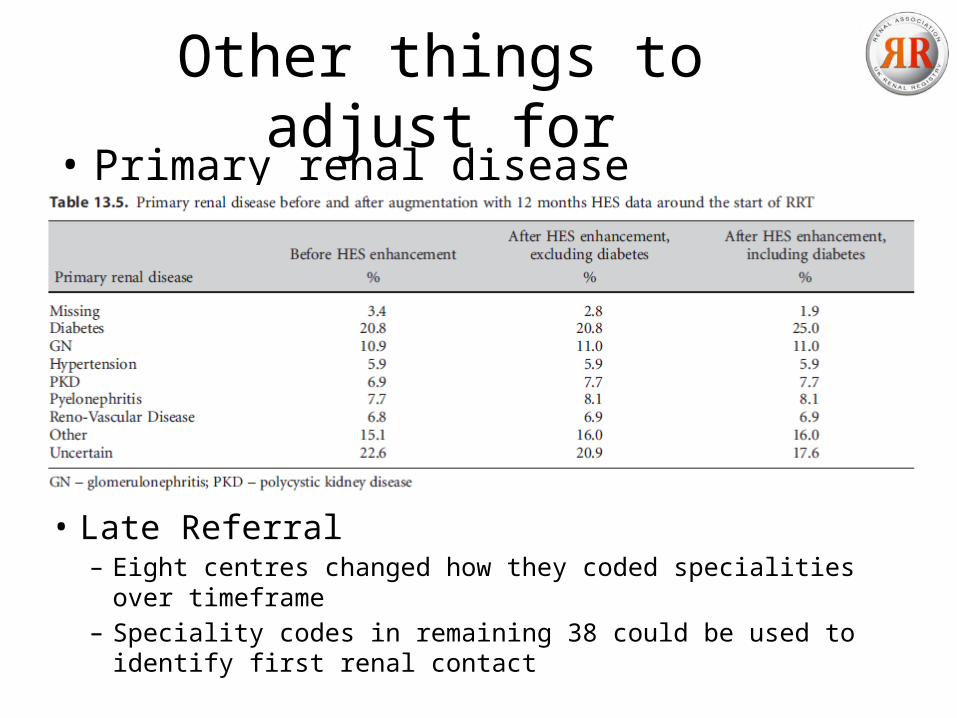
Other things to adjust for• Primary renal disease
• Late Referral– Eight centres changed how they coded specialities over timeframe– Speciality codes in remaining 38 could be used to identify first
renal contact
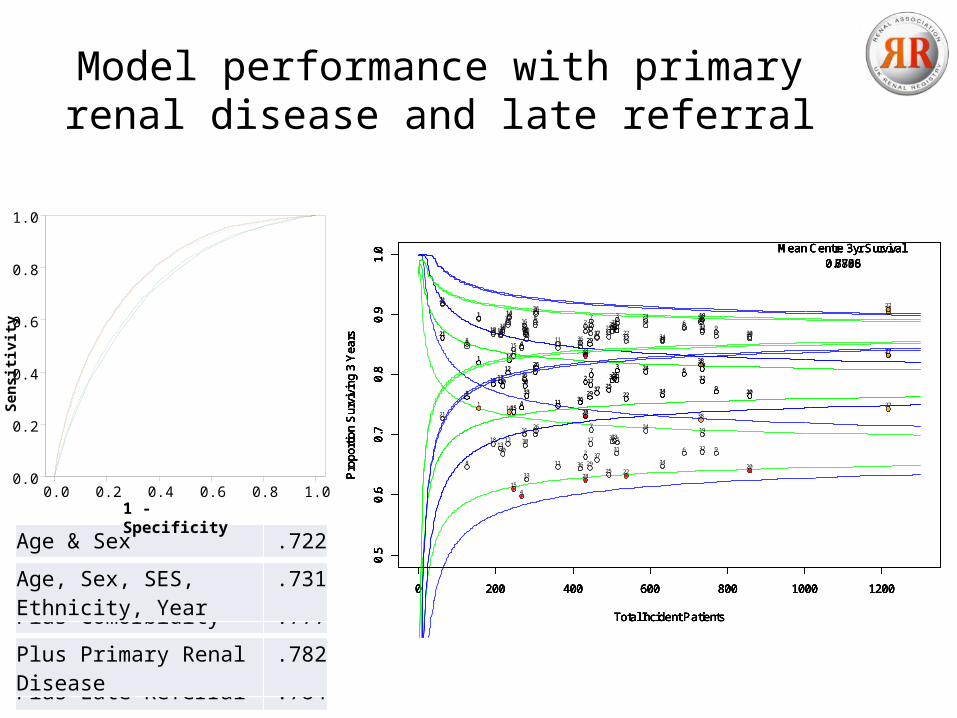
Model performance with primary renal disease and late referral
0 200 400 600 800 1000 1200
0.5
0.6
0.7
0.8
0.9
1.0
Total Incident Patients
Pro
po
rtio
n S
urv
ivin
g 3
Ye
ars
Mean Centre 3yr Survival0.7858
1
2
3
4
5 67
89
10
11
12
13
14
15
161718
19
20
21
22
2324
25
26
27
28
29
3031 32
33 34
35
36
37
38
0 200 400 600 800 1000 1200
0.5
0.6
0.7
0.8
0.9
1.0
Total Incident Patients
Pro
po
rtio
n S
urv
ivin
g 3
Ye
ars
Mean Centre 3yr Survival0.6746
1
2
3
4
5
6
7
8
910
11
1213
14
15
16
1718
19
20
21
22
23
24
25
26
27
28
29
3031 32
33
34
35
36
37
38
0 200 400 600 800 1000 1200
0.5
0.6
0.7
0.8
0.9
1.0
Total Incident Patients
Pro
po
rtio
n S
urv
ivin
g 3
Ye
ars
Mean Centre 3yr Survival0.7858
1
2
3
4
5 67
89
10
11
12
13
14
15
161718
19
20
21
22
2324
25
26
27
28
29
3031 32
33 34
35
36
37
38
0 200 400 600 800 1000 1200
0.5
0.6
0.7
0.8
0.9
1.0
Total Incident Patients
Pro
po
rtio
n S
urv
ivin
g 3
Ye
ars
Mean Centre 3yr Survival0.8706
1
2
3
4
5 67
8
910
11
12
13
14
15
161718
19
20
21
22
2324
25
26 27
28
29
3031 32
33 34
35
3637
38
0 200 400 600 800 1000 1200
0.5
0.6
0.7
0.8
0.9
1.0
Total Incident Patients
Pro
po
rtio
n S
urv
ivin
g 3
Ye
ars
Mean Centre 3yr Survival0.8736
12
3
4
56
7
8
910
11
12
13
14
15
16 1718
19
20
21
22
2324
25
26 27
28
29
30 31 323334
35
36
37
38
Age & Sex .722
Plus Late Referral .784
Plus Primary Renal Disease .782
Plus Comorbidity .777
Age, Sex, SES, Ethnicity, Year .731
1 - Specificity1.00.80.60.40.20.0
Sen
siti
vity
1.0
0.8
0.6
0.4
0.2
0.0
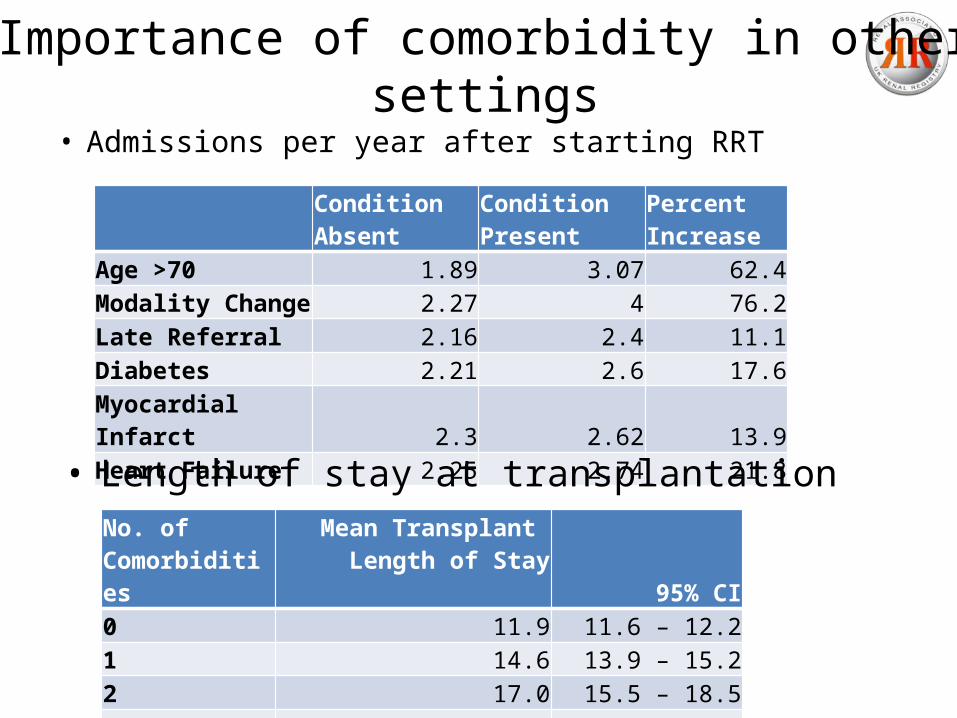
Importance of comorbidity in other settings
• Admissions per year after starting RRTCondition Absent
Condition Present
Percent Increase
Age >70 1.89 3.07 62.4Modality Change 2.27 4 76.2Late Referral 2.16 2.4 11.1Diabetes 2.21 2.6 17.6Myocardial Infarct 2.3 2.62 13.9Heart Failure 2.25 2.74 21.8
No. of Comorbidities
Mean Transplant Length of Stay 95% CI
0 11.9 11.6 – 12.21 14.6 13.9 – 15.22 17.0 15.5 – 18.5>=3 20.8 17.3 – 24.3
• Length of stay at transplantation

Acknowledgements• UK Renal Registry
– All the statisticians & data staff– Charlie Tomson– David Ansell
• Research Capability Programme– Christian Newsome– Alan Barcroft
• ScHARR– Mike Campbell– Richard Jacques
• Kidney Research UK
School ofHealth andRelatedResearch


![Introduction to Comorbidity Auto Saved]](https://img.pdfslide.net/doc/110x75/577d33b31a28ab3a6b8b7d51/introduction-to-comorbidity-auto-saved.jpg)