Embed Size (px)
Citation preview

WHAT IS THE HEALTH CARESERVICES DASHBOARD?A monthly report that:
Consolidates key performance indicators and other important organization metrics across health care programs and service areas.Provides information typically monitored by health care organizations, such as patient outcomes, access to care, and utilization and cost.Helps the organization regularly assess progress in meeting annual performance objectives.Helps health care executives and managers identify areas that may need improvement.
Statewide DashboardView statewide performance trends
Institution ScorecardsSee performance data for a specific institution
Click the icons below for more information:
The Dashboard is intended to support headquarters and institution staff in identifying opportunities for improvement and monitoring progress toward performance objectives. However,there are limitations to the information : California Correctional Health Care Services (CCHCS) has standardized many data collection processes, provided training to promote consistencyin data reporting, and invested in information system modifications to improve data quality. However, much of the data featured in the Health Care Services Dashboard is gatheredthrough multiple networked databases or self‐reported by institutions, and the data have not been validated or verified. Performance objectives and benchmarks were generatedinternally for quality improvement purposes and are not necessarily intended to reflect compliance with court mandates or a determination regarding constitutional levels of care.
Institution ComparisonsCompare results for all measures among California prisons
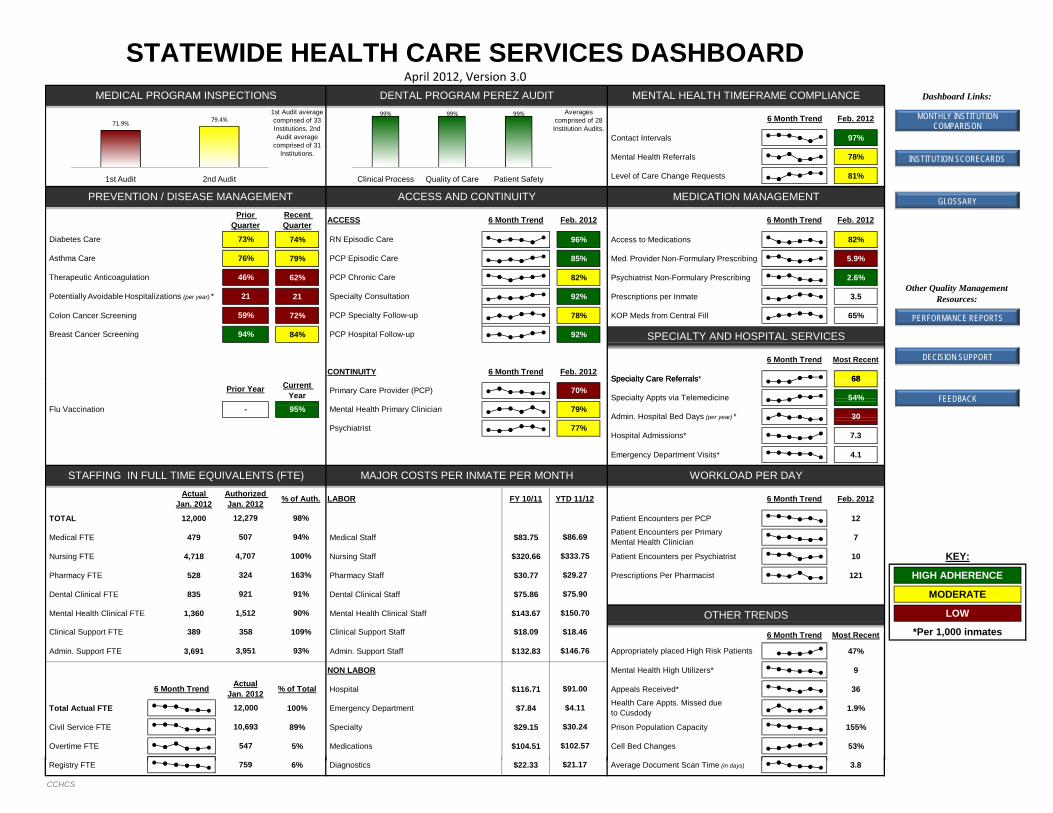
Contact Intervals 97%
Mental Health Referrals 78%
Level of Care Change Requests 81%
74% 96% Access to Medications 82%
79% 85% Med. Provider Non-Formulary Prescribing 5.9%
62% 82% Psychiatrist Non-Formulary Prescribing 2.6%
21 92% Prescriptions per Inmate 3.5
Colon Cancer Screening 72% 78% KOP Meds from Central Fill 65%
84% 92%
21
Diabetes Care
76%
59%
Potentially Avoidable Hospitalizations (per year) *
RN Episodic Care
PCP Episodic Care
PCP Specialty Follow-up
Specialty Consultation
PCP Chronic Care
6 Month Trend
SPECIALTY AND HOSPITAL SERVICES
68Specialty Care Referrals*
PCP Hospital Follow-up94%
CONTINUITY
STATEWIDE HEALTH CARE SERVICES DASHBOARDApril 2012, Version 3.0
Dashboard Links:
73%
Therapeutic Anticoagulation
Asthma Care
46%
6 Month TrendRecent Quarter
PREVENTION / DISEASE MANAGEMENT ACCESS AND CONTINUITY MEDICATION MANAGEMENT
Feb. 20126 Month Trend
MEDICAL PROGRAM INSPECTIONS DENTAL PROGRAM PEREZ AUDIT MENTAL HEALTH TIMEFRAME COMPLIANCE
Feb. 2012Feb. 2012 6 Month Trend
1st Audit average comprised of 33 Institutions. 2nd Audit average
comprised of 31 Institutions.
Averages comprised of 28 Institution Audits.
ACCESS
Other Quality Management Resources:
Breast Cancer Screening
Most RecentFeb. 2012
Prior Quarter
6 Month Trend
MONTHLY INSTITUTION COMPARISON
INSTITUTION SCORECARDS
GLOSSARY
PERFORMANCE REPORTS
DECISION SUPPORT
99% 99% 99%
Clinical Process Quality of Care Patient Safety
71.9% 79.4%
1st Audit 2nd Audit
Emergency Department Visits* 4.1
TOTAL 12,000 Patient Encounters per PCP 12
Medical FTE 479 Medical Staff $83.75 7
Nursing FTE 4,718 Nursing Staff $320.66 Patient Encounters per Psychiatrist 10 KEY:
Pharmacy FTE 528 Pharmacy Staff $30.77 Prescriptions Per Pharmacist 121 HIGH ADHERENCE
Dental Clinical FTE 835 Dental Clinical Staff $75.86 MODERATE
Mental Health Clinical FTE 1,360 Mental Health Clinical Staff $143.67 LOW
Admin. Support FTE 3,691 Admin. Support Staff $132.83 47%
NON LABOR Mental Health High Utilizers* 9
Hospital $116.71 Appeals Received* 36
Total Actual FTE 100% Emergency Department $7.84 1.9%
Civil Service FTE 89% Specialty $29.15 Prison Population Capacity 155%
Overtime FTE 5% Medications $104.51 Cell Bed Changes 53%
MAJOR COSTS PER INMATE PER MONTH
77%
Prior Year
-
98%
94%
Clinical Support FTE
79%
$86.69
$333.75
$29.27
$75.90
$150.70
358 109%
Authorized Jan. 2012 LABOR FY 10/11 YTD 11/12
324
921 91%
STAFFING IN FULL TIME EQUIVALENTS (FTE)
% of Auth.Actual Jan. 2012
*Per 1,000 inmates
$4.11
Appropriately placed High Risk Patients
Health Care Appts. Missed due to Cusdody
$30.24
$102.57
$91.00
$18.09 $18.46
$146.76
Psychiatrist7.3
1,512
70% Specialty Appts via Telemedicine 54%
68 Specialty Care Referrals Primary Care Provider (PCP)
Mental Health Primary Clinician
3,951
Clinical Support Staff
30
Current Year
Flu Vaccination 95%
389
Hospital Admissions*
6 Month Trend ActualJan. 2012 % of Total
12,000
10,693
547
93%
Feb. 20126 Month Trend
6 Month Trend Most Recent
Admin. Hospital Bed Days (per year) *
Patient Encounters per Primary Mental Health Clinician
WORKLOAD PER DAY
OTHER TRENDS
100%
163%
12,279
507
4,707
90%
FEEDBACK
Registry FTE 6% Diagnostics $22.33 Average Document Scan Time (in days) 3.8$21.17
CCHCS
759
ASP
CA
L
CC
C
CC
I
CC
WF
CEN CIM
CIW
CM
C
CM
F
CO
R
CR
C
CTF
CVS
P
DVI
FSP
HD
SP
ISP
KVS
P
LAC
MC
SP
NK
SP
PBSP
PVSP
RJD
SAC
SATF
SCC
SOL
SQ SVSP
VSPW
WSP
STA
TE
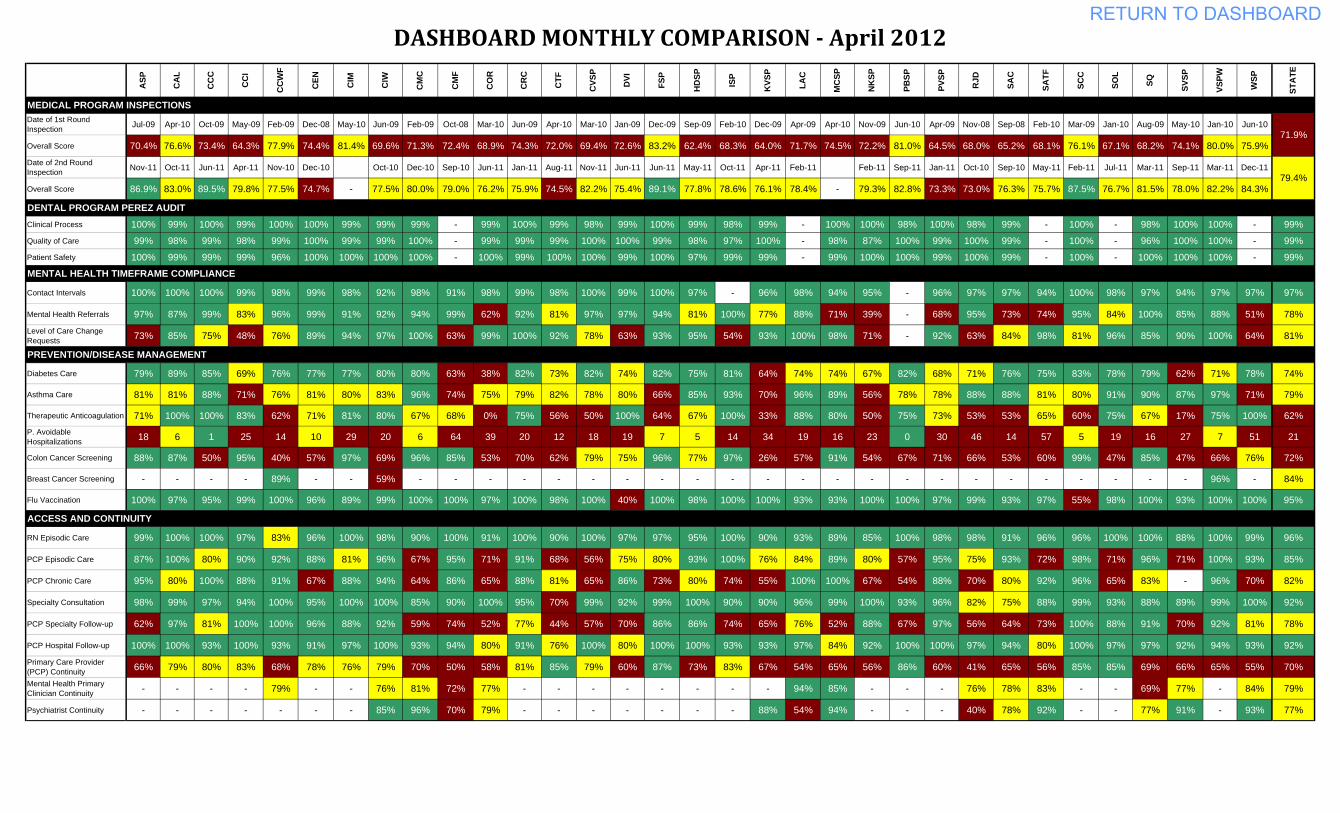
Date of 1st Round Inspection Jul-09 Apr-10 Oct-09 May-09 Feb-09 Dec-08 May-10 Jun-09 Feb-09 Oct-08 Mar-10 Jun-09 Apr-10 Mar-10 Jan-09 Dec-09 Sep-09 Feb-10 Dec-09 Apr-09 Apr-10 Nov-09 Jun-10 Apr-09 Nov-08 Sep-08 Feb-10 Mar-09 Jan-10 Aug-09 May-10 Jan-10 Jun-10
Overall Score 70.4% 76.6% 73.4% 64.3% 77.9% 74.4% 81.4% 69.6% 71.3% 72.4% 68.9% 74.3% 72.0% 69.4% 72.6% 83.2% 62.4% 68.3% 64.0% 71.7% 74.5% 72.2% 81.0% 64.5% 68.0% 65.2% 68.1% 76.1% 67.1% 68.2% 74.1% 80.0% 75.9%
Date of 2nd Round Inspection Nov-11 Oct-11 Jun-11 Apr-11 Nov-10 Dec-10 Oct-10 Dec-10 Sep-10 Jun-11 Jan-11 Aug-11 Nov-11 Jun-11 Jun-11 May-11 Oct-11 Apr-11 Feb-11 Feb-11 Sep-11 Jan-11 Oct-10 Sep-10 May-11 Feb-11 Jul-11 Mar-11 Sep-11 Mar-11 Dec-11
Overall Score 86.9% 83.0% 89.5% 79.8% 77.5% 74.7% - 77.5% 80.0% 79.0% 76.2% 75.9% 74.5% 82.2% 75.4% 89.1% 77.8% 78.6% 76.1% 78.4% - 79.3% 82.8% 73.3% 73.0% 76.3% 75.7% 87.5% 76.7% 81.5% 78.0% 82.2% 84.3%
Clinical Process 100% 99% 100% 99% 100% 100% 99% 99% 99% - 99% 100% 99% 98% 99% 100% 99% 98% 99% - 100% 100% 98% 100% 98% 99% - 100% - 98% 100% 100% - 99%
Quality of Care 99% 98% 99% 98% 99% 100% 99% 99% 100% - 99% 99% 99% 100% 100% 99% 98% 97% 100% - 98% 87% 100% 99% 100% 99% - 100% - 96% 100% 100% - 99%
Patient Safety 100% 99% 99% 99% 96% 100% 100% 100% 100% - 100% 99% 100% 100% 99% 100% 97% 99% 99% - 99% 100% 100% 99% 100% 99% - 100% - 100% 100% 100% - 99%
Contact Intervals 100% 100% 100% 99% 98% 99% 98% 92% 98% 91% 98% 99% 98% 100% 99% 100% 97% - 96% 98% 94% 95% - 96% 97% 97% 94% 100% 98% 97% 94% 97% 97% 97%
Mental Health Referrals 97% 87% 99% 83% 96% 99% 91% 92% 94% 99% 62% 92% 81% 97% 97% 94% 81% 100% 77% 88% 71% 39% - 68% 95% 73% 74% 95% 84% 100% 85% 88% 51% 78%
Level of Care Change Requests 73% 85% 75% 48% 76% 89% 94% 97% 100% 63% 99% 100% 92% 78% 63% 93% 95% 54% 93% 100% 98% 71% - 92% 63% 84% 98% 81% 96% 85% 90% 100% 64% 81%
Diabetes Care 79% 89% 85% 69% 76% 77% 77% 80% 80% 63% 38% 82% 73% 82% 74% 82% 75% 81% 64% 74% 74% 67% 82% 68% 71% 76% 75% 83% 78% 79% 62% 71% 78% 74%
Asthma Care 81% 81% 88% 71% 76% 81% 80% 83% 96% 74% 75% 79% 82% 78% 80% 66% 85% 93% 70% 96% 89% 56% 78% 78% 88% 88% 81% 80% 91% 90% 87% 97% 71% 79%
Therapeutic Anticoagulation 71% 100% 100% 83% 62% 71% 81% 80% 67% 68% 0% 75% 56% 50% 100% 64% 67% 100% 33% 88% 80% 50% 75% 73% 53% 53% 65% 60% 75% 67% 17% 75% 100% 62%P. Avoidable Hospitalizations 18 6 1 25 14 10 29 20 6 64 39 20 12 18 19 7 5 14 34 19 16 23 0 30 46 14 57 5 19 16 27 7 51 21
Colon Cancer Screening 88% 87% 50% 95% 40% 57% 97% 69% 96% 85% 53% 70% 62% 79% 75% 96% 77% 97% 26% 57% 91% 54% 67% 71% 66% 53% 60% 99% 47% 85% 47% 66% 76% 72%
Breast Cancer Screening - - - - 89% - - 59% - - - - - - - - - - - - - - - - - - - - - - - 96% - 84%
Flu Vaccination 100% 97% 95% 99% 100% 96% 89% 99% 100% 100% 97% 100% 98% 100% 40% 100% 98% 100% 100% 93% 93% 100% 100% 97% 99% 93% 97% 55% 98% 100% 93% 100% 100% 95%
RN Episodic Care 99% 100% 100% 97% 83% 96% 100% 98% 90% 100% 91% 100% 90% 100% 97% 97% 95% 100% 90% 93% 89% 85% 100% 98% 98% 91% 96% 96% 100% 100% 88% 100% 99% 96%
PCP Episodic Care 87% 100% 80% 90% 92% 88% 81% 96% 67% 95% 71% 91% 68% 56% 75% 80% 93% 100% 76% 84% 89% 80% 57% 95% 75% 93% 72% 98% 71% 96% 71% 100% 93% 85%
PCP Chronic Care 95% 80% 100% 88% 91% 67% 88% 94% 64% 86% 65% 88% 81% 65% 86% 73% 80% 74% 55% 100% 100% 67% 54% 88% 70% 80% 92% 96% 65% 83% - 96% 70% 82%
Specialty Consultation 98% 99% 97% 94% 100% 95% 100% 100% 85% 90% 100% 95% 70% 99% 92% 99% 100% 90% 90% 96% 99% 100% 93% 96% 82% 75% 88% 99% 93% 88% 89% 99% 100% 92%
PCP Specialty Follow-up 62% 97% 81% 100% 100% 96% 88% 92% 59% 74% 52% 77% 44% 57% 70% 86% 86% 74% 65% 76% 52% 88% 67% 97% 56% 64% 73% 100% 88% 91% 70% 92% 81% 78%
PCP Hospital Follow-up 100% 100% 93% 100% 93% 91% 97% 100% 93% 94% 80% 91% 76% 100% 80% 100% 100% 93% 93% 97% 84% 92% 100% 100% 97% 94% 80% 100% 97% 97% 92% 94% 93% 92%
Primary Care Provider (PCP) Continuity 66% 79% 80% 83% 68% 78% 76% 79% 70% 50% 58% 81% 85% 79% 60% 87% 73% 83% 67% 54% 65% 56% 86% 60% 41% 65% 56% 85% 85% 69% 66% 65% 55% 70%
Mental Health Primary Clinician Continuity - - - - 79% - - 76% 81% 72% 77% - - - - - - - - 94% 85% - - - 76% 78% 83% - - 69% 77% - 84% 79%
Psychiatrist Continuity - - - - - - - 85% 96% 70% 79% - - - - - - - 88% 54% 94% - - - 40% 78% 92% - - 77% 91% - 93% 77%
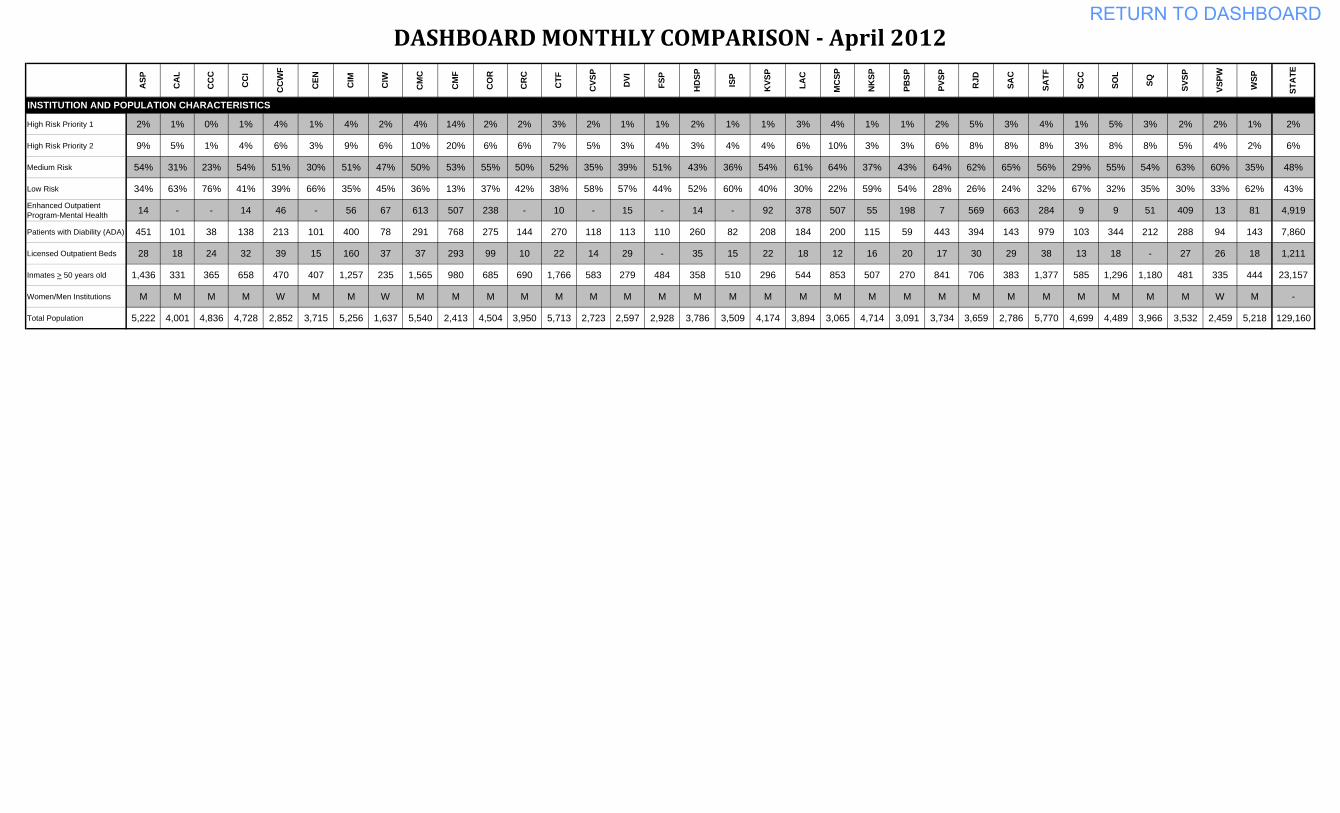
DASHBOARD MONTHLY COMPARISON April 2012
79.4%
71.9%
MEDICAL PROGRAM INSPECTIONS
DENTAL PROGRAM PEREZ AUDIT
MENTAL HEALTH TIMEFRAME COMPLIANCE
PREVENTION/DISEASE MANAGEMENT
ACCESS AND CONTINUITY
RETURN TO DASHBOARD
ASP
CA
L
CC
C
CC
I
CC
WF
CEN CIM
CIW
CM
C
CM
F
CO
R
CR
C
CTF
CVS
P
DVI
FSP
HD
SP
ISP
KVS
P
LAC
MC
SP
NK
SP
PBSP
PVSP
RJD
SAC
SATF
SCC
SOL
SQ SVSP
VSPW
WSP
STA
TE
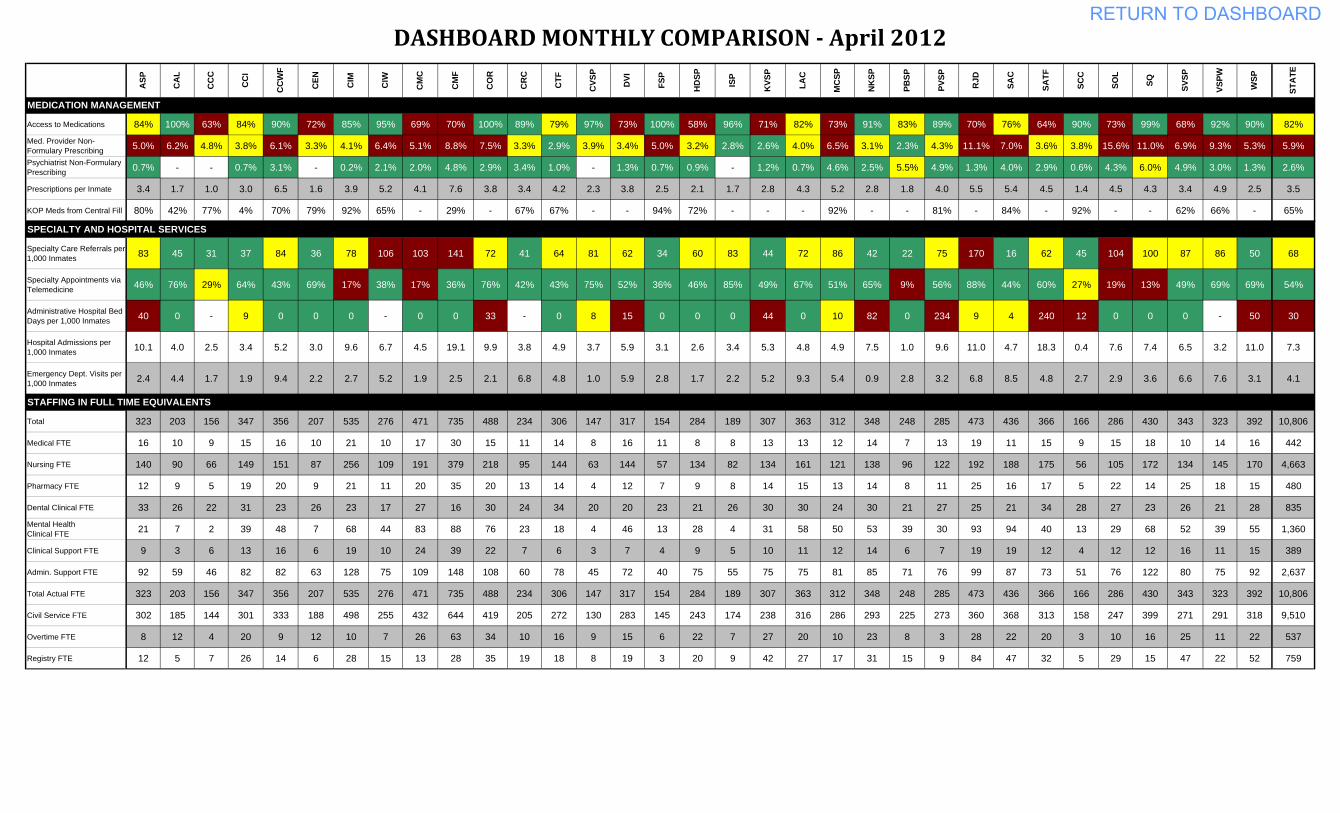
DASHBOARD MONTHLY COMPARISON April 2012
Access to Medications 84% 100% 63% 84% 90% 72% 85% 95% 69% 70% 100% 89% 79% 97% 73% 100% 58% 96% 71% 82% 73% 91% 83% 89% 70% 76% 64% 90% 73% 99% 68% 92% 90% 82%
Med. Provider Non-Formulary Prescribing 5.0% 6.2% 4.8% 3.8% 6.1% 3.3% 4.1% 6.4% 5.1% 8.8% 7.5% 3.3% 2.9% 3.9% 3.4% 5.0% 3.2% 2.8% 2.6% 4.0% 6.5% 3.1% 2.3% 4.3% 11.1% 7.0% 3.6% 3.8% 15.6% 11.0% 6.9% 9.3% 5.3% 5.9%
Psychiatrist Non-Formulary Prescribing 0.7% - - 0.7% 3.1% - 0.2% 2.1% 2.0% 4.8% 2.9% 3.4% 1.0% - 1.3% 0.7% 0.9% - 1.2% 0.7% 4.6% 2.5% 5.5% 4.9% 1.3% 4.0% 2.9% 0.6% 4.3% 6.0% 4.9% 3.0% 1.3% 2.6%
Prescriptions per Inmate 3.4 1.7 1.0 3.0 6.5 1.6 3.9 5.2 4.1 7.6 3.8 3.4 4.2 2.3 3.8 2.5 2.1 1.7 2.8 4.3 5.2 2.8 1.8 4.0 5.5 5.4 4.5 1.4 4.5 4.3 3.4 4.9 2.5 3.5
KOP Meds from Central Fill 80% 42% 77% 4% 70% 79% 92% 65% - 29% - 67% 67% - - 94% 72% - - - 92% - - 81% - 84% - 92% - - 62% 66% - 65%
Specialty Care Referrals per 1,000 Inmates 83 45 31 37 84 36 78 106 103 141 72 41 64 81 62 34 60 83 44 72 86 42 22 75 170 16 62 45 104 100 87 86 50 68
Specialty Appointments via Telemedicine 46% 76% 29% 64% 43% 69% 17% 38% 17% 36% 76% 42% 43% 75% 52% 36% 46% 85% 49% 67% 51% 65% 9% 56% 88% 44% 60% 27% 19% 13% 49% 69% 69% 54%
Administrative Hospital Bed Days per 1,000 Inmates 40 0 - 9 0 0 0 - 0 0 33 - 0 8 15 0 0 0 44 0 10 82 0 234 9 4 240 12 0 0 0 - 50 30
Hospital Admissions per 1,000 Inmates 10.1 4.0 2.5 3.4 5.2 3.0 9.6 6.7 4.5 19.1 9.9 3.8 4.9 3.7 5.9 3.1 2.6 3.4 5.3 4.8 4.9 7.5 1.0 9.6 11.0 4.7 18.3 0.4 7.6 7.4 6.5 3.2 11.0 7.3
Emergency Dept. Visits per 1,000 Inmates 2.4 4.4 1.7 1.9 9.4 2.2 2.7 5.2 1.9 2.5 2.1 6.8 4.8 1.0 5.9 2.8 1.7 2.2 5.2 9.3 5.4 0.9 2.8 3.2 6.8 8.5 4.8 2.7 2.9 3.6 6.6 7.6 3.1 4.1
Total 323 203 156 347 356 207 535 276 471 735 488 234 306 147 317 154 284 189 307 363 312 348 248 285 473 436 366 166 286 430 343 323 392 10,806
Medical FTE 16 10 9 15 16 10 21 10 17 30 15 11 14 8 16 11 8 8 13 13 12 14 7 13 19 11 15 9 15 18 10 14 16 442
Nursing FTE 140 90 66 149 151 87 256 109 191 379 218 95 144 63 144 57 134 82 134 161 121 138 96 122 192 188 175 56 105 172 134 145 170 4,663
Pharmacy FTE 12 9 5 19 20 9 21 11 20 35 20 13 14 4 12 7 9 8 14 15 13 14 8 11 25 16 17 5 22 14 25 18 15 480
Dental Clinical FTE 33 26 22 31 23 26 23 17 27 16 30 24 34 20 20 23 21 26 30 30 24 30 21 27 25 21 34 28 27 23 26 21 28 835
Mental Health Clinical FTE 21 7 2 39 48 7 68 44 83 88 76 23 18 4 46 13 28 4 31 58 50 53 39 30 93 94 40 13 29 68 52 39 55 1,360
Clinical Support FTE 9 3 6 13 16 6 19 10 24 39 22 7 6 3 7 4 9 5 10 11 12 14 6 7 19 19 12 4 12 12 16 11 15 389
Admin. Support FTE 92 59 46 82 82 63 128 75 109 148 108 60 78 45 72 40 75 55 75 75 81 85 71 76 99 87 73 51 76 122 80 75 92 2,637
Total Actual FTE 323 203 156 347 356 207 535 276 471 735 488 234 306 147 317 154 284 189 307 363 312 348 248 285 473 436 366 166 286 430 343 323 392 10,806
Civil Service FTE 302 185 144 301 333 188 498 255 432 644 419 205 272 130 283 145 243 174 238 316 286 293 225 273 360 368 313 158 247 399 271 291 318 9,510
Overtime FTE 8 12 4 20 9 12 10 7 26 63 34 10 16 9 15 6 22 7 27 20 10 23 8 3 28 22 20 3 10 16 25 11 22 537
Registry FTE 12 5 7 26 14 6 28 15 13 28 35 19 18 8 19 3 20 9 42 27 17 31 15 9 84 47 32 5 29 15 47 22 52 759
MEDICATION MANAGEMENT
SPECIALTY AND HOSPITAL SERVICES
STAFFING IN FULL TIME EQUIVALENTS
RETURN TO DASHBOARD
ASP
CA
L
CC
C
CC
I
CC
WF
CEN CIM
CIW
CM
C
CM
F
CO
R
CR
C
CTF
CVS
P
DVI
FSP
HD
SP
ISP
KVS
P
LAC
MC
SP
NK
SP
PBSP
PVSP
RJD
SAC
SATF
SCC
SOL
SQ SVSP
VSPW
WSP
STA
TE
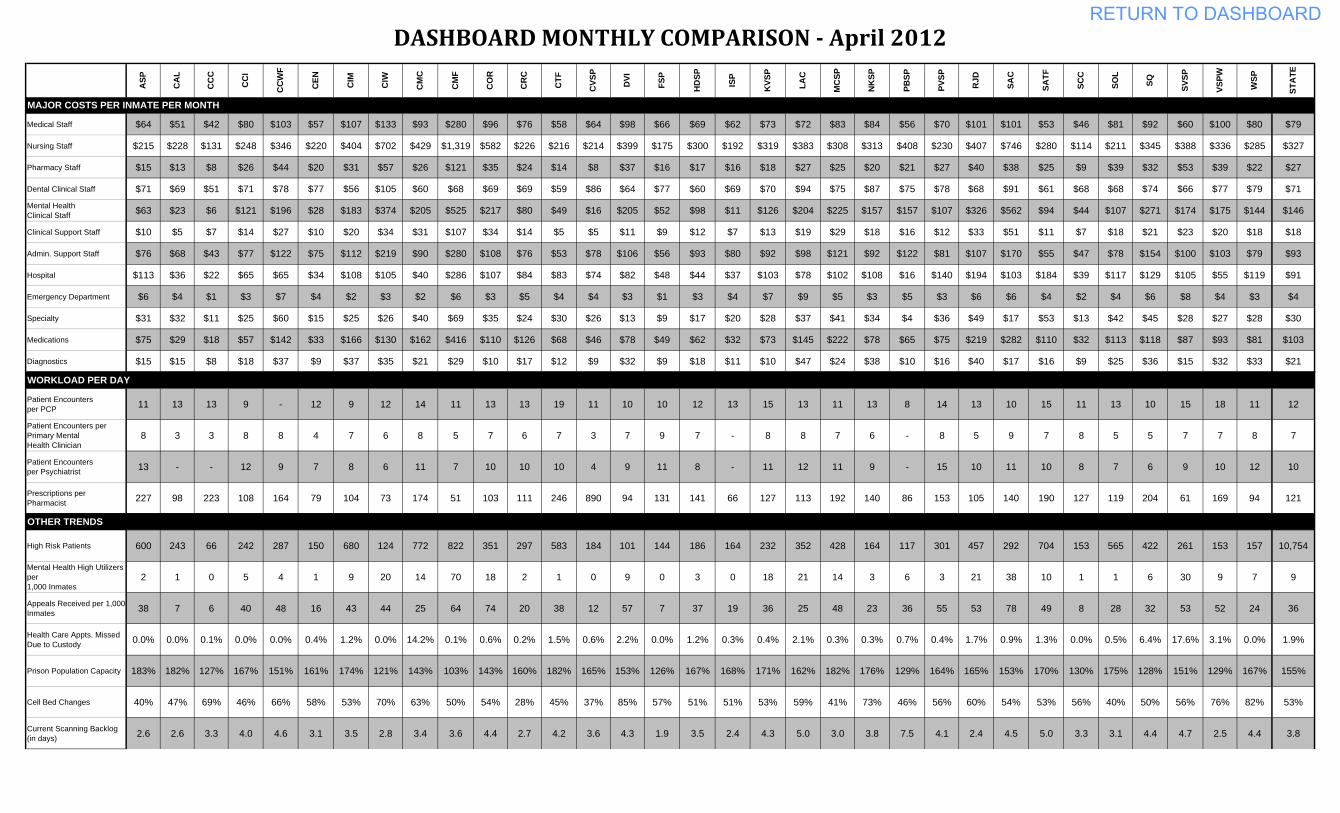
DASHBOARD MONTHLY COMPARISON April 2012
Medical Staff $64 $51 $42 $80 $103 $57 $107 $133 $93 $280 $96 $76 $58 $64 $98 $66 $69 $62 $73 $72 $83 $84 $56 $70 $101 $101 $53 $46 $81 $92 $60 $100 $80 $79
Nursing Staff $215 $228 $131 $248 $346 $220 $404 $702 $429 $1,319 $582 $226 $216 $214 $399 $175 $300 $192 $319 $383 $308 $313 $408 $230 $407 $746 $280 $114 $211 $345 $388 $336 $285 $327
Pharmacy Staff $15 $13 $8 $26 $44 $20 $31 $57 $26 $121 $35 $24 $14 $8 $37 $16 $17 $16 $18 $27 $25 $20 $21 $27 $40 $38 $25 $9 $39 $32 $53 $39 $22 $27
Dental Clinical Staff $71 $69 $51 $71 $78 $77 $56 $105 $60 $68 $69 $69 $59 $86 $64 $77 $60 $69 $70 $94 $75 $87 $75 $78 $68 $91 $61 $68 $68 $74 $66 $77 $79 $71
Mental Health Clinical Staff $63 $23 $6 $121 $196 $28 $183 $374 $205 $525 $217 $80 $49 $16 $205 $52 $98 $11 $126 $204 $225 $157 $157 $107 $326 $562 $94 $44 $107 $271 $174 $175 $144 $146
Clinical Support Staff $10 $5 $7 $14 $27 $10 $20 $34 $31 $107 $34 $14 $5 $5 $11 $9 $12 $7 $13 $19 $29 $18 $16 $12 $33 $51 $11 $7 $18 $21 $23 $20 $18 $18
Admin. Support Staff $76 $68 $43 $77 $122 $75 $112 $219 $90 $280 $108 $76 $53 $78 $106 $56 $93 $80 $92 $98 $121 $92 $122 $81 $107 $170 $55 $47 $78 $154 $100 $103 $79 $93
Hospital $113 $36 $22 $65 $65 $34 $108 $105 $40 $286 $107 $84 $83 $74 $82 $48 $44 $37 $103 $78 $102 $108 $16 $140 $194 $103 $184 $39 $117 $129 $105 $55 $119 $91
Emergency Department $6 $4 $1 $3 $7 $4 $2 $3 $2 $6 $3 $5 $4 $4 $3 $1 $3 $4 $7 $9 $5 $3 $5 $3 $6 $6 $4 $2 $4 $6 $8 $4 $3 $4
Specialty $31 $32 $11 $25 $60 $15 $25 $26 $40 $69 $35 $24 $30 $26 $13 $9 $17 $20 $28 $37 $41 $34 $4 $36 $49 $17 $53 $13 $42 $45 $28 $27 $28 $30
Medications $75 $29 $18 $57 $142 $33 $166 $130 $162 $416 $110 $126 $68 $46 $78 $49 $62 $32 $73 $145 $222 $78 $65 $75 $219 $282 $110 $32 $113 $118 $87 $93 $81 $103
Diagnostics $15 $15 $8 $18 $37 $9 $37 $35 $21 $29 $10 $17 $12 $9 $32 $9 $18 $11 $10 $47 $24 $38 $10 $16 $40 $17 $16 $9 $25 $36 $15 $32 $33 $21
Patient Encounters per PCP 11 13 13 9 - 12 9 12 14 11 13 13 19 11 10 10 12 13 15 13 11 13 8 14 13 10 15 11 13 10 15 18 11 12
Patient Encounters per Primary Mental Health Clinician
8 3 3 8 8 4 7 6 8 5 7 6 7 3 7 9 7 - 8 8 7 6 - 8 5 9 7 8 5 5 7 7 8 7
Patient Encounters per Psychiatrist 13 - - 12 9 7 8 6 11 7 10 10 10 4 9 11 8 - 11 12 11 9 - 15 10 11 10 8 7 6 9 10 12 10
Prescriptions per Pharmacist 227 98 223 108 164 79 104 73 174 51 103 111 246 890 94 131 141 66 127 113 192 140 86 153 105 140 190 127 119 204 61 169 94 121
High Risk Patients 600 243 66 242 287 150 680 124 772 822 351 297 583 184 101 144 186 164 232 352 428 164 117 301 457 292 704 153 565 422 261 153 157 10,754
Mental Health High Utilizers per 1,000 Inmates
2 1 0 5 4 1 9 20 14 70 18 2 1 0 9 0 3 0 18 21 14 3 6 3 21 38 10 1 1 6 30 9 7 9
Appeals Received per 1,000 Inmates 38 7 6 40 48 16 43 44 25 64 74 20 38 12 57 7 37 19 36 25 48 23 36 55 53 78 49 8 28 32 53 52 24 36
Health Care Appts. Missed Due to Custody 0.0% 0.0% 0.1% 0.0% 0.0% 0.4% 1.2% 0.0% 14.2% 0.1% 0.6% 0.2% 1.5% 0.6% 2.2% 0.0% 1.2% 0.3% 0.4% 2.1% 0.3% 0.3% 0.7% 0.4% 1.7% 0.9% 1.3% 0.0% 0.5% 6.4% 17.6% 3.1% 0.0% 1.9%
Prison Population Capacity 183% 182% 127% 167% 151% 161% 174% 121% 143% 103% 143% 160% 182% 165% 153% 126% 167% 168% 171% 162% 182% 176% 129% 164% 165% 153% 170% 130% 175% 128% 151% 129% 167% 155%
Cell Bed Changes 40% 47% 69% 46% 66% 58% 53% 70% 63% 50% 54% 28% 45% 37% 85% 57% 51% 51% 53% 59% 41% 73% 46% 56% 60% 54% 53% 56% 40% 50% 56% 76% 82% 53%
Current Scanning Backlog (in days) 2.6 2.6 3.3 4.0 4.6 3.1 3.5 2.8 3.4 3.6 4.4 2.7 4.2 3.6 4.3 1.9 3.5 2.4 4.3 5.0 3.0 3.8 7.5 4.1 2.4 4.5 5.0 3.3 3.1 4.4 4.7 2.5 4.4 3.8
WORKLOAD PER DAY
OTHER TRENDS
MAJOR COSTS PER INMATE PER MONTH
RETURN TO DASHBOARD
ASP
CA
L
CC
C
CC
I
CC
WF
CEN CIM
CIW
CM
C
CM
F
CO
R
CR
C
CTF
CVS
P
DVI
FSP
HD
SP
ISP
KVS
P
LAC
MC
SP
NK
SP
PBSP
PVSP
RJD
SAC
SATF
SCC
SOL
SQ SVSP
VSPW
WSP
STA
TE
DASHBOARD MONTHLY COMPARISON April 2012
High Risk Priority 1 2% 1% 0% 1% 4% 1% 4% 2% 4% 14% 2% 2% 3% 2% 1% 1% 2% 1% 1% 3% 4% 1% 1% 2% 5% 3% 4% 1% 5% 3% 2% 2% 1% 2%
High Risk Priority 2 9% 5% 1% 4% 6% 3% 9% 6% 10% 20% 6% 6% 7% 5% 3% 4% 3% 4% 4% 6% 10% 3% 3% 6% 8% 8% 8% 3% 8% 8% 5% 4% 2% 6%
Medium Risk 54% 31% 23% 54% 51% 30% 51% 47% 50% 53% 55% 50% 52% 35% 39% 51% 43% 36% 54% 61% 64% 37% 43% 64% 62% 65% 56% 29% 55% 54% 63% 60% 35% 48%
Low Risk 34% 63% 76% 41% 39% 66% 35% 45% 36% 13% 37% 42% 38% 58% 57% 44% 52% 60% 40% 30% 22% 59% 54% 28% 26% 24% 32% 67% 32% 35% 30% 33% 62% 43%
Enhanced Outpatient Program-Mental Health 14 - - 14 46 - 56 67 613 507 238 - 10 - 15 - 14 - 92 378 507 55 198 7 569 663 284 9 9 51 409 13 81 4,919
Patients with Diability (ADA) 451 101 38 138 213 101 400 78 291 768 275 144 270 118 113 110 260 82 208 184 200 115 59 443 394 143 979 103 344 212 288 94 143 7,860
Licensed Outpatient Beds 28 18 24 32 39 15 160 37 37 293 99 10 22 14 29 - 35 15 22 18 12 16 20 17 30 29 38 13 18 - 27 26 18 1,211
Inmates > 50 years old 1,436 331 365 658 470 407 1,257 235 1,565 980 685 690 1,766 583 279 484 358 510 296 544 853 507 270 841 706 383 1,377 585 1,296 1,180 481 335 444 23,157
Women/Men Institutions M M M M W M M W M M M M M M M M M M M M M M M M M M M M M M M W M -
Total Population 5,222 4,001 4,836 4,728 2,852 3,715 5,256 1,637 5,540 2,413 4,504 3,950 5,713 2,723 2,597 2,928 3,786 3,509 4,174 3,894 3,065 4,714 3,091 3,734 3,659 2,786 5,770 4,699 4,489 3,966 3,532 2,459 5,218 129,160
INSTITUTION AND POPULATION CHARACTERISTICS
RETURN TO DASHBOARD
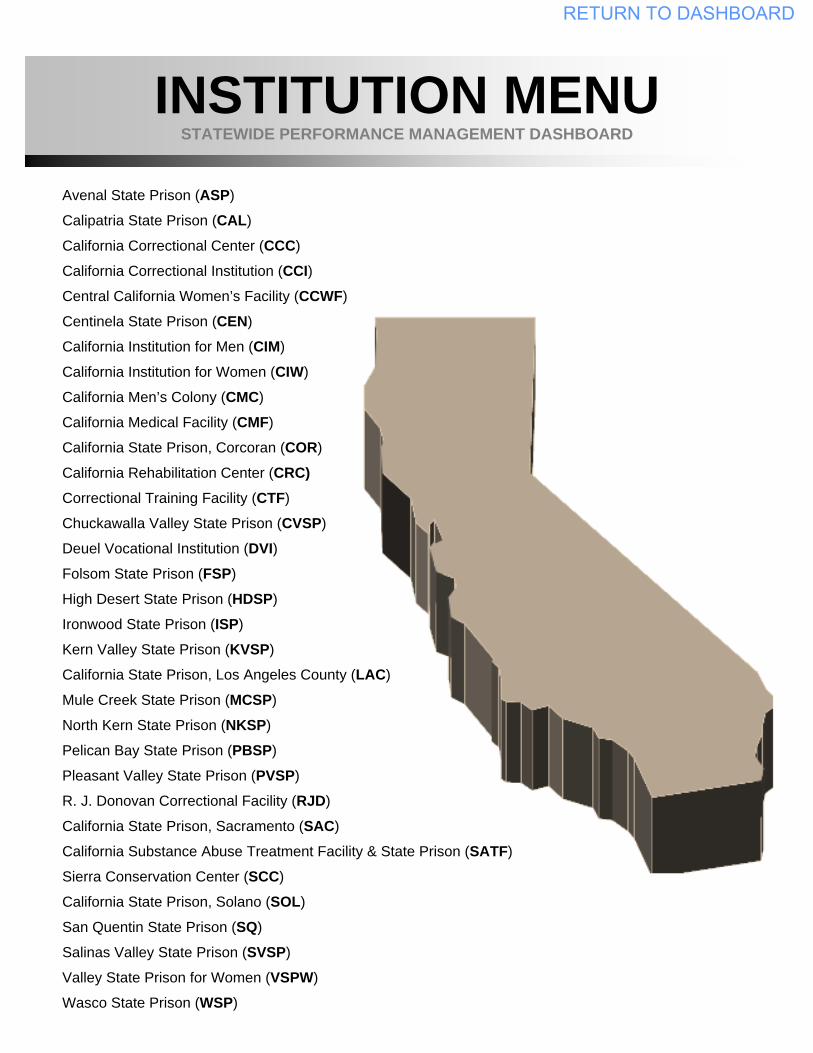
INSTITUTION MENU STATEWIDE PERFORMANCE MANAGEMENT DASHBOARD
Avenal State Prison (ASP)
Calipatria State Prison (CAL)
California Correctional Center (CCC)
California Correctional Institution (CCI) Central California Women’s Facility (CCWF)
Centinela State Prison (CEN)
California Institution for Men (CIM)
California Institution for Women (CIW)
California Men’s Colony (CMC)
California Medical Facility (CMF)
California State Prison, Corcoran (COR)
California Rehabilitation Center (CRC) Correctional Training Facility (CTF)
Chuckawalla Valley State Prison (CVSP)
Deuel Vocational Institution (DVI) Folsom State Prison (FSP)
High Desert State Prison (HDSP)
Ironwood State Prison (ISP)
Kern Valley State Prison (KVSP)
California State Prison, Los Angeles County (LAC)
Mule Creek State Prison (MCSP)
North Kern State Prison (NKSP)
Pelican Bay State Prison (PBSP)
Pleasant Valley State Prison (PVSP)
R. J. Donovan Correctional Facility (RJD)
California State Prison, Sacramento (SAC)
California Substance Abuse Treatment Facility & State Prison (SATF)
Sierra Conservation Center (SCC)
California State Prison, Solano (SOL)
San Quentin State Prison (SQ)
Salinas Valley State Prison (SVSP)
Valley State Prison for Women (VSPW)
Wasco State Prison (WSP)
RETURN TO DASHBOARD
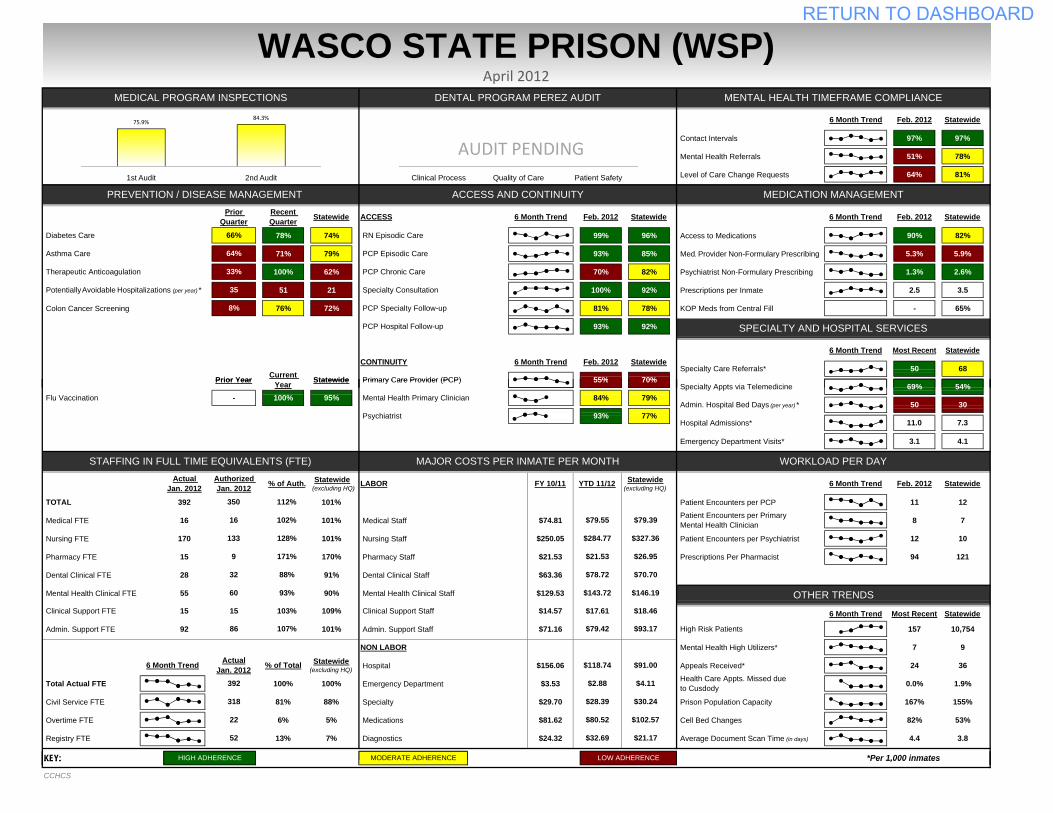
Contact Intervals 97% 97%
Mental Health Referrals 51% 78%
Level of Care Change Requests 64% 81%
78% 74% 99% 96% Access to Medications 90% 82%
71% 79% 93% 85% Med. Provider Non-Formulary Prescribing 5.3% 5.9%
100% 62% 70% 82% Psychiatrist Non-Formulary Prescribing 1.3% 2.6%
51 21 100% 92% Prescriptions per Inmate 2.5 3.5
Colon Cancer Screening 76% 72% 81% 78% KOP Meds from Central Fill - 65%
93% 92%
WASCO STATE PRISON (WSP)April 2012
Most Recent
Feb. 20126 Month Trend
CONTINUITY 6 Month Trend Feb. 2012 Statewide
Therapeutic Anticoagulation
Asthma Care
Diabetes Care
6 Month Trend
SPECIALTY AND HOSPITAL SERVICES
55%
Recent Quarter ACCESS Feb. 2012
Primary Care Provider (PCP)50
PREVENTION / DISEASE MANAGEMENT ACCESS AND CONTINUITY MEDICATION MANAGEMENT
Feb. 20126 Month Trend
MEDICAL PROGRAM INSPECTIONS DENTAL PROGRAM PEREZ AUDIT MENTAL HEALTH TIMEFRAME COMPLIANCE
PCP Chronic Care
6 Month Trend
PCP Specialty Follow-up
RN Episodic Care
PCP Episodic Care
Specialty Consultation Potentially Avoidable Hospitalizations (per year) *
66%
64%
33%
35
Prior Quarter
8%
Statewide Statewide
70%
Statewide
Statewide
Statewide
68 Specialty Care Referrals*
PCP Hospital Follow-up
Prior Year Current Statewide
Clinical Process Quality of Care Patient Safety
75.9%84.3%
1st Audit 2nd Audit
AUDIT PENDING
Emergency Department Visits* 3.1 4.1
TOTAL 392 101% Patient Encounters per PCP 11 12
Medical FTE 16 101% Medical Staff $74.81 8 7
Nursing FTE 170 101% Nursing Staff $250.05 Patient Encounters per Psychiatrist 12 10
Pharmacy FTE 15 170% Pharmacy Staff $21.53 Prescriptions Per Pharmacist 94 121
Dental Clinical FTE 28 91% Dental Clinical Staff $63.36
Mental Health Clinical FTE 55 90% Mental Health Clinical Staff $129.53
Admin. Support FTE 92 101% Admin. Support Staff $71.16 157 10,754
NON LABOR Mental Health High Utilizers* 7 9
Hospital $156.06 Appeals Received* 24 36
Total Actual FTE 100% 100% Emergency Department $3.53 0.0% 1.9%
Civil Service FTE 81% 88% Specialty $29.70 Prison Population Capacity 167% 155%
Overtime FTE 6% 5% Medications $81.62 Cell Bed Changes 82% 53%
Registry FTE 13% 7% Diagnostics $24.32 Average Document Scan Time (in days) 4.4 3.8
KEY:
392
318
22
Statewide(excluding HQ)
Statewide(excluding HQ)
Statewide(excluding HQ)
$79.39
$327.36
$26.95
$70.70
$146.19
$18.46$17.61
93%
69%55%
Specialty Appts via Telemedicine Flu Vaccination
Primary Care Provider (PCP)
Mental Health Primary Clinician
Psychiatrist 93%
YTD 11/12FY 10/11LABOR Feb. 20126 Month Trend
OTHER TRENDS$143.72
Clinical Support Staff
$79.55
$284.77
Patient Encounters per Primary Mental Health Clinician
$14.5715
-
350
16
133
9
32
60
STAFFING IN FULL TIME EQUIVALENTS (FTE)
Clinical Support FTE 15 109%
% of Auth.
112%
70%
79%
77%
54%
30
7.3
Statewide
84% Admin. Hospital Bed Days (per year) * 50
MAJOR COSTS PER INMATE PER MONTH WORKLOAD PER DAY
11.0 Hospital Admissions*
HIGH ADHERENCE LOW ADHERENCEMODERATE ADHERENCE *Per 1,000 inmates
$118.74
$2.88
$28.39
$80.52
$4.11
$30.24
$102.57
$21.17
$91.00
$32.6952
6 Month Trend
$21.53
$78.72
95%100%
Authorized Jan. 2012
Actual Jan. 2012
102%
128%
171%
88%
Prior Year Year Statewide
Health Care Appts. Missed due to Cusdody
86 $79.42 $93.17
6 Month Trend Most Recent Statewide
High Risk Patients
103%
107%
ActualJan. 2012 % of Total
KEY: HIGH ADHERENCE LOW ADHERENCE
CCHCS
MODERATE ADHERENCE Per 1,000 inmates
RETURN TO DASHBOARD
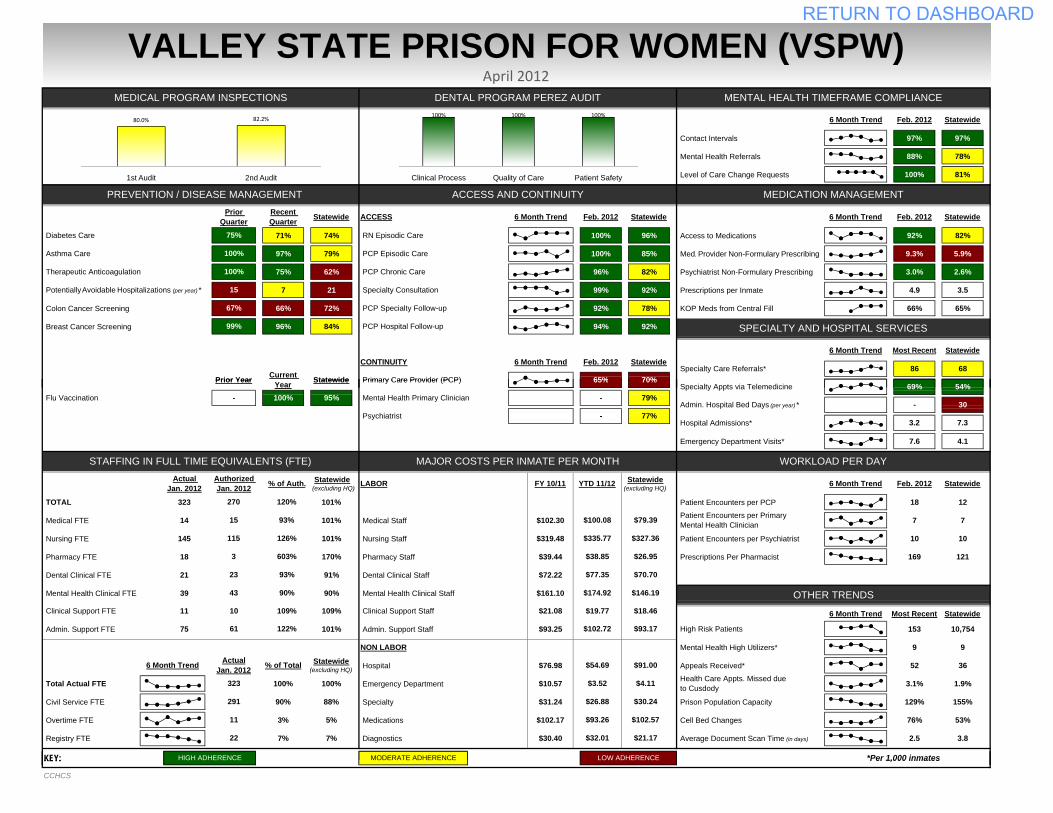
Contact Intervals 97% 97%
Mental Health Referrals 88% 78%
Level of Care Change Requests 100% 81%
71% 74% 100% 96% Access to Medications 92% 82%
97% 79% 100% 85% Med. Provider Non-Formulary Prescribing 9.3% 5.9%
75% 62% 96% 82% Psychiatrist Non-Formulary Prescribing 3.0% 2.6%
7 21 99% 92% Prescriptions per Inmate 4.9 3.5
Colon Cancer Screening 66% 72% 92% 78% KOP Meds from Central Fill 66% 65%
Breast Cancer Screening 96% 84% 94% 92%
VALLEY STATE PRISON FOR WOMEN (VSPW)April 2012
Most Recent
Feb. 20126 Month Trend
CONTINUITY 6 Month Trend Feb. 2012 Statewide
Therapeutic Anticoagulation
Asthma Care
Diabetes Care
6 Month Trend
SPECIALTY AND HOSPITAL SERVICES
65%Prior Year Current Statewide
Potentially Avoidable Hospitalizations (per year) *
Recent Quarter ACCESS
75%
100%
100%
15
67%
99%
Specialty Consultation
StatewidePrior Quarter Statewide Feb. 2012
PCP Chronic Care
6 Month Trend
PCP Specialty Follow-up
RN Episodic Care
PCP Episodic Care
70%Primary Care Provider (PCP)86
PREVENTION / DISEASE MANAGEMENT ACCESS AND CONTINUITY MEDICATION MANAGEMENT
Feb. 20126 Month Trend
MEDICAL PROGRAM INSPECTIONS DENTAL PROGRAM PEREZ AUDIT MENTAL HEALTH TIMEFRAME COMPLIANCE
Statewide
Statewide
Statewide
68 Specialty Care Referrals*
PCP Hospital Follow-up
100% 100% 100%
Clinical Process Quality of Care Patient Safety
80.0% 82.2%
1st Audit 2nd Audit
Emergency Department Visits* 7.6 4.1
TOTAL 323 101% Patient Encounters per PCP 18 12
Medical FTE 14 101% Medical Staff $102.30 7 7
Nursing FTE 145 101% Nursing Staff $319.48 Patient Encounters per Psychiatrist 10 10
Pharmacy FTE 18 170% Pharmacy Staff $39.44 Prescriptions Per Pharmacist 169 121
Dental Clinical FTE 21 91% Dental Clinical Staff $72.22
Mental Health Clinical FTE 39 90% Mental Health Clinical Staff $161.10
Admin. Support FTE 75 101% Admin. Support Staff $93.25 153 10,754
NON LABOR Mental Health High Utilizers* 9 9
Hospital $76.98 Appeals Received* 52 36
Total Actual FTE 100% 100% Emergency Department $10.57 3.1% 1.9%
Civil Service FTE 90% 88% Specialty $31.24 Prison Population Capacity 129% 155%
Overtime FTE 3% 5% Medications $102.17 Cell Bed Changes 76% 53%
Registry FTE 7% 7% Diagnostics $30.40 Average Document Scan Time (in days) 2.5 3.8
KEY:
69%65%
Specialty Appts via TelemedicinePrior Year Year Statewide
% of Auth.
120%
100%
3
STAFFING IN FULL TIME EQUIVALENTS (FTE)
Flu Vaccination Mental Health Primary Clinician
Psychiatrist
95%
Authorized Jan. 2012 LABOR
-
Clinical Support FTE 10
Statewide(excluding HQ)
70%
79%
77%
$19.77
$26.95
$70.70
$146.19
$18.46
Primary Care Provider (PCP)
Actual Jan. 2012
93%
126%
Statewide(excluding HQ)
$79.39
$327.36
270
OTHER TRENDS$174.92
YTD 11/12FY 10/11
6 Month Trend Most Recent Statewide
High Risk Patients
Feb. 20126 Month Trend
54%
30
7.3
Statewide
- Admin. Hospital Bed Days (per year) * -
MAJOR COSTS PER INMATE PER MONTH WORKLOAD PER DAY
3.2 Hospital Admissions*-
MODERATE ADHERENCE *Per 1,000 inmates
$54.69
$3.52
$26.88
$93.26
$4.11
$30.24
$102.57
$21.17
$91.00
$32.0122
6 Month Trend
323
HIGH ADHERENCE LOW ADHERENCE
291
11
109%11 109%
122%
Statewide(excluding HQ)
ActualJan. 2012 % of Total
Health Care Appts. Missed due to Cusdody
61 $102.72 $93.17
Clinical Support Staff
$100.08
$335.77
$21.08
$38.85
$77.35
603%
93%
90%
Patient Encounters per Primary Mental Health Clinician
23
43
15
115
KEY:
CCHCS
MODERATE ADHERENCE Per 1,000 inmatesHIGH ADHERENCE LOW ADHERENCE
RETURN TO DASHBOARD
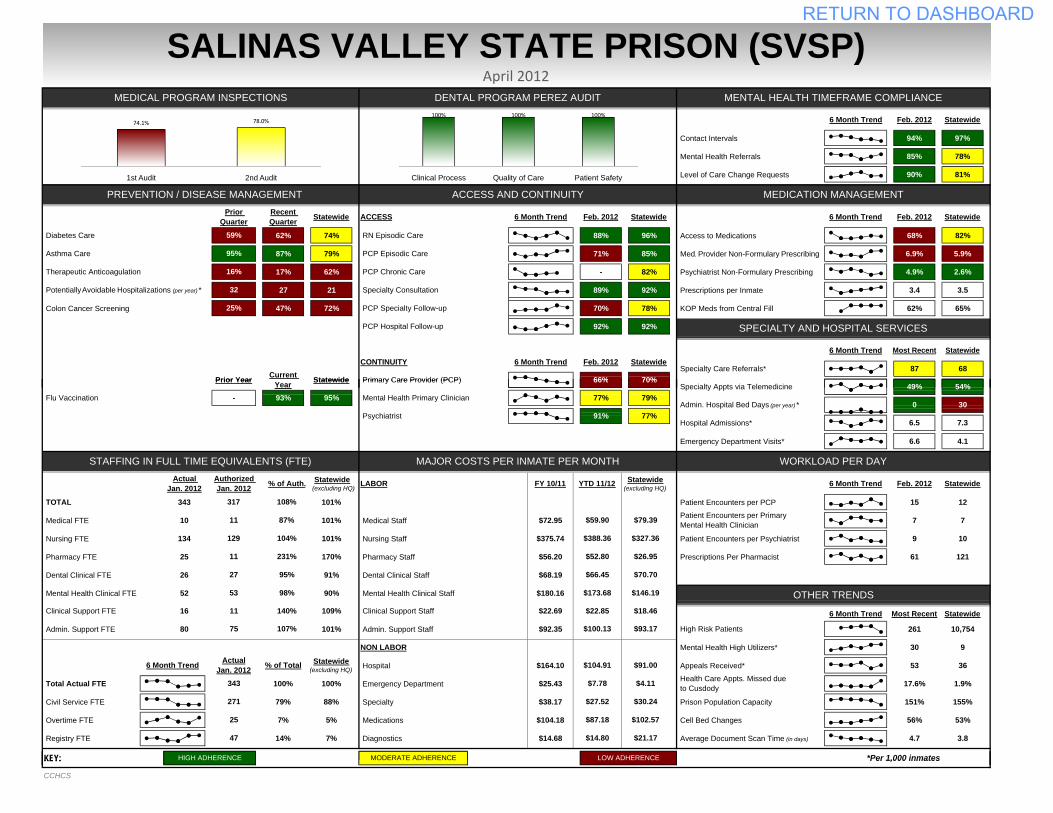
Contact Intervals 94% 97%
Mental Health Referrals 85% 78%
Level of Care Change Requests 90% 81%
62% 74% 88% 96% Access to Medications 68% 82%
87% 79% 71% 85% Med. Provider Non-Formulary Prescribing 6.9% 5.9%
17% 62% - 82% Psychiatrist Non-Formulary Prescribing 4.9% 2.6%
27 21 89% 92% Prescriptions per Inmate 3.4 3.5
Colon Cancer Screening 47% 72% 70% 78% KOP Meds from Central Fill 62% 65%
92% 92%
SALINAS VALLEY STATE PRISON (SVSP)April 2012
Most Recent
Feb. 20126 Month Trend
CONTINUITY 6 Month Trend Feb. 2012 Statewide
Therapeutic Anticoagulation
Asthma Care
Diabetes Care
6 Month Trend
SPECIALTY AND HOSPITAL SERVICES
66%
Recent Quarter ACCESS Feb. 2012
Primary Care Provider (PCP)87
PREVENTION / DISEASE MANAGEMENT ACCESS AND CONTINUITY MEDICATION MANAGEMENT
Feb. 20126 Month Trend
MEDICAL PROGRAM INSPECTIONS DENTAL PROGRAM PEREZ AUDIT MENTAL HEALTH TIMEFRAME COMPLIANCE
PCP Chronic Care
6 Month Trend
PCP Specialty Follow-up
RN Episodic Care
PCP Episodic Care
Specialty Consultation Potentially Avoidable Hospitalizations (per year) *
59%
95%
16%
32
Prior Quarter
25%
Statewide Statewide
70%
Statewide
Statewide
Statewide
68 Specialty Care Referrals*
PCP Hospital Follow-up
Prior Year Current Statewide
100% 100% 100%
Clinical Process Quality of Care Patient Safety
74.1% 78.0%
1st Audit 2nd Audit
Emergency Department Visits* 6.6 4.1
TOTAL 343 101% Patient Encounters per PCP 15 12
Medical FTE 10 101% Medical Staff $72.95 7 7
Nursing FTE 134 101% Nursing Staff $375.74 Patient Encounters per Psychiatrist 9 10
Pharmacy FTE 25 170% Pharmacy Staff $56.20 Prescriptions Per Pharmacist 61 121
Dental Clinical FTE 26 91% Dental Clinical Staff $68.19
Mental Health Clinical FTE 52 90% Mental Health Clinical Staff $180.16
Admin. Support FTE 80 101% Admin. Support Staff $92.35 261 10,754
NON LABOR Mental Health High Utilizers* 30 9
Hospital $164.10 Appeals Received* 53 36
Total Actual FTE 100% 100% Emergency Department $25.43 17.6% 1.9%
Civil Service FTE 79% 88% Specialty $38.17 Prison Population Capacity 151% 155%
Overtime FTE 7% 5% Medications $104.18 Cell Bed Changes 56% 53%
Registry FTE 14% 7% Diagnostics $14.68 Average Document Scan Time (in days) 4.7 3.8
KEY:
343
271
25
Statewide(excluding HQ)
Statewide(excluding HQ)
Statewide(excluding HQ)
$79.39
$327.36
$26.95
$70.70
$146.19
$18.46$22.85
98%
49%66%
Specialty Appts via Telemedicine Flu Vaccination
Primary Care Provider (PCP)
Mental Health Primary Clinician
Psychiatrist 91%
YTD 11/12FY 10/11LABOR Feb. 20126 Month Trend
OTHER TRENDS$173.68
Clinical Support Staff
$59.90
$388.36
Patient Encounters per Primary Mental Health Clinician
$22.6916
-
317
11
129
11
27
53
STAFFING IN FULL TIME EQUIVALENTS (FTE)
Clinical Support FTE 11 109%
% of Auth.
108%
70%
79%
77%
54%
30
7.3
Statewide
77% Admin. Hospital Bed Days (per year) * 0
MAJOR COSTS PER INMATE PER MONTH WORKLOAD PER DAY
6.5 Hospital Admissions*
HIGH ADHERENCE LOW ADHERENCEMODERATE ADHERENCE *Per 1,000 inmates
$104.91
$7.78
$27.52
$87.18
$4.11
$30.24
$102.57
$21.17
$91.00
$14.8047
6 Month Trend
$52.80
$66.45
95%93%
Authorized Jan. 2012
Actual Jan. 2012
87%
104%
231%
95%
Prior Year Year Statewide
Health Care Appts. Missed due to Cusdody
75 $100.13 $93.17
6 Month Trend Most Recent Statewide
High Risk Patients
140%
107%
ActualJan. 2012 % of Total
KEY: HIGH ADHERENCE LOW ADHERENCE
CCHCS
MODERATE ADHERENCE Per 1,000 inmates
RETURN TO DASHBOARD
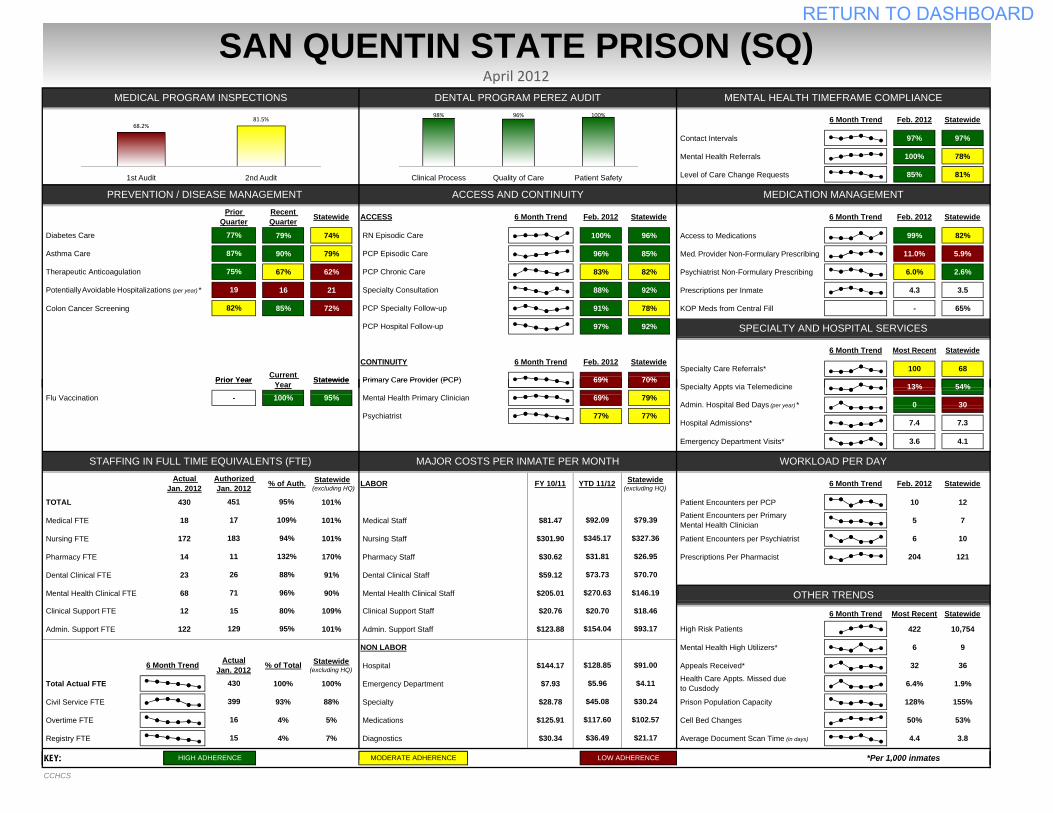
Contact Intervals 97% 97%
Mental Health Referrals 100% 78%
Level of Care Change Requests 85% 81%
79% 74% 100% 96% Access to Medications 99% 82%
90% 79% 96% 85% Med. Provider Non-Formulary Prescribing 11.0% 5.9%
67% 62% 83% 82% Psychiatrist Non-Formulary Prescribing 6.0% 2.6%
16 21 88% 92% Prescriptions per Inmate 4.3 3.5
Colon Cancer Screening 85% 72% 91% 78% KOP Meds from Central Fill - 65%
97% 92% PCP Hospital Follow-up
Current Statewide
Statewide
70%
Statewide
Statewide
Statewide
68 Specialty Care Referrals*
Potentially Avoidable Hospitalizations (per year) *
77%
87%
75%
19
Prior Quarter
82%
Statewide
Prior Year
PCP Chronic Care
6 Month Trend
PCP Specialty Follow-up
RN Episodic Care
PCP Episodic Care
Specialty Consultation
PREVENTION / DISEASE MANAGEMENT ACCESS AND CONTINUITY MEDICATION MANAGEMENT
Feb. 20126 Month Trend
MEDICAL PROGRAM INSPECTIONS DENTAL PROGRAM PEREZ AUDIT MENTAL HEALTH TIMEFRAME COMPLIANCE
Primary Care Provider (PCP)100
SAN QUENTIN STATE PRISON (SQ)April 2012
Most Recent
Feb. 20126 Month Trend
CONTINUITY 6 Month Trend Feb. 2012 Statewide
Therapeutic Anticoagulation
Asthma Care
Diabetes Care
6 Month Trend
SPECIALTY AND HOSPITAL SERVICES
69%
Recent Quarter ACCESS Feb. 2012
98% 96% 100%
Clinical Process Quality of Care Patient Safety
68.2%81.5%
1st Audit 2nd Audit
Emergency Department Visits* 3.6 4.1
TOTAL 430 101% Patient Encounters per PCP 10 12
Medical FTE 18 101% Medical Staff $81.47 5 7
Nursing FTE 172 101% Nursing Staff $301.90 Patient Encounters per Psychiatrist 6 10
Pharmacy FTE 14 170% Pharmacy Staff $30.62 Prescriptions Per Pharmacist 204 121
Dental Clinical FTE 23 91% Dental Clinical Staff $59.12
Mental Health Clinical FTE 68 90% Mental Health Clinical Staff $205.01
Admin. Support FTE 122 101% Admin. Support Staff $123.88 422 10,754
NON LABOR Mental Health High Utilizers* 6 9
Hospital $144.17 Appeals Received* 32 36
Total Actual FTE 100% 100% Emergency Department $7.93 6.4% 1.9%
Civil Service FTE 93% 88% Specialty $28.78 Prison Population Capacity 128% 155%
Overtime FTE 4% 5% Medications $125.91 Cell Bed Changes 50% 53%
Registry FTE 4% 7% Diagnostics $30.34 Average Document Scan Time (in days) 4.4 3.8
KEY:
$31.81
$73.73
95%100%
6 Month Trend
Authorized Jan. 2012
Actual Jan. 2012
109%
94%
132%
88%
96%
Statewide(excluding HQ)
$20.70
Year Statewide
399
16
Health Care Appts. Missed due to Cusdody
129 $154.04 $93.17 High Risk Patients
80%
95%
ActualJan. 2012 % of Total
430
HIGH ADHERENCE LOW ADHERENCEMODERATE ADHERENCE *Per 1,000 inmates
$128.85
$5.96
$45.08
$117.60
$4.11
$30.24
$102.57
$21.17
$91.00
$36.49
Statewide(excluding HQ)
15
70%
79%
77%
54%
30
7.3
Statewide
69% Admin. Hospital Bed Days (per year) * 0
MAJOR COSTS PER INMATE PER MONTH WORKLOAD PER DAY
7.4 Hospital Admissions*
12
-
451
17
183
11
26
71
STAFFING IN FULL TIME EQUIVALENTS (FTE)
Clinical Support FTE 15 109%
% of Auth.
95%
Prior Year
OTHER TRENDS$270.63
Clinical Support Staff
$92.09
$345.17
Patient Encounters per Primary Mental Health Clinician
$20.76 6 Month Trend Most Recent Statewide
$79.39
$327.36
$26.95
$70.70
$146.19
$18.46
Primary Care Provider (PCP)
Mental Health Primary Clinician
Psychiatrist 77%
YTD 11/12FY 10/11LABOR Feb. 20126 Month TrendStatewide(excluding HQ)
13%69%
Specialty Appts via Telemedicine Flu Vaccination
KEY: HIGH ADHERENCE LOW ADHERENCE
CCHCS
MODERATE ADHERENCE Per 1,000 inmates
RETURN TO DASHBOARD
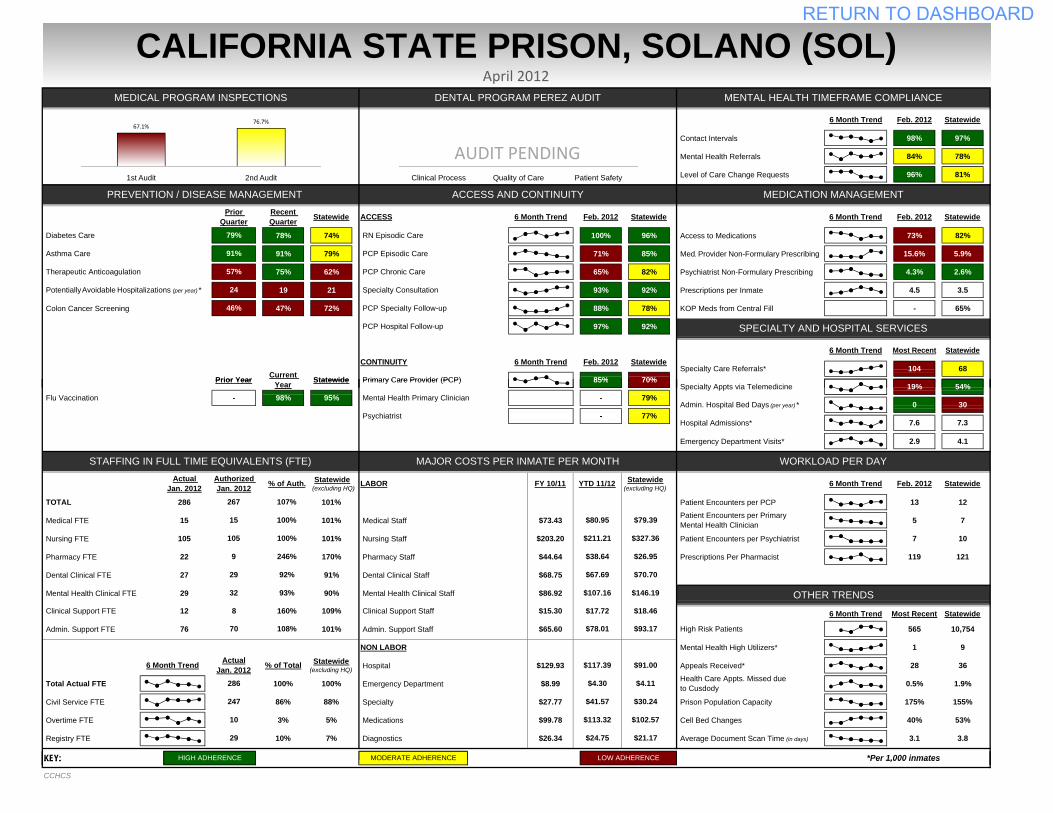
Contact Intervals 98% 97%
Mental Health Referrals 84% 78%
Level of Care Change Requests 96% 81%
78% 74% 100% 96% Access to Medications 73% 82%
91% 79% 71% 85% Med. Provider Non-Formulary Prescribing 15.6% 5.9%
75% 62% 65% 82% Psychiatrist Non-Formulary Prescribing 4.3% 2.6%
19 21 93% 92% Prescriptions per Inmate 4.5 3.5
Colon Cancer Screening 47% 72% 88% 78% KOP Meds from Central Fill - 65%
97% 92% PCP Hospital Follow-up
Current Statewide
Statewide
70%
Statewide
Statewide
Statewide
68 Specialty Care Referrals*
Potentially Avoidable Hospitalizations (per year) *
79%
91%
57%
24
Prior Quarter
46%
Statewide
Prior Year
PCP Chronic Care
6 Month Trend
PCP Specialty Follow-up
RN Episodic Care
PCP Episodic Care
Specialty Consultation
PREVENTION / DISEASE MANAGEMENT ACCESS AND CONTINUITY MEDICATION MANAGEMENT
Feb. 20126 Month Trend
MEDICAL PROGRAM INSPECTIONS DENTAL PROGRAM PEREZ AUDIT MENTAL HEALTH TIMEFRAME COMPLIANCE
Primary Care Provider (PCP)104
CALIFORNIA STATE PRISON, SOLANO (SOL)April 2012
Most Recent
Feb. 20126 Month Trend
CONTINUITY 6 Month Trend Feb. 2012 Statewide
Therapeutic Anticoagulation
Asthma Care
Diabetes Care
6 Month Trend
SPECIALTY AND HOSPITAL SERVICES
85%
Recent Quarter ACCESS Feb. 2012
Clinical Process Quality of Care Patient Safety
67.1%76.7%
1st Audit 2nd Audit
AUDIT PENDING
Emergency Department Visits* 2.9 4.1
TOTAL 286 101% Patient Encounters per PCP 13 12
Medical FTE 15 101% Medical Staff $73.43 5 7
Nursing FTE 105 101% Nursing Staff $203.20 Patient Encounters per Psychiatrist 7 10
Pharmacy FTE 22 170% Pharmacy Staff $44.64 Prescriptions Per Pharmacist 119 121
Dental Clinical FTE 27 91% Dental Clinical Staff $68.75
Mental Health Clinical FTE 29 90% Mental Health Clinical Staff $86.92
Admin. Support FTE 76 101% Admin. Support Staff $65.60 565 10,754
NON LABOR Mental Health High Utilizers* 1 9
Hospital $129.93 Appeals Received* 28 36
Total Actual FTE 100% 100% Emergency Department $8.99 0.5% 1.9%
Civil Service FTE 86% 88% Specialty $27.77 Prison Population Capacity 175% 155%
Overtime FTE 3% 5% Medications $99.78 Cell Bed Changes 40% 53%
Registry FTE 10% 7% Diagnostics $26.34 Average Document Scan Time (in days) 3.1 3.8
KEY:
$38.64
$67.69
95%98%
6 Month Trend
Authorized Jan. 2012
Actual Jan. 2012
100%
100%
246%
92%
93%
Statewide(excluding HQ)
$17.72
Year Statewide
247
10
Health Care Appts. Missed due to Cusdody
70 $78.01 $93.17 High Risk Patients
160%
108%
ActualJan. 2012 % of Total
286
HIGH ADHERENCE LOW ADHERENCEMODERATE ADHERENCE *Per 1,000 inmates
$117.39
$4.30
$41.57
$113.32
$4.11
$30.24
$102.57
$21.17
$91.00
$24.75
Statewide(excluding HQ)
29
70%
79%
77%
54%
30
7.3
Statewide
- Admin. Hospital Bed Days (per year) * 0
MAJOR COSTS PER INMATE PER MONTH WORKLOAD PER DAY
7.6 Hospital Admissions*
12
-
267
15
105
9
29
32
STAFFING IN FULL TIME EQUIVALENTS (FTE)
Clinical Support FTE 8 109%
% of Auth.
107%
Prior Year
OTHER TRENDS$107.16
Clinical Support Staff
$80.95
$211.21
Patient Encounters per Primary Mental Health Clinician
$15.30 6 Month Trend Most Recent Statewide
$79.39
$327.36
$26.95
$70.70
$146.19
$18.46
Primary Care Provider (PCP)
Mental Health Primary Clinician
Psychiatrist -
YTD 11/12FY 10/11LABOR Feb. 20126 Month TrendStatewide(excluding HQ)
19%85%
Specialty Appts via Telemedicine Flu Vaccination
KEY: HIGH ADHERENCE LOW ADHERENCE
CCHCS
MODERATE ADHERENCE Per 1,000 inmates
RETURN TO DASHBOARD
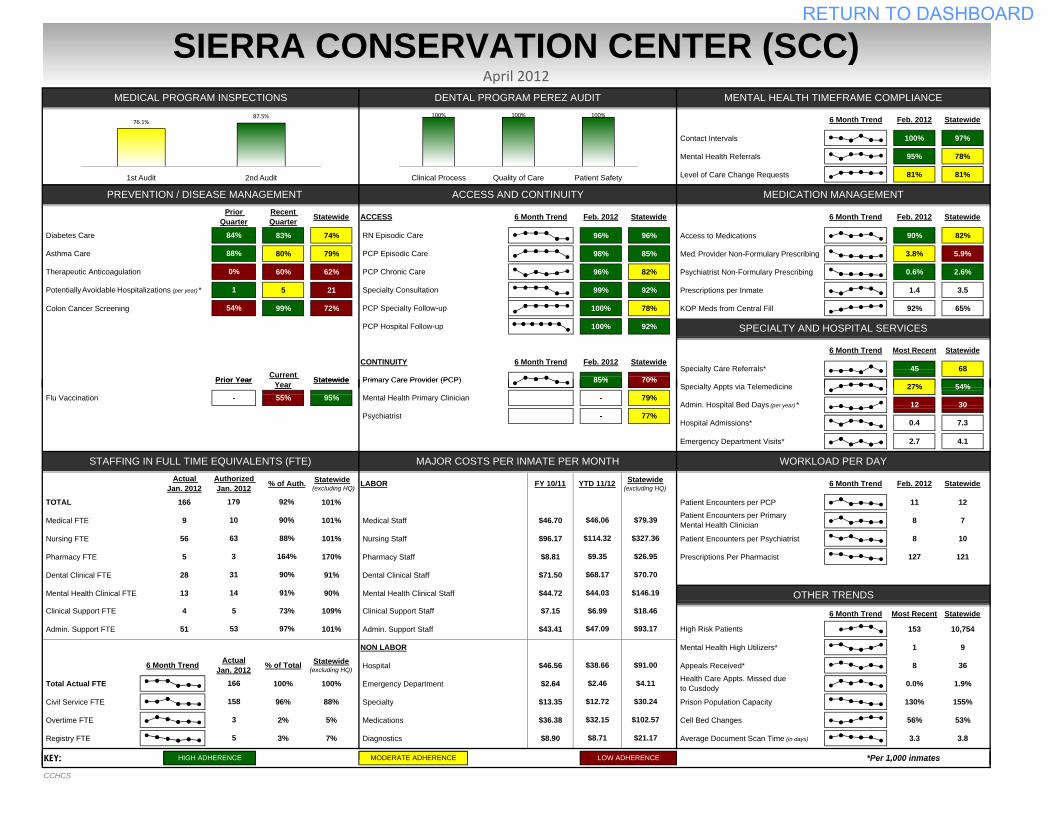
Contact Intervals 100% 97%
Mental Health Referrals 95% 78%
Level of Care Change Requests 81% 81%
83% 74% 96% 96% Access to Medications 90% 82%
80% 79% 98% 85% Med. Provider Non-Formulary Prescribing 3.8% 5.9%
60% 62% 96% 82% Psychiatrist Non-Formulary Prescribing 0.6% 2.6%
5 21 99% 92% Prescriptions per Inmate 1.4 3.5
Colon Cancer Screening 99% 72% 100% 78% KOP Meds from Central Fill 92% 65%
100% 92%
Statewide
SIERRA CONSERVATION CENTER (SCC)April 2012
Most Recent
Feb. 20126 Month Trend
CONTINUITY 6 Month Trend Feb. 2012 Statewide
Therapeutic Anticoagulation
Asthma Care
Diabetes Care
6 Month Trend
SPECIALTY AND HOSPITAL SERVICES
85%
Recent Quarter Feb. 2012
PCP Chronic Care
6 Month Trend
PCP Specialty Follow-up
RN Episodic Care
PCP Episodic Care
Specialty Consultation
ACCESS
Primary Care Provider (PCP)45
PREVENTION / DISEASE MANAGEMENT ACCESS AND CONTINUITY MEDICATION MANAGEMENT
Feb. 20126 Month Trend
MEDICAL PROGRAM INSPECTIONS DENTAL PROGRAM PEREZ AUDIT MENTAL HEALTH TIMEFRAME COMPLIANCE
Potentially Avoidable Hospitalizations (per year) *
84%
88%
0%
1
Prior Quarter
54%
Statewide
Prior Year Current
Statewide
70%
Statewide
Statewide
Statewide
68 Specialty Care Referrals*
PCP Hospital Follow-up
100% 100% 100%
Clinical Process Quality of Care Patient Safety
76.1%87.5%
1st Audit 2nd Audit
Emergency Department Visits* 2.7 4.1
TOTAL 166 101% Patient Encounters per PCP 11 12
Medical FTE 9 101% Medical Staff $46.70 8 7
Nursing FTE 56 101% Nursing Staff $96.17 Patient Encounters per Psychiatrist 8 10
Pharmacy FTE 5 170% Pharmacy Staff $8.81 Prescriptions Per Pharmacist 127 121
Dental Clinical FTE 28 91% Dental Clinical Staff $71.50
Mental Health Clinical FTE 13 90% Mental Health Clinical Staff $44.72
Admin. Support FTE 51 101% Admin. Support Staff $43.41 153 10,754
NON LABOR Mental Health High Utilizers* 1 9
Hospital $46.56 Appeals Received* 8 36
Total Actual FTE 100% 100% Emergency Department $2.64 0.0% 1.9%
Civil Service FTE 96% 88% Specialty $13.35 Prison Population Capacity 130% 155%
Overtime FTE 2% 5% Medications $36.38 Cell Bed Changes 56% 53%
Registry FTE 3% 7% Diagnostics $8.90 Average Document Scan Time (in days) 3.3 3.8
KEY:
Statewide27%
85% Specialty Appts via Telemedicine
Flu Vaccination
$79.39
$327.36
$26.95
$70.70
$146.19
$18.46$6.99
Primary Care Provider (PCP)
Mental Health Primary Clinician
Psychiatrist -
YTD 11/12FY 10/11LABOR Feb. 20126 Month Trend
Hospital Admissions*
OTHER TRENDS$44.03
Clinical Support Staff
$46.06
$114.32
Patient Encounters per Primary Mental Health Clinician
$7.15 6 Month Trend Most Recent Statewide4
-
179
10
63
3
31
14
STAFFING IN FULL TIME EQUIVALENTS (FTE)
Clinical Support FTE 5 109%
% of Auth.
Prior Year Year 70%
79%
77%
54%
30
7.3
Statewide
- Admin. Hospital Bed Days (per year) * 12
MAJOR COSTS PER INMATE PER MONTH WORKLOAD PER DAY
0.4
HIGH ADHERENCE LOW ADHERENCEMODERATE ADHERENCE *Per 1,000 inmates
$38.66
$2.46
$12.72
$32.15
$4.11
$30.24
$102.57
$21.17
$91.00
$8.715
Health Care Appts. Missed due to Cusdody
53 $47.09 $93.17 High Risk Patients
73%
97%
ActualJan. 2012 % of Total
166
158
3
Statewide(excluding HQ)
Statewide(excluding HQ)
Statewide(excluding HQ)
$9.35
$68.17
95%55%
6 Month Trend
Authorized Jan. 2012
Actual Jan. 2012
90%
88%
164%
90%
91%
92%
KEY: HIGH ADHERENCE LOW ADHERENCE
CCHCS
MODERATE ADHERENCE Per 1,000 inmates
RETURN TO DASHBOARD
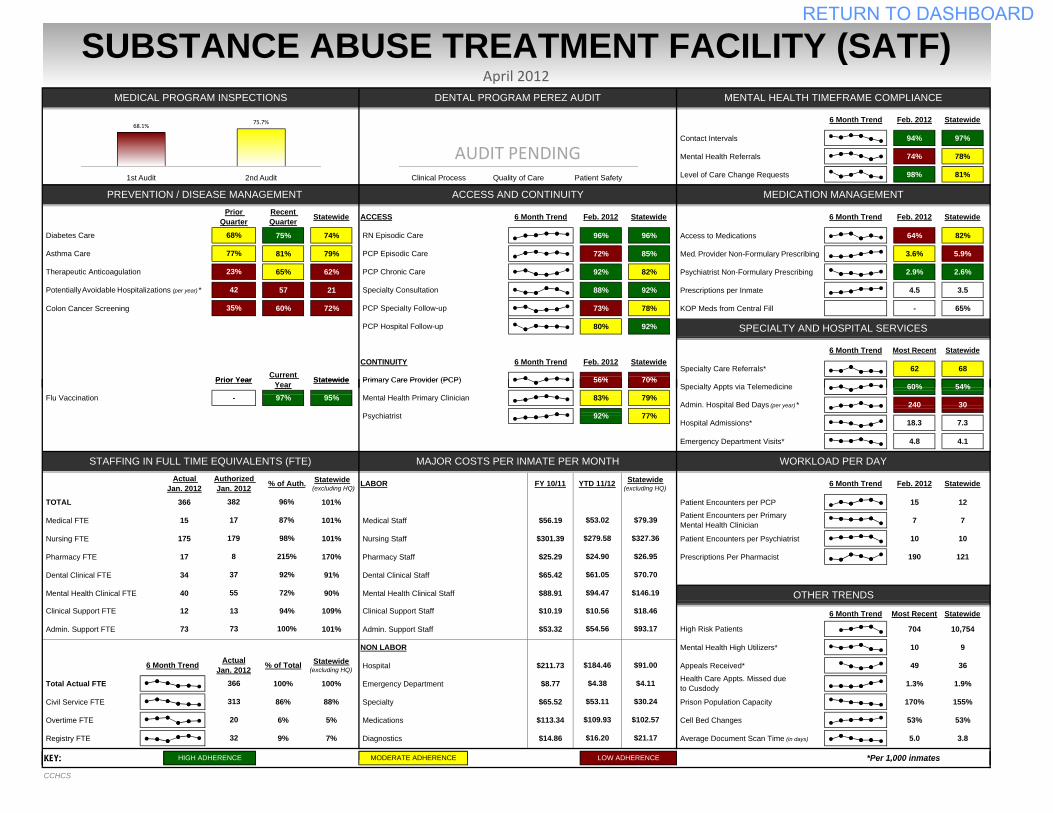
Contact Intervals 94% 97%
Mental Health Referrals 74% 78%
Level of Care Change Requests 98% 81%
75% 74% 96% 96% Access to Medications 64% 82%
81% 79% 72% 85% Med. Provider Non-Formulary Prescribing 3.6% 5.9%
65% 62% 92% 82% Psychiatrist Non-Formulary Prescribing 2.9% 2.6%
57 21 88% 92% Prescriptions per Inmate 4.5 3.5
Colon Cancer Screening 60% 72% 73% 78% KOP Meds from Central Fill - 65%
80% 92%
SUBSTANCE ABUSE TREATMENT FACILITY (SATF)April 2012
Most Recent
Feb. 20126 Month Trend
CONTINUITY 6 Month Trend Feb. 2012 Statewide
Therapeutic Anticoagulation
Asthma Care
Diabetes Care
6 Month Trend
SPECIALTY AND HOSPITAL SERVICES
56%Prior Year Current Statewide
Potentially Avoidable Hospitalizations (per year) *
Recent Quarter ACCESS
68%
77%
23%
42
35%
Specialty Consultation
StatewidePrior Quarter Statewide Feb. 2012
PCP Chronic Care
6 Month Trend
PCP Specialty Follow-up
RN Episodic Care
PCP Episodic Care
70%Primary Care Provider (PCP)62
PREVENTION / DISEASE MANAGEMENT ACCESS AND CONTINUITY MEDICATION MANAGEMENT
Feb. 20126 Month Trend
MEDICAL PROGRAM INSPECTIONS DENTAL PROGRAM PEREZ AUDIT MENTAL HEALTH TIMEFRAME COMPLIANCE
Statewide
Statewide
Statewide
68 Specialty Care Referrals*
PCP Hospital Follow-up
Clinical Process Quality of Care Patient Safety
68.1%75.7%
1st Audit 2nd Audit
AUDIT PENDING
Emergency Department Visits* 4.8 4.1
TOTAL 366 101% Patient Encounters per PCP 15 12
Medical FTE 15 101% Medical Staff $56.19 7 7
Nursing FTE 175 101% Nursing Staff $301.39 Patient Encounters per Psychiatrist 10 10
Pharmacy FTE 17 170% Pharmacy Staff $25.29 Prescriptions Per Pharmacist 190 121
Dental Clinical FTE 34 91% Dental Clinical Staff $65.42
Mental Health Clinical FTE 40 90% Mental Health Clinical Staff $88.91
Admin. Support FTE 73 101% Admin. Support Staff $53.32 704 10,754
NON LABOR Mental Health High Utilizers* 10 9
Hospital $211.73 Appeals Received* 49 36
Total Actual FTE 100% 100% Emergency Department $8.77 1.3% 1.9%
Civil Service FTE 86% 88% Specialty $65.52 Prison Population Capacity 170% 155%
Overtime FTE 6% 5% Medications $113.34 Cell Bed Changes 53% 53%
Registry FTE 9% 7% Diagnostics $14.86 Average Document Scan Time (in days) 5.0 3.8
KEY:
60%56%
Specialty Appts via TelemedicinePrior Year Year Statewide
% of Auth.
96%
97%
8
STAFFING IN FULL TIME EQUIVALENTS (FTE)
Flu Vaccination Mental Health Primary Clinician
Psychiatrist
95%
Authorized Jan. 2012 LABOR
-
Clinical Support FTE 13
Statewide(excluding HQ)
70%
79%
77%
$10.56
$26.95
$70.70
$146.19
$18.46
Primary Care Provider (PCP)
Actual Jan. 2012
87%
98%
Statewide(excluding HQ)
$79.39
$327.36
382
OTHER TRENDS$94.47
YTD 11/12FY 10/11
6 Month Trend Most Recent Statewide
High Risk Patients
Feb. 20126 Month Trend
54%
30
7.3
Statewide
83% Admin. Hospital Bed Days (per year) * 240
MAJOR COSTS PER INMATE PER MONTH WORKLOAD PER DAY
18.3 Hospital Admissions*92%
MODERATE ADHERENCE *Per 1,000 inmates
$184.46
$4.38
$53.11
$109.93
$4.11
$30.24
$102.57
$21.17
$91.00
$16.2032
6 Month Trend
366
HIGH ADHERENCE LOW ADHERENCE
313
20
109%12 94%
100%
Statewide(excluding HQ)
ActualJan. 2012 % of Total
Health Care Appts. Missed due to Cusdody
73 $54.56 $93.17
Clinical Support Staff
$53.02
$279.58
$10.19
$24.90
$61.05
215%
92%
72%
Patient Encounters per Primary Mental Health Clinician
37
55
17
179
KEY:
CCHCS
MODERATE ADHERENCE Per 1,000 inmatesHIGH ADHERENCE LOW ADHERENCE
RETURN TO DASHBOARD

Contact Intervals 97% 97%
Mental Health Referrals 73% 78%
Level of Care Change Requests 84% 81%
76% 74% 91% 96% Access to Medications 76% 82%
88% 79% 93% 85% Med. Provider Non-Formulary Prescribing 7.0% 5.9%
53% 62% 80% 82% Psychiatrist Non-Formulary Prescribing 4.0% 2.6%
14 21 75% 92% Prescriptions per Inmate 5.4 3.5
Colon Cancer Screening 53% 72% 64% 78% KOP Meds from Central Fill 84% 65%
94% 92%
Statewide
Statewide
68 Specialty Care Referrals*
PCP Hospital Follow-up
PREVENTION / DISEASE MANAGEMENT ACCESS AND CONTINUITY MEDICATION MANAGEMENT
Feb. 20126 Month Trend
MEDICAL PROGRAM INSPECTIONS DENTAL PROGRAM PEREZ AUDIT MENTAL HEALTH TIMEFRAME COMPLIANCE
Statewide
1670%Primary Care Provider (PCP)
StatewidePrior Quarter Statewide Feb. 2012
PCP Chronic Care
6 Month Trend
PCP Specialty Follow-up
RN Episodic Care
PCP Episodic Care
67%
87%
67%
14
37%
Specialty Consultation
CALIFORNIA STATE PRISON, SACRAMENTO (SAC)April 2012
Most Recent
Feb. 20126 Month Trend
CONTINUITY 6 Month Trend Feb. 2012 Statewide
Therapeutic Anticoagulation
Asthma Care
Diabetes Care
6 Month Trend
SPECIALTY AND HOSPITAL SERVICES
65%Prior Year Current Statewide
Potentially Avoidable Hospitalizations (per year) *
Recent Quarter ACCESS
99% 99% 99%
Clinical Process Quality of Care Patient Safety
65.2%76.3%
1st Audit 2nd Audit
Emergency Department Visits* 8.5 4.1
TOTAL 436 101% Patient Encounters per PCP 10 12
Medical FTE 11 101% Medical Staff $90.44 9 7
Nursing FTE 188 101% Nursing Staff $746.47 Patient Encounters per Psychiatrist 11 10
Pharmacy FTE 16 170% Pharmacy Staff $46.76 Prescriptions Per Pharmacist 140 121
Dental Clinical FTE 21 91% Dental Clinical Staff $81.53
Mental Health Clinical FTE 94 90% Mental Health Clinical Staff $525.34
Admin. Support FTE 87 101% Admin. Support Staff $150.61 292 10,754
NON LABOR Mental Health High Utilizers* 38 9
Hospital $78.86 Appeals Received* 78 36
Total Actual FTE 100% 100% Emergency Department $5.25 0.9% 1.9%
Civil Service FTE 84% 88% Specialty $11.31 Prison Population Capacity 153% 155%
Overtime FTE 5% 5% Medications $298.83 Cell Bed Changes 54% 53%
Registry FTE 11% 7% Diagnostics $17.27 Average Document Scan Time (in days) 4.5 3.8
KEY:
Health Care Appts. Missed due to Cusdody
92 $170.02 $93.17
Clinical Support Staff
$101.45
$745.80
$50.91
$37.70
$90.67
146%
95%
85%
Patient Encounters per Primary Mental Health Clinician
22
110
11
209
HIGH ADHERENCE LOW ADHERENCE
368
22
109%19 114%
95%
Statewide(excluding HQ)
ActualJan. 2012 % of Total
MODERATE ADHERENCE *Per 1,000 inmates
$102.59
$5.87
$16.89
$282.46
$4.11
$30.24
$102.57
$21.17
$91.00
$16.8847
6 Month Trend
436
54%
30
7.3
Statewide
78% Admin. Hospital Bed Days (per year) * 4
MAJOR COSTS PER INMATE PER MONTH WORKLOAD PER DAY
4.7 Hospital Admissions*78%
OTHER TRENDS$561.70
YTD 11/12FY 10/11
6 Month Trend Most Recent Statewide
High Risk Patients
Feb. 20126 Month Trend
Clinical Support FTE 17
Statewide(excluding HQ)
70%
79%
77%
$51.06
$26.95
$70.70
$146.19
$18.46
Primary Care Provider (PCP)
Actual Jan. 2012
103%
90%
Statewide(excluding HQ)
$79.39
$327.36
471
Flu Vaccination Mental Health Primary Clinician
Psychiatrist
95%
Authorized Jan. 2012 LABOR
-
% of Auth.
93%
93%
11
STAFFING IN FULL TIME EQUIVALENTS (FTE)
44%65%
Specialty Appts via TelemedicinePrior Year Year Statewide
KEY: HIGH ADHERENCE LOW ADHERENCE
CCHCS
MODERATE ADHERENCE Per 1,000 inmates
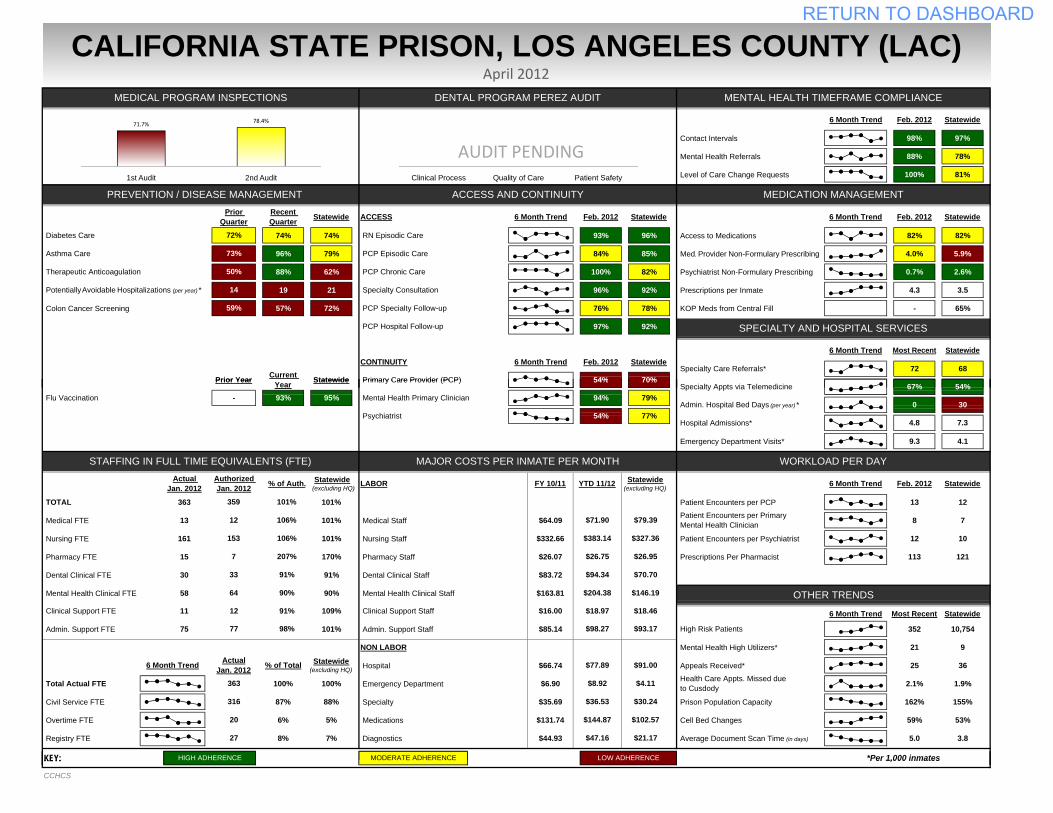
RETURN TO DASHBOARD
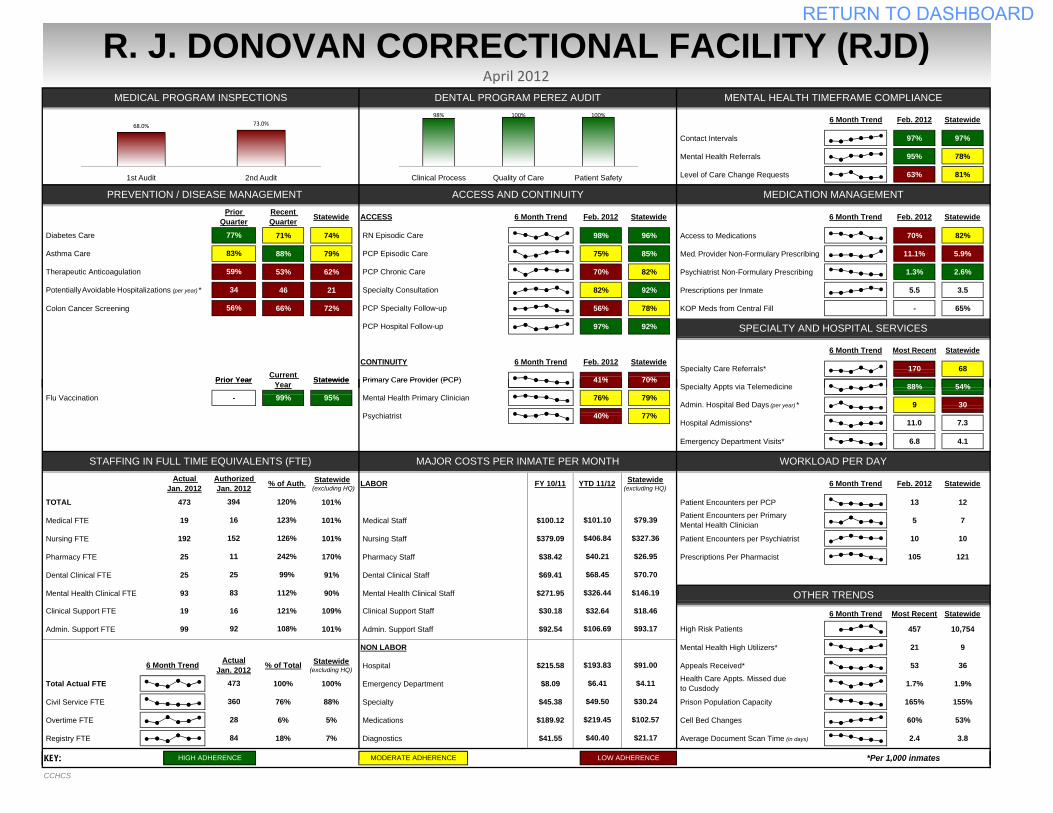
Contact Intervals 97% 97%
Mental Health Referrals 95% 78%
Level of Care Change Requests 63% 81%
71% 74% 98% 96% Access to Medications 70% 82%
88% 79% 75% 85% Med. Provider Non-Formulary Prescribing 11.1% 5.9%
53% 62% 70% 82% Psychiatrist Non-Formulary Prescribing 1.3% 2.6%
46 21 82% 92% Prescriptions per Inmate 5.5 3.5
Colon Cancer Screening 66% 72% 56% 78% KOP Meds from Central Fill - 65%
97% 92% PCP Hospital Follow-up
Statewide
70%
Statewide
Statewide
Statewide
68 Specialty Care Referrals*
Potentially Avoidable Hospitalizations (per year) *
77%
83%
59%
34
Prior Quarter
56%
Statewide
Prior Year Current
PREVENTION / DISEASE MANAGEMENT ACCESS AND CONTINUITY MEDICATION MANAGEMENT
Feb. 20126 Month Trend
MEDICAL PROGRAM INSPECTIONS DENTAL PROGRAM PEREZ AUDIT MENTAL HEALTH TIMEFRAME COMPLIANCE
Primary Care Provider (PCP)170
6 Month Trend
PCP Specialty Follow-up
RN Episodic Care
PCP Episodic Care
Specialty Consultation
ACCESS
Statewide
R. J. DONOVAN CORRECTIONAL FACILITY (RJD)April 2012
Most Recent
Feb. 20126 Month Trend
CONTINUITY 6 Month Trend Feb. 2012 Statewide
Therapeutic Anticoagulation
Asthma Care
Diabetes Care
6 Month Trend
SPECIALTY AND HOSPITAL SERVICES
41%
Recent Quarter Feb. 2012
PCP Chronic Care
98% 100% 100%
Clinical Process Quality of Care Patient Safety
68.0% 73.0%
1st Audit 2nd Audit
Emergency Department Visits* 6.8 4.1
TOTAL 473 101% Patient Encounters per PCP 13 12
Medical FTE 19 101% Medical Staff $100.12 5 7
Nursing FTE 192 101% Nursing Staff $379.09 Patient Encounters per Psychiatrist 10 10
Pharmacy FTE 25 170% Pharmacy Staff $38.42 Prescriptions Per Pharmacist 105 121
Dental Clinical FTE 25 91% Dental Clinical Staff $69.41
Mental Health Clinical FTE 93 90% Mental Health Clinical Staff $271.95
Admin. Support FTE 99 101% Admin. Support Staff $92.54 457 10,754
NON LABOR Mental Health High Utilizers* 21 9
Hospital $215.58 Appeals Received* 53 36
Total Actual FTE 100% 100% Emergency Department $8.09 1.7% 1.9%
Civil Service FTE 76% 88% Specialty $45.38 Prison Population Capacity 165% 155%
Overtime FTE 6% 5% Medications $189.92 Cell Bed Changes 60% 53%
Registry FTE 18% 7% Diagnostics $41.55 Average Document Scan Time (in days) 2.4 3.8
KEY:
360
28
Statewide(excluding HQ)
Statewide(excluding HQ)
Statewide(excluding HQ)
$40.21
$68.45
95%99%
6 Month Trend
Authorized Jan. 2012
Actual Jan. 2012
123%
126%
242%
99%
112%
120%
Health Care Appts. Missed due to Cusdody
92 $106.69 $93.17 High Risk Patients
121%
108%
ActualJan. 2012 % of Total
473
HIGH ADHERENCE LOW ADHERENCEMODERATE ADHERENCE *Per 1,000 inmates
$193.83
$6.41
$49.50
$219.45
$4.11
$30.24
$102.57
$21.17
$91.00
$40.4084
70%
79%
77%
54%
30
7.3
Statewide
76% Admin. Hospital Bed Days (per year) * 9
MAJOR COSTS PER INMATE PER MONTH WORKLOAD PER DAY
11.0
19
-
394
16
152
11
25
83
STAFFING IN FULL TIME EQUIVALENTS (FTE)
Clinical Support FTE 16 109%
% of Auth.
Prior Year Year
OTHER TRENDS$326.44
Clinical Support Staff
$101.10
$406.84
Patient Encounters per Primary Mental Health Clinician
$30.18 6 Month Trend Most Recent Statewide
Primary Care Provider (PCP)
Mental Health Primary Clinician
Psychiatrist 40%
YTD 11/12FY 10/11LABOR Feb. 20126 Month Trend
Hospital Admissions*
$79.39
$327.36
$26.95
$70.70
$146.19
$18.46$32.64
Statewide88%
41% Specialty Appts via Telemedicine
Flu Vaccination
KEY: HIGH ADHERENCE LOW ADHERENCE
CCHCS
MODERATE ADHERENCE Per 1,000 inmates
RETURN TO DASHBOARD
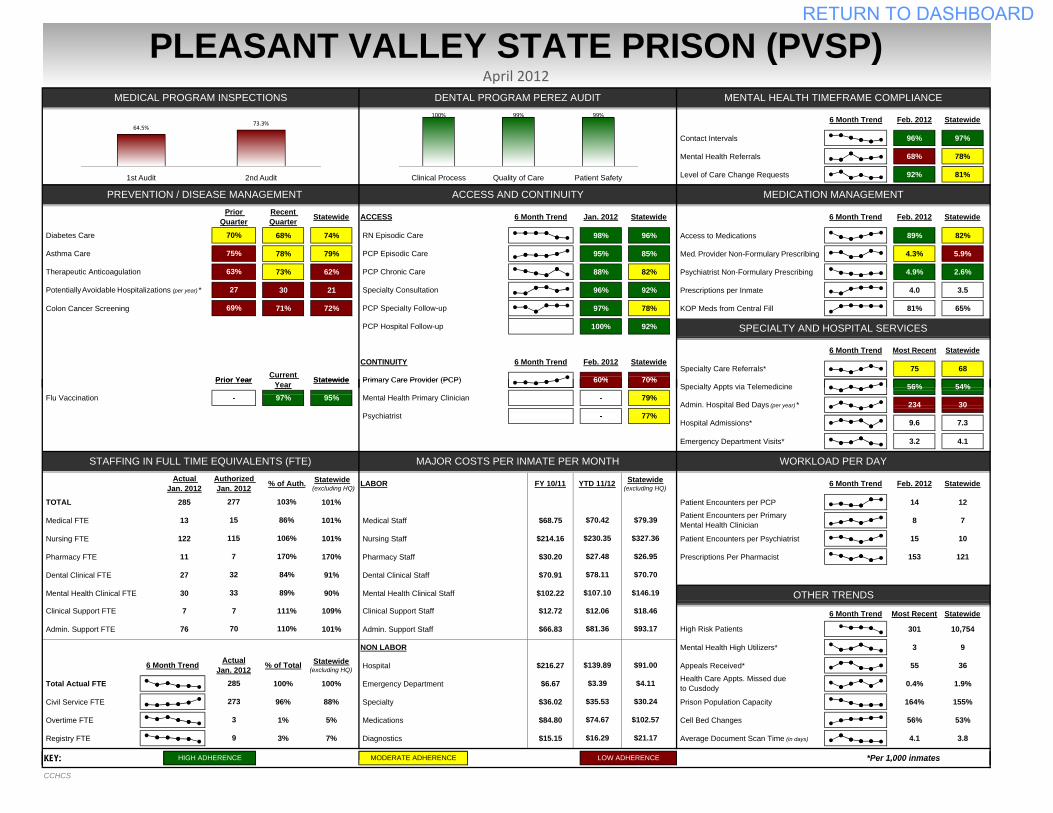
Contact Intervals 96% 97%
Mental Health Referrals 68% 78%
Level of Care Change Requests 92% 81%
68% 74% 98% 96% Access to Medications 89% 82%
78% 79% 95% 85% Med. Provider Non-Formulary Prescribing 4.3% 5.9%
73% 62% 88% 82% Psychiatrist Non-Formulary Prescribing 4.9% 2.6%
30 21 96% 92% Prescriptions per Inmate 4.0 3.5
Colon Cancer Screening 71% 72% 97% 78% KOP Meds from Central Fill 81% 65%
100% 92% PCP Hospital Follow-up
Current Statewide
Statewide
70%
Statewide
Statewide
Statewide
68 Specialty Care Referrals*
Potentially Avoidable Hospitalizations (per year) *
70%
75%
63%
27
Prior Quarter
69%
Statewide
Prior Year
PCP Chronic Care
6 Month Trend
PCP Specialty Follow-up
RN Episodic Care
PCP Episodic Care
Specialty Consultation
PREVENTION / DISEASE MANAGEMENT ACCESS AND CONTINUITY MEDICATION MANAGEMENT
Feb. 20126 Month Trend
MEDICAL PROGRAM INSPECTIONS DENTAL PROGRAM PEREZ AUDIT MENTAL HEALTH TIMEFRAME COMPLIANCE
Primary Care Provider (PCP)75
PLEASANT VALLEY STATE PRISON (PVSP)April 2012
Most Recent
Feb. 20126 Month Trend
CONTINUITY 6 Month Trend Feb. 2012 Statewide
Therapeutic Anticoagulation
Asthma Care
Diabetes Care
6 Month Trend
SPECIALTY AND HOSPITAL SERVICES
60%
Recent Quarter ACCESS Jan. 2012
100% 99% 99%
Clinical Process Quality of Care Patient Safety
64.5%73.3%
1st Audit 2nd Audit
Emergency Department Visits* 3.2 4.1
TOTAL 285 101% Patient Encounters per PCP 14 12
Medical FTE 13 101% Medical Staff $68.75 8 7
Nursing FTE 122 101% Nursing Staff $214.16 Patient Encounters per Psychiatrist 15 10
Pharmacy FTE 11 170% Pharmacy Staff $30.20 Prescriptions Per Pharmacist 153 121
Dental Clinical FTE 27 91% Dental Clinical Staff $70.91
Mental Health Clinical FTE 30 90% Mental Health Clinical Staff $102.22
Admin. Support FTE 76 101% Admin. Support Staff $66.83 301 10,754
NON LABOR Mental Health High Utilizers* 3 9
Hospital $216.27 Appeals Received* 55 36
Total Actual FTE 100% 100% Emergency Department $6.67 0.4% 1.9%
Civil Service FTE 96% 88% Specialty $36.02 Prison Population Capacity 164% 155%
Overtime FTE 1% 5% Medications $84.80 Cell Bed Changes 56% 53%
Registry FTE 3% 7% Diagnostics $15.15 Average Document Scan Time (in days) 4.1 3.8
KEY:
$27.48
$78.11
95%97%
6 Month Trend
Authorized Jan. 2012
Actual Jan. 2012
86%
106%
170%
84%
89%
Statewide(excluding HQ)
$12.06
Year Statewide
273
3
Health Care Appts. Missed due to Cusdody
70 $81.36 $93.17 High Risk Patients
111%
110%
ActualJan. 2012 % of Total
285
HIGH ADHERENCE LOW ADHERENCEMODERATE ADHERENCE *Per 1,000 inmates
$139.89
$3.39
$35.53
$74.67
$4.11
$30.24
$102.57
$21.17
$91.00
$16.29
Statewide(excluding HQ)
9
70%
79%
77%
54%
30
7.3
Statewide
- Admin. Hospital Bed Days (per year) * 234
MAJOR COSTS PER INMATE PER MONTH WORKLOAD PER DAY
9.6 Hospital Admissions*
7
-
277
15
115
7
32
33
STAFFING IN FULL TIME EQUIVALENTS (FTE)
Clinical Support FTE 7 109%
% of Auth.
103%
Prior Year
OTHER TRENDS$107.10
Clinical Support Staff
$70.42
$230.35
Patient Encounters per Primary Mental Health Clinician
$12.72 6 Month Trend Most Recent Statewide
$79.39
$327.36
$26.95
$70.70
$146.19
$18.46
Primary Care Provider (PCP)
Mental Health Primary Clinician
Psychiatrist -
YTD 11/12FY 10/11LABOR Feb. 20126 Month TrendStatewide(excluding HQ)
56%60%
Specialty Appts via Telemedicine Flu Vaccination
KEY: HIGH ADHERENCE LOW ADHERENCE
CCHCS
MODERATE ADHERENCE Per 1,000 inmates
RETURN TO DASHBOARD
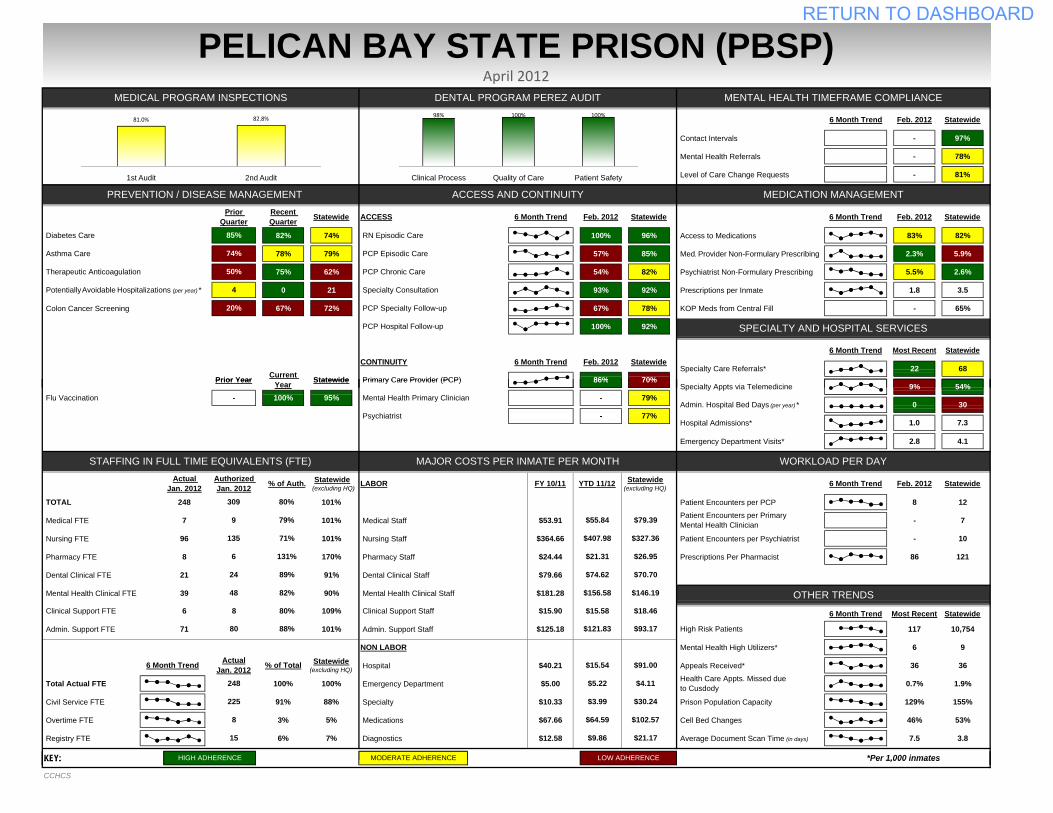
Contact Intervals - 97%
Mental Health Referrals - 78%
Level of Care Change Requests - 81%
82% 74% 100% 96% Access to Medications 83% 82%
78% 79% 57% 85% Med. Provider Non-Formulary Prescribing 2.3% 5.9%
75% 62% 54% 82% Psychiatrist Non-Formulary Prescribing 5.5% 2.6%
0 21 93% 92% Prescriptions per Inmate 1.8 3.5
Colon Cancer Screening 67% 72% 67% 78% KOP Meds from Central Fill - 65%
100% 92%
PELICAN BAY STATE PRISON (PBSP)April 2012
Most Recent
Feb. 20126 Month Trend
CONTINUITY 6 Month Trend Feb. 2012 Statewide
Therapeutic Anticoagulation
Asthma Care
Diabetes Care
6 Month Trend
SPECIALTY AND HOSPITAL SERVICES
86%
Recent Quarter ACCESS Feb. 2012
Primary Care Provider (PCP)22
PREVENTION / DISEASE MANAGEMENT ACCESS AND CONTINUITY MEDICATION MANAGEMENT
Feb. 20126 Month Trend
MEDICAL PROGRAM INSPECTIONS DENTAL PROGRAM PEREZ AUDIT MENTAL HEALTH TIMEFRAME COMPLIANCE
PCP Chronic Care
6 Month Trend
PCP Specialty Follow-up
RN Episodic Care
PCP Episodic Care
Specialty Consultation Potentially Avoidable Hospitalizations (per year) *
85%
74%
50%
4
Prior Quarter
20%
Statewide
Prior Year
Statewide
70%
Statewide
Statewide
Statewide
68 Specialty Care Referrals*Current Statewide
PCP Hospital Follow-up
98% 100% 100%
Clinical Process Quality of Care Patient Safety
81.0% 82.8%
1st Audit 2nd Audit
Emergency Department Visits* 2.8 4.1
TOTAL 248 101% Patient Encounters per PCP 8 12
Medical FTE 7 101% Medical Staff $53.91 - 7
Nursing FTE 96 101% Nursing Staff $364.66 Patient Encounters per Psychiatrist - 10
Pharmacy FTE 8 170% Pharmacy Staff $24.44 Prescriptions Per Pharmacist 86 121
Dental Clinical FTE 21 91% Dental Clinical Staff $79.66
Mental Health Clinical FTE 39 90% Mental Health Clinical Staff $181.28
Admin. Support FTE 71 101% Admin. Support Staff $125.18 117 10,754
NON LABOR Mental Health High Utilizers* 6 9
Hospital $40.21 Appeals Received* 36 36
Total Actual FTE 100% 100% Emergency Department $5.00 0.7% 1.9%
Civil Service FTE 91% 88% Specialty $10.33 Prison Population Capacity 129% 155%
Overtime FTE 3% 5% Medications $67.66 Cell Bed Changes 46% 53%
Registry FTE 6% 7% Diagnostics $12.58 Average Document Scan Time (in days) 7.5 3.8
KEY:
9%86%
Specialty Appts via Telemedicine Flu Vaccination
Primary Care Provider (PCP)
Mental Health Primary Clinician
Psychiatrist -
YTD 11/12FY 10/11LABOR Feb. 20126 Month TrendStatewide(excluding HQ)
OTHER TRENDS$156.58
Clinical Support Staff
$55.84
$407.98
Patient Encounters per Primary Mental Health Clinician
$15.90 6 Month Trend Most Recent Statewide
$79.39
$327.36
$26.95
$70.70
$146.19
$18.466
-
309
9
135
6
24
48
STAFFING IN FULL TIME EQUIVALENTS (FTE)
Clinical Support FTE 8 109%
% of Auth.
80%
Prior Year 70%
79%
77%
54%
30
7.3
Statewide
- Admin. Hospital Bed Days (per year) * 0
MAJOR COSTS PER INMATE PER MONTH WORKLOAD PER DAY
1.0 Hospital Admissions*
HIGH ADHERENCE LOW ADHERENCEMODERATE ADHERENCE *Per 1,000 inmates
$15.54
$5.22
$3.99
$64.59
$4.11
$30.24
$102.57
$21.17
$91.00
$9.86
Statewide(excluding HQ)
15
Health Care Appts. Missed due to Cusdody
80 $121.83 $93.17 High Risk Patients
80%
88%
ActualJan. 2012 % of Total
248
$15.58
Year Statewide
225
8
$21.31
$74.62
95%100%
6 Month Trend
Authorized Jan. 2012
Actual Jan. 2012
79%
71%
131%
89%
82%
Statewide(excluding HQ)
KEY: HIGH ADHERENCE LOW ADHERENCE
CCHCS
MODERATE ADHERENCE Per 1,000 inmates
RETURN TO DASHBOARD

Contact Intervals 95% 97%
Mental Health Referrals 39% 78%
Level of Care Change Requests 71% 81%
67% 74% 85% 96% Access to Medications 91% 82%
56% 79% 80% 85% Med. Provider Non-Formulary Prescribing 3.1% 5.9%
50% 62% 67% 82% Psychiatrist Non-Formulary Prescribing 2.5% 2.6%
23 21 100% 92% Prescriptions per Inmate 2.8 3.5
Colon Cancer Screening 54% 72% 88% 78% KOP Meds from Central Fill - 65%
92% 92% PCP Hospital Follow-up
Prior Year Current Statewide
Statewide
70%
Statewide
Statewide
Statewide
68 Specialty Care Referrals*
Potentially Avoidable Hospitalizations (per year) *
49%
64%
80%
32
Prior Quarter
6%
Statewide
PCP Chronic Care
6 Month Trend
PCP Specialty Follow-up
RN Episodic Care
PCP Episodic Care
Specialty Consultation
PREVENTION / DISEASE MANAGEMENT ACCESS AND CONTINUITY MEDICATION MANAGEMENT
Feb. 20126 Month Trend
MEDICAL PROGRAM INSPECTIONS DENTAL PROGRAM PEREZ AUDIT MENTAL HEALTH TIMEFRAME COMPLIANCE
Primary Care Provider (PCP)42
NORTH KERN STATE PRISON (NKSP)April 2012
Most Recent
Feb. 20126 Month Trend
CONTINUITY 6 Month Trend Feb. 2012 Statewide
Therapeutic Anticoagulation
Asthma Care
Diabetes Care
6 Month Trend
SPECIALTY AND HOSPITAL SERVICES
56%
Recent Quarter ACCESS Feb. 2012
100% 87% 100%
Clinical Process Quality of Care Patient Safety
72.2% 79.3%
1st Audit 2nd Audit
Emergency Department Visits* 0.9 4.1
TOTAL 348 101% Patient Encounters per PCP 13 12
Medical FTE 14 101% Medical Staff $72.37 6 7
Nursing FTE 138 101% Nursing Staff $277.65 Patient Encounters per Psychiatrist 9 10
Pharmacy FTE 14 170% Pharmacy Staff $22.17 Prescriptions Per Pharmacist 140 121
Dental Clinical FTE 30 91% Dental Clinical Staff $70.93
Mental Health Clinical FTE 53 90% Mental Health Clinical Staff $150.62
Admin. Support FTE 85 101% Admin. Support Staff $74.61 164 10,754
NON LABOR Mental Health High Utilizers* 3 9
Hospital $139.95 Appeals Received* 23 36
Total Actual FTE 100% 100% Emergency Department $5.20 0.3% 1.9%
Civil Service FTE 84% 88% Specialty $29.97 Prison Population Capacity 176% 155%
Overtime FTE 7% 5% Medications $77.85 Cell Bed Changes 73% 53%
Registry FTE 9% 7% Diagnostics $24.73 Average Document Scan Time (in days) 3.8 3.8
KEY:
Health Care Appts. Missed due to Cusdody
79 $91.88 $93.17
6 Month Trend Most Recent Statewide
High Risk Patients
118%
108%
ActualJan. 2012 % of Total
$20.48
$87.44
95%100%
Authorized Jan. 2012
Actual Jan. 2012
90%
104%
127%
97%
Prior Year Year Statewide
HIGH ADHERENCE LOW ADHERENCEMODERATE ADHERENCE *Per 1,000 inmates
$108.39
$2.77
$33.70
$77.71
$4.11
$30.24
$102.57
$21.17
$91.00
$38.3831
6 Month Trend
70%
79%
77%
54%
30
7.3
Statewide
- Admin. Hospital Bed Days (per year) * 82
MAJOR COSTS PER INMATE PER MONTH WORKLOAD PER DAY
7.5 Hospital Admissions*
14
-
337
16
132
11
31
56
STAFFING IN FULL TIME EQUIVALENTS (FTE)
Clinical Support FTE 12 109%
% of Auth.
103%
OTHER TRENDS$156.71
Clinical Support Staff
$84.33
$312.86
Patient Encounters per Primary Mental Health Clinician
$15.26
Primary Care Provider (PCP)
Mental Health Primary Clinician
Psychiatrist -
YTD 11/12FY 10/11LABOR Feb. 20126 Month Trend
65%56%
Specialty Appts via Telemedicine Flu Vaccination
348
293
23
Statewide(excluding HQ)
Statewide(excluding HQ)
Statewide(excluding HQ)
$79.39
$327.36
$26.95
$70.70
$146.19
$18.46$18.15
94%
KEY: HIGH ADHERENCE LOW ADHERENCE
CCHCS
MODERATE ADHERENCE Per 1,000 inmates
RETURN TO DASHBOARD
Contact Intervals 94% 97%
Mental Health Referrals 71% 78%
Level of Care Change Requests 98% 81%
74% 74% 89% 96% Access to Medications 73% 82%
89% 79% 89% 85% Med. Provider Non-Formulary Prescribing 6.5% 5.9%
80% 62% 100% 82% Psychiatrist Non-Formulary Prescribing 4.6% 2.6%
16 21 99% 92% Prescriptions per Inmate 5.2 3.5
Colon Cancer Screening 91% 72% 52% 78% KOP Meds from Central Fill 92% 65%
84% 92% PCP Hospital Follow-up
Current Statewide
Statewide
70%
Statewide
Statewide
Statewide
68 Specialty Care Referrals*
Potentially Avoidable Hospitalizations (per year) *
74%
88%
70%
16
Prior Quarter
88%
Statewide
Prior Year
PCP Chronic Care
6 Month Trend
PCP Specialty Follow-up
RN Episodic Care
PCP Episodic Care
Specialty Consultation
PREVENTION / DISEASE MANAGEMENT ACCESS AND CONTINUITY MEDICATION MANAGEMENT
Feb. 20126 Month Trend
MEDICAL PROGRAM INSPECTIONS DENTAL PROGRAM PEREZ AUDIT MENTAL HEALTH TIMEFRAME COMPLIANCE
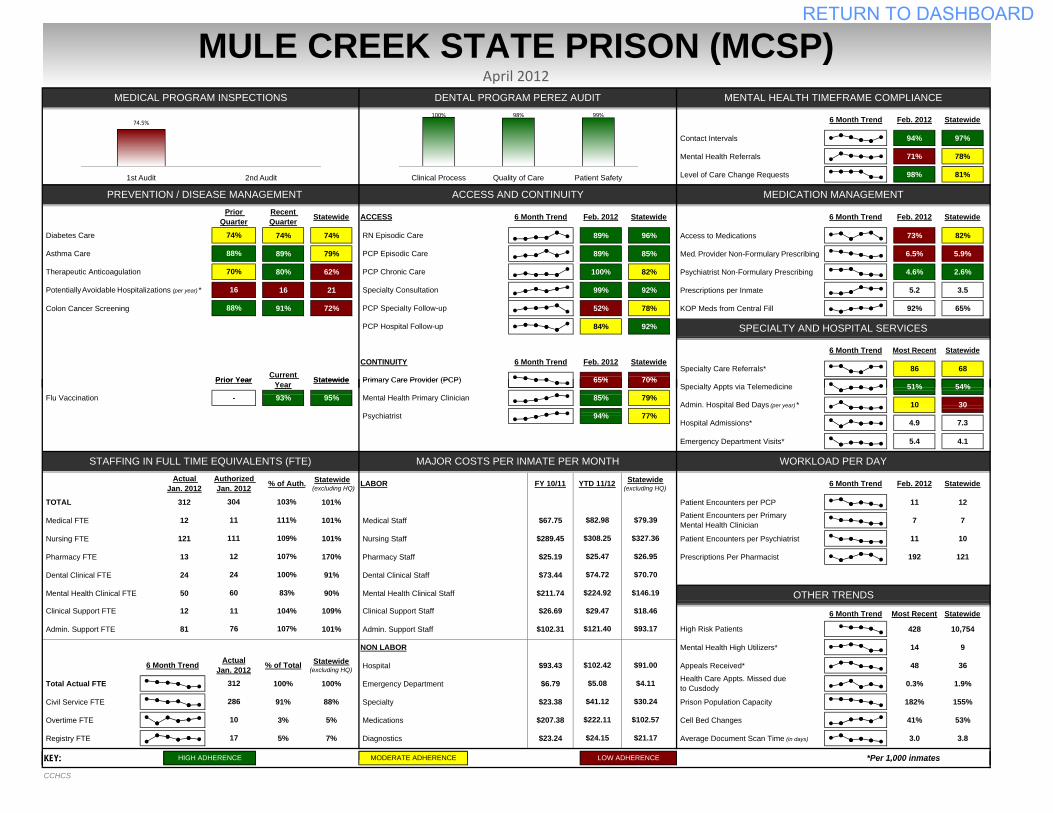
Primary Care Provider (PCP)86
MULE CREEK STATE PRISON (MCSP)April 2012
Most Recent
Feb. 20126 Month Trend
CONTINUITY 6 Month Trend Feb. 2012 Statewide
Therapeutic Anticoagulation
Asthma Care
Diabetes Care
6 Month Trend
SPECIALTY AND HOSPITAL SERVICES
65%
Recent Quarter ACCESS Feb. 2012
100% 98% 99%
Clinical Process Quality of Care Patient Safety
74.5%
1st Audit 2nd Audit
Emergency Department Visits* 5.4 4.1
TOTAL 312 101% Patient Encounters per PCP 11 12
Medical FTE 12 101% Medical Staff $67.75 7 7
Nursing FTE 121 101% Nursing Staff $289.45 Patient Encounters per Psychiatrist 11 10
Pharmacy FTE 13 170% Pharmacy Staff $25.19 Prescriptions Per Pharmacist 192 121
Dental Clinical FTE 24 91% Dental Clinical Staff $73.44
Mental Health Clinical FTE 50 90% Mental Health Clinical Staff $211.74
Admin. Support FTE 81 101% Admin. Support Staff $102.31 428 10,754
NON LABOR Mental Health High Utilizers* 14 9
Hospital $93.43 Appeals Received* 48 36
Total Actual FTE 100% 100% Emergency Department $6.79 0.3% 1.9%
Civil Service FTE 91% 88% Specialty $23.38 Prison Population Capacity 182% 155%
Overtime FTE 3% 5% Medications $207.38 Cell Bed Changes 41% 53%
Registry FTE 5% 7% Diagnostics $23.24 Average Document Scan Time (in days) 3.0 3.8
KEY:
$25.47
$74.72
95%93%
6 Month Trend
Authorized Jan. 2012
Actual Jan. 2012
111%
109%
107%
100%
83%
Statewide(excluding HQ)
$29.47
Year Statewide
286
10
Health Care Appts. Missed due to Cusdody
76 $121.40 $93.17 High Risk Patients
104%
107%
ActualJan. 2012 % of Total
312
HIGH ADHERENCE LOW ADHERENCEMODERATE ADHERENCE *Per 1,000 inmates
$102.42
$5.08
$41.12
$222.11
$4.11
$30.24
$102.57
$21.17
$91.00
$24.15
Statewide(excluding HQ)
17
70%
79%
77%
54%
30
7.3
Statewide
85% Admin. Hospital Bed Days (per year) * 10
MAJOR COSTS PER INMATE PER MONTH WORKLOAD PER DAY
4.9 Hospital Admissions*
12
-
304
11
111
12
24
60
STAFFING IN FULL TIME EQUIVALENTS (FTE)
Clinical Support FTE 11 109%
% of Auth.
103%
Prior Year
OTHER TRENDS$224.92
Clinical Support Staff
$82.98
$308.25
Patient Encounters per Primary Mental Health Clinician
$26.69 6 Month Trend Most Recent Statewide
$79.39
$327.36
$26.95
$70.70
$146.19
$18.46
Primary Care Provider (PCP)
Mental Health Primary Clinician
Psychiatrist 94%
YTD 11/12FY 10/11LABOR Feb. 20126 Month TrendStatewide(excluding HQ)
51%65%
Specialty Appts via Telemedicine Flu Vaccination
KEY: HIGH ADHERENCE LOW ADHERENCE
CCHCS
MODERATE ADHERENCE Per 1,000 inmates
RETURN TO DASHBOARD
Contact Intervals 98% 97%
Mental Health Referrals 88% 78%
Level of Care Change Requests 100% 81%
74% 74% 93% 96% Access to Medications 82% 82%
96% 79% 84% 85% Med. Provider Non-Formulary Prescribing 4.0% 5.9%
88% 62% 100% 82% Psychiatrist Non-Formulary Prescribing 0.7% 2.6%
19 21 96% 92% Prescriptions per Inmate 4.3 3.5
Colon Cancer Screening 57% 72% 76% 78% KOP Meds from Central Fill - 65%
97% 92% PCP Hospital Follow-up
Current Statewide
Statewide
70%
Statewide
Statewide
Statewide
68 Specialty Care Referrals*
Potentially Avoidable Hospitalizations (per year) *
72%
73%
50%
14
Prior Quarter
59%
Statewide
Prior Year
PCP Chronic Care
6 Month Trend
PCP Specialty Follow-up
RN Episodic Care
PCP Episodic Care
Specialty Consultation
PREVENTION / DISEASE MANAGEMENT ACCESS AND CONTINUITY MEDICATION MANAGEMENT
Feb. 20126 Month Trend
MEDICAL PROGRAM INSPECTIONS DENTAL PROGRAM PEREZ AUDIT MENTAL HEALTH TIMEFRAME COMPLIANCE
Primary Care Provider (PCP)72
CALIFORNIA STATE PRISON, LOS ANGELES COUNTY (LAC)April 2012
Most Recent
Feb. 20126 Month Trend
CONTINUITY 6 Month Trend Feb. 2012 Statewide
Therapeutic Anticoagulation
Asthma Care
Diabetes Care
6 Month Trend
SPECIALTY AND HOSPITAL SERVICES
54%
Recent Quarter ACCESS Feb. 2012
Clinical Process Quality of Care Patient Safety
71.7% 78.4%
1st Audit 2nd Audit
AUDIT PENDING
Emergency Department Visits* 9.3 4.1
TOTAL 363 101% Patient Encounters per PCP 13 12
Medical FTE 13 101% Medical Staff $64.09 8 7
Nursing FTE 161 101% Nursing Staff $332.66 Patient Encounters per Psychiatrist 12 10
Pharmacy FTE 15 170% Pharmacy Staff $26.07 Prescriptions Per Pharmacist 113 121
Dental Clinical FTE 30 91% Dental Clinical Staff $83.72
Mental Health Clinical FTE 58 90% Mental Health Clinical Staff $163.81
Admin. Support FTE 75 101% Admin. Support Staff $85.14 352 10,754
NON LABOR Mental Health High Utilizers* 21 9
Hospital $66.74 Appeals Received* 25 36
Total Actual FTE 100% 100% Emergency Department $6.90 2.1% 1.9%
Civil Service FTE 87% 88% Specialty $35.69 Prison Population Capacity 162% 155%
Overtime FTE 6% 5% Medications $131.74 Cell Bed Changes 59% 53%
Registry FTE 8% 7% Diagnostics $44.93 Average Document Scan Time (in days) 5.0 3.8
KEY:
$26.75
$94.34
95%93%
6 Month Trend
Authorized Jan. 2012
Actual Jan. 2012
106%
106%
207%
91%
90%
Statewide(excluding HQ)
$18.97
Year Statewide
316
20
Health Care Appts. Missed due to Cusdody
77 $98.27 $93.17 High Risk Patients
91%
98%
ActualJan. 2012 % of Total
363
HIGH ADHERENCE LOW ADHERENCEMODERATE ADHERENCE *Per 1,000 inmates
$77.89
$8.92
$36.53
$144.87
$4.11
$30.24
$102.57
$21.17
$91.00
$47.16
Statewide(excluding HQ)
27
70%
79%
77%
54%
30
7.3
Statewide
94% Admin. Hospital Bed Days (per year) * 0
MAJOR COSTS PER INMATE PER MONTH WORKLOAD PER DAY
4.8 Hospital Admissions*
11
-
359
12
153
7
33
64
STAFFING IN FULL TIME EQUIVALENTS (FTE)
Clinical Support FTE 12 109%
% of Auth.
101%
Prior Year
OTHER TRENDS$204.38
Clinical Support Staff
$71.90
$383.14
Patient Encounters per Primary Mental Health Clinician
$16.00 6 Month Trend Most Recent Statewide
$79.39
$327.36
$26.95
$70.70
$146.19
$18.46
Primary Care Provider (PCP)
Mental Health Primary Clinician
Psychiatrist 54%
YTD 11/12FY 10/11LABOR Feb. 20126 Month TrendStatewide(excluding HQ)
67%54%
Specialty Appts via Telemedicine Flu Vaccination
KEY: HIGH ADHERENCE LOW ADHERENCE
CCHCS
MODERATE ADHERENCE Per 1,000 inmates
RETURN TO DASHBOARD
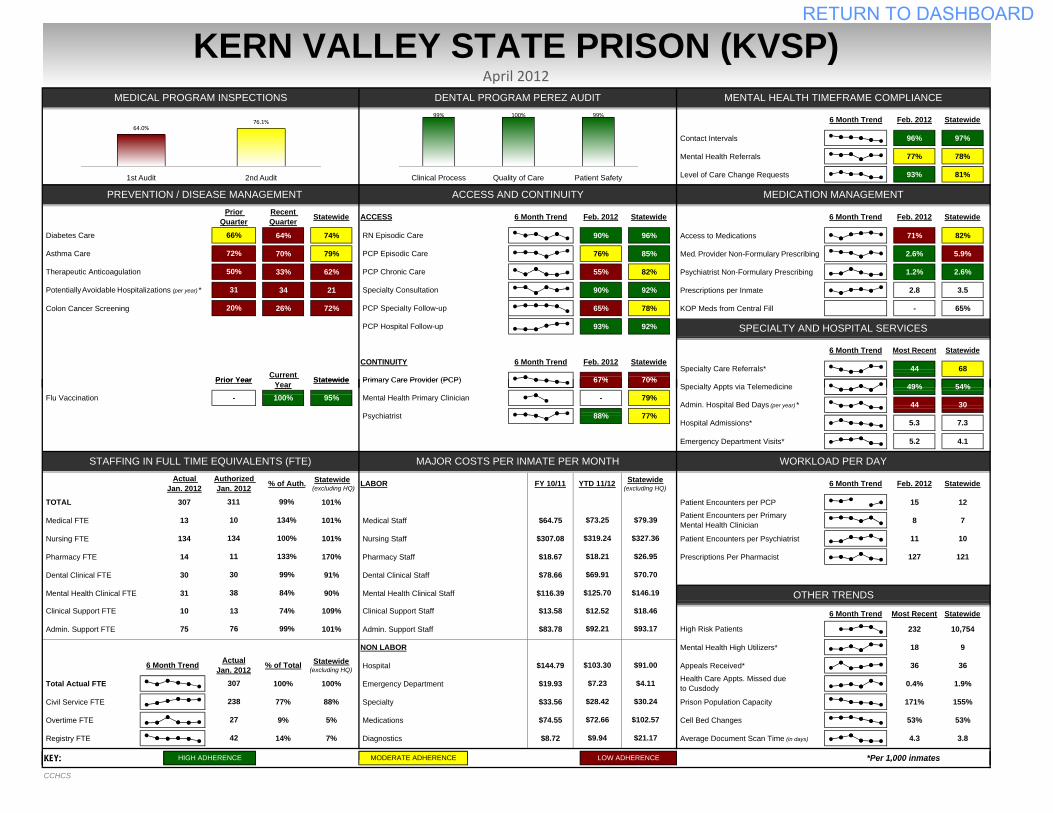
Contact Intervals 96% 97%
Mental Health Referrals 77% 78%
Level of Care Change Requests 93% 81%
64% 74% 90% 96% Access to Medications 71% 82%
70% 79% 76% 85% Med. Provider Non-Formulary Prescribing 2.6% 5.9%
33% 62% 55% 82% Psychiatrist Non-Formulary Prescribing 1.2% 2.6%
34 21 90% 92% Prescriptions per Inmate 2.8 3.5
Colon Cancer Screening 26% 72% 65% 78% KOP Meds from Central Fill - 65%
93% 92%
Statewide
KERN VALLEY STATE PRISON (KVSP)April 2012
Most Recent
Feb. 20126 Month Trend
CONTINUITY 6 Month Trend Feb. 2012 Statewide
Therapeutic Anticoagulation
Asthma Care
Diabetes Care
6 Month Trend
SPECIALTY AND HOSPITAL SERVICES
67%
Recent Quarter Feb. 2012
PCP Chronic Care
6 Month Trend
PCP Specialty Follow-up
RN Episodic Care
PCP Episodic Care
Specialty Consultation
ACCESS
Primary Care Provider (PCP)44
PREVENTION / DISEASE MANAGEMENT ACCESS AND CONTINUITY MEDICATION MANAGEMENT
Feb. 20126 Month Trend
MEDICAL PROGRAM INSPECTIONS DENTAL PROGRAM PEREZ AUDIT MENTAL HEALTH TIMEFRAME COMPLIANCE
Potentially Avoidable Hospitalizations (per year) *
66%
72%
50%
31
Prior Quarter
20%
Statewide
Prior Year Current
Statewide
70%
Statewide
Statewide
Statewide
68 Specialty Care Referrals*
PCP Hospital Follow-up
99% 100% 99%
Clinical Process Quality of Care Patient Safety
64.0%76.1%
1st Audit 2nd Audit
Emergency Department Visits* 5.2 4.1
TOTAL 307 101% Patient Encounters per PCP 15 12
Medical FTE 13 101% Medical Staff $64.75 8 7
Nursing FTE 134 101% Nursing Staff $307.08 Patient Encounters per Psychiatrist 11 10
Pharmacy FTE 14 170% Pharmacy Staff $18.67 Prescriptions Per Pharmacist 127 121
Dental Clinical FTE 30 91% Dental Clinical Staff $78.66
Mental Health Clinical FTE 31 90% Mental Health Clinical Staff $116.39
Admin. Support FTE 75 101% Admin. Support Staff $83.78 232 10,754
NON LABOR Mental Health High Utilizers* 18 9
Hospital $144.79 Appeals Received* 36 36
Total Actual FTE 100% 100% Emergency Department $19.93 0.4% 1.9%
Civil Service FTE 77% 88% Specialty $33.56 Prison Population Capacity 171% 155%
Overtime FTE 9% 5% Medications $74.55 Cell Bed Changes 53% 53%
Registry FTE 14% 7% Diagnostics $8.72 Average Document Scan Time (in days) 4.3 3.8
KEY:
Statewide49%
67% Specialty Appts via Telemedicine
Flu Vaccination
$79.39
$327.36
$26.95
$70.70
$146.19
$18.46$12.52
Primary Care Provider (PCP)
Mental Health Primary Clinician
Psychiatrist 88%
YTD 11/12FY 10/11LABOR Feb. 20126 Month Trend
Hospital Admissions*
OTHER TRENDS$125.70
Clinical Support Staff
$73.25
$319.24
Patient Encounters per Primary Mental Health Clinician
$13.58 6 Month Trend Most Recent Statewide10
-
311
10
134
11
30
38
STAFFING IN FULL TIME EQUIVALENTS (FTE)
Clinical Support FTE 13 109%
% of Auth.
Prior Year Year 70%
79%
77%
54%
30
7.3
Statewide
- Admin. Hospital Bed Days (per year) * 44
MAJOR COSTS PER INMATE PER MONTH WORKLOAD PER DAY
5.3
HIGH ADHERENCE LOW ADHERENCEMODERATE ADHERENCE *Per 1,000 inmates
$103.30
$7.23
$28.42
$72.66
$4.11
$30.24
$102.57
$21.17
$91.00
$9.9442
Health Care Appts. Missed due to Cusdody
76 $92.21 $93.17 High Risk Patients
74%
99%
ActualJan. 2012 % of Total
307
238
27
Statewide(excluding HQ)
Statewide(excluding HQ)
Statewide(excluding HQ)
$18.21
$69.91
95%100%
6 Month Trend
Authorized Jan. 2012
Actual Jan. 2012
134%
100%
133%
99%
84%
99%
KEY: HIGH ADHERENCE LOW ADHERENCE
CCHCS
MODERATE ADHERENCE Per 1,000 inmates
RETURN TO DASHBOARD
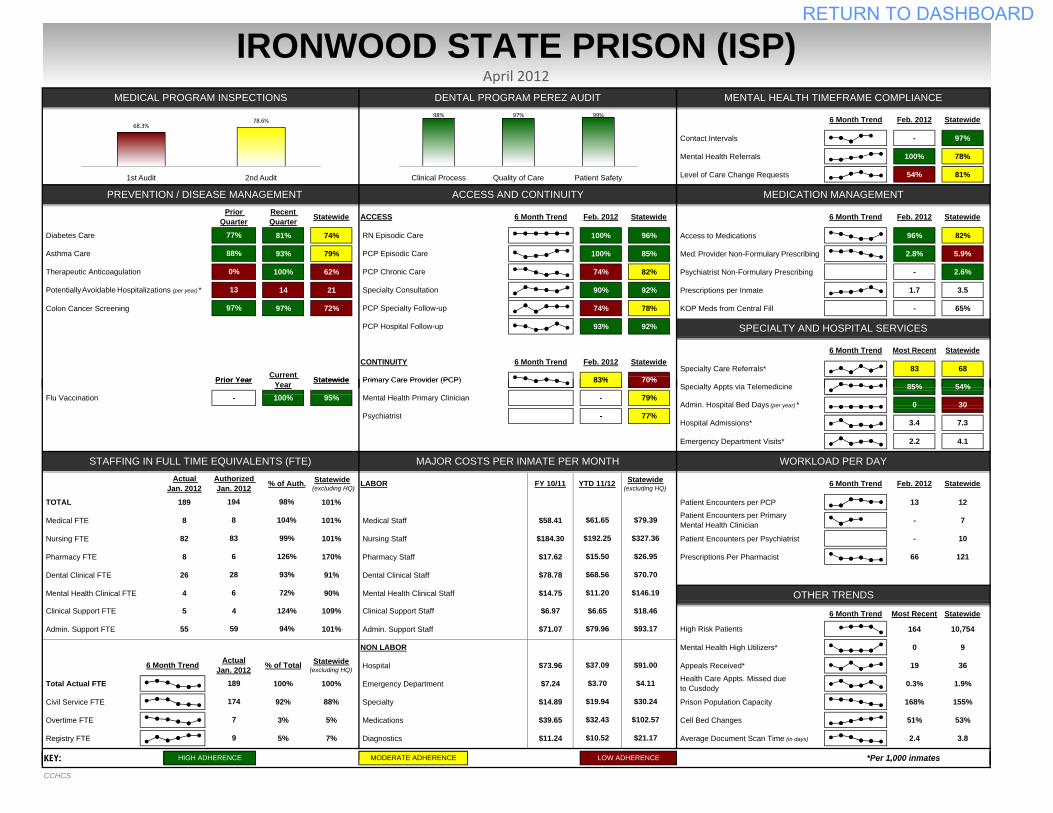
Contact Intervals - 97%
Mental Health Referrals 100% 78%
Level of Care Change Requests 54% 81%
81% 74% 100% 96% Access to Medications 96% 82%
93% 79% 100% 85% Med. Provider Non-Formulary Prescribing 2.8% 5.9%
100% 62% 74% 82% Psychiatrist Non-Formulary Prescribing - 2.6%
14 21 90% 92% Prescriptions per Inmate 1.7 3.5
Colon Cancer Screening 97% 72% 74% 78% KOP Meds from Central Fill - 65%
93% 92%
IRONWOOD STATE PRISON (ISP)April 2012
Most Recent
Feb. 20126 Month Trend
CONTINUITY 6 Month Trend Feb. 2012 Statewide
Therapeutic Anticoagulation
Asthma Care
Diabetes Care
6 Month Trend
SPECIALTY AND HOSPITAL SERVICES
83%
Recent Quarter ACCESS Feb. 2012
Primary Care Provider (PCP)83
PREVENTION / DISEASE MANAGEMENT ACCESS AND CONTINUITY MEDICATION MANAGEMENT
Feb. 20126 Month Trend
MEDICAL PROGRAM INSPECTIONS DENTAL PROGRAM PEREZ AUDIT MENTAL HEALTH TIMEFRAME COMPLIANCE
PCP Chronic Care
6 Month Trend
PCP Specialty Follow-up
RN Episodic Care
PCP Episodic Care
Specialty Consultation Potentially Avoidable Hospitalizations (per year) *
77%
88%
0%
13
Prior Quarter
97%
Statewide
Prior Year
Statewide
70%
Statewide
Statewide
Statewide
68 Specialty Care Referrals*Current Statewide
PCP Hospital Follow-up
98% 97% 99%
Clinical Process Quality of Care Patient Safety
68.3%78.6%
1st Audit 2nd Audit
Emergency Department Visits* 2.2 4.1
TOTAL 189 101% Patient Encounters per PCP 13 12
Medical FTE 8 101% Medical Staff $58.41 - 7
Nursing FTE 82 101% Nursing Staff $184.30 Patient Encounters per Psychiatrist - 10
Pharmacy FTE 8 170% Pharmacy Staff $17.62 Prescriptions Per Pharmacist 66 121
Dental Clinical FTE 26 91% Dental Clinical Staff $78.78
Mental Health Clinical FTE 4 90% Mental Health Clinical Staff $14.75
Admin. Support FTE 55 101% Admin. Support Staff $71.07 164 10,754
NON LABOR Mental Health High Utilizers* 0 9
Hospital $73.96 Appeals Received* 19 36
Total Actual FTE 100% 100% Emergency Department $7.24 0.3% 1.9%
Civil Service FTE 92% 88% Specialty $14.89 Prison Population Capacity 168% 155%
Overtime FTE 3% 5% Medications $39.65 Cell Bed Changes 51% 53%
Registry FTE 5% 7% Diagnostics $11.24 Average Document Scan Time (in days) 2.4 3.8
KEY:
85%83%
Specialty Appts via Telemedicine Flu Vaccination
Primary Care Provider (PCP)
Mental Health Primary Clinician
Psychiatrist -
YTD 11/12FY 10/11LABOR Feb. 20126 Month TrendStatewide(excluding HQ)
OTHER TRENDS$11.20
Clinical Support Staff
$61.65
$192.25
Patient Encounters per Primary Mental Health Clinician
$6.97 6 Month Trend Most Recent Statewide
$79.39
$327.36
$26.95
$70.70
$146.19
$18.465
-
194
8
83
6
28
6
STAFFING IN FULL TIME EQUIVALENTS (FTE)
Clinical Support FTE 4 109%
% of Auth.
98%
Prior Year 70%
79%
77%
54%
30
7.3
Statewide
- Admin. Hospital Bed Days (per year) * 0
MAJOR COSTS PER INMATE PER MONTH WORKLOAD PER DAY
3.4 Hospital Admissions*
HIGH ADHERENCE LOW ADHERENCEMODERATE ADHERENCE *Per 1,000 inmates
$37.09
$3.70
$19.94
$32.43
$4.11
$30.24
$102.57
$21.17
$91.00
$10.52
Statewide(excluding HQ)
9
Health Care Appts. Missed due to Cusdody
59 $79.96 $93.17 High Risk Patients
124%
94%
ActualJan. 2012 % of Total
189
$6.65
Year Statewide
174
7
$15.50
$68.56
95%100%
6 Month Trend
Authorized Jan. 2012
Actual Jan. 2012
104%
99%
126%
93%
72%
Statewide(excluding HQ)
KEY: HIGH ADHERENCE LOW ADHERENCE
CCHCS
MODERATE ADHERENCE Per 1,000 inmates
RETURN TO DASHBOARD
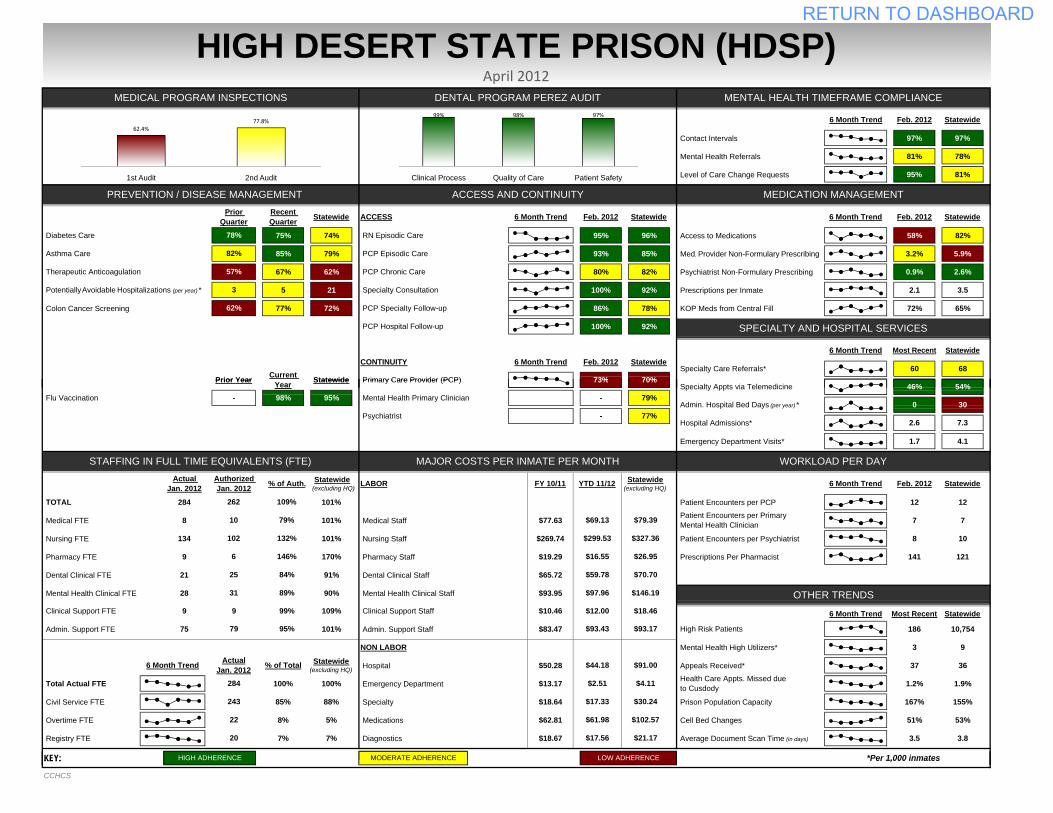
Contact Intervals 97% 97%
Mental Health Referrals 81% 78%
Level of Care Change Requests 95% 81%
75% 74% 95% 96% Access to Medications 58% 82%
85% 79% 93% 85% Med. Provider Non-Formulary Prescribing 3.2% 5.9%
67% 62% 80% 82% Psychiatrist Non-Formulary Prescribing 0.9% 2.6%
5 21 100% 92% Prescriptions per Inmate 2.1 3.5
Colon Cancer Screening 77% 72% 86% 78% KOP Meds from Central Fill 72% 65%
100% 92%
Statewide
Statewide
68 Specialty Care Referrals*
PCP Hospital Follow-up
PREVENTION / DISEASE MANAGEMENT ACCESS AND CONTINUITY MEDICATION MANAGEMENT
Feb. 20126 Month Trend
MEDICAL PROGRAM INSPECTIONS DENTAL PROGRAM PEREZ AUDIT MENTAL HEALTH TIMEFRAME COMPLIANCE
Statewide
6070%Primary Care Provider (PCP)
StatewidePrior Quarter Statewide Feb. 2012
PCP Chronic Care
6 Month Trend
PCP Specialty Follow-up
RN Episodic Care
PCP Episodic Care
78%
82%
57%
3
62%
Specialty Consultation
HIGH DESERT STATE PRISON (HDSP)April 2012
Most Recent
Feb. 20126 Month Trend
CONTINUITY 6 Month Trend Feb. 2012 Statewide
Therapeutic Anticoagulation
Asthma Care
Diabetes Care
6 Month Trend
SPECIALTY AND HOSPITAL SERVICES
73%Prior Year Current Statewide
Potentially Avoidable Hospitalizations (per year) *
Recent Quarter ACCESS
99% 98% 97%
Clinical Process Quality of Care Patient Safety
62.4%77.8%
1st Audit 2nd Audit
Emergency Department Visits* 1.7 4.1
TOTAL 284 101% Patient Encounters per PCP 12 12
Medical FTE 8 101% Medical Staff $77.63 7 7
Nursing FTE 134 101% Nursing Staff $269.74 Patient Encounters per Psychiatrist 8 10
Pharmacy FTE 9 170% Pharmacy Staff $19.29 Prescriptions Per Pharmacist 141 121
Dental Clinical FTE 21 91% Dental Clinical Staff $65.72
Mental Health Clinical FTE 28 90% Mental Health Clinical Staff $93.95
Admin. Support FTE 75 101% Admin. Support Staff $83.47 186 10,754
NON LABOR Mental Health High Utilizers* 3 9
Hospital $50.28 Appeals Received* 37 36
Total Actual FTE 100% 100% Emergency Department $13.17 1.2% 1.9%
Civil Service FTE 85% 88% Specialty $18.64 Prison Population Capacity 167% 155%
Overtime FTE 8% 5% Medications $62.81 Cell Bed Changes 51% 53%
Registry FTE 7% 7% Diagnostics $18.67 Average Document Scan Time (in days) 3.5 3.8
KEY:
Health Care Appts. Missed due to Cusdody
79 $93.43 $93.17
Clinical Support Staff
$69.13
$299.53
$10.46
$16.55
$59.78
146%
84%
89%
Patient Encounters per Primary Mental Health Clinician
25
31
10
102
HIGH ADHERENCE LOW ADHERENCE
243
22
109%9 99%
95%
Statewide(excluding HQ)
ActualJan. 2012 % of Total
MODERATE ADHERENCE *Per 1,000 inmates
$44.18
$2.51
$17.33
$61.98
$4.11
$30.24
$102.57
$21.17
$91.00
$17.5620
6 Month Trend
284
54%
30
7.3
Statewide
- Admin. Hospital Bed Days (per year) * 0
MAJOR COSTS PER INMATE PER MONTH WORKLOAD PER DAY
2.6 Hospital Admissions*-
OTHER TRENDS$97.96
YTD 11/12FY 10/11
6 Month Trend Most Recent Statewide
High Risk Patients
Feb. 20126 Month Trend
Clinical Support FTE 9
Statewide(excluding HQ)
70%
79%
77%
$12.00
$26.95
$70.70
$146.19
$18.46
Primary Care Provider (PCP)
Actual Jan. 2012
79%
132%
Statewide(excluding HQ)
$79.39
$327.36
262
Flu Vaccination Mental Health Primary Clinician
Psychiatrist
95%
Authorized Jan. 2012 LABOR
-
% of Auth.
109%
98%
6
STAFFING IN FULL TIME EQUIVALENTS (FTE)
46%73%
Specialty Appts via TelemedicinePrior Year Year Statewide
KEY: HIGH ADHERENCE LOW ADHERENCE
CCHCS
MODERATE ADHERENCE Per 1,000 inmates
RETURN TO DASHBOARD
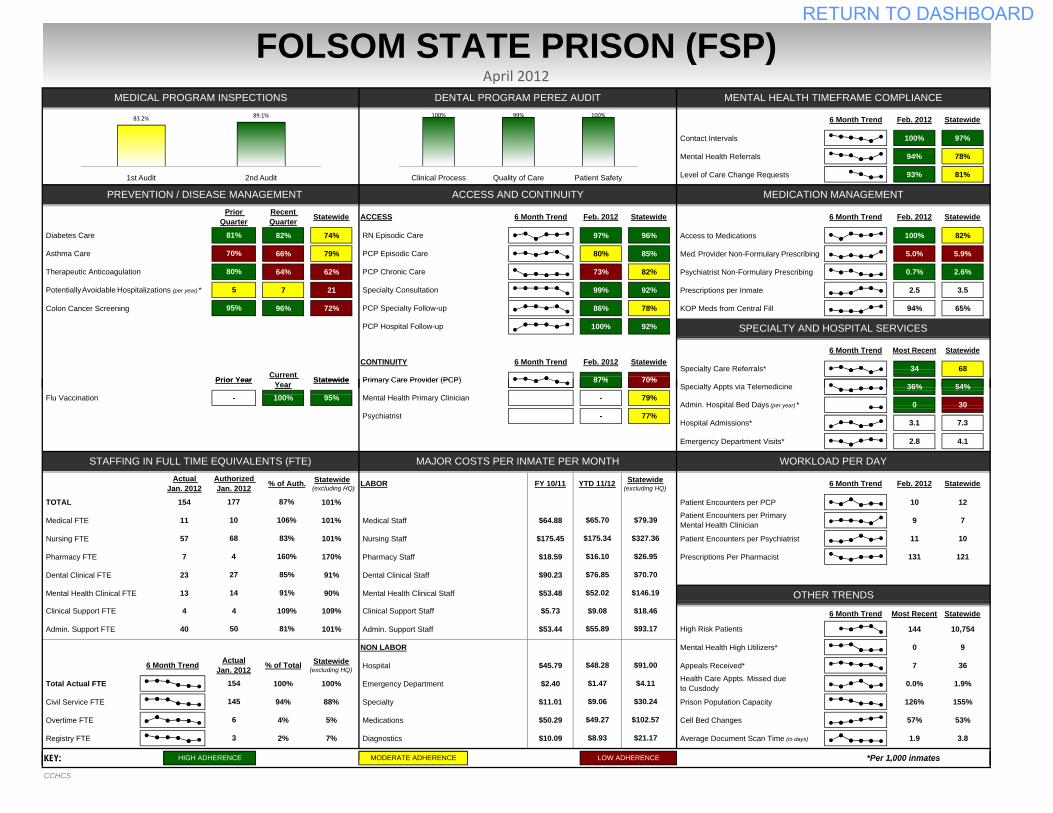
Contact Intervals 100% 97%
Mental Health Referrals 94% 78%
Level of Care Change Requests 93% 81%
82% 74% 97% 96% Access to Medications 100% 82%
66% 79% 80% 85% Med. Provider Non-Formulary Prescribing 5.0% 5.9%
64% 62% 73% 82% Psychiatrist Non-Formulary Prescribing 0.7% 2.6%
7 21 99% 92% Prescriptions per Inmate 2.5 3.5
Colon Cancer Screening 96% 72% 86% 78% KOP Meds from Central Fill 94% 65%
100% 92%
FOLSOM STATE PRISON (FSP)April 2012
Most Recent
Feb. 20126 Month Trend
CONTINUITY 6 Month Trend Feb. 2012 Statewide
Therapeutic Anticoagulation
Asthma Care
Diabetes Care
6 Month Trend
SPECIALTY AND HOSPITAL SERVICES
87%
Recent Quarter ACCESS Feb. 2012
Primary Care Provider (PCP)34
PREVENTION / DISEASE MANAGEMENT ACCESS AND CONTINUITY MEDICATION MANAGEMENT
Feb. 20126 Month Trend
MEDICAL PROGRAM INSPECTIONS DENTAL PROGRAM PEREZ AUDIT MENTAL HEALTH TIMEFRAME COMPLIANCE
PCP Chronic Care
6 Month Trend
PCP Specialty Follow-up
RN Episodic Care
PCP Episodic Care
Specialty Consultation Potentially Avoidable Hospitalizations (per year) *
81%
70%
80%
5
Prior Quarter
95%
Statewide Statewide
70%
Statewide
Statewide
Statewide
68 Specialty Care Referrals*
PCP Hospital Follow-up
Prior Year Current Statewide
100% 99% 100%
Clinical Process Quality of Care Patient Safety
83.2% 89.1%
1st Audit 2nd Audit
Emergency Department Visits* 2.8 4.1
TOTAL 154 101% Patient Encounters per PCP 10 12
Medical FTE 11 101% Medical Staff $64.88 9 7
Nursing FTE 57 101% Nursing Staff $175.45 Patient Encounters per Psychiatrist 11 10
Pharmacy FTE 7 170% Pharmacy Staff $18.59 Prescriptions Per Pharmacist 131 121
Dental Clinical FTE 23 91% Dental Clinical Staff $90.23
Mental Health Clinical FTE 13 90% Mental Health Clinical Staff $53.48
Admin. Support FTE 40 101% Admin. Support Staff $53.44 144 10,754
NON LABOR Mental Health High Utilizers* 0 9
Hospital $45.79 Appeals Received* 7 36
Total Actual FTE 100% 100% Emergency Department $2.40 0.0% 1.9%
Civil Service FTE 94% 88% Specialty $11.01 Prison Population Capacity 126% 155%
Overtime FTE 4% 5% Medications $50.29 Cell Bed Changes 57% 53%
Registry FTE 2% 7% Diagnostics $10.09 Average Document Scan Time (in days) 1.9 3.8
KEY:
154
145
6
Statewide(excluding HQ)
Statewide(excluding HQ)
Statewide(excluding HQ)
$79.39
$327.36
$26.95
$70.70
$146.19
$18.46$9.08
91%
36%87%
Specialty Appts via Telemedicine Flu Vaccination
Primary Care Provider (PCP)
Mental Health Primary Clinician
Psychiatrist -
YTD 11/12FY 10/11LABOR Feb. 20126 Month Trend
OTHER TRENDS$52.02
Clinical Support Staff
$65.70
$175.34
Patient Encounters per Primary Mental Health Clinician
$5.734
-
177
10
68
4
27
14
STAFFING IN FULL TIME EQUIVALENTS (FTE)
Clinical Support FTE 4 109%
% of Auth.
87%
70%
79%
77%
54%
30
7.3
Statewide
- Admin. Hospital Bed Days (per year) * 0
MAJOR COSTS PER INMATE PER MONTH WORKLOAD PER DAY
3.1 Hospital Admissions*
HIGH ADHERENCE LOW ADHERENCEMODERATE ADHERENCE *Per 1,000 inmates
$48.28
$1.47
$9.06
$49.27
$4.11
$30.24
$102.57
$21.17
$91.00
$8.933
6 Month Trend
$16.10
$76.85
95%100%
Authorized Jan. 2012
Actual Jan. 2012
106%
83%
160%
85%
Prior Year Year Statewide
Health Care Appts. Missed due to Cusdody
50 $55.89 $93.17
6 Month Trend Most Recent Statewide
High Risk Patients
109%
81%
ActualJan. 2012 % of Total
KEY: HIGH ADHERENCE LOW ADHERENCE
CCHCS
MODERATE ADHERENCE Per 1,000 inmates
RETURN TO DASHBOARD
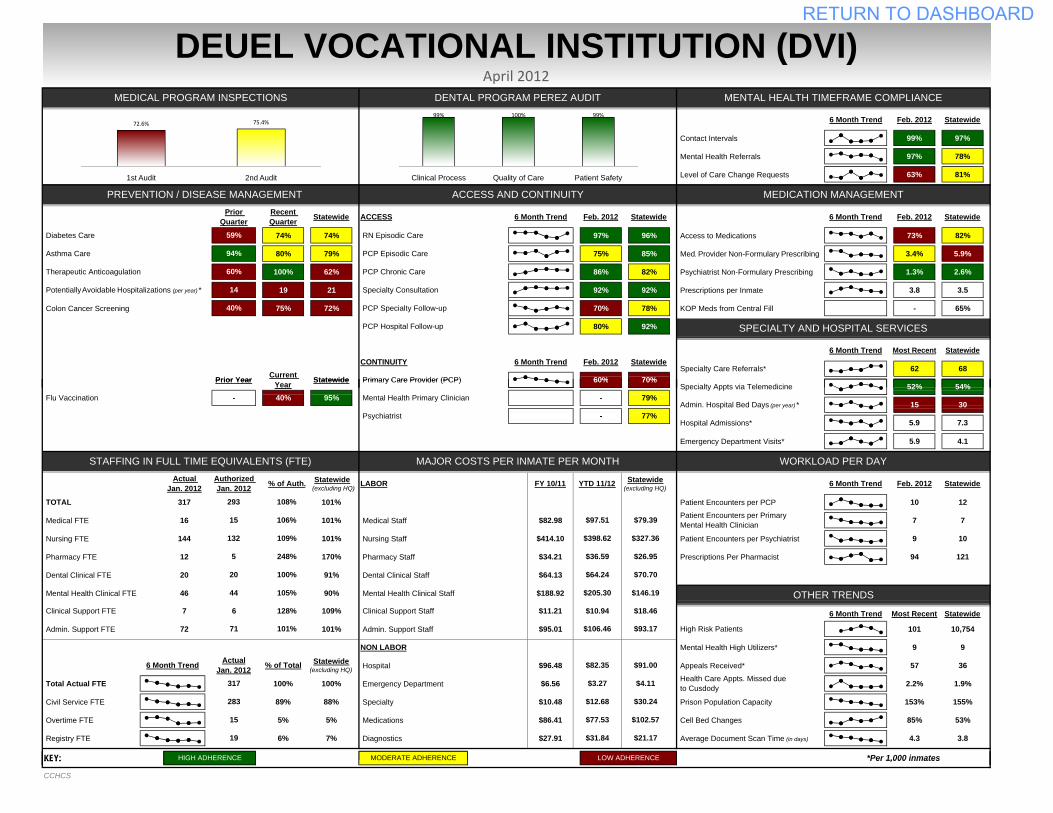
Contact Intervals 99% 97%
Mental Health Referrals 97% 78%
Level of Care Change Requests 63% 81%
74% 74% 97% 96% Access to Medications 73% 82%
80% 79% 75% 85% Med. Provider Non-Formulary Prescribing 3.4% 5.9%
100% 62% 86% 82% Psychiatrist Non-Formulary Prescribing 1.3% 2.6%
19 21 92% 92% Prescriptions per Inmate 3.8 3.5
Colon Cancer Screening 75% 72% 70% 78% KOP Meds from Central Fill - 65%
80% 92%
DEUEL VOCATIONAL INSTITUTION (DVI)April 2012
Most Recent
Feb. 20126 Month Trend
CONTINUITY 6 Month Trend Feb. 2012 Statewide
Therapeutic Anticoagulation
Asthma Care
Diabetes Care
6 Month Trend
SPECIALTY AND HOSPITAL SERVICES
60%
Recent Quarter ACCESS Feb. 2012
Primary Care Provider (PCP)62
PREVENTION / DISEASE MANAGEMENT ACCESS AND CONTINUITY MEDICATION MANAGEMENT
Feb. 20126 Month Trend
MEDICAL PROGRAM INSPECTIONS DENTAL PROGRAM PEREZ AUDIT MENTAL HEALTH TIMEFRAME COMPLIANCE
PCP Chronic Care
6 Month Trend
PCP Specialty Follow-up
RN Episodic Care
PCP Episodic Care
Specialty Consultation Potentially Avoidable Hospitalizations (per year) *
59%
94%
60%
14
Prior Quarter
40%
Statewide
Prior Year
Statewide
70%
Statewide
Statewide
Statewide
68 Specialty Care Referrals*Current Statewide
PCP Hospital Follow-up
99% 100% 99%
Clinical Process Quality of Care Patient Safety
72.6% 75.4%
1st Audit 2nd Audit
Emergency Department Visits* 5.9 4.1
TOTAL 317 101% Patient Encounters per PCP 10 12
Medical FTE 16 101% Medical Staff $82.98 7 7
Nursing FTE 144 101% Nursing Staff $414.10 Patient Encounters per Psychiatrist 9 10
Pharmacy FTE 12 170% Pharmacy Staff $34.21 Prescriptions Per Pharmacist 94 121
Dental Clinical FTE 20 91% Dental Clinical Staff $64.13
Mental Health Clinical FTE 46 90% Mental Health Clinical Staff $188.92
Admin. Support FTE 72 101% Admin. Support Staff $95.01 101 10,754
NON LABOR Mental Health High Utilizers* 9 9
Hospital $96.48 Appeals Received* 57 36
Total Actual FTE 100% 100% Emergency Department $6.56 2.2% 1.9%
Civil Service FTE 89% 88% Specialty $10.48 Prison Population Capacity 153% 155%
Overtime FTE 5% 5% Medications $86.41 Cell Bed Changes 85% 53%
Registry FTE 6% 7% Diagnostics $27.91 Average Document Scan Time (in days) 4.3 3.8
KEY:
52%60%
Specialty Appts via Telemedicine Flu Vaccination
Primary Care Provider (PCP)
Mental Health Primary Clinician
Psychiatrist -
YTD 11/12FY 10/11LABOR Feb. 20126 Month TrendStatewide(excluding HQ)
OTHER TRENDS$205.30
Clinical Support Staff
$97.51
$398.62
Patient Encounters per Primary Mental Health Clinician
$11.21 6 Month Trend Most Recent Statewide
$79.39
$327.36
$26.95
$70.70
$146.19
$18.467
-
293
15
132
5
20
44
STAFFING IN FULL TIME EQUIVALENTS (FTE)
Clinical Support FTE 6 109%
% of Auth.
108%
Prior Year 70%
79%
77%
54%
30
7.3
Statewide
- Admin. Hospital Bed Days (per year) * 15
MAJOR COSTS PER INMATE PER MONTH WORKLOAD PER DAY
5.9 Hospital Admissions*
HIGH ADHERENCE LOW ADHERENCEMODERATE ADHERENCE *Per 1,000 inmates
$82.35
$3.27
$12.68
$77.53
$4.11
$30.24
$102.57
$21.17
$91.00
$31.84
Statewide(excluding HQ)
19
Health Care Appts. Missed due to Cusdody
71 $106.46 $93.17 High Risk Patients
128%
101%
ActualJan. 2012 % of Total
317
$10.94
Year Statewide
283
15
$36.59
$64.24
95%40%
6 Month Trend
Authorized Jan. 2012
Actual Jan. 2012
106%
109%
248%
100%
105%
Statewide(excluding HQ)
KEY: HIGH ADHERENCE LOW ADHERENCE
CCHCS
MODERATE ADHERENCE Per 1,000 inmates
RETURN TO DASHBOARD
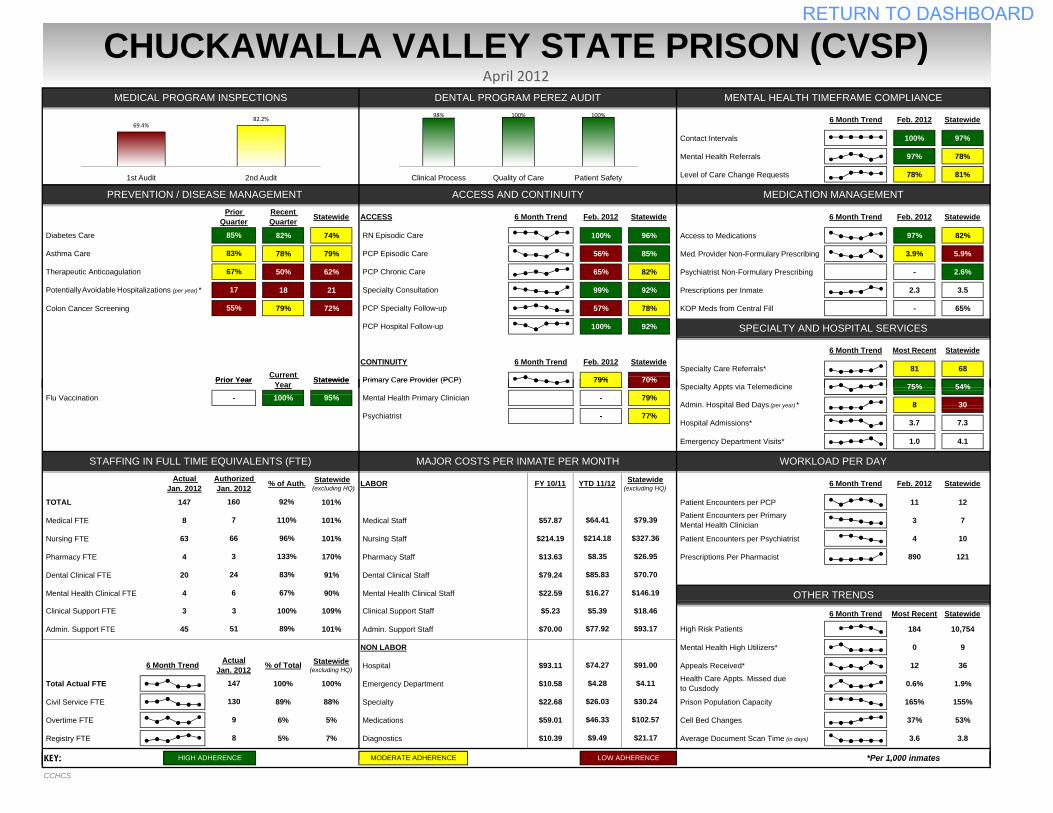
Contact Intervals 100% 97%
Mental Health Referrals 97% 78%
Level of Care Change Requests 78% 81%
82% 74% 100% 96% Access to Medications 97% 82%
78% 79% 56% 85% Med. Provider Non-Formulary Prescribing 3.9% 5.9%
50% 62% 65% 82% Psychiatrist Non-Formulary Prescribing - 2.6%
18 21 99% 92% Prescriptions per Inmate 2.3 3.5
Colon Cancer Screening 79% 72% 57% 78% KOP Meds from Central Fill - 65%
100% 92%
CHUCKAWALLA VALLEY STATE PRISON (CVSP)April 2012
Most Recent
Feb. 20126 Month Trend
CONTINUITY 6 Month Trend Feb. 2012 Statewide
Therapeutic Anticoagulation
Asthma Care
Diabetes Care
6 Month Trend
SPECIALTY AND HOSPITAL SERVICES
79%Prior Year Current Statewide
Potentially Avoidable Hospitalizations (per year) *
Recent Quarter ACCESS
85%
83%
67%
17
55%
Specialty Consultation
StatewidePrior Quarter Statewide Feb. 2012
PCP Chronic Care
6 Month Trend
PCP Specialty Follow-up
RN Episodic Care
PCP Episodic Care
70%Primary Care Provider (PCP)81
PREVENTION / DISEASE MANAGEMENT ACCESS AND CONTINUITY MEDICATION MANAGEMENT
Feb. 20126 Month Trend
MEDICAL PROGRAM INSPECTIONS DENTAL PROGRAM PEREZ AUDIT MENTAL HEALTH TIMEFRAME COMPLIANCE
Statewide
Statewide
Statewide
68 Specialty Care Referrals*
PCP Hospital Follow-up
98% 100% 100%
Clinical Process Quality of Care Patient Safety
69.4%82.2%
1st Audit 2nd Audit
Emergency Department Visits* 1.0 4.1
TOTAL 147 101% Patient Encounters per PCP 11 12
Medical FTE 8 101% Medical Staff $57.87 3 7
Nursing FTE 63 101% Nursing Staff $214.19 Patient Encounters per Psychiatrist 4 10
Pharmacy FTE 4 170% Pharmacy Staff $13.63 Prescriptions Per Pharmacist 890 121
Dental Clinical FTE 20 91% Dental Clinical Staff $79.24
Mental Health Clinical FTE 4 90% Mental Health Clinical Staff $22.59
Admin. Support FTE 45 101% Admin. Support Staff $70.00 184 10,754
NON LABOR Mental Health High Utilizers* 0 9
Hospital $93.11 Appeals Received* 12 36
Total Actual FTE 100% 100% Emergency Department $10.58 0.6% 1.9%
Civil Service FTE 89% 88% Specialty $22.68 Prison Population Capacity 165% 155%
Overtime FTE 6% 5% Medications $59.01 Cell Bed Changes 37% 53%
Registry FTE 5% 7% Diagnostics $10.39 Average Document Scan Time (in days) 3.6 3.8
KEY:
75%79%
Specialty Appts via TelemedicinePrior Year Year Statewide
% of Auth.
92%
100%
3
STAFFING IN FULL TIME EQUIVALENTS (FTE)
Flu Vaccination Mental Health Primary Clinician
Psychiatrist
95%
Authorized Jan. 2012 LABOR
-
Clinical Support FTE 3
Statewide(excluding HQ)
70%
79%
77%
$5.39
$26.95
$70.70
$146.19
$18.46
Primary Care Provider (PCP)
Actual Jan. 2012
110%
96%
Statewide(excluding HQ)
$79.39
$327.36
160
OTHER TRENDS$16.27
YTD 11/12FY 10/11
6 Month Trend Most Recent Statewide
High Risk Patients
Feb. 20126 Month Trend
54%
30
7.3
Statewide
- Admin. Hospital Bed Days (per year) * 8
MAJOR COSTS PER INMATE PER MONTH WORKLOAD PER DAY
3.7 Hospital Admissions*-
MODERATE ADHERENCE *Per 1,000 inmates
$74.27
$4.28
$26.03
$46.33
$4.11
$30.24
$102.57
$21.17
$91.00
$9.498
6 Month Trend
147
HIGH ADHERENCE LOW ADHERENCE
130
9
109%3 100%
89%
Statewide(excluding HQ)
ActualJan. 2012 % of Total
Health Care Appts. Missed due to Cusdody
51 $77.92 $93.17
Clinical Support Staff
$64.41
$214.18
$5.23
$8.35
$85.83
133%
83%
67%
Patient Encounters per Primary Mental Health Clinician
24
6
7
66
KEY:
CCHCS
MODERATE ADHERENCE Per 1,000 inmatesHIGH ADHERENCE LOW ADHERENCE
RETURN TO DASHBOARD
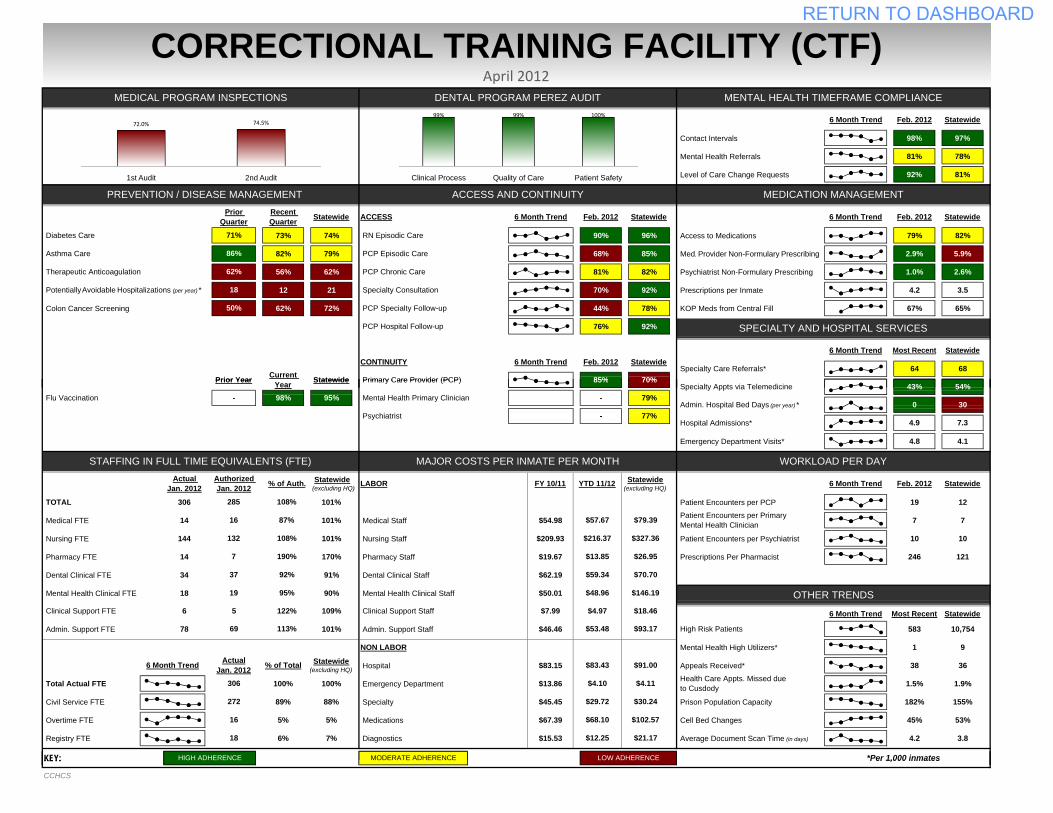
Contact Intervals 98% 97%
Mental Health Referrals 81% 78%
Level of Care Change Requests 92% 81%
73% 74% 90% 96% Access to Medications 79% 82%
82% 79% 68% 85% Med. Provider Non-Formulary Prescribing 2.9% 5.9%
56% 62% 81% 82% Psychiatrist Non-Formulary Prescribing 1.0% 2.6%
12 21 70% 92% Prescriptions per Inmate 4.2 3.5
Colon Cancer Screening 62% 72% 44% 78% KOP Meds from Central Fill 67% 65%
76% 92%
Statewide
CORRECTIONAL TRAINING FACILITY (CTF)April 2012
Most Recent
Feb. 20126 Month Trend
CONTINUITY 6 Month Trend Feb. 2012 Statewide
Therapeutic Anticoagulation
Asthma Care
Diabetes Care
6 Month Trend
SPECIALTY AND HOSPITAL SERVICES
85%
Recent Quarter Feb. 2012
PCP Chronic Care
6 Month Trend
PCP Specialty Follow-up
RN Episodic Care
PCP Episodic Care
Specialty Consultation
ACCESS
Primary Care Provider (PCP)64
PREVENTION / DISEASE MANAGEMENT ACCESS AND CONTINUITY MEDICATION MANAGEMENT
Feb. 20126 Month Trend
MEDICAL PROGRAM INSPECTIONS DENTAL PROGRAM PEREZ AUDIT MENTAL HEALTH TIMEFRAME COMPLIANCE
Potentially Avoidable Hospitalizations (per year) *
71%
86%
62%
18
Prior Quarter
50%
Statewide
Prior Year Current
Statewide
70%
Statewide
Statewide
Statewide
68 Specialty Care Referrals*
PCP Hospital Follow-up
99% 99% 100%
Clinical Process Quality of Care Patient Safety
72.0% 74.5%
1st Audit 2nd Audit
Emergency Department Visits* 4.8 4.1
TOTAL 306 101% Patient Encounters per PCP 19 12
Medical FTE 14 101% Medical Staff $54.98 7 7
Nursing FTE 144 101% Nursing Staff $209.93 Patient Encounters per Psychiatrist 10 10
Pharmacy FTE 14 170% Pharmacy Staff $19.67 Prescriptions Per Pharmacist 246 121
Dental Clinical FTE 34 91% Dental Clinical Staff $62.19
Mental Health Clinical FTE 18 90% Mental Health Clinical Staff $50.01
Admin. Support FTE 78 101% Admin. Support Staff $46.46 583 10,754
NON LABOR Mental Health High Utilizers* 1 9
Hospital $83.15 Appeals Received* 38 36
Total Actual FTE 100% 100% Emergency Department $13.86 1.5% 1.9%
Civil Service FTE 89% 88% Specialty $45.45 Prison Population Capacity 182% 155%
Overtime FTE 5% 5% Medications $67.39 Cell Bed Changes 45% 53%
Registry FTE 6% 7% Diagnostics $15.53 Average Document Scan Time (in days) 4.2 3.8
KEY:
Statewide43%
85% Specialty Appts via Telemedicine
Flu Vaccination
$79.39
$327.36
$26.95
$70.70
$146.19
$18.46$4.97
Primary Care Provider (PCP)
Mental Health Primary Clinician
Psychiatrist -
YTD 11/12FY 10/11LABOR Feb. 20126 Month Trend
Hospital Admissions*
OTHER TRENDS$48.96
Clinical Support Staff
$57.67
$216.37
Patient Encounters per Primary Mental Health Clinician
$7.99 6 Month Trend Most Recent Statewide6
-
285
16
132
7
37
19
STAFFING IN FULL TIME EQUIVALENTS (FTE)
Clinical Support FTE 5 109%
% of Auth.
Prior Year Year 70%
79%
77%
54%
30
7.3
Statewide
- Admin. Hospital Bed Days (per year) * 0
MAJOR COSTS PER INMATE PER MONTH WORKLOAD PER DAY
4.9
HIGH ADHERENCE LOW ADHERENCEMODERATE ADHERENCE *Per 1,000 inmates
$83.43
$4.10
$29.72
$68.10
$4.11
$30.24
$102.57
$21.17
$91.00
$12.2518
Health Care Appts. Missed due to Cusdody
69 $53.48 $93.17 High Risk Patients
122%
113%
ActualJan. 2012 % of Total
306
272
16
Statewide(excluding HQ)
Statewide(excluding HQ)
Statewide(excluding HQ)
$13.85
$59.34
95%98%
6 Month Trend
Authorized Jan. 2012
Actual Jan. 2012
87%
108%
190%
92%
95%
108%
KEY: HIGH ADHERENCE LOW ADHERENCE
CCHCS
MODERATE ADHERENCE Per 1,000 inmates
RETURN TO DASHBOARD
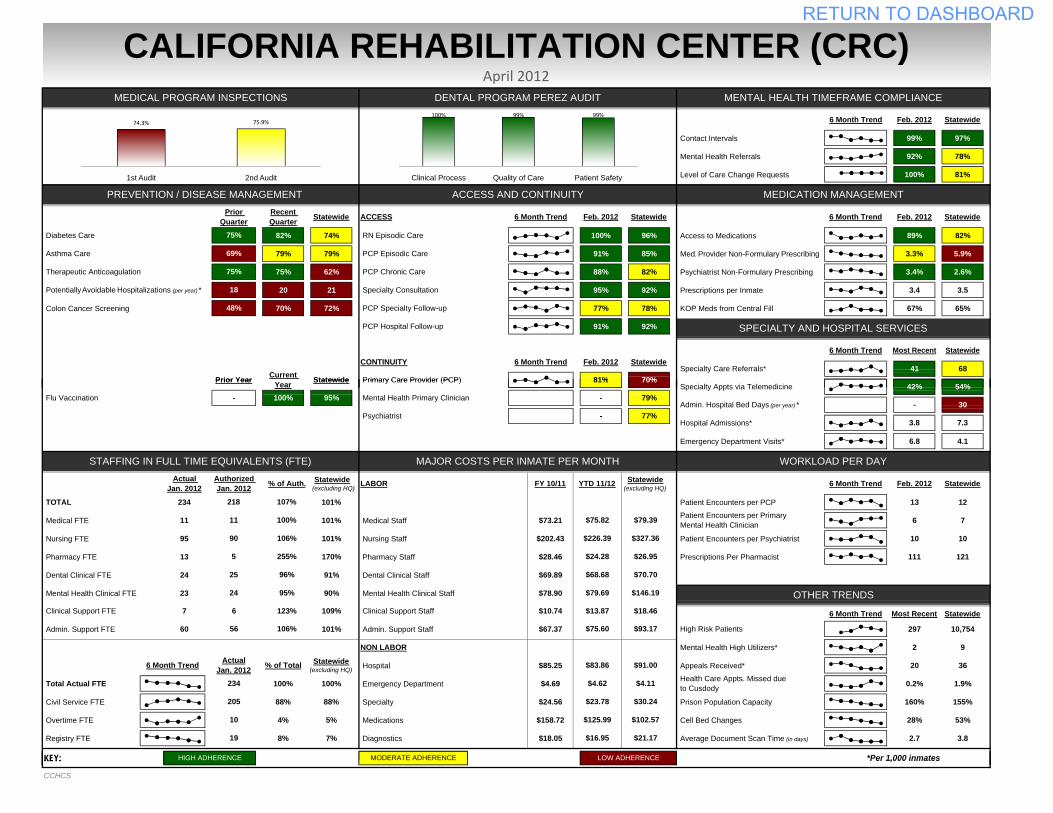
Contact Intervals 99% 97%
Mental Health Referrals 92% 78%
Level of Care Change Requests 100% 81%
82% 74% 100% 96% Access to Medications 89% 82%
79% 79% 91% 85% Med. Provider Non-Formulary Prescribing 3.3% 5.9%
75% 62% 88% 82% Psychiatrist Non-Formulary Prescribing 3.4% 2.6%
20 21 95% 92% Prescriptions per Inmate 3.4 3.5
Colon Cancer Screening 70% 72% 77% 78% KOP Meds from Central Fill 67% 65%
91% 92%
CALIFORNIA REHABILITATION CENTER (CRC)April 2012
Most Recent
Feb. 20126 Month Trend
CONTINUITY 6 Month Trend Feb. 2012 Statewide
Therapeutic Anticoagulation
Asthma Care
Diabetes Care
6 Month Trend
SPECIALTY AND HOSPITAL SERVICES
81%
Recent Quarter ACCESS Feb. 2012
Primary Care Provider (PCP)41
PREVENTION / DISEASE MANAGEMENT ACCESS AND CONTINUITY MEDICATION MANAGEMENT
Feb. 20126 Month Trend
MEDICAL PROGRAM INSPECTIONS DENTAL PROGRAM PEREZ AUDIT MENTAL HEALTH TIMEFRAME COMPLIANCE
PCP Chronic Care
6 Month Trend
PCP Specialty Follow-up
RN Episodic Care
PCP Episodic Care
Specialty Consultation Potentially Avoidable Hospitalizations (per year) *
75%
69%
75%
18
Prior Quarter
48%
Statewide
Prior Year
Statewide
70%
Statewide
Statewide
Statewide
68 Specialty Care Referrals*Current Statewide
PCP Hospital Follow-up
100% 99% 99%
Clinical Process Quality of Care Patient Safety
74.3% 75.9%
1st Audit 2nd Audit
Emergency Department Visits* 6.8 4.1
TOTAL 234 101% Patient Encounters per PCP 13 12
Medical FTE 11 101% Medical Staff $73.21 6 7
Nursing FTE 95 101% Nursing Staff $202.43 Patient Encounters per Psychiatrist 10 10
Pharmacy FTE 13 170% Pharmacy Staff $28.46 Prescriptions Per Pharmacist 111 121
Dental Clinical FTE 24 91% Dental Clinical Staff $69.89
Mental Health Clinical FTE 23 90% Mental Health Clinical Staff $78.90
Admin. Support FTE 60 101% Admin. Support Staff $67.37 297 10,754
NON LABOR Mental Health High Utilizers* 2 9
Hospital $85.25 Appeals Received* 20 36
Total Actual FTE 100% 100% Emergency Department $4.69 0.2% 1.9%
Civil Service FTE 88% 88% Specialty $24.56 Prison Population Capacity 160% 155%
Overtime FTE 4% 5% Medications $158.72 Cell Bed Changes 28% 53%
Registry FTE 8% 7% Diagnostics $18.05 Average Document Scan Time (in days) 2.7 3.8
KEY:
42%81%
Specialty Appts via Telemedicine Flu Vaccination
Primary Care Provider (PCP)
Mental Health Primary Clinician
Psychiatrist -
YTD 11/12FY 10/11LABOR Feb. 20126 Month TrendStatewide(excluding HQ)
OTHER TRENDS$79.69
Clinical Support Staff
$75.82
$226.39
Patient Encounters per Primary Mental Health Clinician
$10.74 6 Month Trend Most Recent Statewide
$79.39
$327.36
$26.95
$70.70
$146.19
$18.467
-
218
11
90
5
25
24
STAFFING IN FULL TIME EQUIVALENTS (FTE)
Clinical Support FTE 6 109%
% of Auth.
107%
Prior Year 70%
79%
77%
54%
30
7.3
Statewide
- Admin. Hospital Bed Days (per year) * -
MAJOR COSTS PER INMATE PER MONTH WORKLOAD PER DAY
3.8 Hospital Admissions*
HIGH ADHERENCE LOW ADHERENCEMODERATE ADHERENCE *Per 1,000 inmates
$83.86
$4.62
$23.78
$125.99
$4.11
$30.24
$102.57
$21.17
$91.00
$16.95
Statewide(excluding HQ)
19
Health Care Appts. Missed due to Cusdody
56 $75.60 $93.17 High Risk Patients
123%
106%
ActualJan. 2012 % of Total
234
$13.87
Year Statewide
205
10
$24.28
$68.68
95%100%
6 Month Trend
Authorized Jan. 2012
Actual Jan. 2012
100%
106%
255%
96%
95%
Statewide(excluding HQ)
KEY: HIGH ADHERENCE LOW ADHERENCE
CCHCS
MODERATE ADHERENCE Per 1,000 inmates
RETURN TO DASHBOARD
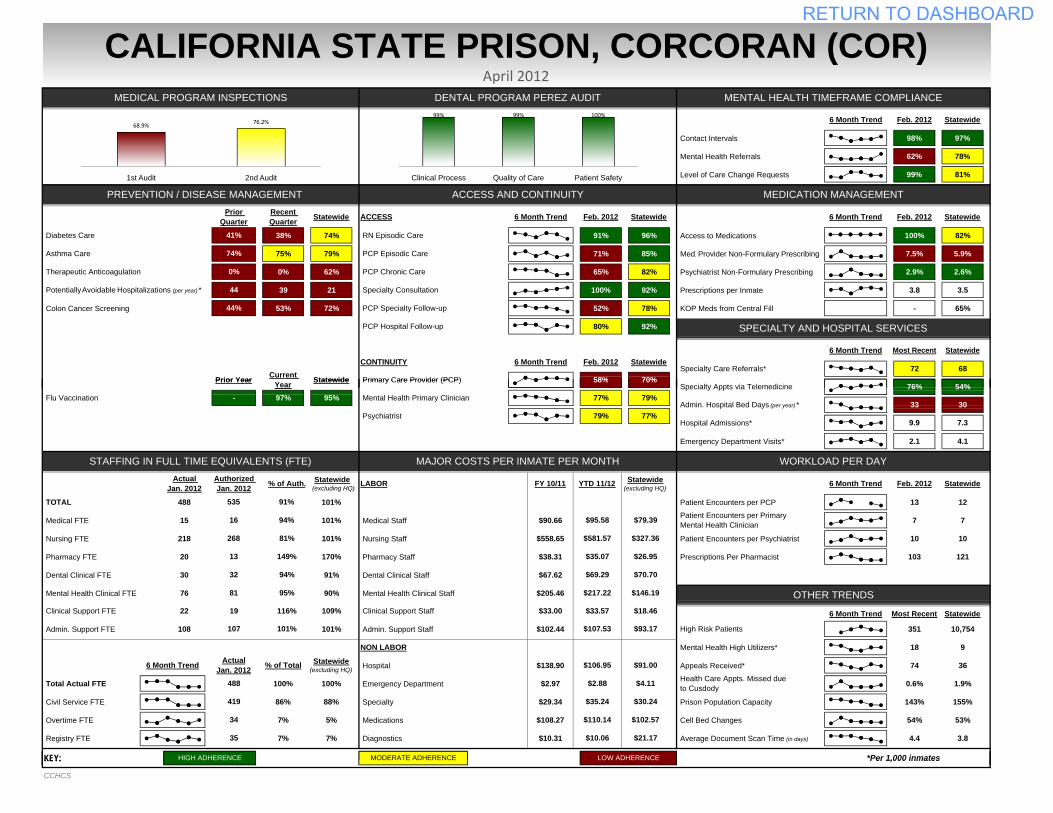
Contact Intervals 98% 97%
Mental Health Referrals 62% 78%
Level of Care Change Requests 99% 81%
38% 74% 91% 96% Access to Medications 100% 82%
75% 79% 71% 85% Med. Provider Non-Formulary Prescribing 7.5% 5.9%
0% 62% 65% 82% Psychiatrist Non-Formulary Prescribing 2.9% 2.6%
39 21 100% 92% Prescriptions per Inmate 3.8 3.5
Colon Cancer Screening 53% 72% 52% 78% KOP Meds from Central Fill - 65%
80% 92%
CALIFORNIA STATE PRISON, CORCORAN (COR)April 2012
Most Recent
Feb. 20126 Month Trend
CONTINUITY 6 Month Trend Feb. 2012 Statewide
Therapeutic Anticoagulation
Asthma Care
Diabetes Care
6 Month Trend
SPECIALTY AND HOSPITAL SERVICES
58%
Potentially Avoidable Hospitalizations (per year) *
Statewide Statewide
Statewide
Recent Quarter ACCESS
41%
74%
0%
44
Prior Quarter
44%
Feb. 2012
PCP Chronic Care
6 Month Trend
PCP Specialty Follow-up
RN Episodic Care
PCP Episodic Care
Specialty Consultation
PCP Hospital Follow-up
72 68
PREVENTION / DISEASE MANAGEMENT ACCESS AND CONTINUITY MEDICATION MANAGEMENT
Feb. 20126 Month Trend
MEDICAL PROGRAM INSPECTIONS DENTAL PROGRAM PEREZ AUDIT MENTAL HEALTH TIMEFRAME COMPLIANCE
Statewide
Statewide
Current Prior Year Statewide Specialty Care Referrals*
Primary Care Provider (PCP) 70%
99% 99% 100%
Clinical Process Quality of Care Patient Safety
68.9% 76.2%
1st Audit 2nd Audit
Emergency Department Visits* 2.1 4.1
TOTAL 488 101% Patient Encounters per PCP 13 12
Medical FTE 15 101% Medical Staff $90.66 7 7
Nursing FTE 218 101% Nursing Staff $558.65 Patient Encounters per Psychiatrist 10 10
Pharmacy FTE 20 170% Pharmacy Staff $38.31 Prescriptions Per Pharmacist 103 121
Dental Clinical FTE 30 91% Dental Clinical Staff $67.62
Mental Health Clinical FTE 76 90% Mental Health Clinical Staff $205.46
Admin. Support FTE 108 101% Admin. Support Staff $102.44 351 10,754
NON LABOR Mental Health High Utilizers* 18 9
Hospital $138.90 Appeals Received* 74 36
Total Actual FTE 100% 100% Emergency Department $2.97 0.6% 1.9%
Civil Service FTE 86% 88% Specialty $29.34 Prison Population Capacity 143% 155%
Overtime FTE 7% 5% Medications $108.27 Cell Bed Changes 54% 53%
Registry FTE 7% 7% Diagnostics $10.31 Average Document Scan Time (in days) 4.4 3.8
KEY:
76%58%
Specialty Appts via Telemedicine95% 79%
488
419
34
22
-
535
16
268
13
32
81 OTHER TRENDS
$79.39
$327.36
77%
Flu Vaccination Mental Health Primary Clinician
Psychiatrist 79%
54%
30
7.3
$217.22
Clinical Support Staff
$95.58
$581.57
Patient Encounters per Primary Mental Health Clinician
$33.00
$35.07
$69.29
$26.95
$70.70
$146.19
$18.46$33.57
STAFFING IN FULL TIME EQUIVALENTS (FTE)
Clinical Support FTE 19 109%
% of Auth.
91%
97%
Authorized Jan. 2012
Actual Jan. 2012
94%
81%
149%
94%
Statewide(excluding HQ)
95%
YearPrior Year Statewide
Statewide
77% Admin. Hospital Bed Days (per year) * 33
MAJOR COSTS PER INMATE PER MONTH WORKLOAD PER DAY
9.9 Hospital Admissions*
Primary Care Provider (PCP)
YTD 11/12FY 10/11LABOR Feb. 20126 Month TrendStatewide(excluding HQ)
70%
HIGH ADHERENCE LOW ADHERENCEMODERATE ADHERENCE *Per 1,000 inmates
$106.95
$2.88
$35.24
$110.14
$4.11
$30.24
$102.57
$21.17
$91.00
$10.0635
6 Month Trend
Health Care Appts. Missed due to Cusdody
107 $107.53 $93.17
6 Month Trend Most Recent Statewide
High Risk Patients
116%
101%
Statewide(excluding HQ)
ActualJan. 2012 % of Total
KEY: HIGH ADHERENCE LOW ADHERENCE
CCHCS
MODERATE ADHERENCE Per 1,000 inmates
RETURN TO DASHBOARD
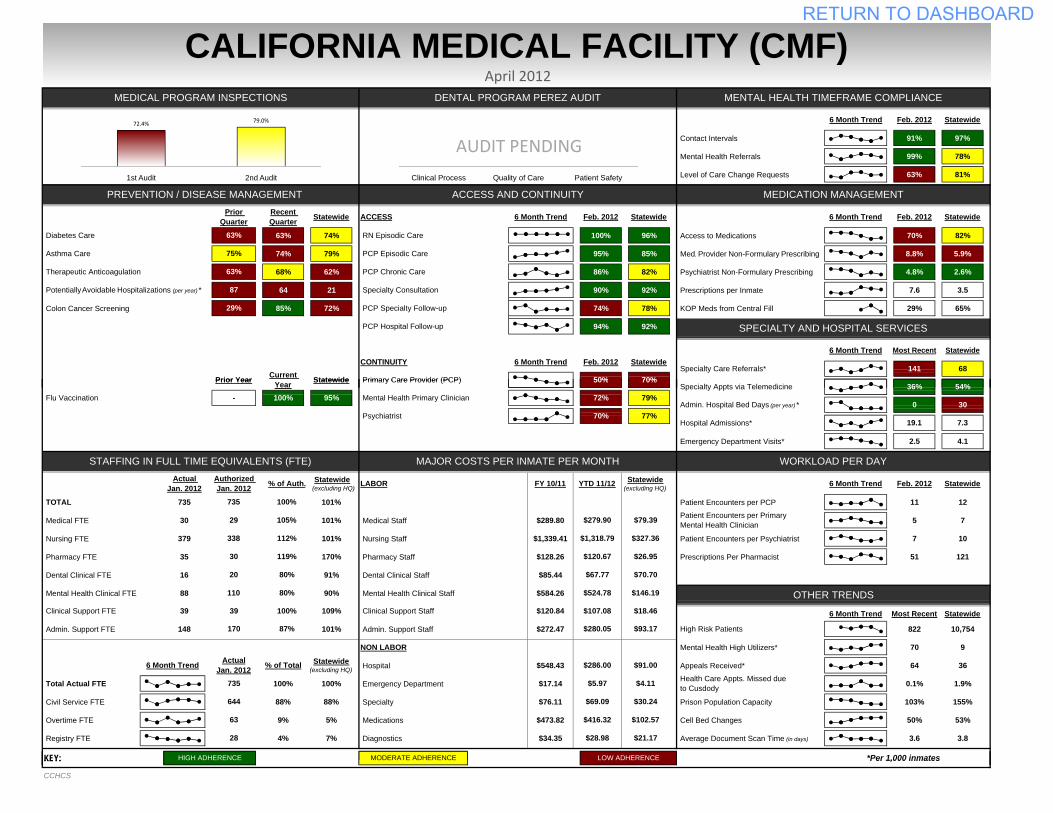
Contact Intervals 91% 97%
Mental Health Referrals 99% 78%
Level of Care Change Requests 63% 81%
63% 74% 100% 96% Access to Medications 70% 82%
74% 79% 95% 85% Med. Provider Non-Formulary Prescribing 8.8% 5.9%
68% 62% 86% 82% Psychiatrist Non-Formulary Prescribing 4.8% 2.6%
64 21 90% 92% Prescriptions per Inmate 7.6 3.5
Colon Cancer Screening 85% 72% 74% 78% KOP Meds from Central Fill 29% 65%
94% 92%
Primary Care Provider (PCP)141
StatewideRecent Quarter
63%
75%
63%
87
Prior Quarter
29%
Prior Year Current Statewide
PREVENTION / DISEASE MANAGEMENT ACCESS AND CONTINUITY MEDICATION MANAGEMENT
Feb. 20126 Month Trend
MEDICAL PROGRAM INSPECTIONS DENTAL PROGRAM PEREZ AUDIT MENTAL HEALTH TIMEFRAME COMPLIANCE
Statewide
70% Specialty Care Referrals*
50%
CALIFORNIA MEDICAL FACILITY (CMF) April 2012
Most Recent
Feb. 20126 Month Trend
CONTINUITY 6 Month Trend Feb. 2012 Statewide
Therapeutic Anticoagulation
Asthma Care
Diabetes Care
6 Month Trend
SPECIALTY AND HOSPITAL SERVICES
Potentially Avoidable Hospitalizations (per year) *
Statewide
PCP Hospital Follow-up
Statewide
Statewide
68
Feb. 2012
PCP Chronic Care
6 Month Trend
PCP Specialty Follow-up
RN Episodic Care
PCP Episodic Care
Specialty Consultation
ACCESS
Clinical Process Quality of Care Patient Safety
72.4% 79.0%
1st Audit 2nd Audit
AUDIT PENDING
Emergency Department Visits* 2.5 4.1
TOTAL 735 101% Patient Encounters per PCP 11 12
Medical FTE 30 101% Medical Staff $289.80 5 7
Nursing FTE 379 101% Nursing Staff $1,339.41 Patient Encounters per Psychiatrist 7 10
Pharmacy FTE 35 170% Pharmacy Staff $128.26 Prescriptions Per Pharmacist 51 121
Dental Clinical FTE 16 91% Dental Clinical Staff $85.44
Mental Health Clinical FTE 88 90% Mental Health Clinical Staff $584.26
Admin. Support FTE 148 101% Admin. Support Staff $272.47 822 10,754
NON LABOR Mental Health High Utilizers* 70 9
Hospital $548.43 Appeals Received* 64 36
Total Actual FTE 100% 100% Emergency Department $17.14 0.1% 1.9%
Civil Service FTE 88% 88% Specialty $76.11 Prison Population Capacity 103% 155%
Overtime FTE 9% 5% Medications $473.82 Cell Bed Changes 50% 53%
Registry FTE 4% 7% Diagnostics $34.35 Average Document Scan Time (in days) 3.6 3.8
KEY:
Health Care Appts. Missed due to Cusdody
170 $280.05 $93.17
6 Month Trend Most Recent Statewide
High Risk Patients
100%
87%
ActualJan. 2012 % of Total
$107.08 Clinical Support Staff
HIGH ADHERENCE LOW ADHERENCEMODERATE ADHERENCE *Per 1,000 inmates
$286.00
$5.97
$69.09
$416.32
$4.11
$30.24
$102.57
$21.17
$91.00
$28.9828
6 Month Trend
0
MAJOR COSTS PER INMATE PER MONTH WORKLOAD PER DAY
19.1 Hospital Admissions*
Primary Care Provider (PCP)
LABOR
Specialty Appts via Telemedicine Mental Health Primary Clinician
Psychiatrist 70%
% of Auth.
100%
100%
Authorized Jan. 2012
Actual Jan. 2012
Flu Vaccination 95%
Prior Year Year Statewide
$279.90
$1,318.79
Patient Encounters per Primary Mental Health Clinician
$120.84
$120.67
$67.77
$79.39
$327.36
$26.95
$70.70
$146.19
$18.46
77%
54%
OTHER TRENDS$524.78
30
7.3
Statewide
72% Admin. Hospital Bed Days (per year) *
YTD 11/12FY 10/11 Feb. 20126 Month TrendStatewide(excluding HQ)
70%
79%
50%
Clinical Support FTE 39 109%
105%
112%
119%
80%
80%
735
STAFFING IN FULL TIME EQUIVALENTS (FTE)
735
644
63
Statewide(excluding HQ)
Statewide(excluding HQ)
39
110
20
29
338
30
36%-
KEY: HIGH ADHERENCE LOW ADHERENCE
CCHCS
MODERATE ADHERENCE Per 1,000 inmates
RETURN TO DASHBOARD
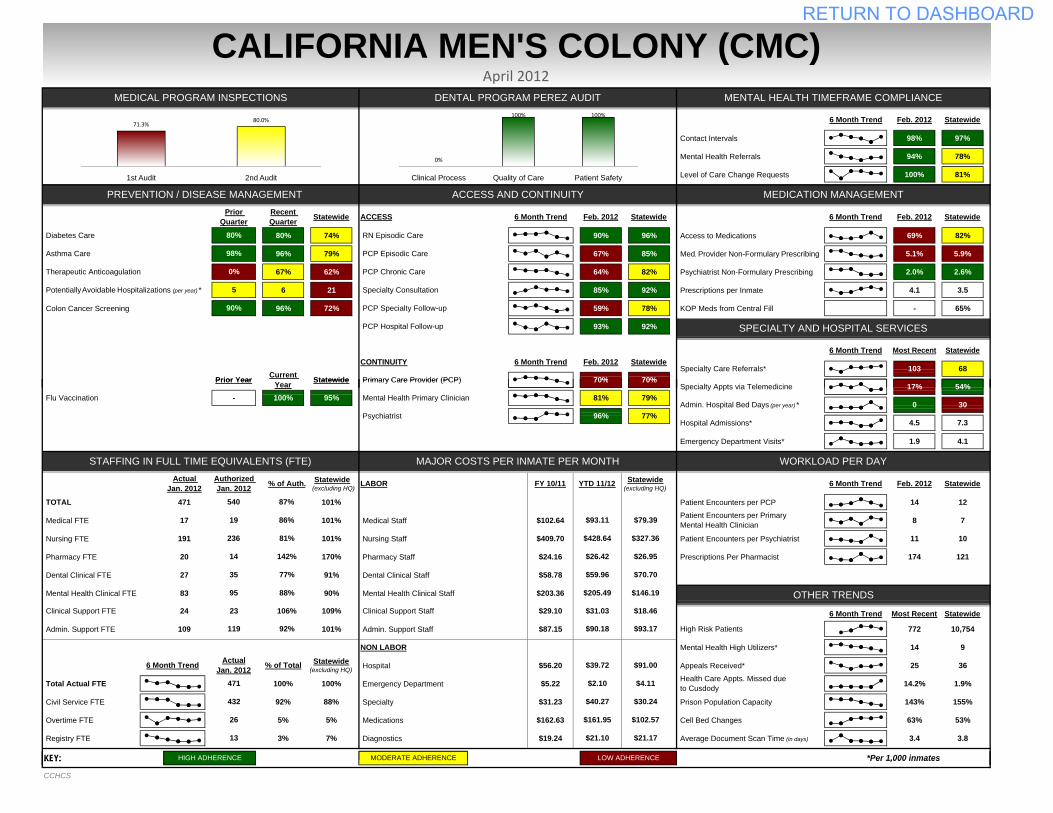
Contact Intervals 98% 97%
Mental Health Referrals 94% 78%
Level of Care Change Requests 100% 81%
80% 74% 90% 96% Access to Medications 69% 82%
96% 79% 67% 85% Med. Provider Non-Formulary Prescribing 5.1% 5.9%
67% 62% 64% 82% Psychiatrist Non-Formulary Prescribing 2.0% 2.6%
6 21 85% 92% Prescriptions per Inmate 4.1 3.5
Colon Cancer Screening 96% 72% 59% 78% KOP Meds from Central Fill - 65%
93% 92%
CALIFORNIA MEN'S COLONY (CMC)April 2012
Most Recent
Feb. 20126 Month Trend
CONTINUITY 6 Month Trend Feb. 2012 Statewide
Therapeutic Anticoagulation
Asthma Care
Diabetes Care
6 Month Trend
SPECIALTY AND HOSPITAL SERVICES
70%
Potentially Avoidable Hospitalizations (per year) *
Statewide Statewide
Statewide
Recent Quarter ACCESS
80%
98%
0%
5
Prior Quarter
90%
Feb. 2012
PCP Chronic Care
6 Month Trend
PCP Specialty Follow-up
RN Episodic Care
PCP Episodic Care
Specialty Consultation
PCP Hospital Follow-up
103 68
PREVENTION / DISEASE MANAGEMENT ACCESS AND CONTINUITY MEDICATION MANAGEMENT
Feb. 20126 Month Trend
MEDICAL PROGRAM INSPECTIONS DENTAL PROGRAM PEREZ AUDIT MENTAL HEALTH TIMEFRAME COMPLIANCE
Statewide
Statewide
Prior Year Current Statewide Specialty Care Referrals*
Primary Care Provider (PCP) 70%
0%
100% 100%
Clinical Process Quality of Care Patient Safety
71.3%80.0%
1st Audit 2nd Audit
Emergency Department Visits* 1.9 4.1
TOTAL 471 101% Patient Encounters per PCP 14 12
Medical FTE 17 101% Medical Staff $102.64 8 7
Nursing FTE 191 101% Nursing Staff $409.70 Patient Encounters per Psychiatrist 11 10
Pharmacy FTE 20 170% Pharmacy Staff $24.16 Prescriptions Per Pharmacist 174 121
Dental Clinical FTE 27 91% Dental Clinical Staff $58.78
Mental Health Clinical FTE 83 90% Mental Health Clinical Staff $203.36
Admin. Support FTE 109 101% Admin. Support Staff $87.15 772 10,754
NON LABOR Mental Health High Utilizers* 14 9
Hospital $56.20 Appeals Received* 25 36
Total Actual FTE 100% 100% Emergency Department $5.22 14.2% 1.9%
Civil Service FTE 92% 88% Specialty $31.23 Prison Population Capacity 143% 155%
Overtime FTE 5% 5% Medications $162.63 Cell Bed Changes 63% 53%
Registry FTE 3% 7% Diagnostics $19.24 Average Document Scan Time (in days) 3.4 3.8
KEY:
17%70%
Specialty Appts via Telemedicine95% 79%
471
432
26
24
-
540
19
236
14
35
95 OTHER TRENDS
$79.39
$327.36
77%
Flu Vaccination Mental Health Primary Clinician
Psychiatrist 96%
54%
30
7.3
$205.49
Clinical Support Staff
$93.11
$428.64
Patient Encounters per Primary Mental Health Clinician
$29.10
$26.42
$59.96
$26.95
$70.70
$146.19
$18.46$31.03
STAFFING IN FULL TIME EQUIVALENTS (FTE)
Clinical Support FTE 23 109%
% of Auth.
87%
100%
Authorized Jan. 2012
Actual Jan. 2012
86%
81%
142%
77%
Statewide(excluding HQ)
88%
Prior Year Year Statewide
Statewide
81% Admin. Hospital Bed Days (per year) * 0
MAJOR COSTS PER INMATE PER MONTH WORKLOAD PER DAY
4.5 Hospital Admissions*
Primary Care Provider (PCP)
YTD 11/12FY 10/11LABOR Feb. 20126 Month TrendStatewide(excluding HQ)
70%
HIGH ADHERENCE LOW ADHERENCEMODERATE ADHERENCE *Per 1,000 inmates
$39.72
$2.10
$40.27
$161.95
$4.11
$30.24
$102.57
$21.17
$91.00
$21.1013
6 Month Trend
Health Care Appts. Missed due to Cusdody
119 $90.18 $93.17
6 Month Trend Most Recent Statewide
High Risk Patients
106%
92%
Statewide(excluding HQ)
ActualJan. 2012 % of Total
KEY: HIGH ADHERENCE LOW ADHERENCE
CCHCS
MODERATE ADHERENCE Per 1,000 inmates
RETURN TO DASHBOARD
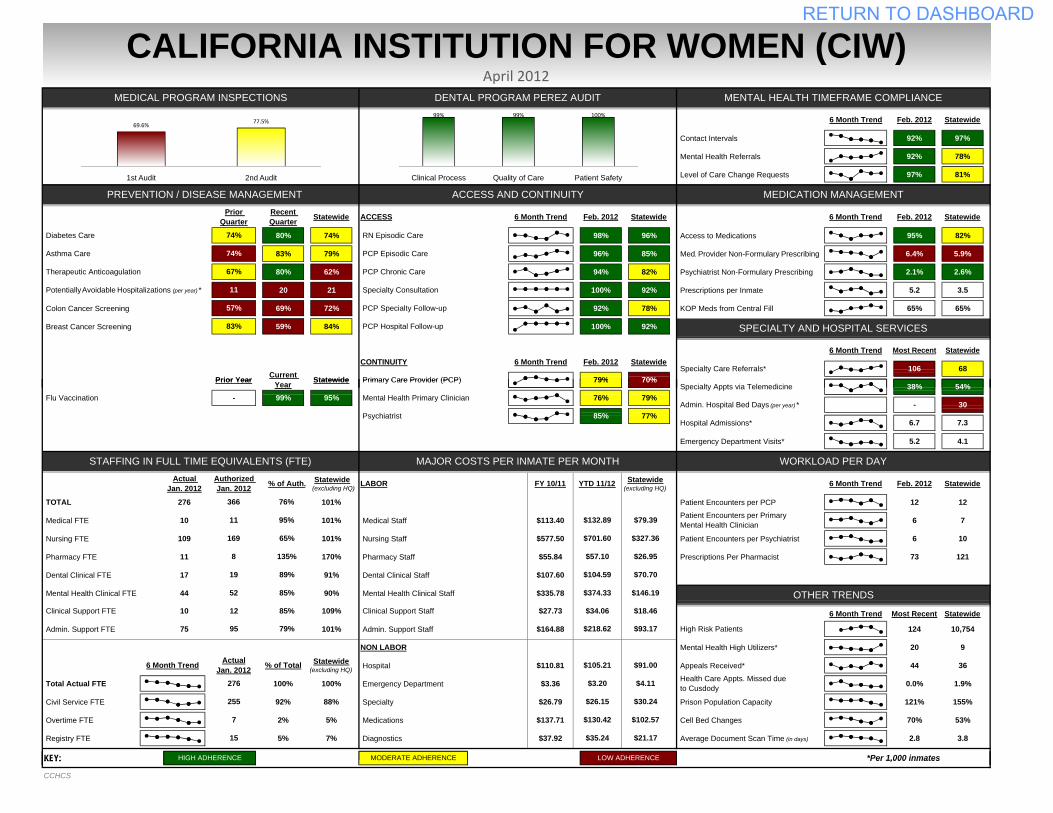
Contact Intervals 92% 97%
Mental Health Referrals 92% 78%
Level of Care Change Requests 97% 81%
80% 74% 98% 96% Access to Medications 95% 82%
83% 79% 96% 85% Med. Provider Non-Formulary Prescribing 6.4% 5.9%
80% 62% 94% 82% Psychiatrist Non-Formulary Prescribing 2.1% 2.6%
20 21 100% 92% Prescriptions per Inmate 5.2 3.5
Colon Cancer Screening 69% 72% 92% 78% KOP Meds from Central Fill 65% 65%
Breast Cancer Screening 59% 84% 100% 92%
CALIFORNIA INSTITUTION FOR WOMEN (CIW)April 2012
Most Recent
Feb. 20126 Month Trend
CONTINUITY 6 Month Trend Feb. 2012 Statewide
Therapeutic Anticoagulation
Asthma Care
Diabetes Care
6 Month Trend
SPECIALTY AND HOSPITAL SERVICES
79%
Potentially Avoidable Hospitalizations (per year) *
Statewide Statewide
Statewide
Recent Quarter ACCESS
74%
74%
67%
11
Prior Quarter
57%
Feb. 2012
PCP Chronic Care
6 Month Trend
PCP Specialty Follow-up
RN Episodic Care
PCP Episodic Care
Specialty Consultation
PCP Hospital Follow-up
106 68
PREVENTION / DISEASE MANAGEMENT ACCESS AND CONTINUITY MEDICATION MANAGEMENT
Feb. 20126 Month Trend
MEDICAL PROGRAM INSPECTIONS DENTAL PROGRAM PEREZ AUDIT MENTAL HEALTH TIMEFRAME COMPLIANCE
Statewide
Statewide
83%
Prior Year Current Statewide Specialty Care Referrals*
Primary Care Provider (PCP) 70%
99% 99% 100%
Clinical Process Quality of Care Patient Safety
69.6%77.5%
1st Audit 2nd Audit
Emergency Department Visits* 5.2 4.1
TOTAL 276 101% Patient Encounters per PCP 12 12
Medical FTE 10 101% Medical Staff $113.40 6 7
Nursing FTE 109 101% Nursing Staff $577.50 Patient Encounters per Psychiatrist 6 10
Pharmacy FTE 11 170% Pharmacy Staff $55.84 Prescriptions Per Pharmacist 73 121
Dental Clinical FTE 17 91% Dental Clinical Staff $107.60
Mental Health Clinical FTE 44 90% Mental Health Clinical Staff $335.78
Admin. Support FTE 75 101% Admin. Support Staff $164.88 124 10,754
NON LABOR Mental Health High Utilizers* 20 9
Hospital $110.81 Appeals Received* 44 36
Total Actual FTE 100% 100% Emergency Department $3.36 0.0% 1.9%
Civil Service FTE 92% 88% Specialty $26.79 Prison Population Capacity 121% 155%
Overtime FTE 2% 5% Medications $137.71 Cell Bed Changes 70% 53%
Registry FTE 5% 7% Diagnostics $37.92 Average Document Scan Time (in days) 2.8 3.8
KEY:
38%79%
Specialty Appts via Telemedicine95% 79%
276
255
7
10
-
366
11
169
8
19
52 OTHER TRENDS
$79.39
$327.36
77%
Flu Vaccination Mental Health Primary Clinician
Psychiatrist 85%
54%
30
7.3
$374.33
Clinical Support Staff
$132.89
$701.60
Patient Encounters per Primary Mental Health Clinician
$27.73
$57.10
$104.59
$26.95
$70.70
$146.19
$18.46$34.06
STAFFING IN FULL TIME EQUIVALENTS (FTE)
Clinical Support FTE 12 109%
% of Auth.
76%
99%
Authorized Jan. 2012
Actual Jan. 2012
95%
65%
135%
89%
Statewide(excluding HQ)
85%
Prior Year Year Statewide
Statewide
76% Admin. Hospital Bed Days (per year) * -
MAJOR COSTS PER INMATE PER MONTH WORKLOAD PER DAY
6.7 Hospital Admissions*
Primary Care Provider (PCP)
YTD 11/12FY 10/11LABOR Feb. 20126 Month TrendStatewide(excluding HQ)
70%
HIGH ADHERENCE LOW ADHERENCEMODERATE ADHERENCE *Per 1,000 inmates
$105.21
$3.20
$26.15
$130.42
$4.11
$30.24
$102.57
$21.17
$91.00
$35.2415
6 Month Trend
Health Care Appts. Missed due to Cusdody
95 $218.62 $93.17
6 Month Trend Most Recent Statewide
High Risk Patients
85%
79%
Statewide(excluding HQ)
ActualJan. 2012 % of Total
KEY: HIGH ADHERENCE LOW ADHERENCE
CCHCS
MODERATE ADHERENCE Per 1,000 inmates
RETURN TO DASHBOARD
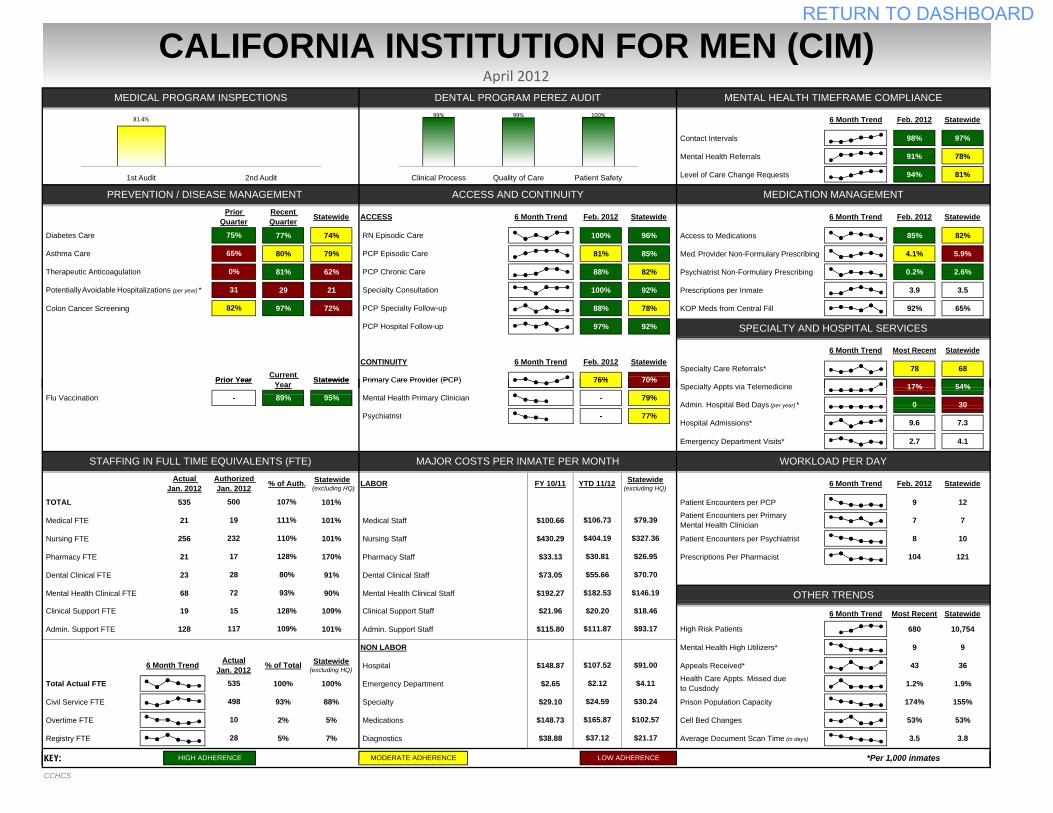
Contact Intervals 98% 97%
Mental Health Referrals 91% 78%
Level of Care Change Requests 94% 81%
77% 74% 100% 96% Access to Medications 85% 82%
80% 79% 81% 85% Med. Provider Non-Formulary Prescribing 4.1% 5.9%
81% 62% 88% 82% Psychiatrist Non-Formulary Prescribing 0.2% 2.6%
29 21 100% 92% Prescriptions per Inmate 3.9 3.5
Colon Cancer Screening 97% 72% 88% 78% KOP Meds from Central Fill 92% 65%
97% 92% PCP Hospital Follow-up
Prior Year Current Statewide
Statewide
70%
Statewide
Statewide
Statewide
68 Specialty Care Referrals*
Potentially Avoidable Hospitalizations (per year) *
75%
65%
0%
31
Prior Quarter
82%
Statewide
PCP Chronic Care
6 Month Trend
PCP Specialty Follow-up
RN Episodic Care
PCP Episodic Care
Specialty Consultation
PREVENTION / DISEASE MANAGEMENT ACCESS AND CONTINUITY MEDICATION MANAGEMENT
Feb. 20126 Month Trend
MEDICAL PROGRAM INSPECTIONS DENTAL PROGRAM PEREZ AUDIT MENTAL HEALTH TIMEFRAME COMPLIANCE
Primary Care Provider (PCP)78
CALIFORNIA INSTITUTION FOR MEN (CIM)April 2012
Most Recent
Feb. 20126 Month Trend
CONTINUITY 6 Month Trend Feb. 2012 Statewide
Therapeutic Anticoagulation
Asthma Care
Diabetes Care
6 Month Trend
SPECIALTY AND HOSPITAL SERVICES
76%
Recent Quarter ACCESS Feb. 2012
99% 99% 100%
Clinical Process Quality of Care Patient Safety
81.4%
1st Audit 2nd Audit
Emergency Department Visits* 2.7 4.1
TOTAL 535 101% Patient Encounters per PCP 9 12
Medical FTE 21 101% Medical Staff $100.66 7 7
Nursing FTE 256 101% Nursing Staff $430.29 Patient Encounters per Psychiatrist 8 10
Pharmacy FTE 21 170% Pharmacy Staff $33.13 Prescriptions Per Pharmacist 104 121
Dental Clinical FTE 23 91% Dental Clinical Staff $73.05
Mental Health Clinical FTE 68 90% Mental Health Clinical Staff $192.27
Admin. Support FTE 128 101% Admin. Support Staff $115.80 680 10,754
NON LABOR Mental Health High Utilizers* 9 9
Hospital $148.87 Appeals Received* 43 36
Total Actual FTE 100% 100% Emergency Department $2.65 1.2% 1.9%
Civil Service FTE 93% 88% Specialty $29.10 Prison Population Capacity 174% 155%
Overtime FTE 2% 5% Medications $148.73 Cell Bed Changes 53% 53%
Registry FTE 5% 7% Diagnostics $38.88 Average Document Scan Time (in days) 3.5 3.8
KEY:
498
10
Statewide(excluding HQ)
Statewide(excluding HQ)
Statewide(excluding HQ)
$30.81
$55.66
95%89%
6 Month Trend
Authorized Jan. 2012
Actual Jan. 2012
111%
110%
128%
80%
93%
Prior Year Year Statewide
Health Care Appts. Missed due to Cusdody
117 $111.87 $93.17 High Risk Patients
128%
109%
ActualJan. 2012 % of Total
535
$20.20
HIGH ADHERENCE LOW ADHERENCEMODERATE ADHERENCE *Per 1,000 inmates
$107.52
$2.12
$24.59
$165.87
$4.11
$30.24
$102.57
$21.17
$91.00
$37.1228
70%
79%
77%
54%
30
7.3
Statewide
- Admin. Hospital Bed Days (per year) * 0
MAJOR COSTS PER INMATE PER MONTH WORKLOAD PER DAY
9.6 Hospital Admissions*
19
-
500
19
232
17
28
72
STAFFING IN FULL TIME EQUIVALENTS (FTE)
Clinical Support FTE 15 109%
% of Auth.
107%
OTHER TRENDS$182.53
Clinical Support Staff
$106.73
$404.19
Patient Encounters per Primary Mental Health Clinician
$21.96 6 Month Trend Most Recent Statewide
$79.39
$327.36
$26.95
$70.70
$146.19
$18.46
Primary Care Provider (PCP)
Mental Health Primary Clinician
Psychiatrist -
YTD 11/12FY 10/11LABOR Feb. 20126 Month Trend
17%76%
Specialty Appts via Telemedicine Flu Vaccination
KEY: HIGH ADHERENCE LOW ADHERENCE
CCHCS
MODERATE ADHERENCE Per 1,000 inmates
RETURN TO DASHBOARD
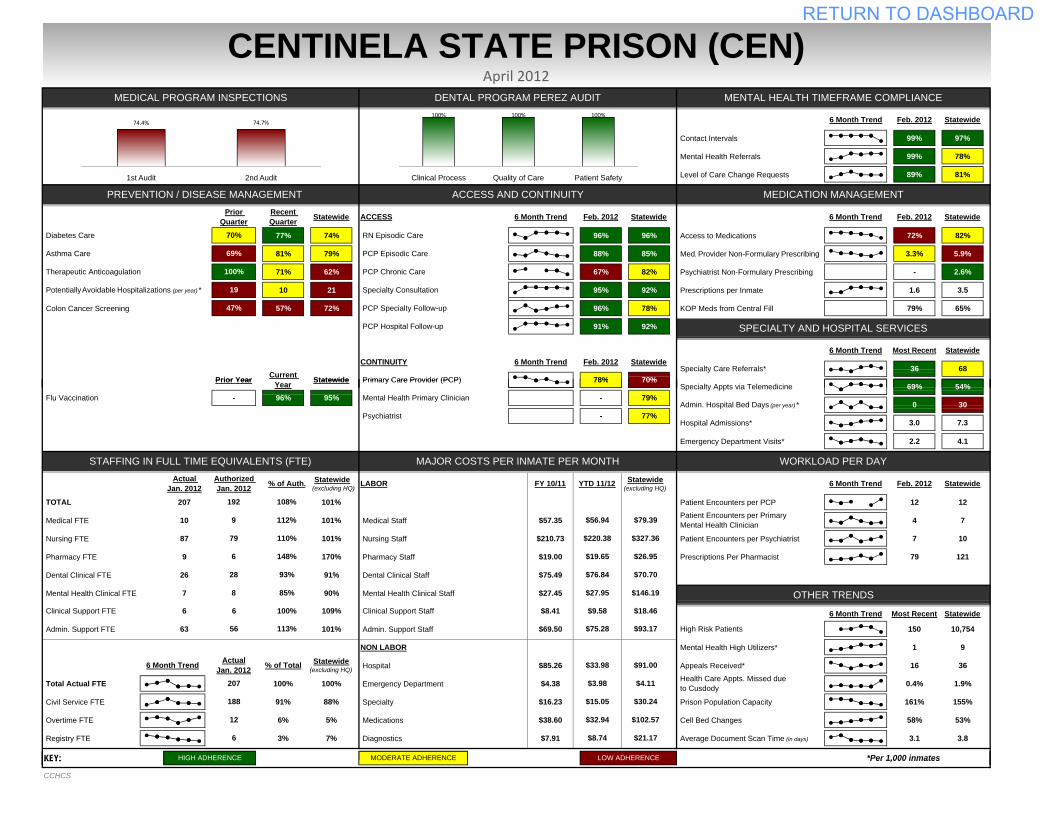
Contact Intervals 99% 97%
Mental Health Referrals 99% 78%
Level of Care Change Requests 89% 81%
77% 74% 96% 96% Access to Medications 72% 82%
81% 79% 88% 85% Med. Provider Non-Formulary Prescribing 3.3% 5.9%
71% 62% 67% 82% Psychiatrist Non-Formulary Prescribing - 2.6%
10 21 95% 92% Prescriptions per Inmate 1.6 3.5
Colon Cancer Screening 57% 72% 96% 78% KOP Meds from Central Fill 79% 65%
91% 92%
CENTINELA STATE PRISON (CEN)April 2012
Most Recent
Feb. 20126 Month Trend
CONTINUITY 6 Month Trend Feb. 2012 Statewide
Therapeutic Anticoagulation
Asthma Care
Diabetes Care
6 Month Trend
SPECIALTY AND HOSPITAL SERVICES
78%
Recent Quarter ACCESS Feb. 2012
PCP Chronic Care
Primary Care Provider (PCP)36
PREVENTION / DISEASE MANAGEMENT ACCESS AND CONTINUITY MEDICATION MANAGEMENT
Feb. 20126 Month Trend
MEDICAL PROGRAM INSPECTIONS DENTAL PROGRAM PEREZ AUDIT MENTAL HEALTH TIMEFRAME COMPLIANCE
6 Month Trend
PCP Specialty Follow-up
RN Episodic Care
PCP Episodic Care
Specialty Consultation Potentially Avoidable Hospitalizations (per year) *
70%
69%
100%
19
Prior Quarter
47%
Statewide
Current
Statewide
70%
Statewide
Statewide
Statewide
68 Specialty Care Referrals*
PCP Hospital Follow-up
Prior Year Statewide
100% 100% 100%
Clinical Process Quality of Care Patient Safety
74.4% 74.7%
1st Audit 2nd Audit
Emergency Department Visits* 2.2 4.1
TOTAL 207 101% Patient Encounters per PCP 12 12
Medical FTE 10 101% Medical Staff $57.35 4 7
Nursing FTE 87 101% Nursing Staff $210.73 Patient Encounters per Psychiatrist 7 10
Pharmacy FTE 9 170% Pharmacy Staff $19.00 Prescriptions Per Pharmacist 79 121
Dental Clinical FTE 26 91% Dental Clinical Staff $75.49
Mental Health Clinical FTE 7 90% Mental Health Clinical Staff $27.45
Admin. Support FTE 63 101% Admin. Support Staff $69.50 150 10,754
NON LABOR Mental Health High Utilizers* 1 9
Hospital $85.26 Appeals Received* 16 36
Total Actual FTE 100% 100% Emergency Department $4.38 0.4% 1.9%
Civil Service FTE 91% 88% Specialty $16.23 Prison Population Capacity 161% 155%
Overtime FTE 6% 5% Medications $38.60 Cell Bed Changes 58% 53%
Registry FTE 3% 7% Diagnostics $7.91 Average Document Scan Time (in days) 3.1 3.8
KEY:
69%78%
Specialty Appts via Telemedicine Flu Vaccination
$79.39
$327.36
$26.95
$70.70
$146.19
$18.46$9.58
Primary Care Provider (PCP)
Mental Health Primary Clinician
Psychiatrist -
YTD 11/12FY 10/11LABOR Feb. 20126 Month TrendStatewide(excluding HQ)
OTHER TRENDS$27.95
Clinical Support Staff
$56.94
$220.38
Patient Encounters per Primary Mental Health Clinician
$8.41 6 Month Trend Most Recent Statewide6
-
192
9
79
6
28
8
STAFFING IN FULL TIME EQUIVALENTS (FTE)
Clinical Support FTE 6 109%
% of Auth.
108%
Year 70%
79%
77%
54%
30
7.3
Statewide
- Admin. Hospital Bed Days (per year) * 0
MAJOR COSTS PER INMATE PER MONTH WORKLOAD PER DAY
3.0 Hospital Admissions*
HIGH ADHERENCE LOW ADHERENCEMODERATE ADHERENCE *Per 1,000 inmates
$33.98
$3.98
$15.05
$32.94
$4.11
$30.24
$102.57
$21.17
$91.00
$8.74
Statewide(excluding HQ)
6
Health Care Appts. Missed due to Cusdody
56 $75.28 $93.17 High Risk Patients
100%
113%
ActualJan. 2012 % of Total
207
188
12
$19.65
$76.84
95%96%
6 Month Trend
Authorized Jan. 2012
Actual Jan. 2012
112%
110%
148%
93%
85%
Statewide(excluding HQ)
Prior Year Statewide
KEY: HIGH ADHERENCE LOW ADHERENCE
CCHCS
MODERATE ADHERENCE Per 1,000 inmates
RETURN TO DASHBOARD
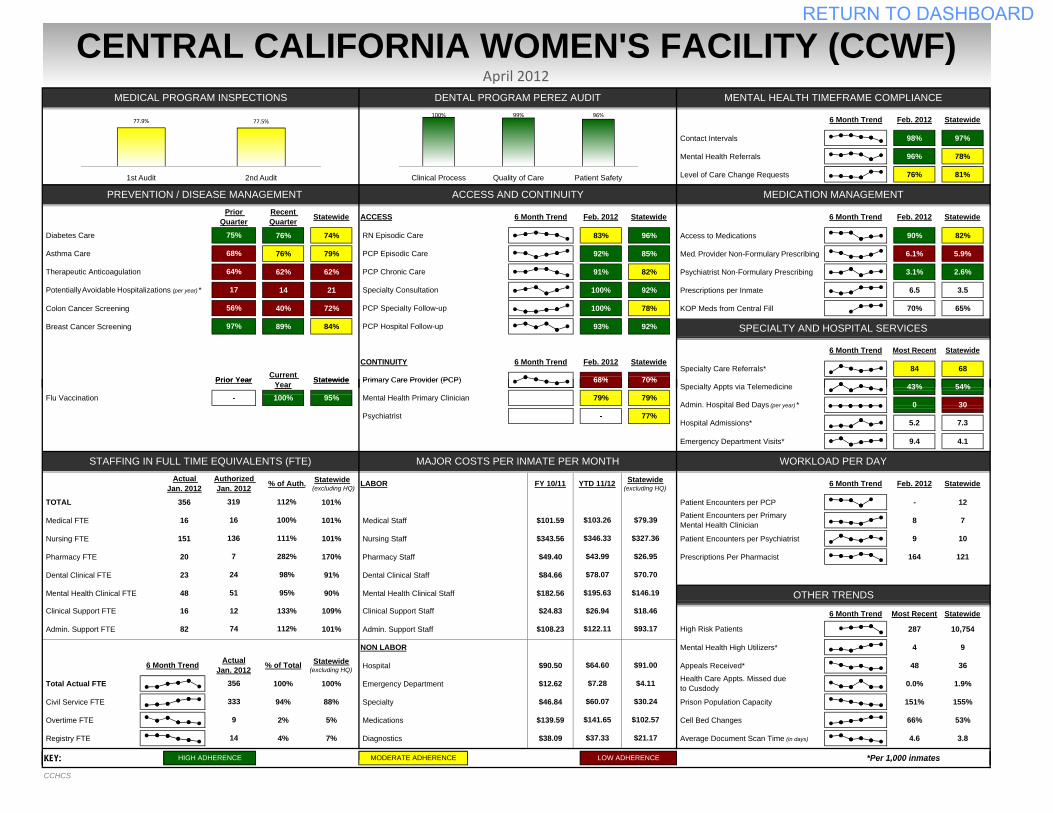
Contact Intervals 98% 97%
Mental Health Referrals 96% 78%
Level of Care Change Requests 76% 81%
76% 74% 83% 96% Access to Medications 90% 82%
76% 79% 92% 85% Med. Provider Non-Formulary Prescribing 6.1% 5.9%
62% 62% 91% 82% Psychiatrist Non-Formulary Prescribing 3.1% 2.6%
14 21 100% 92% Prescriptions per Inmate 6.5 3.5
Colon Cancer Screening 40% 72% 100% 78% KOP Meds from Central Fill 70% 65%
Breast Cancer Screening 89% 84% 93% 92%
CENTRAL CALIFORNIA WOMEN'S FACILITY (CCWF)April 2012
Most Recent
Feb. 20126 Month Trend
CONTINUITY 6 Month Trend Feb. 2012 Statewide
Therapeutic Anticoagulation
Asthma Care
Diabetes Care
6 Month Trend
SPECIALTY AND HOSPITAL SERVICES
68%
Potentially Avoidable Hospitalizations (per year) *
Statewide Statewide
Statewide
Recent Quarter ACCESS
75%
68%
64%
17
Prior Quarter
56%
Feb. 2012
PCP Chronic Care
6 Month Trend
PCP Specialty Follow-up
RN Episodic Care
PCP Episodic Care
Specialty Consultation
PCP Hospital Follow-up
84 68
PREVENTION / DISEASE MANAGEMENT ACCESS AND CONTINUITY MEDICATION MANAGEMENT
Feb. 20126 Month Trend
MEDICAL PROGRAM INSPECTIONS DENTAL PROGRAM PEREZ AUDIT MENTAL HEALTH TIMEFRAME COMPLIANCE
Statewide
Statewide
97%
Prior Year Current Statewide Specialty Care Referrals*
Primary Care Provider (PCP) 70%
100% 99% 96%
Clinical Process Quality of Care Patient Safety
77.9% 77.5%
1st Audit 2nd Audit
Emergency Department Visits* 9.4 4.1
TOTAL 356 101% Patient Encounters per PCP - 12
Medical FTE 16 101% Medical Staff $101.59 8 7
Nursing FTE 151 101% Nursing Staff $343.56 Patient Encounters per Psychiatrist 9 10
Pharmacy FTE 20 170% Pharmacy Staff $49.40 Prescriptions Per Pharmacist 164 121
Dental Clinical FTE 23 91% Dental Clinical Staff $84.66
Mental Health Clinical FTE 48 90% Mental Health Clinical Staff $182.56
Admin. Support FTE 82 101% Admin. Support Staff $108.23 287 10,754
NON LABOR Mental Health High Utilizers* 4 9
Hospital $90.50 Appeals Received* 48 36
Total Actual FTE 100% 100% Emergency Department $12.62 0.0% 1.9%
Civil Service FTE 94% 88% Specialty $46.84 Prison Population Capacity 151% 155%
Overtime FTE 2% 5% Medications $139.59 Cell Bed Changes 66% 53%
Registry FTE 4% 7% Diagnostics $38.09 Average Document Scan Time (in days) 4.6 3.8
KEY:
43%68%
Specialty Appts via Telemedicine95% 79%
356
333
9
16
-
319
16
136
7
24
51 OTHER TRENDS
$79.39
$327.36
77%
Flu Vaccination Mental Health Primary Clinician
Psychiatrist -
54%
30
7.3
$195.63
Clinical Support Staff
$103.26
$346.33
Patient Encounters per Primary Mental Health Clinician
$24.83
$43.99
$78.07
$26.95
$70.70
$146.19
$18.46$26.94
STAFFING IN FULL TIME EQUIVALENTS (FTE)
Clinical Support FTE 12 109%
% of Auth.
112%
100%
Authorized Jan. 2012
Actual Jan. 2012
100%
111%
282%
98%
Statewide(excluding HQ)
95%
Prior Year Year Statewide
Statewide
79% Admin. Hospital Bed Days (per year) * 0
MAJOR COSTS PER INMATE PER MONTH WORKLOAD PER DAY
5.2 Hospital Admissions*
Primary Care Provider (PCP)
YTD 11/12FY 10/11LABOR Feb. 20126 Month TrendStatewide(excluding HQ)
70%
HIGH ADHERENCE LOW ADHERENCEMODERATE ADHERENCE *Per 1,000 inmates
$64.60
$7.28
$60.07
$141.65
$4.11
$30.24
$102.57
$21.17
$91.00
$37.3314
6 Month Trend
Health Care Appts. Missed due to Cusdody
74 $122.11 $93.17
6 Month Trend Most Recent Statewide
High Risk Patients
133%
Statewide(excluding HQ)
112%
ActualJan. 2012 % of Total
KEY: HIGH ADHERENCE LOW ADHERENCE
CCHCS
MODERATE ADHERENCE Per 1,000 inmates
RETURN TO DASHBOARD
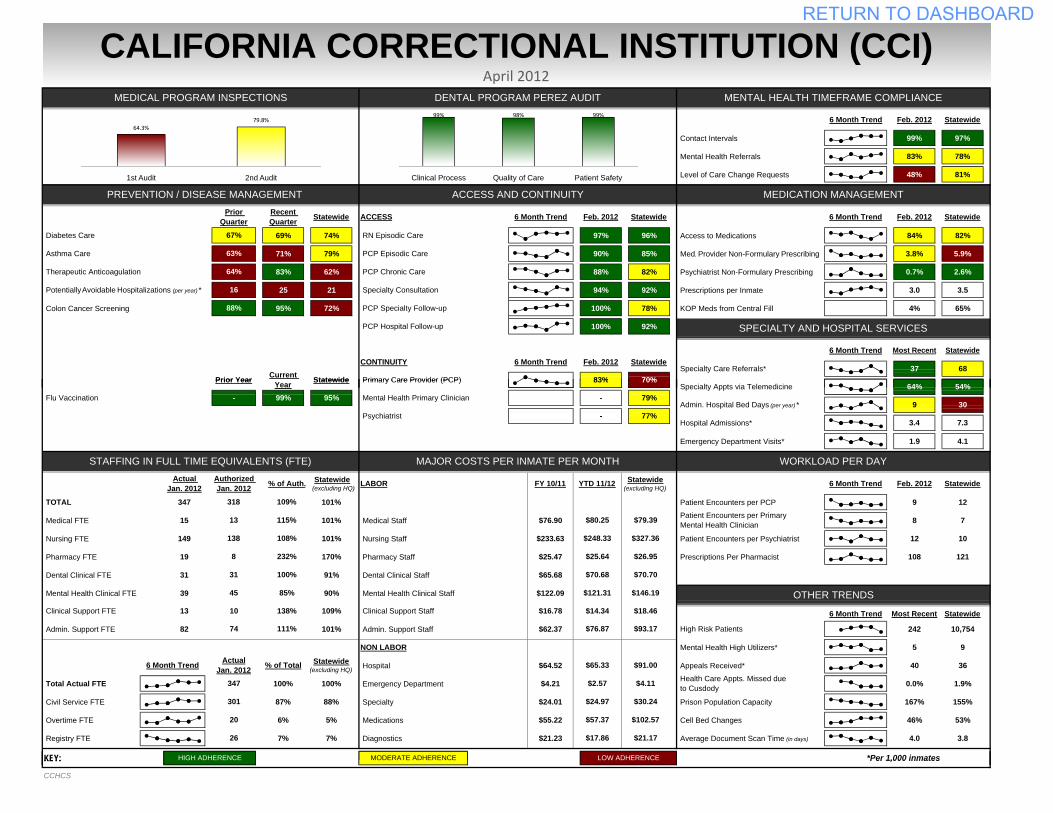
Contact Intervals 99% 97%
Mental Health Referrals 83% 78%
Level of Care Change Requests 48% 81%
69% 74% 97% 96% Access to Medications 84% 82%
71% 79% 90% 85% Med. Provider Non-Formulary Prescribing 3.8% 5.9%
83% 62% 88% 82% Psychiatrist Non-Formulary Prescribing 0.7% 2.6%
25 21 94% 92% Prescriptions per Inmate 3.0 3.5
Colon Cancer Screening 95% 72% 100% 78% KOP Meds from Central Fill 4% 65%
100% 92% PCP Hospital Follow-up
Prior Year Current Statewide
Statewide
70%
Statewide
Statewide
Statewide
68 Specialty Care Referrals*
Potentially Avoidable Hospitalizations (per year) *
67%
63%
64%
16
Prior Quarter
88%
Statewide
PCP Specialty Follow-up
RN Episodic Care
PCP Episodic Care
Specialty Consultation
PREVENTION / DISEASE MANAGEMENT ACCESS AND CONTINUITY MEDICATION MANAGEMENT
6 Month Trend
MEDICAL PROGRAM INSPECTIONS DENTAL PROGRAM PEREZ AUDIT MENTAL HEALTH TIMEFRAME COMPLIANCE
Feb. 2012
Primary Care Provider (PCP)37
CALIFORNIA CORRECTIONAL INSTITUTION (CCI)April 2012
Most Recent
Feb. 20126 Month Trend
CONTINUITY 6 Month Trend Feb. 2012 Statewide
Therapeutic Anticoagulation
Asthma Care
Diabetes Care
6 Month Trend
SPECIALTY AND HOSPITAL SERVICES
83%
Recent Quarter ACCESS
PCP Chronic Care
Feb. 20126 Month Trend
99% 98% 99%
Clinical Process Quality of Care Patient Safety
64.3%79.8%
1st Audit 2nd Audit
Emergency Department Visits* 1.9 4.1
TOTAL 347 101% Patient Encounters per PCP 9 12
Medical FTE 15 101% Medical Staff $76.90 8 7
Nursing FTE 149 101% Nursing Staff $233.63 Patient Encounters per Psychiatrist 12 10
Pharmacy FTE 19 170% Pharmacy Staff $25.47 Prescriptions Per Pharmacist 108 121
Dental Clinical FTE 31 91% Dental Clinical Staff $65.68
Mental Health Clinical FTE 39 90% Mental Health Clinical Staff $122.09
Admin. Support FTE 82 101% Admin. Support Staff $62.37 242 10,754
NON LABOR Mental Health High Utilizers* 5 9
Hospital $64.52 Appeals Received* 40 36
Total Actual FTE 100% 100% Emergency Department $4.21 0.0% 1.9%
Civil Service FTE 87% 88% Specialty $24.01 Prison Population Capacity 167% 155%
Overtime FTE 6% 5% Medications $55.22 Cell Bed Changes 46% 53%
Registry FTE 7% 7% Diagnostics $21.23 Average Document Scan Time (in days) 4.0 3.8
KEY:
Health Care Appts. Missed due to Cusdody
74 $76.87 $93.17
6 Month Trend Most Recent Statewide
High Risk Patients
138%
111%
ActualJan. 2012 % of Total
$25.64
$70.68
95%99%
Authorized Jan. 2012
Actual Jan. 2012
115%
108%
232%
100%
Prior Year Year Statewide
HIGH ADHERENCE LOW ADHERENCEMODERATE ADHERENCE *Per 1,000 inmates
$65.33
$2.57
$24.97
$57.37
$4.11
$30.24
$102.57
$21.17
$91.00
$17.8626
6 Month Trend
70%
79%
77%
54%
30
7.3
Statewide
- Admin. Hospital Bed Days (per year) * 9
MAJOR COSTS PER INMATE PER MONTH WORKLOAD PER DAY
3.4 Hospital Admissions*
13
-
318
13
138
8
31
45
STAFFING IN FULL TIME EQUIVALENTS (FTE)
Clinical Support FTE 10 109%
% of Auth.
109%
OTHER TRENDS$121.31
Clinical Support Staff
$80.25
$248.33
Patient Encounters per Primary Mental Health Clinician
$16.78
Primary Care Provider (PCP)
Mental Health Primary Clinician
Psychiatrist -
YTD 11/12FY 10/11LABOR Feb. 20126 Month Trend
64%83%
Specialty Appts via Telemedicine Flu Vaccination
347
301
20
Statewide(excluding HQ)
Statewide(excluding HQ)
Statewide(excluding HQ)
$79.39
$327.36
$26.95
$70.70
$146.19
$18.46$14.34
85%
KEY: HIGH ADHERENCE LOW ADHERENCE
CCHCS
MODERATE ADHERENCE Per 1,000 inmates
RETURN TO DASHBOARD
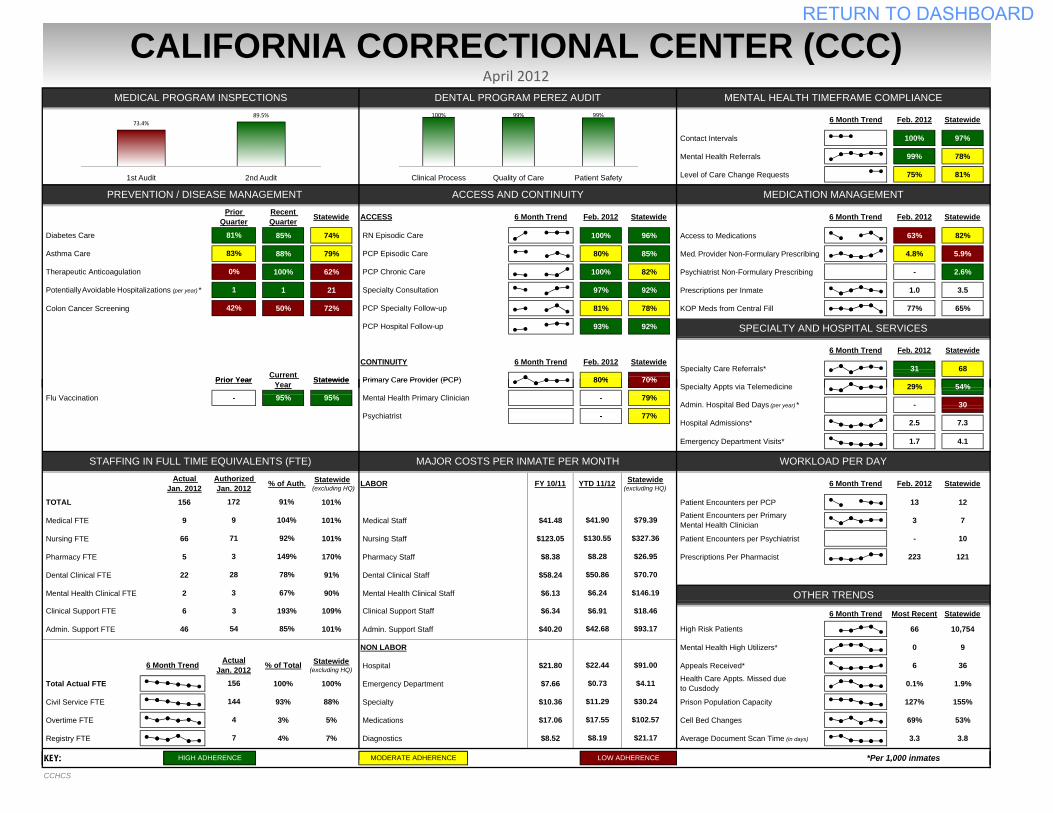
Contact Intervals 100% 97%
Mental Health Referrals 99% 78%
Level of Care Change Requests 75% 81%
85% 74% 100% 96% Access to Medications 63% 82%
88% 79% 80% 85% Med. Provider Non-Formulary Prescribing 4.8% 5.9%
100% 62% 100% 82% Psychiatrist Non-Formulary Prescribing - 2.6%
1 21 97% 92% Prescriptions per Inmate 1.0 3.5
Colon Cancer Screening 50% 72% 81% 78% KOP Meds from Central Fill 77% 65%
93% 92%
Specialty Care Referrals*Primary Care Provider (PCP) 70%
Statewide
Prior Year Current Statewide
PREVENTION / DISEASE MANAGEMENT ACCESS AND CONTINUITY MEDICATION MANAGEMENT
Feb. 20126 Month Trend
MEDICAL PROGRAM INSPECTIONS DENTAL PROGRAM PEREZ AUDIT MENTAL HEALTH TIMEFRAME COMPLIANCE
Statewide
31 68
Feb. 2012
PCP Chronic Care
6 Month Trend
PCP Specialty Follow-up
RN Episodic Care
PCP Episodic Care
Specialty Consultation
PCP Hospital Follow-up
Recent Quarter ACCESS
81%
83%
0%
1
Prior Quarter
42%
CALIFORNIA CORRECTIONAL CENTER (CCC)April 2012
Feb. 2012
Feb. 20126 Month Trend
CONTINUITY 6 Month Trend Feb. 2012 Statewide
Therapeutic Anticoagulation
Asthma Care
Diabetes Care
6 Month Trend
SPECIALTY AND HOSPITAL SERVICES
80%
Potentially Avoidable Hospitalizations (per year) *
Statewide Statewide
Statewide
100% 99% 99%
Clinical Process Quality of Care Patient Safety
73.4%89.5%
1st Audit 2nd Audit
Emergency Department Visits* 1.7 4.1
TOTAL 156 101% Patient Encounters per PCP 13 12
Medical FTE 9 101% Medical Staff $41.48 3 7
Nursing FTE 66 101% Nursing Staff $123.05 Patient Encounters per Psychiatrist - 10
Pharmacy FTE 5 170% Pharmacy Staff $8.38 Prescriptions Per Pharmacist 223 121
Dental Clinical FTE 22 91% Dental Clinical Staff $58.24
Mental Health Clinical FTE 2 90% Mental Health Clinical Staff $6.13
Admin. Support FTE 46 101% Admin. Support Staff $40.20 66 10,754
NON LABOR Mental Health High Utilizers* 0 9
Hospital $21.80 Appeals Received* 6 36
Total Actual FTE 100% 100% Emergency Department $7.66 0.1% 1.9%
Civil Service FTE 93% 88% Specialty $10.36 Prison Population Capacity 127% 155%
Overtime FTE 3% 5% Medications $17.06 Cell Bed Changes 69% 53%
Registry FTE 4% 7% Diagnostics $8.52 Average Document Scan Time (in days) 3.3 3.8
KEY:
Health Care Appts. Missed due to Cusdody
54 $42.68 $93.17
6 Month Trend Most Recent Statewide
High Risk Patients
193%
85%
Statewide(excluding HQ)
ActualJan. 2012 % of Total
HIGH ADHERENCE LOW ADHERENCEMODERATE ADHERENCE *Per 1,000 inmates
$22.44
$0.73
$11.29
$17.55
$4.11
$30.24
$102.57
$21.17
$91.00
$8.197
6 Month Trend
Statewide
- Admin. Hospital Bed Days (per year) * -
MAJOR COSTS PER INMATE PER MONTH WORKLOAD PER DAY
2.5 Hospital Admissions*
Primary Care Provider (PCP)
YTD 11/12FY 10/11LABOR Feb. 20126 Month TrendStatewide(excluding HQ)
70%
STAFFING IN FULL TIME EQUIVALENTS (FTE)
Clinical Support FTE 3 109%
% of Auth.
91%
95%
Authorized Jan. 2012
Actual Jan. 2012
104%
92%
149%
78%
Statewide(excluding HQ)
67%
Prior Year Year Statewide
$6.24
Clinical Support Staff
$41.90
$130.55
Patient Encounters per Primary Mental Health Clinician
$6.34
$8.28
$50.86
$26.95
$70.70
$146.19
$18.46$6.91
77%
Flu Vaccination Mental Health Primary Clinician
Psychiatrist -
54%
30
7.3
OTHER TRENDS
$79.39
$327.36
156
144
4
6
-
172
9
71
3
28
3
29%80%
Specialty Appts via Telemedicine95% 79%
KEY: HIGH ADHERENCE LOW ADHERENCE
CCHCS
MODERATE ADHERENCE Per 1,000 inmates
RETURN TO DASHBOARD
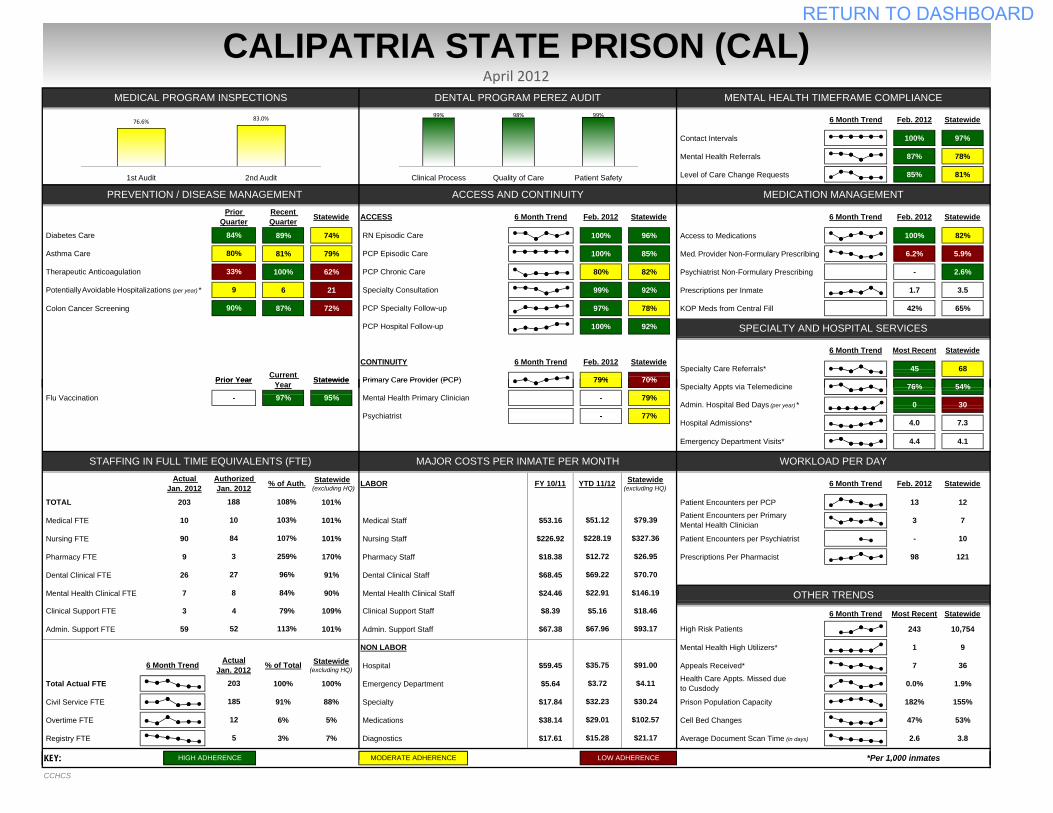
Contact Intervals 100% 97%
Mental Health Referrals 87% 78%
Level of Care Change Requests 85% 81%
89% 74% 100% 96% Access to Medications 100% 82%
81% 79% 100% 85% Med. Provider Non-Formulary Prescribing 6.2% 5.9%
100% 62% 80% 82% Psychiatrist Non-Formulary Prescribing - 2.6%
6 21 99% 92% Prescriptions per Inmate 1.7 3.5
Colon Cancer Screening 87% 72% 97% 78% KOP Meds from Central Fill 42% 65%
100% 92%
Prior Year Current Statewide Primary Care Provider (PCP)
Statewide
70%
Statewide
Statewide
Statewide
68 Specialty Care Referrals*
Potentially Avoidable Hospitalizations (per year) *
84%
80%
33%
9
Prior Quarter
90%
Statewide
PCP Chronic Care
6 Month Trend
PCP Specialty Follow-up
RN Episodic Care
PCP Episodic Care
Specialty Consultation
PREVENTION / DISEASE MANAGEMENT ACCESS AND CONTINUITY MEDICATION MANAGEMENT
Feb. 20126 Month Trend
MEDICAL PROGRAM INSPECTIONS DENTAL PROGRAM PEREZ AUDIT MENTAL HEALTH TIMEFRAME COMPLIANCE
Feb. 2012
45
CALIPATRIA STATE PRISON (CAL)April 2012
Most Recent
Feb. 20126 Month Trend
CONTINUITY 6 Month Trend Feb. 2012 Statewide
Therapeutic Anticoagulation
Asthma Care
Diabetes Care
6 Month Trend
SPECIALTY AND HOSPITAL SERVICES
79%
Recent Quarter ACCESS
PCP Hospital Follow-up
99% 98% 99%
Clinical Process Quality of Care Patient Safety
76.6% 83.0%
1st Audit 2nd Audit
Emergency Department Visits* 4.4 4.1
TOTAL 203 101% Patient Encounters per PCP 13 12
Medical FTE 10 101% Medical Staff $53.16 3 7
Nursing FTE 90 101% Nursing Staff $226.92 Patient Encounters per Psychiatrist - 10
Pharmacy FTE 9 170% Pharmacy Staff $18.38 Prescriptions Per Pharmacist 98 121
Dental Clinical FTE 26 91% Dental Clinical Staff $68.45
Mental Health Clinical FTE 7 90% Mental Health Clinical Staff $24.46
Admin. Support FTE 59 101% Admin. Support Staff $67.38 243 10,754
NON LABOR Mental Health High Utilizers* 1 9
Hospital $59.45 Appeals Received* 7 36
Total Actual FTE 100% 100% Emergency Department $5.64 0.0% 1.9%
Civil Service FTE 91% 88% Specialty $17.84 Prison Population Capacity 182% 155%
Overtime FTE 6% 5% Medications $38.14 Cell Bed Changes 47% 53%
Registry FTE 3% 7% Diagnostics $17.61 Average Document Scan Time (in days) 2.6 3.8
KEY:
12
5
6 Month Trend ActualJan. 2012
Prior Year Year Statewide
185
Primary Care Provider (PCP)
Mental Health Primary Clinician
Psychiatrist
$5.16
Authorized Jan. 2012
Actual Jan. 2012
103%
Statewide(excluding HQ)
Statewide(excluding HQ)
Statewide(excluding HQ)
$12.72
$69.22
52 $67.96 $93.17
107%
259%
96%
84%
203
108%
High Risk Patients
79%
% of Total
113%
HIGH ADHERENCE LOW ADHERENCEMODERATE ADHERENCE *Per 1,000 inmates
$35.75
$3.72
$32.23
$29.01
$4.11
$30.24
$102.57
$21.17
$91.00
$15.28
Health Care Appts. Missed due to Cusdody
70%
79%
77%
54%
30
7.3
Statewide
- Admin. Hospital Bed Days (per year) * 0
MAJOR COSTS PER INMATE PER MONTH WORKLOAD PER DAY
3
-
188
10
84
3
27
8
STAFFING IN FULL TIME EQUIVALENTS (FTE)
Clinical Support FTE 4 109%
% of Auth.
95%97%
OTHER TRENDS$22.91
Clinical Support Staff
$51.12
$228.19
Patient Encounters per Primary Mental Health Clinician
$8.39 6 Month Trend Most Recent Statewide
$79.39
$327.36
$26.95
$70.70
$146.19
$18.46
-
YTD 11/12FY 10/11LABOR Feb. 20126 Month Trend
Hospital Admissions* 4.0
76%79%
Specialty Appts via Telemedicine Flu Vaccination
KEY: HIGH ADHERENCE LOW ADHERENCE
CCHCS
MODERATE ADHERENCE Per 1,000 inmates
RETURN TO DASHBOARD
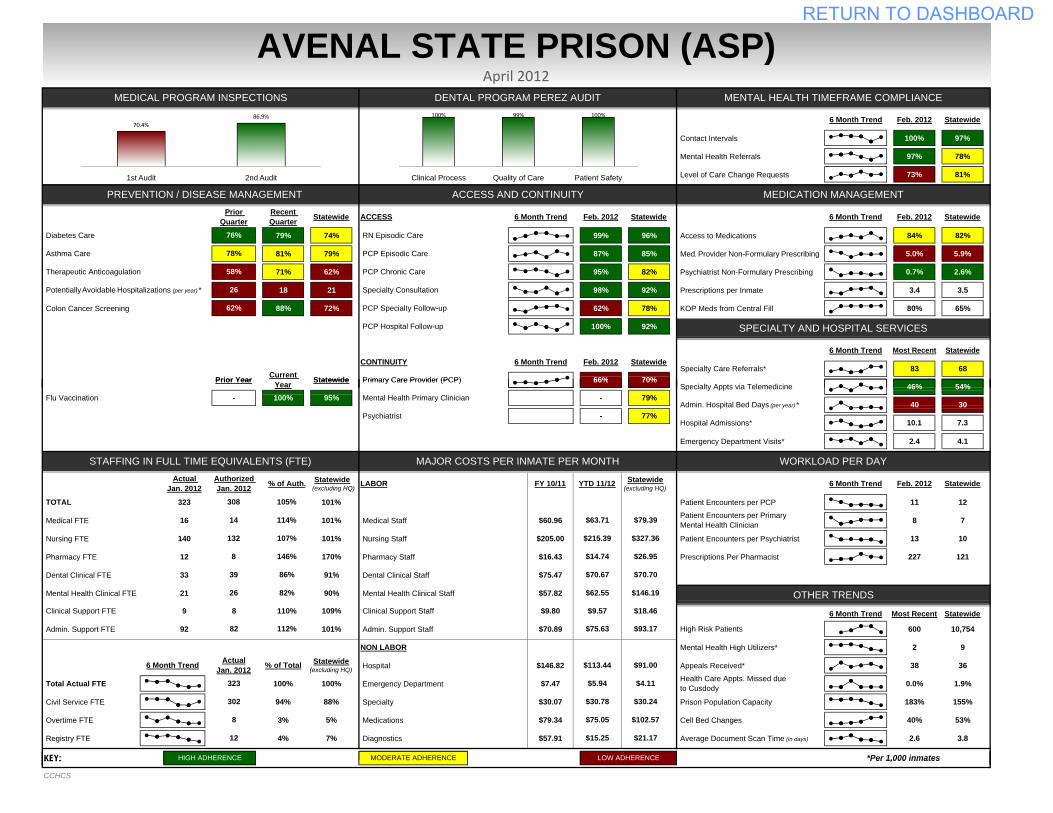
Contact Intervals 100% 97%
Mental Health Referrals 97% 78%
Level of Care Change Requests 73% 81%
79% 74% 99% 96% Access to Medications 84% 82%
81% 79% 87% 85% Med. Provider Non-Formulary Prescribing 5.0% 5.9%
71% 62% 95% 82% Psychiatrist Non-Formulary Prescribing 0.7% 2.6%
18 21 98% 92% Prescriptions per Inmate 3.4 3.5
Colon Cancer Screening 88% 72% 62% 78% KOP Meds from Central Fill 80% 65%
100% 92%
ACCESS
AVENAL STATE PRISON (ASP)April 2012
Most Recent
Feb. 20126 Month Trend
CONTINUITY 6 Month Trend Feb. 2012 Statewide
Therapeutic Anticoagulation
Asthma Care
Diabetes Care
6 Month Trend
SPECIALTY AND HOSPITAL SERVICES
66%Primary Care Provider (PCP)83
PREVENTION / DISEASE MANAGEMENT ACCESS AND CONTINUITY MEDICATION MANAGEMENT
Feb. 20126 Month Trend
MEDICAL PROGRAM INSPECTIONS DENTAL PROGRAM PEREZ AUDIT MENTAL HEALTH TIMEFRAME COMPLIANCE
Statewide
Potentially Avoidable Hospitalizations (per year) *
76%
78%
58%
26
Prior Quarter
62%
StatewideRecent Quarter Statewide
Statewide
68 Specialty Care Referrals*
Feb. 2012
PCP Chronic Care
6 Month Trend
PCP Hospital Follow-up
Statewide
70%
PCP Specialty Follow-up
RN Episodic Care
PCP Episodic Care
Specialty Consultation
Prior Year Current Statewide
100% 99% 100%
Clinical Process Quality of Care Patient Safety
70.4%86.9%
1st Audit 2nd Audit
Emergency Department Visits* 2.4 4.1
TOTAL 323 101% Patient Encounters per PCP 11 12
Medical FTE 16 101% Medical Staff $60.96 8 7
Nursing FTE 140 101% Nursing Staff $205.00 Patient Encounters per Psychiatrist 13 10
Pharmacy FTE 12 170% Pharmacy Staff $16.43 Prescriptions Per Pharmacist 227 121
Dental Clinical FTE 33 91% Dental Clinical Staff $75.47
Mental Health Clinical FTE 21 90% Mental Health Clinical Staff $57.82
Admin. Support FTE 92 101% Admin. Support Staff $70.89 600 10,754
NON LABOR Mental Health High Utilizers* 2 9
Hospital $146.82 Appeals Received* 38 36
Total Actual FTE 100% 100% Emergency Department $7.47 0.0% 1.9%
Civil Service FTE 94% 88% Specialty $30.07 Prison Population Capacity 183% 155%
Overtime FTE 3% 5% Medications $79.34 Cell Bed Changes 40% 53%
Registry FTE 4% 7% Diagnostics $57.91 Average Document Scan Time (in days) 2.6 3.8
KEY:
$9.57$9.80
46%66%
Specialty Appts via TelemedicinePrimary Care Provider (PCP)
Mental Health Primary Clinician
Psychiatrist -
YTD 11/12FY 10/11LABOR Feb. 20126 Month TrendStatewide(excluding HQ)
9
-
308
14
132
8
39
26
STAFFING IN FULL TIME EQUIVALENTS (FTE)
Clinical Support FTE 8 109%
% of Auth.
105%
54%
30
7.3
Statewide
- Admin. Hospital Bed Days (per year) * 40
MAJOR COSTS PER INMATE PER MONTH WORKLOAD PER DAY
10.1 Hospital Admissions*
Statewide(excluding HQ)
Health Care Appts. Missed due to Cusdody
% of Total
70%
79%
77%
Patient Encounters per Primary Mental Health Clinician$79.39
$327.36
$26.95
$70.70
$146.19
$18.46
82%
Clinical Support Staff
Statewide(excluding HQ)
HIGH ADHERENCE LOW ADHERENCEMODERATE ADHERENCE *Per 1,000 inmates
$113.44
$5.94
$30.78
$75.05
$4.11
$30.24
$102.57
$21.17
$91.00
$15.25
$14.74
$70.67
95%100%
$63.71
$215.39
Authorized Jan. 2012
Actual Jan. 2012
114%
107%
146%
86%
Flu Vaccination
Prior Year Year Statewide
OTHER TRENDS$62.55
ActualJan. 20126 Month Trend
323
302
8
12
82 $75.63 $93.17
6 Month Trend Most Recent Statewide
High Risk Patients
110%
112%
KEY: HIGH ADHERENCE LOW ADHERENCE
CCHCS
MODERATE ADHERENCE Per 1,000 inmates
RETURN TO DASHBOARD

CALIFORNIA CORRECTIONAL HEALTH CARE SERVICES DASHBOARD GLOSSARY
Measure Goal Definition Sources
MEDICAL PROGRAM INSPECTIONS
Overall Score
Goal: >85% adherence
The Office of the Inspector General (OIG) uses a series of “yes” or “no” questions to determine adherence in 20 components of medical delivery (e.g., Chronic Care). Each inspection question is weighted and scored by calculating the percentage of “yes” answers for each question from all items sampled. That percentage is then multiplied by the question’s weight to arrive at a weighted score. The total score is calculated by summing the number of weighted subject points earned and dividing that value by the overall number of weighted points possible. Reported percentages reflect the most recent OIG inspection results. See OIG website for details: http://www.oig.ca.gov/pages/reports/medical‐inspections.php.
OIG Medical Inspection Results
High: >85% Moderate:75%‐84% Low: <75%
DENTAL PROGRAM AUDIT
Clinical Process Pass > 75% Percentage adherence to standards in the Clinical Process category of the Perez Court Expert Dental Audit Tool.
Perez Court Expert Dental Audit Tool
Fail < 75%
Quality of Care Pass >80% Percentage adherence to standards in the Quality of Care category of the Perez Court Expert Dental Audit Tool.
Fail < 80%
Patient Safety Pass >90% Percentage adherence to standards in the Patient Safety category of the Perez Court Expert Dental Audit Tool.Fail < 90%
MENTAL HEALTH TIMEFRAME COMPLIANCE
Contact Intervals High: >85% Percentage adherence to the Mental Health Services Delivery System’s (MHSDS) inmate‐patient contact timeframes. Compliance is measured weekly through MHSDS and include routine Interdisciplinary Treatment Team (IDTT), psychiatrist, and primary clinician (PC) contacts. Aggregated percentage adherence represents adherence to contact type timeframes for each care program and housing placement [limited to Correctional Clinical Case Management System (CCCMS), Enhanced Outpatient Program (EOP), housed in Mainline (ML) or the Reception Center (RC)].
Mental Health Tracking System Moderate:75%‐84%
Low: <75%
Mental Health Referrals
Percentage adherence to timeframe requirements for entry into MHSDS, as defined by the MHSDS Program Guide.
Level of Care Change Requests
Percentage adherence to timeframe requirements related to requests for Level of Care Changes for the following MHSDS areas: Correctional Clinical Case Management System (CCCMS), Enhanced Outpatient Program (EOP), and Mental Health Crisis Beds (MHCB) as defined by the MHSDS Program Guide.
1
RETURN TO DASHBOARD
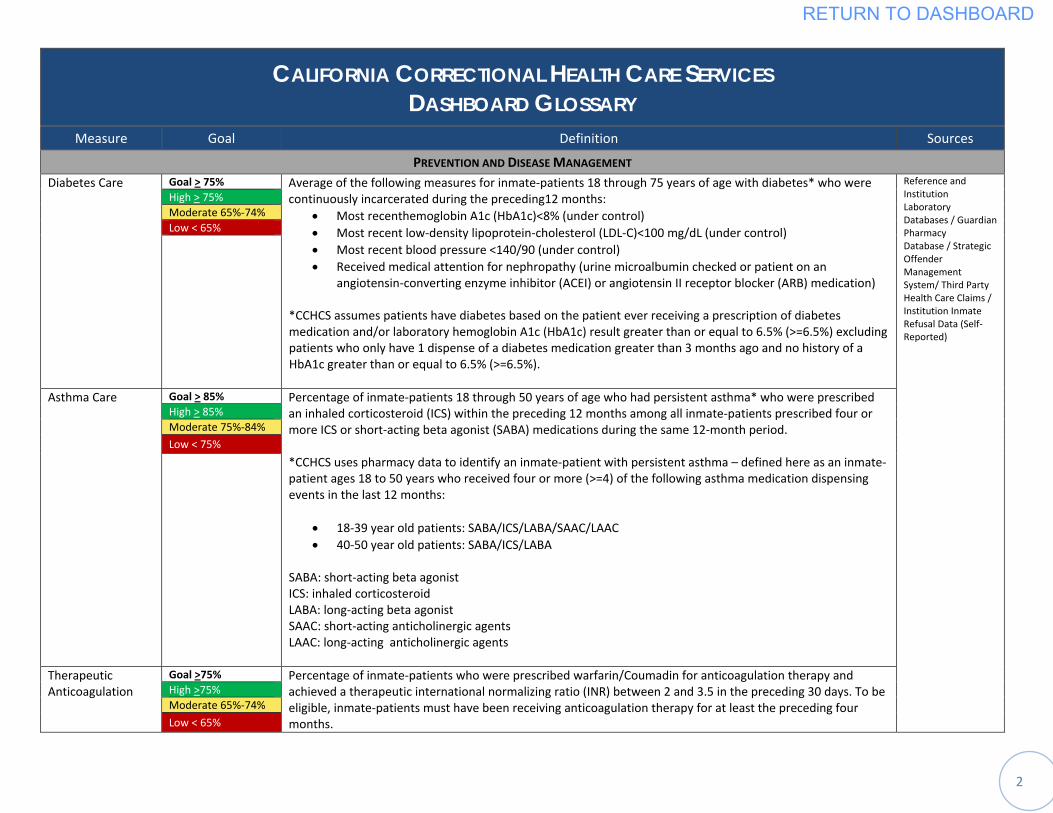
2
CALIFORNIA CORRECTIONAL HEALTH CARE SERVICES DASHBOARD GLOSSARY
Measure Goal Definition Sources
PREVENTION AND DISEASE MANAGEMENT
Diabetes Care
Goal > 75% Average of the following measures for inmate‐patients 18 through 75 years of age with diabetes* who were continuously incarcerated during the preceding12 months:
• Most recenthemoglobin A1c (HbA1c)<8% (under control) • Most recent low‐density lipoprotein‐cholesterol (LDL‐C)<100 mg/dL (under control) • Most recent blood pressure <140/90 (under control) • Received medical attention for nephropathy (urine microalbumin checked or patient on an
angiotensin‐converting enzyme inhibitor (ACEI) or angiotensin II receptor blocker (ARB) medication) *CCHCS assumes patients have diabetes based on the patient ever receiving a prescription of diabetes medication and/or laboratory hemoglobin A1c (HbA1c) result greater than or equal to 6.5% (>=6.5%) excluding patients who only have 1 dispense of a diabetes medication greater than 3 months ago and no history of a HbA1c greater than or equal to 6.5% (>=6.5%).
Reference and Institution Laboratory Databases / Guardian Pharmacy Database / Strategic Offender Management System/ Third Party Health Care Claims / Institution Inmate Refusal Data (Self‐Reported)
High > 75% Moderate 65%‐74% Low < 65%
Asthma Care Goal > 85% Percentage of inmate‐patients 18 through 50 years of age who had persistent asthma* who were prescribed an inhaled corticosteroid (ICS) within the preceding 12 months among all inmate‐patients prescribed four or more ICS or short‐acting beta agonist (SABA) medications during the same 12‐month period. *CCHCS uses pharmacy data to identify an inmate‐patient with persistent asthma – defined here as an inmate‐patient ages 18 to 50 years who received four or more (>=4) of the following asthma medication dispensing events in the last 12 months:
• 18‐39 year old patients: SABA/ICS/LABA/SAAC/LAAC • 40‐50 year old patients: SABA/ICS/LABA
SABA: short‐acting beta agonist ICS: inhaled corticosteroid LABA: long‐acting beta agonist SAAC: short‐acting anticholinergic agents LAAC: long‐acting anticholinergic agents
High > 85% Moderate 75%‐84%
Low < 75%
Therapeutic Anticoagulation
Goal >75% Percentage of inmate‐patients who were prescribed warfarin/Coumadin for anticoagulation therapy and achieved a therapeutic international normalizing ratio (INR) between 2 and 3.5 in the preceding 30 days. To be eligible, inmate‐patients must have been receiving anticoagulation therapy for at least the preceding four months.
High >75% Moderate 65%‐74%
Low < 65%
RETURN TO DASHBOARD
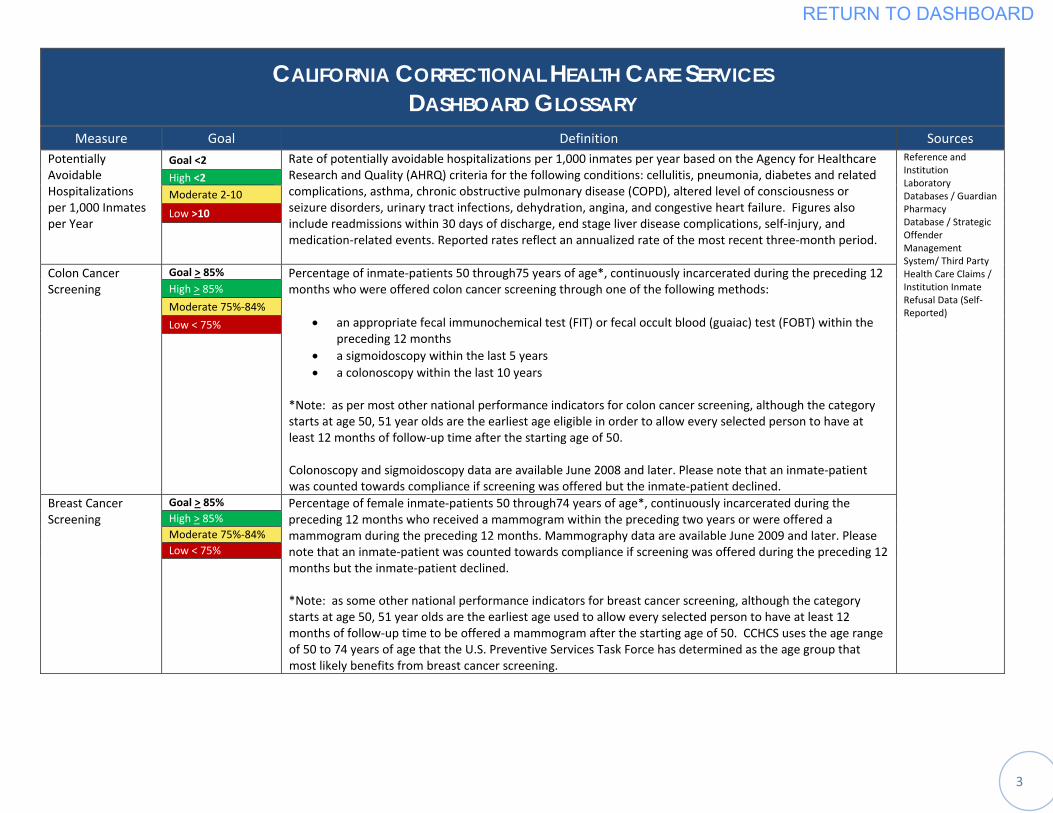
3
CALIFORNIA CORRECTIONAL HEALTH CARE SERVICES DASHBOARD GLOSSARY
Measure Goal Definition Sources Potentially Avoidable Hospitalizations per 1,000 Inmates per Year
Goal <2 Rate of potentially avoidable hospitalizations per 1,000 inmates per year based on the Agency for Healthcare Research and Quality (AHRQ) criteria for the following conditions: cellulitis, pneumonia, diabetes and related complications, asthma, chronic obstructive pulmonary disease (COPD), altered level of consciousness or seizure disorders, urinary tract infections, dehydration, angina, and congestive heart failure. Figures also include readmissions within 30 days of discharge, end stage liver disease complications, self‐injury, and medication‐related events. Reported rates reflect an annualized rate of the most recent three‐month period.
Reference and Institution Laboratory Databases / Guardian Pharmacy Database / Strategic Offender Management System/ Third Party Health Care Claims / Institution Inmate Refusal Data (Self‐Reported)
High <2 Moderate 2‐10
Low >10
Colon Cancer Screening
Goal > 85% Percentage of inmate‐patients 50 through75 years of age*, continuously incarcerated during the preceding 12 months who were offered colon cancer screening through one of the following methods:
• an appropriate fecal immunochemical test (FIT) or fecal occult blood (guaiac) test (FOBT) within the preceding 12 months
• a sigmoidoscopy within the last 5 years • a colonoscopy within the last 10 years
*Note: as per most other national performance indicators for colon cancer screening, although the category starts at age 50, 51 year olds are the earliest age eligible in order to allow every selected person to have at least 12 months of follow‐up time after the starting age of 50. Colonoscopy and sigmoidoscopy data are available June 2008 and later. Please note that an inmate‐patient was counted towards compliance if screening was offered but the inmate‐patient declined.
High > 85%
Moderate 75%‐84%
Low < 75%
Breast Cancer Screening
Goal > 85% Percentage of female inmate‐patients 50 through74 years of age*, continuously incarcerated during the preceding 12 months who received a mammogram within the preceding two years or were offered a mammogram during the preceding 12 months. Mammography data are available June 2009 and later. Please note that an inmate‐patient was counted towards compliance if screening was offered during the preceding 12 months but the inmate‐patient declined. *Note: as some other national performance indicators for breast cancer screening, although the category starts at age 50, 51 year olds are the earliest age used to allow every selected person to have at least 12 months of follow‐up time to be offered a mammogram after the starting age of 50. CCHCS uses the age range of 50 to 74 years of age that the U.S. Preventive Services Task Force has determined as the age group that most likely benefits from breast cancer screening.
High > 85% Moderate 75%‐84% Low < 75%
RETURN TO DASHBOARD
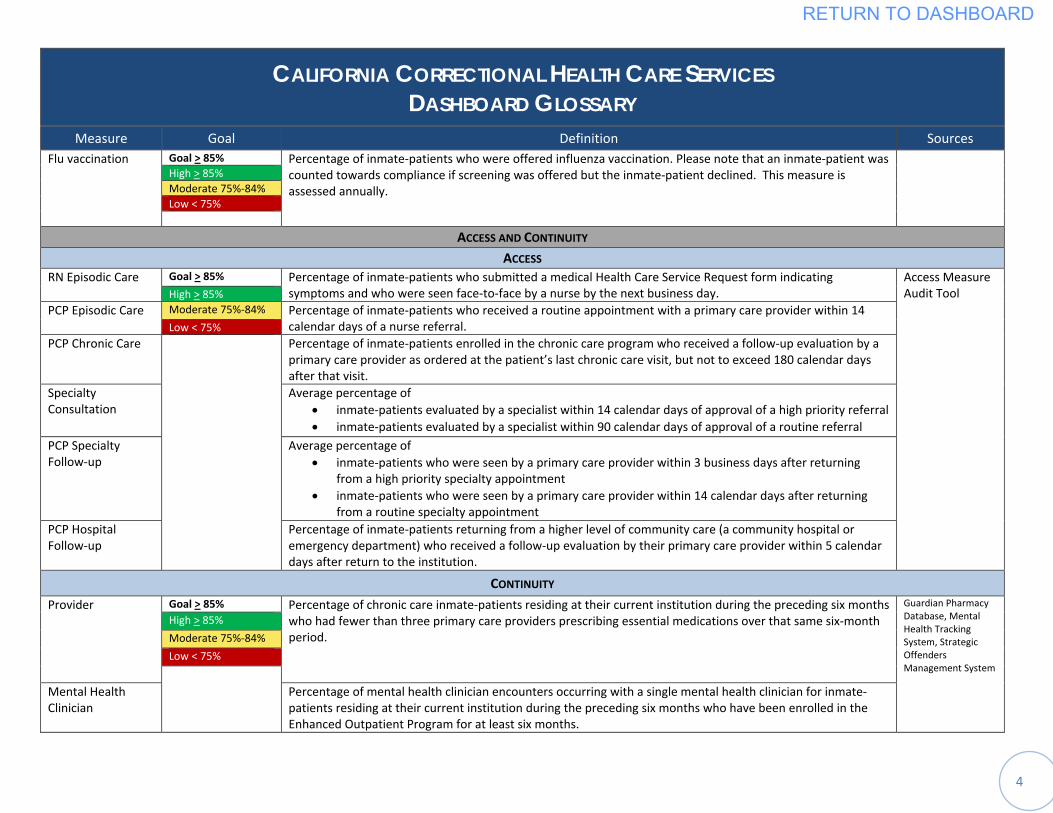
4
CALIFORNIA CORRECTIONAL HEALTH CARE SERVICES DASHBOARD GLOSSARY
Measure Goal Definition Sources Flu vaccination Goal > 85% Percentage of inmate‐patients who were offered influenza vaccination. Please note that an inmate‐patient was
counted towards compliance if screening was offered but the inmate‐patient declined. This measure is assessed annually.
High > 85% Moderate 75%‐84% Low < 75%
ACCESS AND CONTINUITY ACCESS
RN Episodic Care Goal > 85% Percentage of inmate‐patients who submitted a medical Health Care Service Request form indicating symptoms and who were seen face‐to‐face by a nurse by the next business day.
Access Measure Audit Tool High > 85%
PCP Episodic Care Moderate 75%‐84% Percentage of inmate‐patients who received a routine appointment with a primary care provider within 14 calendar days of a nurse referral. Low < 75%
PCP Chronic Care Percentage of inmate‐patients enrolled in the chronic care program who received a follow‐up evaluation by a primary care provider as ordered at the patient’s last chronic care visit, but not to exceed 180 calendar days after that visit.
Specialty Consultation
Average percentage of • inmate‐patients evaluated by a specialist within 14 calendar days of approval of a high priority referral • inmate‐patients evaluated by a specialist within 90 calendar days of approval of a routine referral
PCP Specialty Follow‐up
Average percentage of • inmate‐patients who were seen by a primary care provider within 3 business days after returning
from a high priority specialty appointment • inmate‐patients who were seen by a primary care provider within 14 calendar days after returning
from a routine specialty appointment PCP Hospital Follow‐up
Percentage of inmate‐patients returning from a higher level of community care (a community hospital or emergency department) who received a follow‐up evaluation by their primary care provider within 5 calendar days after return to the institution.
CONTINUITY Provider Goal > 85% Percentage of chronic care inmate‐patients residing at their current institution during the preceding six months
who had fewer than three primary care providers prescribing essential medications over that same six‐month period.
Guardian Pharmacy Database, Mental Health Tracking System, Strategic Offenders Management System
High > 85%
Moderate 75%‐84%
Low < 75%
Mental Health Clinician
Percentage of mental health clinician encounters occurring with a single mental health clinician for inmate‐patients residing at their current institution during the preceding six months who have been enrolled in the Enhanced Outpatient Program for at least six months.
RETURN TO DASHBOARD
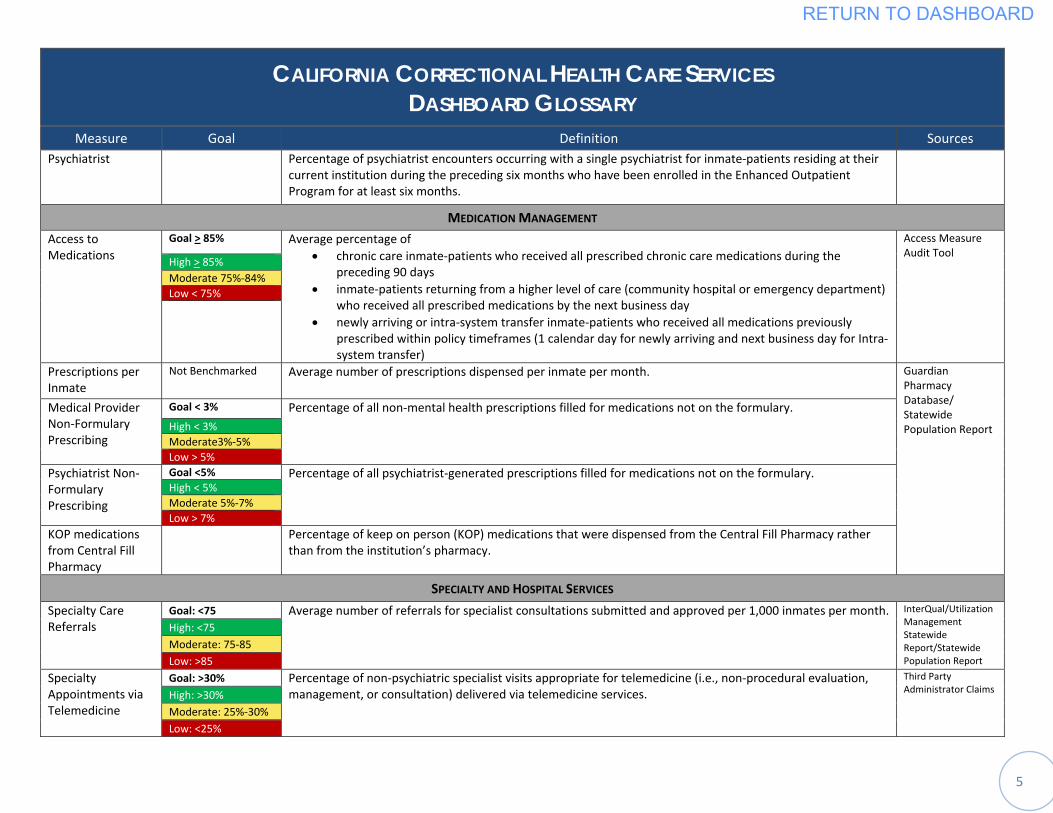
5
CALIFORNIA CORRECTIONAL HEALTH CARE SERVICES DASHBOARD GLOSSARY
Measure Goal Definition Sources Psychiatrist Percentage of psychiatrist encounters occurring with a single psychiatrist for inmate‐patients residing at their
current institution during the preceding six months who have been enrolled in the Enhanced Outpatient Program for at least six months.
MEDICATION MANAGEMENT Access to Medications
Goal > 85% Average percentage of • chronic care inmate‐patients who received all prescribed chronic care medications during the
preceding 90 days • inmate‐patients returning from a higher level of care (community hospital or emergency department)
who received all prescribed medications by the next business day • newly arriving or intra‐system transfer inmate‐patients who received all medications previously
prescribed within policy timeframes (1 calendar day for newly arriving and next business day for Intra‐system transfer)
Access Measure Audit Tool
High > 85% Moderate 75%‐84% Low < 75%
Prescriptions per Inmate
Not Benchmarked Average number of prescriptions dispensed per inmate per month.
Guardian Pharmacy Database/ Statewide Population Report
Medical Provider Non‐Formulary Prescribing
Goal < 3% Percentage of all non‐mental health prescriptions filled for medications not on the formulary.High < 3% Moderate3%‐5% Low > 5%
Psychiatrist Non‐Formulary Prescribing
Goal <5% Percentage of all psychiatrist‐generated prescriptions filled for medications not on the formulary.High < 5% Moderate 5%‐7% Low > 7%
KOP medications from Central Fill Pharmacy
Percentage of keep on person (KOP) medications that were dispensed from the Central Fill Pharmacy rather than from the institution’s pharmacy.
SPECIALTY AND HOSPITAL SERVICES
Specialty Care Referrals
Goal: <75 Average number of referrals for specialist consultations submitted and approved per 1,000 inmates per month. InterQual/Utilization Management Statewide Report/Statewide Population Report
High: <75 Moderate: 75‐85 Low: >85
Specialty Appointments via Telemedicine
Goal: >30% Percentage of non‐psychiatric specialist visits appropriate for telemedicine (i.e., non‐procedural evaluation, management, or consultation) delivered via telemedicine services.
Third Party Administrator Claims High: >30%
Moderate: 25%‐30% Low: <25%
RETURN TO DASHBOARD
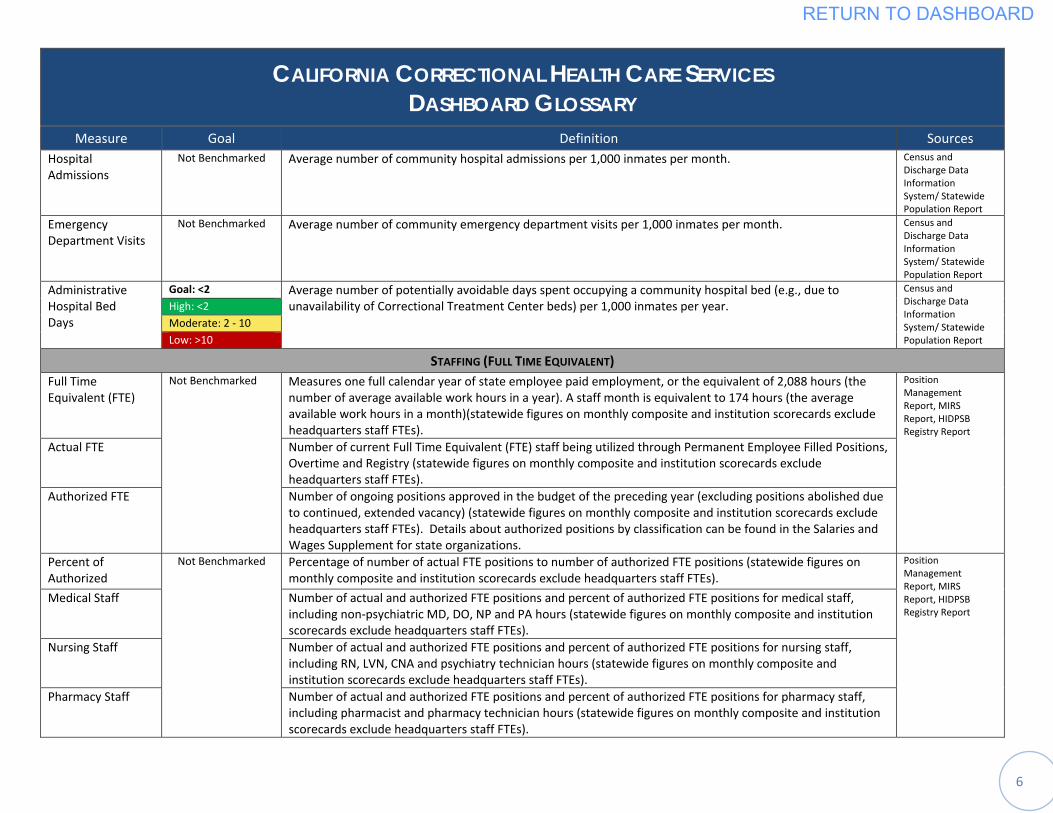
6
CALIFORNIA CORRECTIONAL HEALTH CARE SERVICES DASHBOARD GLOSSARY
Measure Goal Definition Sources Hospital Admissions
Not Benchmarked Average number of community hospital admissions per 1,000 inmates per month.
Census and Discharge Data Information System/ Statewide Population Report
Emergency Department Visits
Not Benchmarked Average number of community emergency department visits per 1,000 inmates per month. Census and Discharge Data Information System/ Statewide Population Report
Administrative Hospital Bed Days
Goal: <2 Average number of potentially avoidable days spent occupying a community hospital bed (e.g., due to unavailability of Correctional Treatment Center beds) per 1,000 inmates per year.
Census and Discharge Data Information System/ Statewide Population Report
High: <2 Moderate: 2 ‐ 10 Low: >10
STAFFING (FULL TIME EQUIVALENT) Full Time Equivalent (FTE)
Not Benchmarked
Measures one full calendar year of state employee paid employment, or the equivalent of 2,088 hours (the number of average available work hours in a year). A staff month is equivalent to 174 hours (the average available work hours in a month)(statewide figures on monthly composite and institution scorecards exclude headquarters staff FTEs).
PositionManagement Report, MIRS Report, HIDPSB Registry Report
Actual FTE Number of current Full Time Equivalent (FTE) staff being utilized through Permanent Employee Filled Positions, Overtime and Registry (statewide figures on monthly composite and institution scorecards exclude headquarters staff FTEs).
Authorized FTE Number of ongoing positions approved in the budget of the preceding year (excluding positions abolished due to continued, extended vacancy) (statewide figures on monthly composite and institution scorecards exclude headquarters staff FTEs). Details about authorized positions by classification can be found in the Salaries and Wages Supplement for state organizations.
Percent of Authorized
Not Benchmarked Percentage of number of actual FTE positions to number of authorized FTE positions (statewide figures on monthly composite and institution scorecards exclude headquarters staff FTEs).
PositionManagement Report, MIRS Report, HIDPSB Registry Report
Medical Staff Number of actual and authorized FTE positions and percent of authorized FTE positions for medical staff, including non‐psychiatric MD, DO, NP and PA hours (statewide figures on monthly composite and institution scorecards exclude headquarters staff FTEs).
Nursing Staff Number of actual and authorized FTE positions and percent of authorized FTE positions for nursing staff, including RN, LVN, CNA and psychiatry technician hours (statewide figures on monthly composite and institution scorecards exclude headquarters staff FTEs).
Pharmacy Staff Number of actual and authorized FTE positions and percent of authorized FTE positions for pharmacy staff, including pharmacist and pharmacy technician hours (statewide figures on monthly composite and institution scorecards exclude headquarters staff FTEs).
RETURN TO DASHBOARD
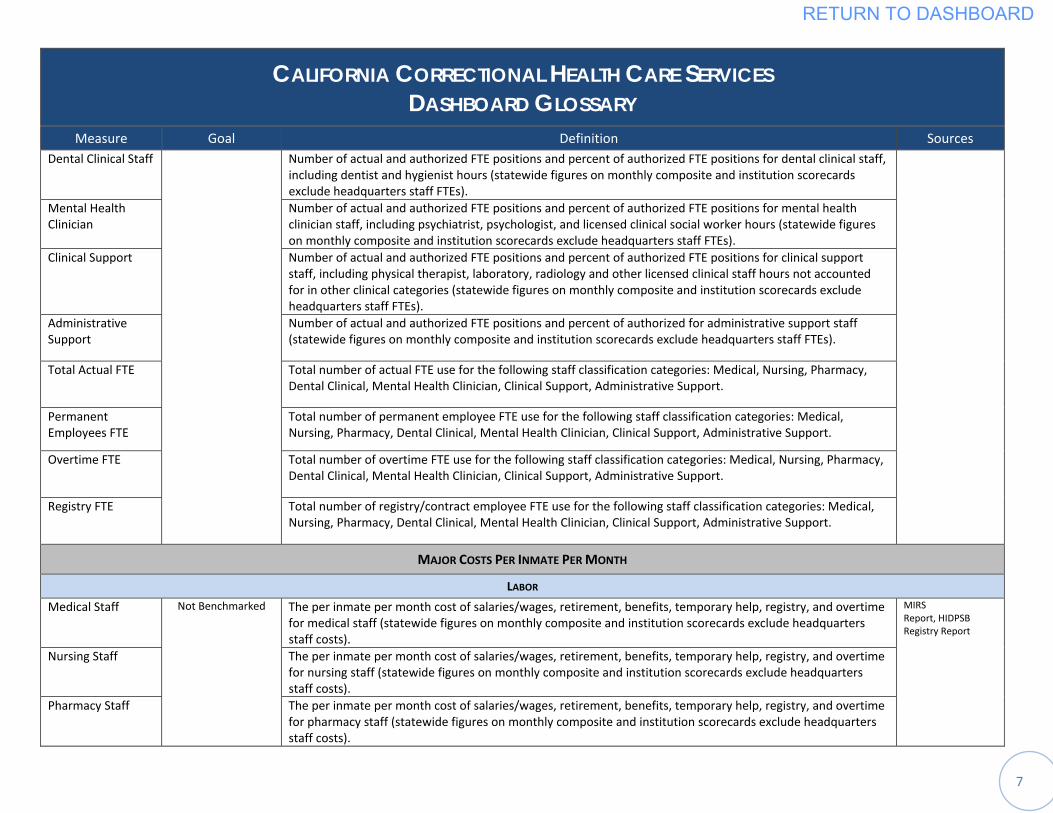
7
CALIFORNIA CORRECTIONAL HEALTH CARE SERVICES DASHBOARD GLOSSARY
Measure Goal Definition Sources Dental Clinical Staff Number of actual and authorized FTE positions and percent of authorized FTE positions for dental clinical staff,
including dentist and hygienist hours (statewide figures on monthly composite and institution scorecards exclude headquarters staff FTEs).
Mental Health Clinician
Number of actual and authorized FTE positions and percent of authorized FTE positions for mental health clinician staff, including psychiatrist, psychologist, and licensed clinical social worker hours (statewide figures on monthly composite and institution scorecards exclude headquarters staff FTEs).
Clinical Support Number of actual and authorized FTE positions and percent of authorized FTE positions for clinical support staff, including physical therapist, laboratory, radiology and other licensed clinical staff hours not accounted for in other clinical categories (statewide figures on monthly composite and institution scorecards exclude headquarters staff FTEs).
Administrative Support
Number of actual and authorized FTE positions and percent of authorized for administrative support staff(statewide figures on monthly composite and institution scorecards exclude headquarters staff FTEs).
Total Actual FTE Total number of actual FTE use for the following staff classification categories: Medical, Nursing, Pharmacy, Dental Clinical, Mental Health Clinician, Clinical Support, Administrative Support.
Permanent Employees FTE
Total number of permanent employee FTE use for the following staff classification categories: Medical, Nursing, Pharmacy, Dental Clinical, Mental Health Clinician, Clinical Support, Administrative Support.
Overtime FTE Total number of overtime FTE use for the following staff classification categories: Medical, Nursing, Pharmacy, Dental Clinical, Mental Health Clinician, Clinical Support, Administrative Support.
Registry FTE Total number of registry/contract employee FTE use for the following staff classification categories: Medical, Nursing, Pharmacy, Dental Clinical, Mental Health Clinician, Clinical Support, Administrative Support.
MAJOR COSTS PER INMATE PER MONTH
LABOR
Medical Staff Not Benchmarked The per inmate per month cost of salaries/wages, retirement, benefits, temporary help, registry, and overtime for medical staff (statewide figures on monthly composite and institution scorecards exclude headquarters staff costs).
MIRSReport, HIDPSB Registry Report
Nursing Staff The per inmate per month cost of salaries/wages, retirement, benefits, temporary help, registry, and overtime for nursing staff (statewide figures on monthly composite and institution scorecards exclude headquarters staff costs).
Pharmacy Staff The per inmate per month cost of salaries/wages, retirement, benefits, temporary help, registry, and overtime for pharmacy staff (statewide figures on monthly composite and institution scorecards exclude headquarters staff costs).
RETURN TO DASHBOARD
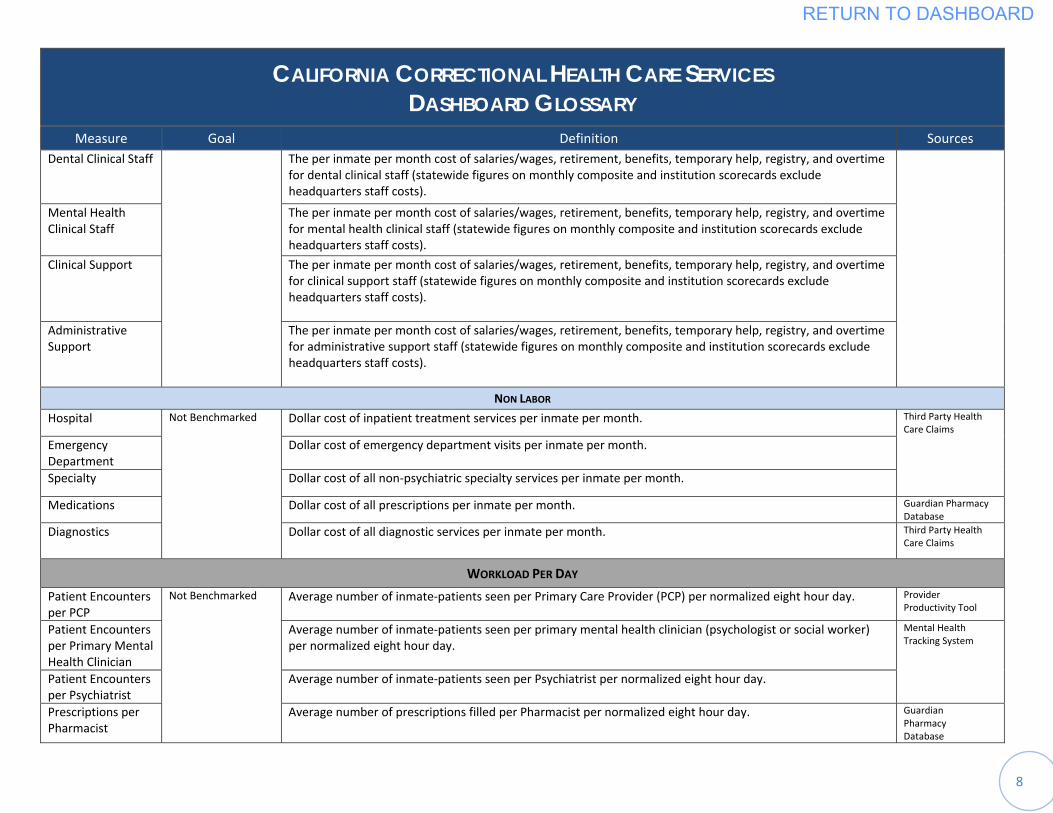
8
CALIFORNIA CORRECTIONAL HEALTH CARE SERVICES DASHBOARD GLOSSARY
Measure Goal Definition Sources Dental Clinical Staff The per inmate per month cost of salaries/wages, retirement, benefits, temporary help, registry, and overtime
for dental clinical staff (statewide figures on monthly composite and institution scorecards exclude headquarters staff costs).
Mental Health Clinical Staff
The per inmate per month cost of salaries/wages, retirement, benefits, temporary help, registry, and overtime for mental health clinical staff (statewide figures on monthly composite and institution scorecards exclude headquarters staff costs).
Clinical Support The per inmate per month cost of salaries/wages, retirement, benefits, temporary help, registry, and overtime for clinical support staff (statewide figures on monthly composite and institution scorecards exclude headquarters staff costs).
Administrative Support
The per inmate per month cost of salaries/wages, retirement, benefits, temporary help, registry, and overtime for administrative support staff (statewide figures on monthly composite and institution scorecards exclude headquarters staff costs).
NON LABOR
Hospital Not Benchmarked
Dollar cost of inpatient treatment services per inmate per month. Third Party Health Care Claims
Emergency Department
Dollar cost of emergency department visits per inmate per month.
Specialty Dollar cost of all non‐psychiatric specialty services per inmate per month.
Medications Dollar cost of all prescriptions per inmate per month. Guardian Pharmacy Database
Diagnostics Dollar cost of all diagnostic services per inmate per month. Third Party Health Care Claims
WORKLOAD PER DAY
Patient Encounters per PCP
Not Benchmarked Average number of inmate‐patients seen per Primary Care Provider (PCP) per normalized eight hour day. Provider Productivity Tool
Patient Encounters per Primary Mental Health Clinician
Average number of inmate‐patients seen per primary mental health clinician (psychologist or social worker) per normalized eight hour day.
Mental Health Tracking System
Patient Encounters per Psychiatrist
Average number of inmate‐patients seen per Psychiatrist per normalized eight hour day.
Prescriptions per Pharmacist
Average number of prescriptions filled per Pharmacist per normalized eight hour day. Guardian Pharmacy Database
RETURN TO DASHBOARD
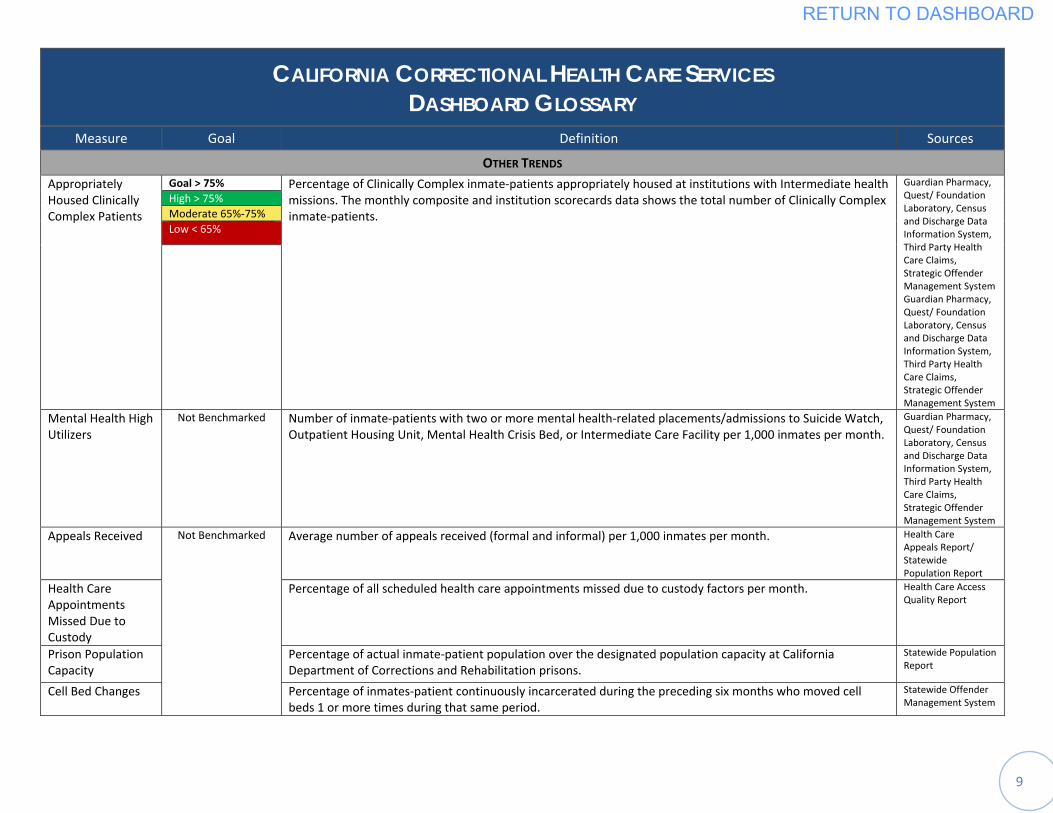
9
CALIFORNIA CORRECTIONAL HEALTH CARE SERVICES DASHBOARD GLOSSARY
Measure Goal Definition Sources
OTHER TRENDS Appropriately Housed Clinically Complex Patients
Goal > 75% Percentage of Clinically Complex inmate‐patients appropriately housed at institutions with Intermediate health missions. The monthly composite and institution scorecards data shows the total number of Clinically Complex inmate‐patients.
Guardian Pharmacy, Quest/ Foundation Laboratory, Census and Discharge Data Information System, Third Party Health Care Claims, Strategic Offender Management System Guardian Pharmacy, Quest/ Foundation Laboratory, Census and Discharge Data Information System, Third Party Health Care Claims, Strategic Offender Management System
High > 75% Moderate 65%‐75% Low < 65%
Mental Health High Utilizers
Not Benchmarked
Number of inmate‐patients with two or more mental health‐related placements/admissions to Suicide Watch, Outpatient Housing Unit, Mental Health Crisis Bed, or Intermediate Care Facility per 1,000 inmates per month.
Guardian Pharmacy, Quest/ Foundation Laboratory, Census and Discharge Data Information System, Third Party Health Care Claims, Strategic Offender Management System
Appeals Received
Not Benchmarked Average number of appeals received (formal and informal) per 1,000 inmates per month. Health Care Appeals Report/ Statewide Population Report
Health Care Appointments Missed Due to Custody
Percentage of all scheduled health care appointments missed due to custody factors per month.
Health Care Access Quality Report
Prison Population Capacity
Percentage of actual inmate‐patient population over the designated population capacity at California Department of Corrections and Rehabilitation prisons.
Statewide Population Report
Cell Bed Changes Percentage of inmates‐patient continuously incarcerated during the preceding six months who moved cell beds 1 or more times during that same period.
Statewide Offender Management System
RETURN TO DASHBOARD
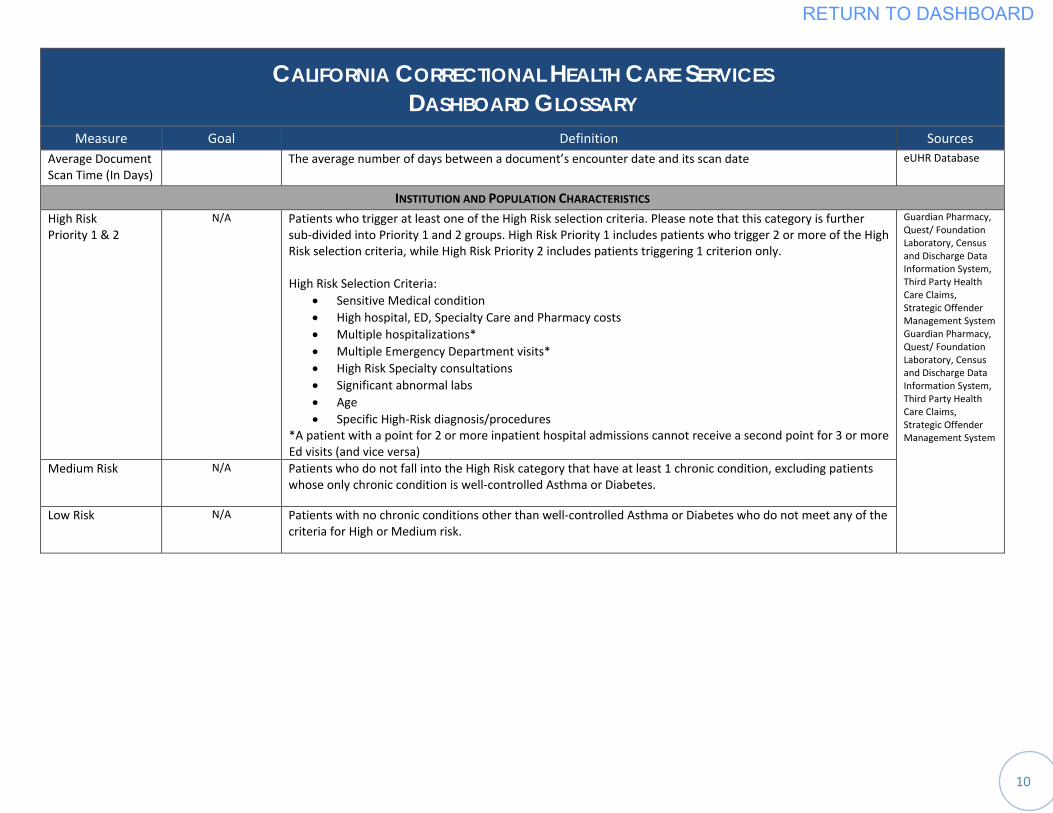
10
CALIFORNIA CORRECTIONAL HEALTH CARE SERVICES DASHBOARD GLOSSARY
Measure Goal Definition Sources Average Document Scan Time (In Days)
The average number of days between a document’s encounter date and its scan date eUHR Database
INSTITUTION AND POPULATION CHARACTERISTICS High Risk Priority 1 & 2
N/A Patients who trigger at least one of the High Risk selection criteria. Please note that this category is further sub‐divided into Priority 1 and 2 groups. High Risk Priority 1 includes patients who trigger 2 or more of the High Risk selection criteria, while High Risk Priority 2 includes patients triggering 1 criterion only. High Risk Selection Criteria:
• Sensitive Medical condition • High hospital, ED, Specialty Care and Pharmacy costs • Multiple hospitalizations* • Multiple Emergency Department visits* • High Risk Specialty consultations • Significant abnormal labs • Age • Specific High‐Risk diagnosis/procedures
*A patient with a point for 2 or more inpatient hospital admissions cannot receive a second point for 3 or more Ed visits (and vice versa)
Guardian Pharmacy, Quest/ Foundation Laboratory, Census and Discharge Data Information System, Third Party Health Care Claims, Strategic Offender Management System Guardian Pharmacy, Quest/ Foundation Laboratory, Census and Discharge Data Information System, Third Party Health Care Claims, Strategic Offender Management System
Medium Risk N/A Patients who do not fall into the High Risk category that have at least 1 chronic condition, excluding patients whose only chronic condition is well‐controlled Asthma or Diabetes.
Low Risk N/A Patients with no chronic conditions other than well‐controlled Asthma or Diabetes who do not meet any of the criteria for High or Medium risk.
RETURN TO DASHBOARD


![KPIs Dashboard for Invenio-Related Services · time plots. Grafana is an open source project used for monitoring and analyzing time-series data [6]. 3.1 Dashboard The dashboard consists](https://img.pdfslide.net/doc/110x75/5f02cfbb7e708231d406210b/kpis-dashboard-for-invenio-related-services-time-plots-grafana-is-an-open-source.jpg)