Embed Size (px)
Citation preview
Wheat Quality Council
Hard Spring Wheat Technical Committee
2015 Crop
February 16-18, 2016
Kansas City, MO
2
Wheat Quality Council
Hard Spring Wheat Technical Committee
2015 Crop
Sponsored by the Wheat Quality Council February 16-18, 2016
Ben Handcock, Executive Vice President Wheat Quality Council 5231 Tall Spruce Street
Brighton, CO 80601 Phone: 303-558-0101
Fax (303) 558-0100 E-mail: [email protected]
Linda Dykes, Ph.D., Editor USDA-ARS Hard Red Spring & Durum Wheat Quality Laboratory
Cereal Crops Research Unit Red River Valley Agricultural Research Center
Harris Hall, North Dakota State University Fargo, ND 58102
Phone: 701-239-1412 Fax: 701-239-1377
Email: [email protected]
3
Table of Contents
Introduction ................................................................................................................................... 4
Source of wheat ............................................................................................................................ 5
Field Plot Locations and Procedures ............................................................................................ 5
Field Production Data ................................................................................................................... 6
Climate, Disease, and Field Conditions ........................................................................................ 7
Description of 2015 Hard Spring Wheat Lines .............................................................................. 8
Wheat Production Sites .............................................................................................................. 10
Grain Cleaning and Milling Procedures ...................................................................................... 11
Methods of Analysis .................................................................................................................... 11
Test Bake Procedures ................................................................................................................ 13
Bake Cooperators ....................................................................................................................... 13
Quality Data of 2015 Hard Spring Wheat Lines .......................................................................... 14
SWQAC #1 – MN10261-1 ................................................................................................... 14
SWQAC #2 – ND820 ........................................................................................................... 20
SWQAC #3 – Bolles ............................................................................................................ 26
SWQAC #4 – SY Valda ....................................................................................................... 36
SWQAC #5 – LCS Prime ..................................................................................................... 46
SWQAC #6 – MN11325-7 ................................................................................................... 56
SWQAC #7 – ND821 ........................................................................................................... 62
SWQAC #8 – SD4383 ......................................................................................................... 68
SWQAC #10 – LNR11-0757 ................................................................................................ 74
Appendix ..................................................................................................................................... 80
Wheat Marketing Score ....................................................................................................... 81
Method #1 ....................................................................................................................... 81
Method #2 ....................................................................................................................... 82
Miag Mill Streams ................................................................................................................ 83
Miag Multomat Mill Flow Chart ............................................................................................ 84
Wheat Kernel Characteristics by Location ........................................................................... 85
Flour Characteristics by Location ........................................................................................ 86
Farinograph Characteristics by Location ............................................................................. 87
Mixograph Characteristics by Location ................................................................................ 88
Interpreting Mixogram Results ............................................................................................. 89
Extensograph Characteristics by Location .......................................................................... 90
Ash/Protein Content in Mill Streams .................................................................................... 93
Cooperators’ Bake Data .................................................................................................... 103 Hard Red Spring Wheat Breeding Quality Target Values .................................................. 121
4
Wheat Quality Council
Hard Spring Wheat Technical Committee
Introduction Breeders’ experimental lines of wheat are evaluated for overall quality before being released for commercial production. The Hard Spring Wheat Technical Committee provides milling and baking quality data on breeders’ experimental lines of wheat that are annually submitted to the Wheat Quality Council (WQC). The impact is the commercialization of high quality wheat for production and processing. Nine experimental lines of hard spring wheat were grown at up to five locations in 2015 and evaluated for kernel, milling, and bread baking quality against the check variety Glenn. To avoid any bias in the test procedures, code numbers were assigned to the experimental lines and maintained throughout the growing and harvesting of the plots and the milling and baking trials. Wheat samples were milled at the USDA Hard Red Spring and Durum Wheat Quality Laboratory (WQL), Fargo, ND. Flour samples were shipped to independent laboratories and tested for bread baking quality. From this report: The WQC makes no representation regarding the accuracy or conclusiveness of the data developed by and received from the participating laboratories. The data has been scientifically determined and accurately reported from the perspective of the Hard Spring Wheat Technical Committee. The results relate only to test samples that were volunteered for testing in the 2015 crop year. Test results from other crop years may differ from those reported herein. The Hard Spring Wheat Technical Committee, by compilation of data and issuance of this report, does not make or intend any general recommendations or conclusions on its part with respect to the desirability of any wheat included in the tests. Mention of a vendor, product, proprietary product, or procedure does not constitute a guarantee or warranty of the vendor, product, or procedure by the Hard Spring Wheat Technical Committee or by cooperating laboratories, and does not imply its approval to the exclusion of other vendors, products, or procedures that may also be suitable. Data reported herein are not to be used in any publication or literature or for advertising or publicity purposes.
5
The 2015 Wheat Quality Testing Program
Source of Wheat
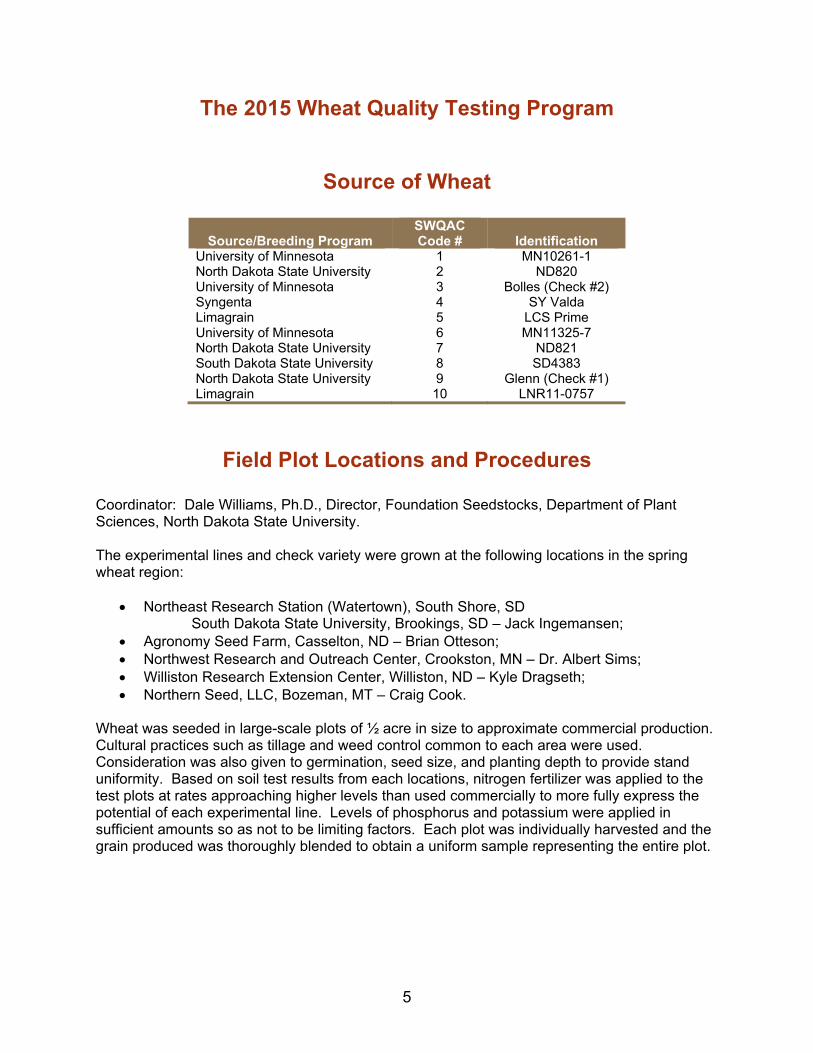
Source/Breeding Program SWQAC Code # Identification
University of Minnesota 1 MN10261-1 North Dakota State University 2 ND820 University of Minnesota 3 Bolles (Check #2) Syngenta 4 SY Valda Limagrain 5 LCS Prime University of Minnesota 6 MN11325-7 North Dakota State University 7 ND821 South Dakota State University 8 SD4383 North Dakota State University 9 Glenn (Check #1) Limagrain 10 LNR11-0757
Field Plot Locations and Procedures
Coordinator: Dale Williams, Ph.D., Director, Foundation Seedstocks, Department of Plant Sciences, North Dakota State University. The experimental lines and check variety were grown at the following locations in the spring wheat region:
Northeast Research Station (Watertown), South Shore, SD South Dakota State University, Brookings, SD – Jack Ingemansen;
Agronomy Seed Farm, Casselton, ND – Brian Otteson; Northwest Research and Outreach Center, Crookston, MN – Dr. Albert Sims; Williston Research Extension Center, Williston, ND – Kyle Dragseth; Northern Seed, LLC, Bozeman, MT – Craig Cook.
Wheat was seeded in large-scale plots of ½ acre in size to approximate commercial production. Cultural practices such as tillage and weed control common to each area were used. Consideration was also given to germination, seed size, and planting depth to provide stand uniformity. Based on soil test results from each locations, nitrogen fertilizer was applied to the test plots at rates approaching higher levels than used commercially to more fully express the potential of each experimental line. Levels of phosphorus and potassium were applied in sufficient amounts so as not to be limiting factors. Each plot was individually harvested and the grain produced was thoroughly blended to obtain a uniform sample representing the entire plot.
6
Field Production Data
LOCATION
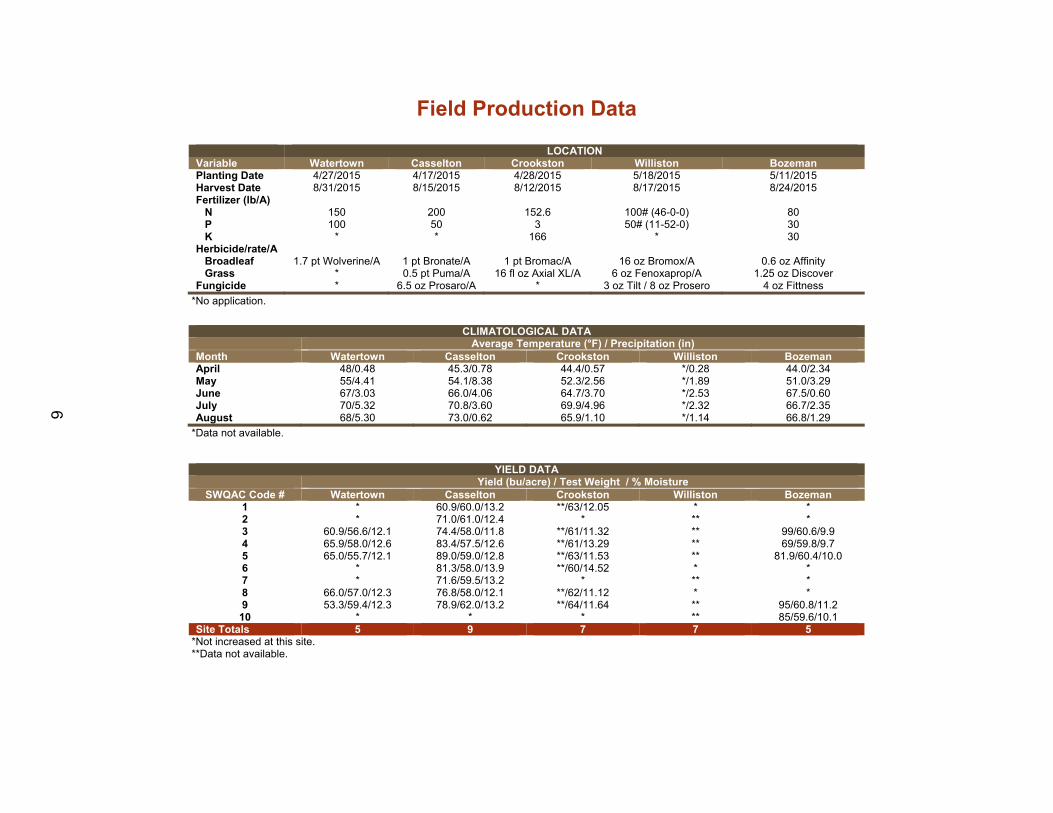
Variable Watertown Casselton Crookston Williston Bozeman Planting Date 4/27/2015 4/17/2015 4/28/2015 5/18/2015 5/11/2015 Harvest Date 8/31/2015 8/15/2015 8/12/2015 8/17/2015 8/24/2015 Fertilizer (lb/A) N 150 200 152.6 100# (46-0-0) 80 P 100 50 3 50# (11-52-0) 30 K * * 166 * 30 Herbicide/rate/A Broadleaf 1.7 pt Wolverine/A 1 pt Bronate/A 1 pt Bromac/A 16 oz Bromox/A 0.6 oz Affinity Grass * 0.5 pt Puma/A 16 fl oz Axial XL/A 6 oz Fenoxaprop/A 1.25 oz Discover Fungicide * 6.5 oz Prosaro/A * 3 oz Tilt / 8 oz Prosero 4 oz Fittness
*No application.
CLIMATOLOGICAL DATA
Average Temperature (°F) / Precipitation (in) Month Watertown Casselton Crookston Williston Bozeman April 48/0.48 45.3/0.78 44.4/0.57 */0.28 44.0/2.34 May 55/4.41 54.1/8.38 52.3/2.56 */1.89 51.0/3.29 June 67/3.03 66.0/4.06 64.7/3.70 */2.53 67.5/0.60 July 70/5.32 70.8/3.60 69.9/4.96 */2.32 66.7/2.35 August 68/5.30 73.0/0.62 65.9/1.10 */1.14 66.8/1.29
*Data not available.
YIELD DATA
Yield (bu/acre) / Test Weight / % Moisture SWQAC Code # Watertown Casselton Crookston Williston Bozeman
1 * 60.9/60.0/13.2 **/63/12.05 * * 2 * 71.0/61.0/12.4 * ** * 3 60.9/56.6/12.1 74.4/58.0/11.8 **/61/11.32 ** 99/60.6/9.9 4 65.9/58.0/12.6 83.4/57.5/12.6 **/61/13.29 ** 69/59.8/9.7 5 65.0/55.7/12.1 89.0/59.0/12.8 **/63/11.53 ** 81.9/60.4/10.0 6 * 81.3/58.0/13.9 **/60/14.52 * * 7 * 71.6/59.5/13.2 * ** * 8 66.0/57.0/12.3 76.8/58.0/12.1 **/62/11.12 * * 9 53.3/59.4/12.3 78.9/62.0/13.2 **/64/11.64 ** 95/60.8/11.2
10 * * * ** 85/59.6/10.1 Site Totals 5 9 7 7 5
*Not increased at this site. **Data not available.
7
Climate, Disease, and Field Conditions
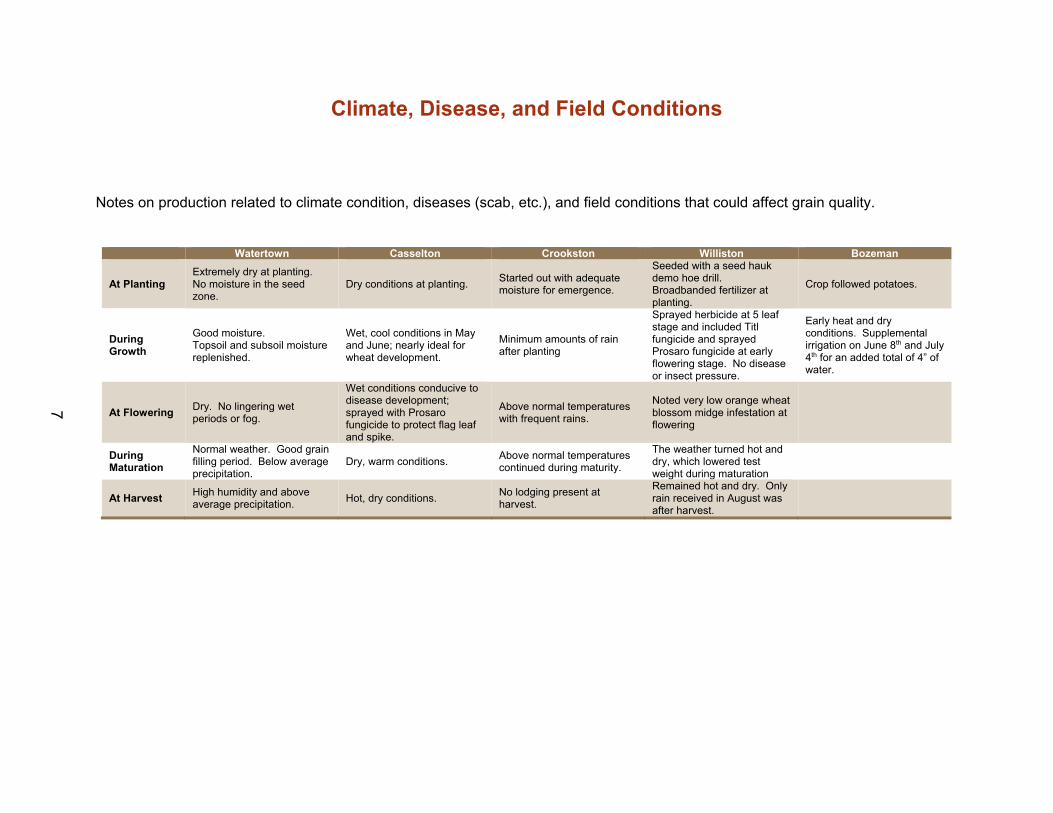
Notes on production related to climate condition, diseases (scab, etc.), and field conditions that could affect grain quality.
Watertown Casselton Crookston Williston Bozeman
At Planting Extremely dry at planting. No moisture in the seed zone.
Dry conditions at planting. Started out with adequate moisture for emergence.
Seeded with a seed hauk demo hoe drill. Broadbanded fertilizer at planting.
Crop followed potatoes.
During Growth
Good moisture. Topsoil and subsoil moisture replenished.
Wet, cool conditions in May and June; nearly ideal for wheat development.
Minimum amounts of rain after planting
Sprayed herbicide at 5 leaf stage and included Titl fungicide and sprayed Prosaro fungicide at early flowering stage. No disease or insect pressure.
Early heat and dry conditions. Supplemental irrigation on June 8th and July 4th for an added total of 4” of water.
At Flowering Dry. No lingering wet periods or fog.
Wet conditions conducive to disease development; sprayed with Prosaro fungicide to protect flag leaf and spike.
Above normal temperatures with frequent rains.
Noted very low orange wheat blossom midge infestation at flowering
During Maturation
Normal weather. Good grain filling period. Below average precipitation.
Dry, warm conditions. Above normal temperatures continued during maturity.
The weather turned hot and dry, which lowered test weight during maturation
At Harvest High humidity and above average precipitation.
Hot, dry conditions. No lodging present at harvest.
Remained hot and dry. Only rain received in August was after harvest.
8
Description of 2015 Hard Spring Wheat Lines
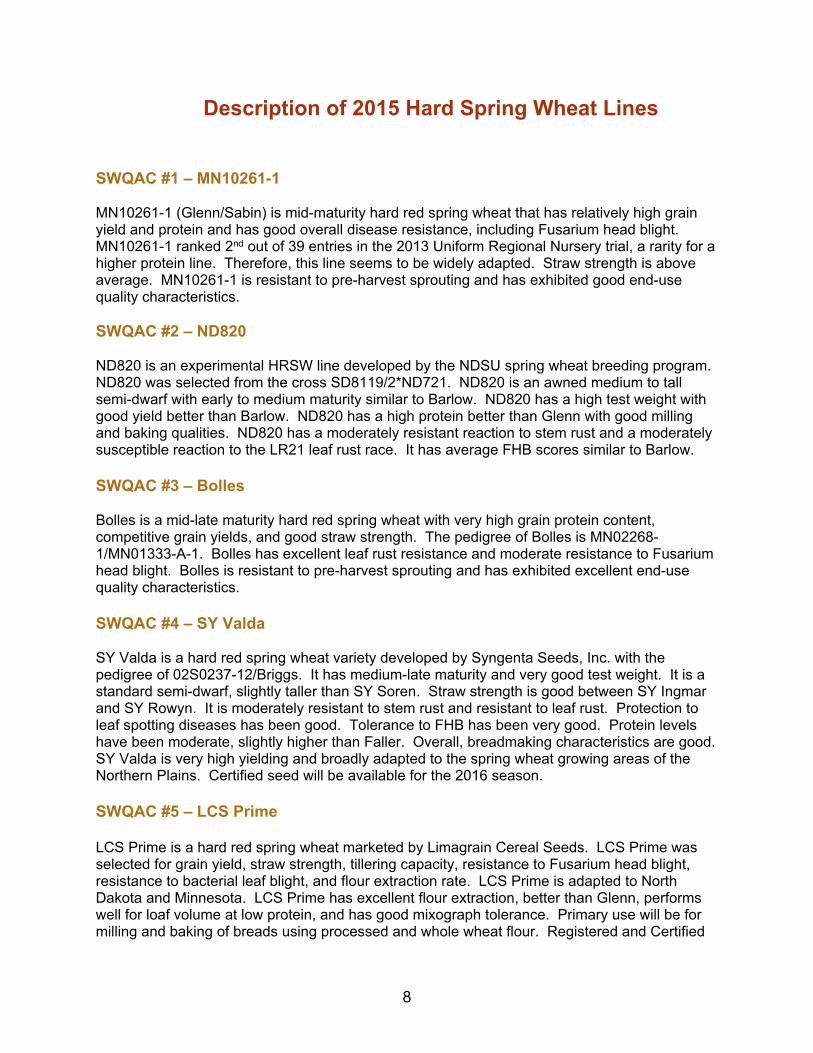
SWQAC #1 – MN10261-1 MN10261-1 (Glenn/Sabin) is mid-maturity hard red spring wheat that has relatively high grain yield and protein and has good overall disease resistance, including Fusarium head blight. MN10261-1 ranked 2nd out of 39 entries in the 2013 Uniform Regional Nursery trial, a rarity for a higher protein line. Therefore, this line seems to be widely adapted. Straw strength is above average. MN10261-1 is resistant to pre-harvest sprouting and has exhibited good end-use quality characteristics. SWQAC #2 – ND820 ND820 is an experimental HRSW line developed by the NDSU spring wheat breeding program. ND820 was selected from the cross SD8119/2*ND721. ND820 is an awned medium to tall semi-dwarf with early to medium maturity similar to Barlow. ND820 has a high test weight with good yield better than Barlow. ND820 has a high protein better than Glenn with good milling and baking qualities. ND820 has a moderately resistant reaction to stem rust and a moderately susceptible reaction to the LR21 leaf rust race. It has average FHB scores similar to Barlow. SWQAC #3 – Bolles Bolles is a mid-late maturity hard red spring wheat with very high grain protein content, competitive grain yields, and good straw strength. The pedigree of Bolles is MN02268-1/MN01333-A-1. Bolles has excellent leaf rust resistance and moderate resistance to Fusarium head blight. Bolles is resistant to pre-harvest sprouting and has exhibited excellent end-use quality characteristics. SWQAC #4 – SY Valda SY Valda is a hard red spring wheat variety developed by Syngenta Seeds, Inc. with the pedigree of 02S0237-12/Briggs. It has medium-late maturity and very good test weight. It is a standard semi-dwarf, slightly taller than SY Soren. Straw strength is good between SY Ingmar and SY Rowyn. It is moderately resistant to stem rust and resistant to leaf rust. Protection to leaf spotting diseases has been good. Tolerance to FHB has been very good. Protein levels have been moderate, slightly higher than Faller. Overall, breadmaking characteristics are good. SY Valda is very high yielding and broadly adapted to the spring wheat growing areas of the Northern Plains. Certified seed will be available for the 2016 season. SWQAC #5 – LCS Prime LCS Prime is a hard red spring wheat marketed by Limagrain Cereal Seeds. LCS Prime was selected for grain yield, straw strength, tillering capacity, resistance to Fusarium head blight, resistance to bacterial leaf blight, and flour extraction rate. LCS Prime is adapted to North Dakota and Minnesota. LCS Prime has excellent flour extraction, better than Glenn, performs well for loaf volume at low protein, and has good mixograph tolerance. Primary use will be for milling and baking of breads using processed and whole wheat flour. Registered and Certified
9
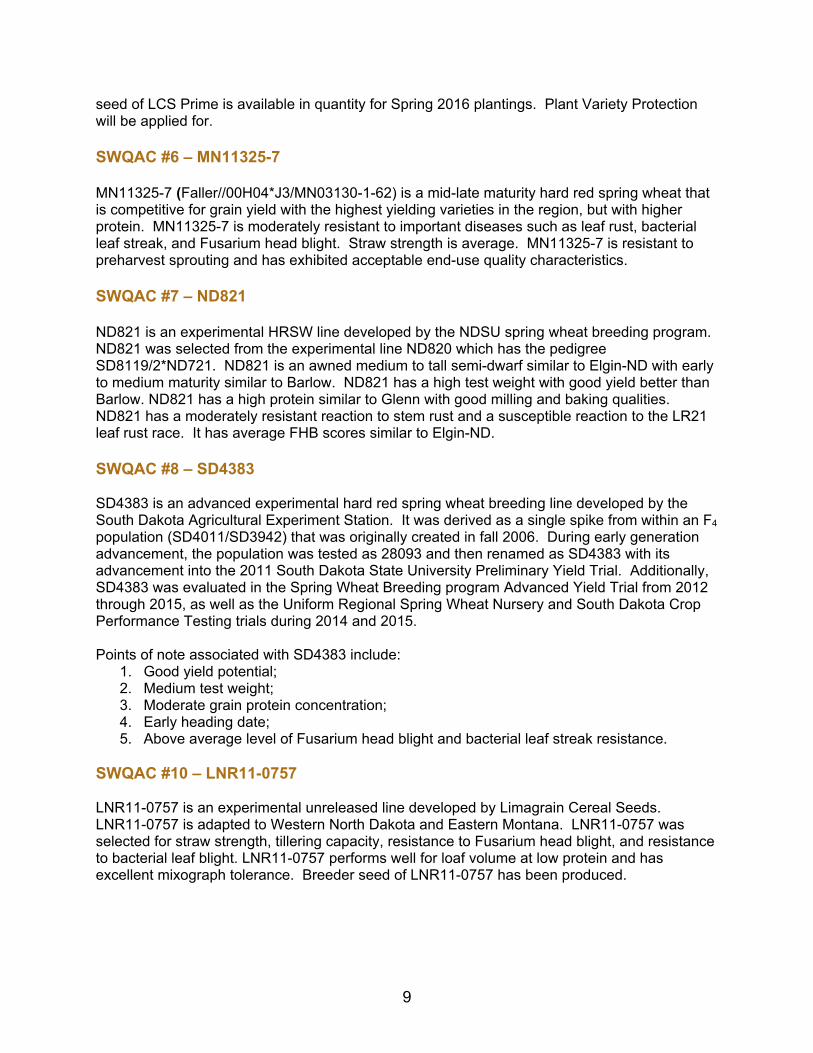
seed of LCS Prime is available in quantity for Spring 2016 plantings. Plant Variety Protection will be applied for. SWQAC #6 – MN11325-7 MN11325-7 (Faller//00H04*J3/MN03130-1-62) is a mid-late maturity hard red spring wheat that is competitive for grain yield with the highest yielding varieties in the region, but with higher protein. MN11325-7 is moderately resistant to important diseases such as leaf rust, bacterial leaf streak, and Fusarium head blight. Straw strength is average. MN11325-7 is resistant to preharvest sprouting and has exhibited acceptable end-use quality characteristics. SWQAC #7 – ND821 ND821 is an experimental HRSW line developed by the NDSU spring wheat breeding program. ND821 was selected from the experimental line ND820 which has the pedigree SD8119/2*ND721. ND821 is an awned medium to tall semi-dwarf similar to Elgin-ND with early to medium maturity similar to Barlow. ND821 has a high test weight with good yield better than Barlow. ND821 has a high protein similar to Glenn with good milling and baking qualities. ND821 has a moderately resistant reaction to stem rust and a susceptible reaction to the LR21 leaf rust race. It has average FHB scores similar to Elgin-ND. SWQAC #8 – SD4383 SD4383 is an advanced experimental hard red spring wheat breeding line developed by the South Dakota Agricultural Experiment Station. It was derived as a single spike from within an F4 population (SD4011/SD3942) that was originally created in fall 2006. During early generation advancement, the population was tested as 28093 and then renamed as SD4383 with its advancement into the 2011 South Dakota State University Preliminary Yield Trial. Additionally, SD4383 was evaluated in the Spring Wheat Breeding program Advanced Yield Trial from 2012 through 2015, as well as the Uniform Regional Spring Wheat Nursery and South Dakota Crop Performance Testing trials during 2014 and 2015. Points of note associated with SD4383 include:
1. Good yield potential; 2. Medium test weight; 3. Moderate grain protein concentration; 4. Early heading date; 5. Above average level of Fusarium head blight and bacterial leaf streak resistance.
SWQAC #10 – LNR11-0757 LNR11-0757 is an experimental unreleased line developed by Limagrain Cereal Seeds. LNR11-0757 is adapted to Western North Dakota and Eastern Montana. LNR11-0757 was selected for straw strength, tillering capacity, resistance to Fusarium head blight, and resistance to bacterial leaf blight. LNR11-0757 performs well for loaf volume at low protein and has excellent mixograph tolerance. Breeder seed of LNR11-0757 has been produced.
10
Wheat Production Sites
SWQAC Production Sites Code # Entry Source Watertown Casselton Crookston Williston Bozeman
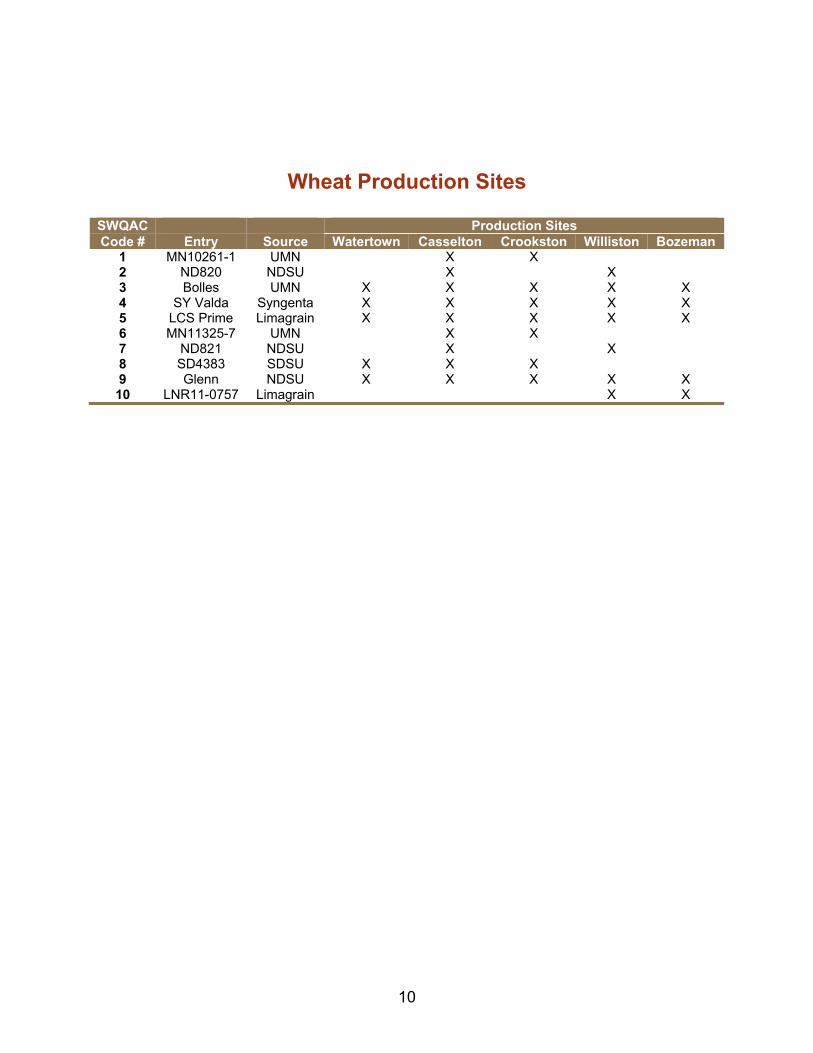
1 MN10261-1 UMN X X 2 ND820 NDSU X X 3 Bolles UMN X X X X X 4 SY Valda Syngenta X X X X X 5 LCS Prime Limagrain X X X X X 6 MN11325-7 UMN X X 7 ND821 NDSU X X 8 SD4383 SDSU X X X 9 Glenn NDSU X X X X X 10 LNR11-0757 Limagrain X X
11
Grain Cleaning and Milling Procedures Wheat (approximately 3 bu/line) was cleaned in a Carter-Day Bulldog seed cleaner that was equipped with two rotating indent cylinders (#24 – coarse; #16 – fine), a sizer cylinder (#5), vibrator, and air aspiration. Cleaned wheat (110 lbs) was tempered to 16.5% moisture content and conditioned for approximately 20-24 hours before milling. Milling was performed on the Miag Multomat. Feed rate was set at 180 lbs/hour. Break rollers were adjusted to the following releases through a U.S. 16 S.S. sieve: first break – 30%; second break – 53%; and third break, clean-up – 66%. Flour blending: Sixteen mill streams were selected among 23 streams based on cumulative ash curves and blended to long patent flour. Cumulative ash content was calculated based on product basis milling yield (14% moisture basis). Milling streams blended to long patent flour – 1st Break, 2nd Break I, Break Dust, Sizing I, 2nd Break II, 3rd Break, Sizing II, 5th Break, 4th Break, 1st Middlings, 2nd Middlings, 3rd Middlings, 4th Middlings, 6th Middlings, Tail Flour, and Tail Cyclone Flour.
Methods of Analysis
Wheat Market Value Score;
DON levels - analyzed by NDSU, Department of Plant Sciences (gas chromatography
method, J. AOAC Int. 79:472, 1996);
Test weight (AACCI Method 55-10);
Wheat and flour protein (AACCI Method 46-30 – combustion method);
Wheat and flour ash (AACCI Method 08-01);
Kernel Size (Sieving according to USDA-ARS WQL);
Wheat and flour Falling Number (Perten Falling Number System);
Single kernel characteristics (Perten Single Kernel Characterization System – SKCS):
o Mean and standard deviation values were calculated from 300 kernels.
Vitreous kernel content (DHV analysis by FGIS Grain Testing Service);
Flour color (Minolta Colorimeter, L* and b* values);
Flour extraction: % Total product basis (TPB), % tempered wheat basis (TWB), and estimated pounds patent flour/bushel wheat;
12
Farinograph (AACCI Method 54-21, Brabender Computerized Farinograph system with 50 g mixing bowl):
o Water absorption: 500 BU and 14% mb;
o Arrival time: time required for the top of the curve to reach the 500 BU line after
addition of water;
o Peak time: time between addition of water and development of the maximum consistency of the dough;
o Stability: difference in time between the point at which the top of the curve first
intercepts the 500 BU line (arrival time) and the point at which the top of the curve leaves the 500 BU line (departure time);
o Mechanical Tolerance Index (MTI): difference in BU between the top of the
curve at the peak and the top of the curve measured 5 minutes after the peak is reached;
o Time to Breakdown (TTB): time from the start of mixing to the time at which
consistency has decreased 30 BU from the peak point.
Mixograph (AACCI Method 54-40A, mixograph with 35 g mixing bowl):
o Water absorption (14% mb) = Protein (14% mb) x 1.5 + 43.6 (The Mixograph Handbook, 1997).
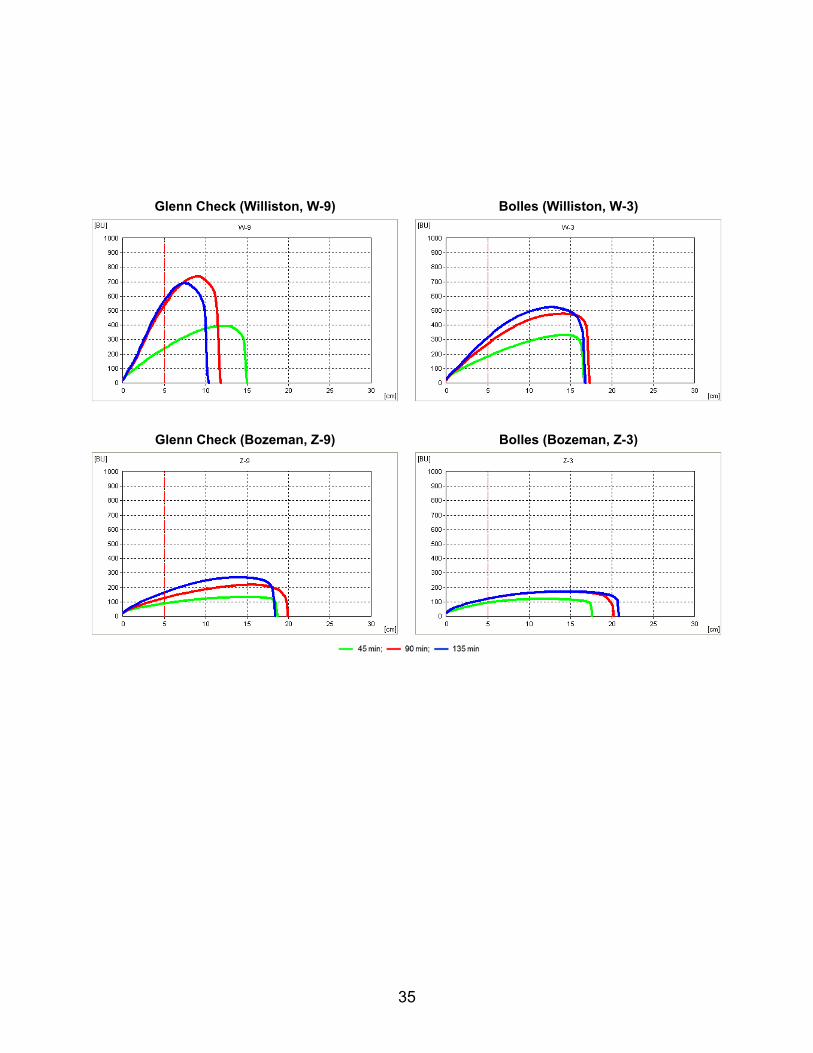
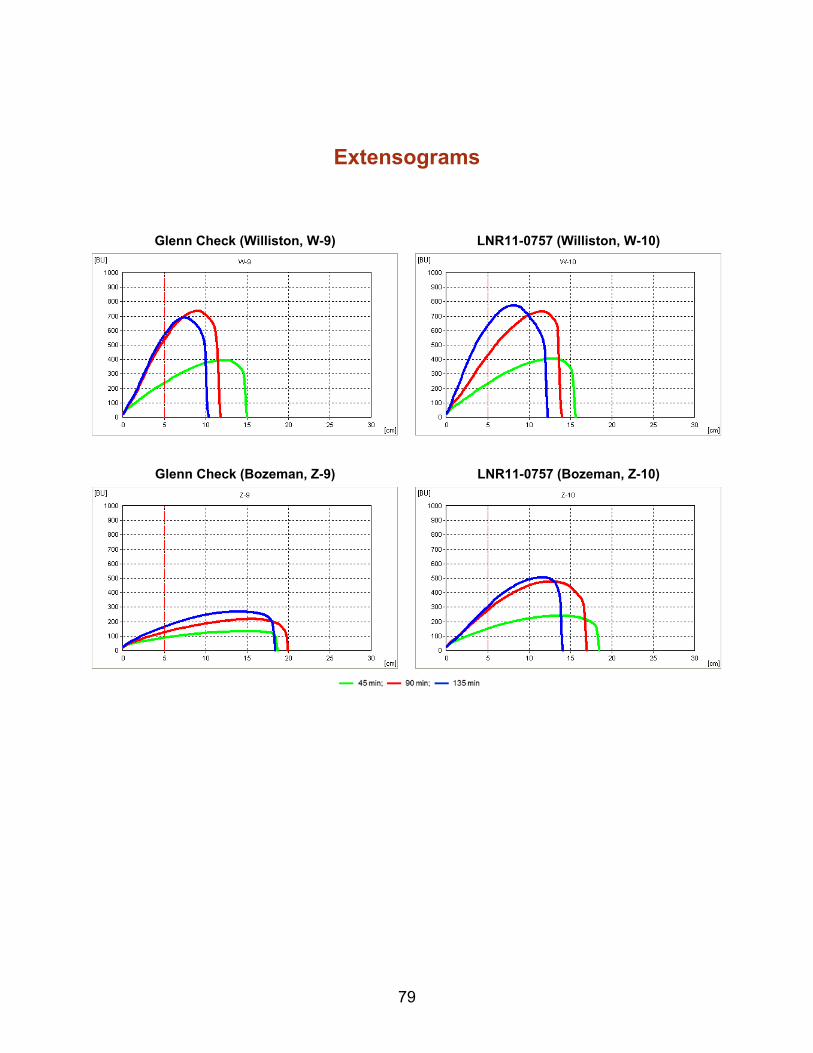
Extensograph (AACCI Method 54-10 with modifications):
o Flour (100 g, 14% mb), 2.0% NaCl (U.S.P.), and water (farinograph absorption -
2%) were mixed to optimum development in a pin mixer (National Mfg. Co.);
o Dough was scaled to 150 g, rounded, molded, placed in extensograph holders, and rested for 45, 90, and 135 minutes at 30°C and 78% relative humidity. The dough was then stretched as described in the procedure referenced above. For conversion purposes, 500 g = 400 BU;
o Extensograph parameters:
Energy (cm2): area under the curve;
Resistance to extension (BU): height of the curve 50 mm after the
beginning of torque increase;
Extensibility (cm): total length of the curve at the baseline;
Maximum resistance (BU): maximum curve height;
Ratio number: quotient of resistance to extension and extensibility;
Ratio number (max.): quotient of maximum resistance and extensibility.

13
Test Bake Procedures
Samples of flour were shipped to cooperators for evaluation of baking properties. The flour had been uniformly malted to a falling number of approximately 250 seconds. Bleach was not added to the flour. Each cooperator test baked the flour according to their standard method using straight dough, sponge and dough, or other test bake methods. Cooperator data were returned to the WQL for compilation of results.
Bake Cooperators
ADM Milling – Overland Park, KS;
Ardent Mills – Minnetonka, MN;
Bay State Milling – Winona, MN;
Cereal Food Processors, Inc. (Grain Craft) – Wichita, KS;
General Mills – Minneapolis, MN;
Limagrain Cereal Seeds LLC – Fort Collins, CO;
North Dakota Mill – Grand Forks, ND;
North Dakota State University, Department of Plant Sciences – Fargo, ND;
Syngenta – Berthoud, CO;
USDA-ARS Hard Red Spring & Durum Wheat Quality Laboratory – Fargo, ND;
USDA-ARS Hard Winter Wheat Quality Laboratory – Manhattan, KS;
USDA-ARS Western Wheat Quality Laboratory – Pullman, WA;
Wheat Marketing Center – Portland, OR.
The Wheat Quality Council acknowledges the dedication and sacrifice of time by those individuals who are involved in test baking hard spring wheat samples. Your efforts are well appreciated by wheat breeders, commercial flour millers and bakers, and wheat marketing personnel who inspire the overall industry to improve the quality of U.S. wheat.
14
Quality Data of 2015 Hard Spring Wheat Lines
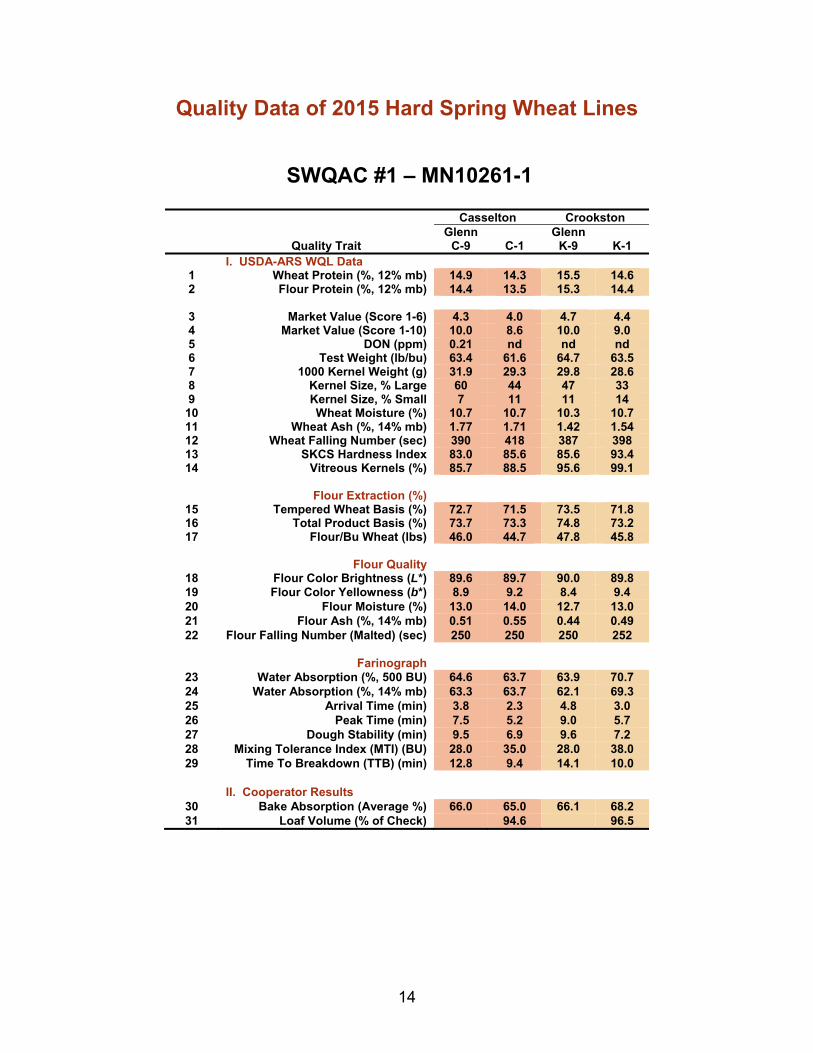
SWQAC #1 – MN10261-1
Casselton Crookston
Quality Trait Glenn
C-9 C-1 Glenn
K-9
K-1 I. USDA-ARS WQL Data
1 Wheat Protein (%, 12% mb) 14.9 14.3 15.5 14.6 2 Flour Protein (%, 12% mb) 14.4 13.5 15.3 14.4
3 Market Value (Score 1-6) 4.3 4.0 4.7 4.4 4 Market Value (Score 1-10) 10.0 8.6 10.0 9.0 5 DON (ppm) 0.21 nd nd nd 6 Test Weight (lb/bu) 63.4 61.6 64.7 63.5 7 1000 Kernel Weight (g) 31.9 29.3 29.8 28.6 8 Kernel Size, % Large 60 44 47 33 9 Kernel Size, % Small 7 11 11 14
10 Wheat Moisture (%) 10.7 10.7 10.3 10.7 11 Wheat Ash (%, 14% mb) 1.77 1.71 1.42 1.54 12 Wheat Falling Number (sec) 390 418 387 398 13 SKCS Hardness Index 83.0 85.6 85.6 93.4 14 Vitreous Kernels (%) 85.7 88.5 95.6 99.1
Flour Extraction (%)
15 Tempered Wheat Basis (%) 72.7 71.5 73.5 71.8 16 Total Product Basis (%) 73.7 73.3 74.8 73.2 17 Flour/Bu Wheat (lbs) 46.0 44.7 47.8 45.8
Flour Quality
18 Flour Color Brightness (L*) 89.6 89.7 90.0 89.8 19 Flour Color Yellowness (b*) 8.9 9.2 8.4 9.4 20 Flour Moisture (%) 13.0 14.0 12.7 13.0 21 Flour Ash (%, 14% mb) 0.51 0.55 0.44 0.49 22 Flour Falling Number (Malted) (sec) 250 250 250 252
Farinograph
23 Water Absorption (%, 500 BU) 64.6 63.7 63.9 70.7 24 Water Absorption (%, 14% mb) 63.3 63.7 62.1 69.3 25 Arrival Time (min) 3.8 2.3 4.8 3.0 26 Peak Time (min) 7.5 5.2 9.0 5.7 27 Dough Stability (min) 9.5 6.9 9.6 7.2 28 Mixing Tolerance Index (MTI) (BU) 28.0 35.0 28.0 38.0 29 Time To Breakdown (TTB) (min) 12.8 9.4 14.1 10.0
II. Cooperator Results
30 Bake Absorption (Average %) 66.0 65.0 66.1 68.2 31 Loaf Volume (% of Check) 94.6 96.5
15
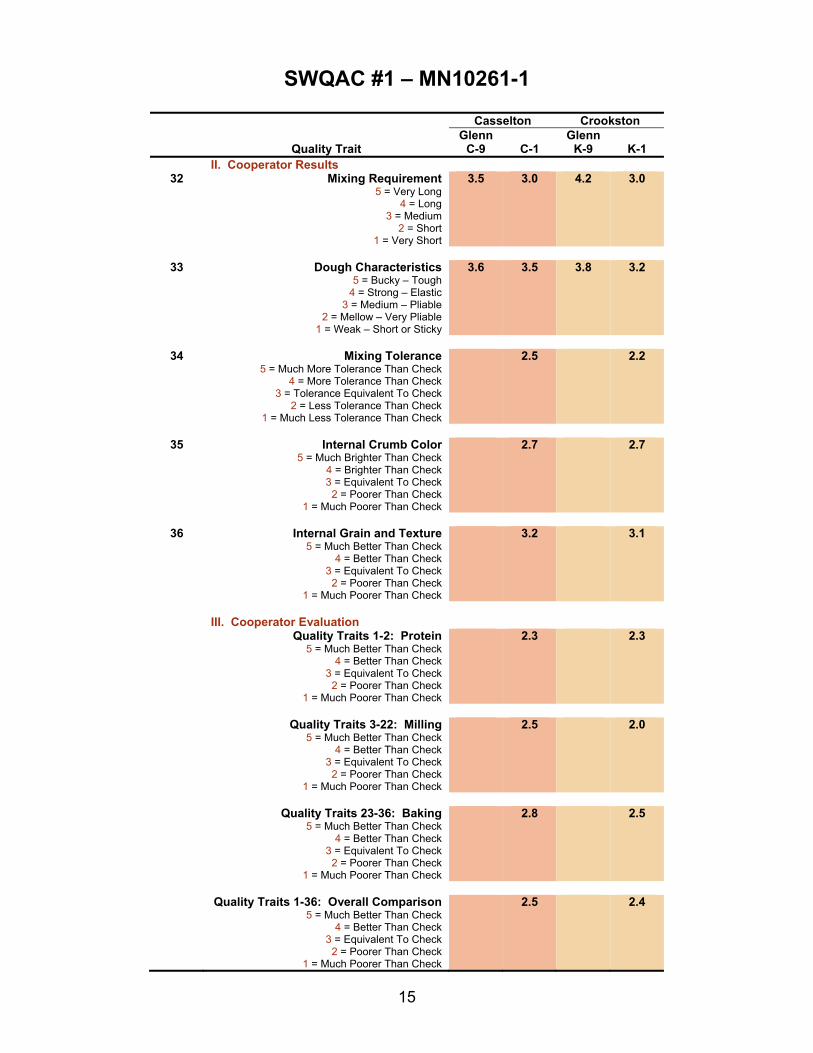
SWQAC #1 – MN10261-1
Casselton Crookston
Quality Trait Glenn
C-9 C-1 Glenn
K-9
K-1 II. Cooperator Results
32 Mixing Requirement5 = Very Long
4 = Long 3 = Medium
2 = Short 1 = Very Short
3.5 3.0 4.2 3.0
33 Dough Characteristics
5 = Bucky – Tough 4 = Strong – Elastic
3 = Medium – Pliable 2 = Mellow – Very Pliable
1 = Weak – Short or Sticky
3.6 3.5 3.8 3.2
34 Mixing Tolerance
5 = Much More Tolerance Than Check 4 = More Tolerance Than Check
3 = Tolerance Equivalent To Check 2 = Less Tolerance Than Check
1 = Much Less Tolerance Than Check
2.5 2.2
35 Internal Crumb Color
5 = Much Brighter Than Check 4 = Brighter Than Check 3 = Equivalent To Check
2 = Poorer Than Check 1 = Much Poorer Than Check
2.7 2.7
36 Internal Grain and Texture
5 = Much Better Than Check 4 = Better Than Check
3 = Equivalent To Check 2 = Poorer Than Check
1 = Much Poorer Than Check
3.2 3.1
III. Cooperator Evaluation Quality Traits 1-2: Protein
5 = Much Better Than Check 4 = Better Than Check
3 = Equivalent To Check 2 = Poorer Than Check
1 = Much Poorer Than Check
2.3 2.3
Quality Traits 3-22: Milling
5 = Much Better Than Check 4 = Better Than Check
3 = Equivalent To Check 2 = Poorer Than Check
1 = Much Poorer Than Check
2.5 2.0
Quality Traits 23-36: Baking
5 = Much Better Than Check 4 = Better Than Check
3 = Equivalent To Check 2 = Poorer Than Check
1 = Much Poorer Than Check
2.8 2.5
Quality Traits 1-36: Overall Comparison
5 = Much Better Than Check 4 = Better Than Check
3 = Equivalent To Check 2 = Poorer Than Check
1 = Much Poorer Than Check
2.5 2.4
16
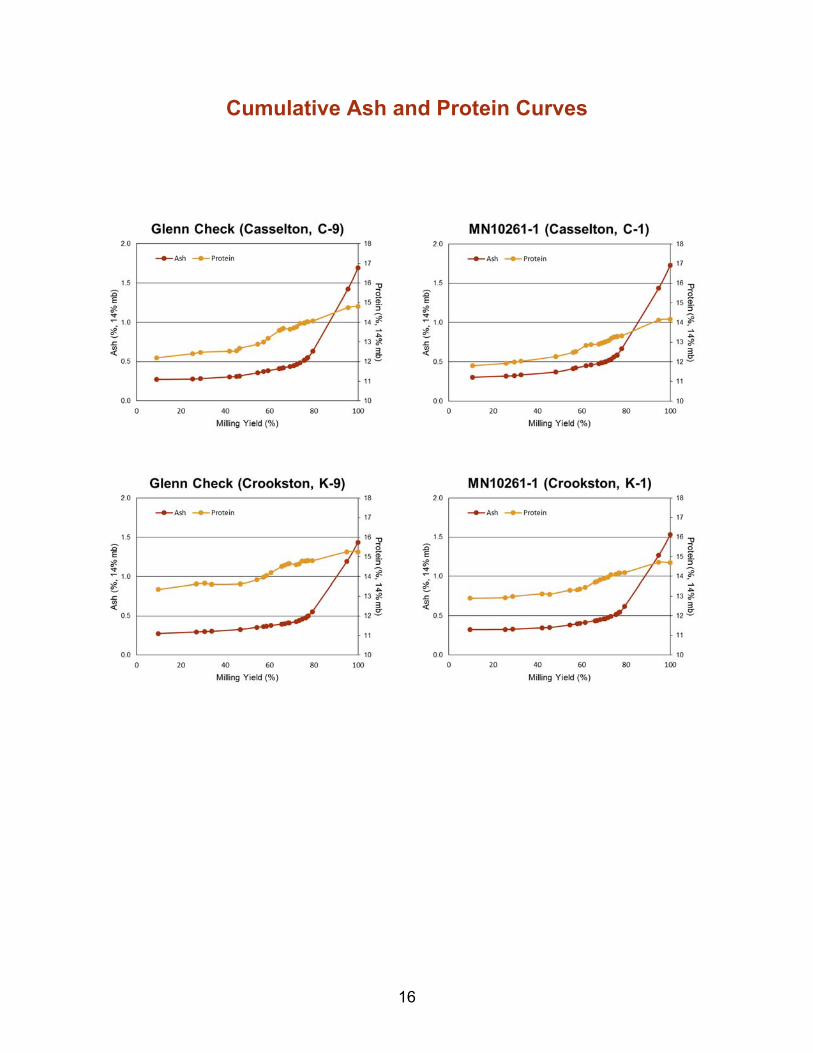
Cumulative Ash and Protein Curves
17
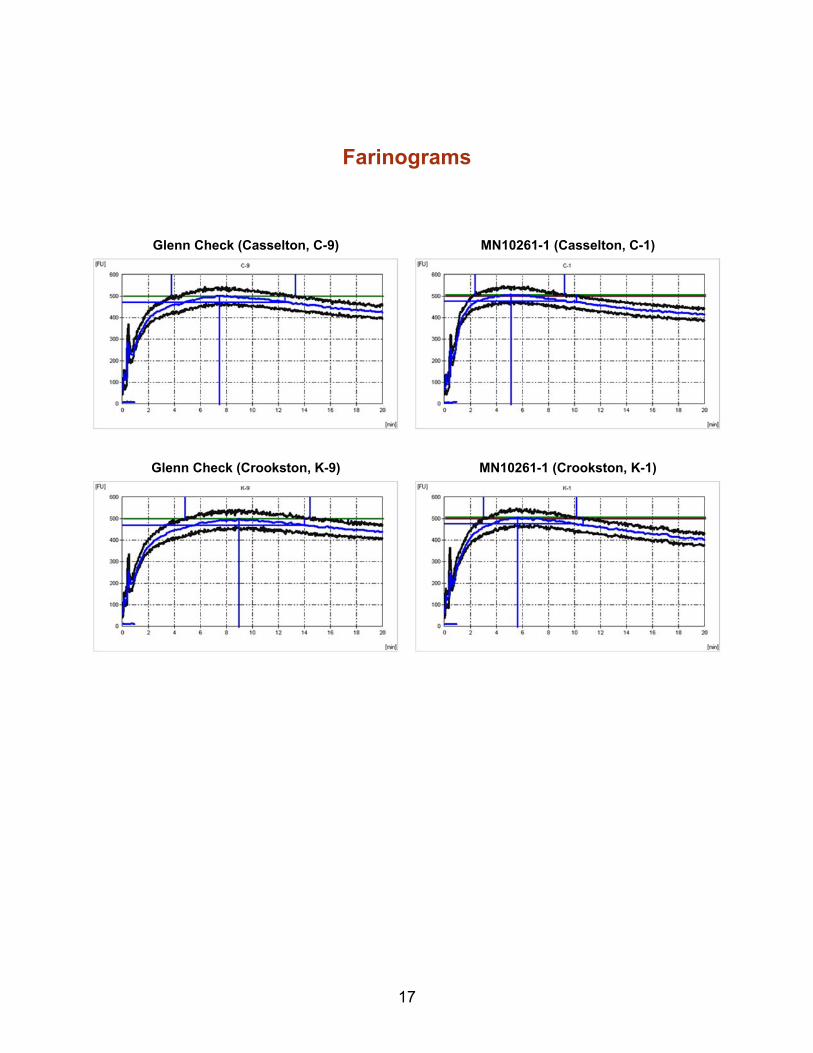
Farinograms MN10261-1 (Casselton, C-1) Glenn Check (Casselton, C-9)
MN10261-1 (Crookston, K-1) Glenn Check (Crookston, K-9)
18
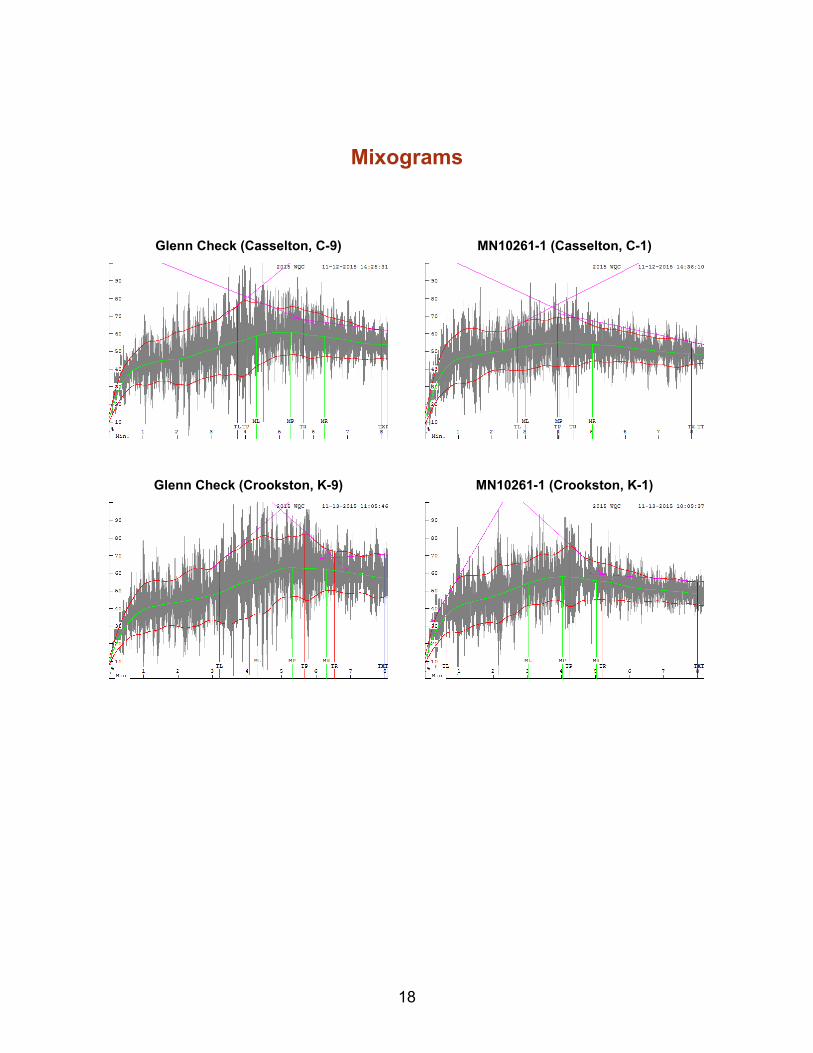
Mixograms
Glenn Check (Casselton, C-9) MN10261-1 (Casselton, C-1)
Glenn Check (Crookston, K-9) MN10261-1 (Crookston, K-1)
19
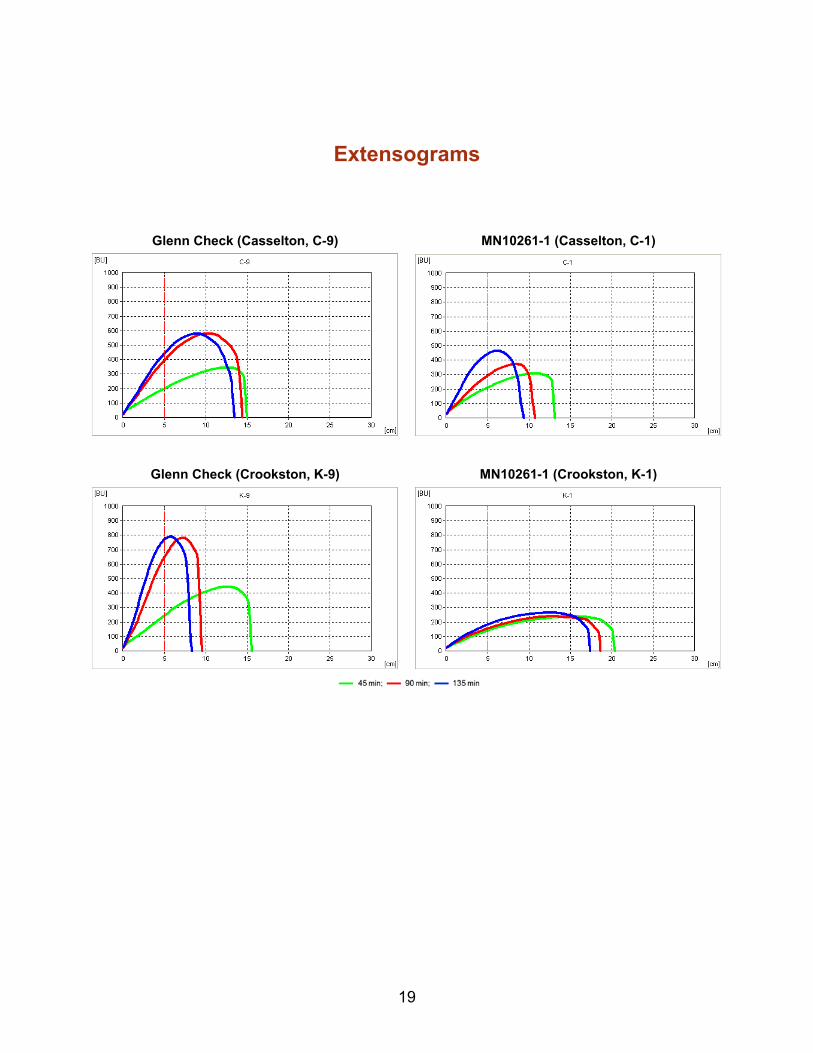
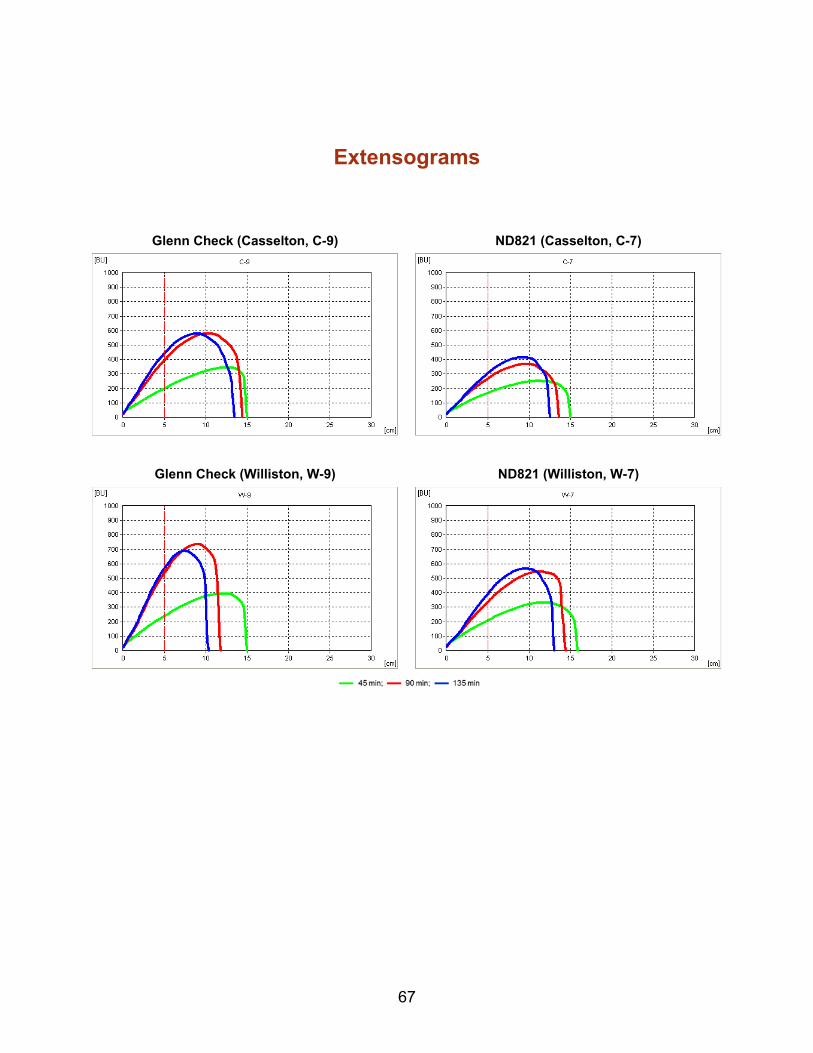
Extensograms
MN10261-1 (Casselton, C-1)
MN10261-1 (Crookston, K-1)
Glenn Check (Casselton, C-9)
Glenn Check (Crookston, K-9)
20
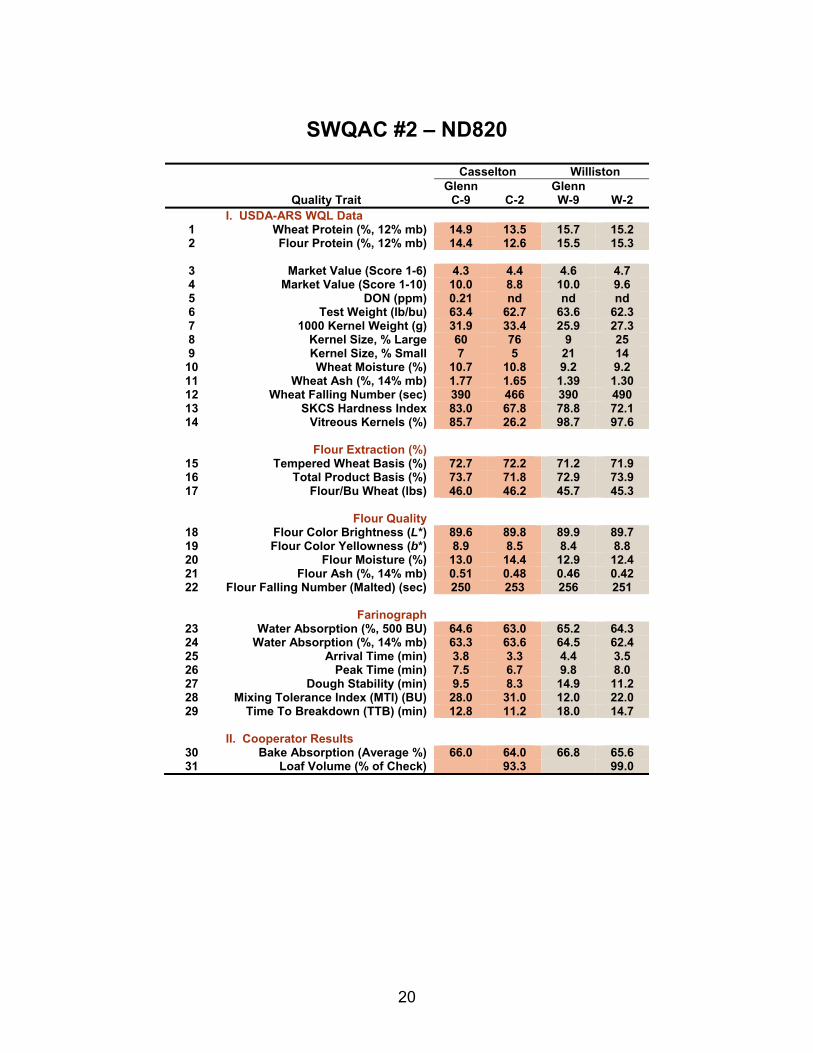
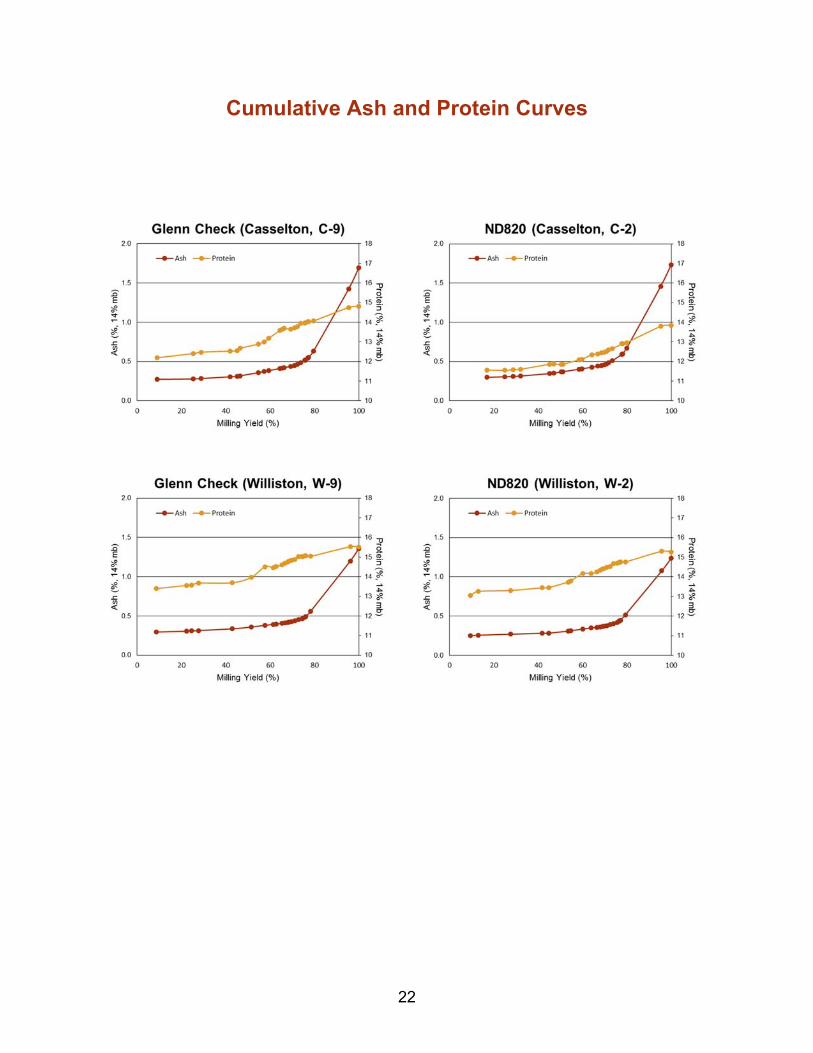
SWQAC #2 – ND820
Casselton Williston
Quality Trait Glenn
C-9 C-2 Glenn W-9
W-2
I. USDA-ARS WQL Data 1 Wheat Protein (%, 12% mb) 14.9 13.5 15.7 15.2 2 Flour Protein (%, 12% mb) 14.4 12.6 15.5 15.3
3 Market Value (Score 1-6) 4.3 4.4 4.6 4.7 4 Market Value (Score 1-10) 10.0 8.8 10.0 9.6 5 DON (ppm) 0.21 nd nd nd 6 Test Weight (lb/bu) 63.4 62.7 63.6 62.3 7 1000 Kernel Weight (g) 31.9 33.4 25.9 27.3 8 Kernel Size, % Large 60 76 9 25 9 Kernel Size, % Small 7 5 21 14
10 Wheat Moisture (%) 10.7 10.8 9.2 9.2 11 Wheat Ash (%, 14% mb) 1.77 1.65 1.39 1.30 12 Wheat Falling Number (sec) 390 466 390 490 13 SKCS Hardness Index 83.0 67.8 78.8 72.1 14 Vitreous Kernels (%) 85.7 26.2 98.7 97.6
Flour Extraction (%)
15 Tempered Wheat Basis (%) 72.7 72.2 71.2 71.9 16 Total Product Basis (%) 73.7 71.8 72.9 73.9 17 Flour/Bu Wheat (lbs) 46.0 46.2 45.7 45.3
Flour Quality
18 Flour Color Brightness (L*) 89.6 89.8 89.9 89.7 19 Flour Color Yellowness (b*) 8.9 8.5 8.4 8.8 20 Flour Moisture (%) 13.0 14.4 12.9 12.4 21 Flour Ash (%, 14% mb) 0.51 0.48 0.46 0.42 22 Flour Falling Number (Malted) (sec) 250 253 256 251
Farinograph
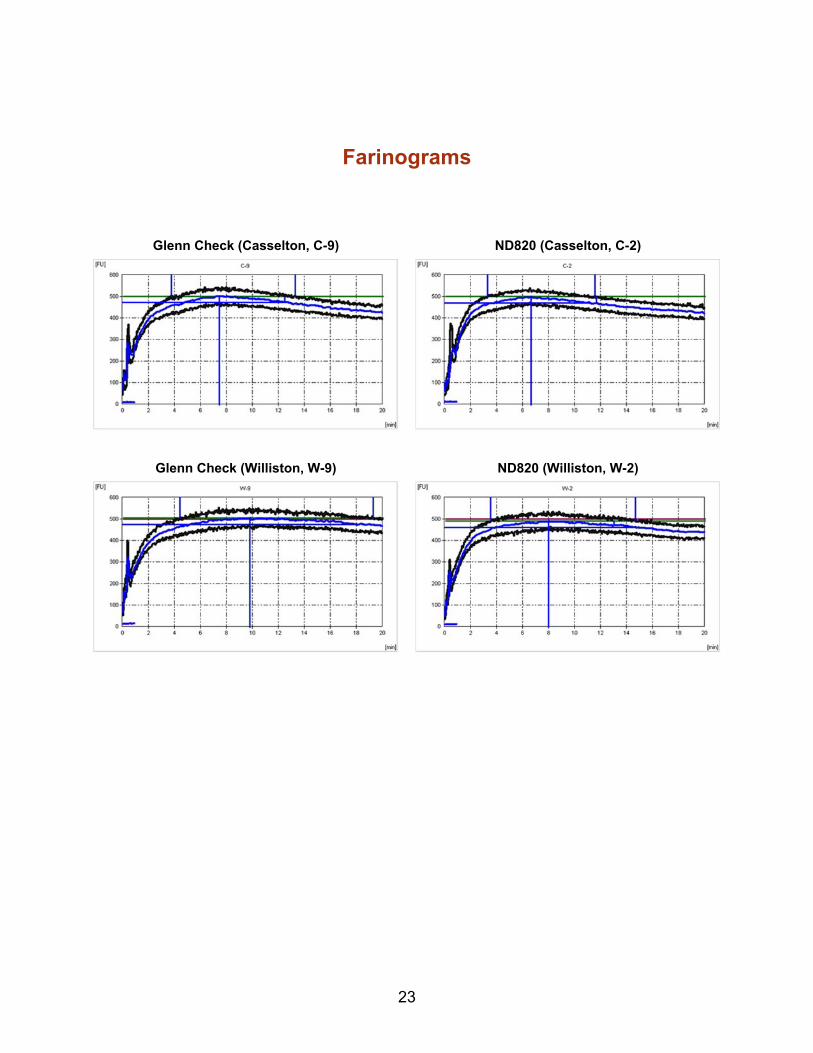
23 Water Absorption (%, 500 BU) 64.6 63.0 65.2 64.3 24 Water Absorption (%, 14% mb) 63.3 63.6 64.5 62.4 25 Arrival Time (min) 3.8 3.3 4.4 3.5 26 Peak Time (min) 7.5 6.7 9.8 8.0 27 Dough Stability (min) 9.5 8.3 14.9 11.2 28 Mixing Tolerance Index (MTI) (BU) 28.0 31.0 12.0 22.0 29 Time To Breakdown (TTB) (min) 12.8 11.2 18.0 14.7
II. Cooperator Results
30 Bake Absorption (Average %) 66.0 64.0 66.8 65.6 31 Loaf Volume (% of Check) 93.3 99.0

21
SWQAC #2 – ND820
Casselton Williston
Quality Trait Glenn
C-9 C-2 Glenn W-9
W-2
II. Cooperator Results 32 Mixing Requirement
5 = Very Long 4 = Long
3 = Medium 2 = Short
1 = Very Short
3.5 2.8 4.1 3.6
33 Dough Characteristics
5 = Bucky – Tough 4 = Strong – Elastic
3 = Medium – Pliable 2 = Mellow – Very Pliable
1 = Weak – Short or Sticky
3.6 3.0 4.0 3.7
34 Mixing Tolerance
5 = Much More Tolerance Than Check 4 = More Tolerance Than Check
3 = Tolerance Equivalent To Check 2 = Less Tolerance Than Check
1 = Much Less Tolerance Than Check
2.7 2.5
35 Internal Crumb Color
5 = Much Brighter Than Check 4 = Brighter Than Check 3 = Equivalent To Check
2 = Poorer Than Check 1 = Much Poorer Than Check
3.3 3.2
36 Internal Grain and Texture
5 = Much Better Than Check 4 = Better Than Check
3 = Equivalent To Check 2 = Poorer Than Check
1 = Much Poorer Than Check
3.5 3.5
III. Cooperator Evaluation Quality Traits 1-2: Protein
5 = Much Better Than Check 4 = Better Than Check
3 = Equivalent To Check 2 = Poorer Than Check
1 = Much Poorer Than Check
1.5 2.7
Quality Traits 3-22: Milling
5 = Much Better Than Check 4 = Better Than Check
3 = Equivalent To Check 2 = Poorer Than Check
1 = Much Poorer Than Check
2.7 3.3
Quality Traits 23-36: Baking
5 = Much Better Than Check 4 = Better Than Check
3 = Equivalent To Check 2 = Poorer Than Check
1 = Much Poorer Than Check
2.7 3.2
Quality Traits 1-36: Overall Comparison
5 = Much Better Than Check 4 = Better Than Check
3 = Equivalent To Check 2 = Poorer Than Check
1 = Much Poorer Than Check
2.4 3.0
22
Cumulative Ash and Protein Curves
23
Farinograms
ND820 (Casselton, C-2) Glenn Check (Casselton, C-9)
ND820 (Williston, W-2) Glenn Check (Williston, W-9)
24
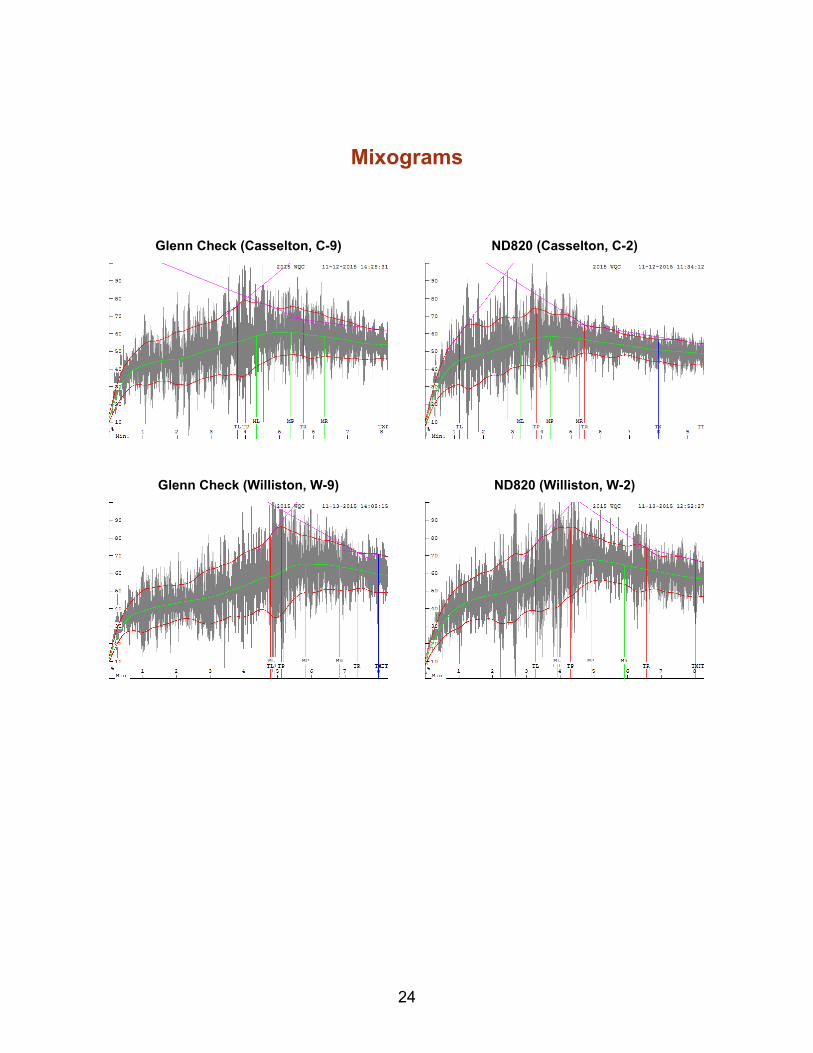
Mixograms
Glenn Check (Casselton, C-9) ND820 (Casselton, C-2)
Glenn Check (Williston, W-9) ND820 (Williston, W-2)
25
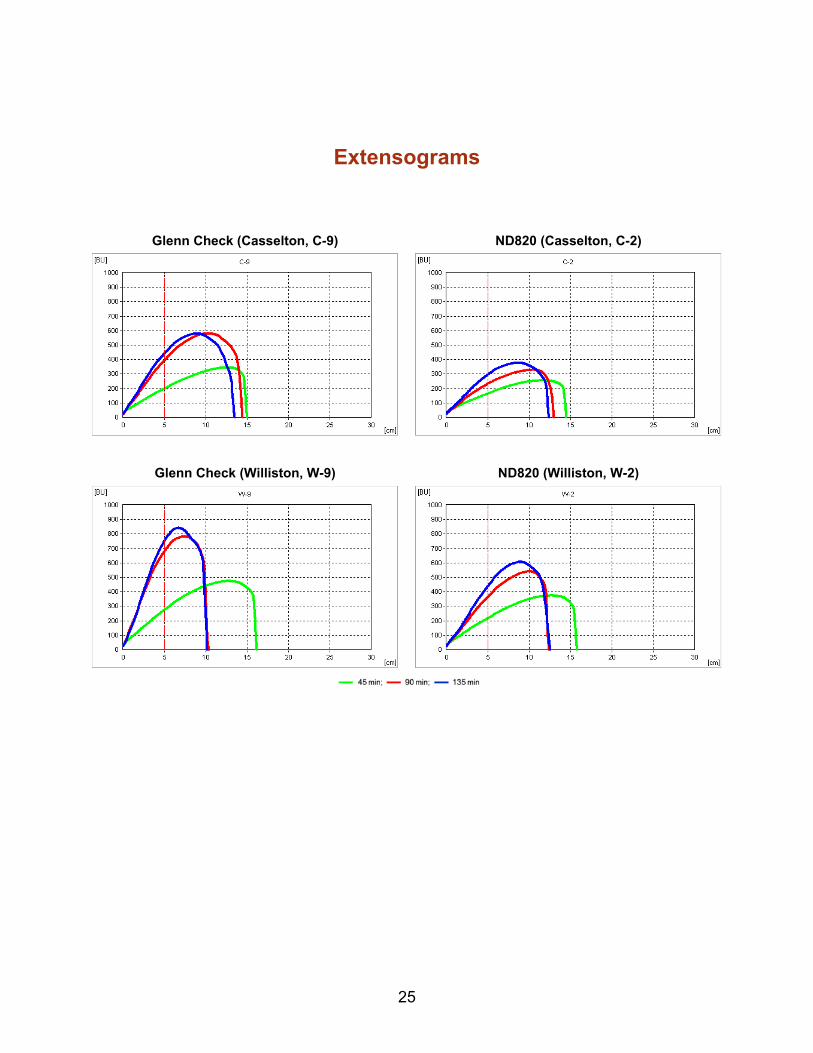
Extensograms
ND820 (Casselton, C-2) Glenn Check (Casselton, C-9)
ND820 (Williston, W-2) Glenn Check (Williston, W-9)

26
SWQAC #3 - Bolles
Watertown Casselton Crookston Williston Bozeman
Quality Trait Glenn
B-9
B-3 Glenn
C-9
C-3 Glenn
K-9
K-3 Glenn W-9
W-3
Glenn Z-9
Z-3
I. USDA-ARS WQL Data 1 Wheat Protein (%, 12% mb) 15.5 13.7 14.9 15.8 15.5 16.2 15.7 17.0 15.1 15.9 2 Flour Protein (%, 12% mb) 14.5 13.1 14.4 15.2 15.3 16.2 15.5 17.3 14.5 15.5
3 Market Value (Score 1-6) 4.4 3.7 4.3 4.0 4.7 4.9 4.6 5.0 4.6 4.9 4 Market Value (Score 1-10) 10.0 7.4 10.0 8.4 10.0 9.0 10.0 9.6 10.0 9.2 5 DON (ppm) nd nd 0.21 0.98 nd nd nd nd nd nd 6 Test Weight (lb/bu) 62.0 59.0 63.4 59.6 64.7 61.8 63.6 61.6 65.4 63.0 7 1000 Kernel Weight (g) 33.3 32.9 31.9 28.1 29.8 32.8 25.9 28.6 37.2 37.7 8 Kernel Size, % Large 75 73 60 50 47 68 9 23 79 83 9 Kernel Size, % Small 5 7 7 12 11 7 21 10 4 5
10 Wheat Moisture (%) 10.9 11.0 10.7 10.3 10.3 10.9 9.2 10.3 10.3 10.1 11 Wheat Ash (%, 14% mb) 1.63 1.63 1.77 1.76 1.42 1.60 1.39 1.43 1.58 1.58 12 Wheat Falling Number (sec) 366 430 390 462 387 415 390 501 347 347 13 SKCS Hardness Index 76.2 75.7 83.0 83.2 85.6 87.5 78.8 73.6 82.5 77.2 14 Vitreous Kernels (%) 76.2 47.3 85.7 86.6 95.6 97.4 98.7 98.4 96.4 95.4
Flour Extraction (%)
15 Tempered Wheat Basis (%) 70.6 72.0 72.7 70.7 73.5 72.6 71.2 70.0 71.5 70.1 16 Total Product Basis (%) 73.5 73.7 73.7 72.8 74.8 74.2 72.9 72.0 73.2 72.0 17 Flour/Bu Wheat (lbs) 43.4 42.3 46.0 43.4 47.8 45.1 45.7 43.6 47.2 44.0
Flour Quality
18 Flour Color Brightness (L*) 89.8 90.0 89.6 89.4 90.0 89.6 89.9 89.4 89.7 89.7 19 Flour Color Yellowness (b*) 8.0 8.5 8.9 9.7 8.4 9.0 8.4 9.3 8.9 10.0 20 Flour Moisture (%) 12.4 12.8 13.0 14.4 12.7 13.4 12.9 13.5 12.9 12.4 21 Flour Ash (%, 14% mb) 0.49 0.51 0.51 0.53 0.44 0.50 0.46 0.47 0.50 0.52 22 Flour Falling Number (Malted) (sec) 251 249 250 243 250 247 256 250 251 244
Farinograph
23 Water Absorption (%, 500 BU) 65.5 62.1 64.6 61.2 63.9 64.6 65.2 64.8 71.0 68.5 24 Water Absorption (%, 14% mb) 63.4 60.5 63.3 61.7 62.1 64.0 64.5 64.3 69.6 66.6 25 Arrival Time (min) 2.7 2.7 3.8 3.1 4.8 4.6 4.4 6.2 4.5 4.3 26 Peak Time (min) 7.9 8.3 7.5 7.0 9.0 9.2 9.8 10.7 5.9 6.9 27 Dough Stability (min) 11.1 11.8 9.5 13.0 9.6 12.5 14.9 19.2 6.2 5.8 28 Mixing Tolerance Index (MTI) (BU) 25.0 27.0 28.0 11.0 28.0 23.0 12.0 15.0 26.0 40.0 29 Time To Breakdown (TTB) (min) 13.3 13.1 12.8 15.3 14.1 15.9 18.0 20.9 11.1 10.4
II. Cooperator Results
30 Bake Absorption (Average %) 66.4 64.2 66.0 64.7 66.1 66.5 66.8 66.9 68.3 67.7 31 Loaf Volume (% of Check) 94.7 98.4 100.4 102.4 89.9
27
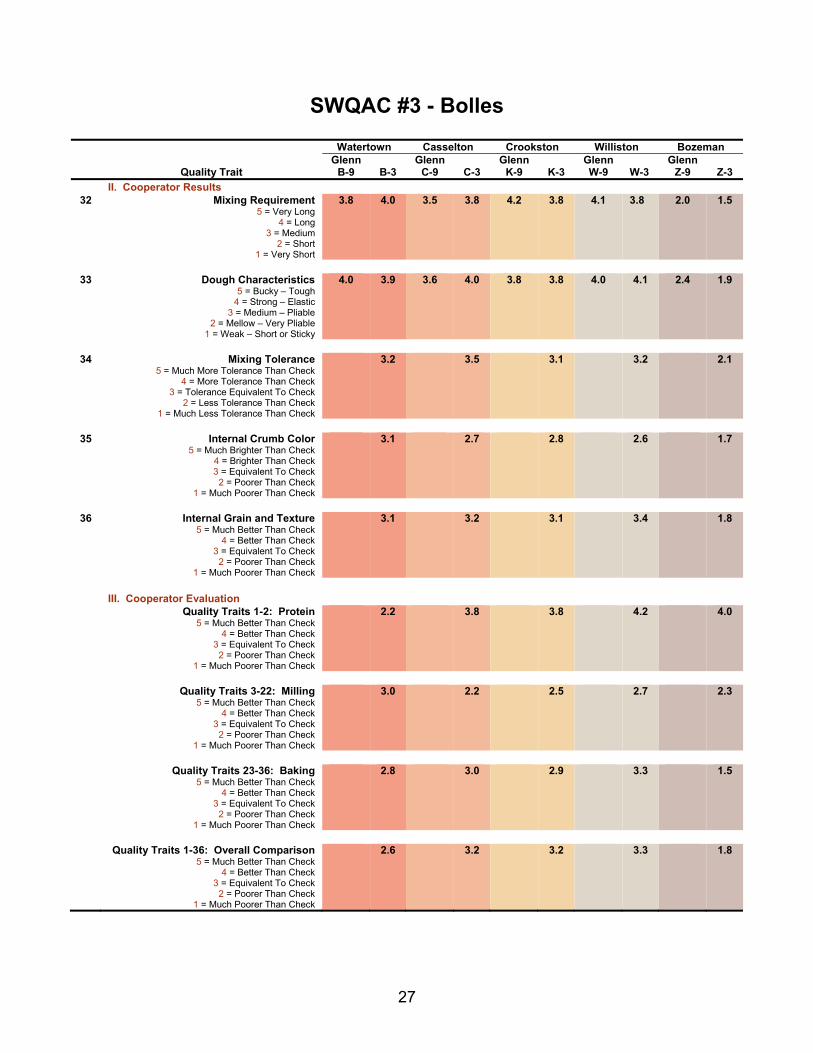
SWQAC #3 - Bolles
Watertown Casselton Crookston Williston Bozeman
Quality Trait Glenn
B-9
B-3 Glenn
C-9
C-3 Glenn
K-9
K-3 Glenn W-9
W-3
Glenn Z-9
Z-3
II. Cooperator Results 32 Mixing Requirement
5 = Very Long 4 = Long
3 = Medium 2 = Short
1 = Very Short
3.8 4.0 3.5 3.8 4.2 3.8 4.1 3.8 2.0 1.5
33 Dough Characteristics
5 = Bucky – Tough 4 = Strong – Elastic
3 = Medium – Pliable 2 = Mellow – Very Pliable
1 = Weak – Short or Sticky
4.0 3.9 3.6 4.0 3.8 3.8 4.0 4.1 2.4 1.9
34 Mixing Tolerance
5 = Much More Tolerance Than Check 4 = More Tolerance Than Check
3 = Tolerance Equivalent To Check 2 = Less Tolerance Than Check
1 = Much Less Tolerance Than Check
3.2 3.5 3.1 3.2 2.1
35 Internal Crumb Color
5 = Much Brighter Than Check 4 = Brighter Than Check 3 = Equivalent To Check
2 = Poorer Than Check 1 = Much Poorer Than Check
3.1 2.7 2.8 2.6 1.7
36 Internal Grain and Texture
5 = Much Better Than Check 4 = Better Than Check
3 = Equivalent To Check 2 = Poorer Than Check
1 = Much Poorer Than Check
3.1 3.2 3.1 3.4 1.8
III. Cooperator Evaluation Quality Traits 1-2: Protein
5 = Much Better Than Check 4 = Better Than Check
3 = Equivalent To Check 2 = Poorer Than Check
1 = Much Poorer Than Check
2.2 3.8 3.8 4.2 4.0
Quality Traits 3-22: Milling
5 = Much Better Than Check 4 = Better Than Check
3 = Equivalent To Check 2 = Poorer Than Check
1 = Much Poorer Than Check
3.0 2.2 2.5 2.7 2.3
Quality Traits 23-36: Baking
5 = Much Better Than Check 4 = Better Than Check
3 = Equivalent To Check 2 = Poorer Than Check
1 = Much Poorer Than Check
2.8 3.0 2.9 3.3 1.5
Quality Traits 1-36: Overall Comparison
5 = Much Better Than Check 4 = Better Than Check
3 = Equivalent To Check 2 = Poorer Than Check
1 = Much Poorer Than Check
2.6 3.2 3.2 3.3 1.8
28
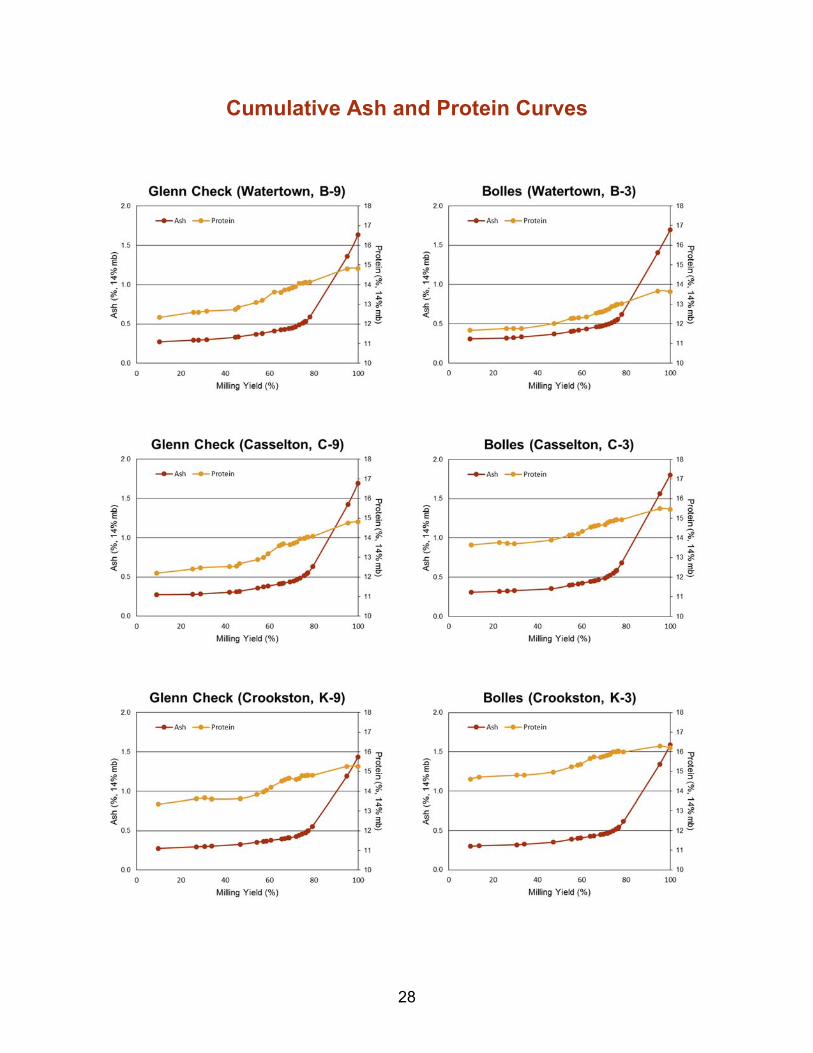
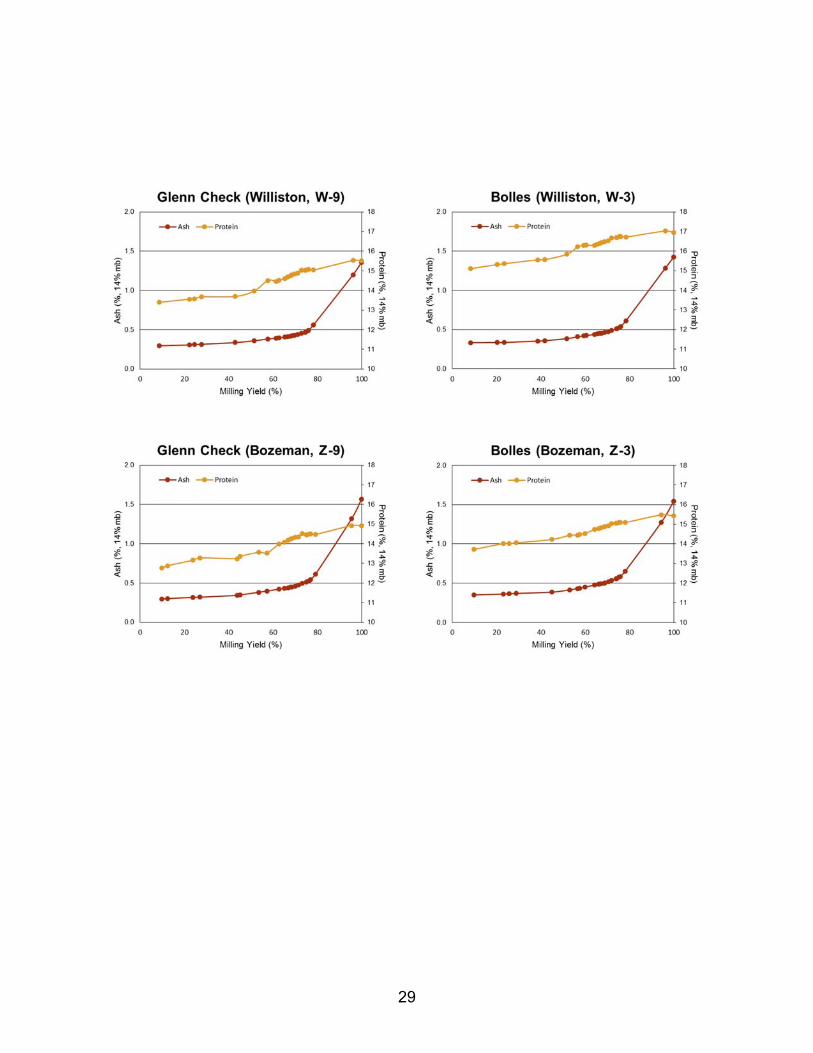
Cumulative Ash and Protein Curves
29
30
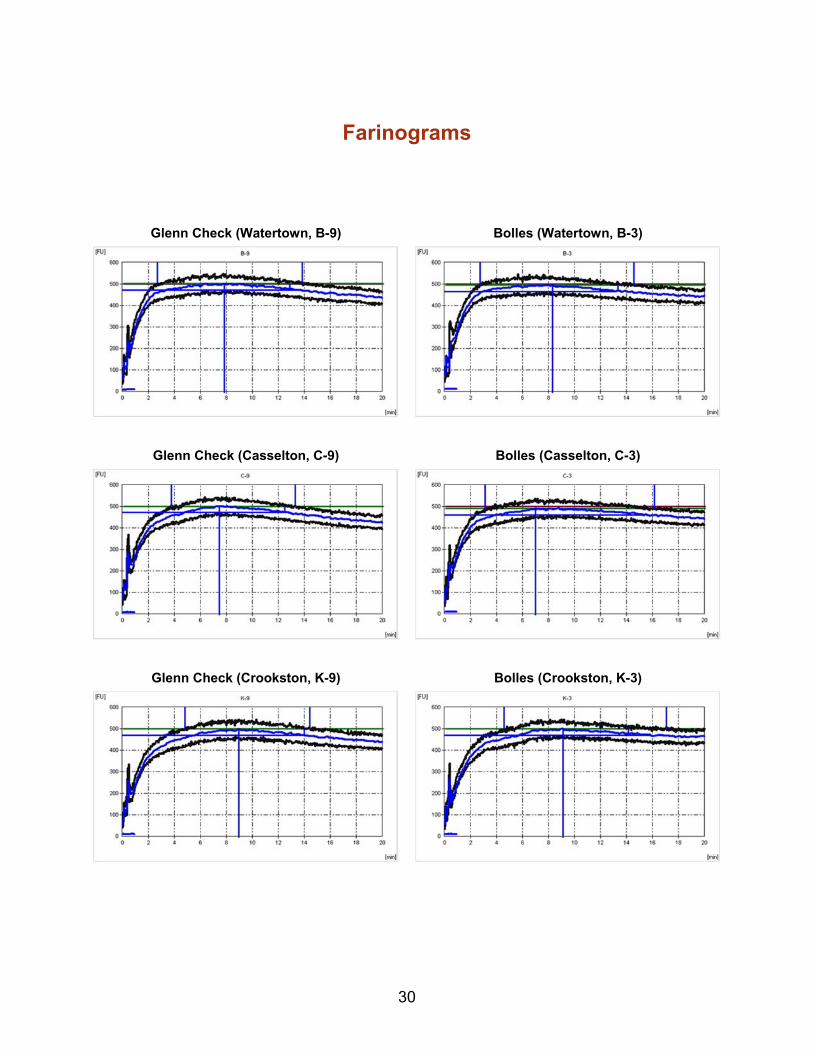
Farinograms
Bolles (Watertown, B-3) Glenn Check (Watertown, B-9)
Bolles (Casselton, C-3) Glenn Check (Casselton, C-9)
Bolles (Crookston, K-3) Glenn Check (Crookston, K-9)
31
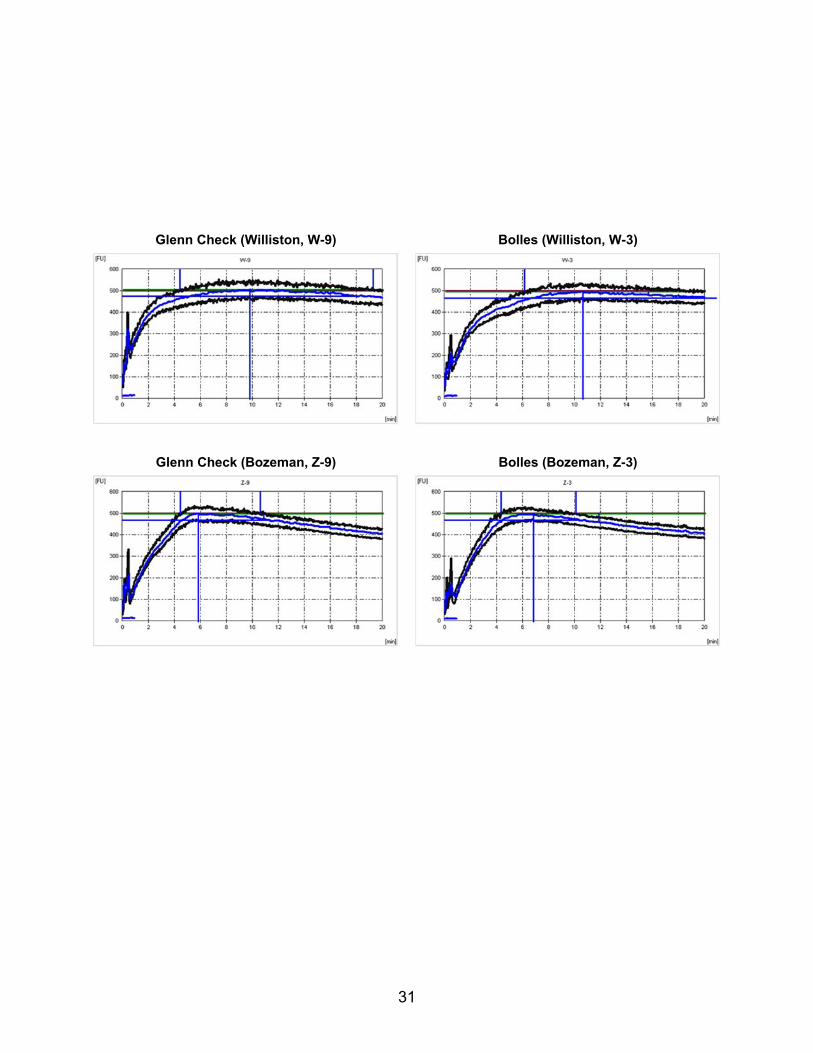
Bolles (Williston, W-3) Glenn Check (Williston, W-9)
Bolles (Bozeman, Z-3) Glenn Check (Bozeman, Z-9)
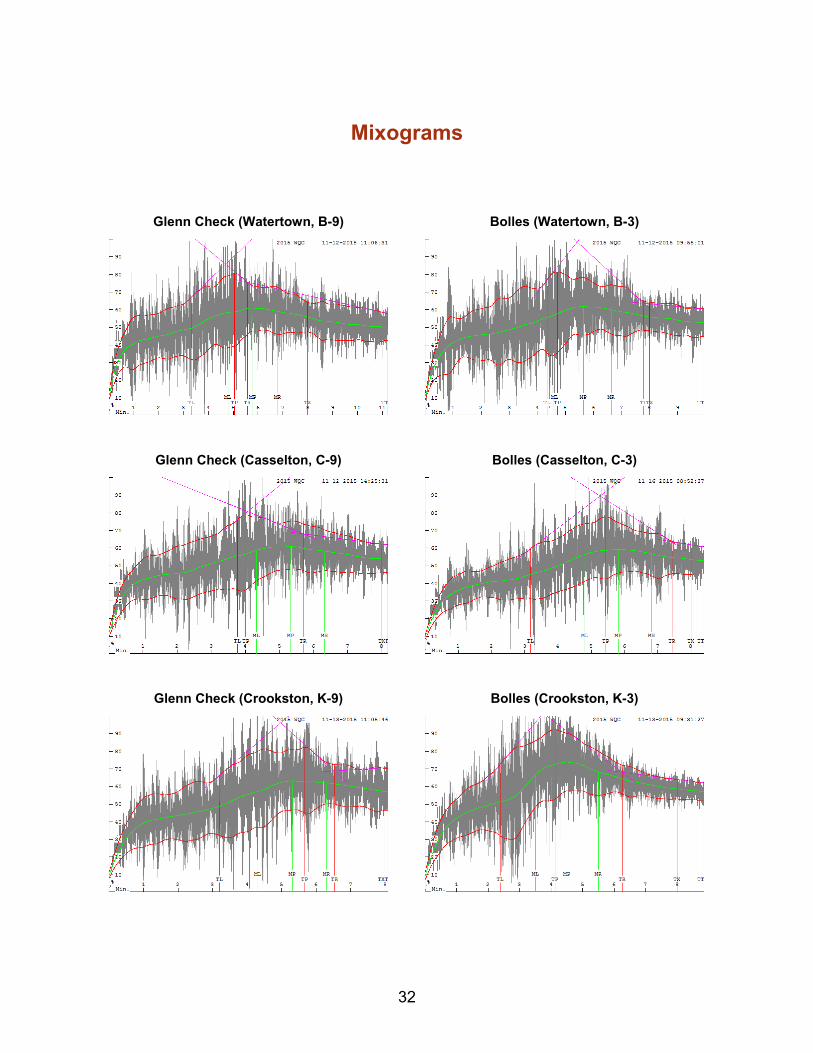
32
Mixograms
Glenn Check (Casselton, C-9)
Glenn Check (Crookston, K-9)
Glenn Check (Watertown, B-9) Bolles (Watertown, B-3)
Bolles (Casselton, C-3)
Bolles (Crookston, K-3)
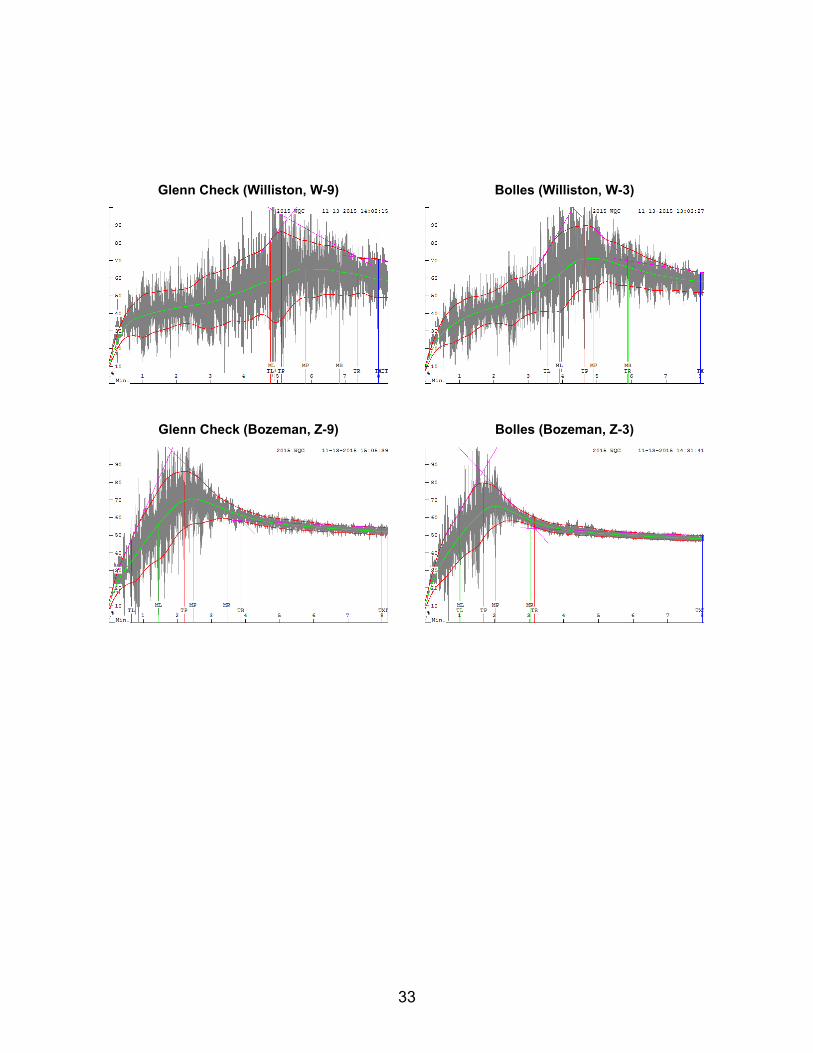
33
Glenn Check (Williston, W-9)
Glenn Check (Bozeman, Z-9)
Bolles (Williston, W-3)
Bolles (Bozeman, Z-3)
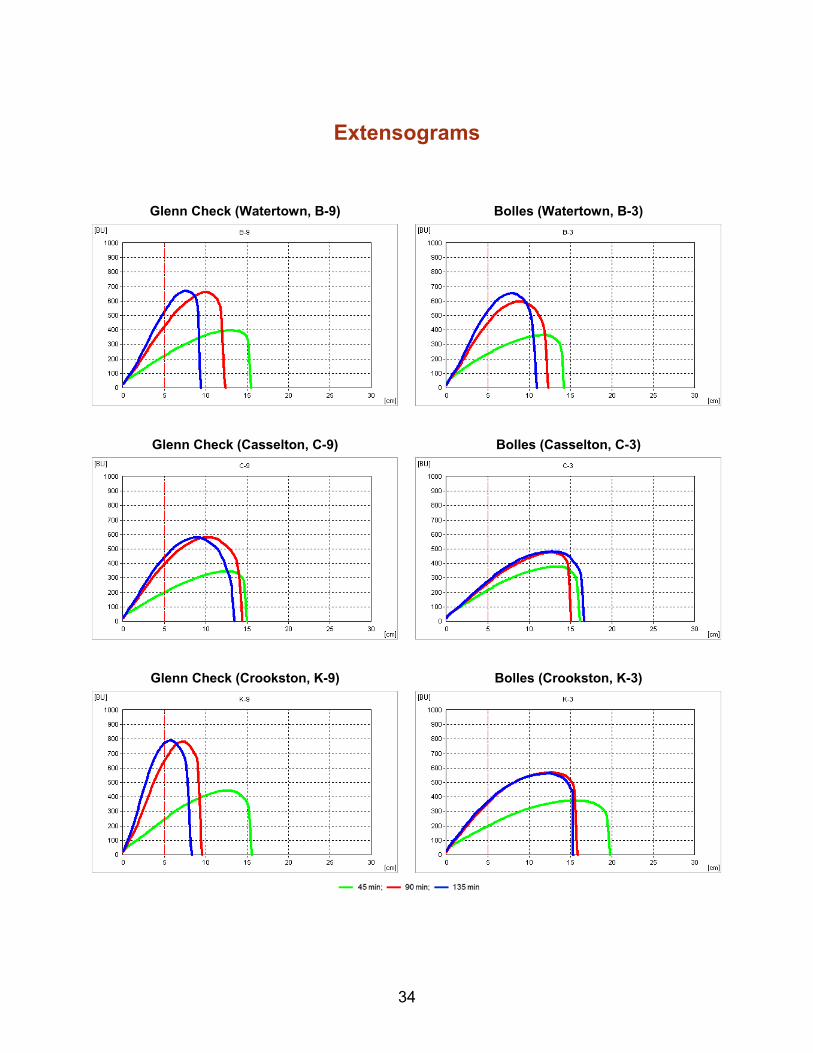
34
Extensograms
Bolles (Watertown, B-3) Glenn Check (Watertown, B-9)
Bolles (Casselton, C-3) Glenn Check (Casselton, C-9)
Bolles (Crookston, K-3) Glenn Check (Crookston, K-9)
35
Bolles (Williston, W-3) Glenn Check (Williston, W-9)
Bolles (Bozeman, Z-3) Glenn Check (Bozeman, Z-9)
36
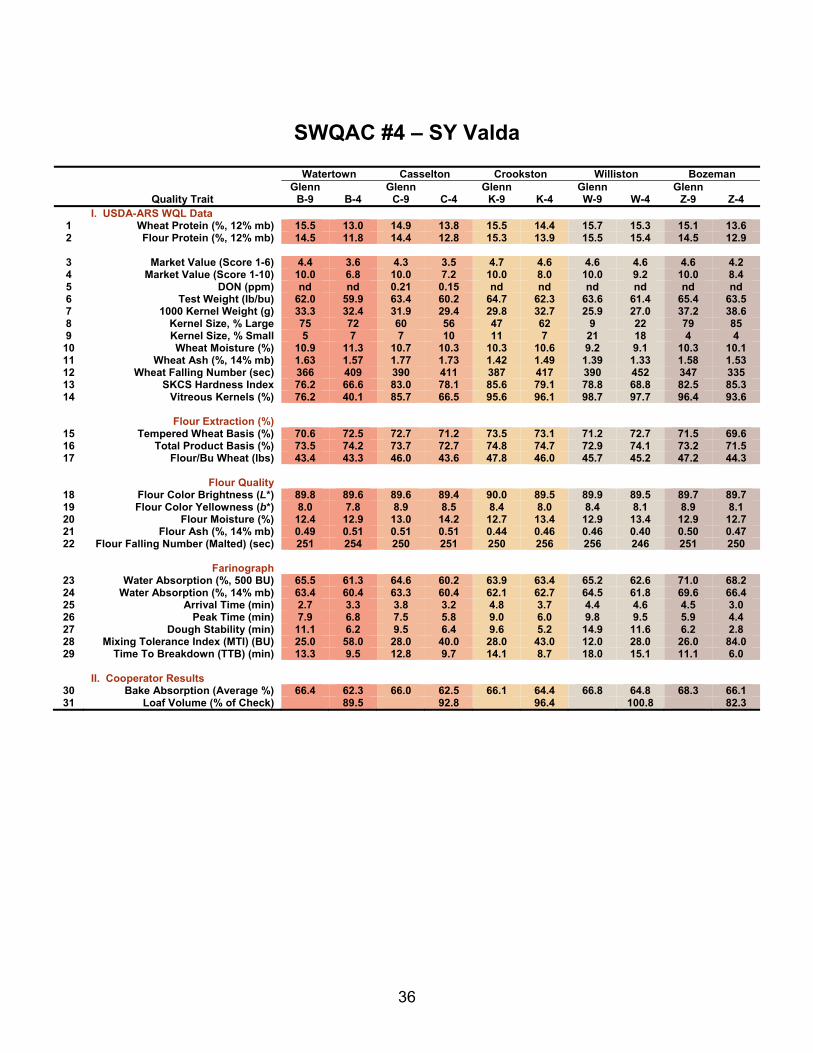
SWQAC #4 – SY Valda
Watertown Casselton Crookston Williston Bozeman
Quality Trait Glenn
B-9
B-4 Glenn
C-9
C-4 Glenn
K-9
K-4 Glenn W-9
W-4
Glenn Z-9
Z-4
I. USDA-ARS WQL Data 1 Wheat Protein (%, 12% mb) 15.5 13.0 14.9 13.8 15.5 14.4 15.7 15.3 15.1 13.6 2 Flour Protein (%, 12% mb) 14.5 11.8 14.4 12.8 15.3 13.9 15.5 15.4 14.5 12.9
3 Market Value (Score 1-6) 4.4 3.6 4.3 3.5 4.7 4.6 4.6 4.6 4.6 4.2 4 Market Value (Score 1-10) 10.0 6.8 10.0 7.2 10.0 8.0 10.0 9.2 10.0 8.4 5 DON (ppm) nd nd 0.21 0.15 nd nd nd nd nd nd 6 Test Weight (lb/bu) 62.0 59.9 63.4 60.2 64.7 62.3 63.6 61.4 65.4 63.5 7 1000 Kernel Weight (g) 33.3 32.4 31.9 29.4 29.8 32.7 25.9 27.0 37.2 38.6 8 Kernel Size, % Large 75 72 60 56 47 62 9 22 79 85 9 Kernel Size, % Small 5 7 7 10 11 7 21 18 4 4
10 Wheat Moisture (%) 10.9 11.3 10.7 10.3 10.3 10.6 9.2 9.1 10.3 10.1 11 Wheat Ash (%, 14% mb) 1.63 1.57 1.77 1.73 1.42 1.49 1.39 1.33 1.58 1.53 12 Wheat Falling Number (sec) 366 409 390 411 387 417 390 452 347 335 13 SKCS Hardness Index 76.2 66.6 83.0 78.1 85.6 79.1 78.8 68.8 82.5 85.3 14 Vitreous Kernels (%) 76.2 40.1 85.7 66.5 95.6 96.1 98.7 97.7 96.4 93.6
Flour Extraction (%)
15 Tempered Wheat Basis (%) 70.6 72.5 72.7 71.2 73.5 73.1 71.2 72.7 71.5 69.6 16 Total Product Basis (%) 73.5 74.2 73.7 72.7 74.8 74.7 72.9 74.1 73.2 71.5 17 Flour/Bu Wheat (lbs) 43.4 43.3 46.0 43.6 47.8 46.0 45.7 45.2 47.2 44.3
Flour Quality
18 Flour Color Brightness (L*) 89.8 89.6 89.6 89.4 90.0 89.5 89.9 89.5 89.7 89.7 19 Flour Color Yellowness (b*) 8.0 7.8 8.9 8.5 8.4 8.0 8.4 8.1 8.9 8.1 20 Flour Moisture (%) 12.4 12.9 13.0 14.2 12.7 13.4 12.9 13.4 12.9 12.7 21 Flour Ash (%, 14% mb) 0.49 0.51 0.51 0.51 0.44 0.46 0.46 0.40 0.50 0.47 22 Flour Falling Number (Malted) (sec) 251 254 250 251 250 256 256 246 251 250
Farinograph
23 Water Absorption (%, 500 BU) 65.5 61.3 64.6 60.2 63.9 63.4 65.2 62.6 71.0 68.2 24 Water Absorption (%, 14% mb) 63.4 60.4 63.3 60.4 62.1 62.7 64.5 61.8 69.6 66.4 25 Arrival Time (min) 2.7 3.3 3.8 3.2 4.8 3.7 4.4 4.6 4.5 3.0 26 Peak Time (min) 7.9 6.8 7.5 5.8 9.0 6.0 9.8 9.5 5.9 4.4 27 Dough Stability (min) 11.1 6.2 9.5 6.4 9.6 5.2 14.9 11.6 6.2 2.8 28 Mixing Tolerance Index (MTI) (BU) 25.0 58.0 28.0 40.0 28.0 43.0 12.0 28.0 26.0 84.0 29 Time To Breakdown (TTB) (min) 13.3 9.5 12.8 9.7 14.1 8.7 18.0 15.1 11.1 6.0
II. Cooperator Results
30 Bake Absorption (Average %) 66.4 62.3 66.0 62.5 66.1 64.4 66.8 64.8 68.3 66.1 31 Loaf Volume (% of Check) 89.5 92.8 96.4 100.8 82.3
37
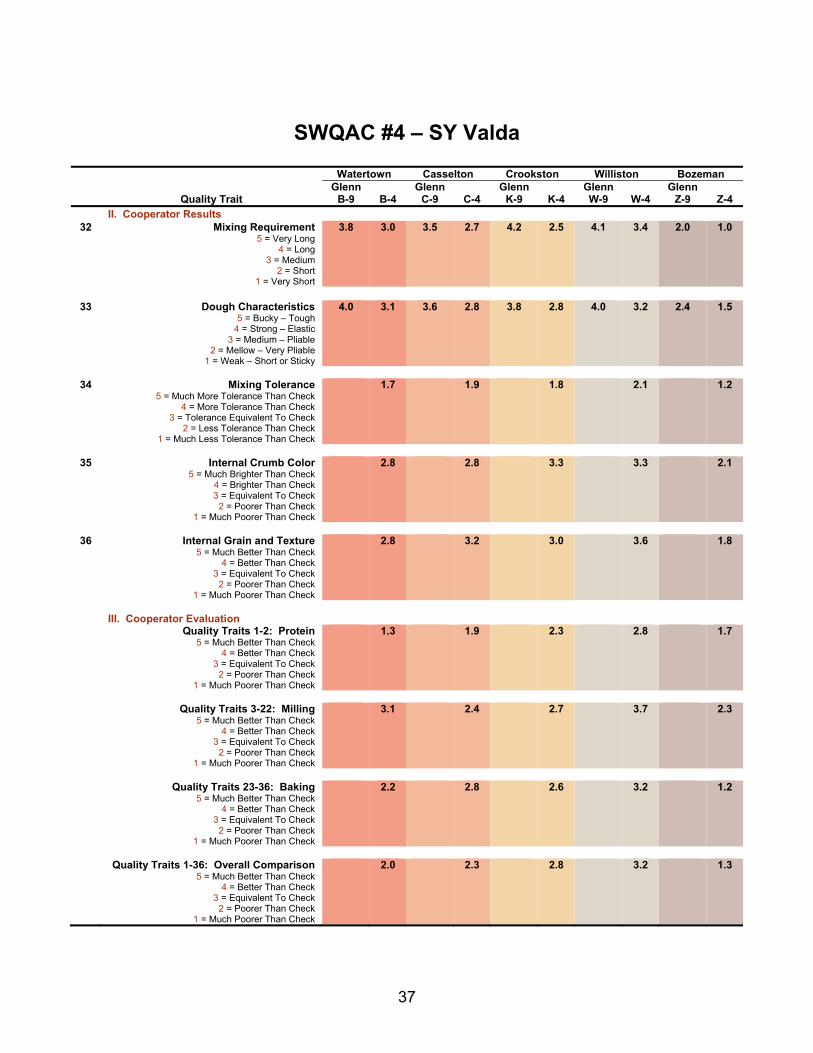
SWQAC #4 – SY Valda
Watertown Casselton Crookston Williston Bozeman
Quality Trait Glenn
B-9
B-4 Glenn
C-9
C-4 Glenn
K-9
K-4 Glenn W-9
W-4
Glenn Z-9
Z-4
II. Cooperator Results 32 Mixing Requirement
5 = Very Long 4 = Long
3 = Medium 2 = Short
1 = Very Short
3.8 3.0 3.5 2.7 4.2 2.5 4.1 3.4 2.0 1.0
33 Dough Characteristics
5 = Bucky – Tough 4 = Strong – Elastic
3 = Medium – Pliable 2 = Mellow – Very Pliable
1 = Weak – Short or Sticky
4.0 3.1 3.6 2.8 3.8 2.8 4.0 3.2 2.4 1.5
34 Mixing Tolerance
5 = Much More Tolerance Than Check 4 = More Tolerance Than Check
3 = Tolerance Equivalent To Check 2 = Less Tolerance Than Check
1 = Much Less Tolerance Than Check
1.7 1.9 1.8 2.1 1.2
35 Internal Crumb Color
5 = Much Brighter Than Check 4 = Brighter Than Check 3 = Equivalent To Check
2 = Poorer Than Check 1 = Much Poorer Than Check
2.8 2.8 3.3 3.3 2.1
36 Internal Grain and Texture
5 = Much Better Than Check 4 = Better Than Check
3 = Equivalent To Check 2 = Poorer Than Check
1 = Much Poorer Than Check
2.8 3.2 3.0 3.6 1.8
III. Cooperator Evaluation Quality Traits 1-2: Protein
5 = Much Better Than Check 4 = Better Than Check
3 = Equivalent To Check 2 = Poorer Than Check
1 = Much Poorer Than Check
1.3 1.9 2.3 2.8 1.7
Quality Traits 3-22: Milling
5 = Much Better Than Check 4 = Better Than Check
3 = Equivalent To Check 2 = Poorer Than Check
1 = Much Poorer Than Check
3.1 2.4 2.7 3.7 2.3
Quality Traits 23-36: Baking
5 = Much Better Than Check 4 = Better Than Check
3 = Equivalent To Check 2 = Poorer Than Check
1 = Much Poorer Than Check
2.2 2.8 2.6 3.2 1.2
Quality Traits 1-36: Overall Comparison
5 = Much Better Than Check 4 = Better Than Check
3 = Equivalent To Check 2 = Poorer Than Check
1 = Much Poorer Than Check
2.0 2.3 2.8 3.2 1.3
38
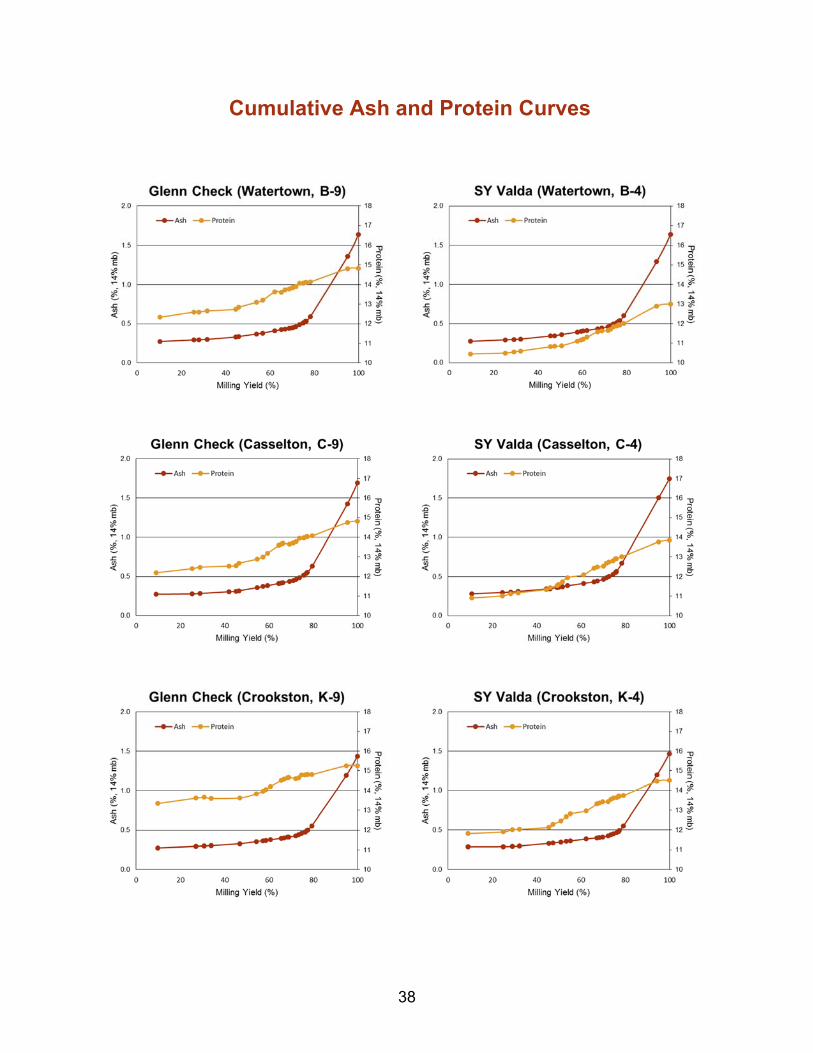
Cumulative Ash and Protein Curves
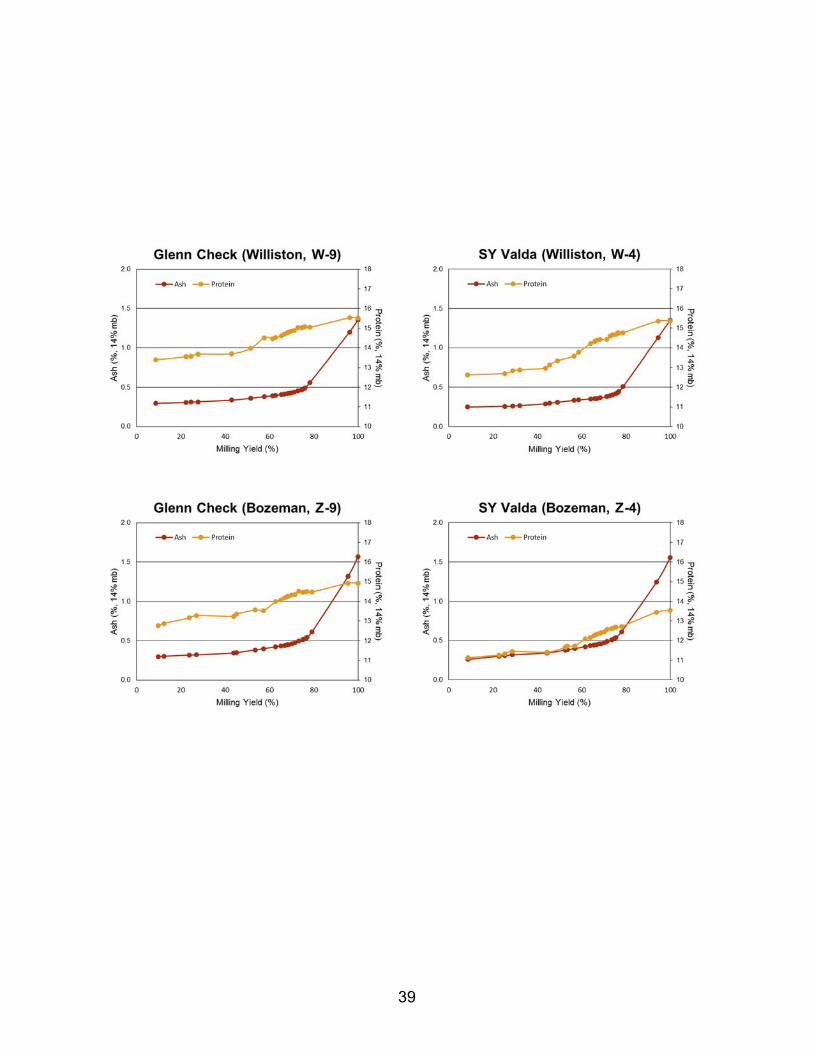
39
40
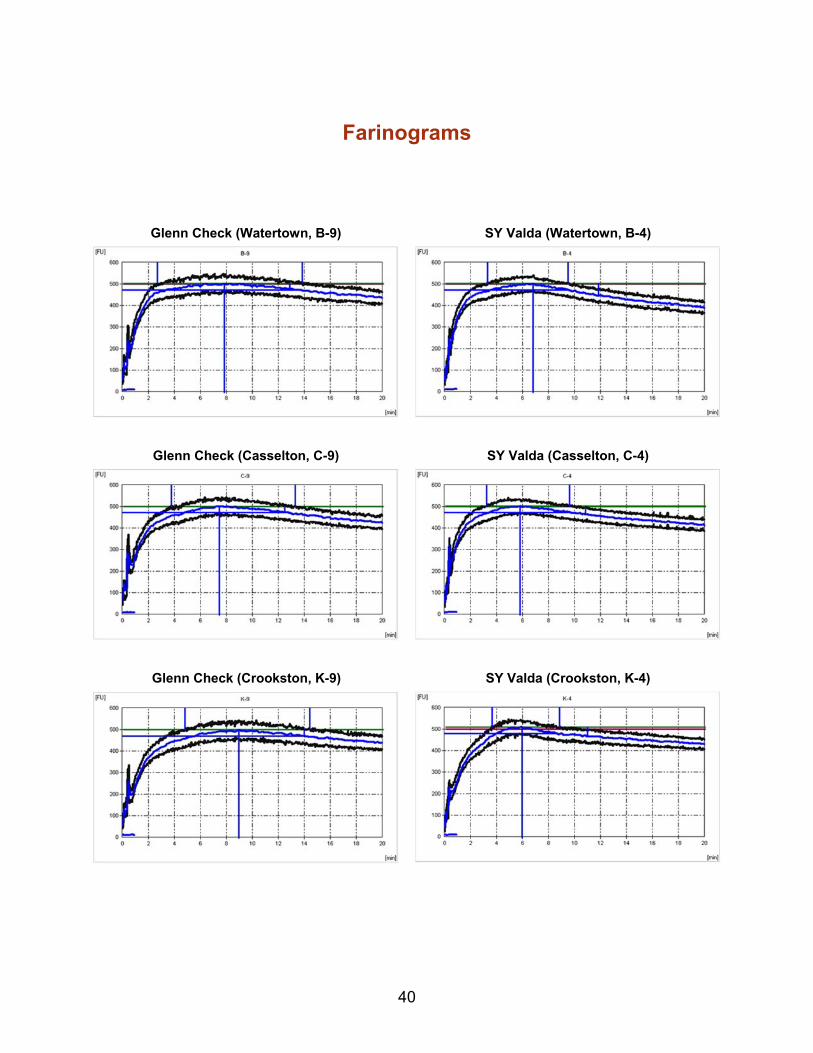
Farinograms
SY Valda (Watertown, B-4) Glenn Check (Watertown, B-9)
SY Valda (Casselton, C-4) Glenn Check (Casselton, C-9)
SY Valda (Crookston, K-4) Glenn Check (Crookston, K-9)
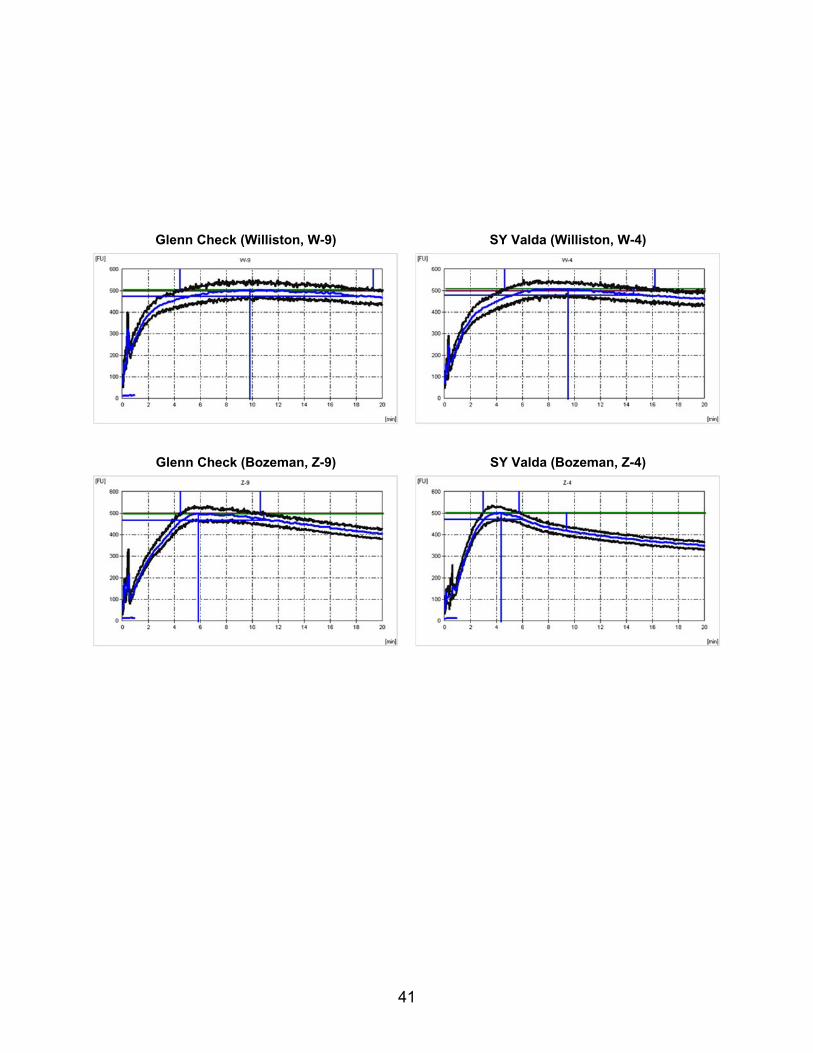
41
SY Valda (Williston, W-4) Glenn Check (Williston, W-9)
SY Valda (Bozeman, Z-4) Glenn Check (Bozeman, Z-9)
42
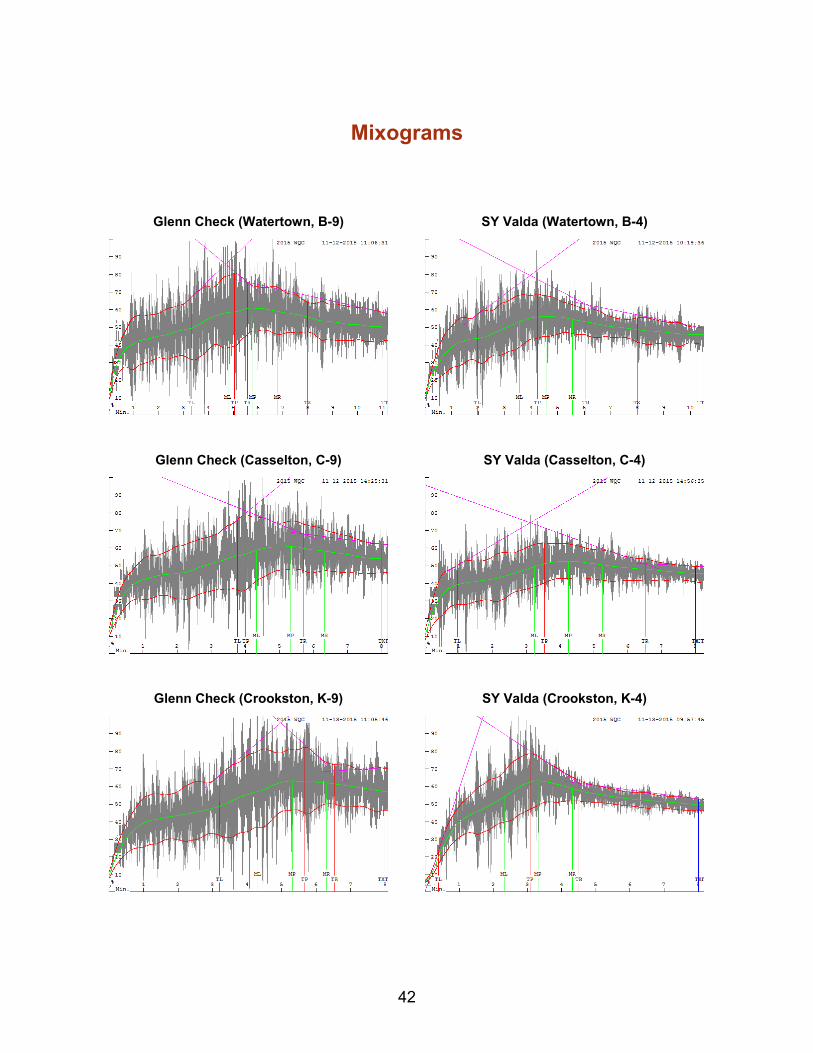
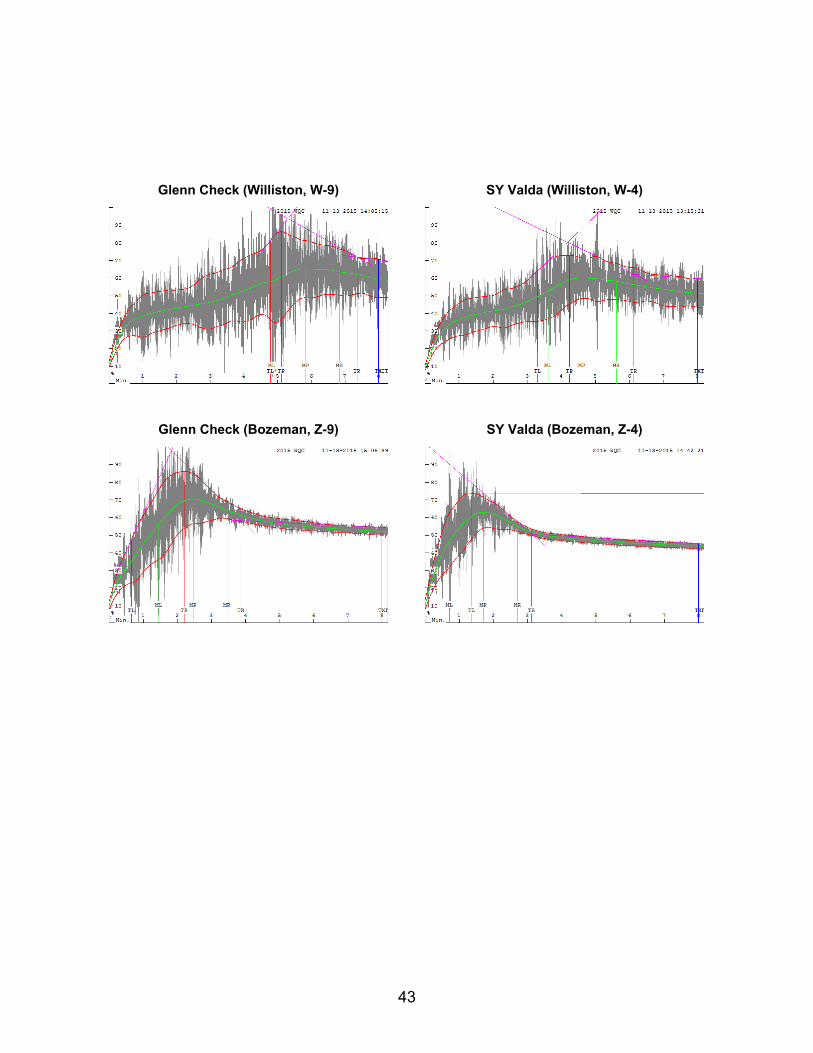
Mixograms
Glenn Check (Bozeman, Z-9)
Glenn Check (Casselton, C-9)
Glenn Check (Crookston, K-9)
Glenn Check (Watertown, B-9) SY Valda (Watertown, B-4)
SY Valda (Casselton, C-4)
SY Valda (Crookston, K-4)
43
Glenn Check (Williston, W-9)
Glenn Check (Bozeman, Z-9)
SY Valda (Williston, W-4)
SY Valda (Bozeman, Z-4)
44
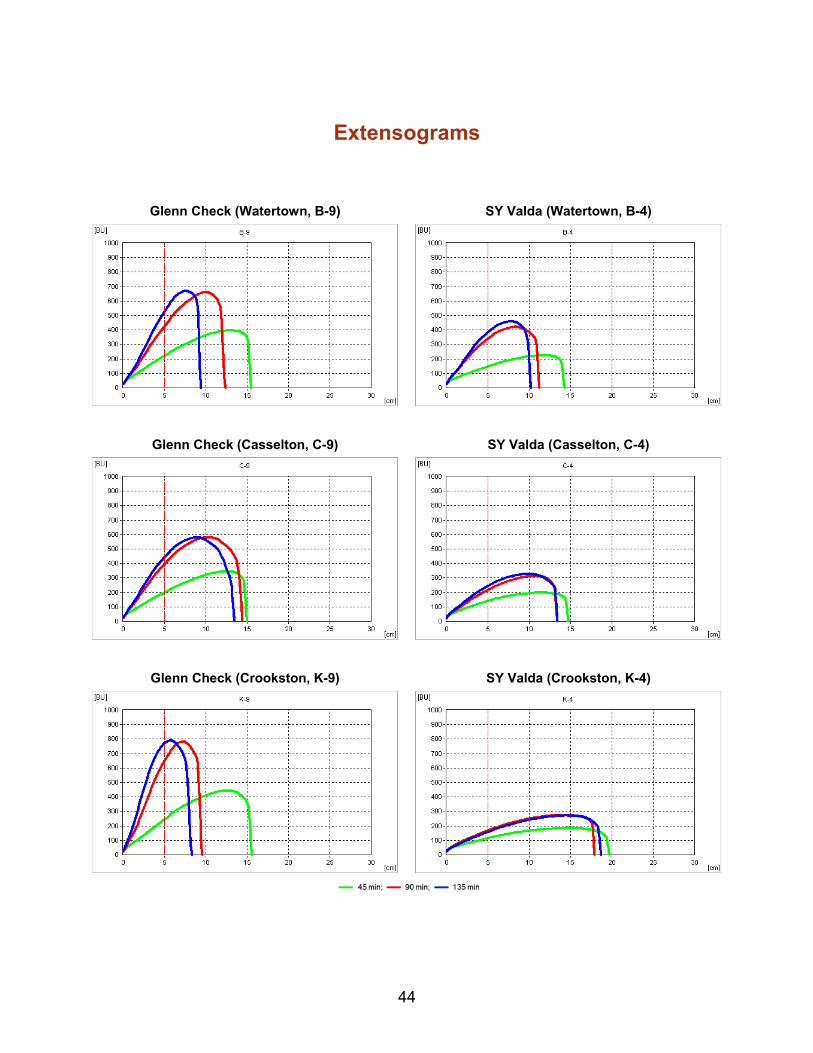
Extensograms
Glenn Check (Watertown, B-9) SY Valda (Watertown, B-4)
SY Valda (Casselton, C-4) Glenn Check (Casselton, C-9)
SY Valda (Crookston, K-4) Glenn Check (Crookston, K-9)
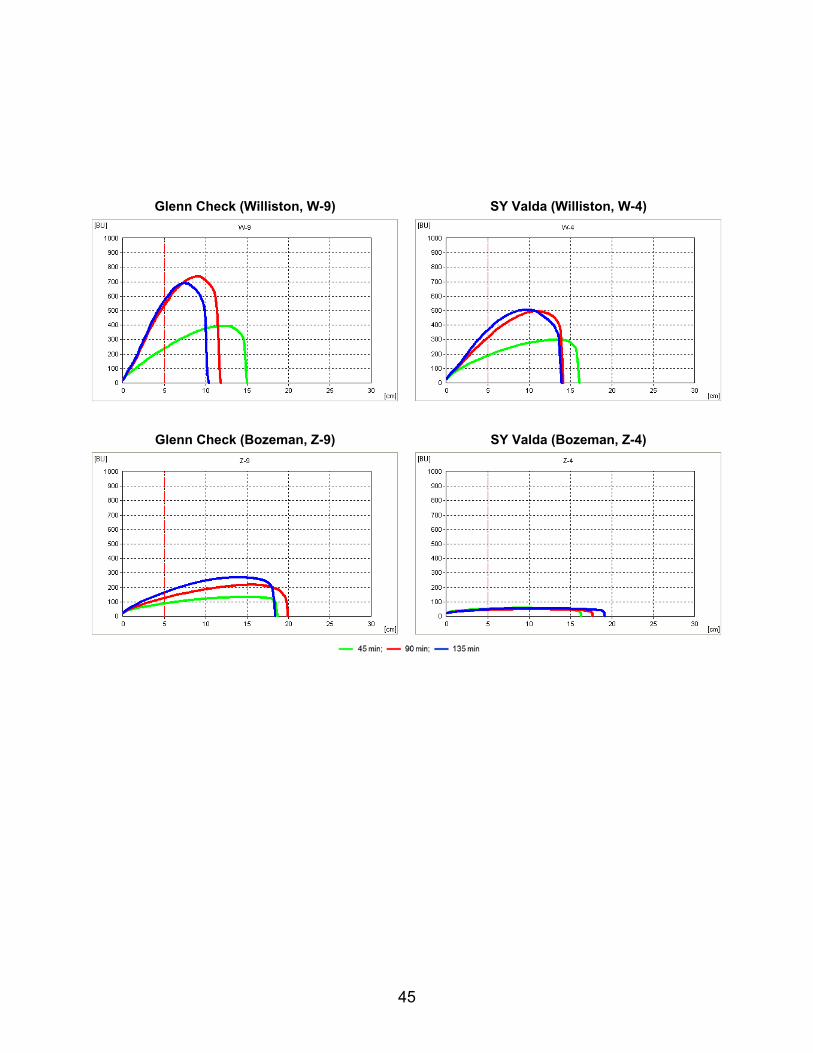
45
SY Valda (Williston, W-4)
Glenn Check (Bozeman, Z-9) SY Valda (Bozeman, Z-4)
Glenn Check (Williston, W-9)

46
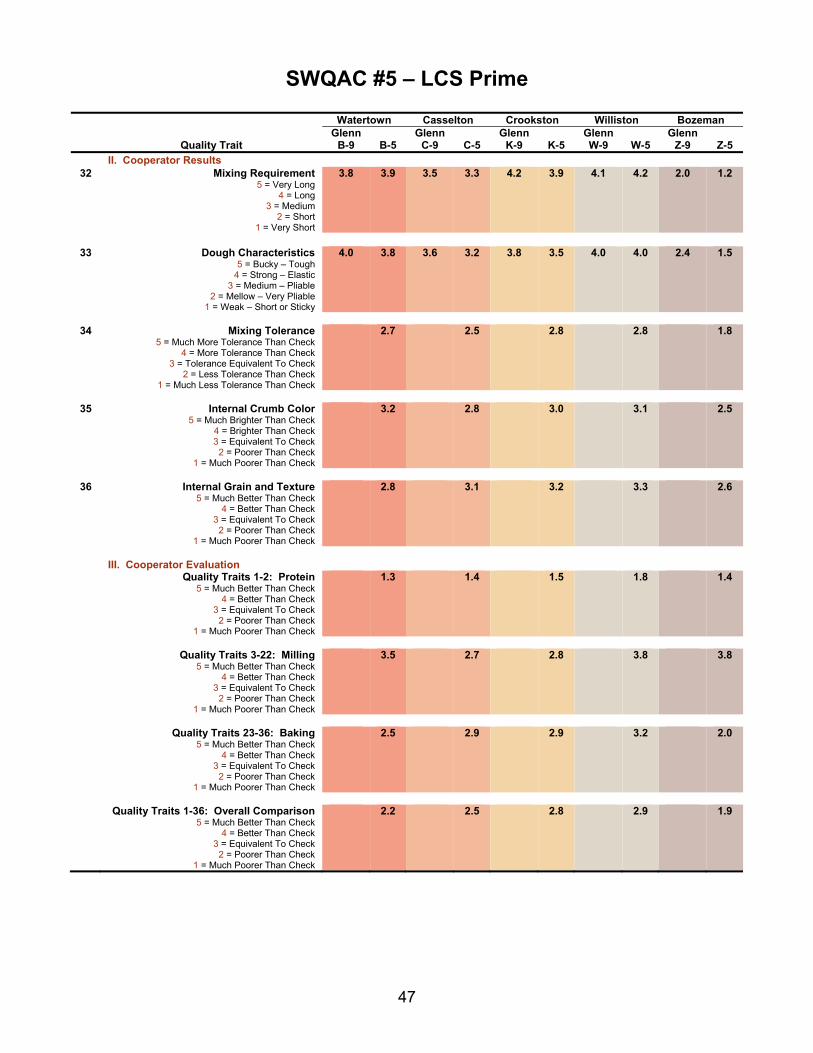
SWQAC #5 – LCS Prime
Watertown Casselton Crookston Williston Bozeman
Quality Trait Glenn
B-9
B-5 Glenn
C-9
C-5 Glenn
K-9
K-5 Glenn W-9
W-5
Glenn Z-9
Z-5
I. USDA-ARS WQL Data 1 Wheat Protein (%, 12% mb) 15.5 12.7 14.9 13.2 15.5 13.2 15.7 14.0 15.1 13.2 2 Flour Protein (%, 12% mb) 14.5 11.6 14.4 12.1 15.3 12.7 15.5 13.2 14.5 12.4
3 Market Value (Score 1-6) 4.4 3.4 4.3 3.5 4.7 4.1 4.6 4.5 4.6 4.2 4 Market Value (Score 1-10) 10.0 6.2 10.0 7.0 10.0 7.2 10.0 8.2 10.0 8.2 5 DON (ppm) nd nd 0.21 0.29 nd nd nd nd nd nd 6 Test Weight (lb/bu) 62.0 59.9 63.4 60.5 64.7 63.1 63.6 62.7 65.4 65.7 7 1000 Kernel Weight (g) 33.3 33.4 31.9 29.1 29.8 29.4 25.9 27.6 37.2 40.8 8 Kernel Size, % Large 75 72 60 59 47 47 9 33 79 83 9 Kernel Size, % Small 5 8 7 12 11 14 21 18 4 5
10 Wheat Moisture (%) 10.9 10.9 10.7 10.1 10.3 10.4 9.2 9.3 10.3 10.3 11 Wheat Ash (%, 14% mb) 1.63 1.59 1.77 1.62 1.42 1.44 1.39 1.30 1.58 1.44 12 Wheat Falling Number (sec) 366 396 390 411 387 401 390 428 347 331 13 SKCS Hardness Index 76.2 69.2 83.0 78.5 85.6 95.0 78.8 82.3 82.5 81.9 14 Vitreous Kernels (%) 76.2 36.7 85.7 37.0 95.6 96.8 98.7 94.5 96.4 63.3
Flour Extraction (%)
15 Tempered Wheat Basis (%) 70.6 73.9 72.7 72.8 73.5 73.8 71.2 72.8 71.5 73.0 16 Total Product Basis (%) 73.5 75.0 73.7 75.7* 74.8 74.4 72.9 73.7 73.2 74.7 17 Flour/Bu Wheat (lbs) 43.4 44.0 46.0 44.4 47.8 46.8 45.7 46.0 47.2 48.3
Flour Quality
18 Flour Color Brightness (L*) 89.8 89.7 89.6 89.4 90.0 89.8 89.9 90.0 89.7 89.9 19 Flour Color Yellowness (b*) 8.0 8.1 8.9 8.5 8.4 8.4 8.4 8.3 8.9 8.0 20 Flour Moisture (%) 12.4 12.8 13.0 13.4 12.7 13.0 12.9 13.1 12.9 13.0 21 Flour Ash (%, 14% mb) 0.49 0.49 0.51 0.56 0.44 0.47 0.46 0.42 0.50 0.54 22 Flour Falling Number (Malted) (sec) 251 253 250 254 250 248 256 252 251 252
Farinograph
23 Water Absorption (%, 500 BU) 65.5 59.6 64.6 62.1 63.9 61.8 65.2 62.6 71.0 70.7 24 Water Absorption (%, 14% mb) 63.4 58.0 63.3 61.4 62.1 60.5 64.5 61.7 69.6 69.4 25 Arrival Time (min) 2.7 1.6 3.8 2.3 4.8 2.2 4.4 2.4 4.5 3.0 26 Peak Time (min) 7.9 6.5 7.5 5.5 9.0 6.3 9.8 7.3 5.9 4.2 27 Dough Stability (min) 11.1 10.5 9.5 7.5 9.6 9.7 14.9 12.6 6.2 3.4 28 Mixing Tolerance Index (MTI) (BU) 25.0 27.0 28.0 36.0 28.0 31.0 12.0 23.0 26.0 58.0 29 Time To Breakdown (TTB) (min) 13.3 11.8 12.8 9.9 14.1 11.2 18.0 13.5 11.1 6.8
II. Cooperator Results
30 Bake Absorption (Average %) 66.4 61.8 66.0 63.4 66.1 63.6 66.8 64.4 68.3 67.2 31 Loaf Volume (% of Check) 92.8 94.5 95.6 98.5 90.0
*Choke at bran pickup was found and cleaned during sample C-5. This affected TPB but not patent flour characteristics.
47
SWQAC #5 – LCS Prime
Watertown Casselton Crookston Williston Bozeman
Quality Trait Glenn
B-9
B-5 Glenn
C-9
C-5 Glenn
K-9
K-5 Glenn W-9
W-5
Glenn Z-9
Z-5
II. Cooperator Results 32 Mixing Requirement
5 = Very Long 4 = Long
3 = Medium 2 = Short
1 = Very Short
3.8 3.9 3.5 3.3 4.2 3.9 4.1 4.2 2.0 1.2
33 Dough Characteristics
5 = Bucky – Tough 4 = Strong – Elastic
3 = Medium – Pliable 2 = Mellow – Very Pliable
1 = Weak – Short or Sticky
4.0 3.8 3.6 3.2 3.8 3.5 4.0 4.0 2.4 1.5
34 Mixing Tolerance
5 = Much More Tolerance Than Check 4 = More Tolerance Than Check
3 = Tolerance Equivalent To Check 2 = Less Tolerance Than Check
1 = Much Less Tolerance Than Check
2.7 2.5 2.8 2.8 1.8
35 Internal Crumb Color
5 = Much Brighter Than Check 4 = Brighter Than Check 3 = Equivalent To Check
2 = Poorer Than Check 1 = Much Poorer Than Check
3.2 2.8 3.0 3.1 2.5
36 Internal Grain and Texture
5 = Much Better Than Check 4 = Better Than Check
3 = Equivalent To Check 2 = Poorer Than Check
1 = Much Poorer Than Check
2.8 3.1 3.2 3.3 2.6
III. Cooperator Evaluation Quality Traits 1-2: Protein
5 = Much Better Than Check 4 = Better Than Check
3 = Equivalent To Check 2 = Poorer Than Check
1 = Much Poorer Than Check
1.3 1.4 1.5 1.8 1.4
Quality Traits 3-22: Milling
5 = Much Better Than Check 4 = Better Than Check
3 = Equivalent To Check 2 = Poorer Than Check
1 = Much Poorer Than Check
3.5 2.7 2.8 3.8 3.8
Quality Traits 23-36: Baking
5 = Much Better Than Check 4 = Better Than Check
3 = Equivalent To Check 2 = Poorer Than Check
1 = Much Poorer Than Check
2.5 2.9 2.9 3.2 2.0
Quality Traits 1-36: Overall Comparison
5 = Much Better Than Check 4 = Better Than Check
3 = Equivalent To Check 2 = Poorer Than Check
1 = Much Poorer Than Check
2.2 2.5 2.8 2.9 1.9
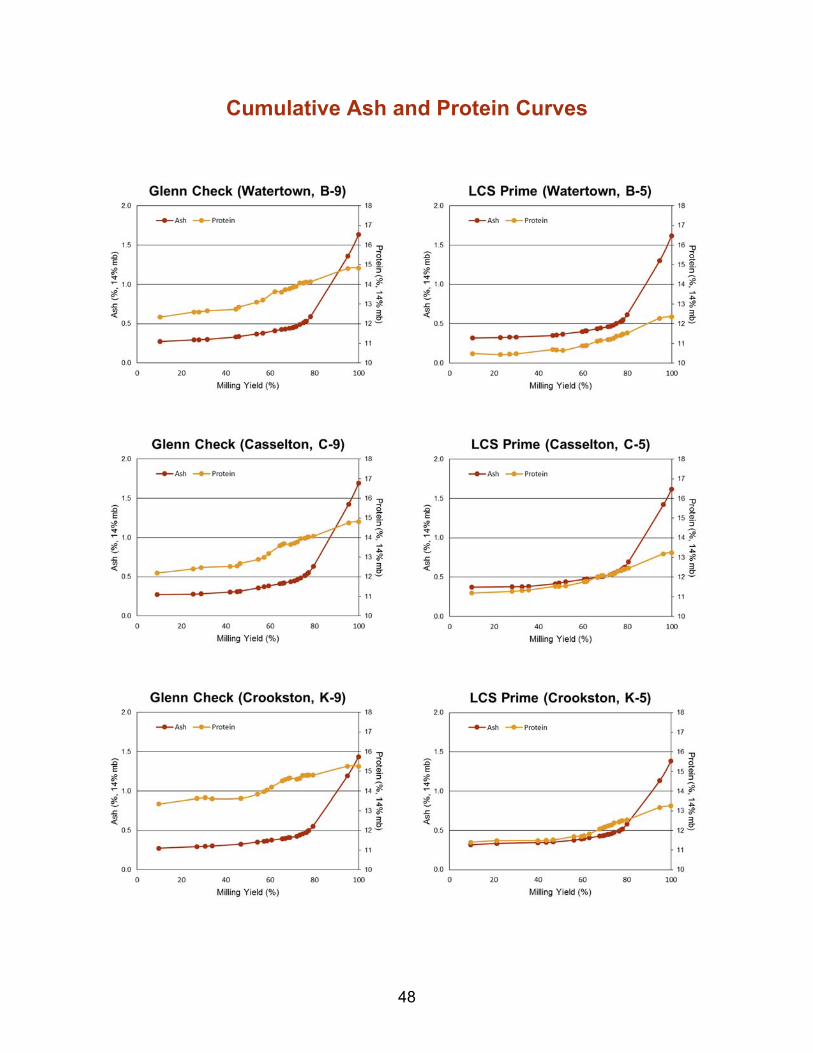
48
Cumulative Ash and Protein Curves
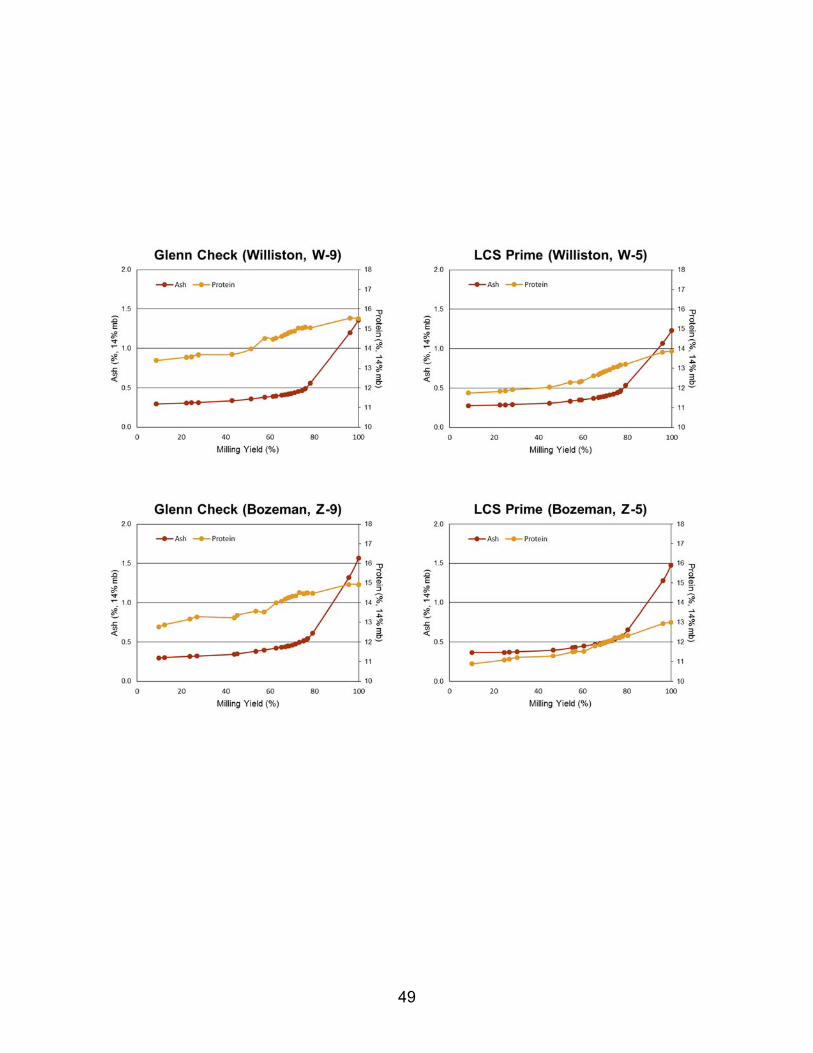
49
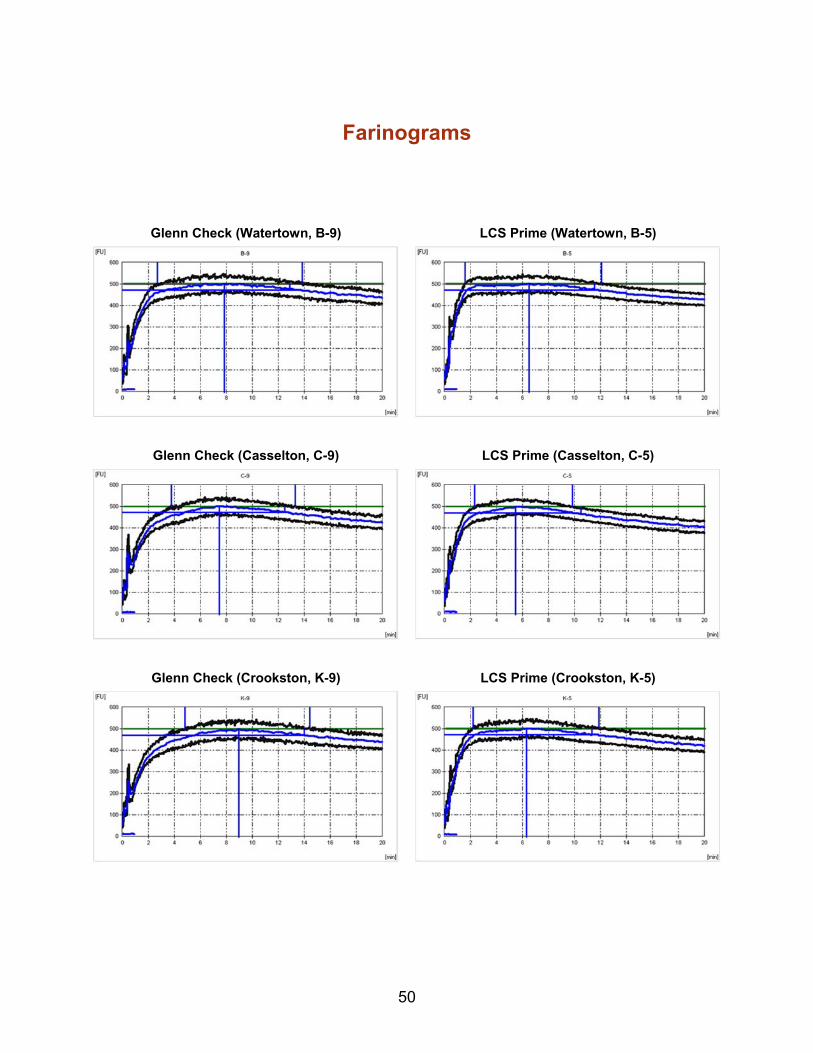
50
Farinograms
LCS Prime (Watertown, B-5) Glenn Check (Watertown, B-9)
LCS Prime (Casselton, C-5) Glenn Check (Casselton, C-9)
LCS Prime (Crookston, K-5) Glenn Check (Crookston, K-9)
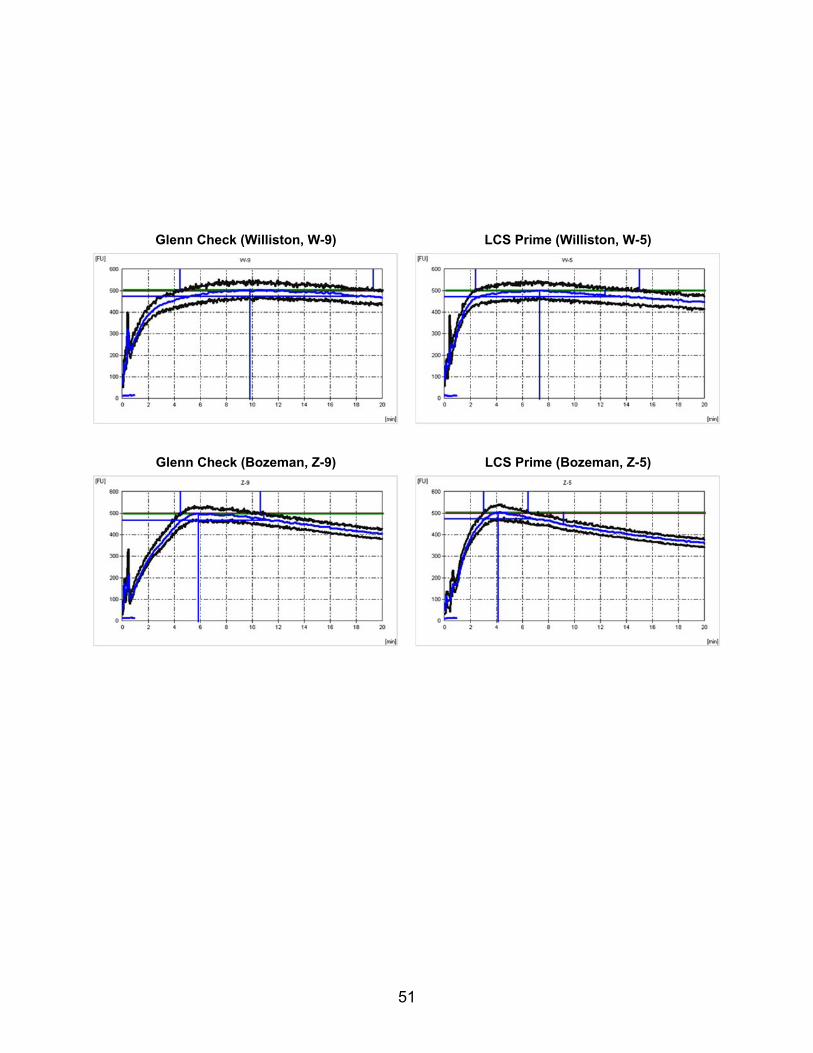
51
LCS Prime (Williston, W-5) Glenn Check (Williston, W-9)
LCS Prime (Bozeman, Z-5) Glenn Check (Bozeman, Z-9)
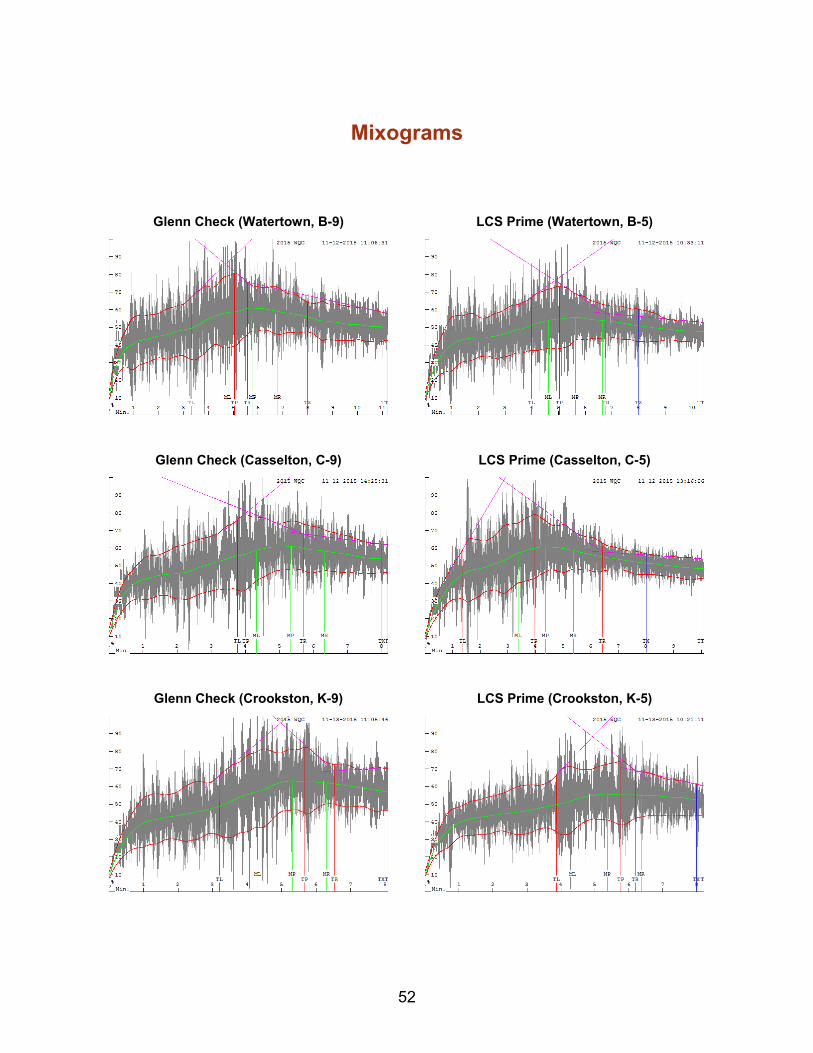
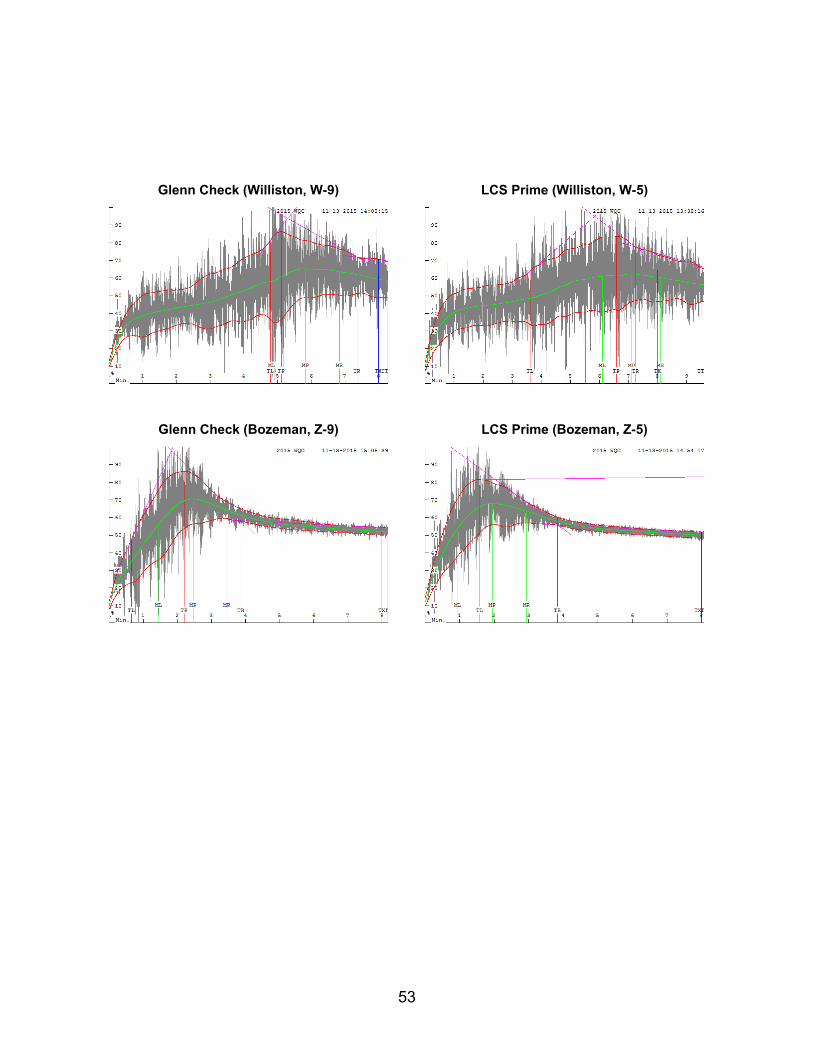
52
Mixograms
Glenn Check (Casselton, C-9)
Glenn Check (Crookston, K-9)
Glenn Check (Watertown, B-9) LCS Prime (Watertown, B-5)
LCS Prime (Casselton, C-5)
LCS Prime (Crookston, K-5)
53
Glenn Check (Williston, W-9)
Glenn Check (Bozeman, Z-9)
LCS Prime (Williston, W-5)
LCS Prime (Bozeman, Z-5)
54
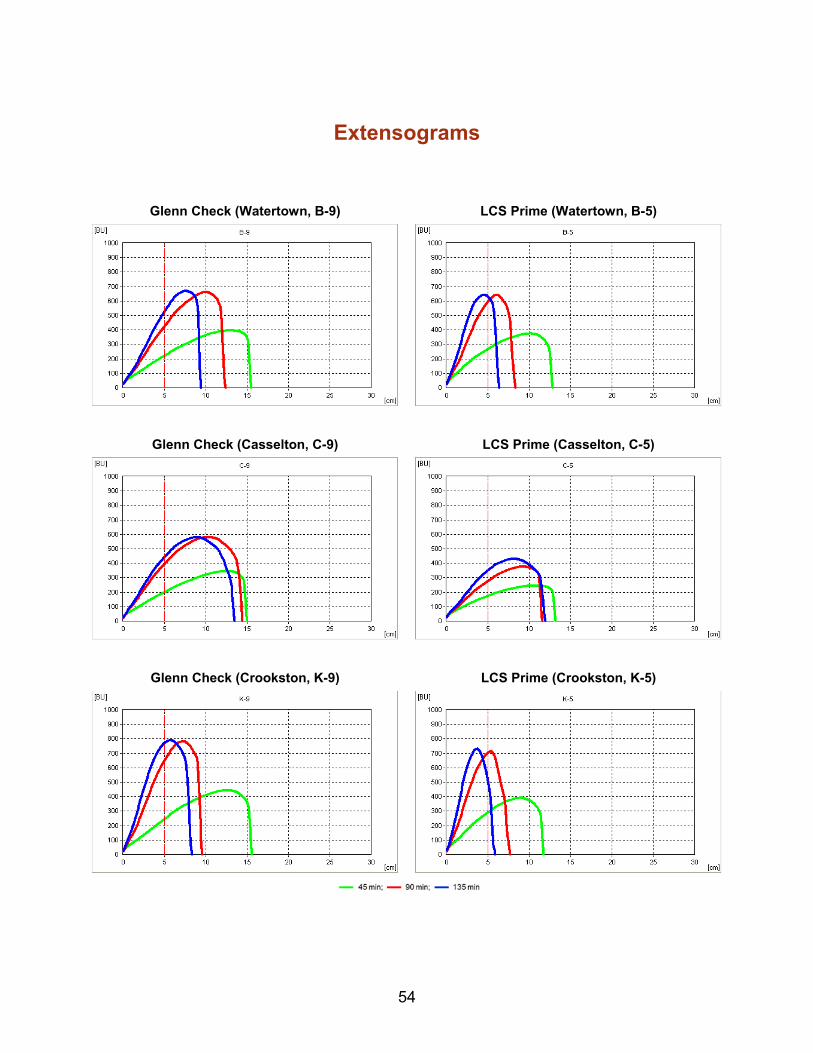
Extensograms
Glenn Check (Watertown, B-9) LCS Prime (Watertown, B-5)
LCS Prime (Casselton, C-5) Glenn Check (Casselton, C-9)
LCS Prime (Crookston, K-5) Glenn Check (Crookston, K-9)
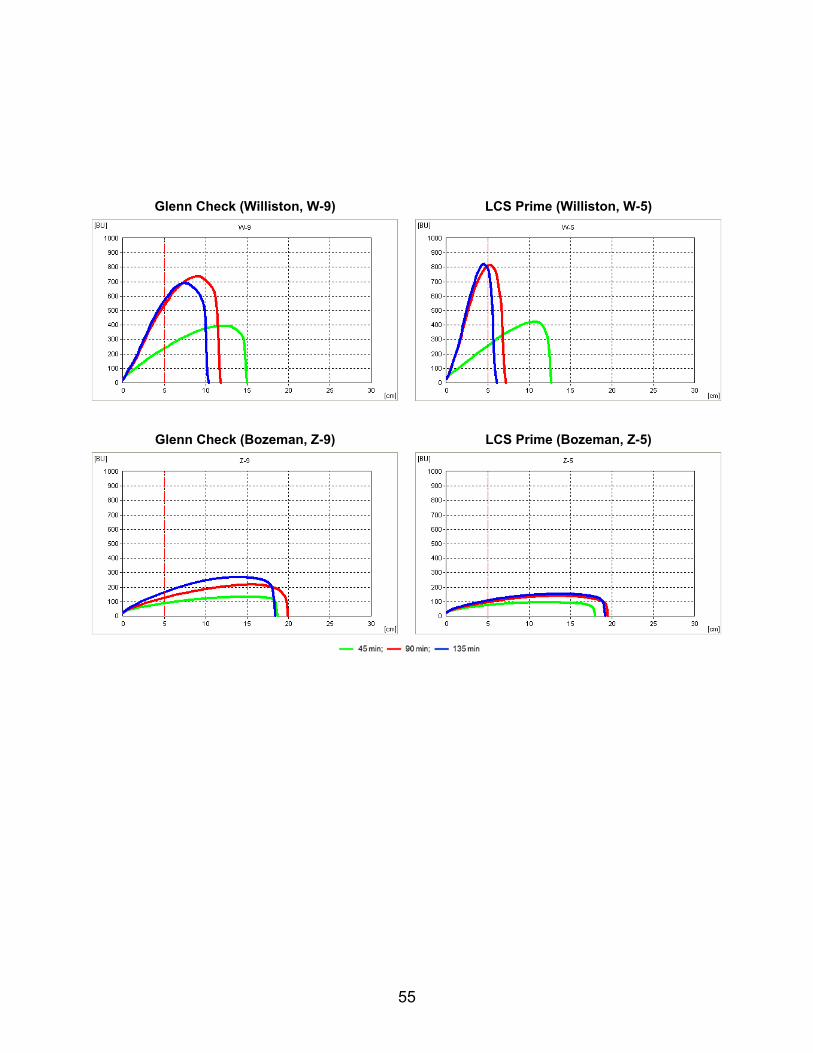
55
LCS Prime (Williston, W-5) Glenn Check (Williston, W-9)
LCS Prime (Bozeman, Z-5) Glenn Check (Bozeman, Z-9)

56
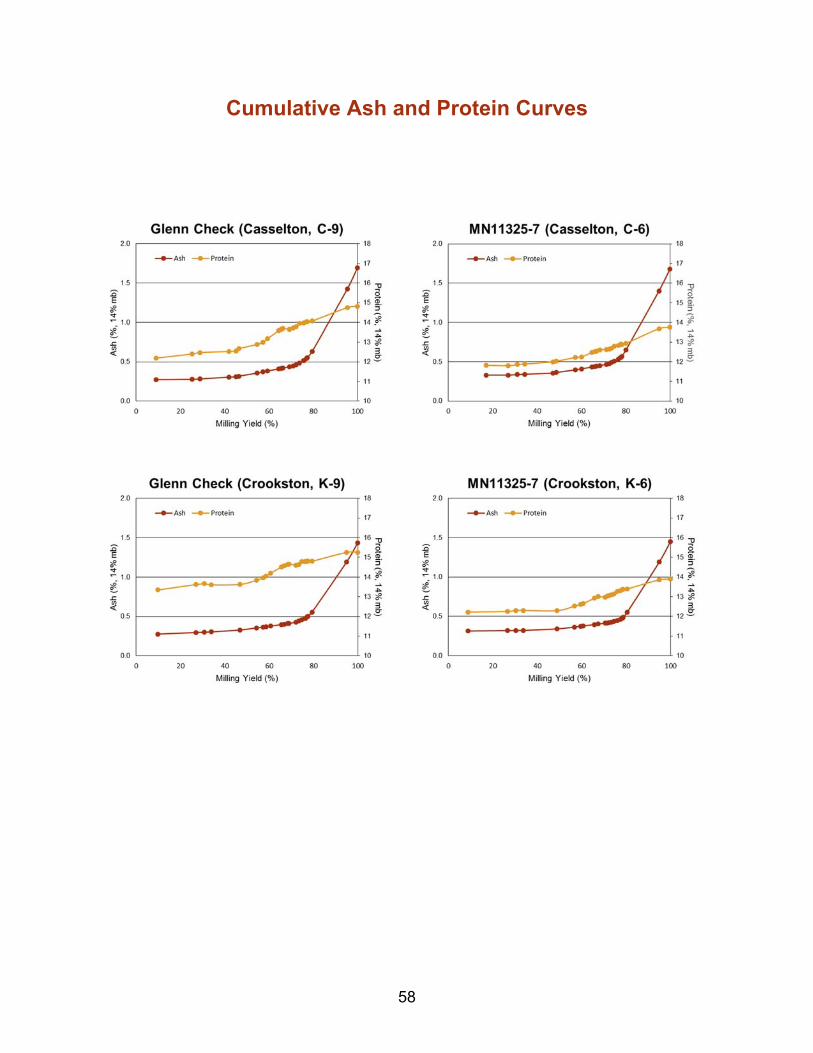
SWQAC #6 – MN11325-7
Casselton Crookston
Quality Trait Glenn
C-9 C-6 Glenn
K-9
K-6 I. USDA-ARS WQL Data
1 Wheat Protein (%, 12% mb) 14.9 13.8 15.5 13.8 2 Flour Protein (%, 12% mb) 14.4 13.0 15.3 13.8
3 Market Value (Score 1-6) 4.3 3.5 4.7 4.6 4 Market Value (Score 1-10) 10.0 7.2 10.0 7.8 5 DON (ppm) 0.21 nd nd nd 6 Test Weight (lb/bu) 63.4 59.9 64.7 62.7 7 1000 Kernel Weight (g) 31.9 27.9 29.8 32.1 8 Kernel Size, % Large 60 43 47 57 9 Kernel Size, % Small 7 13 11 9
10 Wheat Moisture (%) 10.7 10.1 10.3 11.1 11 Wheat Ash (%, 14% mb) 1.77 1.68 1.42 1.44 12 Wheat Falling Number (sec) 390 456 387 432 13 SKCS Hardness Index 83.0 74.2 85.6 84.1 14 Vitreous Kernels (%) 85.7 59.1 95.6 95.5
Flour Extraction (%)
15 Tempered Wheat Basis (%) 72.7 73.4 73.5 73.6 16 Total Product Basis (%) 73.7 75.0 74.8 76.0 17 Flour/Bu Wheat (lbs) 46.0 44.4 47.8 46.8
Flour Quality
18 Flour Color Brightness (L*) 89.6 89.3 90.0 89.9 19 Flour Color Yellowness (b*) 8.9 8.6 8.4 8.0 20 Flour Moisture (%) 13.0 13.3 12.7 13.2 21 Flour Ash (%, 14% mb) 0.51 0.49 0.44 0.44 22 Flour Falling Number (Malted) (sec) 250 251 250 245
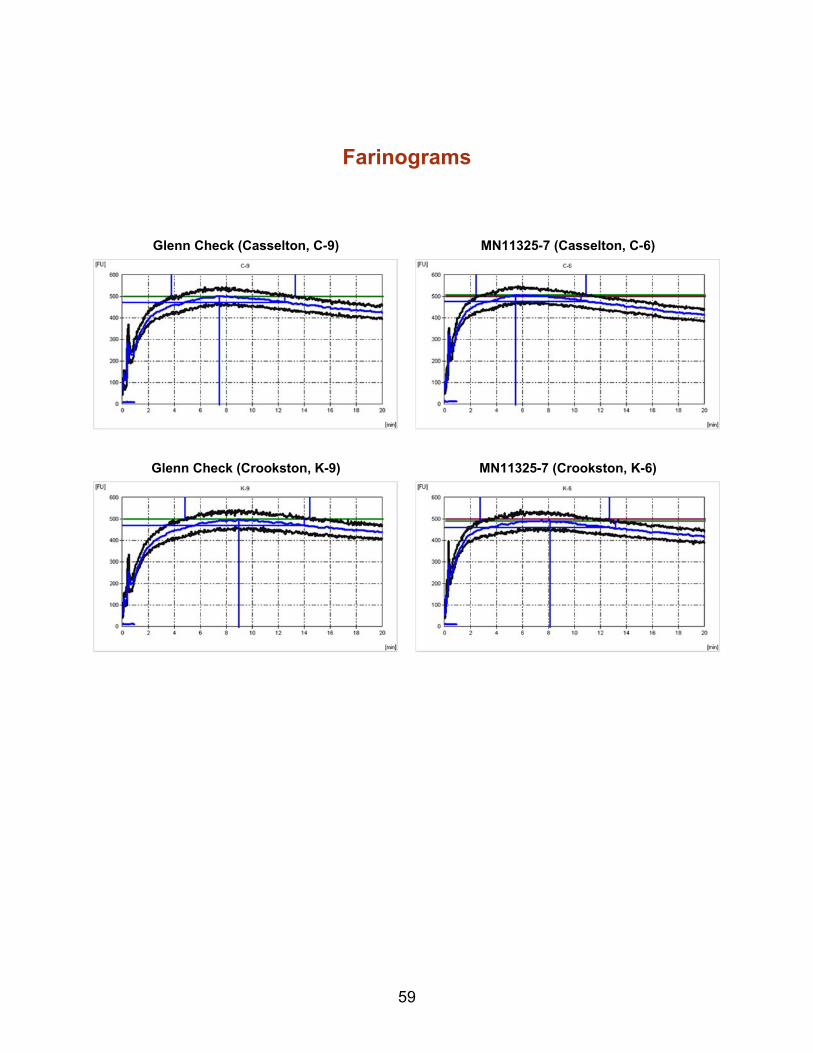
Farinograph
23 Water Absorption (%, 500 BU) 64.6 60.9 63.9 61.0 24 Water Absorption (%, 14% mb) 63.3 60.1 62.1 59.8 25 Arrival Time (min) 3.8 2.4 4.8 2.7 26 Peak Time (min) 7.5 5.5 9.0 8.2 27 Dough Stability (min) 9.5 8.5 9.6 10.0 28 Mixing Tolerance Index (MTI) (BU) 28.0 24.0 28.0 37.0 29 Time To Breakdown (TTB) (min) 12.8 11.0 14.1 12.7
II. Cooperator Results
30 Bake Absorption (Average %) 66.0 63.0 66.1 63.6 31 Loaf Volume (% of Check) 96.0 96.6

57
SWQAC #6 – MN11325-7
Casselton Crookston
Quality Trait Glenn
C-9 C-6 Glenn
K-9
K-6 II. Cooperator Results
32 Mixing Requirement5 = Very Long
4 = Long 3 = Medium
2 = Short 1 = Very Short
3.5 3.0 4.2 3.8
33 Dough Characteristics
5 = Bucky – Tough 4 = Strong – Elastic
3 = Medium – Pliable 2 = Mellow – Very Pliable
1 = Weak – Short or Sticky
3.6 3.1 3.8 3.7
34 Mixing Tolerance
5 = Much More Tolerance Than Check 4 = More Tolerance Than Check
3 = Tolerance Equivalent To Check 2 = Less Tolerance Than Check
1 = Much Less Tolerance Than Check
2.5 2.8
35 Internal Crumb Color
5 = Much Brighter Than Check 4 = Brighter Than Check 3 = Equivalent To Check
2 = Poorer Than Check 1 = Much Poorer Than Check
2.7 2.8
36 Internal Grain and Texture
5 = Much Better Than Check 4 = Better Than Check
3 = Equivalent To Check 2 = Poorer Than Check
1 = Much Poorer Than Check
3.3 3.3
III. Cooperator Evaluation Quality Traits 1-2: Protein
5 = Much Better Than Check 4 = Better Than Check
3 = Equivalent To Check 2 = Poorer Than Check
1 = Much Poorer Than Check
2.2 2.0
Quality Traits 3-22: Milling
5 = Much Better Than Check 4 = Better Than Check
3 = Equivalent To Check 2 = Poorer Than Check
1 = Much Poorer Than Check
3.0 3.2
Quality Traits 23-36: Baking
5 = Much Better Than Check 4 = Better Than Check
3 = Equivalent To Check 2 = Poorer Than Check
1 = Much Poorer Than Check
2.8 2.8
Quality Traits 1-36: Overall Comparison
5 = Much Better Than Check 4 = Better Than Check
3 = Equivalent To Check 2 = Poorer Than Check
1 = Much Poorer Than Check
2.7 2.8
58
Cumulative Ash and Protein Curves
59
Farinograms MN11325-7 (Casselton, C-6) Glenn Check (Casselton, C-9)
MN11325-7 (Crookston, K-6) Glenn Check (Crookston, K-9)
60
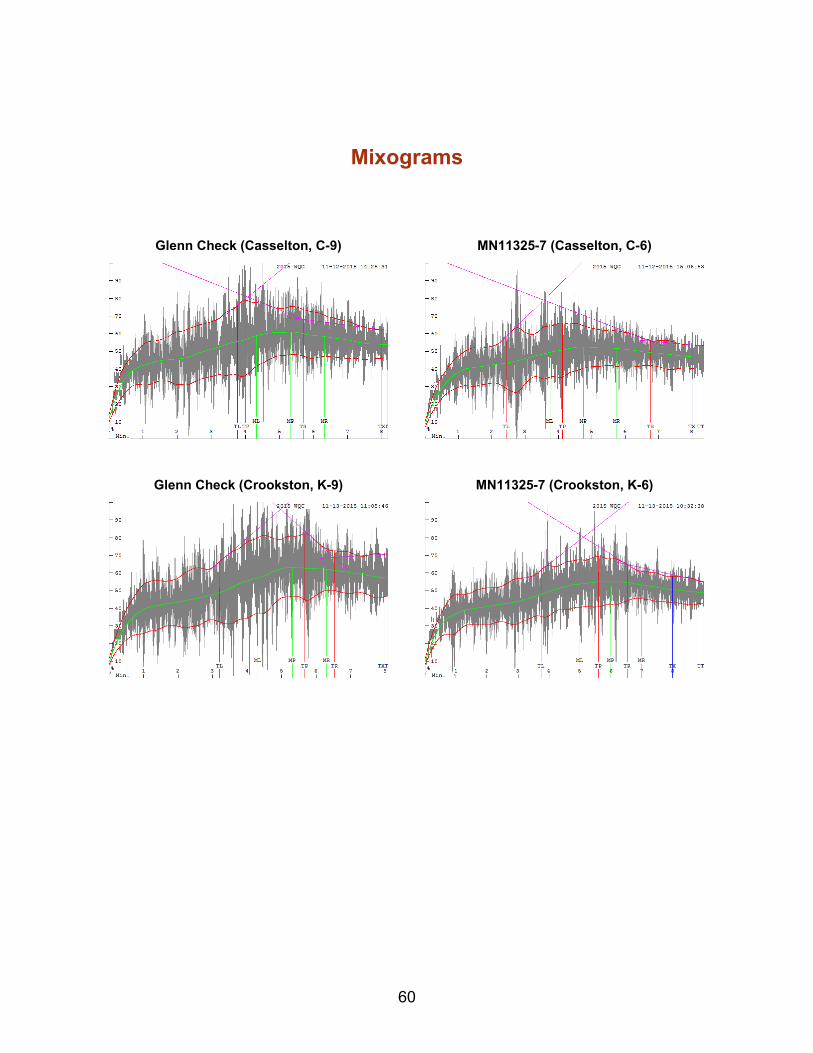
Mixograms
Glenn Check (Casselton, C-9)
Glenn Check (Crookston, K-9)
MN11325-7 (Casselton, C-6)
MN11325-7 (Crookston, K-6)
61
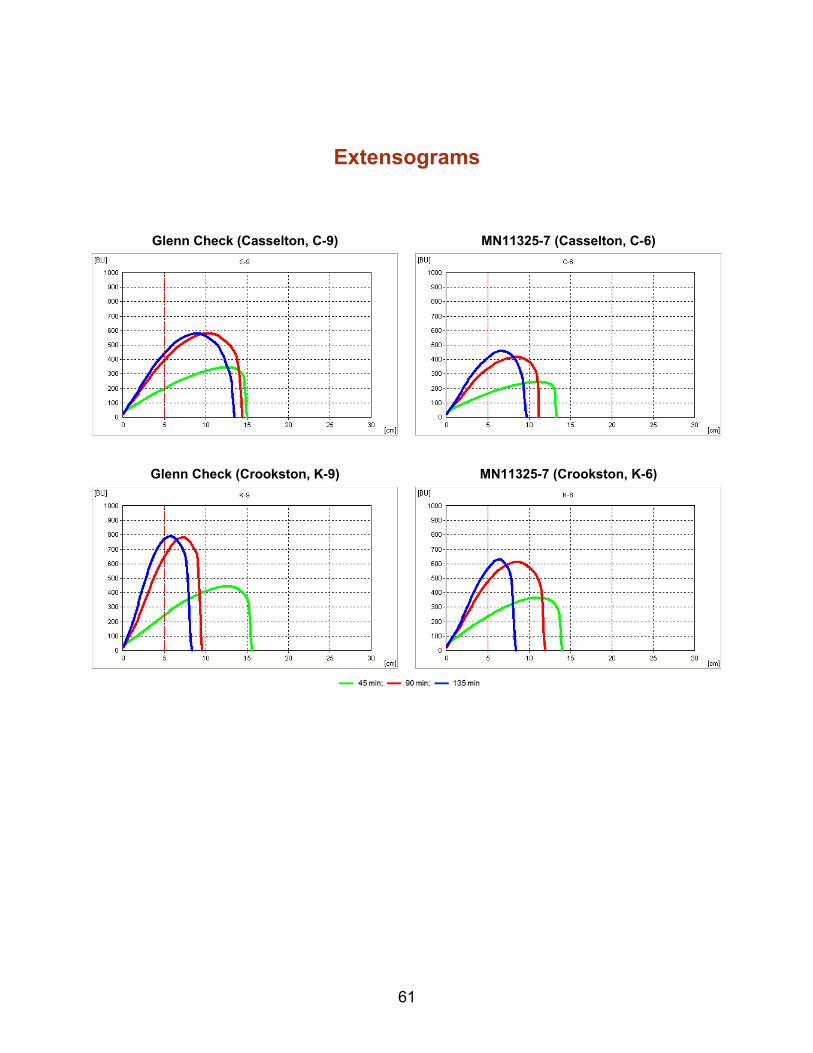
Extensograms
MN11325-7 (Casselton, C-6) Glenn Check (Casselton, C-9)
MN11325-7 (Crookston, K-6) Glenn Check (Crookston, K-9)
62
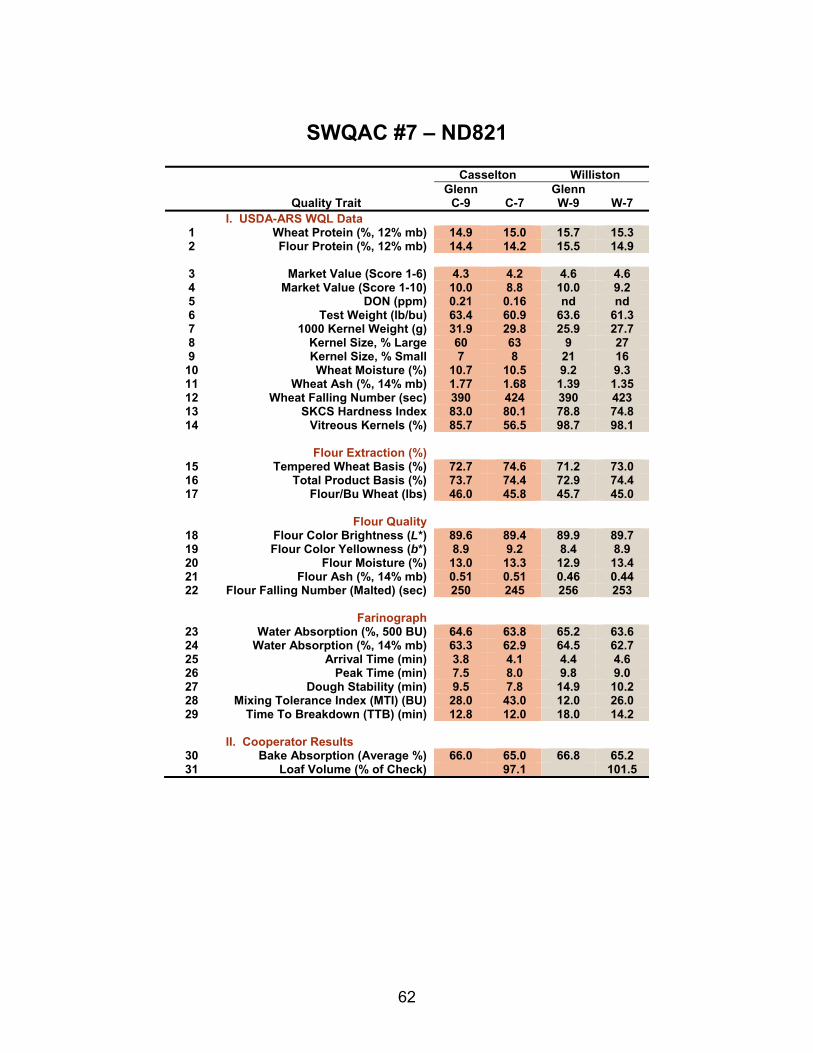
SWQAC #7 – ND821
Casselton Williston
Quality Trait Glenn
C-9 C-7 Glenn W-9
W-7
I. USDA-ARS WQL Data 1 Wheat Protein (%, 12% mb) 14.9 15.0 15.7 15.3 2 Flour Protein (%, 12% mb) 14.4 14.2 15.5 14.9
3 Market Value (Score 1-6) 4.3 4.2 4.6 4.6 4 Market Value (Score 1-10) 10.0 8.8 10.0 9.2 5 DON (ppm) 0.21 0.16 nd nd 6 Test Weight (lb/bu) 63.4 60.9 63.6 61.3 7 1000 Kernel Weight (g) 31.9 29.8 25.9 27.7 8 Kernel Size, % Large 60 63 9 27 9 Kernel Size, % Small 7 8 21 16
10 Wheat Moisture (%) 10.7 10.5 9.2 9.3 11 Wheat Ash (%, 14% mb) 1.77 1.68 1.39 1.35 12 Wheat Falling Number (sec) 390 424 390 423 13 SKCS Hardness Index 83.0 80.1 78.8 74.8 14 Vitreous Kernels (%) 85.7 56.5 98.7 98.1
Flour Extraction (%)
15 Tempered Wheat Basis (%) 72.7 74.6 71.2 73.0 16 Total Product Basis (%) 73.7 74.4 72.9 74.4 17 Flour/Bu Wheat (lbs) 46.0 45.8 45.7 45.0
Flour Quality
18 Flour Color Brightness (L*) 89.6 89.4 89.9 89.7 19 Flour Color Yellowness (b*) 8.9 9.2 8.4 8.9 20 Flour Moisture (%) 13.0 13.3 12.9 13.4 21 Flour Ash (%, 14% mb) 0.51 0.51 0.46 0.44 22 Flour Falling Number (Malted) (sec) 250 245 256 253
Farinograph
23 Water Absorption (%, 500 BU) 64.6 63.8 65.2 63.6 24 Water Absorption (%, 14% mb) 63.3 62.9 64.5 62.7 25 Arrival Time (min) 3.8 4.1 4.4 4.6 26 Peak Time (min) 7.5 8.0 9.8 9.0 27 Dough Stability (min) 9.5 7.8 14.9 10.2 28 Mixing Tolerance Index (MTI) (BU) 28.0 43.0 12.0 26.0 29 Time To Breakdown (TTB) (min) 12.8 12.0 18.0 14.2
II. Cooperator Results
30 Bake Absorption (Average %) 66.0 65.0 66.8 65.2 31 Loaf Volume (% of Check) 97.1 101.5
63
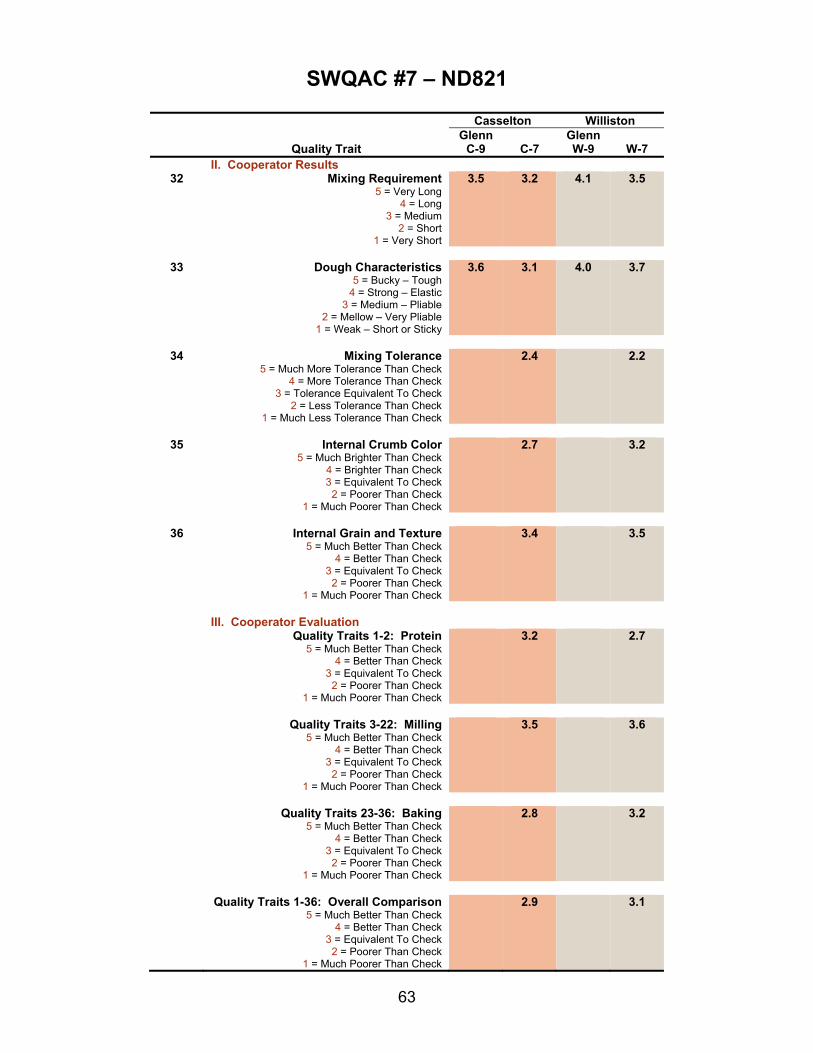
SWQAC #7 – ND821
Casselton Williston
Quality Trait Glenn
C-9 C-7 Glenn W-9
W-7
II. Cooperator Results 32 Mixing Requirement
5 = Very Long 4 = Long
3 = Medium 2 = Short
1 = Very Short
3.5 3.2 4.1 3.5
33 Dough Characteristics
5 = Bucky – Tough 4 = Strong – Elastic
3 = Medium – Pliable 2 = Mellow – Very Pliable
1 = Weak – Short or Sticky
3.6 3.1 4.0 3.7
34 Mixing Tolerance
5 = Much More Tolerance Than Check 4 = More Tolerance Than Check
3 = Tolerance Equivalent To Check 2 = Less Tolerance Than Check
1 = Much Less Tolerance Than Check
2.4 2.2
35 Internal Crumb Color
5 = Much Brighter Than Check 4 = Brighter Than Check 3 = Equivalent To Check
2 = Poorer Than Check 1 = Much Poorer Than Check
2.7 3.2
36 Internal Grain and Texture
5 = Much Better Than Check 4 = Better Than Check
3 = Equivalent To Check 2 = Poorer Than Check
1 = Much Poorer Than Check
3.4 3.5
III. Cooperator Evaluation Quality Traits 1-2: Protein
5 = Much Better Than Check 4 = Better Than Check
3 = Equivalent To Check 2 = Poorer Than Check
1 = Much Poorer Than Check
3.2 2.7
Quality Traits 3-22: Milling
5 = Much Better Than Check 4 = Better Than Check
3 = Equivalent To Check 2 = Poorer Than Check
1 = Much Poorer Than Check
3.5 3.6
Quality Traits 23-36: Baking
5 = Much Better Than Check 4 = Better Than Check
3 = Equivalent To Check 2 = Poorer Than Check
1 = Much Poorer Than Check
2.8 3.2
Quality Traits 1-36: Overall Comparison
5 = Much Better Than Check 4 = Better Than Check
3 = Equivalent To Check 2 = Poorer Than Check
1 = Much Poorer Than Check
2.9 3.1
64
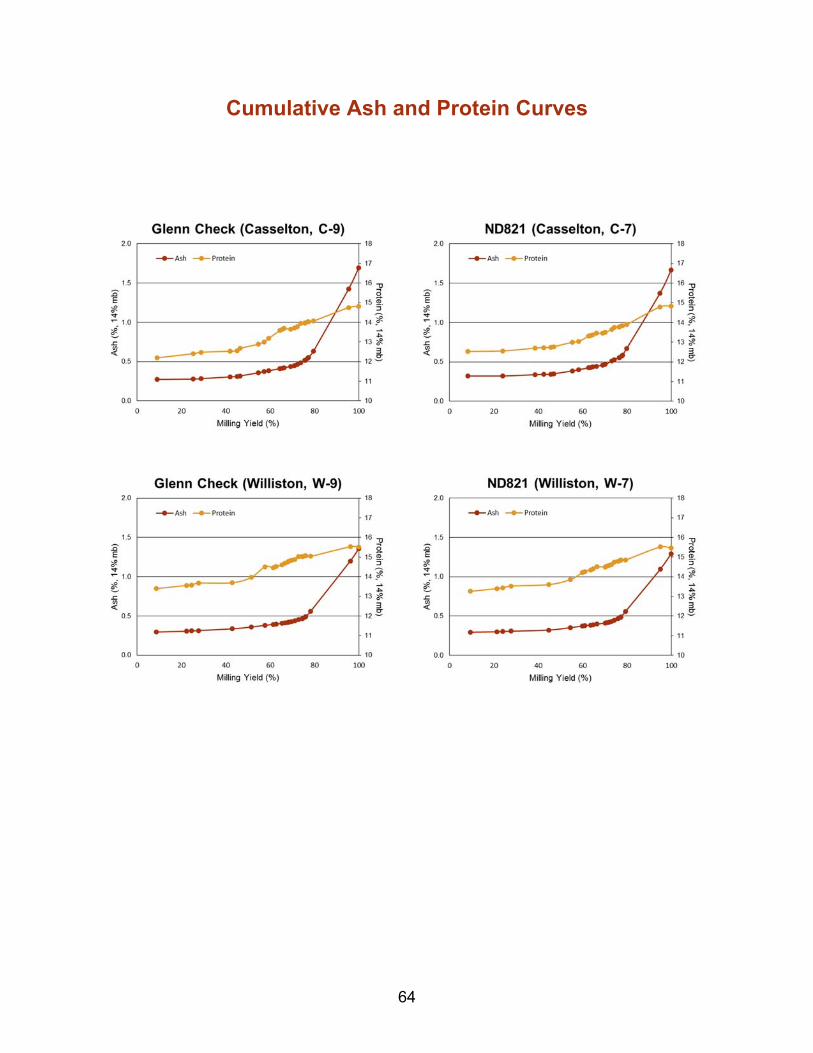
Cumulative Ash and Protein Curves

65
Farinograms
ND821 (Casselton, C-7) Glenn Check (Casselton, C-9)
ND821 (Williston, W-7) Glenn Check (Williston, W-9)
66
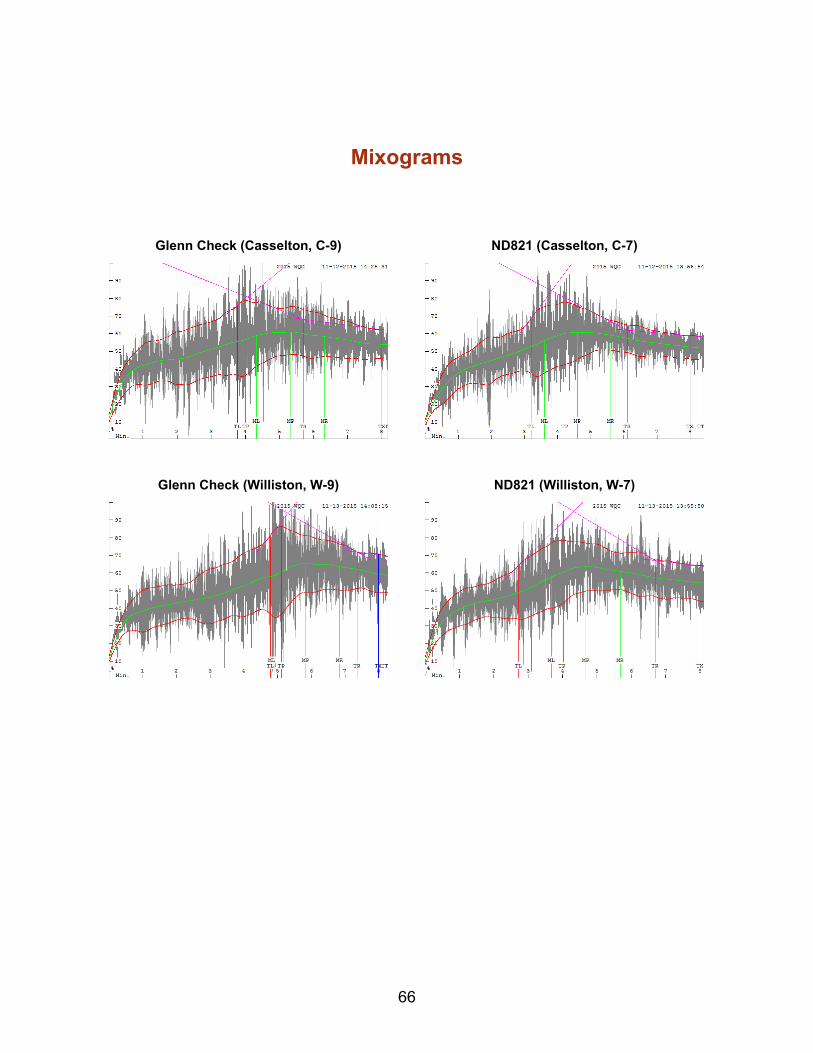
Mixograms
Glenn Check (Casselton, C-9)
Glenn Check (Williston, W-9)
ND821 (Casselton, C-7)
ND821 (Williston, W-7)
67
Extensograms
ND821 (Casselton, C-7) Glenn Check (Casselton, C-9)
ND821 (Williston, W-7) Glenn Check (Williston, W-9)
68
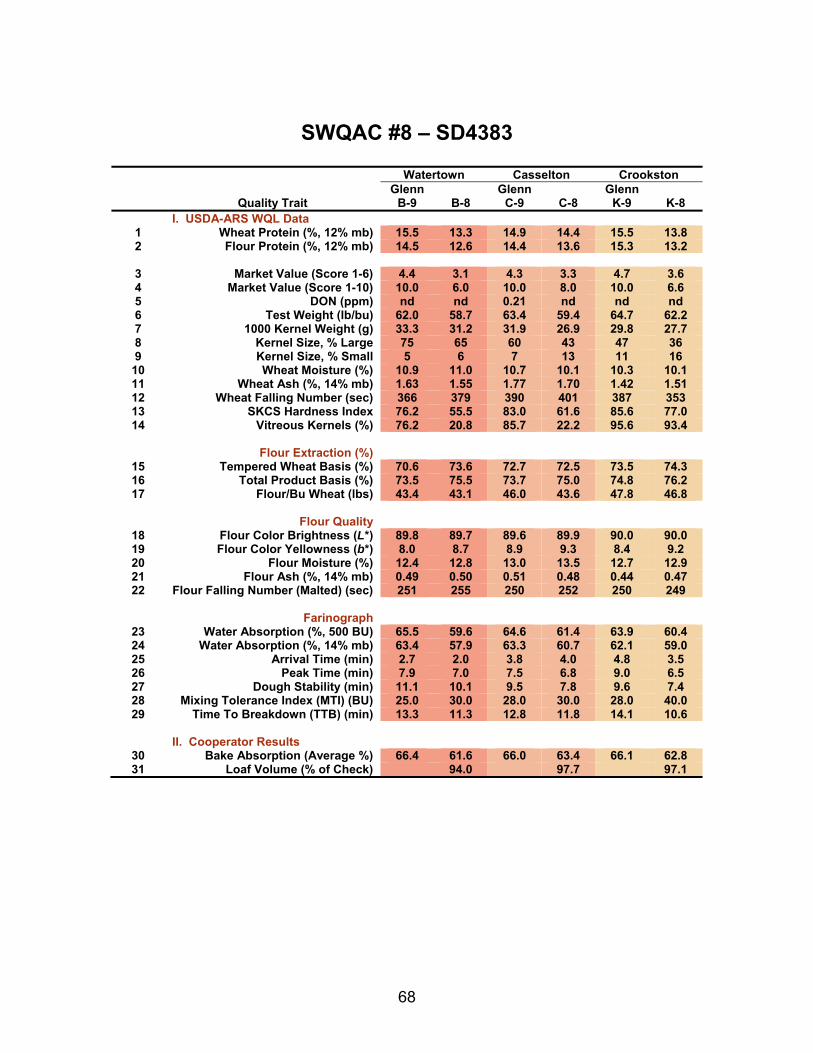
SWQAC #8 – SD4383
Watertown Casselton Crookston
Quality Trait Glenn
B-9 B-8 Glenn
C-9 C-8 Glenn
K-9 K-8 I. USDA-ARS WQL Data
1 Wheat Protein (%, 12% mb) 15.5 13.3 14.9 14.4 15.5 13.82 Flour Protein (%, 12% mb) 14.5 12.6 14.4 13.6 15.3 13.2
3 Market Value (Score 1-6) 4.4 3.1 4.3 3.3 4.7 3.64 Market Value (Score 1-10) 10.0 6.0 10.0 8.0 10.0 6.65 DON (ppm) nd nd 0.21 nd nd nd6 Test Weight (lb/bu) 62.0 58.7 63.4 59.4 64.7 62.27 1000 Kernel Weight (g) 33.3 31.2 31.9 26.9 29.8 27.78 Kernel Size, % Large 75 65 60 43 47 369 Kernel Size, % Small 5 6 7 13 11 16
10 Wheat Moisture (%) 10.9 11.0 10.7 10.1 10.3 10.111 Wheat Ash (%, 14% mb) 1.63 1.55 1.77 1.70 1.42 1.5112 Wheat Falling Number (sec) 366 379 390 401 387 35313 SKCS Hardness Index 76.2 55.5 83.0 61.6 85.6 77.014 Vitreous Kernels (%) 76.2 20.8 85.7 22.2 95.6 93.4
Flour Extraction (%)
15 Tempered Wheat Basis (%) 70.6 73.6 72.7 72.5 73.5 74.316 Total Product Basis (%) 73.5 75.5 73.7 75.0 74.8 76.217 Flour/Bu Wheat (lbs) 43.4 43.1 46.0 43.6 47.8 46.8
Flour Quality
18 Flour Color Brightness (L*) 89.8 89.7 89.6 89.9 90.0 90.019 Flour Color Yellowness (b*) 8.0 8.7 8.9 9.3 8.4 9.220 Flour Moisture (%) 12.4 12.8 13.0 13.5 12.7 12.921 Flour Ash (%, 14% mb) 0.49 0.50 0.51 0.48 0.44 0.4722 Flour Falling Number (Malted) (sec) 251 255 250 252 250 249
Farinograph
23 Water Absorption (%, 500 BU) 65.5 59.6 64.6 61.4 63.9 60.424 Water Absorption (%, 14% mb) 63.4 57.9 63.3 60.7 62.1 59.025 Arrival Time (min) 2.7 2.0 3.8 4.0 4.8 3.526 Peak Time (min) 7.9 7.0 7.5 6.8 9.0 6.527 Dough Stability (min) 11.1 10.1 9.5 7.8 9.6 7.428 Mixing Tolerance Index (MTI) (BU) 25.0 30.0 28.0 30.0 28.0 40.029 Time To Breakdown (TTB) (min) 13.3 11.3 12.8 11.8 14.1 10.6
II. Cooperator Results
30 Bake Absorption (Average %) 66.4 61.6 66.0 63.4 66.1 62.831 Loaf Volume (% of Check) 94.0 97.7 97.1
69
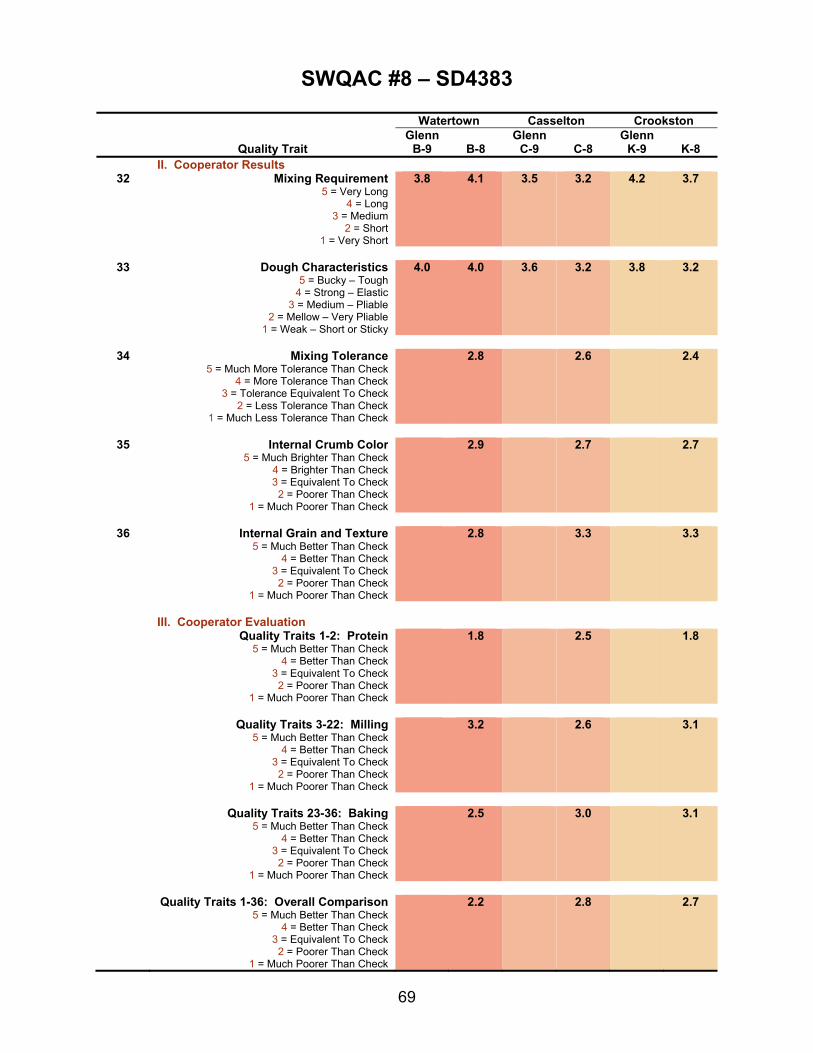
SWQAC #8 – SD4383
Watertown Casselton Crookston
Quality Trait Glenn
B-9 B-8 Glenn
C-9
C-8 Glenn
K-9 K-8 II. Cooperator Results
32 Mixing Requirement5 = Very Long
4 = Long 3 = Medium
2 = Short 1 = Very Short
3.8 4.1 3.5 3.2 4.2 3.7
33 Dough Characteristics
5 = Bucky – Tough 4 = Strong – Elastic
3 = Medium – Pliable 2 = Mellow – Very Pliable
1 = Weak – Short or Sticky
4.0 4.0 3.6 3.2 3.8 3.2
34 Mixing Tolerance
5 = Much More Tolerance Than Check 4 = More Tolerance Than Check
3 = Tolerance Equivalent To Check 2 = Less Tolerance Than Check
1 = Much Less Tolerance Than Check
2.8 2.6 2.4
35 Internal Crumb Color
5 = Much Brighter Than Check 4 = Brighter Than Check 3 = Equivalent To Check
2 = Poorer Than Check 1 = Much Poorer Than Check
2.9 2.7 2.7
36 Internal Grain and Texture
5 = Much Better Than Check 4 = Better Than Check
3 = Equivalent To Check 2 = Poorer Than Check
1 = Much Poorer Than Check
2.8 3.3 3.3
III. Cooperator Evaluation Quality Traits 1-2: Protein
5 = Much Better Than Check 4 = Better Than Check
3 = Equivalent To Check 2 = Poorer Than Check
1 = Much Poorer Than Check
1.8 2.5 1.8
Quality Traits 3-22: Milling
5 = Much Better Than Check 4 = Better Than Check
3 = Equivalent To Check 2 = Poorer Than Check
1 = Much Poorer Than Check
3.2 2.6 3.1
Quality Traits 23-36: Baking
5 = Much Better Than Check 4 = Better Than Check
3 = Equivalent To Check 2 = Poorer Than Check
1 = Much Poorer Than Check
2.5 3.0 3.1
Quality Traits 1-36: Overall Comparison
5 = Much Better Than Check 4 = Better Than Check
3 = Equivalent To Check 2 = Poorer Than Check
1 = Much Poorer Than Check
2.2 2.8 2.7
70
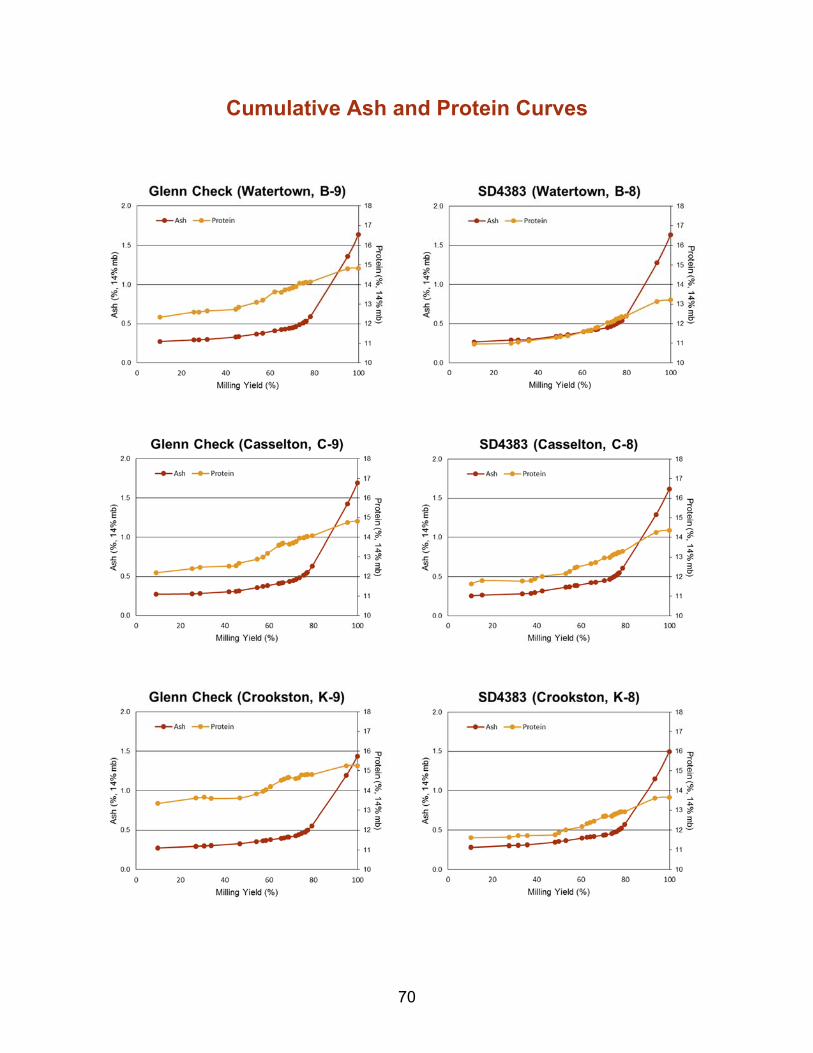
Cumulative Ash and Protein Curves
71
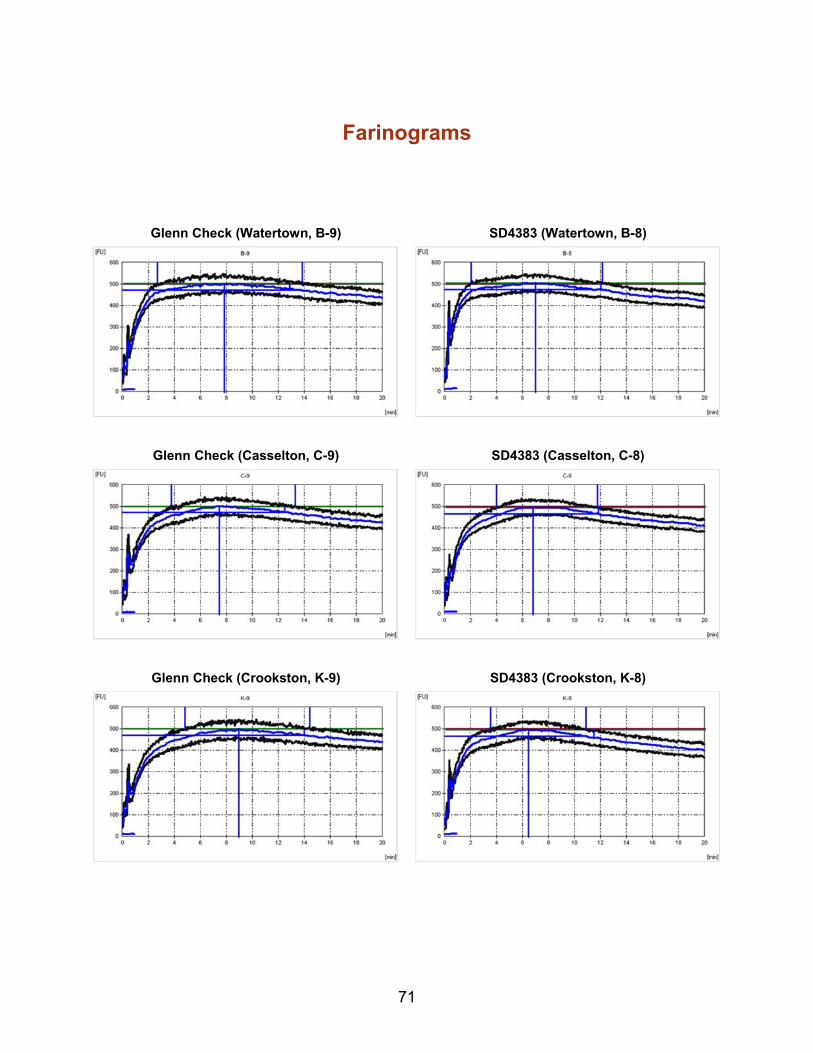
Farinograms
SD4383 (Watertown, B-8) Glenn Check (Watertown, B-9)
SD4383 (Casselton, C-8) Glenn Check (Casselton, C-9)
SD4383 (Crookston, K-8) Glenn Check (Crookston, K-9)
72
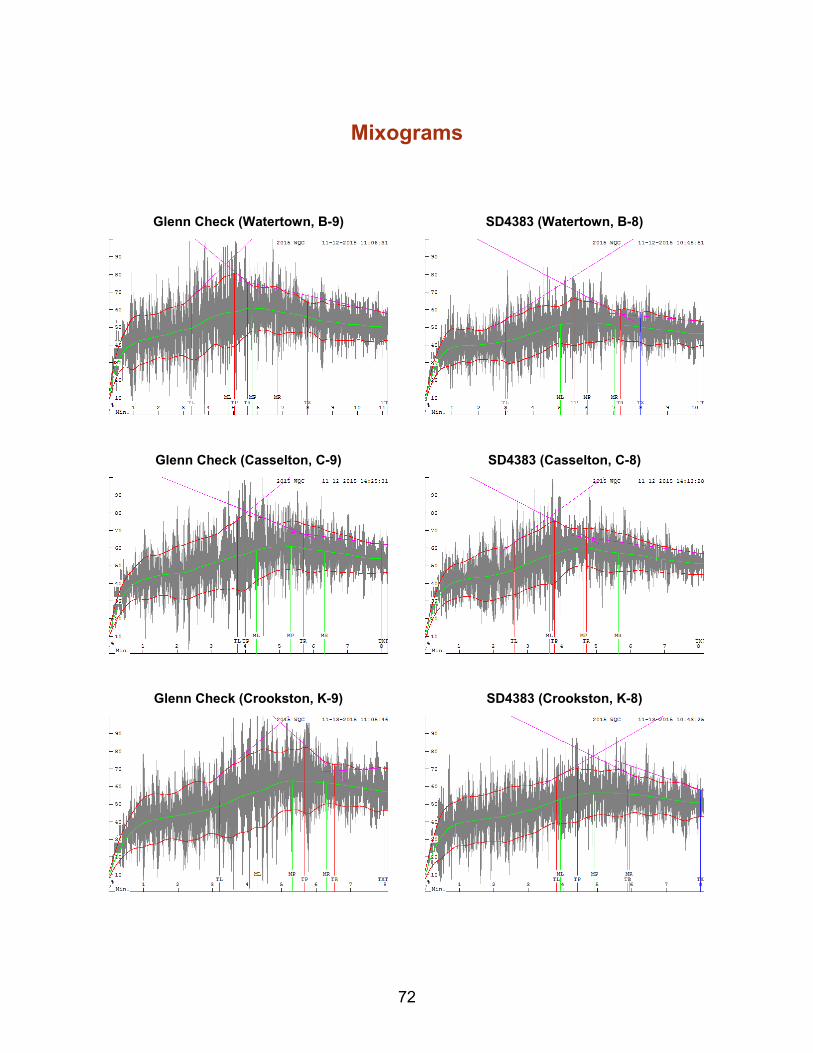
Mixograms
Glenn Check (Casselton, C-9)
Glenn Check (Crookston, K-9)
Glenn Check (Watertown, B-9) SD4383 (Watertown, B-8)
SD4383 (Casselton, C-8)
SD4383 (Crookston, K-8)
73
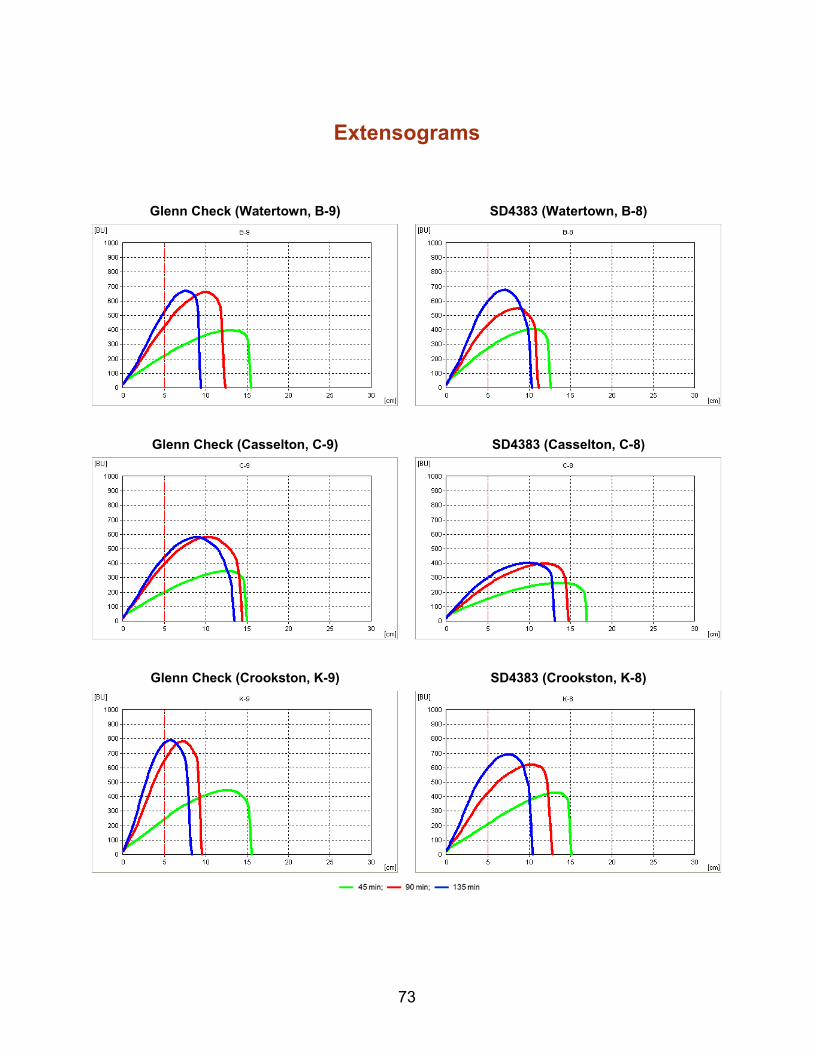
Extensograms
SD4383 (Watertown, B-8) Glenn Check (Watertown, B-9)
SD4383 (Casselton, C-8) Glenn Check (Casselton, C-9)
SD4383 (Crookston, K-8) Glenn Check (Crookston, K-9)
74
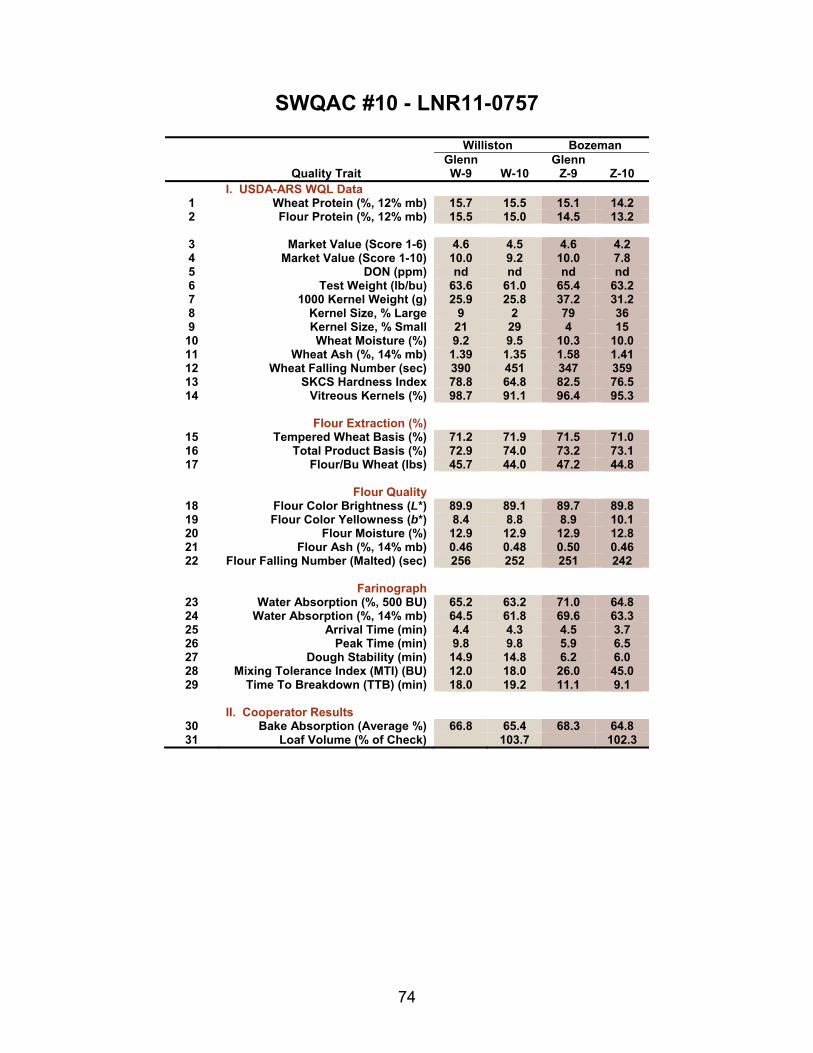
SWQAC #10 - LNR11-0757
Williston Bozeman
Quality Trait GlennW-9 W-10
Glenn Z-9
Z-10
I. USDA-ARS WQL Data 1 Wheat Protein (%, 12% mb) 15.7 15.5 15.1 14.2 2 Flour Protein (%, 12% mb) 15.5 15.0 14.5 13.2
3 Market Value (Score 1-6) 4.6 4.5 4.6 4.2 4 Market Value (Score 1-10) 10.0 9.2 10.0 7.8 5 DON (ppm) nd nd nd nd 6 Test Weight (lb/bu) 63.6 61.0 65.4 63.2 7 1000 Kernel Weight (g) 25.9 25.8 37.2 31.2 8 Kernel Size, % Large 9 2 79 36 9 Kernel Size, % Small 21 29 4 15
10 Wheat Moisture (%) 9.2 9.5 10.3 10.0 11 Wheat Ash (%, 14% mb) 1.39 1.35 1.58 1.41 12 Wheat Falling Number (sec) 390 451 347 359 13 SKCS Hardness Index 78.8 64.8 82.5 76.5 14 Vitreous Kernels (%) 98.7 91.1 96.4 95.3
Flour Extraction (%)
15 Tempered Wheat Basis (%) 71.2 71.9 71.5 71.0 16 Total Product Basis (%) 72.9 74.0 73.2 73.1 17 Flour/Bu Wheat (lbs) 45.7 44.0 47.2 44.8
Flour Quality
18 Flour Color Brightness (L*) 89.9 89.1 89.7 89.8 19 Flour Color Yellowness (b*) 8.4 8.8 8.9 10.1 20 Flour Moisture (%) 12.9 12.9 12.9 12.8 21 Flour Ash (%, 14% mb) 0.46 0.48 0.50 0.46 22 Flour Falling Number (Malted) (sec) 256 252 251 242
Farinograph
23 Water Absorption (%, 500 BU) 65.2 63.2 71.0 64.8 24 Water Absorption (%, 14% mb) 64.5 61.8 69.6 63.3 25 Arrival Time (min) 4.4 4.3 4.5 3.7 26 Peak Time (min) 9.8 9.8 5.9 6.5 27 Dough Stability (min) 14.9 14.8 6.2 6.0 28 Mixing Tolerance Index (MTI) (BU) 12.0 18.0 26.0 45.0 29 Time To Breakdown (TTB) (min) 18.0 19.2 11.1 9.1
II. Cooperator Results
30 Bake Absorption (Average %) 66.8 65.4 68.3 64.8 31 Loaf Volume (% of Check) 103.7 102.3
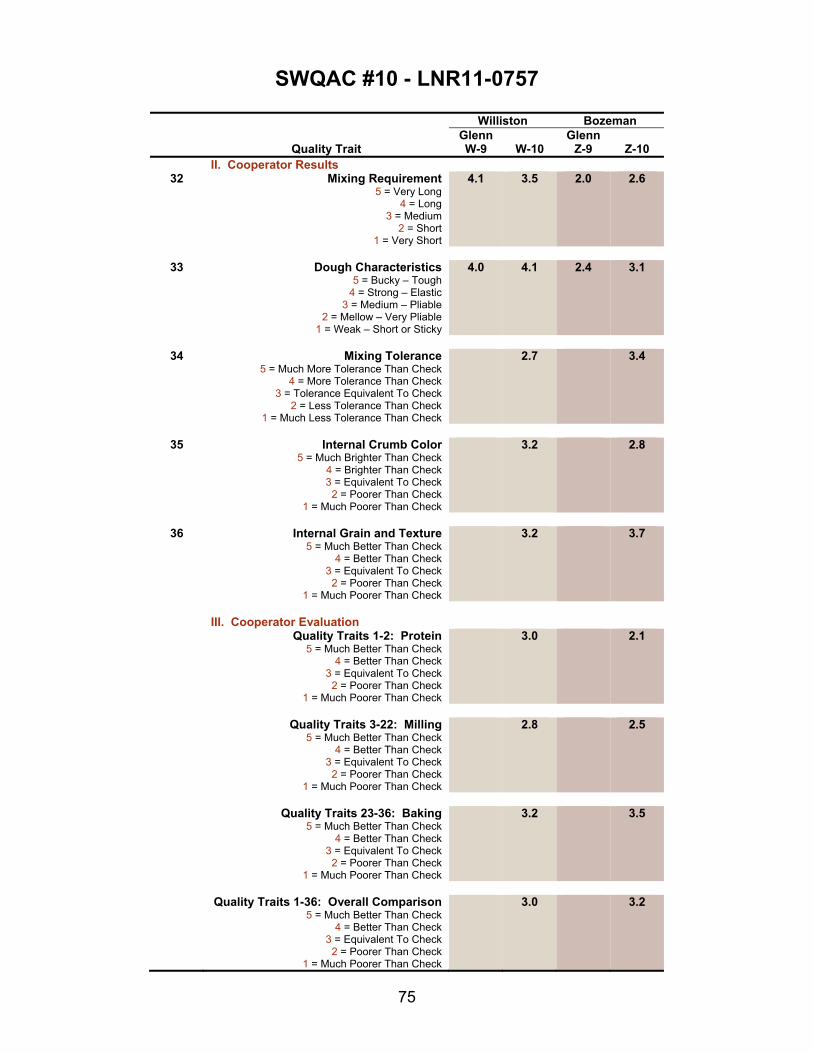
75
SWQAC #10 - LNR11-0757
Williston Bozeman
Quality Trait GlennW-9 W-10
Glenn Z-9
Z-10
II. Cooperator Results 32 Mixing Requirement
5 = Very Long 4 = Long
3 = Medium 2 = Short
1 = Very Short
4.1 3.5 2.0 2.6
33 Dough Characteristics
5 = Bucky – Tough 4 = Strong – Elastic
3 = Medium – Pliable 2 = Mellow – Very Pliable
1 = Weak – Short or Sticky
4.0 4.1 2.4 3.1
34 Mixing Tolerance
5 = Much More Tolerance Than Check 4 = More Tolerance Than Check
3 = Tolerance Equivalent To Check 2 = Less Tolerance Than Check
1 = Much Less Tolerance Than Check
2.7 3.4
35 Internal Crumb Color
5 = Much Brighter Than Check 4 = Brighter Than Check 3 = Equivalent To Check
2 = Poorer Than Check 1 = Much Poorer Than Check
3.2 2.8
36 Internal Grain and Texture
5 = Much Better Than Check 4 = Better Than Check
3 = Equivalent To Check 2 = Poorer Than Check
1 = Much Poorer Than Check
3.2 3.7
III. Cooperator Evaluation Quality Traits 1-2: Protein
5 = Much Better Than Check 4 = Better Than Check
3 = Equivalent To Check 2 = Poorer Than Check
1 = Much Poorer Than Check
3.0 2.1
Quality Traits 3-22: Milling
5 = Much Better Than Check 4 = Better Than Check
3 = Equivalent To Check 2 = Poorer Than Check
1 = Much Poorer Than Check
2.8 2.5
Quality Traits 23-36: Baking
5 = Much Better Than Check 4 = Better Than Check
3 = Equivalent To Check 2 = Poorer Than Check
1 = Much Poorer Than Check
3.2 3.5
Quality Traits 1-36: Overall Comparison
5 = Much Better Than Check 4 = Better Than Check
3 = Equivalent To Check 2 = Poorer Than Check
1 = Much Poorer Than Check
3.0 3.2
76
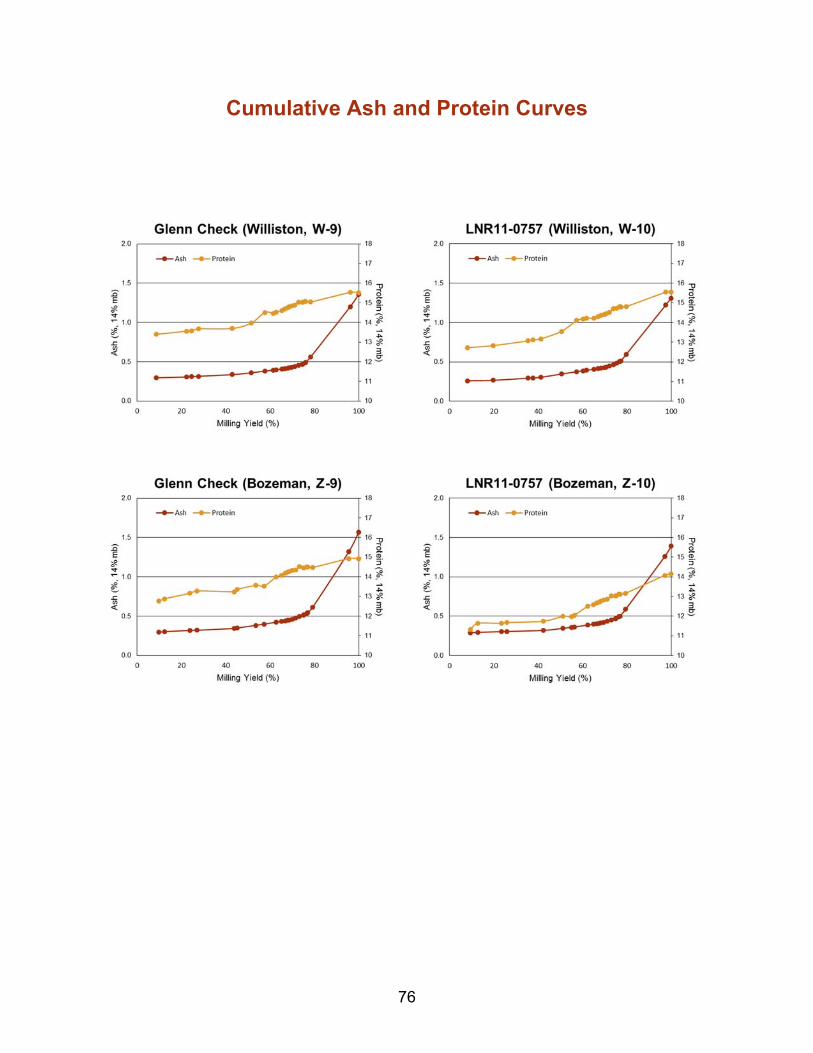
Cumulative Ash and Protein Curves
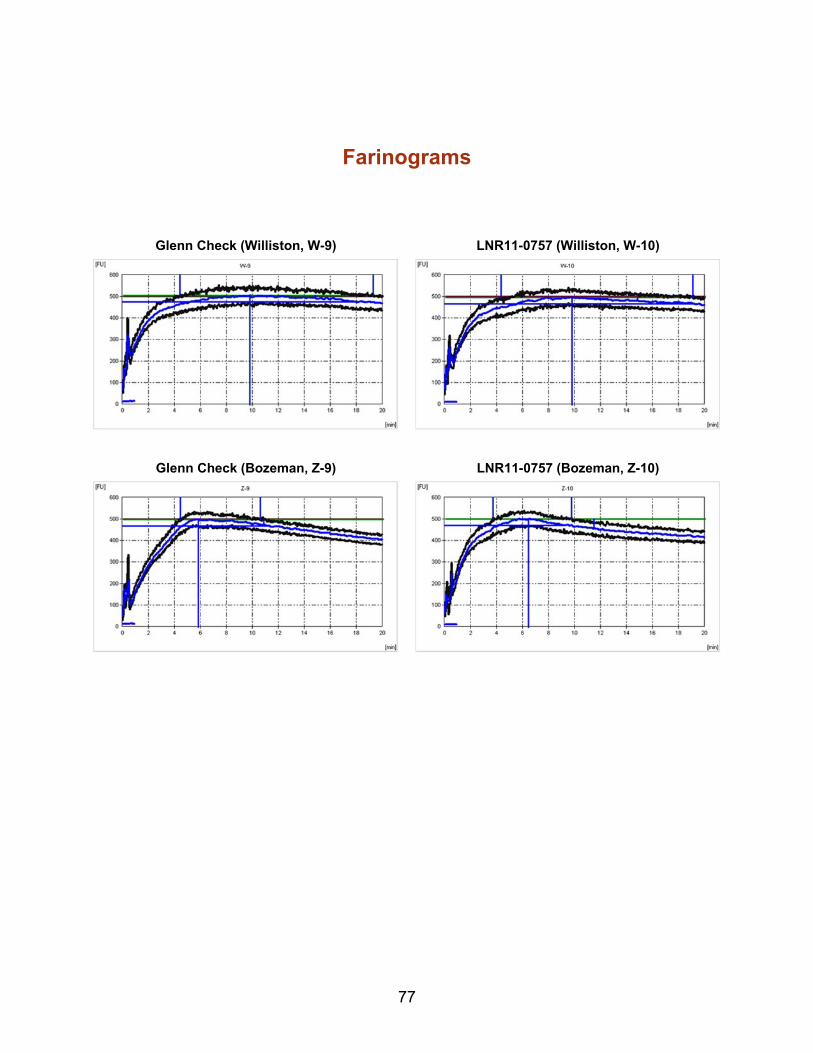
77
Farinograms
Glenn Check (Williston, W-9) LNR11-0757 (Williston, W-10)
Glenn Check (Bozeman, Z-9) LNR11-0757 (Bozeman, Z-10)
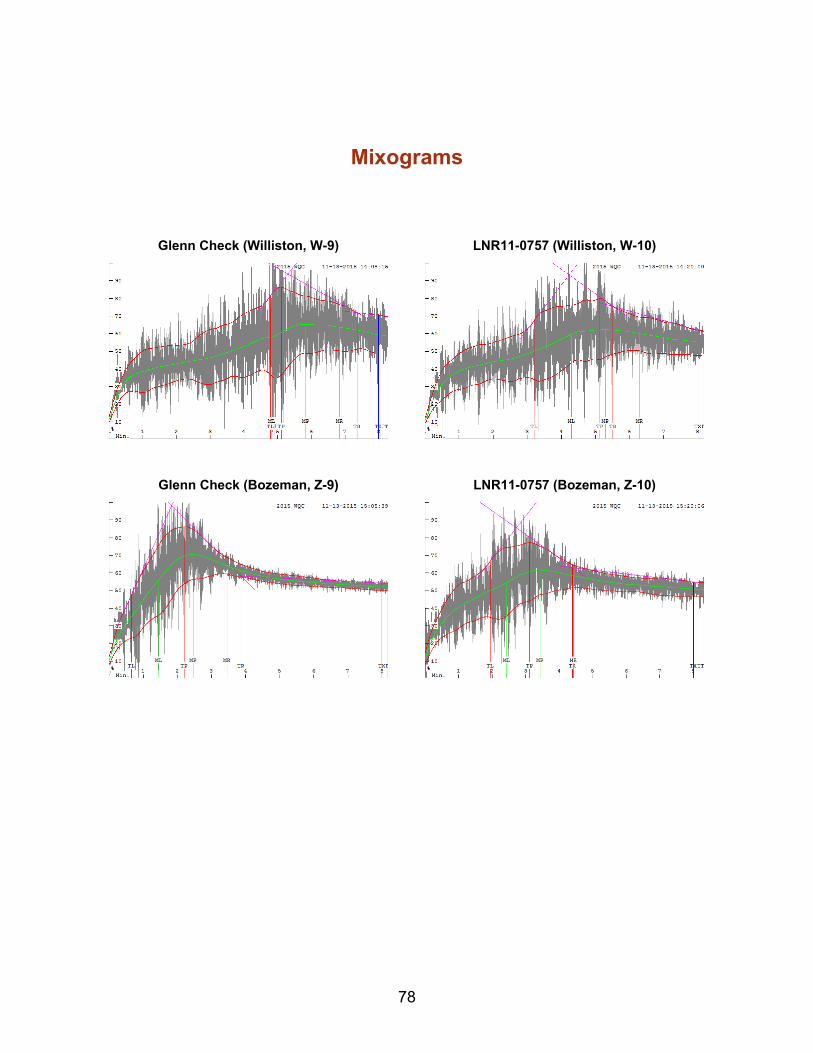
78
Mixograms
Glenn Check (Williston, W-9)
Glenn Check (Bozeman, Z-9)
LNR11-0757 (Williston, W-10)
LNR11-0757 (Bozeman, Z-10)
79
Extensograms
Glenn Check (Williston, W-9) LNR11-0757 (Williston, W-10)
Glenn Check (Bozeman, Z-9) LNR11-0757 (Bozeman, Z-10)
80
Appendix
Wheat Marketing Score .............................................................................................................. 81
Method #1 ....................................................................................................................... 81
Method #2 ....................................................................................................................... 82
Miag Mill Streams ....................................................................................................................... 83
Miag Multomat Mill Flow Chart .................................................................................................... 84
Wheat Kernel Characteristics by Location .................................................................................. 85
Flour Characteristics by Location ................................................................................................ 86
Farinograph Characteristics by Location .................................................................................... 87
Mixograph Characteristics by Location ....................................................................................... 88
Interpreting Mixogram Results .................................................................................................... 89
Extensograph Characteristics by Location .................................................................................. 90
Ash/Protein Content in Mill Streams ........................................................................................... 93
Cooperators’ Bake Data ............................................................................................................ 103 Hard Red Spring Wheat Breeding Quality Target Values ......................................................... 121
81
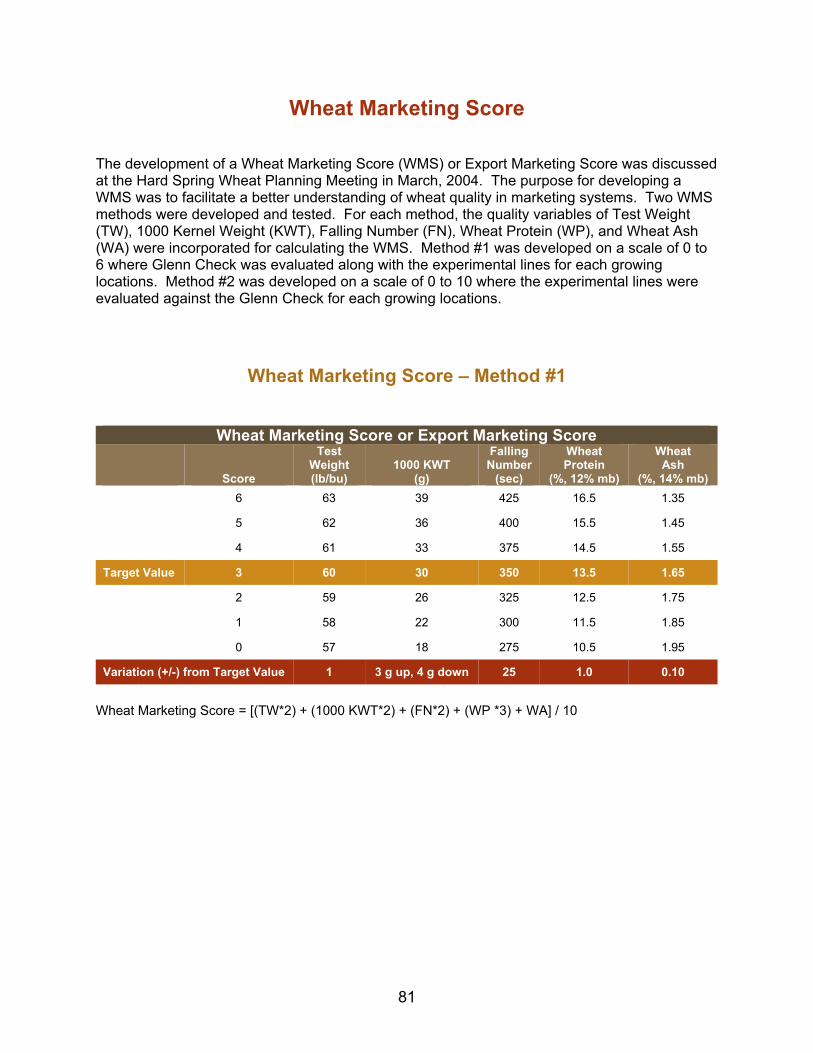
Wheat Marketing Score
The development of a Wheat Marketing Score (WMS) or Export Marketing Score was discussed at the Hard Spring Wheat Planning Meeting in March, 2004. The purpose for developing a WMS was to facilitate a better understanding of wheat quality in marketing systems. Two WMS methods were developed and tested. For each method, the quality variables of Test Weight (TW), 1000 Kernel Weight (KWT), Falling Number (FN), Wheat Protein (WP), and Wheat Ash (WA) were incorporated for calculating the WMS. Method #1 was developed on a scale of 0 to 6 where Glenn Check was evaluated along with the experimental lines for each growing locations. Method #2 was developed on a scale of 0 to 10 where the experimental lines were evaluated against the Glenn Check for each growing locations.
Wheat Marketing Score – Method #1
Wheat Marketing Score or Export Marketing Score
Score
Test Weight (lb/bu)
1000 KWT (g)
Falling Number
(sec)
Wheat Protein
(%, 12% mb)
WheatAsh
(%, 14% mb)
6 63 39 425 16.5 1.35
5 62 36 400 15.5 1.45
4 61 33 375 14.5 1.55
Target Value 3 60 30 350 13.5 1.65
2 59 26 325 12.5 1.75
1 58 22 300 11.5 1.85
0 57 18 275 10.5 1.95
Variation (+/-) from Target Value 1 3 g up, 4 g down 25 1.0 0.10
Wheat Marketing Score = [(TW*2) + (1000 KWT*2) + (FN*2) + (WP *3) + WA] / 10
82
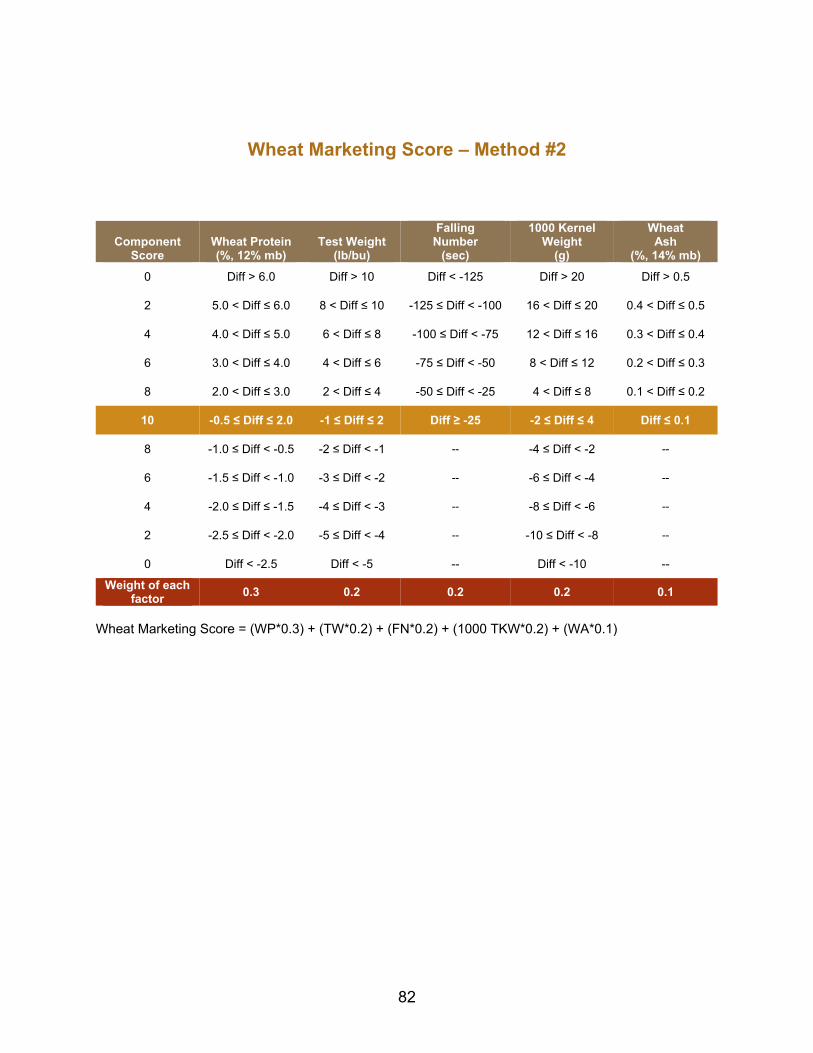
Wheat Marketing Score – Method #2
Component Score
Wheat Protein (%, 12% mb)
Test Weight (lb/bu)
FallingNumber
(sec)
1000 Kernel Weight
(g)
WheatAsh
(%, 14% mb)
0 Diff > 6.0 Diff > 10 Diff < -125 Diff > 20 Diff > 0.5
2 5.0 < Diff ≤ 6.0 8 < Diff ≤ 10 -125 ≤ Diff < -100 16 < Diff ≤ 20 0.4 < Diff ≤ 0.5
4 4.0 < Diff ≤ 5.0 6 < Diff ≤ 8 -100 ≤ Diff < -75 12 < Diff ≤ 16 0.3 < Diff ≤ 0.4
6 3.0 < Diff ≤ 4.0 4 < Diff ≤ 6 -75 ≤ Diff < -50 8 < Diff ≤ 12 0.2 < Diff ≤ 0.3
8 2.0 < Diff ≤ 3.0 2 < Diff ≤ 4 -50 ≤ Diff < -25 4 < Diff ≤ 8 0.1 < Diff ≤ 0.2
10 -0.5 ≤ Diff ≤ 2.0 -1 ≤ Diff ≤ 2 Diff ≥ -25 -2 ≤ Diff ≤ 4 Diff ≤ 0.1
8 -1.0 ≤ Diff < -0.5 -2 ≤ Diff < -1 -- -4 ≤ Diff < -2 --
6 -1.5 ≤ Diff < -1.0 -3 ≤ Diff < -2 -- -6 ≤ Diff < -4 --
4 -2.0 ≤ Diff ≤ -1.5 -4 ≤ Diff < -3 -- -8 ≤ Diff < -6 --
2 -2.5 ≤ Diff < -2.0 -5 ≤ Diff < -4 -- -10 ≤ Diff < -8 --
0 Diff < -2.5 Diff < -5 -- Diff < -10 -- Weight of each
factor 0.3 0.2 0.2 0.2 0.1
Wheat Marketing Score = (WP*0.3) + (TW*0.2) + (FN*0.2) + (1000 TKW*0.2) + (WA*0.1)
83
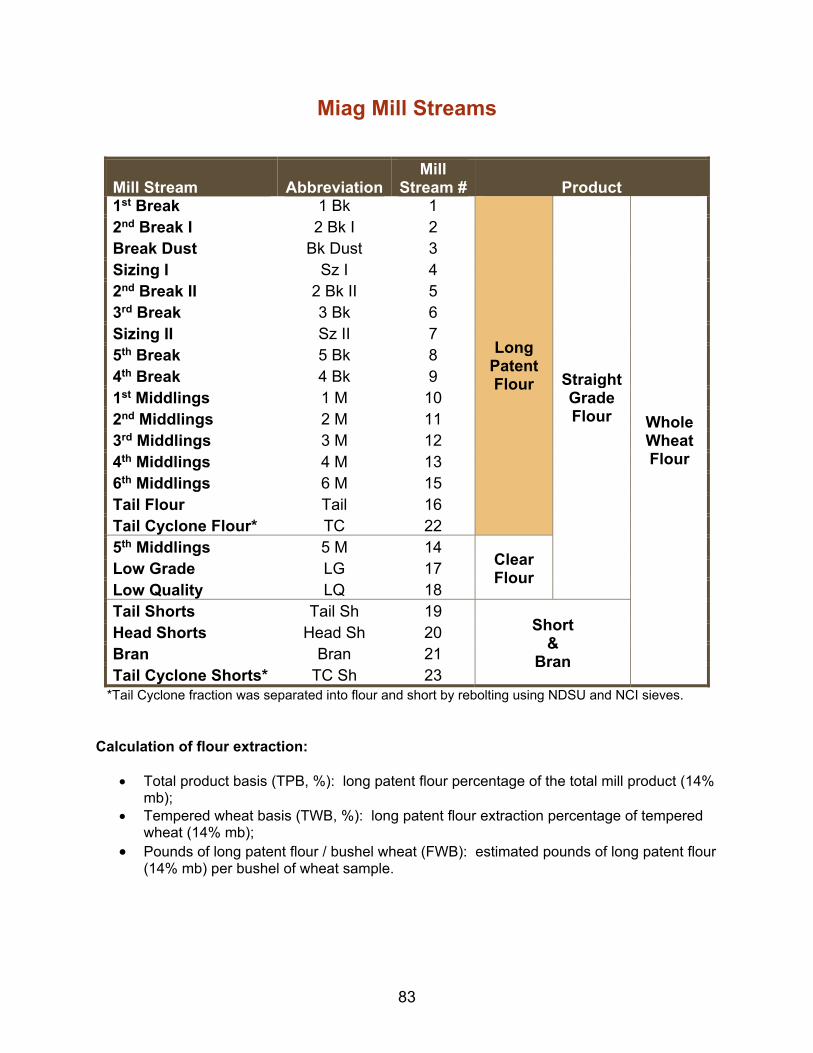
Miag Mill Streams
Mill Stream AbbreviationMill
Stream # Product 1st Break 1 Bk 1
Long Patent Flour Straight
Grade Flour Whole
Wheat Flour
2nd Break I 2 Bk I 2 Break Dust Bk Dust 3 Sizing I Sz I 4 2nd Break II 2 Bk II 5 3rd Break 3 Bk 6 Sizing II Sz II 7 5th Break 5 Bk 8 4th Break 4 Bk 9 1st Middlings 1 M 10 2nd Middlings 2 M 11 3rd Middlings 3 M 12 4th Middlings 4 M 13 6th Middlings 6 M 15 Tail Flour Tail 16 Tail Cyclone Flour* TC 22 5th Middlings 5 M 14
Clear Flour
Low Grade LG 17 Low Quality LQ 18 Tail Shorts Tail Sh 19
Short &
Bran
Head Shorts Head Sh 20 Bran Bran 21 Tail Cyclone Shorts* TC Sh 23
*Tail Cyclone fraction was separated into flour and short by rebolting using NDSU and NCI sieves. Calculation of flour extraction:
Total product basis (TPB, %): long patent flour percentage of the total mill product (14% mb);
Tempered wheat basis (TWB, %): long patent flour extraction percentage of tempered wheat (14% mb);
Pounds of long patent flour / bushel wheat (FWB): estimated pounds of long patent flour (14% mb) per bushel of wheat sample.
84
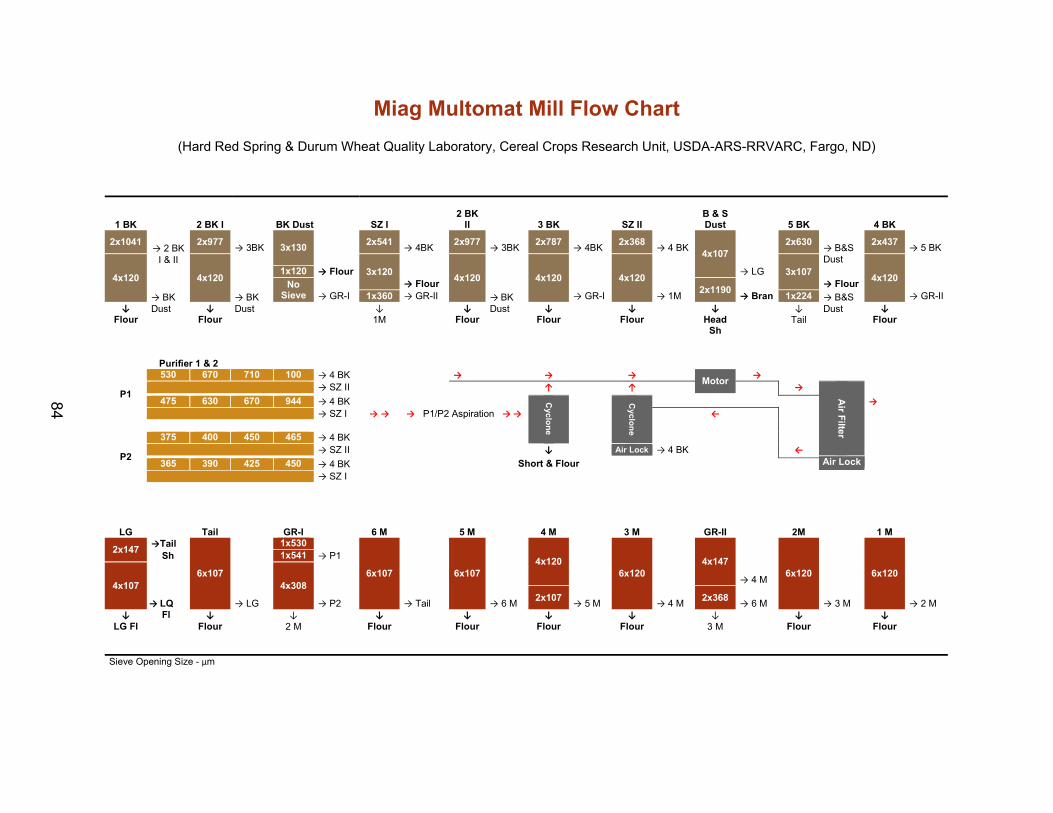
Miag Multomat Mill Flow Chart
(Hard Red Spring & Durum Wheat Quality Laboratory, Cereal Crops Research Unit, USDA-ARS-RRVARC, Fargo, ND)
1 BK
2 BK I BK Dust SZ I 2 BK
II
3 BK
SZ II B & S
Dust
5 BK
4 BK
2x1041
2x977
3x130
2x541
2x977
2x787
2x368
4x10⁷
2x630
2x437
→ 2 BK
I & II → 3BK → 4BK → 3BK → 4BK → 4 BK → B&S
Dust → 5 BK
4x120 4x120
3x120
4x120
4x120
4x120
3x10⁷
4x120
1x120 → Flour → LG No
Sieve → Flour
2x1190 → Flour
→ BK Dust
→ BK Dust
→ GR-I 1x360 → GR-II → BK Dust
→ GR-I → 1M → Bran 1x224 → B&S Dust
→ GR-II↓ ↓ ↓ ↓ ↓ ↓ ↓ ↓ ↓
Flour Flour 1M Flour Flour Flour Head Sh
Tail Flour
Purifier 1 & 2
P1
530 670 710 100 → 4 BK → → → Motor
→ → SZ II ↑ ↑ →
Air F
ilter
475 630 670 944 → 4 BK Cyclo
ne
Cyclo
ne
→ → SZ I → → → P1/P2 Aspiration → → ←
P2
375 400 450 465 → 4 BK → SZ II ↓ Air Lock → 4 BK ←
Air Lock
365 390 425 450 → 4 BK Short & Flour → SZ I
LG Tail GR-I 6 M 5 M 4 M 3 M GR-II 2M 1 M
2x147 →Tail
6x10⁷
1x530
6x10⁷
6x10⁷
4x120
6x120
4x147
6x120
6x120
Sh 1x541 → P1
4x10⁷
4x308
→ 4 M
2x10⁷
2x368
→ LQ → LG → P2 → Tail → 6 M → 5 M → 4 M → 6 M → 3 M → 2 M
↓ Fl ↓ ↓ ↓ ↓ ↓ ↓ ↓ ↓ ↓ LG Fl Flour 2 M Flour Flour Flour Flour 3 M Flour Flour
Sieve Opening Size - µm
85
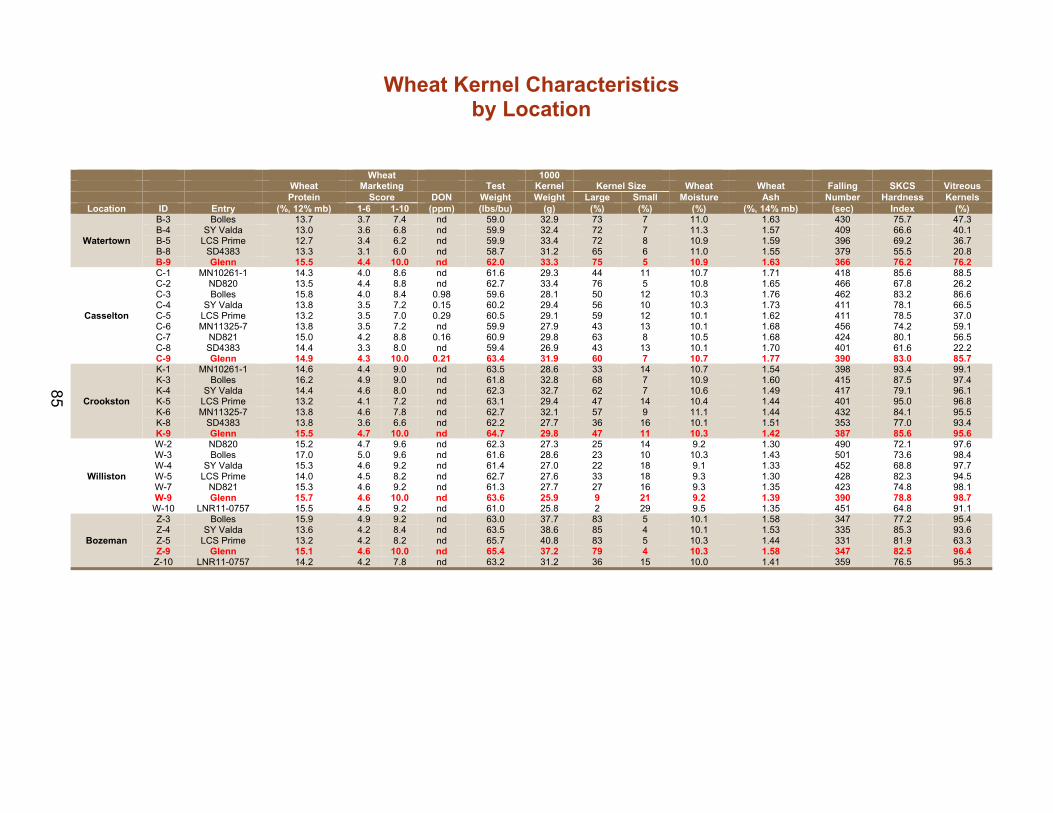
Wheat Kernel Characteristics by Location
Wheat 1000 Wheat Marketing Test Kernel Kernel Size Wheat Wheat Falling SKCS Vitreous Protein Score DON Weight Weight Large Small Moisture Ash Number Hardness Kernels
Location ID Entry (%, 12% mb) 1-6 1-10 (ppm) (lbs/bu) (g) (%) (%) (%) (%, 14% mb) (sec) Index (%)
Watertown
B-3 Bolles 13.7 3.7 7.4 nd 59.0 32.9 73 7 11.0 1.63 430 75.7 47.3 B-4 SY Valda 13.0 3.6 6.8 nd 59.9 32.4 72 7 11.3 1.57 409 66.6 40.1 B-5 LCS Prime 12.7 3.4 6.2 nd 59.9 33.4 72 8 10.9 1.59 396 69.2 36.7 B-8 SD4383 13.3 3.1 6.0 nd 58.7 31.2 65 6 11.0 1.55 379 55.5 20.8 B-9 Glenn 15.5 4.4 10.0 nd 62.0 33.3 75 5 10.9 1.63 366 76.2 76.2
Casselton
C-1 MN10261-1 14.3 4.0 8.6 nd 61.6 29.3 44 11 10.7 1.71 418 85.6 88.5 C-2 ND820 13.5 4.4 8.8 nd 62.7 33.4 76 5 10.8 1.65 466 67.8 26.2 C-3 Bolles 15.8 4.0 8.4 0.98 59.6 28.1 50 12 10.3 1.76 462 83.2 86.6 C-4 SY Valda 13.8 3.5 7.2 0.15 60.2 29.4 56 10 10.3 1.73 411 78.1 66.5 C-5 LCS Prime 13.2 3.5 7.0 0.29 60.5 29.1 59 12 10.1 1.62 411 78.5 37.0 C-6 MN11325-7 13.8 3.5 7.2 nd 59.9 27.9 43 13 10.1 1.68 456 74.2 59.1 C-7 ND821 15.0 4.2 8.8 0.16 60.9 29.8 63 8 10.5 1.68 424 80.1 56.5 C-8 SD4383 14.4 3.3 8.0 nd 59.4 26.9 43 13 10.1 1.70 401 61.6 22.2 C-9 Glenn 14.9 4.3 10.0 0.21 63.4 31.9 60 7 10.7 1.77 390 83.0 85.7
Crookston
K-1 MN10261-1 14.6 4.4 9.0 nd 63.5 28.6 33 14 10.7 1.54 398 93.4 99.1 K-3 Bolles 16.2 4.9 9.0 nd 61.8 32.8 68 7 10.9 1.60 415 87.5 97.4 K-4 SY Valda 14.4 4.6 8.0 nd 62.3 32.7 62 7 10.6 1.49 417 79.1 96.1 K-5 LCS Prime 13.2 4.1 7.2 nd 63.1 29.4 47 14 10.4 1.44 401 95.0 96.8 K-6 MN11325-7 13.8 4.6 7.8 nd 62.7 32.1 57 9 11.1 1.44 432 84.1 95.5 K-8 SD4383 13.8 3.6 6.6 nd 62.2 27.7 36 16 10.1 1.51 353 77.0 93.4 K-9 Glenn 15.5 4.7 10.0 nd 64.7 29.8 47 11 10.3 1.42 387 85.6 95.6
Williston
W-2 ND820 15.2 4.7 9.6 nd 62.3 27.3 25 14 9.2 1.30 490 72.1 97.6 W-3 Bolles 17.0 5.0 9.6 nd 61.6 28.6 23 10 10.3 1.43 501 73.6 98.4 W-4 SY Valda 15.3 4.6 9.2 nd 61.4 27.0 22 18 9.1 1.33 452 68.8 97.7 W-5 LCS Prime 14.0 4.5 8.2 nd 62.7 27.6 33 18 9.3 1.30 428 82.3 94.5 W-7 ND821 15.3 4.6 9.2 nd 61.3 27.7 27 16 9.3 1.35 423 74.8 98.1 W-9 Glenn 15.7 4.6 10.0 nd 63.6 25.9 9 21 9.2 1.39 390 78.8 98.7 W-10 LNR11-0757 15.5 4.5 9.2 nd 61.0 25.8 2 29 9.5 1.35 451 64.8 91.1
Bozeman
Z-3 Bolles 15.9 4.9 9.2 nd 63.0 37.7 83 5 10.1 1.58 347 77.2 95.4 Z-4 SY Valda 13.6 4.2 8.4 nd 63.5 38.6 85 4 10.1 1.53 335 85.3 93.6 Z-5 LCS Prime 13.2 4.2 8.2 nd 65.7 40.8 83 5 10.3 1.44 331 81.9 63.3 Z-9 Glenn 15.1 4.6 10.0 nd 65.4 37.2 79 4 10.3 1.58 347 82.5 96.4
Z-10 LNR11-0757 14.2 4.2 7.8 nd 63.2 31.2 36 15 10.0 1.41 359 76.5 95.3
86
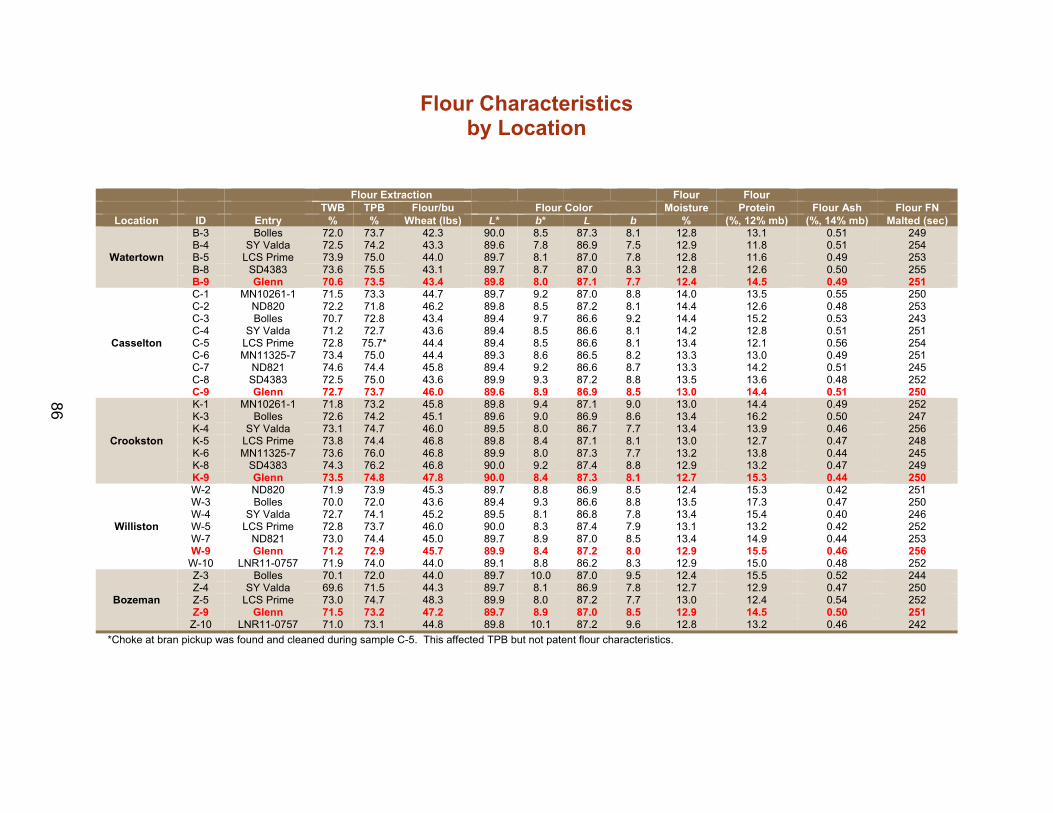
Flour Characteristics
by Location
Flour Extraction Flour Flour TWB TPB Flour/bu Flour Color Moisture Protein Flour Ash Flour FN
Location ID Entry % % Wheat (lbs) L* b* L b % (%, 12% mb) (%, 14% mb) Malted (sec)
Watertown
B-3 Bolles 72.0 73.7 42.3 90.0 8.5 87.3 8.1 12.8 13.1 0.51 249 B-4 SY Valda 72.5 74.2 43.3 89.6 7.8 86.9 7.5 12.9 11.8 0.51 254 B-5 LCS Prime 73.9 75.0 44.0 89.7 8.1 87.0 7.8 12.8 11.6 0.49 253 B-8 SD4383 73.6 75.5 43.1 89.7 8.7 87.0 8.3 12.8 12.6 0.50 255 B-9 Glenn 70.6 73.5 43.4 89.8 8.0 87.1 7.7 12.4 14.5 0.49 251
Casselton
C-1 MN10261-1 71.5 73.3 44.7 89.7 9.2 87.0 8.8 14.0 13.5 0.55 250 C-2 ND820 72.2 71.8 46.2 89.8 8.5 87.2 8.1 14.4 12.6 0.48 253 C-3 Bolles 70.7 72.8 43.4 89.4 9.7 86.6 9.2 14.4 15.2 0.53 243 C-4 SY Valda 71.2 72.7 43.6 89.4 8.5 86.6 8.1 14.2 12.8 0.51 251 C-5 LCS Prime 72.8 75.7* 44.4 89.4 8.5 86.6 8.1 13.4 12.1 0.56 254 C-6 MN11325-7 73.4 75.0 44.4 89.3 8.6 86.5 8.2 13.3 13.0 0.49 251 C-7 ND821 74.6 74.4 45.8 89.4 9.2 86.6 8.7 13.3 14.2 0.51 245 C-8 SD4383 72.5 75.0 43.6 89.9 9.3 87.2 8.8 13.5 13.6 0.48 252 C-9 Glenn 72.7 73.7 46.0 89.6 8.9 86.9 8.5 13.0 14.4 0.51 250
Crookston
K-1 MN10261-1 71.8 73.2 45.8 89.8 9.4 87.1 9.0 13.0 14.4 0.49 252 K-3 Bolles 72.6 74.2 45.1 89.6 9.0 86.9 8.6 13.4 16.2 0.50 247 K-4 SY Valda 73.1 74.7 46.0 89.5 8.0 86.7 7.7 13.4 13.9 0.46 256 K-5 LCS Prime 73.8 74.4 46.8 89.8 8.4 87.1 8.1 13.0 12.7 0.47 248 K-6 MN11325-7 73.6 76.0 46.8 89.9 8.0 87.3 7.7 13.2 13.8 0.44 245 K-8 SD4383 74.3 76.2 46.8 90.0 9.2 87.4 8.8 12.9 13.2 0.47 249 K-9 Glenn 73.5 74.8 47.8 90.0 8.4 87.3 8.1 12.7 15.3 0.44 250
Williston
W-2 ND820 71.9 73.9 45.3 89.7 8.8 86.9 8.5 12.4 15.3 0.42 251 W-3 Bolles 70.0 72.0 43.6 89.4 9.3 86.6 8.8 13.5 17.3 0.47 250 W-4 SY Valda 72.7 74.1 45.2 89.5 8.1 86.8 7.8 13.4 15.4 0.40 246 W-5 LCS Prime 72.8 73.7 46.0 90.0 8.3 87.4 7.9 13.1 13.2 0.42 252 W-7 ND821 73.0 74.4 45.0 89.7 8.9 87.0 8.5 13.4 14.9 0.44 253 W-9 Glenn 71.2 72.9 45.7 89.9 8.4 87.2 8.0 12.9 15.5 0.46 256
W-10 LNR11-0757 71.9 74.0 44.0 89.1 8.8 86.2 8.3 12.9 15.0 0.48 252
Bozeman
Z-3 Bolles 70.1 72.0 44.0 89.7 10.0 87.0 9.5 12.4 15.5 0.52 244 Z-4 SY Valda 69.6 71.5 44.3 89.7 8.1 86.9 7.8 12.7 12.9 0.47 250 Z-5 LCS Prime 73.0 74.7 48.3 89.9 8.0 87.2 7.7 13.0 12.4 0.54 252 Z-9 Glenn 71.5 73.2 47.2 89.7 8.9 87.0 8.5 12.9 14.5 0.50 251
Z-10 LNR11-0757 71.0 73.1 44.8 89.8 10.1 87.2 9.6 12.8 13.2 0.46 242
*Choke at bran pickup was found and cleaned during sample C-5. This affected TPB but not patent flour characteristics.
87
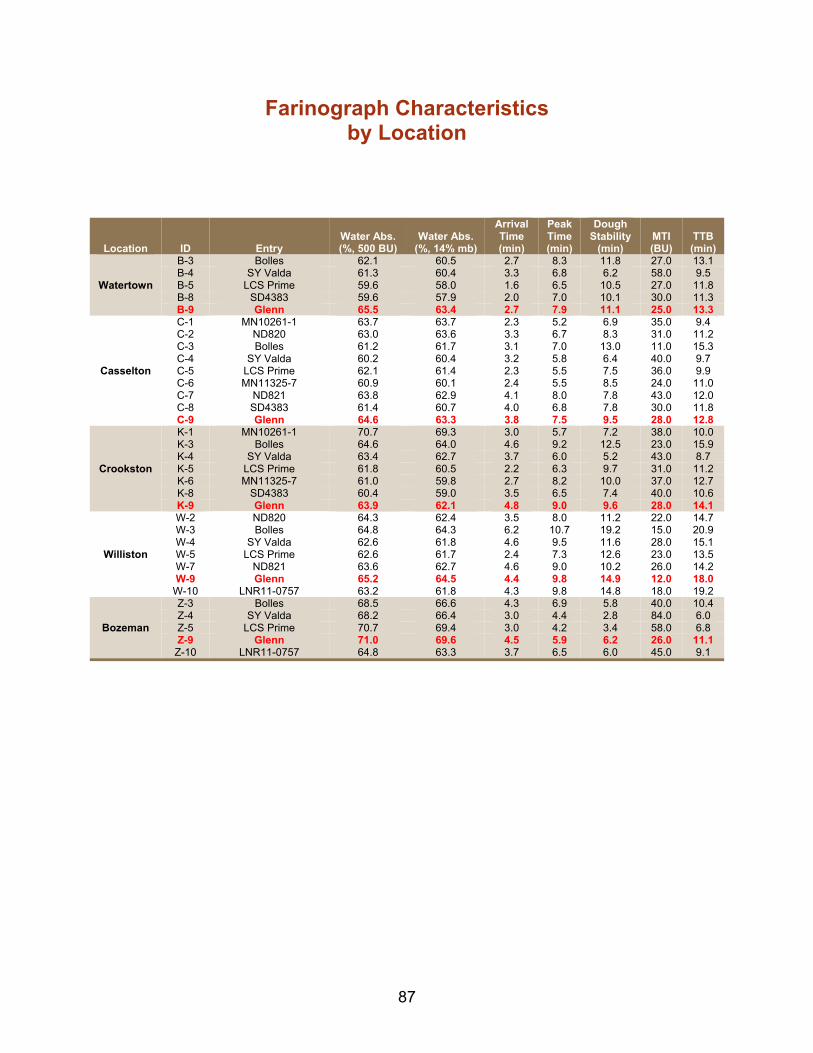
Farinograph Characteristics by Location
Location ID Entry Water Abs. (%, 500 BU)
Water Abs. (%, 14% mb)
Arrival Time (min)
Peak Time (min)
Dough Stability
(min) MTI (BU)
TTB (min)
Watertown
B-3 Bolles 62.1 60.5 2.7 8.3 11.8 27.0 13.1 B-4 SY Valda 61.3 60.4 3.3 6.8 6.2 58.0 9.5 B-5 LCS Prime 59.6 58.0 1.6 6.5 10.5 27.0 11.8 B-8 SD4383 59.6 57.9 2.0 7.0 10.1 30.0 11.3 B-9 Glenn 65.5 63.4 2.7 7.9 11.1 25.0 13.3
Casselton
C-1 MN10261-1 63.7 63.7 2.3 5.2 6.9 35.0 9.4 C-2 ND820 63.0 63.6 3.3 6.7 8.3 31.0 11.2 C-3 Bolles 61.2 61.7 3.1 7.0 13.0 11.0 15.3 C-4 SY Valda 60.2 60.4 3.2 5.8 6.4 40.0 9.7 C-5 LCS Prime 62.1 61.4 2.3 5.5 7.5 36.0 9.9 C-6 MN11325-7 60.9 60.1 2.4 5.5 8.5 24.0 11.0 C-7 ND821 63.8 62.9 4.1 8.0 7.8 43.0 12.0 C-8 SD4383 61.4 60.7 4.0 6.8 7.8 30.0 11.8 C-9 Glenn 64.6 63.3 3.8 7.5 9.5 28.0 12.8
Crookston
K-1 MN10261-1 70.7 69.3 3.0 5.7 7.2 38.0 10.0 K-3 Bolles 64.6 64.0 4.6 9.2 12.5 23.0 15.9 K-4 SY Valda 63.4 62.7 3.7 6.0 5.2 43.0 8.7 K-5 LCS Prime 61.8 60.5 2.2 6.3 9.7 31.0 11.2 K-6 MN11325-7 61.0 59.8 2.7 8.2 10.0 37.0 12.7 K-8 SD4383 60.4 59.0 3.5 6.5 7.4 40.0 10.6 K-9 Glenn 63.9 62.1 4.8 9.0 9.6 28.0 14.1
Williston
W-2 ND820 64.3 62.4 3.5 8.0 11.2 22.0 14.7 W-3 Bolles 64.8 64.3 6.2 10.7 19.2 15.0 20.9 W-4 SY Valda 62.6 61.8 4.6 9.5 11.6 28.0 15.1 W-5 LCS Prime 62.6 61.7 2.4 7.3 12.6 23.0 13.5 W-7 ND821 63.6 62.7 4.6 9.0 10.2 26.0 14.2 W-9 Glenn 65.2 64.5 4.4 9.8 14.9 12.0 18.0
W-10 LNR11-0757 63.2 61.8 4.3 9.8 14.8 18.0 19.2
Bozeman
Z-3 Bolles 68.5 66.6 4.3 6.9 5.8 40.0 10.4 Z-4 SY Valda 68.2 66.4 3.0 4.4 2.8 84.0 6.0 Z-5 LCS Prime 70.7 69.4 3.0 4.2 3.4 58.0 6.8 Z-9 Glenn 71.0 69.6 4.5 5.9 6.2 26.0 11.1
Z-10 LNR11-0757 64.8 63.3 3.7 6.5 6.0 45.0 9.1
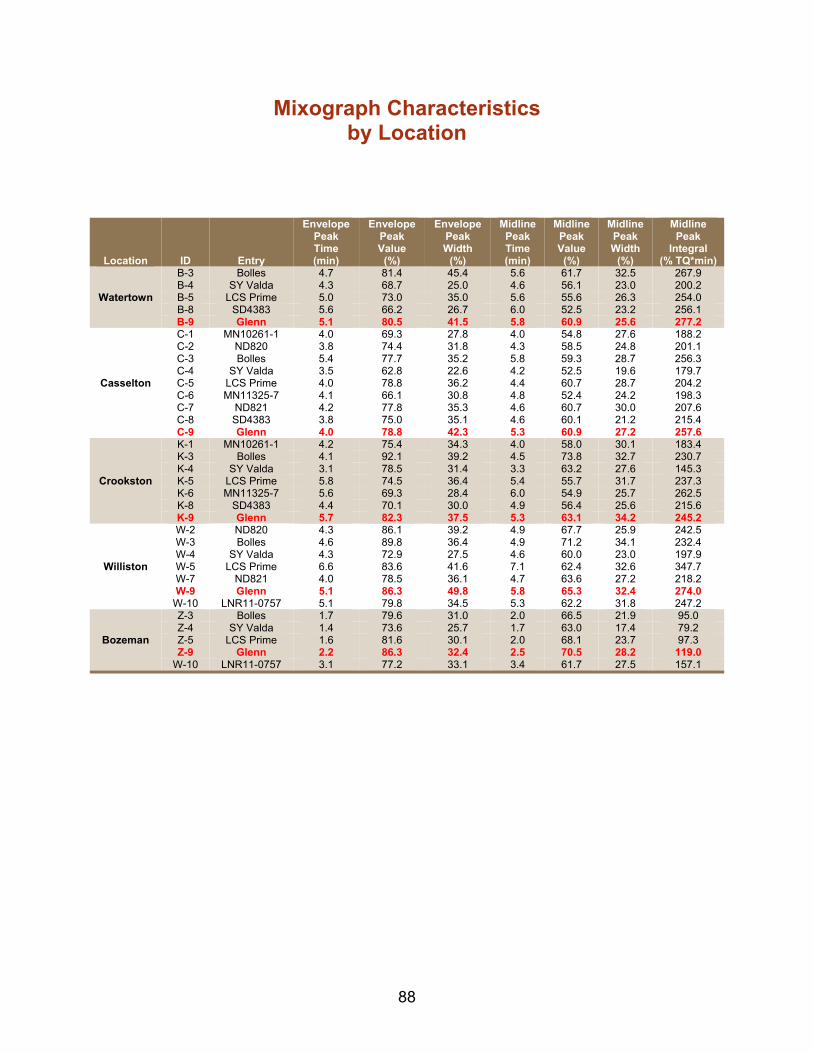
88
Mixograph Characteristics by Location
Location ID Entry
Envelope Peak Time (min)
Envelope Peak Value
(%)
Envelope Peak Width
(%)
Midline Peak Time (min)
Midline Peak Value
(%)
Midline Peak Width
(%)
Midline Peak
Integral (% TQ*min)
Watertown
B-3 Bolles 4.7 81.4 45.4 5.6 61.7 32.5 267.9 B-4 SY Valda 4.3 68.7 25.0 4.6 56.1 23.0 200.2 B-5 LCS Prime 5.0 73.0 35.0 5.6 55.6 26.3 254.0 B-8 SD4383 5.6 66.2 26.7 6.0 52.5 23.2 256.1 B-9 Glenn 5.1 80.5 41.5 5.8 60.9 25.6 277.2
Casselton
C-1 MN10261-1 4.0 69.3 27.8 4.0 54.8 27.6 188.2 C-2 ND820 3.8 74.4 31.8 4.3 58.5 24.8 201.1 C-3 Bolles 5.4 77.7 35.2 5.8 59.3 28.7 256.3 C-4 SY Valda 3.5 62.8 22.6 4.2 52.5 19.6 179.7 C-5 LCS Prime 4.0 78.8 36.2 4.4 60.7 28.7 204.2 C-6 MN11325-7 4.1 66.1 30.8 4.8 52.4 24.2 198.3 C-7 ND821 4.2 77.8 35.3 4.6 60.7 30.0 207.6 C-8 SD4383 3.8 75.0 35.1 4.6 60.1 21.2 215.4 C-9 Glenn 4.0 78.8 42.3 5.3 60.9 27.2 257.6
Crookston
K-1 MN10261-1 4.2 75.4 34.3 4.0 58.0 30.1 183.4 K-3 Bolles 4.1 92.1 39.2 4.5 73.8 32.7 230.7 K-4 SY Valda 3.1 78.5 31.4 3.3 63.2 27.6 145.3 K-5 LCS Prime 5.8 74.5 36.4 5.4 55.7 31.7 237.3 K-6 MN11325-7 5.6 69.3 28.4 6.0 54.9 25.7 262.5 K-8 SD4383 4.4 70.1 30.0 4.9 56.4 25.6 215.6 K-9 Glenn 5.7 82.3 37.5 5.3 63.1 34.2 245.2
Williston
W-2 ND820 4.3 86.1 39.2 4.9 67.7 25.9 242.5 W-3 Bolles 4.6 89.8 36.4 4.9 71.2 34.1 232.4 W-4 SY Valda 4.3 72.9 27.5 4.6 60.0 23.0 197.9 W-5 LCS Prime 6.6 83.6 41.6 7.1 62.4 32.6 347.7 W-7 ND821 4.0 78.5 36.1 4.7 63.6 27.2 218.2 W-9 Glenn 5.1 86.3 49.8 5.8 65.3 32.4 274.0
W-10 LNR11-0757 5.1 79.8 34.5 5.3 62.2 31.8 247.2
Bozeman
Z-3 Bolles 1.7 79.6 31.0 2.0 66.5 21.9 95.0 Z-4 SY Valda 1.4 73.6 25.7 1.7 63.0 17.4 79.2 Z-5 LCS Prime 1.6 81.6 30.1 2.0 68.1 23.7 97.3 Z-9 Glenn 2.2 86.3 32.4 2.5 70.5 28.2 119.0
W-10 LNR11-0757 3.1 77.2 33.1 3.4 61.7 27.5 157.1
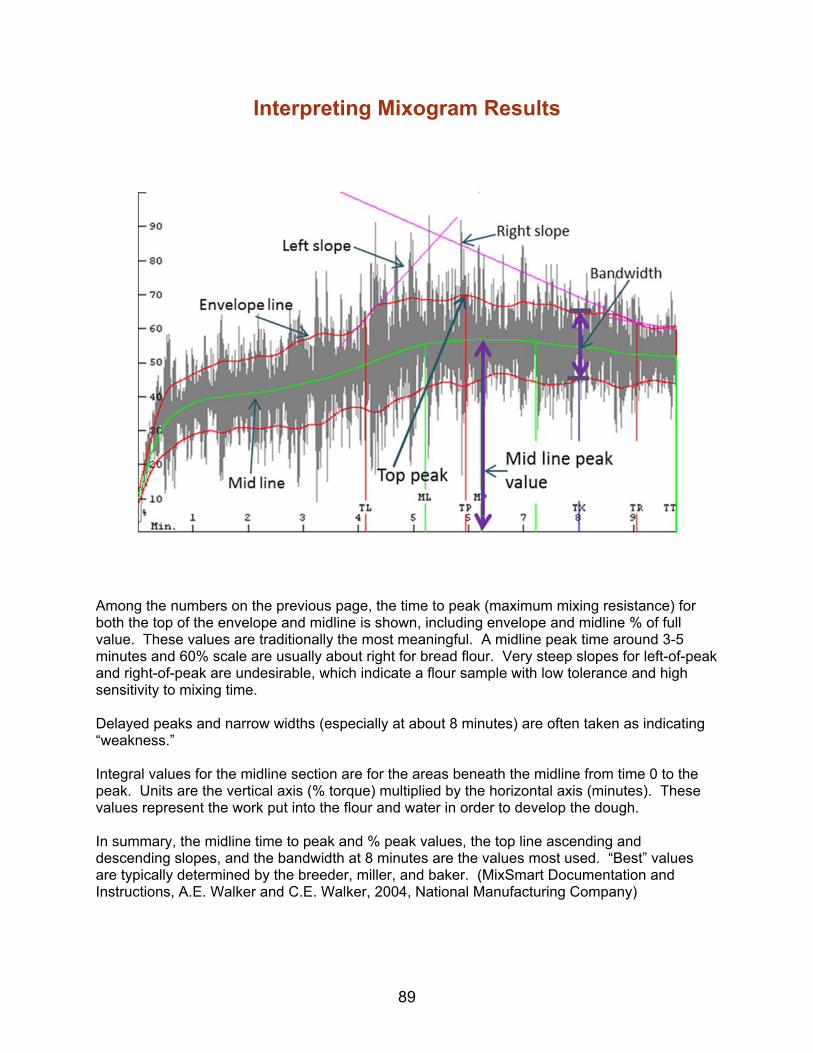
89
Interpreting Mixogram Results
Among the numbers on the previous page, the time to peak (maximum mixing resistance) for both the top of the envelope and midline is shown, including envelope and midline % of full value. These values are traditionally the most meaningful. A midline peak time around 3-5 minutes and 60% scale are usually about right for bread flour. Very steep slopes for left-of-peak and right-of-peak are undesirable, which indicate a flour sample with low tolerance and high sensitivity to mixing time. Delayed peaks and narrow widths (especially at about 8 minutes) are often taken as indicating “weakness.” Integral values for the midline section are for the areas beneath the midline from time 0 to the peak. Units are the vertical axis (% torque) multiplied by the horizontal axis (minutes). These values represent the work put into the flour and water in order to develop the dough. In summary, the midline time to peak and % peak values, the top line ascending and descending slopes, and the bandwidth at 8 minutes are the values most used. “Best” values are typically determined by the breeder, miller, and baker. (MixSmart Documentation and Instructions, A.E. Walker and C.E. Walker, 2004, National Manufacturing Company)
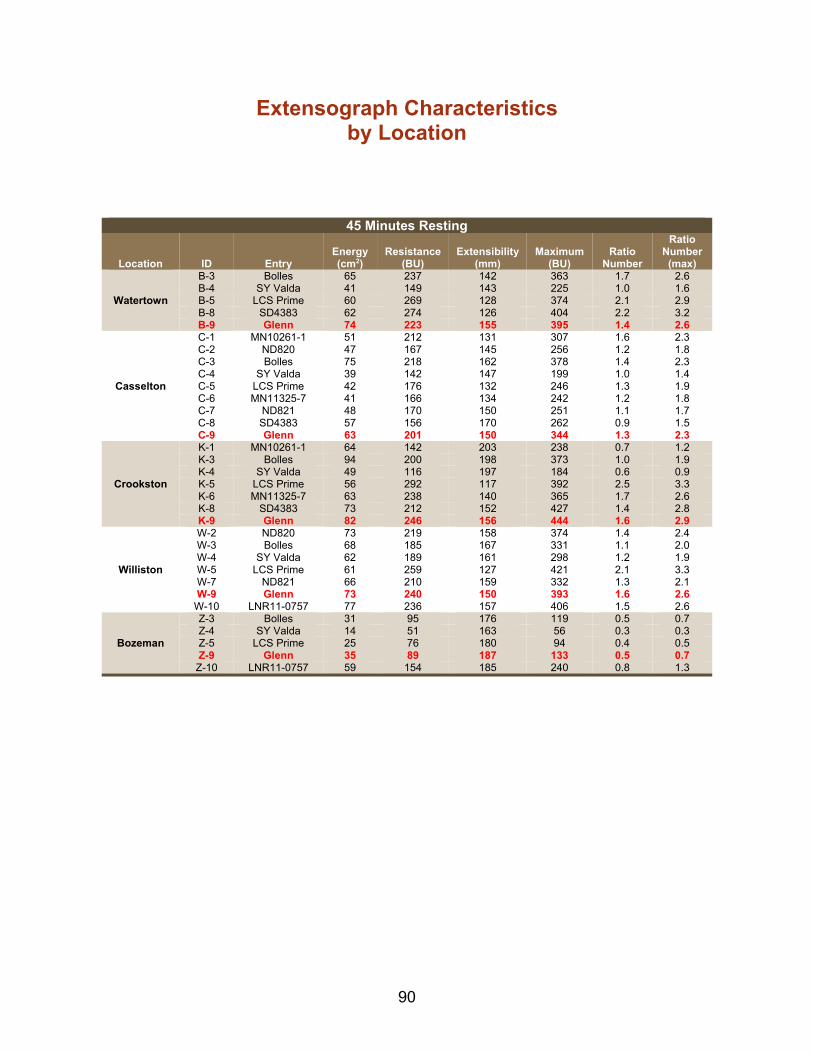
90
Extensograph Characteristics by Location
45 Minutes Resting
Location ID Entry Energy (cm2)
Resistance (BU)
Extensibility (mm)
Maximum (BU)
Ratio Number
Ratio Number
(max)
Watertown
B-3 Bolles 65 237 142 363 1.7 2.6 B-4 SY Valda 41 149 143 225 1.0 1.6 B-5 LCS Prime 60 269 128 374 2.1 2.9 B-8 SD4383 62 274 126 404 2.2 3.2 B-9 Glenn 74 223 155 395 1.4 2.6
Casselton
C-1 MN10261-1 51 212 131 307 1.6 2.3 C-2 ND820 47 167 145 256 1.2 1.8 C-3 Bolles 75 218 162 378 1.4 2.3 C-4 SY Valda 39 142 147 199 1.0 1.4 C-5 LCS Prime 42 176 132 246 1.3 1.9 C-6 MN11325-7 41 166 134 242 1.2 1.8 C-7 ND821 48 170 150 251 1.1 1.7 C-8 SD4383 57 156 170 262 0.9 1.5 C-9 Glenn 63 201 150 344 1.3 2.3
Crookston
K-1 MN10261-1 64 142 203 238 0.7 1.2 K-3 Bolles 94 200 198 373 1.0 1.9 K-4 SY Valda 49 116 197 184 0.6 0.9 K-5 LCS Prime 56 292 117 392 2.5 3.3 K-6 MN11325-7 63 238 140 365 1.7 2.6 K-8 SD4383 73 212 152 427 1.4 2.8 K-9 Glenn 82 246 156 444 1.6 2.9
Williston
W-2 ND820 73 219 158 374 1.4 2.4 W-3 Bolles 68 185 167 331 1.1 2.0 W-4 SY Valda 62 189 161 298 1.2 1.9 W-5 LCS Prime 61 259 127 421 2.1 3.3 W-7 ND821 66 210 159 332 1.3 2.1 W-9 Glenn 73 240 150 393 1.6 2.6
W-10 LNR11-0757 77 236 157 406 1.5 2.6
Bozeman
Z-3 Bolles 31 95 176 119 0.5 0.7 Z-4 SY Valda 14 51 163 56 0.3 0.3 Z-5 LCS Prime 25 76 180 94 0.4 0.5 Z-9 Glenn 35 89 187 133 0.5 0.7
Z-10 LNR11-0757 59 154 185 240 0.8 1.3
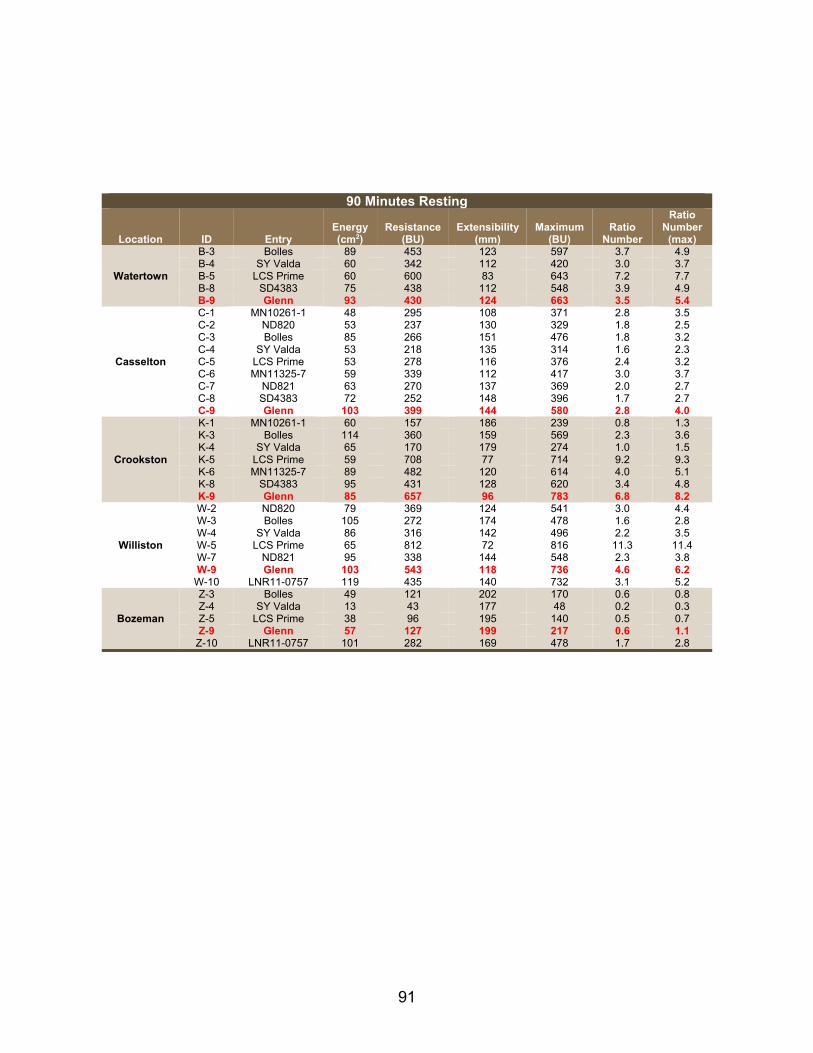
91
90 Minutes Resting
Location ID Entry Energy (cm2)
Resistance (BU)
Extensibility (mm)
Maximum (BU)
Ratio Number
Ratio Number
(max)
Watertown
B-3 Bolles 89 453 123 597 3.7 4.9 B-4 SY Valda 60 342 112 420 3.0 3.7 B-5 LCS Prime 60 600 83 643 7.2 7.7 B-8 SD4383 75 438 112 548 3.9 4.9 B-9 Glenn 93 430 124 663 3.5 5.4
Casselton
C-1 MN10261-1 48 295 108 371 2.8 3.5 C-2 ND820 53 237 130 329 1.8 2.5 C-3 Bolles 85 266 151 476 1.8 3.2 C-4 SY Valda 53 218 135 314 1.6 2.3 C-5 LCS Prime 53 278 116 376 2.4 3.2 C-6 MN11325-7 59 339 112 417 3.0 3.7 C-7 ND821 63 270 137 369 2.0 2.7 C-8 SD4383 72 252 148 396 1.7 2.7 C-9 Glenn 103 399 144 580 2.8 4.0
Crookston
K-1 MN10261-1 60 157 186 239 0.8 1.3 K-3 Bolles 114 360 159 569 2.3 3.6 K-4 SY Valda 65 170 179 274 1.0 1.5 K-5 LCS Prime 59 708 77 714 9.2 9.3 K-6 MN11325-7 89 482 120 614 4.0 5.1 K-8 SD4383 95 431 128 620 3.4 4.8 K-9 Glenn 85 657 96 783 6.8 8.2
Williston
W-2 ND820 79 369 124 541 3.0 4.4 W-3 Bolles 105 272 174 478 1.6 2.8 W-4 SY Valda 86 316 142 496 2.2 3.5 W-5 LCS Prime 65 812 72 816 11.3 11.4 W-7 ND821 95 338 144 548 2.3 3.8 W-9 Glenn 103 543 118 736 4.6 6.2
W-10 LNR11-0757 119 435 140 732 3.1 5.2
Bozeman
Z-3 Bolles 49 121 202 170 0.6 0.8 Z-4 SY Valda 13 43 177 48 0.2 0.3 Z-5 LCS Prime 38 96 195 140 0.5 0.7 Z-9 Glenn 57 127 199 217 0.6 1.1
Z-10 LNR11-0757 101 282 169 478 1.7 2.8
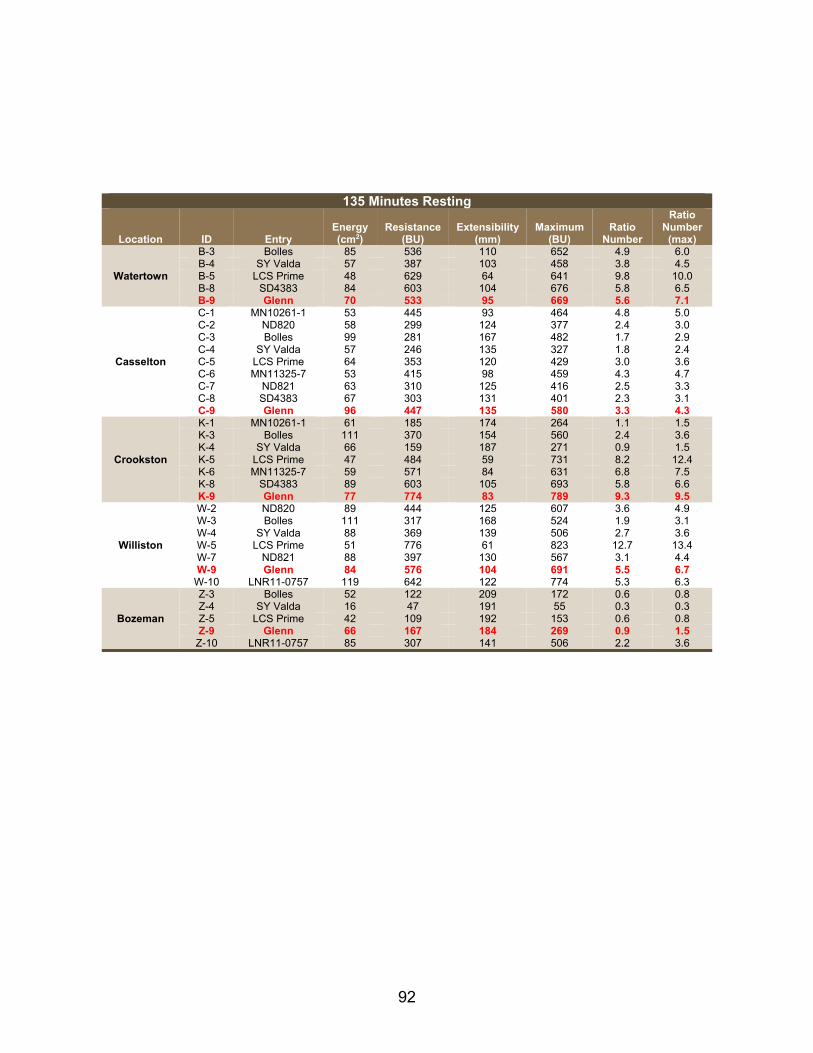
92
135 Minutes Resting
Location ID Entry Energy (cm2)
Resistance (BU)
Extensibility (mm)
Maximum (BU)
Ratio Number
Ratio Number
(max)
Watertown
B-3 Bolles 85 536 110 652 4.9 6.0 B-4 SY Valda 57 387 103 458 3.8 4.5 B-5 LCS Prime 48 629 64 641 9.8 10.0 B-8 SD4383 84 603 104 676 5.8 6.5 B-9 Glenn 70 533 95 669 5.6 7.1
Casselton
C-1 MN10261-1 53 445 93 464 4.8 5.0 C-2 ND820 58 299 124 377 2.4 3.0 C-3 Bolles 99 281 167 482 1.7 2.9 C-4 SY Valda 57 246 135 327 1.8 2.4 C-5 LCS Prime 64 353 120 429 3.0 3.6 C-6 MN11325-7 53 415 98 459 4.3 4.7 C-7 ND821 63 310 125 416 2.5 3.3 C-8 SD4383 67 303 131 401 2.3 3.1 C-9 Glenn 96 447 135 580 3.3 4.3
Crookston
K-1 MN10261-1 61 185 174 264 1.1 1.5 K-3 Bolles 111 370 154 560 2.4 3.6 K-4 SY Valda 66 159 187 271 0.9 1.5 K-5 LCS Prime 47 484 59 731 8.2 12.4 K-6 MN11325-7 59 571 84 631 6.8 7.5 K-8 SD4383 89 603 105 693 5.8 6.6 K-9 Glenn 77 774 83 789 9.3 9.5
Williston
W-2 ND820 89 444 125 607 3.6 4.9 W-3 Bolles 111 317 168 524 1.9 3.1 W-4 SY Valda 88 369 139 506 2.7 3.6 W-5 LCS Prime 51 776 61 823 12.7 13.4 W-7 ND821 88 397 130 567 3.1 4.4 W-9 Glenn 84 576 104 691 5.5 6.7
W-10 LNR11-0757 119 642 122 774 5.3 6.3
Bozeman
Z-3 Bolles 52 122 209 172 0.6 0.8 Z-4 SY Valda 16 47 191 55 0.3 0.3 Z-5 LCS Prime 42 109 192 153 0.6 0.8 Z-9 Glenn 66 167 184 269 0.9 1.5
Z-10 LNR11-0757 85 307 141 506 2.2 3.6
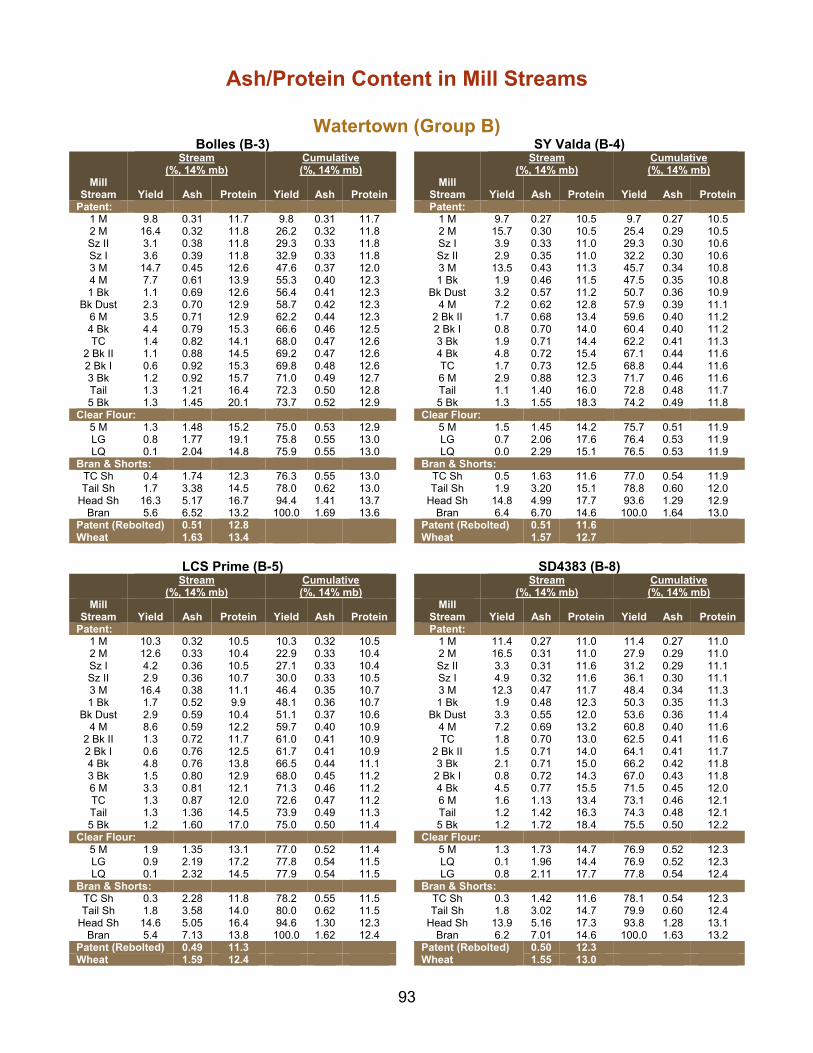
93
Ash/Protein Content in Mill Streams
Watertown (Group B) Bolles (B-3) SY Valda (B-4)
Stream
(%, 14% mb) Cumulative (%, 14% mb)
Stream
(%, 14% mb) Cumulative (%, 14% mb)
Mill Stream Yield Ash Protein Yield Ash Protein
Mill Stream Yield Ash Protein Yield Ash Protein
Patent: Patent: 1 M 9.8 0.31 11.7 9.8 0.31 11.7 1 M 9.7 0.27 10.5 9.7 0.27 10.5 2 M 16.4 0.32 11.8 26.2 0.32 11.8 2 M 15.7 0.30 10.5 25.4 0.29 10.5 Sz II 3.1 0.38 11.8 29.3 0.33 11.8 Sz I 3.9 0.33 11.0 29.3 0.30 10.6 Sz I 3.6 0.39 11.8 32.9 0.33 11.8 Sz II 2.9 0.35 11.0 32.2 0.30 10.6 3 M 14.7 0.45 12.6 47.6 0.37 12.0 3 M 13.5 0.43 11.3 45.7 0.34 10.8 4 M 7.7 0.61 13.9 55.3 0.40 12.3 1 Bk 1.9 0.46 11.5 47.5 0.35 10.8 1 Bk 1.1 0.69 12.6 56.4 0.41 12.3 Bk Dust 3.2 0.57 11.2 50.7 0.36 10.9
Bk Dust 2.3 0.70 12.9 58.7 0.42 12.3 4 M 7.2 0.62 12.8 57.9 0.39 11.1 6 M 3.5 0.71 12.9 62.2 0.44 12.3 2 Bk II 1.7 0.68 13.4 59.6 0.40 11.2 4 Bk 4.4 0.79 15.3 66.6 0.46 12.5 2 Bk I 0.8 0.70 14.0 60.4 0.40 11.2 TC 1.4 0.82 14.1 68.0 0.47 12.6 3 Bk 1.9 0.71 14.4 62.2 0.41 11.3
2 Bk II 1.1 0.88 14.5 69.2 0.47 12.6 4 Bk 4.8 0.72 15.4 67.1 0.44 11.6 2 Bk I 0.6 0.92 15.3 69.8 0.48 12.6 TC 1.7 0.73 12.5 68.8 0.44 11.6 3 Bk 1.2 0.92 15.7 71.0 0.49 12.7 6 M 2.9 0.88 12.3 71.7 0.46 11.6 Tail 1.3 1.21 16.4 72.3 0.50 12.8 Tail 1.1 1.40 16.0 72.8 0.48 11.7 5 Bk 1.3 1.45 20.1 73.7 0.52 12.9 5 Bk 1.3 1.55 18.3 74.2 0.49 11.8
Clear Flour: Clear Flour: 5 M 1.3 1.48 15.2 75.0 0.53 12.9 5 M 1.5 1.45 14.2 75.7 0.51 11.9 LG 0.8 1.77 19.1 75.8 0.55 13.0 LG 0.7 2.06 17.6 76.4 0.53 11.9 LQ 0.1 2.04 14.8 75.9 0.55 13.0 LQ 0.0 2.29 15.1 76.5 0.53 11.9
Bran & Shorts: Bran & Shorts: TC Sh 0.4 1.74 12.3 76.3 0.55 13.0 TC Sh 0.5 1.63 11.6 77.0 0.54 11.9 Tail Sh 1.7 3.38 14.5 78.0 0.62 13.0 Tail Sh 1.9 3.20 15.1 78.8 0.60 12.0
Head Sh 16.3 5.17 16.7 94.4 1.41 13.7 Head Sh 14.8 4.99 17.7 93.6 1.29 12.9 Bran 5.6 6.52 13.2 100.0 1.69 13.6 Bran 6.4 6.70 14.6 100.0 1.64 13.0
Patent (Rebolted) 0.51 12.8 Patent (Rebolted) Wheat
0.51 11.6 Wheat 1.63 13.4 1.57 12.7
LCS Prime (B-5) SD4383 (B-8)
Stream
(%, 14% mb) Cumulative (%, 14% mb)
Stream
(%, 14% mb) Cumulative (%, 14% mb)
Mill Stream Yield Ash Protein Yield Ash Protein
Mill Stream Yield Ash Protein Yield Ash Protein
Patent: Patent: 1 M 10.3 0.32 10.5 10.3 0.32 10.5 1 M 11.4 0.27 11.0 11.4 0.27 11.0 2 M 12.6 0.33 10.4 22.9 0.33 10.4 2 M 16.5 0.31 11.0 27.9 0.29 11.0 Sz I 4.2 0.36 10.5 27.1 0.33 10.4 Sz II 3.3 0.31 11.6 31.2 0.29 11.1 Sz II 2.9 0.36 10.7 30.0 0.33 10.5 Sz I 4.9 0.32 11.6 36.1 0.30 11.1 3 M 16.4 0.38 11.1 46.4 0.35 10.7 3 M 12.3 0.47 11.7 48.4 0.34 11.3 1 Bk 1.7 0.52 9.9 48.1 0.36 10.7 1 Bk 1.9 0.48 12.3 50.3 0.35 11.3
Bk Dust 2.9 0.59 10.4 51.1 0.37 10.6 Bk Dust 3.3 0.55 12.0 53.6 0.36 11.4 4 M 8.6 0.59 12.2 59.7 0.40 10.9 4 M 7.2 0.69 13.2 60.8 0.40 11.6
2 Bk II 1.3 0.72 11.7 61.0 0.41 10.9 TC 1.8 0.70 13.0 62.5 0.41 11.6 2 Bk I 0.6 0.76 12.5 61.7 0.41 10.9 2 Bk II 1.5 0.71 14.0 64.1 0.41 11.7 4 Bk 4.8 0.76 13.8 66.5 0.44 11.1 3 Bk 2.1 0.71 15.0 66.2 0.42 11.8 3 Bk 1.5 0.80 12.9 68.0 0.45 11.2 2 Bk I 0.8 0.72 14.3 67.0 0.43 11.8 6 M 3.3 0.81 12.1 71.3 0.46 11.2 4 Bk 4.5 0.77 15.5 71.5 0.45 12.0 TC 1.3 0.87 12.0 72.6 0.47 11.2 6 M 1.6 1.13 13.4 73.1 0.46 12.1 Tail 1.3 1.36 14.5 73.9 0.49 11.3 Tail 1.2 1.42 16.3 74.3 0.48 12.1 5 Bk 1.2 1.60 17.0 75.0 0.50 11.4 5 Bk 1.2 1.72 18.4 75.5 0.50 12.2
Clear Flour: Clear Flour: 5 M 1.9 1.35 13.1 77.0 0.52 11.4 5 M 1.3 1.73 14.7 76.9 0.52 12.3 LG 0.9 2.19 17.2 77.8 0.54 11.5 LQ 0.1 1.96 14.4 76.9 0.52 12.3 LQ 0.1 2.32 14.5 77.9 0.54 11.5 LG 0.8 2.11 17.7 77.8 0.54 12.4
Bran & Shorts: Bran & Shorts: TC Sh 0.3 2.28 11.8 78.2 0.55 11.5 TC Sh 0.3 1.42 11.6 78.1 0.54 12.3 Tail Sh 1.8 3.58 14.0 80.0 0.62 11.5 Tail Sh 1.8 3.02 14.7 79.9 0.60 12.4
Head Sh 14.6 5.05 16.4 94.6 1.30 12.3 Head Sh 13.9 5.16 17.3 93.8 1.28 13.1 Bran 5.4 7.13 13.8 100.0 1.62 12.4 Bran 6.2 7.01 14.6 100.0 1.63 13.2
Patent (Rebolted) 0.49 11.3 Patent (Rebolted) Wheat
0.50 12.3 Wheat 1.59 12.4 1.55 13.0
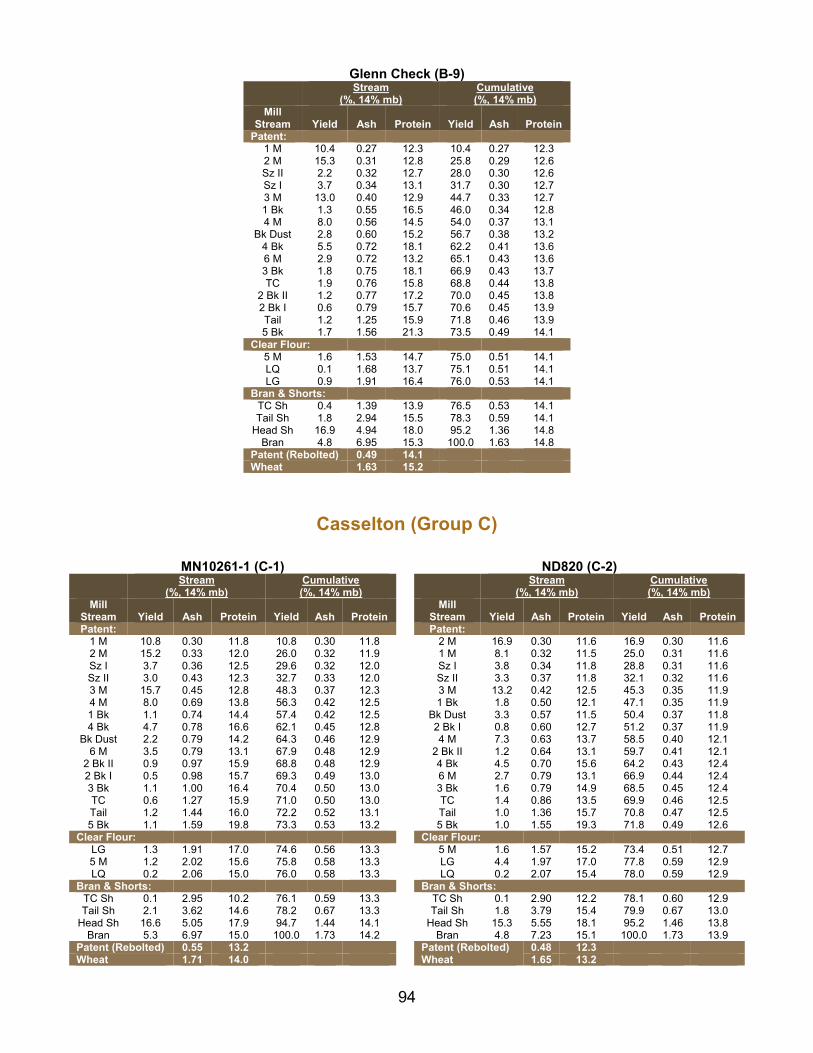
94
Glenn Check (B-9)
Stream
(%, 14% mb) Cumulative (%, 14% mb)
Mill Stream Yield Ash Protein Yield Ash Protein
Patent: 1 M 10.4 0.27 12.3 10.4 0.27 12.3 2 M 15.3 0.31 12.8 25.8 0.29 12.6 Sz II 2.2 0.32 12.7 28.0 0.30 12.6 Sz I 3.7 0.34 13.1 31.7 0.30 12.7 3 M 13.0 0.40 12.9 44.7 0.33 12.7 1 Bk 1.3 0.55 16.5 46.0 0.34 12.8 4 M 8.0 0.56 14.5 54.0 0.37 13.1
Bk Dust 2.8 0.60 15.2 56.7 0.38 13.2 4 Bk 5.5 0.72 18.1 62.2 0.41 13.6 6 M 2.9 0.72 13.2 65.1 0.43 13.6 3 Bk 1.8 0.75 18.1 66.9 0.43 13.7 TC 1.9 0.76 15.8 68.8 0.44 13.8
2 Bk II 1.2 0.77 17.2 70.0 0.45 13.8 2 Bk I 0.6 0.79 15.7 70.6 0.45 13.9 Tail 1.2 1.25 15.9 71.8 0.46 13.9 5 Bk 1.7 1.56 21.3 73.5 0.49 14.1
Clear Flour: 5 M 1.6 1.53 14.7 75.0 0.51 14.1 LQ 0.1 1.68 13.7 75.1 0.51 14.1 LG 0.9 1.91 16.4 76.0 0.53 14.1
Bran & Shorts: TC Sh 0.4 1.39 13.9 76.5 0.53 14.1 Tail Sh 1.8 2.94 15.5 78.3 0.59 14.1
Head Sh 16.9 4.94 18.0 95.2 1.36 14.8 Bran 4.8 6.95 15.3 100.0 1.63 14.8
Patent (Rebolted) 0.49 14.1 Wheat 1.63 15.2
Casselton (Group C)
MN10261-1 (C-1) ND820 (C-2)
Stream
(%, 14% mb) Cumulative (%, 14% mb)
Stream
(%, 14% mb) Cumulative (%, 14% mb)
Mill Stream Yield Ash Protein Yield Ash Protein
Mill Stream Yield Ash Protein Yield Ash Protein
Patent: Patent: 1 M 10.8 0.30 11.8 10.8 0.30 11.8 2 M 16.9 0.30 11.6 16.9 0.30 11.6 2 M 15.2 0.33 12.0 26.0 0.32 11.9 1 M 8.1 0.32 11.5 25.0 0.31 11.6 Sz I 3.7 0.36 12.5 29.6 0.32 12.0 Sz I 3.8 0.34 11.8 28.8 0.31 11.6 Sz II 3.0 0.43 12.3 32.7 0.33 12.0 Sz II 3.3 0.37 11.8 32.1 0.32 11.6 3 M 15.7 0.45 12.8 48.3 0.37 12.3 3 M 13.2 0.42 12.5 45.3 0.35 11.9 4 M 8.0 0.69 13.8 56.3 0.42 12.5 1 Bk 1.8 0.50 12.1 47.1 0.35 11.9 1 Bk 1.1 0.74 14.4 57.4 0.42 12.5 Bk Dust 3.3 0.57 11.5 50.4 0.37 11.8 4 Bk 4.7 0.78 16.6 62.1 0.45 12.8 2 Bk I 0.8 0.60 12.7 51.2 0.37 11.9
Bk Dust 2.2 0.79 14.2 64.3 0.46 12.9 4 M 7.3 0.63 13.7 58.5 0.40 12.1 6 M 3.5 0.79 13.1 67.9 0.48 12.9 2 Bk II 1.2 0.64 13.1 59.7 0.41 12.1
2 Bk II 0.9 0.97 15.9 68.8 0.48 12.9 4 Bk 4.5 0.70 15.6 64.2 0.43 12.4 2 Bk I 0.5 0.98 15.7 69.3 0.49 13.0 6 M 2.7 0.79 13.1 66.9 0.44 12.4 3 Bk 1.1 1.00 16.4 70.4 0.50 13.0 3 Bk 1.6 0.79 14.9 68.5 0.45 12.4 TC 0.6 1.27 15.9 71.0 0.50 13.0 TC 1.4 0.86 13.5 69.9 0.46 12.5 Tail 1.2 1.44 16.0 72.2 0.52 13.1 Tail 1.0 1.36 15.7 70.8 0.47 12.5 5 Bk 1.1 1.59 19.8 73.3 0.53 13.2 5 Bk 1.0 1.55 19.3 71.8 0.49 12.6
Clear Flour: Clear Flour: LG 1.3 1.91 17.0 74.6 0.56 13.3 5 M 1.6 1.57 15.2 73.4 0.51 12.7 5 M 1.2 2.02 15.6 75.8 0.58 13.3 LG 4.4 1.97 17.0 77.8 0.59 12.9 LQ 0.2 2.06 15.0 76.0 0.58 13.3 LQ 0.2 2.07 15.4 78.0 0.59 12.9
Bran & Shorts: Bran & Shorts: TC Sh 0.1 2.95 10.2 76.1 0.59 13.3 TC Sh 0.1 2.90 12.2 78.1 0.60 12.9 Tail Sh 2.1 3.62 14.6 78.2 0.67 13.3 Tail Sh 1.8 3.79 15.4 79.9 0.67 13.0
Head Sh 16.6 5.05 17.9 94.7 1.44 14.1 Head Sh 15.3 5.55 18.1 95.2 1.46 13.8 Bran 5.3 6.97 15.0 100.0 1.73 14.2 Bran 4.8 7.23 15.1 100.0 1.73 13.9
Patent (Rebolted) 0.55 13.2 Patent (Rebolted) Wheat
0.48 12.3 Wheat 1.71 14.0 1.65 13.2
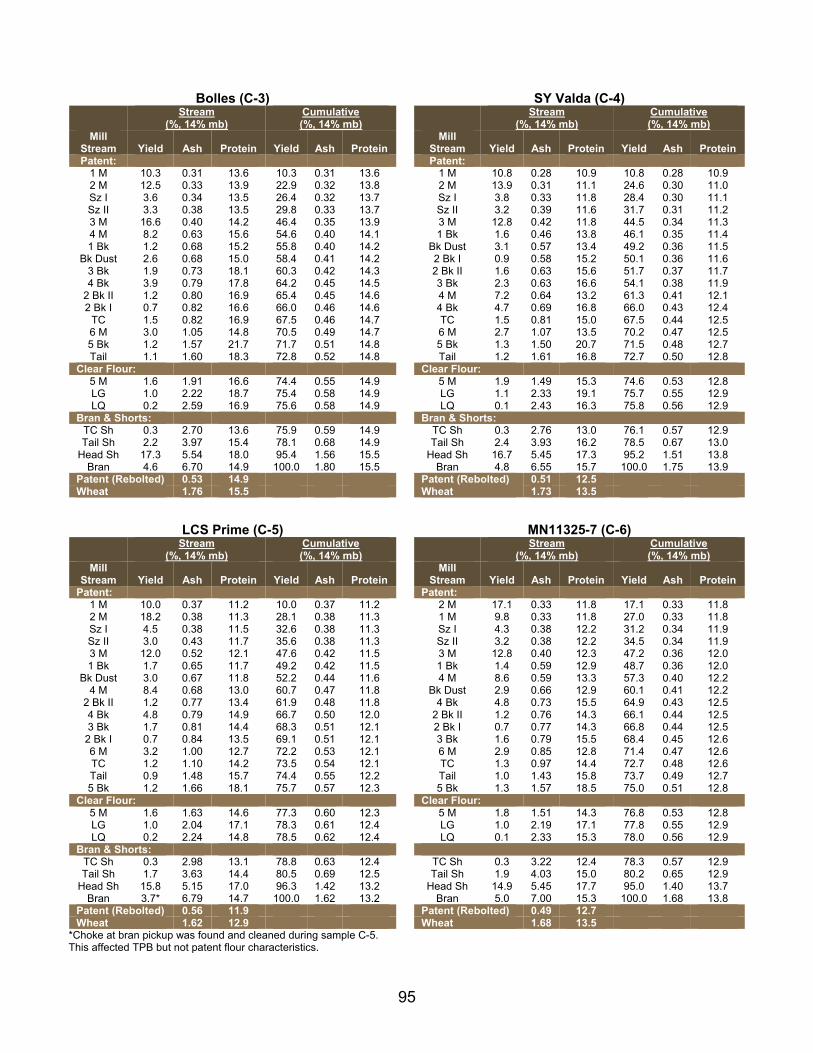
95
Bolles (C-3) SY Valda (C-4)
Stream
(%, 14% mb) Cumulative (%, 14% mb)
Stream
(%, 14% mb) Cumulative (%, 14% mb)
Mill Stream Yield Ash Protein Yield Ash Protein
Mill Stream Yield Ash Protein Yield Ash Protein
Patent: Patent: 1 M 10.3 0.31 13.6 10.3 0.31 13.6 1 M 10.8 0.28 10.9 10.8 0.28 10.9 2 M 12.5 0.33 13.9 22.9 0.32 13.8 2 M 13.9 0.31 11.1 24.6 0.30 11.0 Sz I 3.6 0.34 13.5 26.4 0.32 13.7 Sz I 3.8 0.33 11.8 28.4 0.30 11.1 Sz II 3.3 0.38 13.5 29.8 0.33 13.7 Sz II 3.2 0.39 11.6 31.7 0.31 11.2 3 M 16.6 0.40 14.2 46.4 0.35 13.9 3 M 12.8 0.42 11.8 44.5 0.34 11.3 4 M 8.2 0.63 15.6 54.6 0.40 14.1 1 Bk 1.6 0.46 13.8 46.1 0.35 11.4 1 Bk 1.2 0.68 15.2 55.8 0.40 14.2 Bk Dust 3.1 0.57 13.4 49.2 0.36 11.5
Bk Dust 2.6 0.68 15.0 58.4 0.41 14.2 2 Bk I 0.9 0.58 15.2 50.1 0.36 11.6 3 Bk 1.9 0.73 18.1 60.3 0.42 14.3 2 Bk II 1.6 0.63 15.6 51.7 0.37 11.7 4 Bk 3.9 0.79 17.8 64.2 0.45 14.5 3 Bk 2.3 0.63 16.6 54.1 0.38 11.9
2 Bk II 1.2 0.80 16.9 65.4 0.45 14.6 4 M 7.2 0.64 13.2 61.3 0.41 12.1 2 Bk I 0.7 0.82 16.6 66.0 0.46 14.6 4 Bk 4.7 0.69 16.8 66.0 0.43 12.4
TC 1.5 0.82 16.9 67.5 0.46 14.7 TC 1.5 0.81 15.0 67.5 0.44 12.5 6 M 3.0 1.05 14.8 70.5 0.49 14.7 6 M 2.7 1.07 13.5 70.2 0.47 12.5 5 Bk 1.2 1.57 21.7 71.7 0.51 14.8 5 Bk 1.3 1.50 20.7 71.5 0.48 12.7 Tail 1.1 1.60 18.3 72.8 0.52 14.8 Tail 1.2 1.61 16.8 72.7 0.50 12.8
Clear Flour: Clear Flour: 5 M 1.6 1.91 16.6 74.4 0.55 14.9 5 M 1.9 1.49 15.3 74.6 0.53 12.8 LG 1.0 2.22 18.7 75.4 0.58 14.9 LG 1.1 2.33 19.1 75.7 0.55 12.9 LQ 0.2 2.59 16.9 75.6 0.58 14.9 LQ 0.1 2.43 16.3 75.8 0.56 12.9
Bran & Shorts: Bran & Shorts: TC Sh 0.3 2.70 13.6 75.9 0.59 14.9 TC Sh 0.3 2.76 13.0 76.1 0.57 12.9 Tail Sh 2.2 3.97 15.4 78.1 0.68 14.9 Tail Sh 2.4 3.93 16.2 78.5 0.67 13.0
Head Sh 17.3 5.54 18.0 95.4 1.56 15.5 Head Sh 16.7 5.45 17.3 95.2 1.51 13.8 Bran 4.6 6.70 14.9 100.0 1.80 15.5 Bran 4.8 6.55 15.7 100.0 1.75 13.9
Patent (Rebolted) 0.53 14.9 Patent (Rebolted) Wheat
0.51 12.5 Wheat 1.76 15.5 1.73 13.5
LCS Prime (C-5) MN11325-7 (C-6)
Stream
(%, 14% mb) Cumulative (%, 14% mb)
Stream
(%, 14% mb) Cumulative (%, 14% mb)
Mill Stream Yield Ash Protein Yield Ash Protein
Mill Stream Yield Ash Protein Yield Ash Protein
Patent: Patent: 1 M 10.0 0.37 11.2 10.0 0.37 11.2 2 M 17.1 0.33 11.8 17.1 0.33 11.8 2 M 18.2 0.38 11.3 28.1 0.38 11.3 1 M 9.8 0.33 11.8 27.0 0.33 11.8 Sz I 4.5 0.38 11.5 32.6 0.38 11.3 Sz I 4.3 0.38 12.2 31.2 0.34 11.9 Sz II 3.0 0.43 11.7 35.6 0.38 11.3 Sz II 3.2 0.38 12.2 34.5 0.34 11.9 3 M 12.0 0.52 12.1 47.6 0.42 11.5 3 M 12.8 0.40 12.3 47.2 0.36 12.0 1 Bk 1.7 0.65 11.7 49.2 0.42 11.5 1 Bk 1.4 0.59 12.9 48.7 0.36 12.0
Bk Dust 3.0 0.67 11.8 52.2 0.44 11.6 4 M 8.6 0.59 13.3 57.3 0.40 12.2 4 M 8.4 0.68 13.0 60.7 0.47 11.8 Bk Dust 2.9 0.66 12.9 60.1 0.41 12.2
2 Bk II 1.2 0.77 13.4 61.9 0.48 11.8 4 Bk 4.8 0.73 15.5 64.9 0.43 12.5 4 Bk 4.8 0.79 14.9 66.7 0.50 12.0 2 Bk II 1.2 0.76 14.3 66.1 0.44 12.5 3 Bk 1.7 0.81 14.4 68.3 0.51 12.1 2 Bk I 0.7 0.77 14.3 66.8 0.44 12.5
2 Bk I 0.7 0.84 13.5 69.1 0.51 12.1 3 Bk 1.6 0.79 15.5 68.4 0.45 12.6 6 M 3.2 1.00 12.7 72.2 0.53 12.1 6 M 2.9 0.85 12.8 71.4 0.47 12.6 TC 1.2 1.10 14.2 73.5 0.54 12.1 TC 1.3 0.97 14.4 72.7 0.48 12.6 Tail 0.9 1.48 15.7 74.4 0.55 12.2 Tail 1.0 1.43 15.8 73.7 0.49 12.7 5 Bk 1.2 1.66 18.1 75.7 0.57 12.3 5 Bk 1.3 1.57 18.5 75.0 0.51 12.8
Clear Flour: Clear Flour: 5 M 1.6 1.63 14.6 77.3 0.60 12.3 5 M 1.8 1.51 14.3 76.8 0.53 12.8 LG 1.0 2.04 17.1 78.3 0.61 12.4 LG 1.0 2.19 17.1 77.8 0.55 12.9 LQ 0.2 2.24 14.8 78.5 0.62 12.4 LQ 0.1 2.33 15.3 78.0 0.56 12.9
Bran & Shorts: TC Sh 0.3 2.98 13.1 78.8 0.63 12.4 TC Sh 0.3 3.22 12.4 78.3 0.57 12.9 Tail Sh 1.7 3.63 14.4 80.5 0.69 12.5 Tail Sh 1.9 4.03 15.0 80.2 0.65 12.9
Head Sh 15.8 5.15 17.0 96.3 1.42 13.2 Head Sh 14.9 5.45 17.7 95.0 1.40 13.7 Bran 3.7* 6.79 14.7 100.0 1.62 13.2 Bran 5.0 7.00 15.3 100.0 1.68 13.8
Patent (Rebolted) 0.56 11.9 Patent (Rebolted) 0.49 12.7 Wheat 1.62 12.9 Wheat 1.68 13.5
*Choke at bran pickup was found and cleaned during sample C-5. This affected TPB but not patent flour characteristics.

96
ND821 (C-7) SD4383 (C-8)
Stream
(%, 14% mb) Cumulative (%, 14% mb)
Stream
(%, 14% mb) Cumulative (%, 14% mb)
Mill Stream Yield Ash Protein Yield Ash Protein
Mill Stream Yield Ash Protein Yield Ash Protein
Patent: Patent: 1 M 8.3 0.32 12.5 8.3 0.32 12.5 1 M 10.5 0.26 11.6 10.5 0.26 11.6 2 M 15.8 0.32 12.6 24.1 0.32 12.6 Sz I 4.9 0.28 12.2 15.5 0.26 11.8 3 M 14.5 0.36 12.9 38.7 0.34 12.7 2 M 18.1 0.30 11.8 33.6 0.28 11.8 Sz I 3.8 0.37 13.0 42.5 0.34 12.7 Sz II 3.9 0.35 12.0 37.4 0.29 11.8 Sz II 3.2 0.38 12.9 45.7 0.34 12.7 1 Bk 1.8 0.48 13.9 39.3 0.30 11.9 1 Bk 1.4 0.54 13.9 47.1 0.35 12.8 Bk Dust 3.3 0.55 13.5 42.6 0.32 12.0 4 M 8.4 0.59 14.3 55.5 0.39 13.0 3 M 10.6 0.56 12.7 53.2 0.37 12.2
Bk Dust 2.9 0.68 13.8 58.3 0.40 13.0 2 Bk II 1.8 0.61 15.3 55.0 0.37 12.3 4 Bk 4.5 0.75 16.8 62.8 0.42 13.3 3 Bk 2.4 0.64 16.6 57.4 0.38 12.4
2 Bk I 0.7 0.76 15.5 63.5 0.43 13.3 2 Bk I 0.9 0.65 15.4 58.3 0.39 12.5 2 Bk II 1.2 0.76 15.6 64.7 0.43 13.4 4 M 6.3 0.73 14.3 64.7 0.42 12.7 3 Bk 1.6 0.77 16.8 66.3 0.44 13.5 TC 2.0 0.74 14.9 66.7 0.43 12.7 6 M 2.8 0.85 13.6 69.0 0.46 13.5 4 Bk 4.0 0.74 16.7 70.7 0.45 13.0 TC 1.3 1.00 15.7 70.3 0.47 13.5 6 M 2.3 1.04 13.6 73.0 0.47 13.0 Tail 3.0 1.49 17.0 73.3 0.51 13.6 5 Bk 1.1 1.69 20.2 74.2 0.49 13.1 5 Bk 1.1 1.75 20.5 74.4 0.53 13.7 Tail 0.9 1.70 17.6 75.0 0.50 13.1
Clear Flour: Clear Flour: 5 M 2.2 1.37 15.0 76.5 0.55 13.8 5 M 1.0 1.92 15.9 76.0 0.52 13.2 LQ 0.2 2.20 16.5 76.7 0.55 13.8 LG 0.8 2.33 18.7 76.9 0.54 13.2 LG 1.0 2.21 18.0 77.7 0.58 13.8 LQ 0.1 2.59 16.4 76.9 0.54 13.2
Bran & Shorts: TC Sh 0.4 2.82 13.4 78.1 0.59 13.8 TC Sh 0.4 2.10 13.3 77.3 0.55 13.2 Tail Sh 1.9 4.07 16.3 79.9 0.67 13.9 Tail Sh 1.6 3.60 15.6 78.9 0.61 13.3
Head Sh 15.0 5.12 19.6 95.0 1.37 14.8 Head Sh 15.0 4.87 19.3 94.0 1.29 14.3 Bran 5.0 7.22 15.5 100.0 1.67 14.8 Bran 6.0 6.68 16.0 100.0 1.62 14.4
Patent (Rebolted) 0.51 13.9 Patent (Rebolted) Wheat
0.48 13.3 Wheat 1.68 14.7 1.70 14.1
Glenn Check (C-9)
Stream
(%, 14% mb) Cumulative (%, 14% mb)
Mill Stream Yield Ash Protein Yield Ash Protein
Patent: 1 M 9.1 0.27 12.2 9.1 0.27 12.2 2 M 16.4 0.28 12.5 25.4 0.28 12.4 Sz I 3.6 0.32 13.0 29.0 0.28 12.5 3 M 12.9 0.35 12.6 41.9 0.31 12.5 Sz II 3.2 0.38 12.8 45.1 0.31 12.5 1 Bk 1.4 0.58 16.8 46.5 0.32 12.7 4 M 8.2 0.59 14.1 54.8 0.36 12.9
Bk Dust 2.7 0.66 15.4 57.4 0.37 13.0 3 Bk 1.9 0.71 18.4 59.3 0.38 13.2 4 Bk 5.1 0.73 18.2 64.5 0.41 13.6
2 Bk II 1.1 0.76 17.3 65.6 0.42 13.6 2 Bk I 0.7 0.76 17.5 66.3 0.42 13.7 6 M 3.1 0.83 13.0 69.4 0.44 13.7 TC 1.7 0.86 16.4 71.1 0.45 13.7 Tail 1.2 1.38 17.0 72.3 0.47 13.8 5 Bk 1.4 1.59 22.2 73.7 0.49 13.9
Clear Flour: 5 M 1.9 1.59 15.0 75.7 0.52 14.0 LQ 0.2 1.90 15.0 75.8 0.52 14.0 LG 1.1 2.16 18.0 76.9 0.54 14.0
Bran & Shorts: TC Sh 0.4 2.49 14.5 77.3 0.55 14.0 Tail Sh 2.2 3.44 15.2 79.6 0.63 14.1
Head Sh 15.9 5.40 18.2 95.4 1.43 14.8 Bran 4.6 7.28 16.3 100.0 1.69 14.8
Patent (Rebolted) 0.51 14.1 Wheat 1.77 14.6
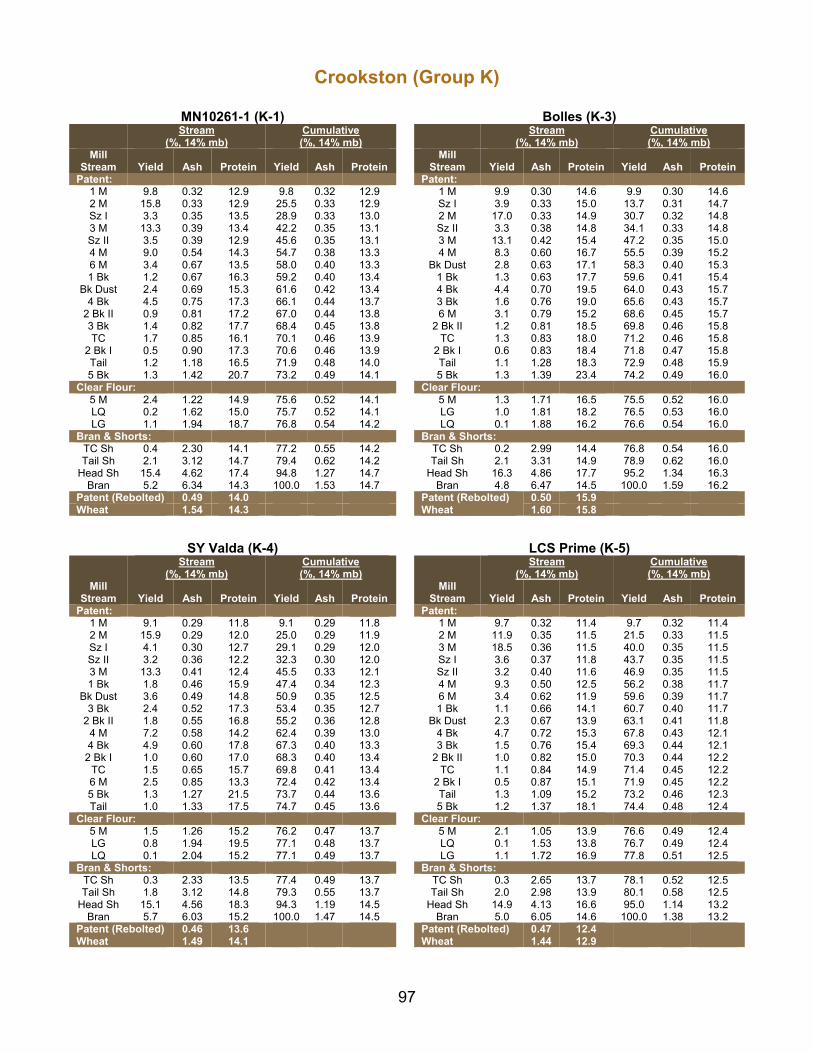
97
Crookston (Group K)
MN10261-1 (K-1) Bolles (K-3)
Stream
(%, 14% mb) Cumulative (%, 14% mb)
Stream
(%, 14% mb) Cumulative (%, 14% mb)
Mill Stream Yield Ash Protein Yield Ash Protein
Mill Stream Yield Ash Protein Yield Ash Protein
Patent: Patent: 1 M 9.8 0.32 12.9 9.8 0.32 12.9 1 M 9.9 0.30 14.6 9.9 0.30 14.6 2 M 15.8 0.33 12.9 25.5 0.33 12.9 Sz I 3.9 0.33 15.0 13.7 0.31 14.7 Sz I 3.3 0.35 13.5 28.9 0.33 13.0 2 M 17.0 0.33 14.9 30.7 0.32 14.8 3 M 13.3 0.39 13.4 42.2 0.35 13.1 Sz II 3.3 0.38 14.8 34.1 0.33 14.8 Sz II 3.5 0.39 12.9 45.6 0.35 13.1 3 M 13.1 0.42 15.4 47.2 0.35 15.0 4 M 9.0 0.54 14.3 54.7 0.38 13.3 4 M 8.3 0.60 16.7 55.5 0.39 15.2 6 M 3.4 0.67 13.5 58.0 0.40 13.3 Bk Dust 2.8 0.63 17.1 58.3 0.40 15.3 1 Bk 1.2 0.67 16.3 59.2 0.40 13.4 1 Bk 1.3 0.63 17.7 59.6 0.41 15.4
Bk Dust 2.4 0.69 15.3 61.6 0.42 13.4 4 Bk 4.4 0.70 19.5 64.0 0.43 15.7 4 Bk 4.5 0.75 17.3 66.1 0.44 13.7 3 Bk 1.6 0.76 19.0 65.6 0.43 15.7
2 Bk II 0.9 0.81 17.2 67.0 0.44 13.8 6 M 3.1 0.79 15.2 68.6 0.45 15.7 3 Bk 1.4 0.82 17.7 68.4 0.45 13.8 2 Bk II 1.2 0.81 18.5 69.8 0.46 15.8 TC 1.7 0.85 16.1 70.1 0.46 13.9 TC 1.3 0.83 18.0 71.2 0.46 15.8
2 Bk I 0.5 0.90 17.3 70.6 0.46 13.9 2 Bk I 0.6 0.83 18.4 71.8 0.47 15.8 Tail 1.2 1.18 16.5 71.9 0.48 14.0 Tail 1.1 1.28 18.3 72.9 0.48 15.9 5 Bk 1.3 1.42 20.7 73.2 0.49 14.1 5 Bk 1.3 1.39 23.4 74.2 0.49 16.0
Clear Flour: Clear Flour: 5 M 2.4 1.22 14.9 75.6 0.52 14.1 5 M 1.3 1.71 16.5 75.5 0.52 16.0 LQ 0.2 1.62 15.0 75.7 0.52 14.1 LG 1.0 1.81 18.2 76.5 0.53 16.0 LG 1.1 1.94 18.7 76.8 0.54 14.2 LQ 0.1 1.88 16.2 76.6 0.54 16.0
Bran & Shorts: Bran & Shorts: TC Sh 0.4 2.30 14.1 77.2 0.55 14.2 TC Sh 0.2 2.99 14.4 76.8 0.54 16.0 Tail Sh 2.1 3.12 14.7 79.4 0.62 14.2 Tail Sh 2.1 3.31 14.9 78.9 0.62 16.0
Head Sh 15.4 4.62 17.4 94.8 1.27 14.7 Head Sh 16.3 4.86 17.7 95.2 1.34 16.3 Bran 5.2 6.34 14.3 100.0 1.53 14.7 Bran 4.8 6.47 14.5 100.0 1.59 16.2
Patent (Rebolted) 0.49 14.0 Patent (Rebolted) Wheat
0.50 15.9 Wheat 1.54 14.3 1.60 15.8
SY Valda (K-4) LCS Prime (K-5)
Stream
(%, 14% mb) Cumulative (%, 14% mb)
Stream
(%, 14% mb) Cumulative (%, 14% mb)
Mill Stream Yield Ash Protein Yield Ash Protein
Mill Stream Yield Ash Protein Yield Ash Protein
Patent: Patent: 1 M 9.1 0.29 11.8 9.1 0.29 11.8 1 M 9.7 0.32 11.4 9.7 0.32 11.4 2 M 15.9 0.29 12.0 25.0 0.29 11.9 2 M 11.9 0.35 11.5 21.5 0.33 11.5 Sz I 4.1 0.30 12.7 29.1 0.29 12.0 3 M 18.5 0.36 11.5 40.0 0.35 11.5 Sz II 3.2 0.36 12.2 32.3 0.30 12.0 Sz I 3.6 0.37 11.8 43.7 0.35 11.5 3 M 13.3 0.41 12.4 45.5 0.33 12.1 Sz II 3.2 0.40 11.6 46.9 0.35 11.5 1 Bk 1.8 0.46 15.9 47.4 0.34 12.3 4 M 9.3 0.50 12.5 56.2 0.38 11.7
Bk Dust 3.6 0.49 14.8 50.9 0.35 12.5 6 M 3.4 0.62 11.9 59.6 0.39 11.7 3 Bk 2.4 0.52 17.3 53.4 0.35 12.7 1 Bk 1.1 0.66 14.1 60.7 0.40 11.7
2 Bk II 1.8 0.55 16.8 55.2 0.36 12.8 Bk Dust 2.3 0.67 13.9 63.1 0.41 11.8 4 M 7.2 0.58 14.2 62.4 0.39 13.0 4 Bk 4.7 0.72 15.3 67.8 0.43 12.1 4 Bk 4.9 0.60 17.8 67.3 0.40 13.3 3 Bk 1.5 0.76 15.4 69.3 0.44 12.1
2 Bk I 1.0 0.60 17.0 68.3 0.40 13.4 2 Bk II 1.0 0.82 15.0 70.3 0.44 12.2 TC 1.5 0.65 15.7 69.8 0.41 13.4 TC 1.1 0.84 14.9 71.4 0.45 12.2 6 M 2.5 0.85 13.3 72.4 0.42 13.4 2 Bk I 0.5 0.87 15.1 71.9 0.45 12.2 5 Bk 1.3 1.27 21.5 73.7 0.44 13.6 Tail 1.3 1.09 15.2 73.2 0.46 12.3 Tail 1.0 1.33 17.5 74.7 0.45 13.6 5 Bk 1.2 1.37 18.1 74.4 0.48 12.4
Clear Flour: Clear Flour: 5 M 1.5 1.26 15.2 76.2 0.47 13.7 5 M 2.1 1.05 13.9 76.6 0.49 12.4 LG 0.8 1.94 19.5 77.1 0.48 13.7 LQ 0.1 1.53 13.8 76.7 0.49 12.4 LQ 0.1 2.04 15.2 77.1 0.49 13.7 LG 1.1 1.72 16.9 77.8 0.51 12.5
Bran & Shorts: Bran & Shorts: TC Sh 0.3 2.33 13.5 77.4 0.49 13.7 TC Sh 0.3 2.65 13.7 78.1 0.52 12.5 Tail Sh 1.8 3.12 14.8 79.3 0.55 13.7 Tail Sh 2.0 2.98 13.9 80.1 0.58 12.5
Head Sh 15.1 4.56 18.3 94.3 1.19 14.5 Head Sh 14.9 4.13 16.6 95.0 1.14 13.2 Bran 5.7 6.03 15.2 100.0 1.47 14.5 Bran 5.0 6.05 14.6 100.0 1.38 13.2
Patent (Rebolted) 0.46 13.6 Patent (Rebolted) Wheat
0.47 12.4 Wheat 1.49 14.1 1.44 12.9
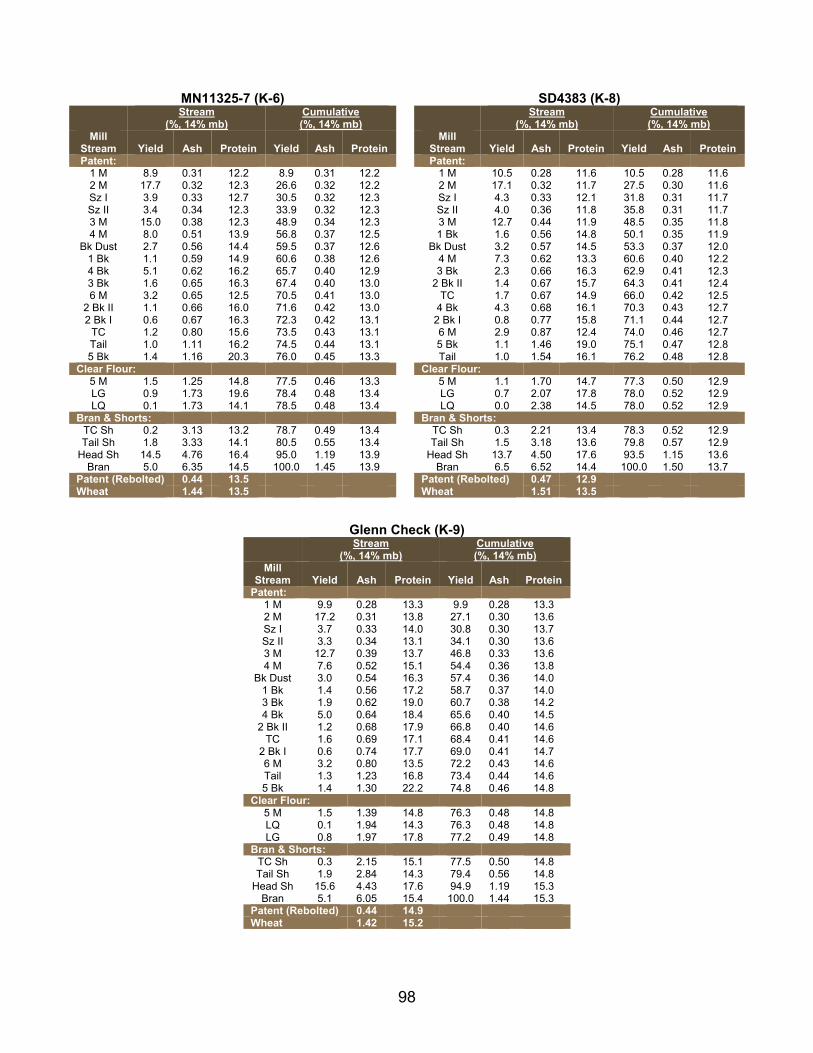
98
MN11325-7 (K-6) SD4383 (K-8)
Stream
(%, 14% mb) Cumulative (%, 14% mb)
Stream
(%, 14% mb) Cumulative (%, 14% mb)
Mill Stream Yield Ash Protein Yield Ash Protein
Mill Stream Yield Ash Protein Yield Ash Protein
Patent: Patent: 1 M 8.9 0.31 12.2 8.9 0.31 12.2 1 M 10.5 0.28 11.6 10.5 0.28 11.6 2 M 17.7 0.32 12.3 26.6 0.32 12.2 2 M 17.1 0.32 11.7 27.5 0.30 11.6 Sz I 3.9 0.33 12.7 30.5 0.32 12.3 Sz I 4.3 0.33 12.1 31.8 0.31 11.7 Sz II 3.4 0.34 12.3 33.9 0.32 12.3 Sz II 4.0 0.36 11.8 35.8 0.31 11.7 3 M 15.0 0.38 12.3 48.9 0.34 12.3 3 M 12.7 0.44 11.9 48.5 0.35 11.8 4 M 8.0 0.51 13.9 56.8 0.37 12.5 1 Bk 1.6 0.56 14.8 50.1 0.35 11.9
Bk Dust 2.7 0.56 14.4 59.5 0.37 12.6 Bk Dust 3.2 0.57 14.5 53.3 0.37 12.0 1 Bk 1.1 0.59 14.9 60.6 0.38 12.6 4 M 7.3 0.62 13.3 60.6 0.40 12.2 4 Bk 5.1 0.62 16.2 65.7 0.40 12.9 3 Bk 2.3 0.66 16.3 62.9 0.41 12.3 3 Bk 1.6 0.65 16.3 67.4 0.40 13.0 2 Bk II 1.4 0.67 15.7 64.3 0.41 12.4 6 M 3.2 0.65 12.5 70.5 0.41 13.0 TC 1.7 0.67 14.9 66.0 0.42 12.5
2 Bk II 1.1 0.66 16.0 71.6 0.42 13.0 4 Bk 4.3 0.68 16.1 70.3 0.43 12.7 2 Bk I 0.6 0.67 16.3 72.3 0.42 13.1 2 Bk I 0.8 0.77 15.8 71.1 0.44 12.7
TC 1.2 0.80 15.6 73.5 0.43 13.1 6 M 2.9 0.87 12.4 74.0 0.46 12.7 Tail 1.0 1.11 16.2 74.5 0.44 13.1 5 Bk 1.1 1.46 19.0 75.1 0.47 12.8 5 Bk 1.4 1.16 20.3 76.0 0.45 13.3 Tail 1.0 1.54 16.1 76.2 0.48 12.8
Clear Flour: Clear Flour: 5 M 1.5 1.25 14.8 77.5 0.46 13.3 5 M 1.1 1.70 14.7 77.3 0.50 12.9 LG 0.9 1.73 19.6 78.4 0.48 13.4 LG 0.7 2.07 17.8 78.0 0.52 12.9 LQ 0.1 1.73 14.1 78.5 0.48 13.4 LQ 0.0 2.38 14.5 78.0 0.52 12.9
Bran & Shorts: Bran & Shorts: TC Sh 0.2 3.13 13.2 78.7 0.49 13.4 TC Sh 0.3 2.21 13.4 78.3 0.52 12.9 Tail Sh 1.8 3.33 14.1 80.5 0.55 13.4 Tail Sh 1.5 3.18 13.6 79.8 0.57 12.9
Head Sh 14.5 4.76 16.4 95.0 1.19 13.9 Head Sh 13.7 4.50 17.6 93.5 1.15 13.6 Bran 5.0 6.35 14.5 100.0 1.45 13.9 Bran 6.5 6.52 14.4 100.0 1.50 13.7
Patent (Rebolted) 0.44 13.5 Patent (Rebolted) Wheat
0.47 12.9 Wheat 1.44 13.5 1.51 13.5
Glenn Check (K-9)
Stream
(%, 14% mb) Cumulative (%, 14% mb)
Mill Stream Yield Ash Protein Yield Ash Protein
Patent: 1 M 9.9 0.28 13.3 9.9 0.28 13.3 2 M 17.2 0.31 13.8 27.1 0.30 13.6 Sz I 3.7 0.33 14.0 30.8 0.30 13.7 Sz II 3.3 0.34 13.1 34.1 0.30 13.6 3 M 12.7 0.39 13.7 46.8 0.33 13.6 4 M 7.6 0.52 15.1 54.4 0.36 13.8
Bk Dust 3.0 0.54 16.3 57.4 0.36 14.0 1 Bk 1.4 0.56 17.2 58.7 0.37 14.0 3 Bk 1.9 0.62 19.0 60.7 0.38 14.2 4 Bk 5.0 0.64 18.4 65.6 0.40 14.5
2 Bk II 1.2 0.68 17.9 66.8 0.40 14.6 TC 1.6 0.69 17.1 68.4 0.41 14.6
2 Bk I 0.6 0.74 17.7 69.0 0.41 14.7 6 M 3.2 0.80 13.5 72.2 0.43 14.6 Tail 1.3 1.23 16.8 73.4 0.44 14.6 5 Bk 1.4 1.30 22.2 74.8 0.46 14.8
Clear Flour: 5 M 1.5 1.39 14.8 76.3 0.48 14.8 LQ 0.1 1.94 14.3 76.3 0.48 14.8 LG 0.8 1.97 17.8 77.2 0.49 14.8
Bran & Shorts: TC Sh 0.3 2.15 15.1 77.5 0.50 14.8 Tail Sh 1.9 2.84 14.3 79.4 0.56 14.8
Head Sh 15.6 4.43 17.6 94.9 1.19 15.3 Bran 5.1 6.05 15.4 100.0 1.44 15.3
Patent (Rebolted) 0.44 14.9 Wheat 1.42 15.2
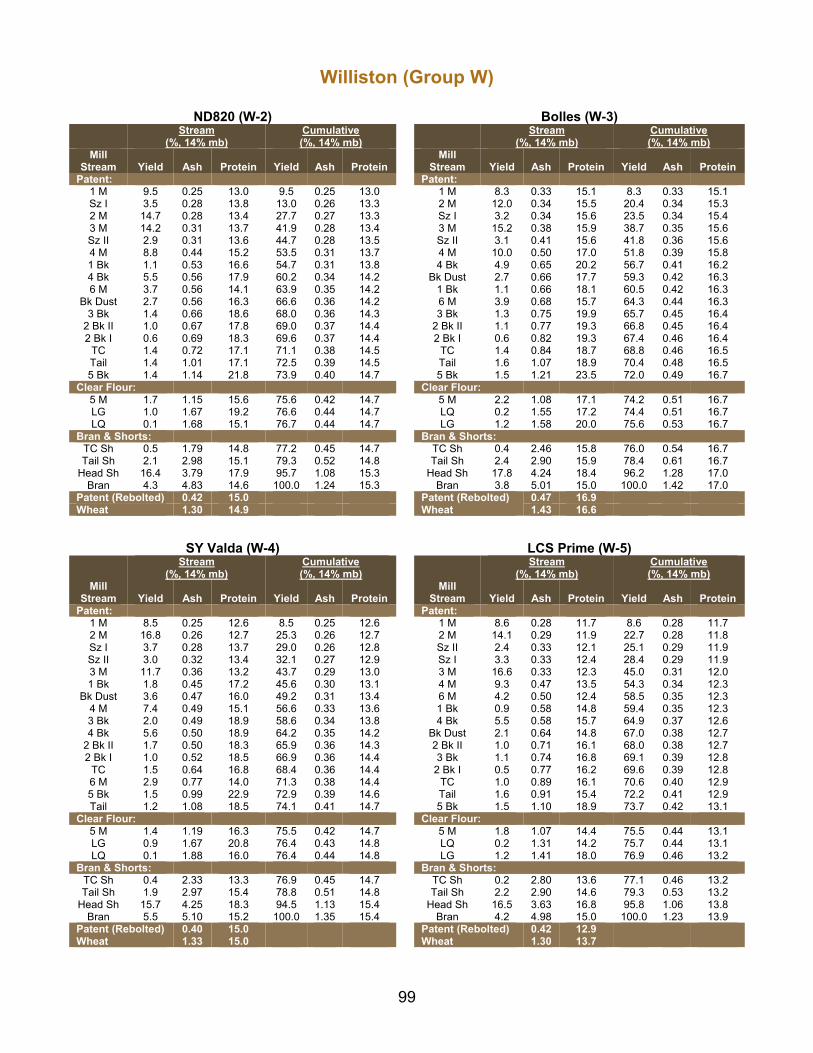
99
Williston (Group W)
ND820 (W-2) Bolles (W-3)
Stream
(%, 14% mb) Cumulative (%, 14% mb)
Stream
(%, 14% mb) Cumulative (%, 14% mb)
Mill Stream Yield Ash Protein Yield Ash Protein
Mill Stream Yield Ash Protein Yield Ash Protein
Patent: Patent: 1 M 9.5 0.25 13.0 9.5 0.25 13.0 1 M 8.3 0.33 15.1 8.3 0.33 15.1 Sz I 3.5 0.28 13.8 13.0 0.26 13.3 2 M 12.0 0.34 15.5 20.4 0.34 15.3 2 M 14.7 0.28 13.4 27.7 0.27 13.3 Sz I 3.2 0.34 15.6 23.5 0.34 15.4 3 M 14.2 0.31 13.7 41.9 0.28 13.4 3 M 15.2 0.38 15.9 38.7 0.35 15.6 Sz II 2.9 0.31 13.6 44.7 0.28 13.5 Sz II 3.1 0.41 15.6 41.8 0.36 15.6 4 M 8.8 0.44 15.2 53.5 0.31 13.7 4 M 10.0 0.50 17.0 51.8 0.39 15.8 1 Bk 1.1 0.53 16.6 54.7 0.31 13.8 4 Bk 4.9 0.65 20.2 56.7 0.41 16.2 4 Bk 5.5 0.56 17.9 60.2 0.34 14.2 Bk Dust 2.7 0.66 17.7 59.3 0.42 16.3 6 M 3.7 0.56 14.1 63.9 0.35 14.2 1 Bk 1.1 0.66 18.1 60.5 0.42 16.3
Bk Dust 2.7 0.56 16.3 66.6 0.36 14.2 6 M 3.9 0.68 15.7 64.3 0.44 16.3 3 Bk 1.4 0.66 18.6 68.0 0.36 14.3 3 Bk 1.3 0.75 19.9 65.7 0.45 16.4
2 Bk II 1.0 0.67 17.8 69.0 0.37 14.4 2 Bk II 1.1 0.77 19.3 66.8 0.45 16.4 2 Bk I 0.6 0.69 18.3 69.6 0.37 14.4 2 Bk I 0.6 0.82 19.3 67.4 0.46 16.4
TC 1.4 0.72 17.1 71.1 0.38 14.5 TC 1.4 0.84 18.7 68.8 0.46 16.5 Tail 1.4 1.01 17.1 72.5 0.39 14.5 Tail 1.6 1.07 18.9 70.4 0.48 16.5 5 Bk 1.4 1.14 21.8 73.9 0.40 14.7 5 Bk 1.5 1.21 23.5 72.0 0.49 16.7
Clear Flour: Clear Flour: 5 M 1.7 1.15 15.6 75.6 0.42 14.7 5 M 2.2 1.08 17.1 74.2 0.51 16.7 LG 1.0 1.67 19.2 76.6 0.44 14.7 LQ 0.2 1.55 17.2 74.4 0.51 16.7 LQ 0.1 1.68 15.1 76.7 0.44 14.7 LG 1.2 1.58 20.0 75.6 0.53 16.7
Bran & Shorts: Bran & Shorts: TC Sh 0.5 1.79 14.8 77.2 0.45 14.7 TC Sh 0.4 2.46 15.8 76.0 0.54 16.7 Tail Sh 2.1 2.98 15.1 79.3 0.52 14.8 Tail Sh 2.4 2.90 15.9 78.4 0.61 16.7
Head Sh 16.4 3.79 17.9 95.7 1.08 15.3 Head Sh 17.8 4.24 18.4 96.2 1.28 17.0 Bran 4.3 4.83 14.6 100.0 1.24 15.3 Bran 3.8 5.01 15.0 100.0 1.42 17.0
Patent (Rebolted) 0.42 15.0 Patent (Rebolted) Wheat
0.47 16.9 Wheat 1.30 14.9 1.43 16.6
SY Valda (W-4) LCS Prime (W-5)
Stream
(%, 14% mb) Cumulative (%, 14% mb)
Stream
(%, 14% mb) Cumulative (%, 14% mb)
Mill Stream Yield Ash Protein Yield Ash Protein
Mill Stream Yield Ash Protein Yield Ash Protein
Patent: Patent: 1 M 8.5 0.25 12.6 8.5 0.25 12.6 1 M 8.6 0.28 11.7 8.6 0.28 11.7 2 M 16.8 0.26 12.7 25.3 0.26 12.7 2 M 14.1 0.29 11.9 22.7 0.28 11.8 Sz I 3.7 0.28 13.7 29.0 0.26 12.8 Sz II 2.4 0.33 12.1 25.1 0.29 11.9 Sz II 3.0 0.32 13.4 32.1 0.27 12.9 Sz I 3.3 0.33 12.4 28.4 0.29 11.9 3 M 11.7 0.36 13.2 43.7 0.29 13.0 3 M 16.6 0.33 12.3 45.0 0.31 12.0 1 Bk 1.8 0.45 17.2 45.6 0.30 13.1 4 M 9.3 0.47 13.5 54.3 0.34 12.3
Bk Dust 3.6 0.47 16.0 49.2 0.31 13.4 6 M 4.2 0.50 12.4 58.5 0.35 12.3 4 M 7.4 0.49 15.1 56.6 0.33 13.6 1 Bk 0.9 0.58 14.8 59.4 0.35 12.3 3 Bk 2.0 0.49 18.9 58.6 0.34 13.8 4 Bk 5.5 0.58 15.7 64.9 0.37 12.6 4 Bk 5.6 0.50 18.9 64.2 0.35 14.2 Bk Dust 2.1 0.64 14.8 67.0 0.38 12.7
2 Bk II 1.7 0.50 18.3 65.9 0.36 14.3 2 Bk II 1.0 0.71 16.1 68.0 0.38 12.7 2 Bk I 1.0 0.52 18.5 66.9 0.36 14.4 3 Bk 1.1 0.74 16.8 69.1 0.39 12.8
TC 1.5 0.64 16.8 68.4 0.36 14.4 2 Bk I 0.5 0.77 16.2 69.6 0.39 12.8 6 M 2.9 0.77 14.0 71.3 0.38 14.4 TC 1.0 0.89 16.1 70.6 0.40 12.9 5 Bk 1.5 0.99 22.9 72.9 0.39 14.6 Tail 1.6 0.91 15.4 72.2 0.41 12.9 Tail 1.2 1.08 18.5 74.1 0.41 14.7 5 Bk 1.5 1.10 18.9 73.7 0.42 13.1
Clear Flour: Clear Flour: 5 M 1.4 1.19 16.3 75.5 0.42 14.7 5 M 1.8 1.07 14.4 75.5 0.44 13.1 LG 0.9 1.67 20.8 76.4 0.43 14.8 LQ 0.2 1.31 14.2 75.7 0.44 13.1 LQ 0.1 1.88 16.0 76.4 0.44 14.8 LG 1.2 1.41 18.0 76.9 0.46 13.2
Bran & Shorts: Bran & Shorts: TC Sh 0.4 2.33 13.3 76.9 0.45 14.7 TC Sh 0.2 2.80 13.6 77.1 0.46 13.2 Tail Sh 1.9 2.97 15.4 78.8 0.51 14.8 Tail Sh 2.2 2.90 14.6 79.3 0.53 13.2
Head Sh 15.7 4.25 18.3 94.5 1.13 15.4 Head Sh 16.5 3.63 16.8 95.8 1.06 13.8 Bran 5.5 5.10 15.2 100.0 1.35 15.4 Bran 4.2 4.98 15.0 100.0 1.23 13.9
Patent (Rebolted) 0.40 15.0 Patent (Rebolted) Wheat
0.42 12.9 Wheat 1.33 15.0 1.30 13.7
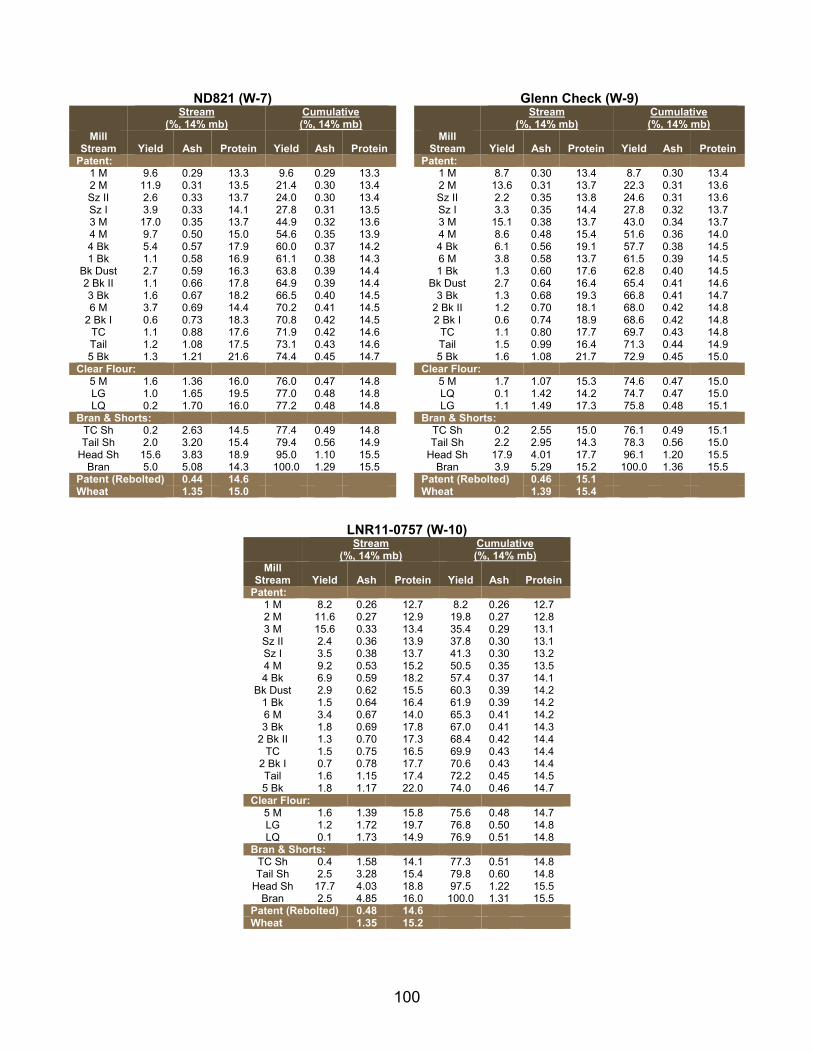
100
ND821 (W-7) Glenn Check (W-9)
Stream
(%, 14% mb) Cumulative (%, 14% mb)
Stream
(%, 14% mb) Cumulative (%, 14% mb)
Mill Stream Yield Ash Protein Yield Ash Protein
Mill Stream Yield Ash Protein Yield Ash Protein
Patent: Patent: 1 M 9.6 0.29 13.3 9.6 0.29 13.3 1 M 8.7 0.30 13.4 8.7 0.30 13.4 2 M 11.9 0.31 13.5 21.4 0.30 13.4 2 M 13.6 0.31 13.7 22.3 0.31 13.6 Sz II 2.6 0.33 13.7 24.0 0.30 13.4 Sz II 2.2 0.35 13.8 24.6 0.31 13.6 Sz I 3.9 0.33 14.1 27.8 0.31 13.5 Sz I 3.3 0.35 14.4 27.8 0.32 13.7 3 M 17.0 0.35 13.7 44.9 0.32 13.6 3 M 15.1 0.38 13.7 43.0 0.34 13.7 4 M 9.7 0.50 15.0 54.6 0.35 13.9 4 M 8.6 0.48 15.4 51.6 0.36 14.0 4 Bk 5.4 0.57 17.9 60.0 0.37 14.2 4 Bk 6.1 0.56 19.1 57.7 0.38 14.5 1 Bk 1.1 0.58 16.9 61.1 0.38 14.3 6 M 3.8 0.58 13.7 61.5 0.39 14.5
Bk Dust 2.7 0.59 16.3 63.8 0.39 14.4 1 Bk 1.3 0.60 17.6 62.8 0.40 14.5 2 Bk II 1.1 0.66 17.8 64.9 0.39 14.4 Bk Dust 2.7 0.64 16.4 65.4 0.41 14.6 3 Bk 1.6 0.67 18.2 66.5 0.40 14.5 3 Bk 1.3 0.68 19.3 66.8 0.41 14.7 6 M 3.7 0.69 14.4 70.2 0.41 14.5 2 Bk II 1.2 0.70 18.1 68.0 0.42 14.8
2 Bk I 0.6 0.73 18.3 70.8 0.42 14.5 2 Bk I 0.6 0.74 18.9 68.6 0.42 14.8 TC 1.1 0.88 17.6 71.9 0.42 14.6 TC 1.1 0.80 17.7 69.7 0.43 14.8 Tail 1.2 1.08 17.5 73.1 0.43 14.6 Tail 1.5 0.99 16.4 71.3 0.44 14.9 5 Bk 1.3 1.21 21.6 74.4 0.45 14.7 5 Bk 1.6 1.08 21.7 72.9 0.45 15.0
Clear Flour: Clear Flour: 5 M 1.6 1.36 16.0 76.0 0.47 14.8 5 M 1.7 1.07 15.3 74.6 0.47 15.0 LG 1.0 1.65 19.5 77.0 0.48 14.8 LQ 0.1 1.42 14.2 74.7 0.47 15.0 LQ 0.2 1.70 16.0 77.2 0.48 14.8 LG 1.1 1.49 17.3 75.8 0.48 15.1
Bran & Shorts: Bran & Shorts: TC Sh 0.2 2.63 14.5 77.4 0.49 14.8 TC Sh 0.2 2.55 15.0 76.1 0.49 15.1 Tail Sh 2.0 3.20 15.4 79.4 0.56 14.9 Tail Sh 2.2 2.95 14.3 78.3 0.56 15.0
Head Sh 15.6 3.83 18.9 95.0 1.10 15.5 Head Sh 17.9 4.01 17.7 96.1 1.20 15.5 Bran 5.0 5.08 14.3 100.0 1.29 15.5 Bran 3.9 5.29 15.2 100.0 1.36 15.5
Patent (Rebolted) 0.44 14.6 Patent (Rebolted) Wheat
0.46 15.1 Wheat 1.35 15.0 1.39 15.4
LNR11-0757 (W-10)
Stream
(%, 14% mb) Cumulative (%, 14% mb)
Mill Stream Yield Ash Protein Yield Ash Protein
Patent: 1 M 8.2 0.26 12.7 8.2 0.26 12.7 2 M 11.6 0.27 12.9 19.8 0.27 12.8 3 M 15.6 0.33 13.4 35.4 0.29 13.1 Sz II 2.4 0.36 13.9 37.8 0.30 13.1 Sz I 3.5 0.38 13.7 41.3 0.30 13.2 4 M 9.2 0.53 15.2 50.5 0.35 13.5 4 Bk 6.9 0.59 18.2 57.4 0.37 14.1
Bk Dust 2.9 0.62 15.5 60.3 0.39 14.2 1 Bk 1.5 0.64 16.4 61.9 0.39 14.2 6 M 3.4 0.67 14.0 65.3 0.41 14.2 3 Bk 1.8 0.69 17.8 67.0 0.41 14.3
2 Bk II 1.3 0.70 17.3 68.4 0.42 14.4 TC 1.5 0.75 16.5 69.9 0.43 14.4
2 Bk I 0.7 0.78 17.7 70.6 0.43 14.4 Tail 1.6 1.15 17.4 72.2 0.45 14.5 5 Bk 1.8 1.17 22.0 74.0 0.46 14.7
Clear Flour: 5 M 1.6 1.39 15.8 75.6 0.48 14.7 LG 1.2 1.72 19.7 76.8 0.50 14.8 LQ 0.1 1.73 14.9 76.9 0.51 14.8
Bran & Shorts: TC Sh 0.4 1.58 14.1 77.3 0.51 14.8 Tail Sh 2.5 3.28 15.4 79.8 0.60 14.8
Head Sh 17.7 4.03 18.8 97.5 1.22 15.5 Bran 2.5 4.85 16.0 100.0 1.31 15.5
Patent (Rebolted) 0.48 14.6 Wheat 1.35 15.2
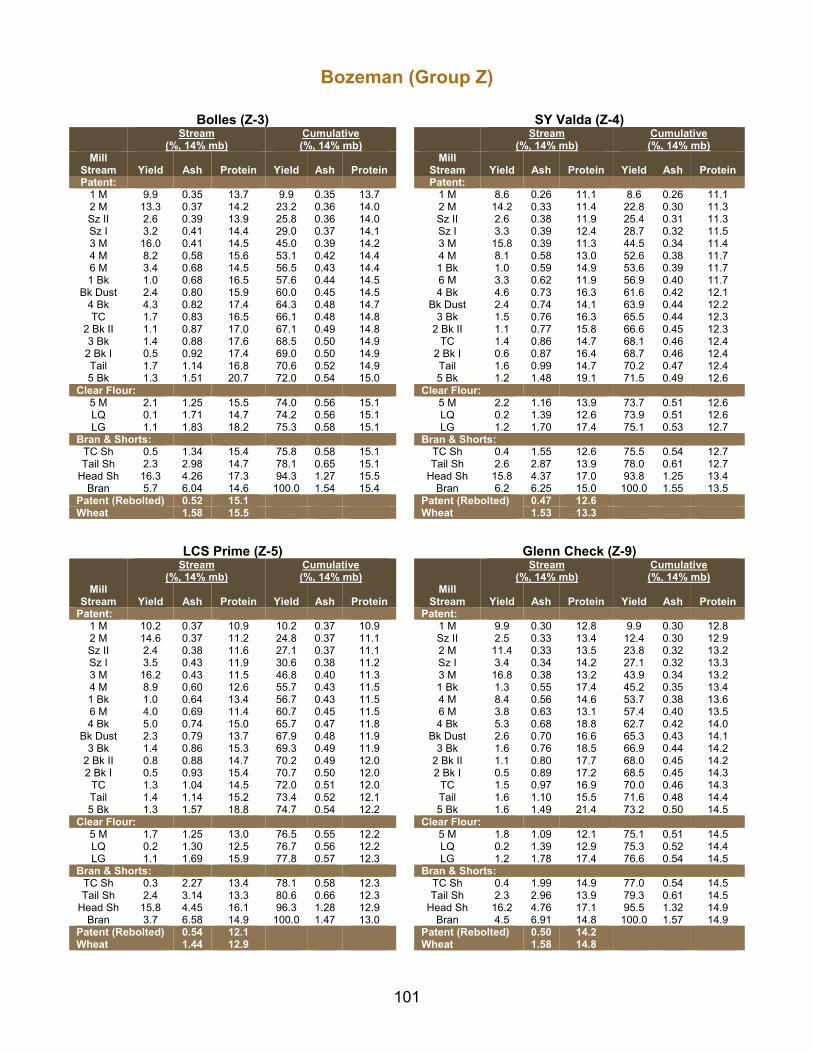
101
Bozeman (Group Z)
Bolles (Z-3) SY Valda (Z-4)
Stream
(%, 14% mb) Cumulative (%, 14% mb)
Stream
(%, 14% mb) Cumulative (%, 14% mb)
Mill Stream Yield Ash Protein Yield Ash Protein
Mill Stream Yield Ash Protein Yield Ash Protein
Patent: Patent: 1 M 9.9 0.35 13.7 9.9 0.35 13.7 1 M 8.6 0.26 11.1 8.6 0.26 11.1 2 M 13.3 0.37 14.2 23.2 0.36 14.0 2 M 14.2 0.33 11.4 22.8 0.30 11.3 Sz II 2.6 0.39 13.9 25.8 0.36 14.0 Sz II 2.6 0.38 11.9 25.4 0.31 11.3 Sz I 3.2 0.41 14.4 29.0 0.37 14.1 Sz I 3.3 0.39 12.4 28.7 0.32 11.5 3 M 16.0 0.41 14.5 45.0 0.39 14.2 3 M 15.8 0.39 11.3 44.5 0.34 11.4 4 M 8.2 0.58 15.6 53.1 0.42 14.4 4 M 8.1 0.58 13.0 52.6 0.38 11.7 6 M 3.4 0.68 14.5 56.5 0.43 14.4 1 Bk 1.0 0.59 14.9 53.6 0.39 11.7 1 Bk 1.0 0.68 16.5 57.6 0.44 14.5 6 M 3.3 0.62 11.9 56.9 0.40 11.7
Bk Dust 2.4 0.80 15.9 60.0 0.45 14.5 4 Bk 4.6 0.73 16.3 61.6 0.42 12.1 4 Bk 4.3 0.82 17.4 64.3 0.48 14.7 Bk Dust 2.4 0.74 14.1 63.9 0.44 12.2 TC 1.7 0.83 16.5 66.1 0.48 14.8 3 Bk 1.5 0.76 16.3 65.5 0.44 12.3
2 Bk II 1.1 0.87 17.0 67.1 0.49 14.8 2 Bk II 1.1 0.77 15.8 66.6 0.45 12.3 3 Bk 1.4 0.88 17.6 68.5 0.50 14.9 TC 1.4 0.86 14.7 68.1 0.46 12.4
2 Bk I 0.5 0.92 17.4 69.0 0.50 14.9 2 Bk I 0.6 0.87 16.4 68.7 0.46 12.4 Tail 1.7 1.14 16.8 70.6 0.52 14.9 Tail 1.6 0.99 14.7 70.2 0.47 12.4 5 Bk 1.3 1.51 20.7 72.0 0.54 15.0 5 Bk 1.2 1.48 19.1 71.5 0.49 12.6
Clear Flour: Clear Flour: 5 M 2.1 1.25 15.5 74.0 0.56 15.1 5 M 2.2 1.16 13.9 73.7 0.51 12.6 LQ 0.1 1.71 14.7 74.2 0.56 15.1 LQ 0.2 1.39 12.6 73.9 0.51 12.6 LG 1.1 1.83 18.2 75.3 0.58 15.1 LG 1.2 1.70 17.4 75.1 0.53 12.7
Bran & Shorts: Bran & Shorts: TC Sh 0.5 1.34 15.4 75.8 0.58 15.1 TC Sh 0.4 1.55 12.6 75.5 0.54 12.7 Tail Sh 2.3 2.98 14.7 78.1 0.65 15.1 Tail Sh 2.6 2.87 13.9 78.0 0.61 12.7
Head Sh 16.3 4.26 17.3 94.3 1.27 15.5 Head Sh 15.8 4.37 17.0 93.8 1.25 13.4 Bran 5.7 6.04 14.6 100.0 1.54 15.4 Bran 6.2 6.25 15.0 100.0 1.55 13.5
Patent (Rebolted) 0.52 15.1 Patent (Rebolted) Wheat
0.47 12.6 Wheat 1.58 15.5 1.53 13.3
LCS Prime (Z-5) Glenn Check (Z-9)
Stream
(%, 14% mb) Cumulative (%, 14% mb)
Stream
(%, 14% mb) Cumulative (%, 14% mb)
Mill Stream Yield Ash Protein Yield Ash Protein
Mill Stream Yield Ash Protein Yield Ash Protein
Patent: Patent: 1 M 10.2 0.37 10.9 10.2 0.37 10.9 1 M 9.9 0.30 12.8 9.9 0.30 12.8 2 M 14.6 0.37 11.2 24.8 0.37 11.1 Sz II 2.5 0.33 13.4 12.4 0.30 12.9 Sz II 2.4 0.38 11.6 27.1 0.37 11.1 2 M 11.4 0.33 13.5 23.8 0.32 13.2 Sz I 3.5 0.43 11.9 30.6 0.38 11.2 Sz I 3.4 0.34 14.2 27.1 0.32 13.3 3 M 16.2 0.43 11.5 46.8 0.40 11.3 3 M 16.8 0.38 13.2 43.9 0.34 13.2 4 M 8.9 0.60 12.6 55.7 0.43 11.5 1 Bk 1.3 0.55 17.4 45.2 0.35 13.4 1 Bk 1.0 0.64 13.4 56.7 0.43 11.5 4 M 8.4 0.56 14.6 53.7 0.38 13.6 6 M 4.0 0.69 11.4 60.7 0.45 11.5 6 M 3.8 0.63 13.1 57.4 0.40 13.5 4 Bk 5.0 0.74 15.0 65.7 0.47 11.8 4 Bk 5.3 0.68 18.8 62.7 0.42 14.0
Bk Dust 2.3 0.79 13.7 67.9 0.48 11.9 Bk Dust 2.6 0.70 16.6 65.3 0.43 14.1 3 Bk 1.4 0.86 15.3 69.3 0.49 11.9 3 Bk 1.6 0.76 18.5 66.9 0.44 14.2
2 Bk II 0.8 0.88 14.7 70.2 0.49 12.0 2 Bk II 1.1 0.80 17.7 68.0 0.45 14.2 2 Bk I 0.5 0.93 15.4 70.7 0.50 12.0 2 Bk I 0.5 0.89 17.2 68.5 0.45 14.3
TC 1.3 1.04 14.5 72.0 0.51 12.0 TC 1.5 0.97 16.9 70.0 0.46 14.3 Tail 1.4 1.14 15.2 73.4 0.52 12.1 Tail 1.6 1.10 15.5 71.6 0.48 14.4 5 Bk 1.3 1.57 18.8 74.7 0.54 12.2 5 Bk 1.6 1.49 21.4 73.2 0.50 14.5
Clear Flour: Clear Flour: 5 M 1.7 1.25 13.0 76.5 0.55 12.2 5 M 1.8 1.09 12.1 75.1 0.51 14.5 LQ 0.2 1.30 12.5 76.7 0.56 12.2 LQ 0.2 1.39 12.9 75.3 0.52 14.4 LG 1.1 1.69 15.9 77.8 0.57 12.3 LG 1.2 1.78 17.4 76.6 0.54 14.5
Bran & Shorts: Bran & Shorts: TC Sh 0.3 2.27 13.4 78.1 0.58 12.3 TC Sh 0.4 1.99 14.9 77.0 0.54 14.5 Tail Sh 2.4 3.14 13.3 80.6 0.66 12.3 Tail Sh 2.3 2.96 13.9 79.3 0.61 14.5
Head Sh 15.8 4.45 16.1 96.3 1.28 12.9 Head Sh 16.2 4.76 17.1 95.5 1.32 14.9 Bran 3.7 6.58 14.9 100.0 1.47 13.0 Bran 4.5 6.91 14.8 100.0 1.57 14.9
Patent (Rebolted) 0.54 12.1 Patent (Rebolted) Wheat
0.50 14.2 Wheat 1.44 12.9 1.58 14.8
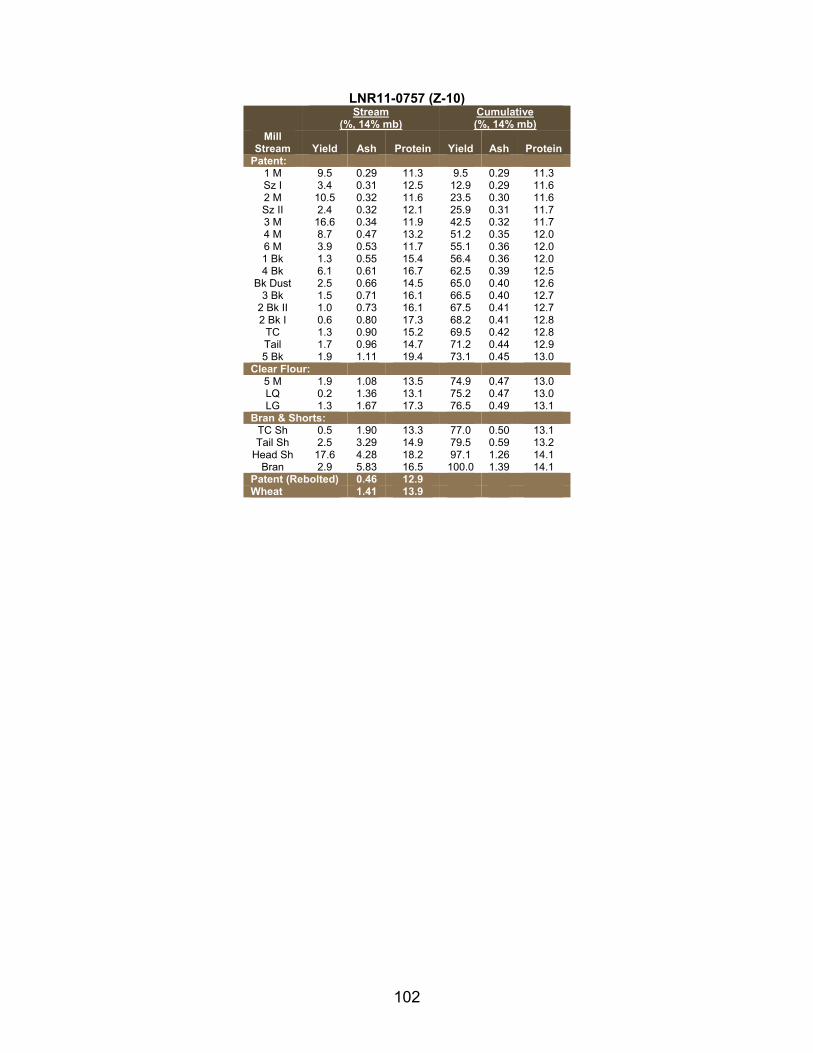
102
LNR11-0757 (Z-10)
Stream
(%, 14% mb) Cumulative (%, 14% mb)
Mill Stream Yield Ash Protein Yield Ash Protein
Patent: 1 M 9.5 0.29 11.3 9.5 0.29 11.3 Sz I 3.4 0.31 12.5 12.9 0.29 11.6 2 M 10.5 0.32 11.6 23.5 0.30 11.6 Sz II 2.4 0.32 12.1 25.9 0.31 11.7 3 M 16.6 0.34 11.9 42.5 0.32 11.7 4 M 8.7 0.47 13.2 51.2 0.35 12.0 6 M 3.9 0.53 11.7 55.1 0.36 12.0 1 Bk 1.3 0.55 15.4 56.4 0.36 12.0 4 Bk 6.1 0.61 16.7 62.5 0.39 12.5
Bk Dust 2.5 0.66 14.5 65.0 0.40 12.6 3 Bk 1.5 0.71 16.1 66.5 0.40 12.7
2 Bk II 1.0 0.73 16.1 67.5 0.41 12.7 2 Bk I 0.6 0.80 17.3 68.2 0.41 12.8
TC 1.3 0.90 15.2 69.5 0.42 12.8 Tail 1.7 0.96 14.7 71.2 0.44 12.9 5 Bk 1.9 1.11 19.4 73.1 0.45 13.0
Clear Flour: 5 M 1.9 1.08 13.5 74.9 0.47 13.0 LQ 0.2 1.36 13.1 75.2 0.47 13.0 LG 1.3 1.67 17.3 76.5 0.49 13.1
Bran & Shorts: TC Sh 0.5 1.90 13.3 77.0 0.50 13.1 Tail Sh 2.5 3.29 14.9 79.5 0.59 13.2
Head Sh 17.6 4.28 18.2 97.1 1.26 14.1 Bran 2.9 5.83 16.5 100.0 1.39 14.1
Patent (Rebolted) 0.46 12.9 Wheat 1.41 13.9
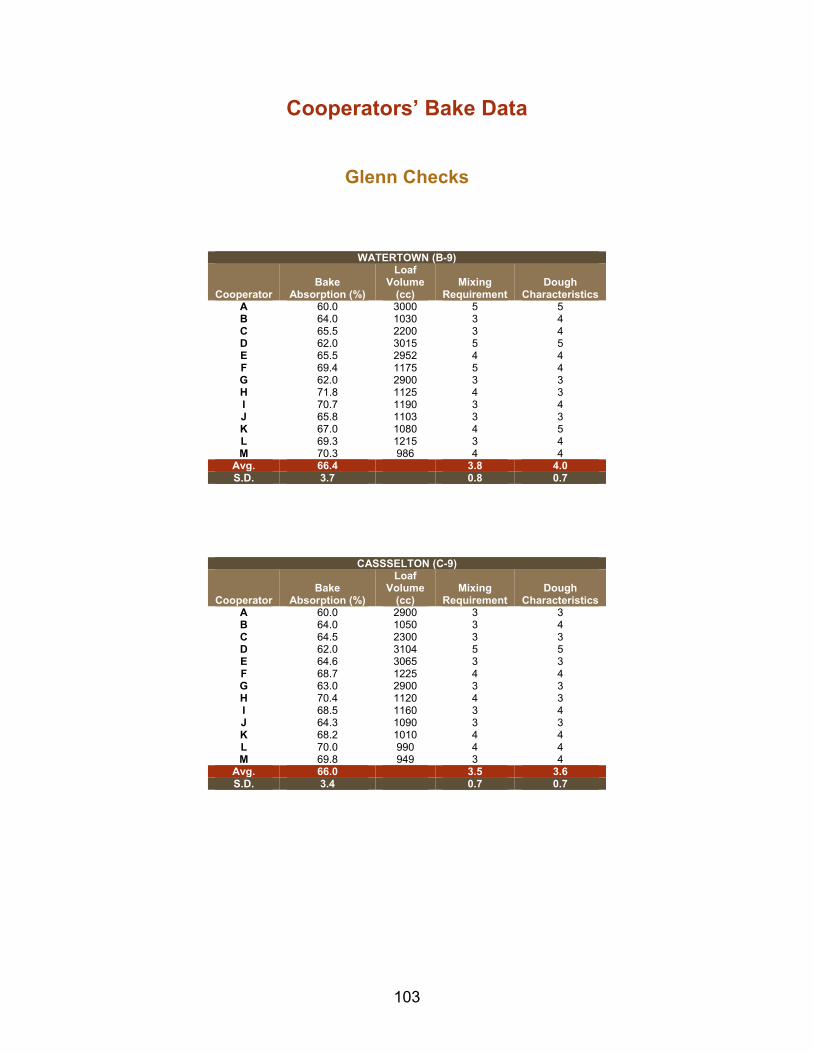
103
Cooperators’ Bake Data
Glenn Checks
WATERTOWN (B-9)
Cooperator Bake
Absorption (%)
Loaf Volume
(cc) Mixing
Requirement Dough
Characteristics A 60.0 3000 5 5 B 64.0 1030 3 4 C 65.5 2200 3 4 D 62.0 3015 5 5 E 65.5 2952 4 4 F 69.4 1175 5 4 G 62.0 2900 3 3 H 71.8 1125 4 3 I 70.7 1190 3 4 J 65.8 1103 3 3 K 67.0 1080 4 5 L 69.3 1215 3 4 M 70.3 986 4 4
Avg. 66.4 3.8 4.0 S.D. 3.7 0.8 0.7
CASSSELTON (C-9)
Cooperator Bake
Absorption (%)
Loaf Volume
(cc) Mixing
Requirement Dough
Characteristics A 60.0 2900 3 3 B 64.0 1050 3 4 C 64.5 2300 3 3 D 62.0 3104 5 5 E 64.6 3065 3 3 F 68.7 1225 4 4 G 63.0 2900 3 3 H 70.4 1120 4 3 I 68.5 1160 3 4 J 64.3 1090 3 3 K 68.2 1010 4 4 L 70.0 990 4 4 M 69.8 949 3 4
Avg. 66.0 3.5 3.6 S.D. 3.4 0.7 0.7
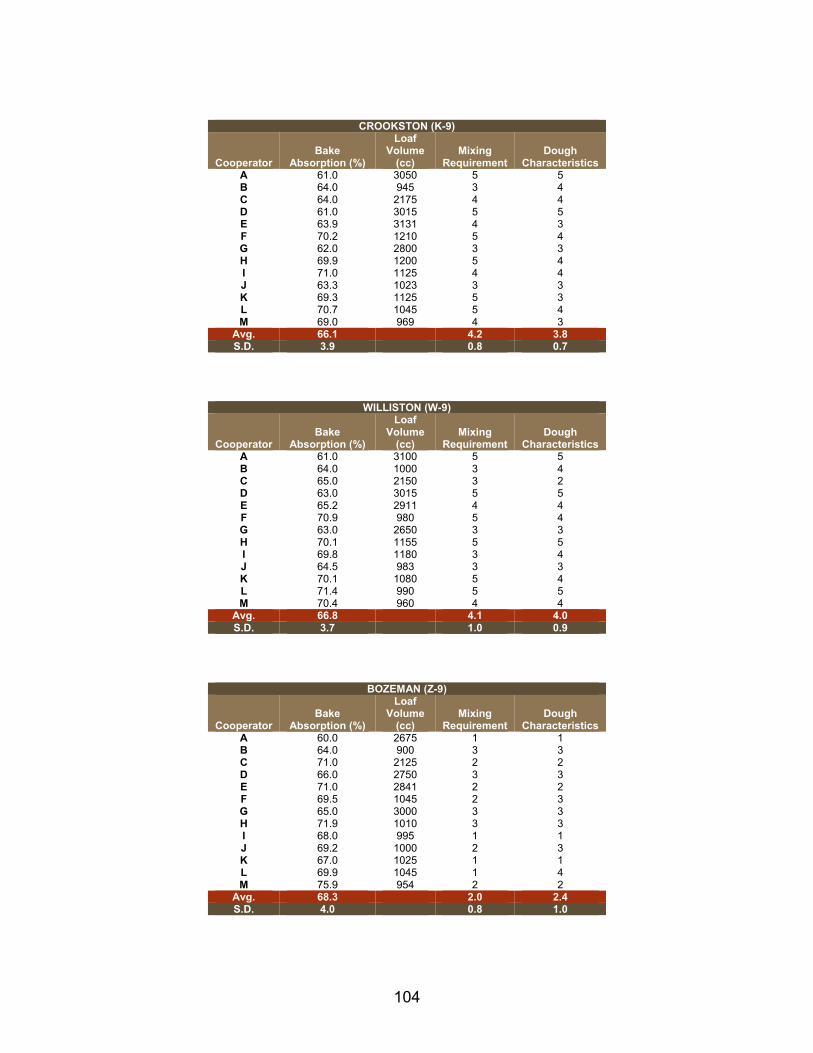
104
CROOKSTON (K-9)
Cooperator Bake
Absorption (%)
Loaf Volume
(cc) Mixing
Requirement Dough
Characteristics A 61.0 3050 5 5 B 64.0 945 3 4 C 64.0 2175 4 4 D 61.0 3015 5 5 E 63.9 3131 4 3 F 70.2 1210 5 4 G 62.0 2800 3 3 H 69.9 1200 5 4 I 71.0 1125 4 4 J 63.3 1023 3 3 K 69.3 1125 5 3 L 70.7 1045 5 4 M 69.0 969 4 3
Avg. 66.1 4.2 3.8 S.D. 3.9 0.8 0.7
WILLISTON (W-9)
Cooperator Bake
Absorption (%)
Loaf Volume
(cc) Mixing
Requirement Dough
Characteristics A 61.0 3100 5 5 B 64.0 1000 3 4 C 65.0 2150 3 2 D 63.0 3015 5 5 E 65.2 2911 4 4 F 70.9 980 5 4 G 63.0 2650 3 3 H 70.1 1155 5 5 I 69.8 1180 3 4 J 64.5 983 3 3 K 70.1 1080 5 4 L 71.4 990 5 5 M 70.4 960 4 4
Avg. 66.8 4.1 4.0 S.D. 3.7 1.0 0.9
BOZEMAN (Z-9)
Cooperator Bake
Absorption (%)
Loaf Volume
(cc) Mixing
Requirement Dough
Characteristics A 60.0 2675 1 1 B 64.0 900 3 3 C 71.0 2125 2 2 D 66.0 2750 3 3 E 71.0 2841 2 2 F 69.5 1045 2 3 G 65.0 3000 3 3 H 71.9 1010 3 3 I 68.0 995 1 1 J 69.2 1000 2 3 K 67.0 1025 1 1 L 69.9 1045 1 4 M 75.9 954 2 2
Avg. 68.3 2.0 2.4 S.D. 4.0 0.8 1.0
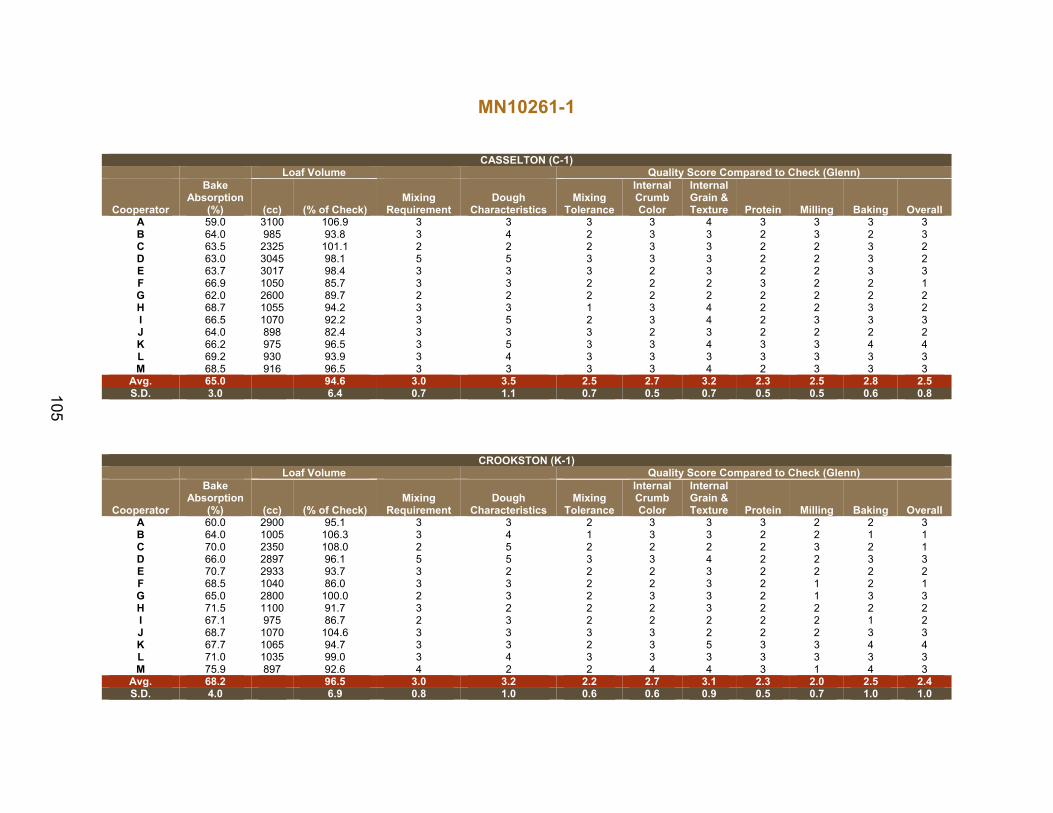
105
MN10261-1
CASSELTON (C-1) Loaf Volume Quality Score Compared to Check (Glenn)
Cooperator
Bake Absorption
(%) (cc) (% of Check) Mixing
Requirement Dough
Characteristics Mixing
Tolerance
Internal Crumb Color
Internal Grain & Texture Protein Milling Baking Overall
A 59.0 3100 106.9 3 3 3 3 4 3 3 3 3 B 64.0 985 93.8 3 4 2 3 3 2 3 2 3 C 63.5 2325 101.1 2 2 2 3 3 2 2 3 2 D 63.0 3045 98.1 5 5 3 3 3 2 2 3 2 E 63.7 3017 98.4 3 3 3 2 3 2 2 3 3 F 66.9 1050 85.7 3 3 2 2 2 3 2 2 1 G 62.0 2600 89.7 2 2 2 2 2 2 2 2 2 H 68.7 1055 94.2 3 3 1 3 4 2 2 3 2 I 66.5 1070 92.2 3 5 2 3 4 2 3 3 3 J 64.0 898 82.4 3 3 3 2 3 2 2 2 2 K 66.2 975 96.5 3 5 3 3 4 3 3 4 4 L 69.2 930 93.9 3 4 3 3 3 3 3 3 3 M 68.5 916 96.5 3 3 3 3 4 2 3 3 3
Avg. 65.0 94.6 3.0 3.5 2.5 2.7 3.2 2.3 2.5 2.8 2.5 S.D. 3.0 6.4 0.7 1.1 0.7 0.5 0.7 0.5 0.5 0.6 0.8
CROOKSTON (K-1) Loaf Volume Quality Score Compared to Check (Glenn)
Cooperator
Bake Absorption
(%) (cc) (% of Check) Mixing
Requirement Dough
Characteristics Mixing
Tolerance
Internal Crumb Color
Internal Grain & Texture Protein Milling Baking Overall
A 60.0 2900 95.1 3 3 2 3 3 3 2 2 3 B 64.0 1005 106.3 3 4 1 3 3 2 2 1 1 C 70.0 2350 108.0 2 5 2 2 2 2 3 2 1 D 66.0 2897 96.1 5 5 3 3 4 2 2 3 3 E 70.7 2933 93.7 3 2 2 2 3 2 2 2 2 F 68.5 1040 86.0 3 3 2 2 3 2 1 2 1 G 65.0 2800 100.0 2 3 2 3 3 2 1 3 3 H 71.5 1100 91.7 3 2 2 2 3 2 2 2 2 I 67.1 975 86.7 2 3 2 2 2 2 2 1 2 J 68.7 1070 104.6 3 3 3 3 2 2 2 3 3 K 67.7 1065 94.7 3 3 2 3 5 3 3 4 4 L 71.0 1035 99.0 3 4 3 3 3 3 3 3 3 M 75.9 897 92.6 4 2 2 4 4 3 1 4 3
Avg. 68.2 96.5 3.0 3.2 2.2 2.7 3.1 2.3 2.0 2.5 2.4 S.D. 4.0 6.9 0.8 1.0 0.6 0.6 0.9 0.5 0.7 1.0 1.0

106
ND820
CASSELTON (C-2) Loaf Volume Quality Score Compared to Check (Glenn)
Cooperator
Bake Absorption
(%) (cc) (% of Check) Mixing
Requirement Dough
Characteristics Mixing
Tolerance
Internal Crumb Color
Internal Grain & Texture Protein Milling Baking Overall
A 58.0 3000 103.4 3 3 3 3 4 2 3 3 3 B 62.0 985 93.8 3 4 3 3 3 1 2 2 2 C 63.0 2275 98.9 2 2 2 3 3 1 4 3 2 D 63.0 3045 98.1 5 5 3 4 3 2 3 3 3 E 63.0 2894 94.4 3 2 3 4 4 1 3 2 3 F 65.7 1040 84.9 3 3 2 3 2 2 3 2 2 G 62.0 2600 89.7 2 2 2 3 3 1 3 1 2 H 66.7 1020 91.1 3 1 2 3 4 1 3 2 1 I 64.0 1055 90.9 2 3 2 4 5 1 2 4 2 J 62.5 915 83.9 3 3 4 2 2 2 2 2 2 K 64.7 970 96.0 3 4 3 3 5 2 2 4 4 L 69.2 930 93.9 2 4 3 4 3 2 2 4 3 M 68.2 890 93.8 3 3 3 4 4 1 3 3 2
Avg. 64.0 93.3 2.8 3.0 2.7 3.3 3.5 1.5 2.7 2.7 2.4 S.D. 3.0 5.4 0.8 1.1 0.6 0.6 1.0 0.5 0.6 0.9 0.8
WILLISTON (W-2) Loaf Volume Quality Score Compared to Check (Glenn)
Cooperator
Bake Absorption
(%) (cc) (% of Check) Mixing
Requirement Dough
Characteristics Mixing
Tolerance
Internal Crumb Color
Internal Grain & Texture Protein Milling Baking Overall
A 61.0 2950 95.2 5 5 3 3 3 3 3 3 3 B 64.0 995 99.5 3 4 3 3 4 3 3 3 3 C 64.5 2250 104.7 3 3 2 4 4 3 4 4 3 D 61.0 3104 103.0 5 5 3 3 3 2 3 3 3 E 64.3 3026 104.0 4 5 3 4 3 3 3 3 3 F 69.5 1000 102.0 4 3 3 3 3 3 2 3 2 G 62.0 2700 101.9 1 2 2 3 3 2 3 3 3 H 68.6 1135 98.3 4 4 2 3 4 2 3 2 2 I 68.5 1060 89.8 3 3 2 3 4 2 4 4 3 J 63.0 875 89.0 3 3 3 3 3 3 4 2 3 K 68.5 1025 94.9 5 4 3 3 4 3 4 4 4 L 68.8 1035 104.5 3 4 2 3 4 3 3 4 4 M 69.3 961 100.1 4 3 2 3 4 3 4 3 3
Avg. 65.6 99.0 3.6 3.7 2.5 3.2 3.5 2.7 3.3 3.2 3.0 S.D. 3.3 5.3 1.1 0.9 0.5 0.4 0.5 0.5 0.6 0.7 0.6
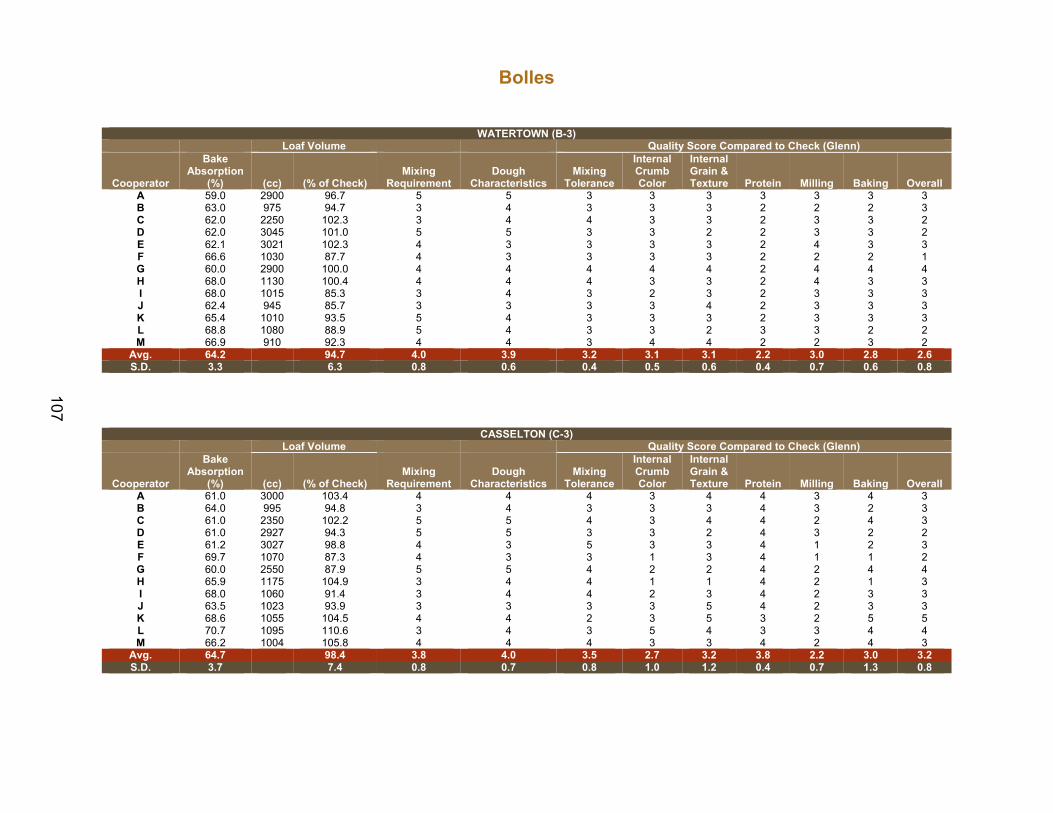
107
Bolles
WATERTOWN (B-3) Loaf Volume Quality Score Compared to Check (Glenn)
Cooperator
Bake Absorption
(%) (cc) (% of Check) Mixing
Requirement Dough
Characteristics Mixing
Tolerance
Internal Crumb Color
Internal Grain & Texture Protein Milling Baking Overall
A 59.0 2900 96.7 5 5 3 3 3 3 3 3 3 B 63.0 975 94.7 3 4 3 3 3 2 2 2 3 C 62.0 2250 102.3 3 4 4 3 3 2 3 3 2 D 62.0 3045 101.0 5 5 3 3 2 2 3 3 2 E 62.1 3021 102.3 4 3 3 3 3 2 4 3 3 F 66.6 1030 87.7 4 3 3 3 3 2 2 2 1 G 60.0 2900 100.0 4 4 4 4 4 2 4 4 4 H 68.0 1130 100.4 4 4 4 3 3 2 4 3 3 I 68.0 1015 85.3 3 4 3 2 3 2 3 3 3 J 62.4 945 85.7 3 3 3 3 4 2 3 3 3 K 65.4 1010 93.5 5 4 3 3 3 2 3 3 3 L 68.8 1080 88.9 5 4 3 3 2 3 3 2 2 M 66.9 910 92.3 4 4 3 4 4 2 2 3 2
Avg. 64.2 94.7 4.0 3.9 3.2 3.1 3.1 2.2 3.0 2.8 2.6 S.D. 3.3 6.3 0.8 0.6 0.4 0.5 0.6 0.4 0.7 0.6 0.8
CASSELTON (C-3) Loaf Volume Quality Score Compared to Check (Glenn)
Cooperator
Bake Absorption
(%) (cc) (% of Check) Mixing
Requirement Dough
Characteristics Mixing
Tolerance
Internal Crumb Color
Internal Grain & Texture Protein Milling Baking Overall
A 61.0 3000 103.4 4 4 4 3 4 4 3 4 3 B 64.0 995 94.8 3 4 3 3 3 4 3 2 3 C 61.0 2350 102.2 5 5 4 3 4 4 2 4 3 D 61.0 2927 94.3 5 5 3 3 2 4 3 2 2 E 61.2 3027 98.8 4 3 5 3 3 4 1 2 3 F 69.7 1070 87.3 4 3 3 1 3 4 1 1 2 G 60.0 2550 87.9 5 5 4 2 2 4 2 4 4 H 65.9 1175 104.9 3 4 4 1 1 4 2 1 3 I 68.0 1060 91.4 3 4 4 2 3 4 2 3 3 J 63.5 1023 93.9 3 3 3 3 5 4 2 3 3 K 68.6 1055 104.5 4 4 2 3 5 3 2 5 5 L 70.7 1095 110.6 3 4 3 5 4 3 3 4 4 M 66.2 1004 105.8 4 4 4 3 3 4 2 4 3
Avg. 64.7 98.4 3.8 4.0 3.5 2.7 3.2 3.8 2.2 3.0 3.2 S.D. 3.7 7.4 0.8 0.7 0.8 1.0 1.2 0.4 0.7 1.3 0.8
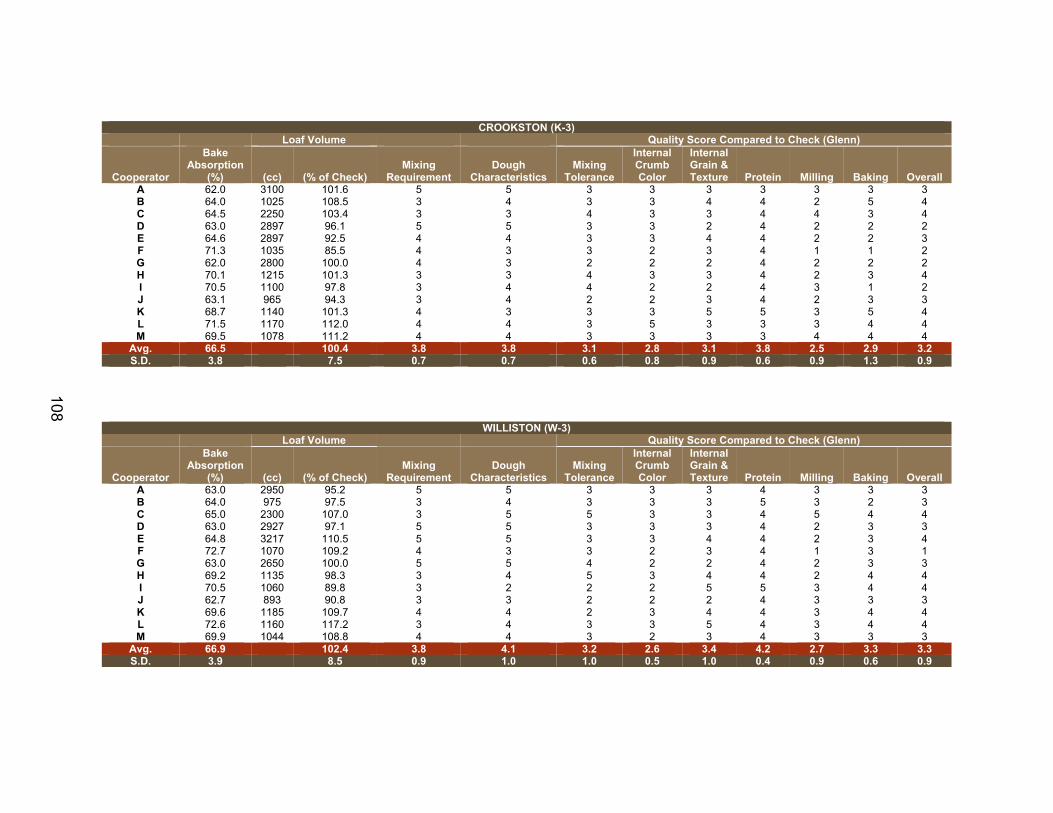
108
CROOKSTON (K-3) Loaf Volume Quality Score Compared to Check (Glenn)
Cooperator
Bake Absorption
(%) (cc) (% of Check) Mixing
Requirement Dough
Characteristics Mixing
Tolerance
Internal Crumb Color
Internal Grain & Texture Protein Milling Baking Overall
A 62.0 3100 101.6 5 5 3 3 3 3 3 3 3 B 64.0 1025 108.5 3 4 3 3 4 4 2 5 4 C 64.5 2250 103.4 3 3 4 3 3 4 4 3 4 D 63.0 2897 96.1 5 5 3 3 2 4 2 2 2 E 64.6 2897 92.5 4 4 3 3 4 4 2 2 3 F 71.3 1035 85.5 4 3 3 2 3 4 1 1 2 G 62.0 2800 100.0 4 3 2 2 2 4 2 2 2 H 70.1 1215 101.3 3 3 4 3 3 4 2 3 4 I 70.5 1100 97.8 3 4 4 2 2 4 3 1 2 J 63.1 965 94.3 3 4 2 2 3 4 2 3 3 K 68.7 1140 101.3 4 3 3 3 5 5 3 5 4 L 71.5 1170 112.0 4 4 3 5 3 3 3 4 4 M 69.5 1078 111.2 4 4 3 3 3 3 4 4 4
Avg. 66.5 100.4 3.8 3.8 3.1 2.8 3.1 3.8 2.5 2.9 3.2 S.D. 3.8 7.5 0.7 0.7 0.6 0.8 0.9 0.6 0.9 1.3 0.9
WILLISTON (W-3) Loaf Volume Quality Score Compared to Check (Glenn)
Cooperator
Bake Absorption
(%) (cc) (% of Check) Mixing
Requirement Dough
Characteristics Mixing
Tolerance
Internal Crumb Color
Internal Grain & Texture Protein Milling Baking Overall
A 63.0 2950 95.2 5 5 3 3 3 4 3 3 3 B 64.0 975 97.5 3 4 3 3 3 5 3 2 3 C 65.0 2300 107.0 3 5 5 3 3 4 5 4 4 D 63.0 2927 97.1 5 5 3 3 3 4 2 3 3 E 64.8 3217 110.5 5 5 3 3 4 4 2 3 4 F 72.7 1070 109.2 4 3 3 2 3 4 1 3 1 G 63.0 2650 100.0 5 5 4 2 2 4 2 3 3 H 69.2 1135 98.3 3 4 5 3 4 4 2 4 4 I 70.5 1060 89.8 3 2 2 2 5 5 3 4 4 J 62.7 893 90.8 3 3 2 2 2 4 3 3 3 K 69.6 1185 109.7 4 4 2 3 4 4 3 4 4 L 72.6 1160 117.2 3 4 3 3 5 4 3 4 4 M 69.9 1044 108.8 4 4 3 2 3 4 3 3 3
Avg. 66.9 102.4 3.8 4.1 3.2 2.6 3.4 4.2 2.7 3.3 3.3 S.D. 3.9 8.5 0.9 1.0 1.0 0.5 1.0 0.4 0.9 0.6 0.9

109
BOZEMAN (Z-3) Loaf Volume Quality Score Compared to Check (Glenn)
Cooperator
Bake Absorption
(%) (cc) (% of Check) Mixing
Requirement Dough
Characteristics Mixing
Tolerance
Internal Crumb Color
Internal Grain & Texture Protein Milling Baking Overall
A 61.0 2550 95.3 1 1 1 2 3 4 3 1 1 B 64.0 850 94.4 3 3 2 3 1 4 2 2 3 C 68.5 2175 102.4 2 2 3 2 2 4 3 2 2 D 65.0 2515 91.5 1 3 1 2 1 4 2 1 1 E 68.5 2525 88.9 1 1 2 1 1 4 2 1 1 F 70.5 800 76.6 2 2 1 1 1 4 1 1 1 G 65.0 2500 83.3 2 2 2 1 1 5 2 1 2 H 71.8 1070 105.9 1 1 3 2 4 4 2 3 3 I 70.5 880 88.4 1 1 2 1 1 4 2 1 1 J 66.1 715 71.5 1 2 2 1 1 4 3 1 1 K 65.5 965 94.1 1 2 3 3 2 4 3 2 3 L 69.8 925 88.5 1 3 3 2 2 3 3 1 2 M 73.4 832 87.2 2 2 2 1 4 4 2 2 3
Avg. 67.7 89.9 1.5 1.9 2.1 1.7 1.8 4.0 2.3 1.5 1.8 S.D. 3.5 9.4 0.7 0.8 0.8 0.8 1.1 0.4 0.6 0.7 0.9
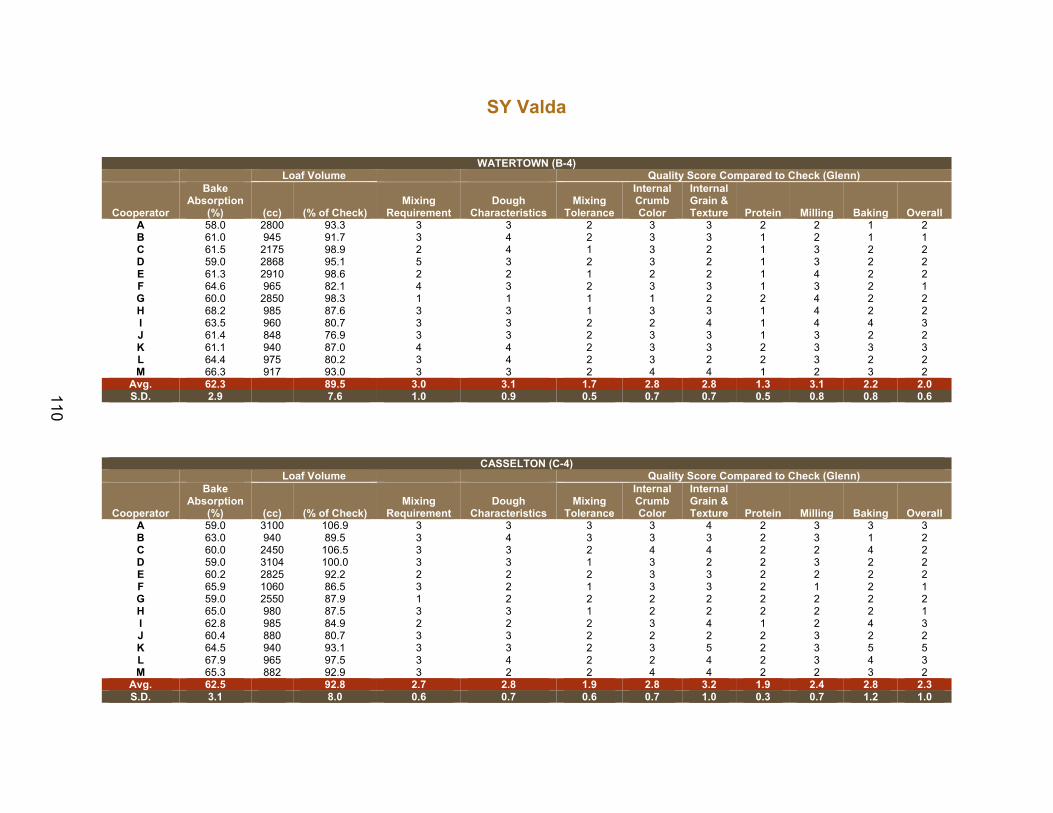
110
SY Valda
WATERTOWN (B-4) Loaf Volume Quality Score Compared to Check (Glenn)
Cooperator
Bake Absorption
(%) (cc) (% of Check) Mixing
Requirement Dough
Characteristics Mixing
Tolerance
Internal Crumb Color
Internal Grain & Texture Protein Milling Baking Overall
A 58.0 2800 93.3 3 3 2 3 3 2 2 1 2 B 61.0 945 91.7 3 4 2 3 3 1 2 1 1 C 61.5 2175 98.9 2 4 1 3 2 1 3 2 2 D 59.0 2868 95.1 5 3 2 3 2 1 3 2 2 E 61.3 2910 98.6 2 2 1 2 2 1 4 2 2 F 64.6 965 82.1 4 3 2 3 3 1 3 2 1 G 60.0 2850 98.3 1 1 1 1 2 2 4 2 2 H 68.2 985 87.6 3 3 1 3 3 1 4 2 2 I 63.5 960 80.7 3 3 2 2 4 1 4 4 3 J 61.4 848 76.9 3 3 2 3 3 1 3 2 2 K 61.1 940 87.0 4 4 2 3 3 2 3 3 3 L 64.4 975 80.2 3 4 2 3 2 2 3 2 2 M 66.3 917 93.0 3 3 2 4 4 1 2 3 2
Avg. 62.3 89.5 3.0 3.1 1.7 2.8 2.8 1.3 3.1 2.2 2.0 S.D. 2.9 7.6 1.0 0.9 0.5 0.7 0.7 0.5 0.8 0.8 0.6
CASSELTON (C-4) Loaf Volume Quality Score Compared to Check (Glenn)
Cooperator
Bake Absorption
(%) (cc) (% of Check) Mixing
Requirement Dough
Characteristics Mixing
Tolerance
Internal Crumb Color
Internal Grain & Texture Protein Milling Baking Overall
A 59.0 3100 106.9 3 3 3 3 4 2 3 3 3 B 63.0 940 89.5 3 4 3 3 3 2 3 1 2 C 60.0 2450 106.5 3 3 2 4 4 2 2 4 2 D 59.0 3104 100.0 3 3 1 3 2 2 3 2 2 E 60.2 2825 92.2 2 2 2 3 3 2 2 2 2 F 65.9 1060 86.5 3 2 1 3 3 2 1 2 1 G 59.0 2550 87.9 1 2 2 2 2 2 2 2 2 H 65.0 980 87.5 3 3 1 2 2 2 2 2 1 I 62.8 985 84.9 2 2 2 3 4 1 2 4 3 J 60.4 880 80.7 3 3 2 2 2 2 3 2 2 K 64.5 940 93.1 3 3 2 3 5 2 3 5 5 L 67.9 965 97.5 3 4 2 2 4 2 3 4 3 M 65.3 882 92.9 3 2 2 4 4 2 2 3 2
Avg. 62.5 92.8 2.7 2.8 1.9 2.8 3.2 1.9 2.4 2.8 2.3 S.D. 3.1 8.0 0.6 0.7 0.6 0.7 1.0 0.3 0.7 1.2 1.0
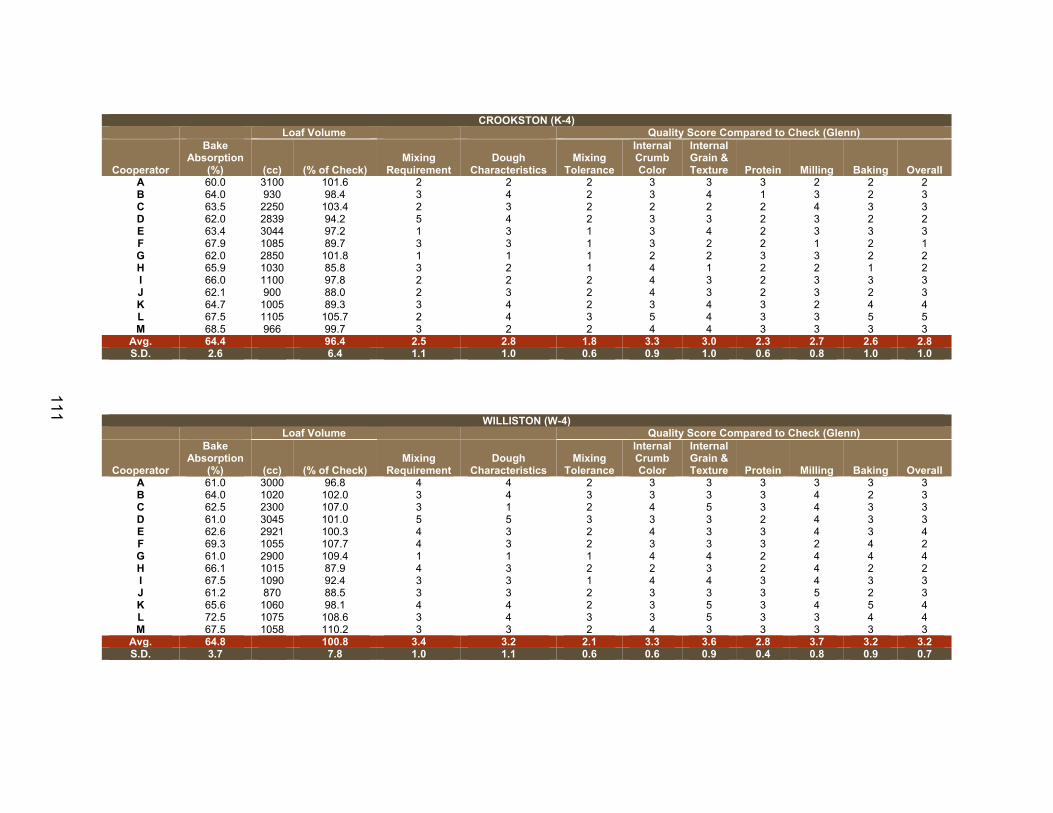
111
CROOKSTON (K-4)
Loaf Volume Quality Score Compared to Check (Glenn)
Cooperator
Bake Absorption
(%) (cc) (% of Check) Mixing
Requirement Dough
Characteristics Mixing
Tolerance
Internal Crumb Color
Internal Grain & Texture Protein Milling Baking Overall
A 60.0 3100 101.6 2 2 2 3 3 3 2 2 2 B 64.0 930 98.4 3 4 2 3 4 1 3 2 3 C 63.5 2250 103.4 2 3 2 2 2 2 4 3 3 D 62.0 2839 94.2 5 4 2 3 3 2 3 2 2 E 63.4 3044 97.2 1 3 1 3 4 2 3 3 3 F 67.9 1085 89.7 3 3 1 3 2 2 1 2 1 G 62.0 2850 101.8 1 1 1 2 2 3 3 2 2 H 65.9 1030 85.8 3 2 1 4 1 2 2 1 2 I 66.0 1100 97.8 2 2 2 4 3 2 3 3 3 J 62.1 900 88.0 2 3 2 4 3 2 3 2 3 K 64.7 1005 89.3 3 4 2 3 4 3 2 4 4 L 67.5 1105 105.7 2 4 3 5 4 3 3 5 5 M 68.5 966 99.7 3 2 2 4 4 3 3 3 3
Avg. 64.4 96.4 2.5 2.8 1.8 3.3 3.0 2.3 2.7 2.6 2.8 S.D. 2.6 6.4 1.1 1.0 0.6 0.9 1.0 0.6 0.8 1.0 1.0
WILLISTON (W-4) Loaf Volume Quality Score Compared to Check (Glenn)
Cooperator
Bake Absorption
(%) (cc) (% of Check) Mixing
Requirement Dough
Characteristics Mixing
Tolerance
Internal Crumb Color
Internal Grain & Texture Protein Milling Baking Overall
A 61.0 3000 96.8 4 4 2 3 3 3 3 3 3 B 64.0 1020 102.0 3 4 3 3 3 3 4 2 3 C 62.5 2300 107.0 3 1 2 4 5 3 4 3 3 D 61.0 3045 101.0 5 5 3 3 3 2 4 3 3 E 62.6 2921 100.3 4 3 2 4 3 3 4 3 4 F 69.3 1055 107.7 4 3 2 3 3 3 2 4 2 G 61.0 2900 109.4 1 1 1 4 4 2 4 4 4 H 66.1 1015 87.9 4 3 2 2 3 2 4 2 2 I 67.5 1090 92.4 3 3 1 4 4 3 4 3 3 J 61.2 870 88.5 3 3 2 3 3 3 5 2 3 K 65.6 1060 98.1 4 4 2 3 5 3 4 5 4 L 72.5 1075 108.6 3 4 3 3 5 3 3 4 4 M 67.5 1058 110.2 3 3 2 4 3 3 3 3 3
Avg. 64.8 100.8 3.4 3.2 2.1 3.3 3.6 2.8 3.7 3.2 3.2 S.D. 3.7 7.8 1.0 1.1 0.6 0.6 0.9 0.4 0.8 0.9 0.7
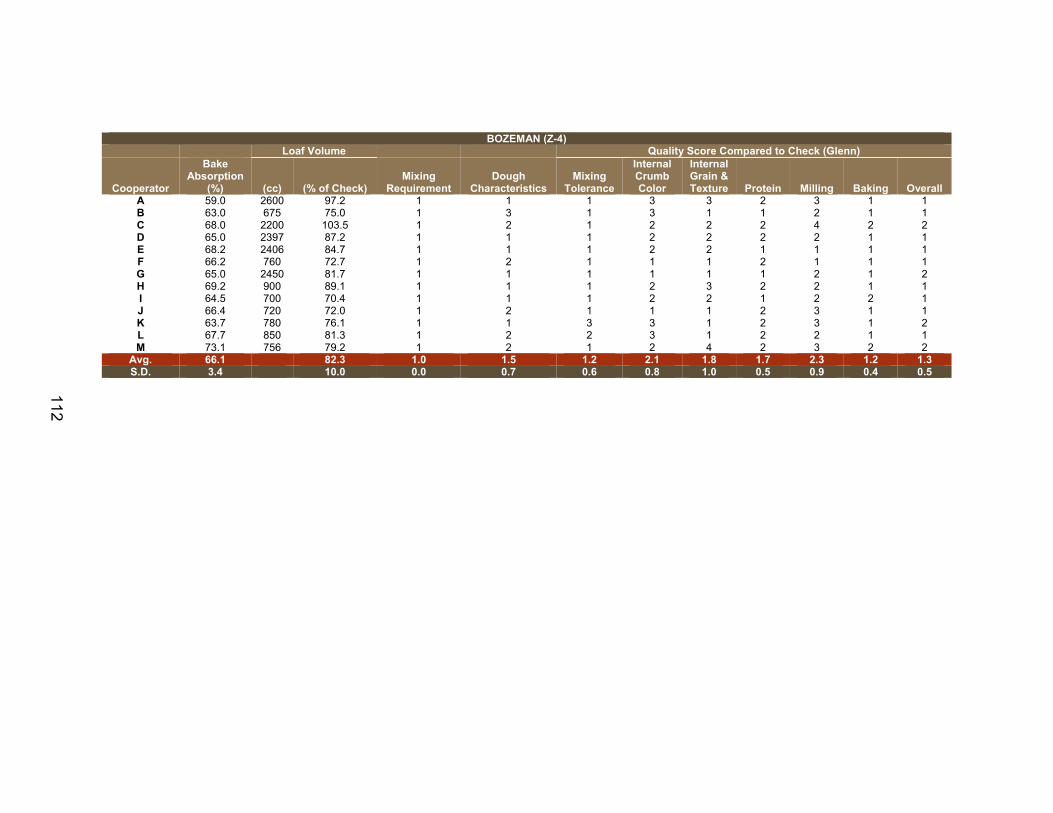
112
BOZEMAN (Z-4) Loaf Volume Quality Score Compared to Check (Glenn)
Cooperator
Bake Absorption
(%) (cc) (% of Check) Mixing
Requirement Dough
Characteristics Mixing
Tolerance
Internal Crumb Color
Internal Grain & Texture Protein Milling Baking Overall
A 59.0 2600 97.2 1 1 1 3 3 2 3 1 1 B 63.0 675 75.0 1 3 1 3 1 1 2 1 1 C 68.0 2200 103.5 1 2 1 2 2 2 4 2 2 D 65.0 2397 87.2 1 1 1 2 2 2 2 1 1 E 68.2 2406 84.7 1 1 1 2 2 1 1 1 1 F 66.2 760 72.7 1 2 1 1 1 2 1 1 1 G 65.0 2450 81.7 1 1 1 1 1 1 2 1 2 H 69.2 900 89.1 1 1 1 2 3 2 2 1 1 I 64.5 700 70.4 1 1 1 2 2 1 2 2 1 J 66.4 720 72.0 1 2 1 1 1 2 3 1 1 K 63.7 780 76.1 1 1 3 3 1 2 3 1 2 L 67.7 850 81.3 1 2 2 3 1 2 2 1 1 M 73.1 756 79.2 1 2 1 2 4 2 3 2 2
Avg. 66.1 82.3 1.0 1.5 1.2 2.1 1.8 1.7 2.3 1.2 1.3 S.D. 3.4 10.0 0.0 0.7 0.6 0.8 1.0 0.5 0.9 0.4 0.5
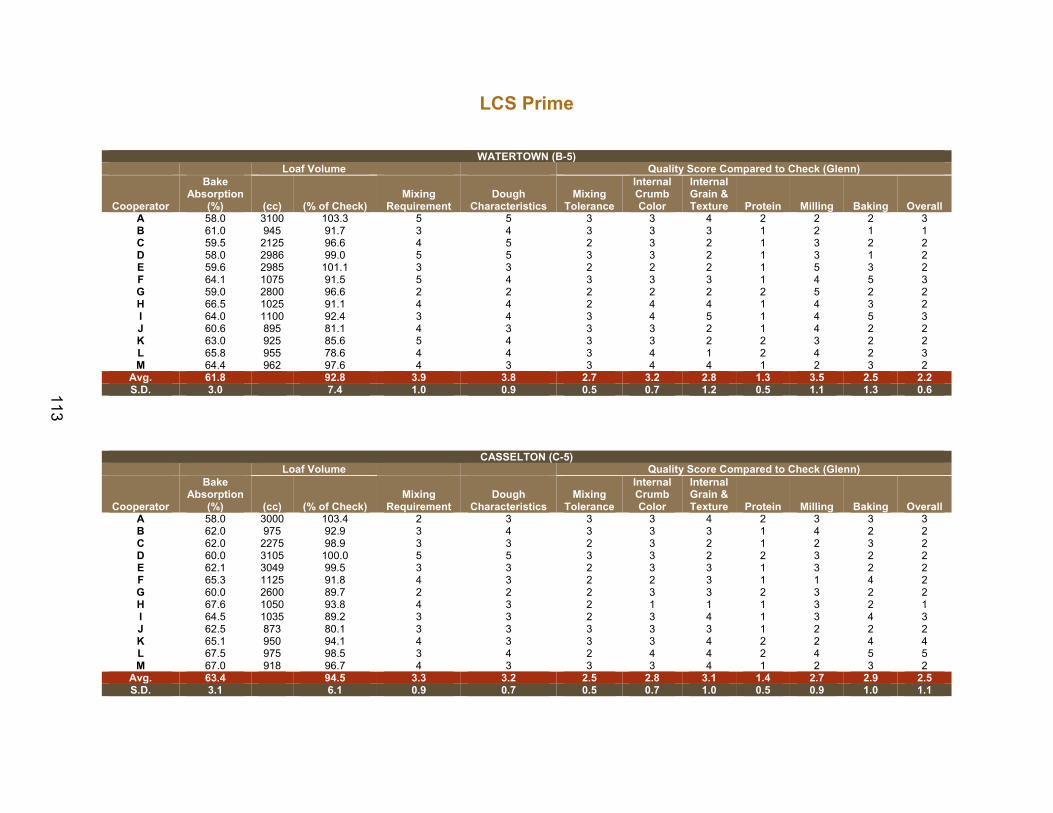
113
LCS Prime
WATERTOWN (B-5) Loaf Volume Quality Score Compared to Check (Glenn)
Cooperator
Bake Absorption
(%) (cc) (% of Check) Mixing
Requirement Dough
Characteristics Mixing
Tolerance
Internal Crumb Color
Internal Grain & Texture Protein Milling Baking Overall
A 58.0 3100 103.3 5 5 3 3 4 2 2 2 3 B 61.0 945 91.7 3 4 3 3 3 1 2 1 1 C 59.5 2125 96.6 4 5 2 3 2 1 3 2 2 D 58.0 2986 99.0 5 5 3 3 2 1 3 1 2 E 59.6 2985 101.1 3 3 2 2 2 1 5 3 2 F 64.1 1075 91.5 5 4 3 3 3 1 4 5 3 G 59.0 2800 96.6 2 2 2 2 2 2 5 2 2 H 66.5 1025 91.1 4 4 2 4 4 1 4 3 2 I 64.0 1100 92.4 3 4 3 4 5 1 4 5 3 J 60.6 895 81.1 4 3 3 3 2 1 4 2 2 K 63.0 925 85.6 5 4 3 3 2 2 3 2 2 L 65.8 955 78.6 4 4 3 4 1 2 4 2 3 M 64.4 962 97.6 4 3 3 4 4 1 2 3 2
Avg. 61.8 92.8 3.9 3.8 2.7 3.2 2.8 1.3 3.5 2.5 2.2 S.D. 3.0 7.4 1.0 0.9 0.5 0.7 1.2 0.5 1.1 1.3 0.6
CASSELTON (C-5) Loaf Volume Quality Score Compared to Check (Glenn)
Cooperator
Bake Absorption
(%) (cc) (% of Check) Mixing
Requirement Dough
Characteristics Mixing
Tolerance
Internal Crumb Color
Internal Grain & Texture Protein Milling Baking Overall
A 58.0 3000 103.4 2 3 3 3 4 2 3 3 3 B 62.0 975 92.9 3 4 3 3 3 1 4 2 2 C 62.0 2275 98.9 3 3 2 3 2 1 2 3 2 D 60.0 3105 100.0 5 5 3 3 2 2 3 2 2 E 62.1 3049 99.5 3 3 2 3 3 1 3 2 2 F 65.3 1125 91.8 4 3 2 2 3 1 1 4 2 G 60.0 2600 89.7 2 2 2 3 3 2 3 2 2 H 67.6 1050 93.8 4 3 2 1 1 1 3 2 1 I 64.5 1035 89.2 3 3 2 3 4 1 3 4 3 J 62.5 873 80.1 3 3 3 3 3 1 2 2 2 K 65.1 950 94.1 4 3 3 3 4 2 2 4 4 L 67.5 975 98.5 3 4 2 4 4 2 4 5 5 M 67.0 918 96.7 4 3 3 3 4 1 2 3 2
Avg. 63.4 94.5 3.3 3.2 2.5 2.8 3.1 1.4 2.7 2.9 2.5 S.D. 3.1 6.1 0.9 0.7 0.5 0.7 1.0 0.5 0.9 1.0 1.1
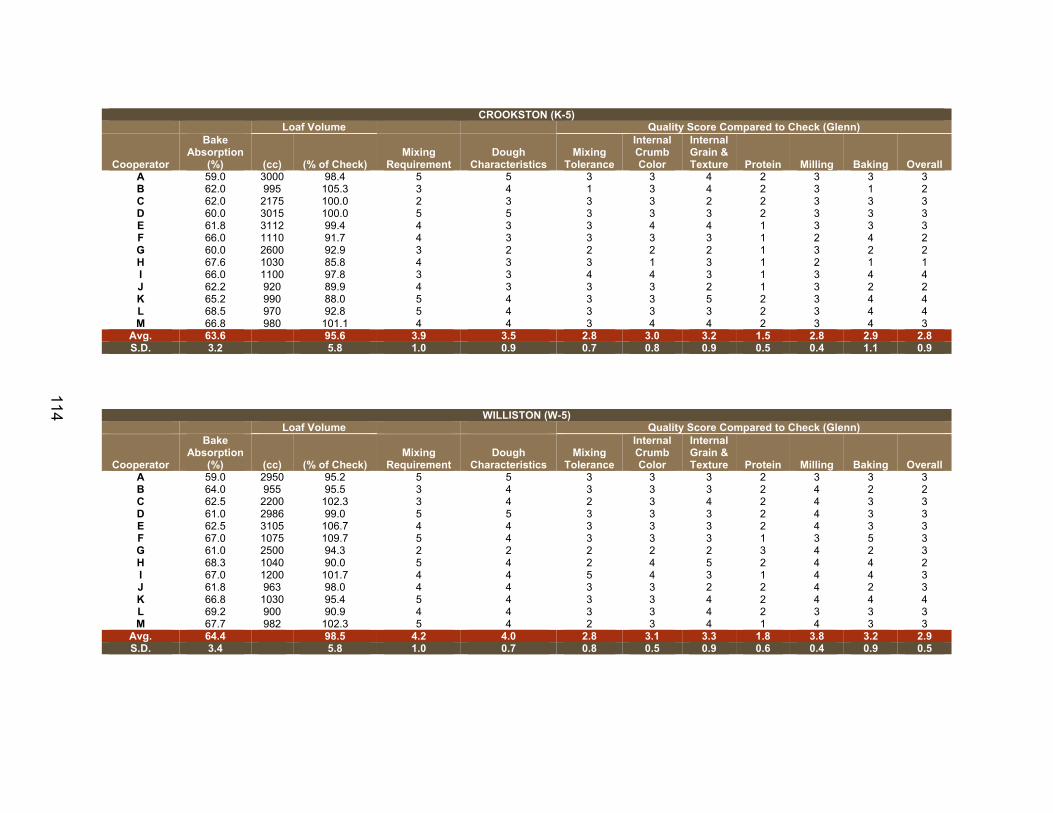
114
CROOKSTON (K-5) Loaf Volume Quality Score Compared to Check (Glenn)
Cooperator
Bake Absorption
(%) (cc) (% of Check) Mixing
Requirement Dough
Characteristics Mixing
Tolerance
Internal Crumb Color
Internal Grain & Texture Protein Milling Baking Overall
A 59.0 3000 98.4 5 5 3 3 4 2 3 3 3 B 62.0 995 105.3 3 4 1 3 4 2 3 1 2 C 62.0 2175 100.0 2 3 3 3 2 2 3 3 3 D 60.0 3015 100.0 5 5 3 3 3 2 3 3 3 E 61.8 3112 99.4 4 3 3 4 4 1 3 3 3 F 66.0 1110 91.7 4 3 3 3 3 1 2 4 2 G 60.0 2600 92.9 3 2 2 2 2 1 3 2 2 H 67.6 1030 85.8 4 3 3 1 3 1 2 1 1 I 66.0 1100 97.8 3 3 4 4 3 1 3 4 4 J 62.2 920 89.9 4 3 3 3 2 1 3 2 2 K 65.2 990 88.0 5 4 3 3 5 2 3 4 4 L 68.5 970 92.8 5 4 3 3 3 2 3 4 4 M 66.8 980 101.1 4 4 3 4 4 2 3 4 3
Avg. 63.6 95.6 3.9 3.5 2.8 3.0 3.2 1.5 2.8 2.9 2.8 S.D. 3.2 5.8 1.0 0.9 0.7 0.8 0.9 0.5 0.4 1.1 0.9
WILLISTON (W-5) Loaf Volume Quality Score Compared to Check (Glenn)
Cooperator
Bake Absorption
(%) (cc) (% of Check) Mixing
Requirement Dough
Characteristics Mixing
Tolerance
Internal Crumb Color
Internal Grain & Texture Protein Milling Baking Overall
A 59.0 2950 95.2 5 5 3 3 3 2 3 3 3 B 64.0 955 95.5 3 4 3 3 3 2 4 2 2 C 62.5 2200 102.3 3 4 2 3 4 2 4 3 3 D 61.0 2986 99.0 5 5 3 3 3 2 4 3 3 E 62.5 3105 106.7 4 4 3 3 3 2 4 3 3 F 67.0 1075 109.7 5 4 3 3 3 1 3 5 3 G 61.0 2500 94.3 2 2 2 2 2 3 4 2 3 H 68.3 1040 90.0 5 4 2 4 5 2 4 4 2 I 67.0 1200 101.7 4 4 5 4 3 1 4 4 3 J 61.8 963 98.0 4 4 3 3 2 2 4 2 3 K 66.8 1030 95.4 5 4 3 3 4 2 4 4 4 L 69.2 900 90.9 4 4 3 3 4 2 3 3 3 M 67.7 982 102.3 5 4 2 3 4 1 4 3 3
Avg. 64.4 98.5 4.2 4.0 2.8 3.1 3.3 1.8 3.8 3.2 2.9 S.D. 3.4 5.8 1.0 0.7 0.8 0.5 0.9 0.6 0.4 0.9 0.5
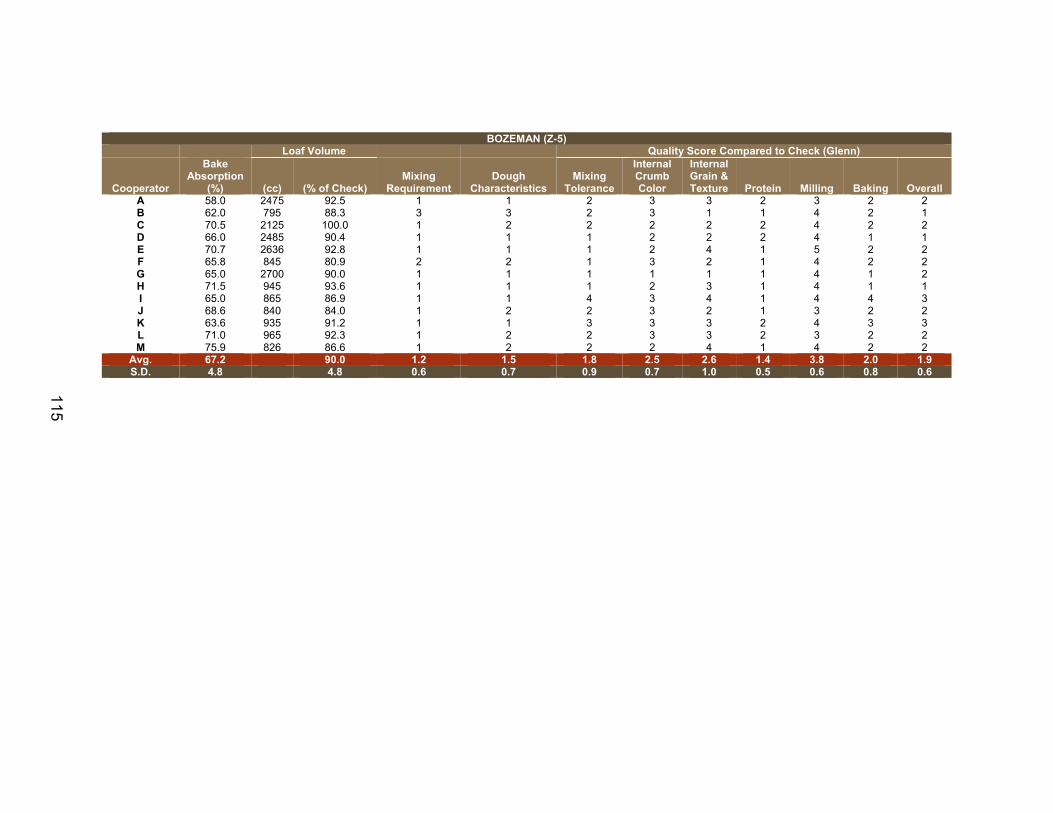
115
BOZEMAN (Z-5) Loaf Volume Quality Score Compared to Check (Glenn)
Cooperator
Bake Absorption
(%) (cc) (% of Check) Mixing
Requirement Dough
Characteristics Mixing
Tolerance
Internal Crumb Color
Internal Grain & Texture Protein Milling Baking Overall
A 58.0 2475 92.5 1 1 2 3 3 2 3 2 2 B 62.0 795 88.3 3 3 2 3 1 1 4 2 1 C 70.5 2125 100.0 1 2 2 2 2 2 4 2 2 D 66.0 2485 90.4 1 1 1 2 2 2 4 1 1 E 70.7 2636 92.8 1 1 1 2 4 1 5 2 2 F 65.8 845 80.9 2 2 1 3 2 1 4 2 2 G 65.0 2700 90.0 1 1 1 1 1 1 4 1 2 H 71.5 945 93.6 1 1 1 2 3 1 4 1 1 I 65.0 865 86.9 1 1 4 3 4 1 4 4 3 J 68.6 840 84.0 1 2 2 3 2 1 3 2 2 K 63.6 935 91.2 1 1 3 3 3 2 4 3 3 L 71.0 965 92.3 1 2 2 3 3 2 3 2 2 M 75.9 826 86.6 1 2 2 2 4 1 4 2 2
Avg. 67.2 90.0 1.2 1.5 1.8 2.5 2.6 1.4 3.8 2.0 1.9 S.D. 4.8 4.8 0.6 0.7 0.9 0.7 1.0 0.5 0.6 0.8 0.6
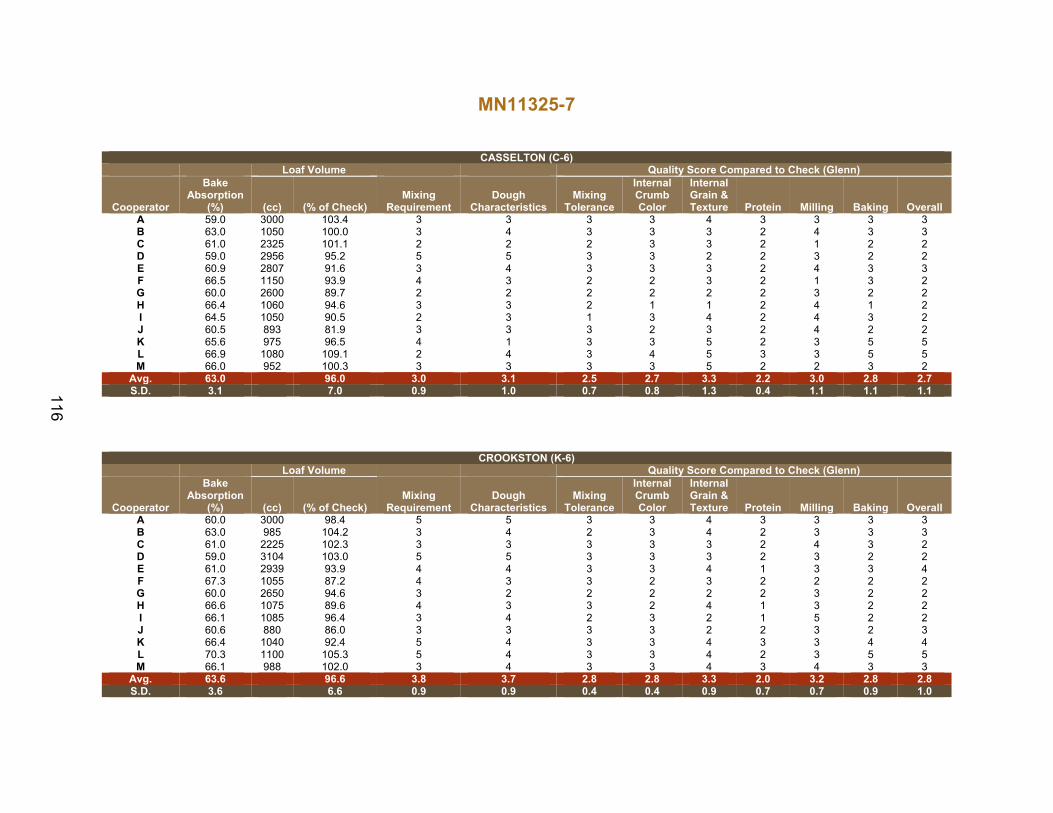
116
MN11325-7
CASSELTON (C-6) Loaf Volume Quality Score Compared to Check (Glenn)
Cooperator
Bake Absorption
(%) (cc) (% of Check) Mixing
Requirement Dough
Characteristics Mixing
Tolerance
Internal Crumb Color
Internal Grain & Texture Protein Milling Baking Overall
A 59.0 3000 103.4 3 3 3 3 4 3 3 3 3 B 63.0 1050 100.0 3 4 3 3 3 2 4 3 3 C 61.0 2325 101.1 2 2 2 3 3 2 1 2 2 D 59.0 2956 95.2 5 5 3 3 2 2 3 2 2 E 60.9 2807 91.6 3 4 3 3 3 2 4 3 3 F 66.5 1150 93.9 4 3 2 2 3 2 1 3 2 G 60.0 2600 89.7 2 2 2 2 2 2 3 2 2 H 66.4 1060 94.6 3 3 2 1 1 2 4 1 2 I 64.5 1050 90.5 2 3 1 3 4 2 4 3 2 J 60.5 893 81.9 3 3 3 2 3 2 4 2 2 K 65.6 975 96.5 4 1 3 3 5 2 3 5 5 L 66.9 1080 109.1 2 4 3 4 5 3 3 5 5 M 66.0 952 100.3 3 3 3 3 5 2 2 3 2
Avg. 63.0 96.0 3.0 3.1 2.5 2.7 3.3 2.2 3.0 2.8 2.7 S.D. 3.1 7.0 0.9 1.0 0.7 0.8 1.3 0.4 1.1 1.1 1.1
CROOKSTON (K-6) Loaf Volume Quality Score Compared to Check (Glenn)
Cooperator
Bake Absorption
(%) (cc) (% of Check) Mixing
Requirement Dough
Characteristics Mixing
Tolerance
Internal Crumb Color
Internal Grain & Texture Protein Milling Baking Overall
A 60.0 3000 98.4 5 5 3 3 4 3 3 3 3 B 63.0 985 104.2 3 4 2 3 4 2 3 3 3 C 61.0 2225 102.3 3 3 3 3 3 2 4 3 2 D 59.0 3104 103.0 5 5 3 3 3 2 3 2 2 E 61.0 2939 93.9 4 4 3 3 4 1 3 3 4 F 67.3 1055 87.2 4 3 3 2 3 2 2 2 2 G 60.0 2650 94.6 3 2 2 2 2 2 3 2 2 H 66.6 1075 89.6 4 3 3 2 4 1 3 2 2 I 66.1 1085 96.4 3 4 2 3 2 1 5 2 2 J 60.6 880 86.0 3 3 3 3 2 2 3 2 3 K 66.4 1040 92.4 5 4 3 3 4 3 3 4 4 L 70.3 1100 105.3 5 4 3 3 4 2 3 5 5 M 66.1 988 102.0 3 4 3 3 4 3 4 3 3
Avg. 63.6 96.6 3.8 3.7 2.8 2.8 3.3 2.0 3.2 2.8 2.8 S.D. 3.6 6.6 0.9 0.9 0.4 0.4 0.9 0.7 0.7 0.9 1.0
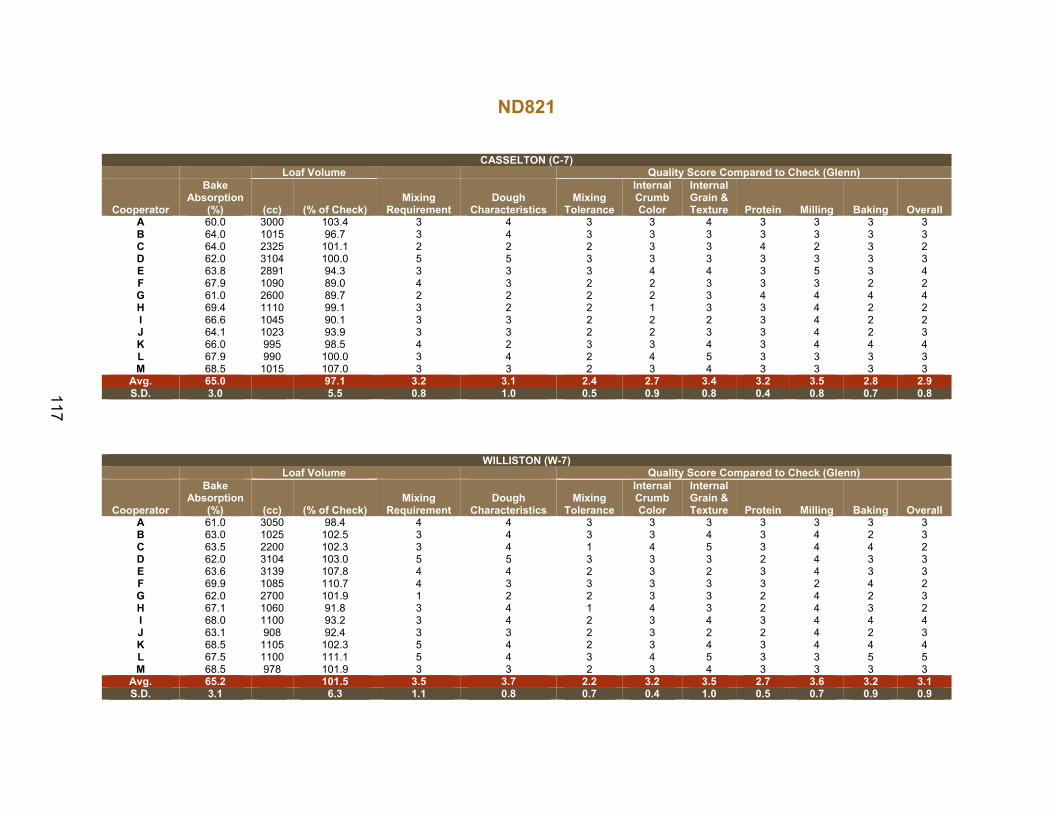
117
ND821
CASSELTON (C-7) Loaf Volume Quality Score Compared to Check (Glenn)
Cooperator
Bake Absorption
(%) (cc) (% of Check) Mixing
Requirement Dough
Characteristics Mixing
Tolerance
Internal Crumb Color
Internal Grain & Texture Protein Milling Baking Overall
A 60.0 3000 103.4 3 4 3 3 4 3 3 3 3 B 64.0 1015 96.7 3 4 3 3 3 3 3 3 3 C 64.0 2325 101.1 2 2 2 3 3 4 2 3 2 D 62.0 3104 100.0 5 5 3 3 3 3 3 3 3 E 63.8 2891 94.3 3 3 3 4 4 3 5 3 4 F 67.9 1090 89.0 4 3 2 2 3 3 3 2 2 G 61.0 2600 89.7 2 2 2 2 3 4 4 4 4 H 69.4 1110 99.1 3 2 2 1 3 3 4 2 2 I 66.6 1045 90.1 3 3 2 2 2 3 4 2 2 J 64.1 1023 93.9 3 3 2 2 3 3 4 2 3 K 66.0 995 98.5 4 2 3 3 4 3 4 4 4 L 67.9 990 100.0 3 4 2 4 5 3 3 3 3 M 68.5 1015 107.0 3 3 2 3 4 3 3 3 3
Avg. 65.0 97.1 3.2 3.1 2.4 2.7 3.4 3.2 3.5 2.8 2.9 S.D. 3.0 5.5 0.8 1.0 0.5 0.9 0.8 0.4 0.8 0.7 0.8
WILLISTON (W-7) Loaf Volume Quality Score Compared to Check (Glenn)
Cooperator
Bake Absorption
(%) (cc) (% of Check) Mixing
Requirement Dough
Characteristics Mixing
Tolerance
Internal Crumb Color
Internal Grain & Texture Protein Milling Baking Overall
A 61.0 3050 98.4 4 4 3 3 3 3 3 3 3 B 63.0 1025 102.5 3 4 3 3 4 3 4 2 3 C 63.5 2200 102.3 3 4 1 4 5 3 4 4 2 D 62.0 3104 103.0 5 5 3 3 3 2 4 3 3 E 63.6 3139 107.8 4 4 2 3 2 3 4 3 3 F 69.9 1085 110.7 4 3 3 3 3 3 2 4 2 G 62.0 2700 101.9 1 2 2 3 3 2 4 2 3 H 67.1 1060 91.8 3 4 1 4 3 2 4 3 2 I 68.0 1100 93.2 3 4 2 3 4 3 4 4 4 J 63.1 908 92.4 3 3 2 3 2 2 4 2 3 K 68.5 1105 102.3 5 4 2 3 4 3 4 4 4 L 67.5 1100 111.1 5 4 3 4 5 3 3 5 5 M 68.5 978 101.9 3 3 2 3 4 3 3 3 3
Avg. 65.2 101.5 3.5 3.7 2.2 3.2 3.5 2.7 3.6 3.2 3.1 S.D. 3.1 6.3 1.1 0.8 0.7 0.4 1.0 0.5 0.7 0.9 0.9
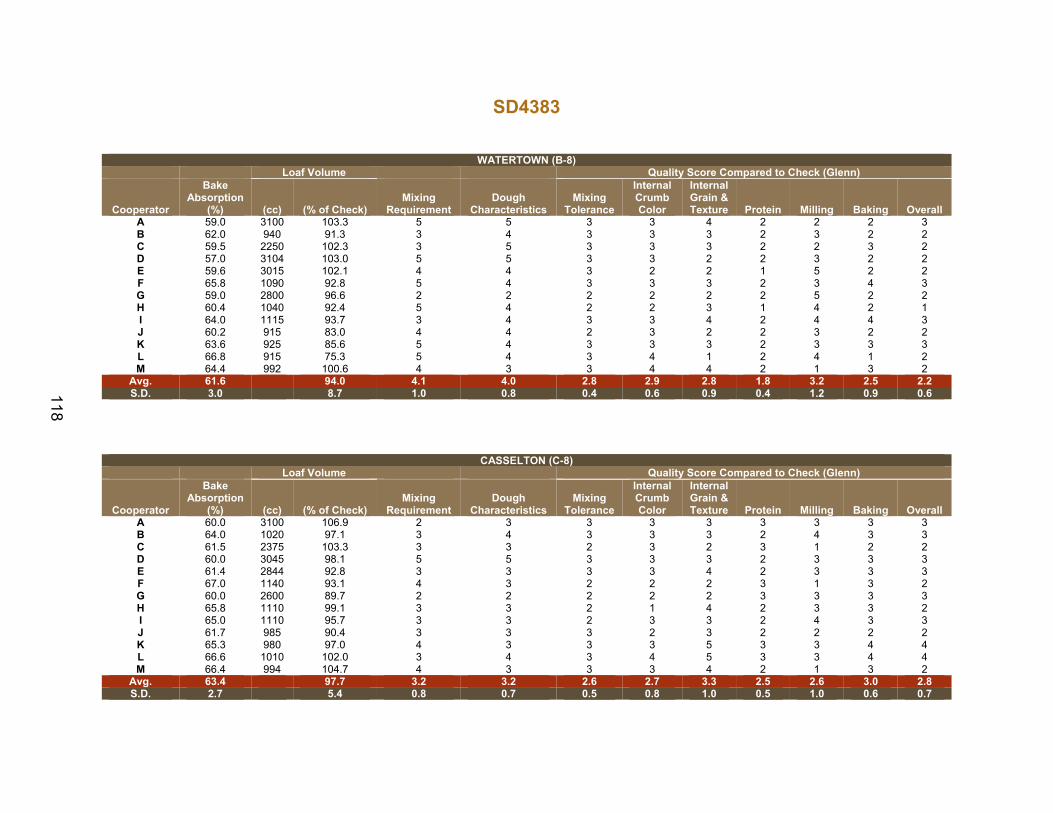
118
SD4383
WATERTOWN (B-8) Loaf Volume Quality Score Compared to Check (Glenn)
Cooperator
Bake Absorption
(%) (cc) (% of Check) Mixing
Requirement Dough
Characteristics Mixing
Tolerance
Internal Crumb Color
Internal Grain & Texture Protein Milling Baking Overall
A 59.0 3100 103.3 5 5 3 3 4 2 2 2 3 B 62.0 940 91.3 3 4 3 3 3 2 3 2 2 C 59.5 2250 102.3 3 5 3 3 3 2 2 3 2 D 57.0 3104 103.0 5 5 3 3 2 2 3 2 2 E 59.6 3015 102.1 4 4 3 2 2 1 5 2 2 F 65.8 1090 92.8 5 4 3 3 3 2 3 4 3 G 59.0 2800 96.6 2 2 2 2 2 2 5 2 2 H 60.4 1040 92.4 5 4 2 2 3 1 4 2 1 I 64.0 1115 93.7 3 4 3 3 4 2 4 4 3 J 60.2 915 83.0 4 4 2 3 2 2 3 2 2 K 63.6 925 85.6 5 4 3 3 3 2 3 3 3 L 66.8 915 75.3 5 4 3 4 1 2 4 1 2 M 64.4 992 100.6 4 3 3 4 4 2 1 3 2
Avg. 61.6 94.0 4.1 4.0 2.8 2.9 2.8 1.8 3.2 2.5 2.2 S.D. 3.0 8.7 1.0 0.8 0.4 0.6 0.9 0.4 1.2 0.9 0.6
CASSELTON (C-8) Loaf Volume Quality Score Compared to Check (Glenn)
Cooperator
Bake Absorption
(%) (cc) (% of Check) Mixing
Requirement Dough
Characteristics Mixing
Tolerance
Internal Crumb Color
Internal Grain & Texture Protein Milling Baking Overall
A 60.0 3100 106.9 2 3 3 3 3 3 3 3 3 B 64.0 1020 97.1 3 4 3 3 3 2 4 3 3 C 61.5 2375 103.3 3 3 2 3 2 3 1 2 2 D 60.0 3045 98.1 5 5 3 3 3 2 3 3 3 E 61.4 2844 92.8 3 3 3 3 4 2 3 3 3 F 67.0 1140 93.1 4 3 2 2 2 3 1 3 2 G 60.0 2600 89.7 2 2 2 2 2 3 3 3 3 H 65.8 1110 99.1 3 3 2 1 4 2 3 3 2 I 65.0 1110 95.7 3 3 2 3 3 2 4 3 3 J 61.7 985 90.4 3 3 3 2 3 2 2 2 2 K 65.3 980 97.0 4 3 3 3 5 3 3 4 4 L 66.6 1010 102.0 3 4 3 4 5 3 3 4 4 M 66.4 994 104.7 4 3 3 3 4 2 1 3 2
Avg. 63.4 97.7 3.2 3.2 2.6 2.7 3.3 2.5 2.6 3.0 2.8 S.D. 2.7 5.4 0.8 0.7 0.5 0.8 1.0 0.5 1.0 0.6 0.7

119
CROOKSTON (K-8) Loaf Volume Quality Score Compared to Check (Glenn)
Cooperator
Bake Absorption
(%) (cc) (% of Check) Mixing
Requirement Dough
Characteristics Mixing
Tolerance
Internal Crumb Color
Internal Grain & Texture Protein Milling Baking Overall
A 59.0 3050 100.0 5 5 3 3 4 3 3 3 3 B 63.0 1015 107.4 3 4 2 3 4 2 4 3 3 C 60.5 2225 102.3 2 3 2 2 3 2 2 3 2 D 58.0 3104 103.0 5 5 3 3 2 2 4 2 2 E 60.4 2973 95.0 2 3 2 3 4 1 4 3 4 F 66.5 1065 88.0 4 3 3 3 3 1 2 3 2 G 59.0 2550 91.1 2 1 1 1 2 2 4 2 2 H 66.2 1095 91.3 5 3 2 3 4 1 2 3 2 I 65.8 1135 100.9 3 3 3 2 2 1 5 3 2 J 60.1 933 91.2 3 3 3 2 3 2 3 2 2 K 66.1 995 88.4 5 2 3 3 5 2 3 5 4 L 66.9 1030 98.6 5 4 2 3 3 2 3 5 5 M 65.3 1026 105.9 4 3 2 4 4 2 1 3 2
Avg. 62.8 97.1 3.7 3.2 2.4 2.7 3.3 1.8 3.1 3.1 2.7 S.D. 3.4 6.7 1.3 1.1 0.7 0.8 0.9 0.6 1.1 1.0 1.0
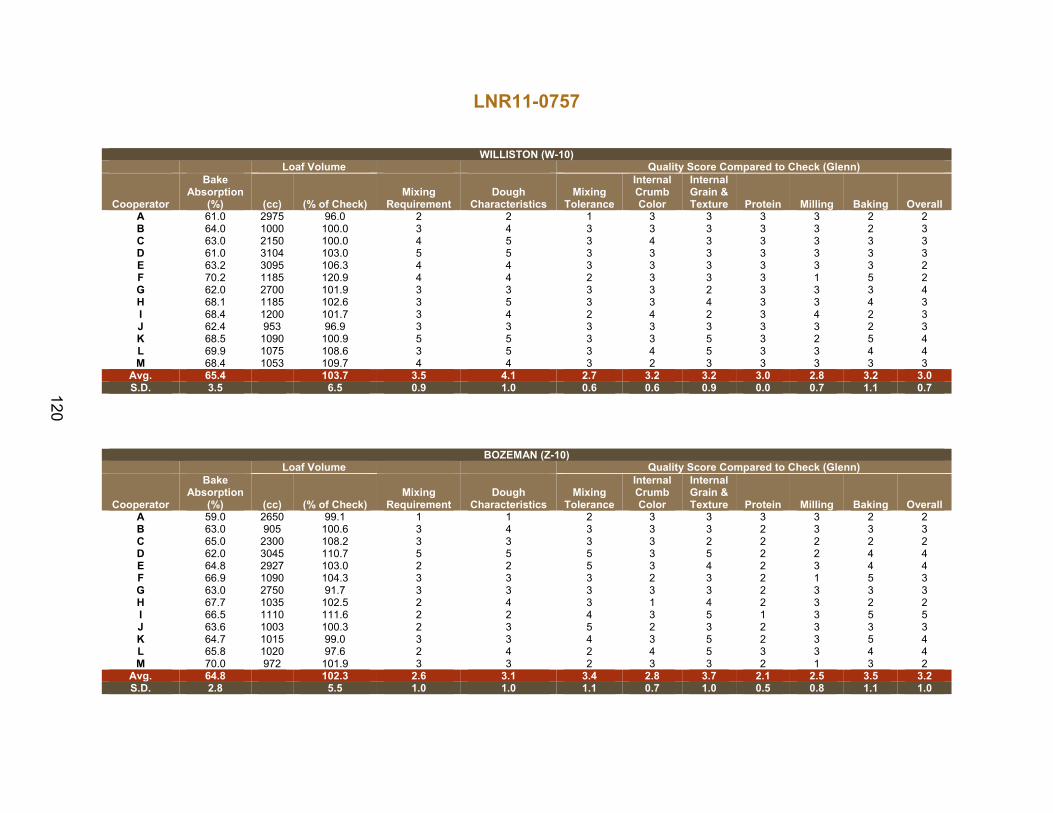
120
LNR11-0757
WILLISTON (W-10) Loaf Volume Quality Score Compared to Check (Glenn)
Cooperator
Bake Absorption
(%) (cc) (% of Check) Mixing
Requirement Dough
Characteristics Mixing
Tolerance
Internal Crumb Color
Internal Grain & Texture Protein Milling Baking Overall
A 61.0 2975 96.0 2 2 1 3 3 3 3 2 2 B 64.0 1000 100.0 3 4 3 3 3 3 3 2 3 C 63.0 2150 100.0 4 5 3 4 3 3 3 3 3 D 61.0 3104 103.0 5 5 3 3 3 3 3 3 3 E 63.2 3095 106.3 4 4 3 3 3 3 3 3 2 F 70.2 1185 120.9 4 4 2 3 3 3 1 5 2 G 62.0 2700 101.9 3 3 3 3 2 3 3 3 4 H 68.1 1185 102.6 3 5 3 3 4 3 3 4 3 I 68.4 1200 101.7 3 4 2 4 2 3 4 2 3 J 62.4 953 96.9 3 3 3 3 3 3 3 2 3 K 68.5 1090 100.9 5 5 3 3 5 3 2 5 4 L 69.9 1075 108.6 3 5 3 4 5 3 3 4 4 M 68.4 1053 109.7 4 4 3 2 3 3 3 3 3
Avg. 65.4 103.7 3.5 4.1 2.7 3.2 3.2 3.0 2.8 3.2 3.0 S.D. 3.5 6.5 0.9 1.0 0.6 0.6 0.9 0.0 0.7 1.1 0.7
BOZEMAN (Z-10) Loaf Volume Quality Score Compared to Check (Glenn)
Cooperator
Bake Absorption
(%) (cc) (% of Check) Mixing
Requirement Dough
Characteristics Mixing
Tolerance
Internal Crumb Color
Internal Grain & Texture Protein Milling Baking Overall
A 59.0 2650 99.1 1 1 2 3 3 3 3 2 2 B 63.0 905 100.6 3 4 3 3 3 2 3 3 3 C 65.0 2300 108.2 3 3 3 3 2 2 2 2 2 D 62.0 3045 110.7 5 5 5 3 5 2 2 4 4 E 64.8 2927 103.0 2 2 5 3 4 2 3 4 4 F 66.9 1090 104.3 3 3 3 2 3 2 1 5 3 G 63.0 2750 91.7 3 3 3 3 3 2 3 3 3 H 67.7 1035 102.5 2 4 3 1 4 2 3 2 2 I 66.5 1110 111.6 2 2 4 3 5 1 3 5 5 J 63.6 1003 100.3 2 3 5 2 3 2 3 3 3 K 64.7 1015 99.0 3 3 4 3 5 2 3 5 4 L 65.8 1020 97.6 2 4 2 4 5 3 3 4 4 M 70.0 972 101.9 3 3 2 3 3 2 1 3 2
Avg. 64.8 102.3 2.6 3.1 3.4 2.8 3.7 2.1 2.5 3.5 3.2 S.D. 2.8 5.5 1.0 1.0 1.1 0.7 1.0 0.5 0.8 1.1 1.0
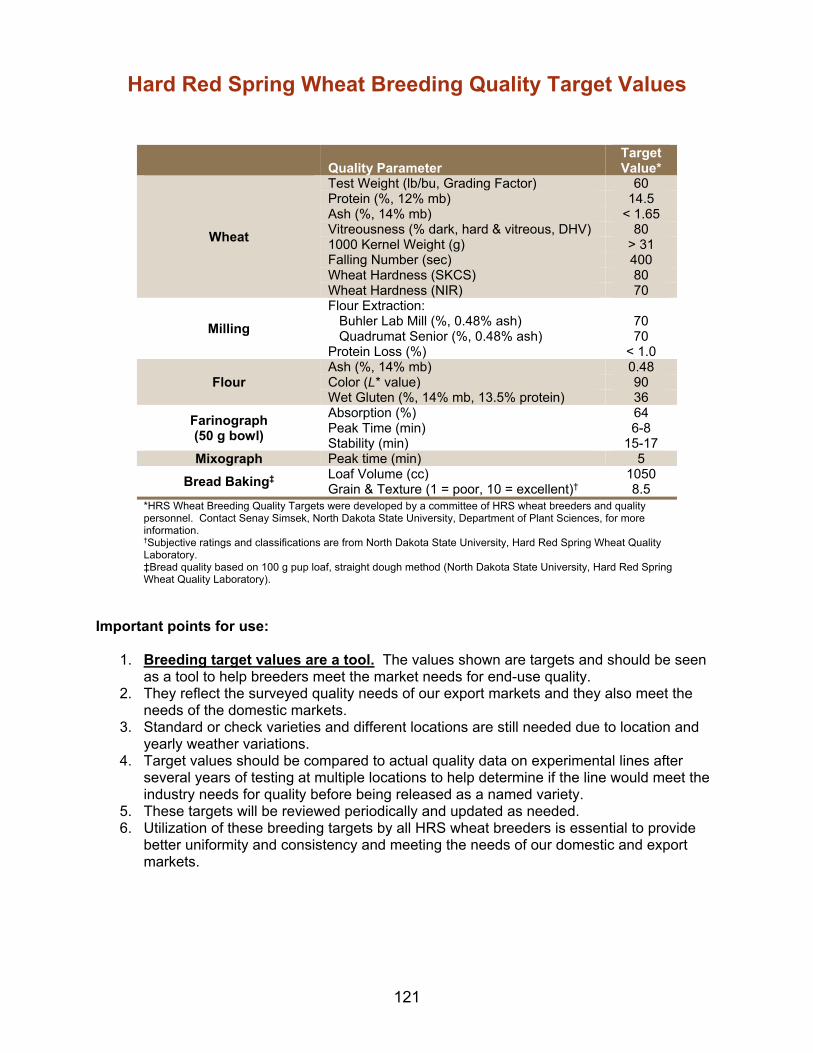
121
Hard Red Spring Wheat Breeding Quality Target Values
Quality Parameter Target Value*
Wheat
Test Weight (lb/bu, Grading Factor) 60 Protein (%, 12% mb) 14.5 Ash (%, 14% mb) < 1.65 Vitreousness (% dark, hard & vitreous, DHV) 80 1000 Kernel Weight (g) > 31 Falling Number (sec) 400 Wheat Hardness (SKCS) 80 Wheat Hardness (NIR) 70
Milling
Flour Extraction: Buhler Lab Mill (%, 0.48% ash) 70 Quadrumat Senior (%, 0.48% ash) 70 Protein Loss (%) < 1.0
Flour Ash (%, 14% mb) 0.48 Color (L* value) 90 Wet Gluten (%, 14% mb, 13.5% protein) 36
Farinograph (50 g bowl)
Absorption (%) 64 Peak Time (min) 6-8 Stability (min) 15-17
Mixograph Peak time (min) 5
Bread Baking‡ Loaf Volume (cc) 1050 Grain & Texture (1 = poor, 10 = excellent)† 8.5
*HRS Wheat Breeding Quality Targets were developed by a committee of HRS wheat breeders and quality personnel. Contact Senay Simsek, North Dakota State University, Department of Plant Sciences, for more information. †Subjective ratings and classifications are from North Dakota State University, Hard Red Spring Wheat Quality Laboratory. ‡Bread quality based on 100 g pup loaf, straight dough method (North Dakota State University, Hard Red Spring Wheat Quality Laboratory).
Important points for use:
1. Breeding target values are a tool. The values shown are targets and should be seen as a tool to help breeders meet the market needs for end-use quality.
2. They reflect the surveyed quality needs of our export markets and they also meet the needs of the domestic markets.
3. Standard or check varieties and different locations are still needed due to location and yearly weather variations.
4. Target values should be compared to actual quality data on experimental lines after several years of testing at multiple locations to help determine if the line would meet the industry needs for quality before being released as a named variety.
5. These targets will be reviewed periodically and updated as needed. 6. Utilization of these breeding targets by all HRS wheat breeders is essential to provide
better uniformity and consistency and meeting the needs of our domestic and export markets.