Embed Size (px)
Citation preview
Where is the end of the EU-rope
Richard Baldwin Graduate Institute, Geneva and University of Oxford
11 May 2013, Innsbruck
Plan of talk
• Misthinking globalisation
• What it means for future of Europe
– Membership
– Depth
Misthinking globalisation
• Conventional:
– Autarky to free trade, slowly.
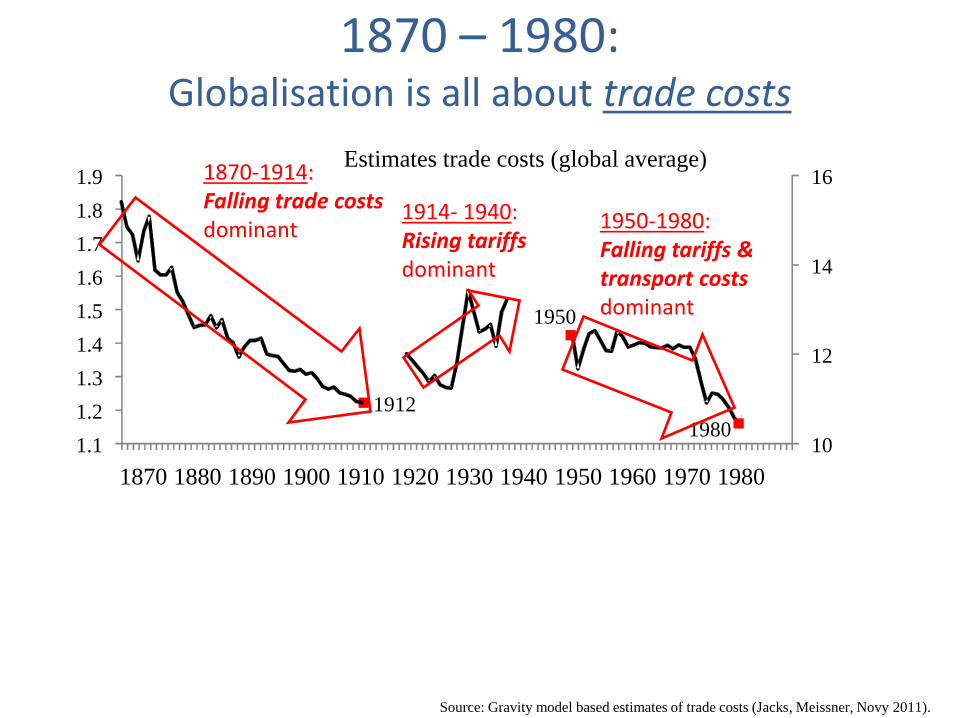
1870 – 1980: Globalisation is all about trade costs
1870 1880 1890 1900 1910 1920 1930 1940 1950 1960 1970 1980
16
1.1 10
12
14
1.2
1.3
1.4
1.5
1.6
1.7
1.8
1.9
1912
1870-1914: Falling trade costs dominant
1914- 1940: Rising tariffs dominant
1950
1980
1950-1980: Falling tariffs & transport costs dominant
Source: Gravity model based estimates of trade costs (Jacks, Meissner, Novy 2011).
Estimates trade costs (global average)
1870 1880 1890 1900 1910 1920 1930 1940 1950 1960 1970 1980
16
1.1 10
12
14
1.2
1.3
1.4
1.5
1.6
1.7
1.8
1.9
1912
1950
1980
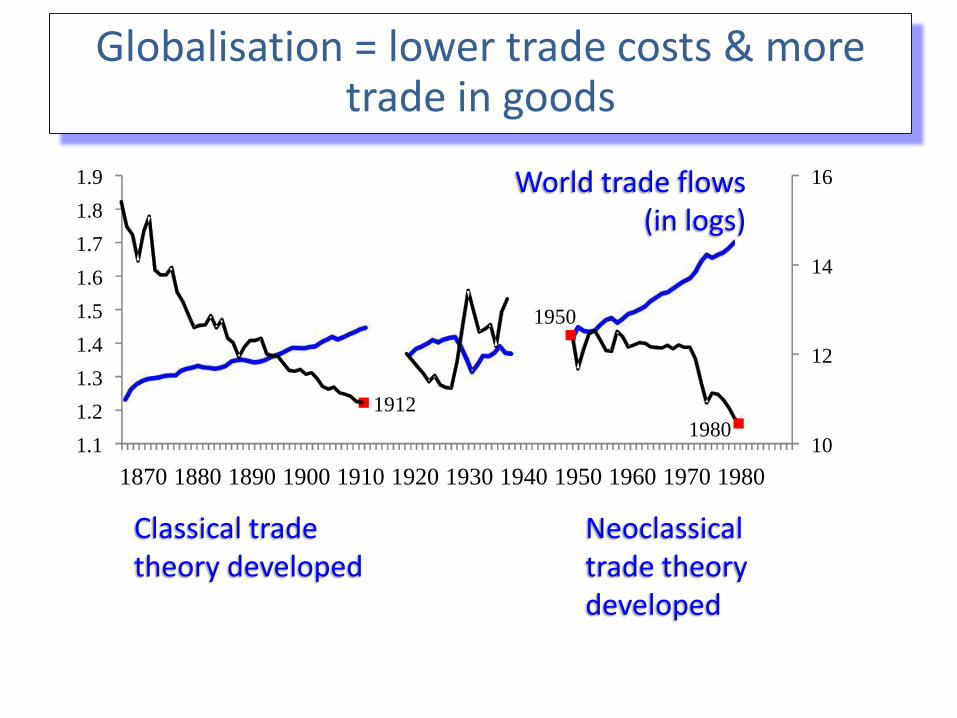
World trade flows (in logs)
Classical trade theory developed
Neoclassical trade theory developed
Add trade flows Globalisation = lower trade costs & more trade in goods
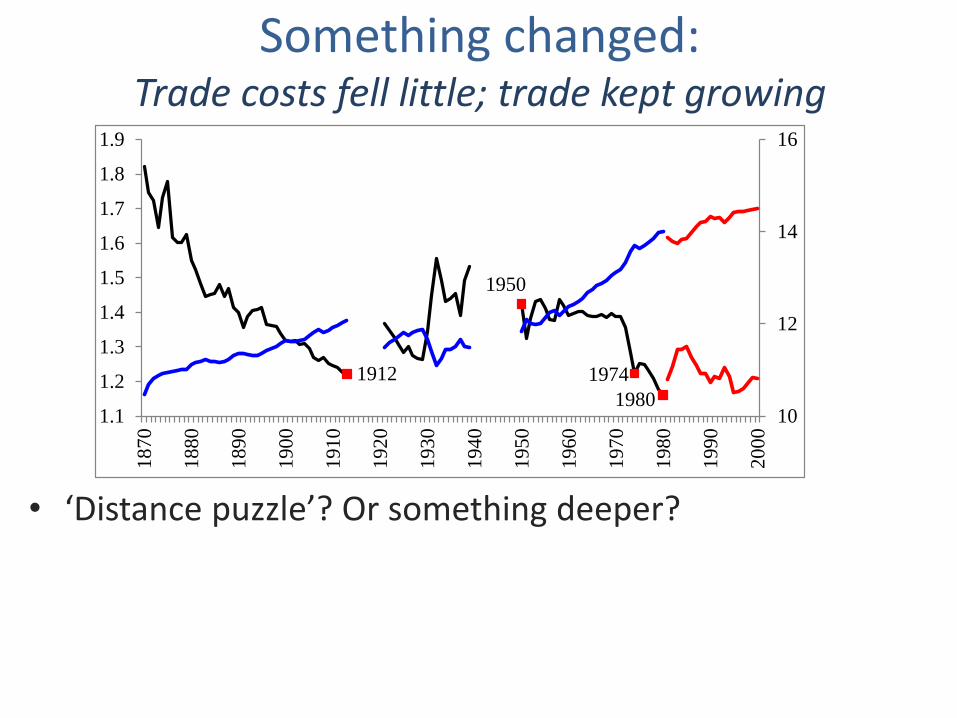
Something changed: Trade costs fell little; trade kept growing
• ‘Distance puzzle’? Or something deeper?
1912
1950
1974
198010
12
14
16
1.1
1.2
1.3
1.4
1.5
1.6
1.7
1.8
1.91
87
0
1880
18
90
19
00
19
10
19
20
19
30
19
40
1950
19
60
19
70
19
80
19
90
20
00
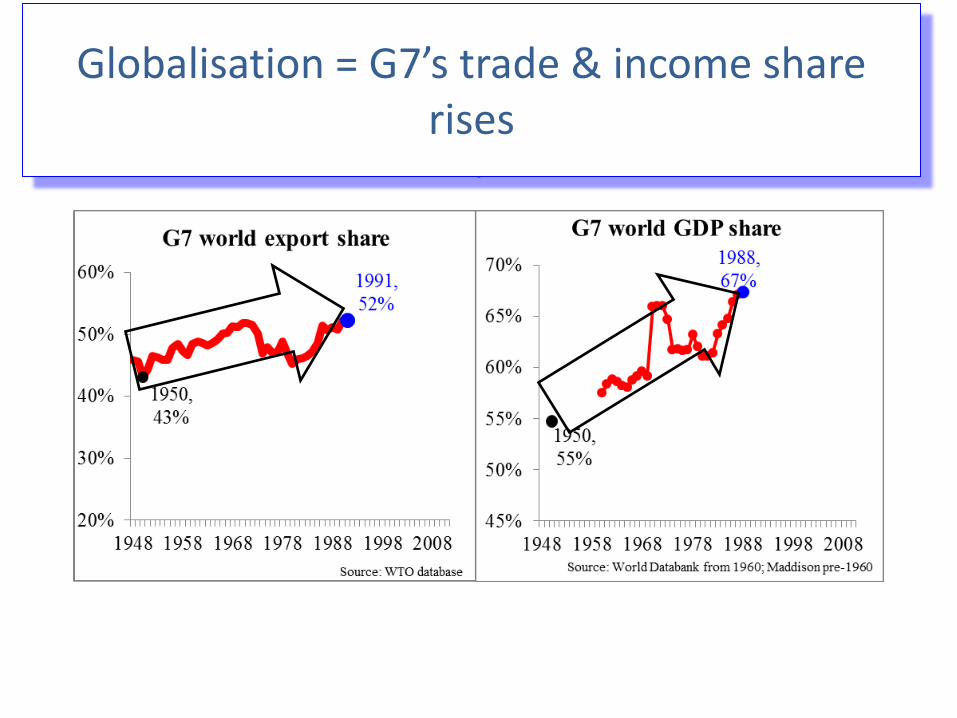
Big picture impact, 1870-1980s
• G7’s share of world exports & income
Globalisation = G7’s trade & income share rises
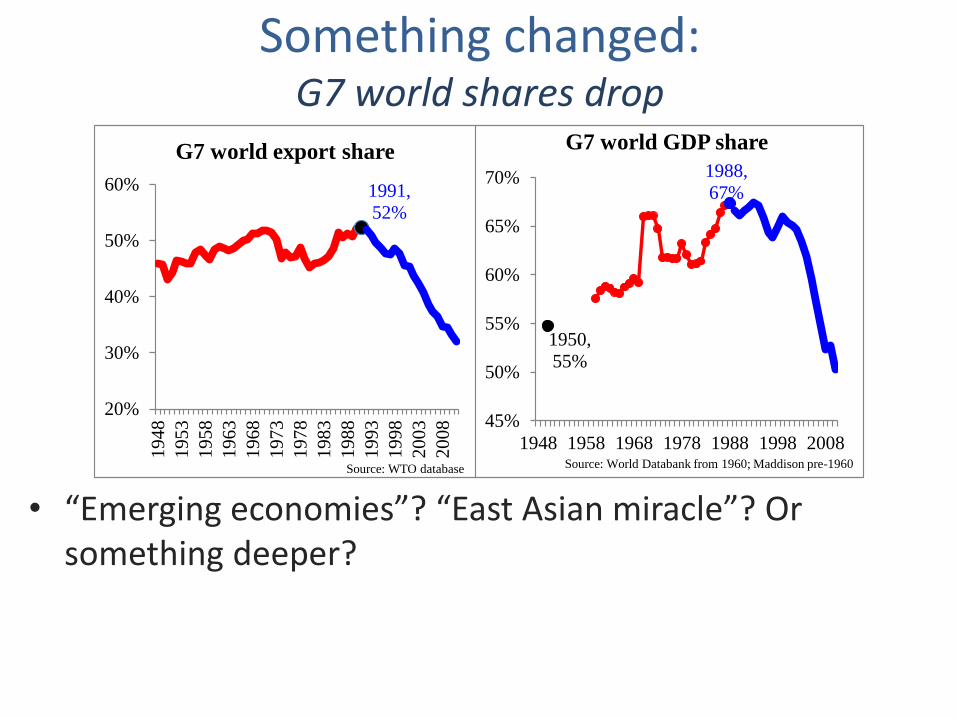
Something changed: G7 world shares drop
• “Emerging economies”? “East Asian miracle”? Or something deeper?
1991,
52%
20%
30%
40%
50%
60%
19
48
19
53
1958
19
63
19
68
19
73
19
78
19
83
19
88
19
93
19
98
20
03
20
08
Source: WTO database
G7 world export share
1950,
55%
1988,
67%
45%
50%
55%
60%
65%
70%
1948 1958 1968 1978 1988 1998 2008Source: World Databank from 1960; Maddison pre-1960
G7 world GDP share
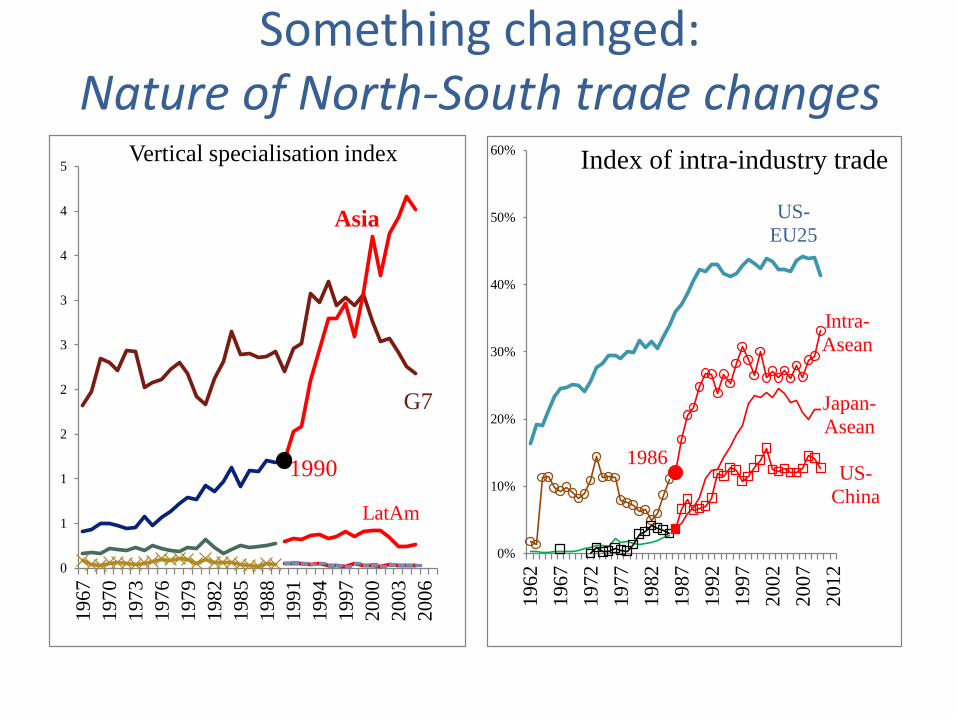
Something changed: Nature of North-South trade changes
US-
EU25
1986
Intra-
Asean
Japan-
Asean
US-
China
0%
10%
20%
30%
40%
50%
60%
1962
1967
1972
1977
1982
1987
1992
1997
2002
2007
2012
Index of intra-industry trade
G7
1990
Asia
LatAm
0
1
1
2
2
3
3
4
4
5
1967
1970
1973
1976
1979
1982
1985
1988
1991
1994
1997
2000
2003
2006
Vertical specialisation index
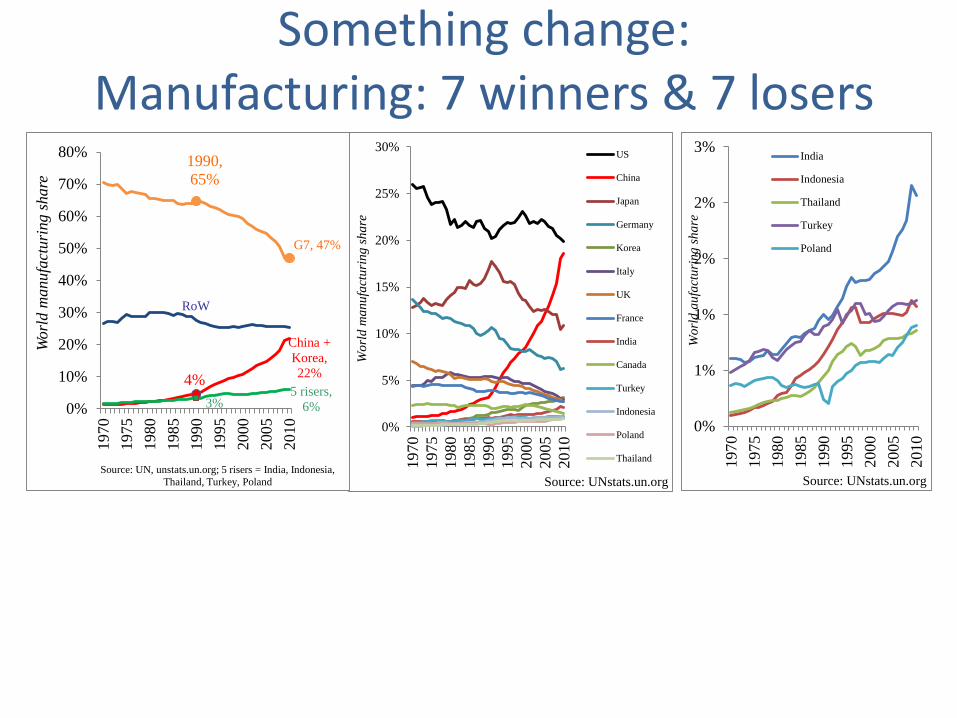
Something change: Manufacturing: 7 winners & 7 losers
0%
1%
1%
2%
2%
3%
1970
1975
1980
1985
1990
1995
2000
2005
2010
Wo
rld
au
fact
uri
ng
sh
are
Source: UNstats.un.org
India
Indonesia
Thailand
Turkey
Poland
0%
5%
10%
15%
20%
25%
30%
1970
1975
1980
1985
1990
1995
2000
2005
2010
Wo
rld
ma
nu
fact
uri
ng
sh
are
Source: UNstats.un.org
US
China
Japan
Germany
Korea
Italy
UK
France
India
Canada
Turkey
Indonesia
Poland
Thailand
1990,
65%
G7, 47%
4%
China +
Korea,
22%
3%5 risers,
6%
RoW
0%
10%
20%
30%
40%
50%
60%
70%
80%
1970
1975
1980
1985
1990
1995
2000
2005
2010
Worl
d m
anufa
cturi
ng s
hare
Source: UN, unstats.un.org; 5 risers = India, Indonesia,
Thailand, Turkey, Poland
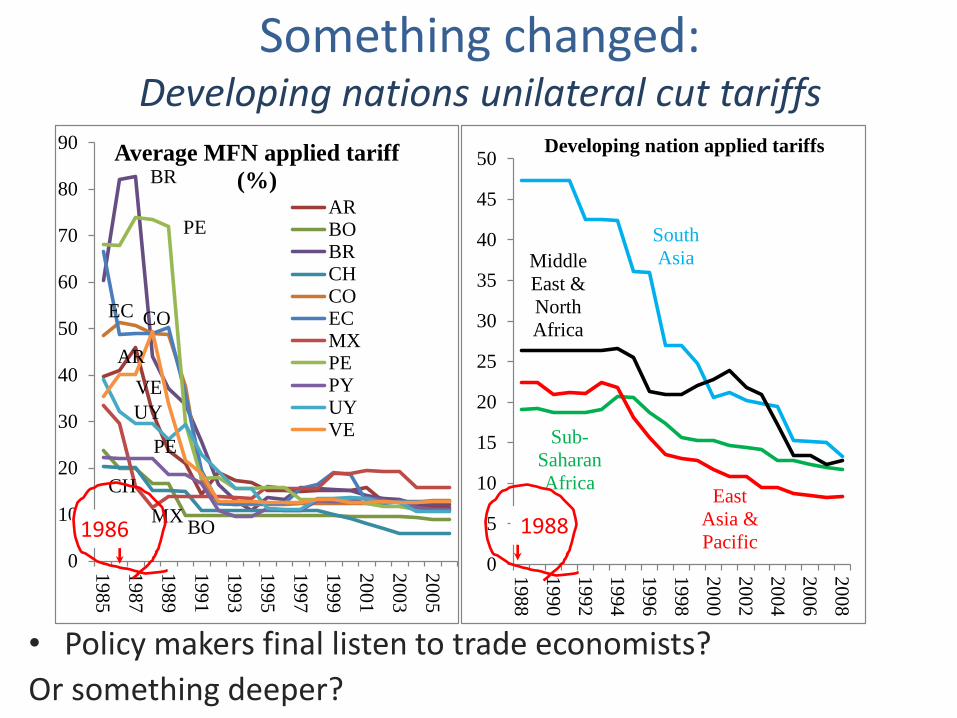
Something changed: Developing nations unilateral cut tariffs
• Policy makers final listen to trade economists?
Or something deeper?
AR
BO
BR
CH
COEC
MX
PE
PE
UY
VE
0
10
20
30
40
50
60
70
80
90
19
85
19
87
19
89
19
91
1993
19
95
19
97
19
99
20
01
20
03
20
05
Average MFN applied tariff
(%)ARBOBRCHCOECMXPEPYUYVE
South
Asia
Sub-
Saharan
Africa
Middle
East &
North
Africa
East
Asia &
Pacific0
5
10
15
20
25
30
35
40
45
50
1988
19
90
19
92
19
94
19
96
1998
20
00
20
02
20
04
20
06
2008
Developing nation applied tariffs
1986 1988
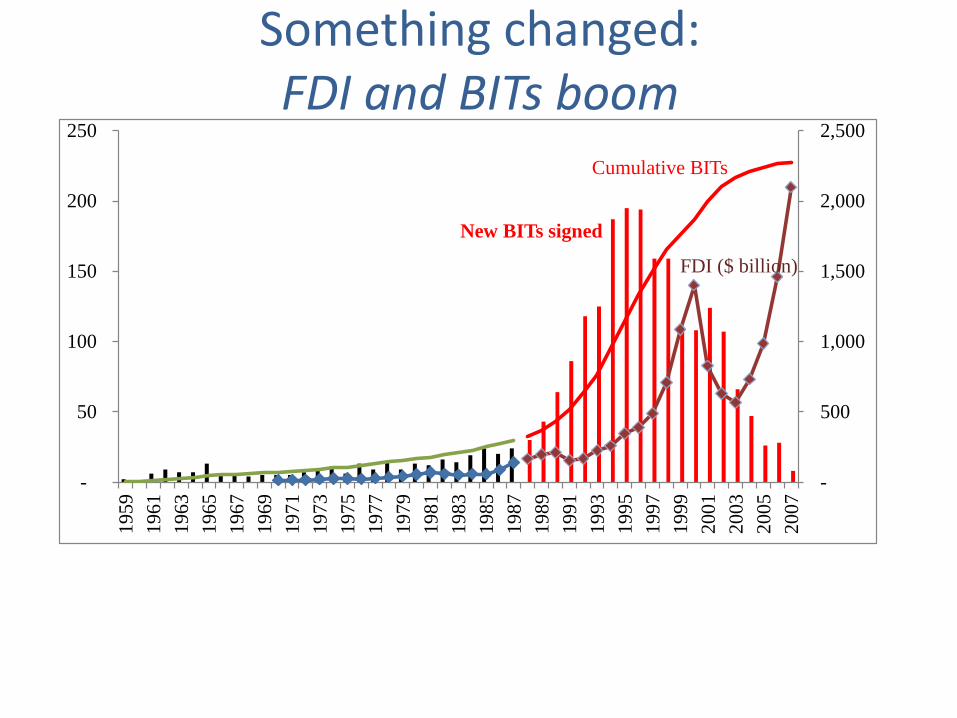
Something changed: FDI and BITs boom
New BITs signed
Cumulative BITs
FDI ($ billion)
-
500
1,000
1,500
2,000
2,500
-
50
100
150
200
2501959
19
61
19
63
19
65
19
67
19
69
19
71
19
73
19
75
19
77
19
79
1981
19
83
19
85
19
87
19
89
19
91
19
93
19
95
19
97
19
99
2001
20
03
20
05
20
07
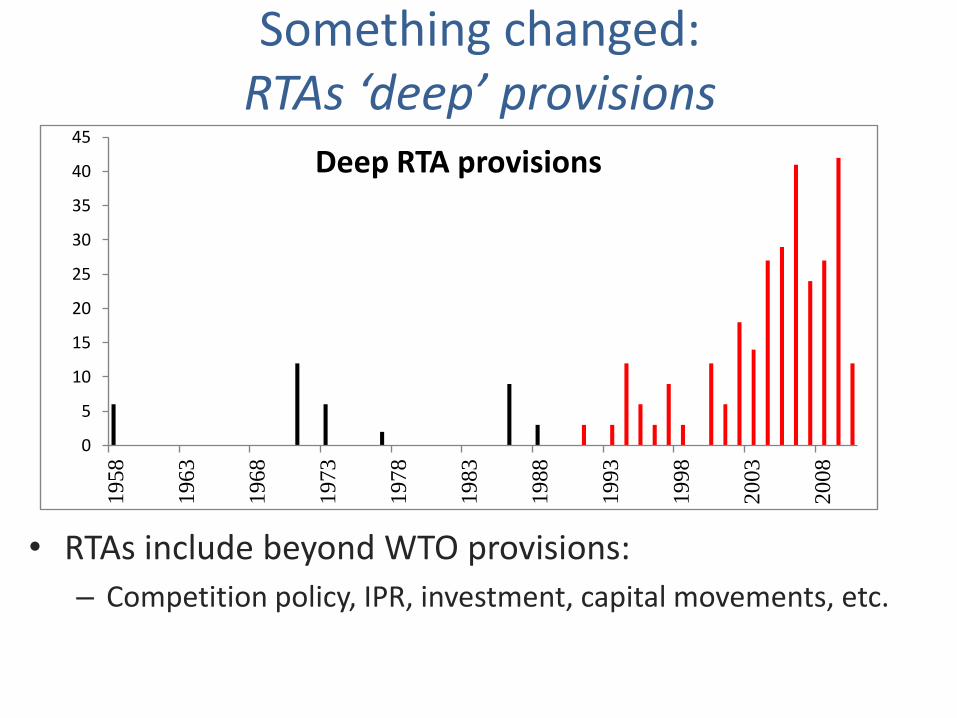
Something changed: RTAs ‘deep’ provisions
• RTAs include beyond WTO provisions:
– Competition policy, IPR, investment, capital movements, etc.
0
5
10
15
20
25
30
35
40
451958
1963
1968
1973
1978
1983
1988
1993
1998
2003
2008
Deep RTA provisions

What changed?
Stage B Stage A
Stage C
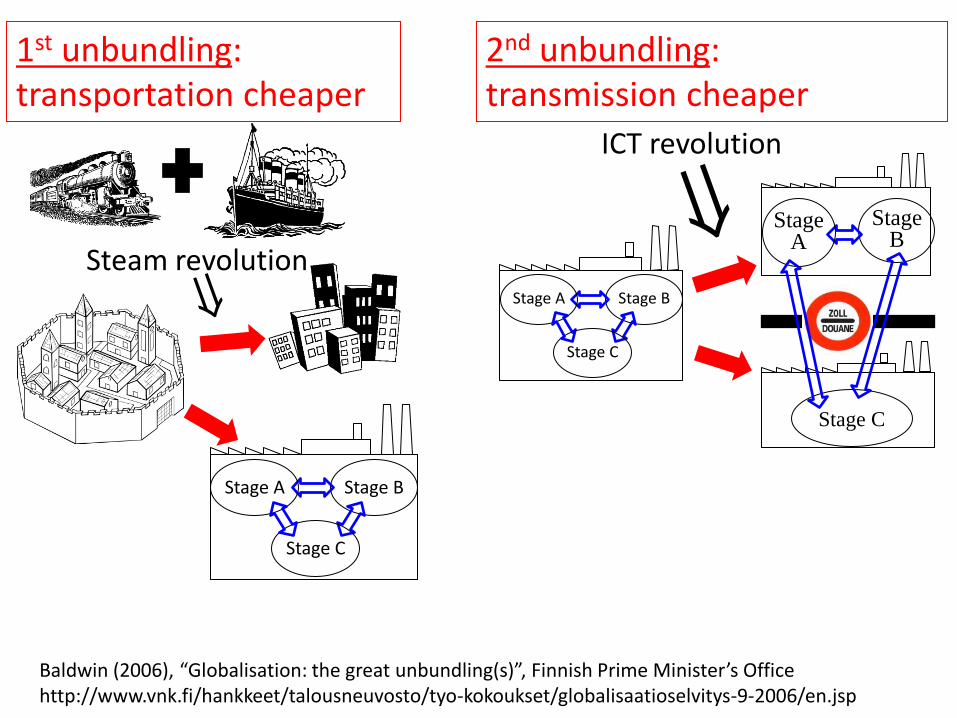
Steam revolution
1st unbundling: transportation cheaper
Baldwin (2006), “Globalisation: the great unbundling(s)”, Finnish Prime Minister’s Office http://www.vnk.fi/hankkeet/talousneuvosto/tyo-kokoukset/globalisaatioselvitys-9-2006/en.jsp
ICT revolution
2nd unbundling: transmission cheaper
Stage B
Stage A
Stage C
Stage B Stage A
Stage C
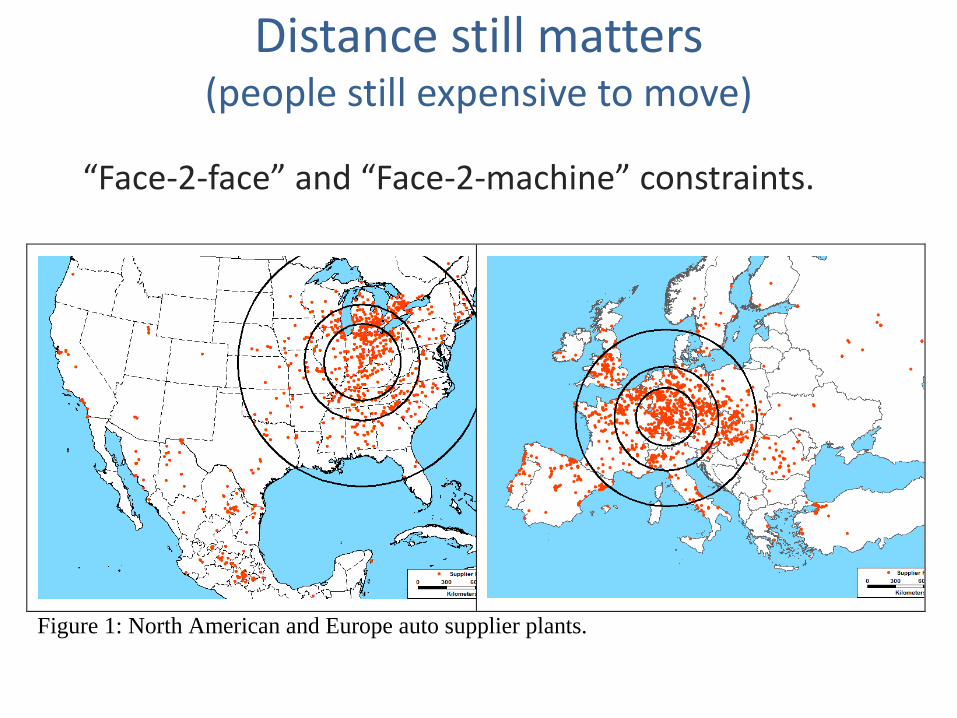
Distance still matters (people still expensive to move)
“Face-2-face” and “Face-2-machine” constraints.
Figure 1: North American and Europe auto supplier plants.
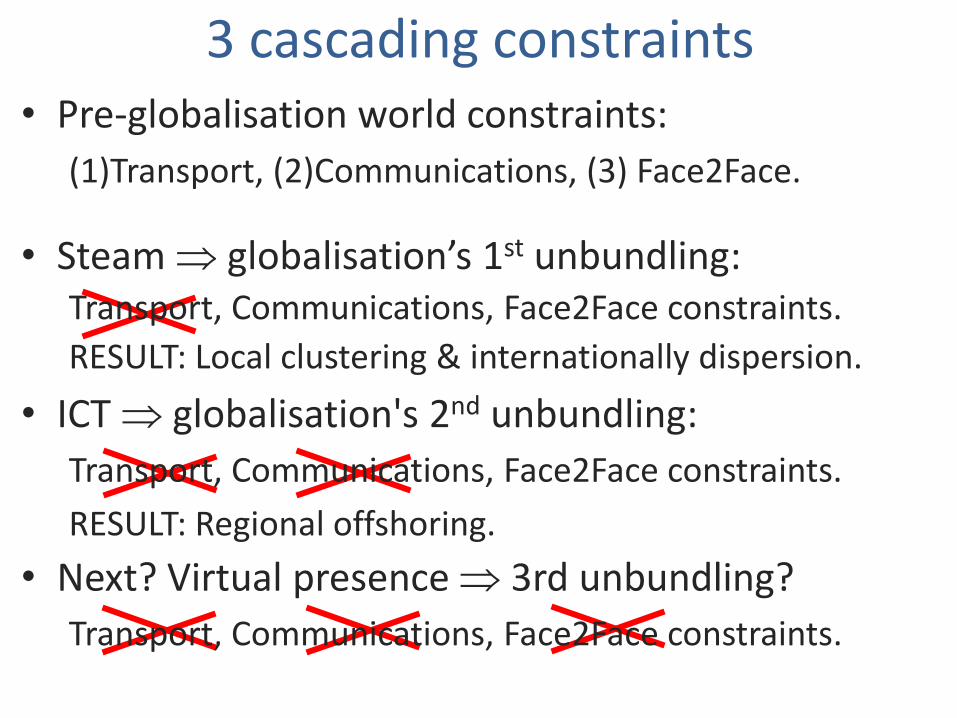
3 cascading constraints • Pre-globalisation world constraints:
(1)Transport, (2)Communications, (3) Face2Face.
• Next? Virtual presence 3rd unbundling?
Transport, Communications, Face2Face constraints.
• Steam globalisation’s 1st unbundling: Transport, Communications, Face2Face constraints.
RESULT: Local clustering & internationally dispersion.
• ICT globalisation's 2nd unbundling:
Transport, Communications, Face2Face constraints.
RESULT: Regional offshoring.
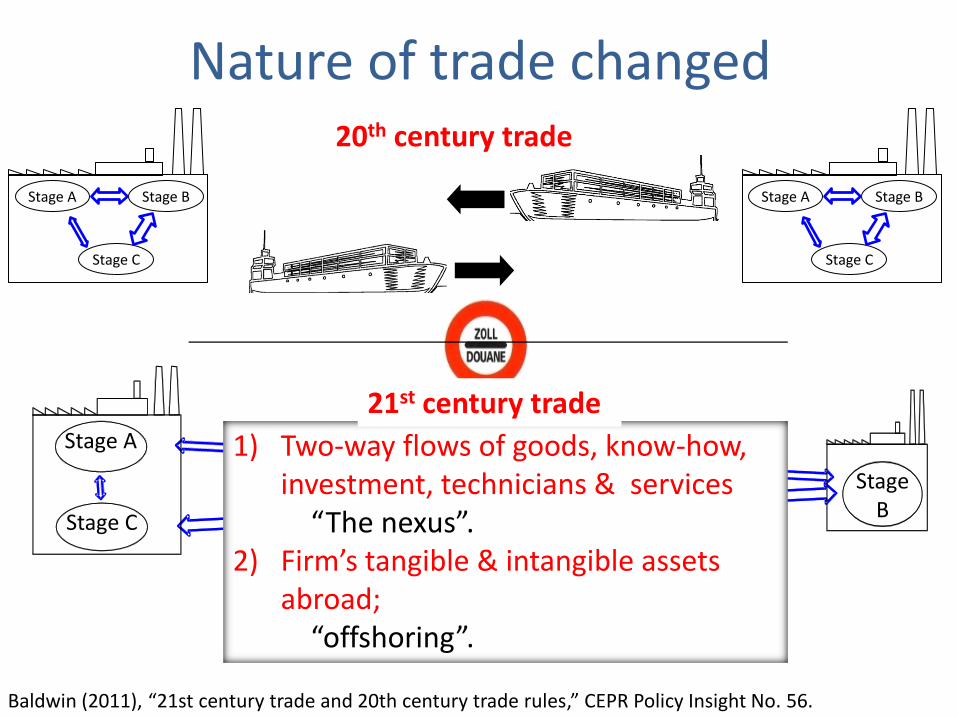
Nature of trade changed 20th century trade
Baldwin (2011), “21st century trade and 20th century trade rules,” CEPR Policy Insight No. 56.
Stage B
Stage A
Stage C
1) Two-way flows of goods, know-how, investment, technicians & services
“The nexus”. 2) Firm’s tangible & intangible assets
abroad; “offshoring”.
21st century trade
Stage B Stage A
Stage C
Stage B Stage A
Stage C

Elephant = Know-how easier to move.
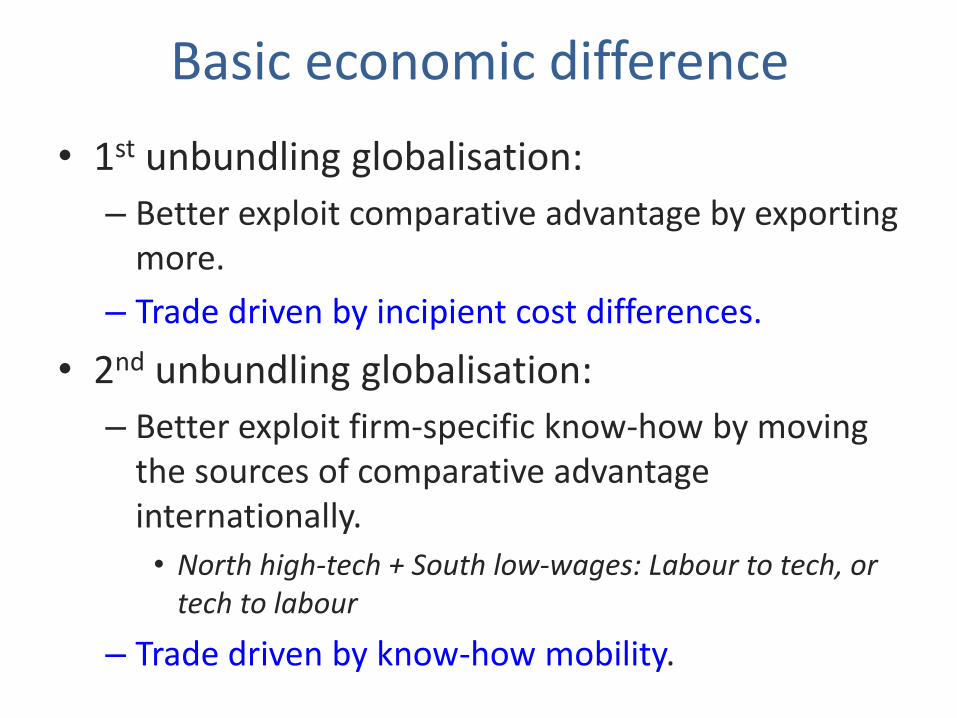
Basic economic difference
• 1st unbundling globalisation:
– Better exploit comparative advantage by exporting more.
– Trade driven by incipient cost differences.
• 2nd unbundling globalisation:
– Better exploit firm-specific know-how by moving the sources of comparative advantage internationally.
• North high-tech + South low-wages: Labour to tech, or tech to labour
– Trade driven by know-how mobility.
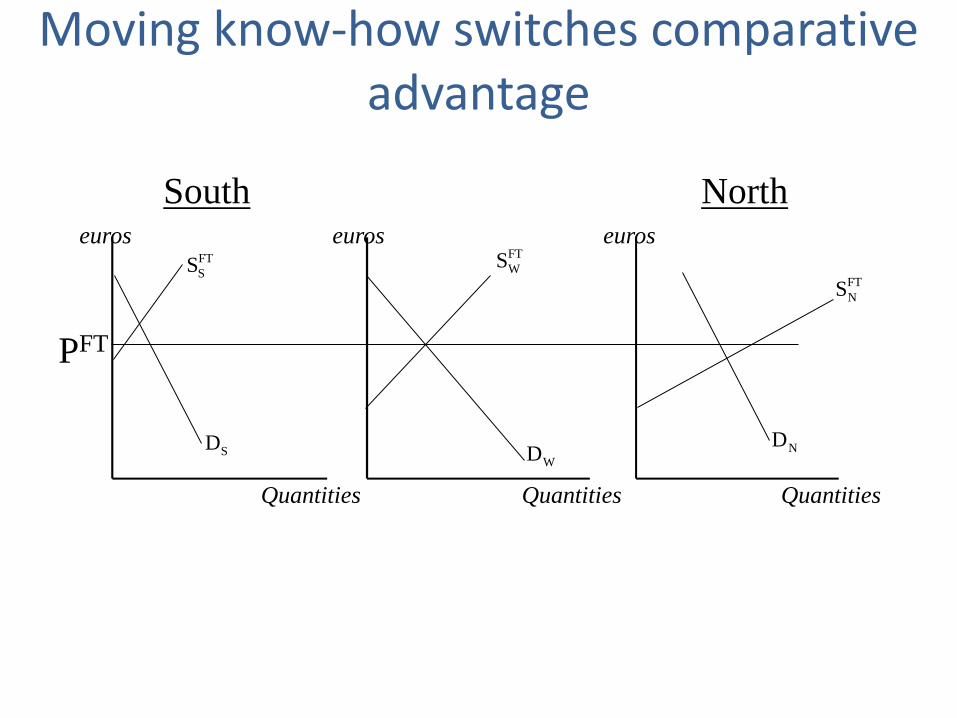
FT
WS
WD
Quantities
euros
FT
NS
Quantities
euros FT
SS
PFT
Quantities
euros
NDSD
Moving know-how switches comparative advantage
North South
FT
WS
WD
Quantities
euros
FT
NS
Quantities
euros FT
SS
PFT
Quantities
euros
NDSD
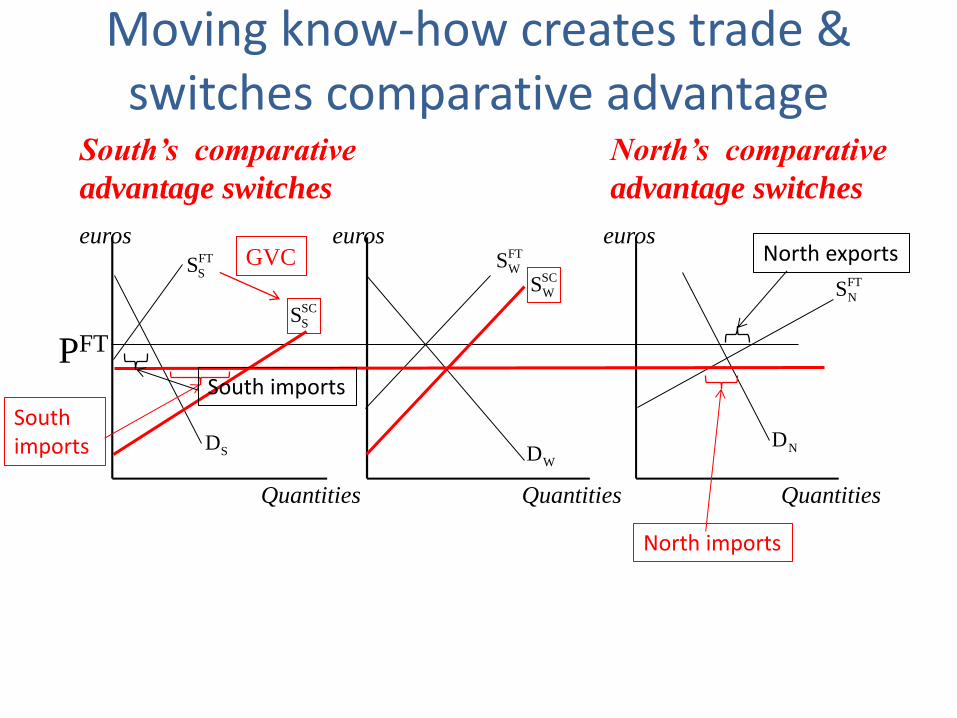
Moving know-how creates trade & switches comparative advantage
North South
South’s comparative
advantage switches
North’s comparative
advantage switches
SC
WSSC
SS
GVC
South imports
North imports
North exports
South imports
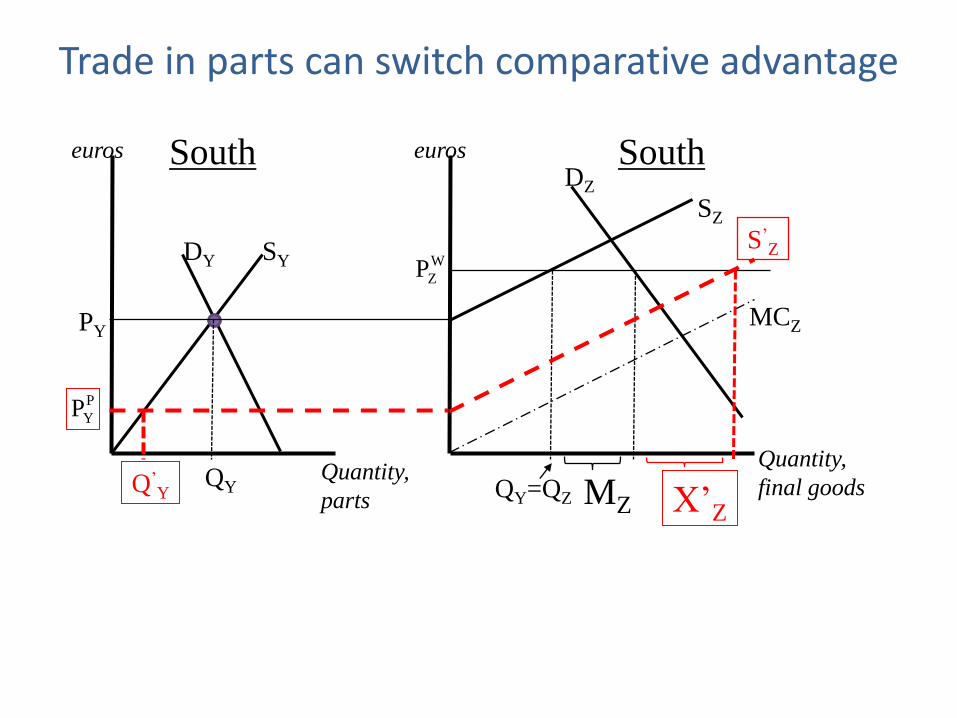
Quantity,
parts
DY
SZ
DZ
euros euros
MCZ
Quantity,
final goods QY=QZ
SY W
ZP
PY
MZ
Trade in parts can switch comparative advantage
QY
South South
S’Z
P
YP
X’Z
Q’Y
GVC revolution gets data
• Gary Gereffi working on GVC for years.
– http://www.globalvaluechains.org/concepts.html
– Theory in 1960s, 1970s, 1980s, 1990s, 2000s.
• New data changes everything:
– WIOD.org dataset
• Timmer et al. papers
– TiVA dataset
– GTAP dataset work
• Johnson & Noguera paper
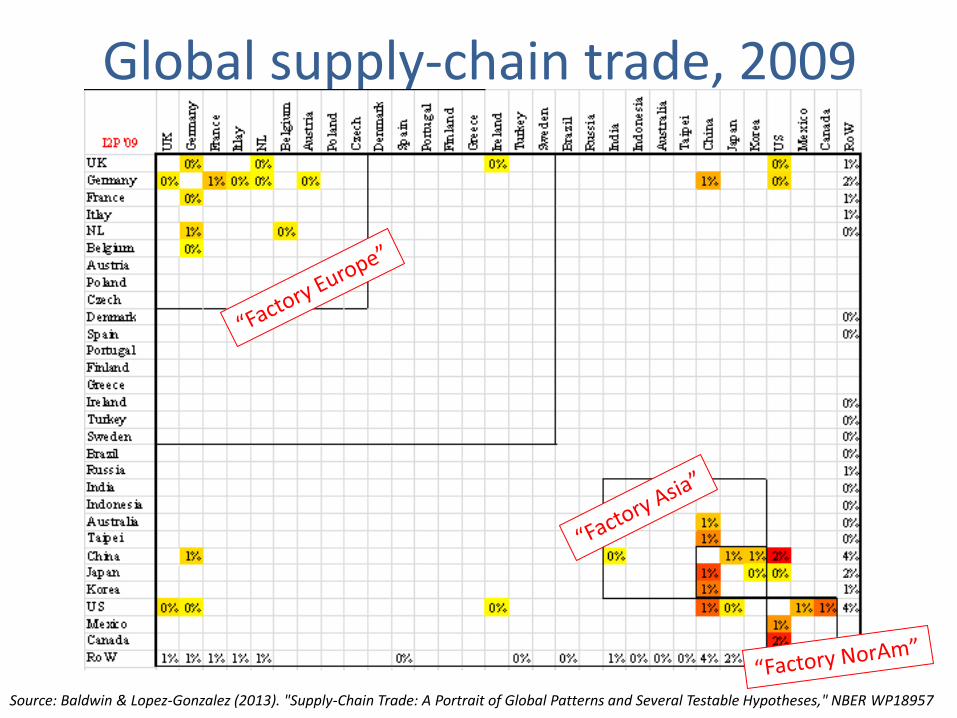
Global supply-chain trade, 2009
Source: Baldwin & Lopez-Gonzalez (2013). "Supply-Chain Trade: A Portrait of Global Patterns and Several Testable Hypotheses," NBER WP18957
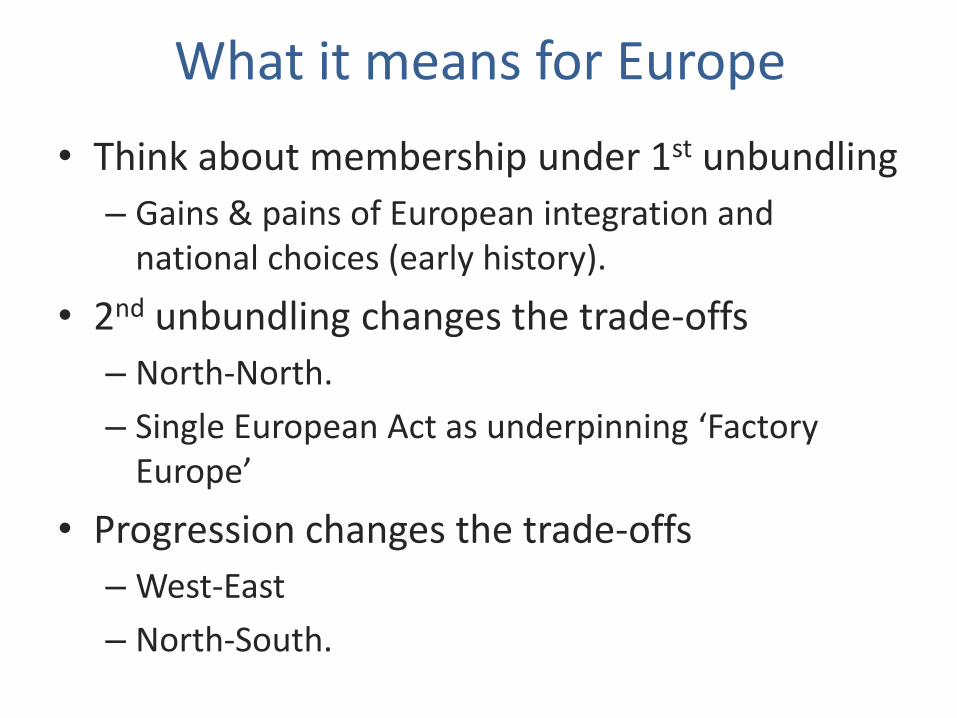
What it means for Europe
• Think about membership under 1st unbundling
– Gains & pains of European integration and national choices (early history).
• 2nd unbundling changes the trade-offs
– North-North.
– Single European Act as underpinning ‘Factory Europe’
• Progression changes the trade-offs
– West-East
– North-South.
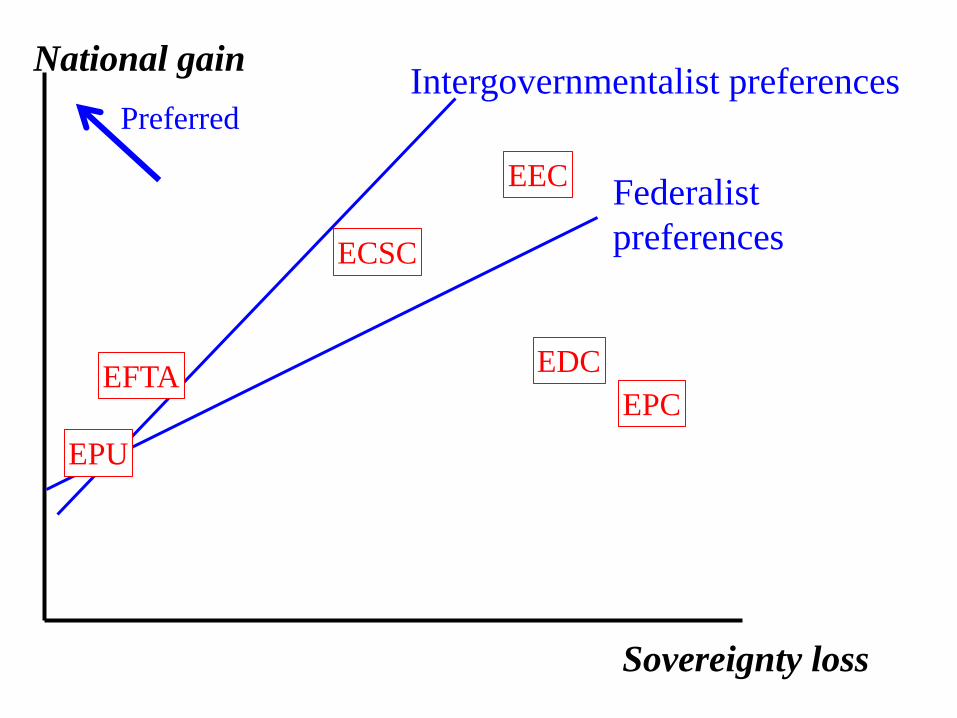
Thinking about integration
• Gains from integration = economic benefit.
• Pains from integration = loss of sovereignty.
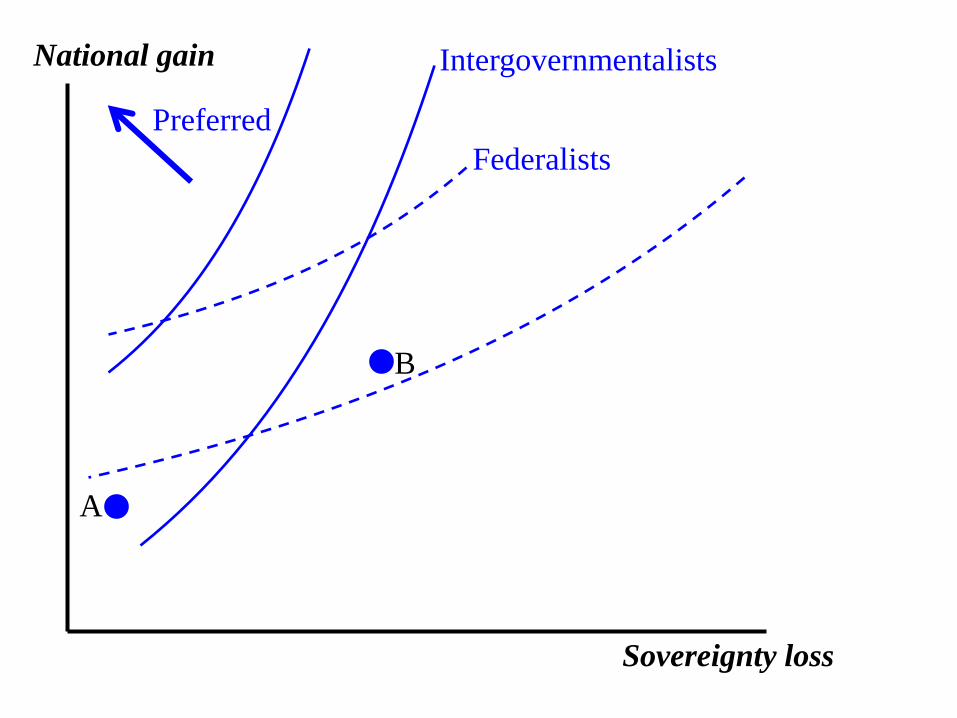
National gain
Sovereignty loss
A
B
Preferred
Federalists
Intergovernmentalists
National gain
Sovereignty loss
Intergovernmentalist preferences
Federalist
preferences
EPU
EDC
ECSC
EPC
EEC
EFTA
Preferred
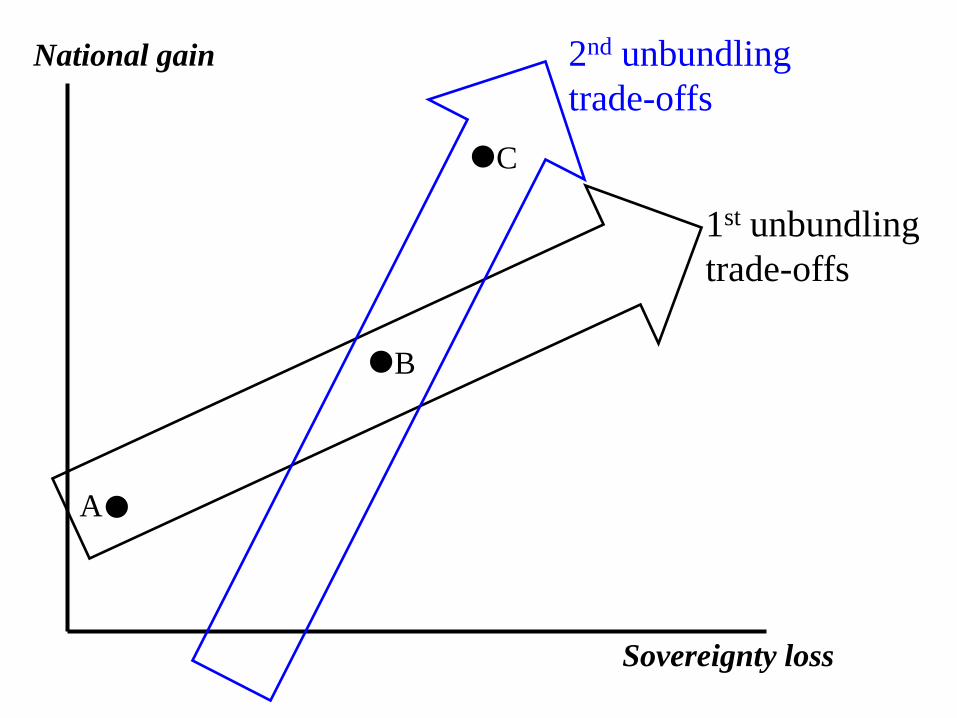
National gain
Sovereignty loss
A
1st unbundling
trade-offs
B
2nd unbundling
trade-offs
C
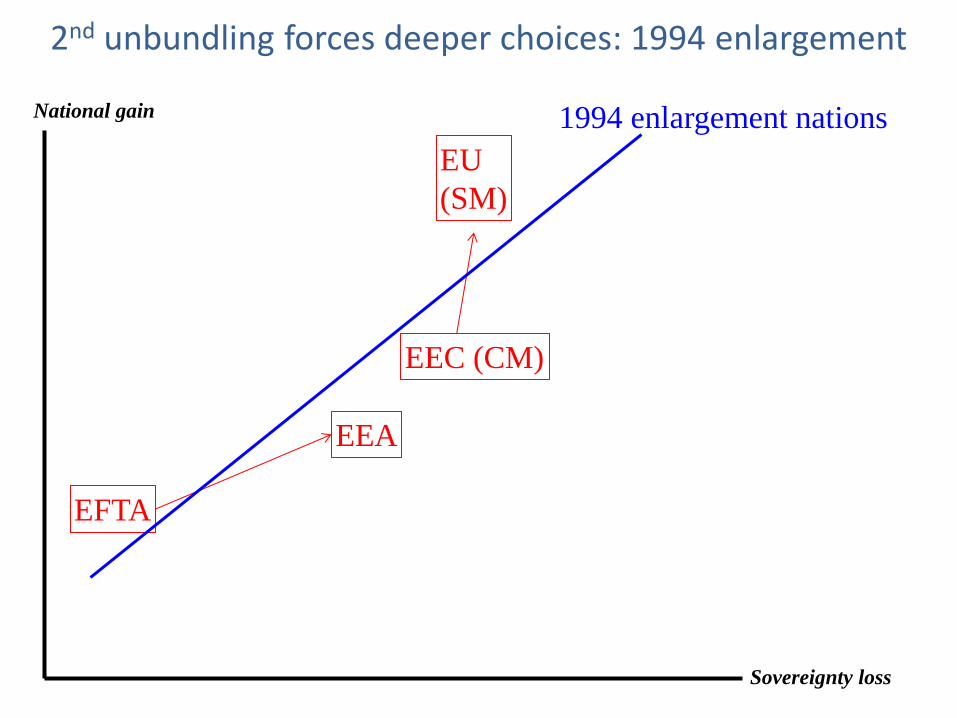
National gain
Sovereignty loss
EEC (CM)
EFTA
EU
(SM)
EEA
1994 enlargement nations
2nd unbundling forces deeper choices: 1994 enlargement
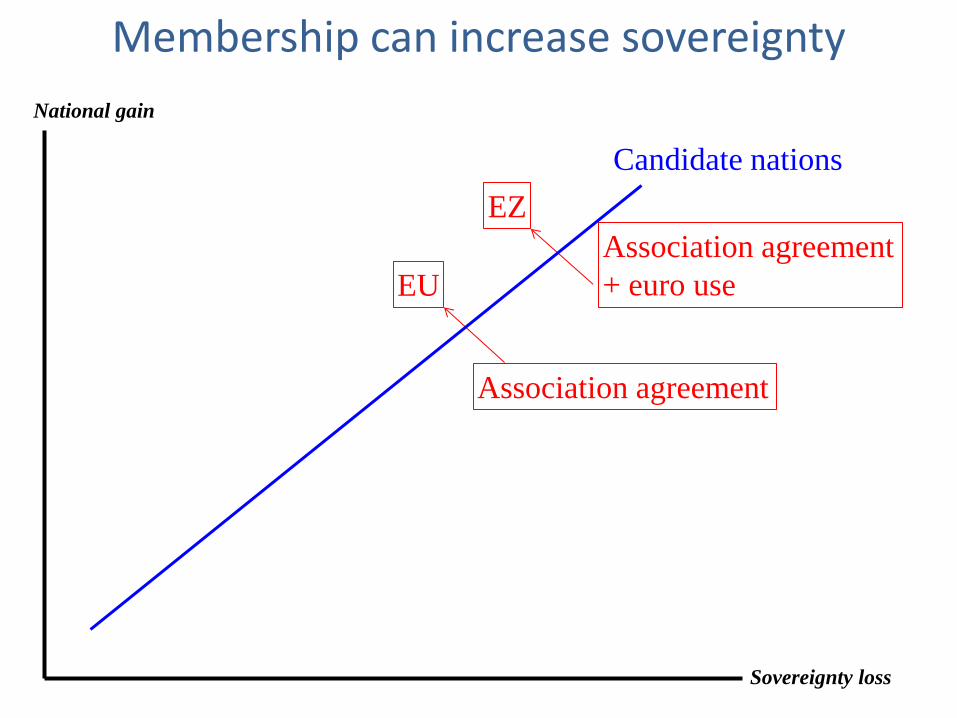
Candidate nations
EU
EZ
Association agreement
Association agreement
+ euro use
National gain
Sovereignty loss
Membership can increase sovereignty
“Supply” of membership
• Do incumbents want newcomers to join?
• Dialectic process:
– Enlargement brings in more diversity of preferences.
– After struggling with unified approach, flexible integration starts.
– Institutions rearranged to deal with large number of members.
– Enlargement gets easier.
– Repeat.
• Suggests that enlargement is not near the end but EU will change along the way.
Back to international supply chains
• To date, most of ‘Factory Europe’ is inside EU.
– Turkey, Tunisia, Morocco
• Factory Europe likely to spread:
– Maghreb & Egypt
– Kenya
– Ukraine
• Do Europeans want tech to go to workers, or workers to come to tech?
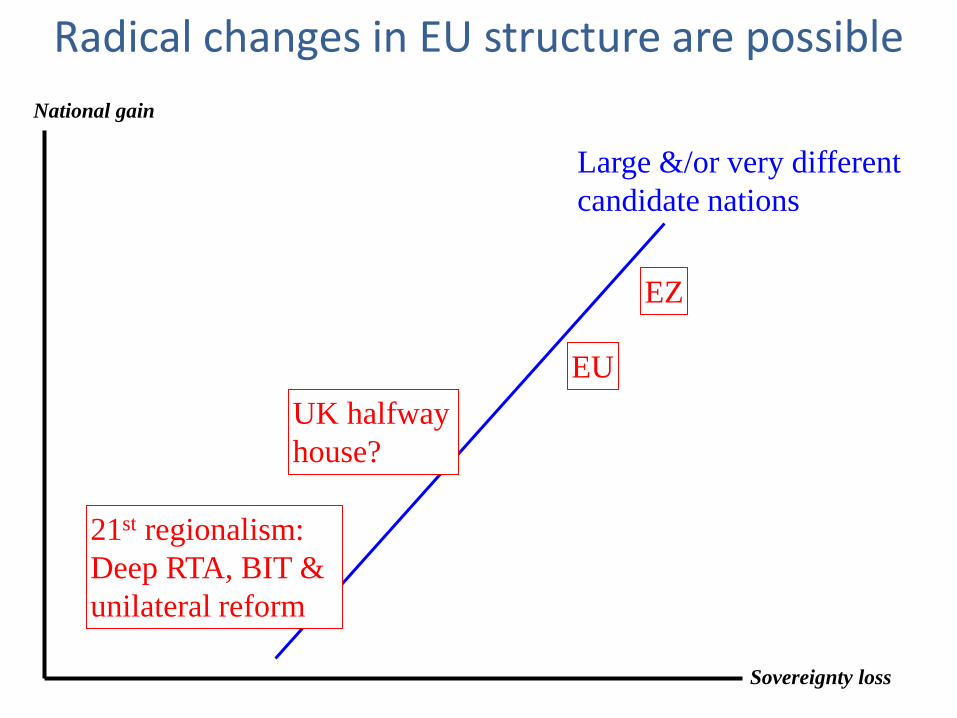
Large &/or very different
candidate nations
EU
EZ
21st regionalism:
Deep RTA, BIT &
unilateral reform
UK halfway
house?
National gain
Sovereignty loss
Radical changes in EU structure are possible
Concluding conjectures • EU will enlarge to include all Balkans. • Enlarging Factory Europe will be important in
shaping Europe’s future. – Tech to workers or workers to tech???
• EZ will deepen and cement two-tier membership. – Institutional adjustments will make enlargement
easier.
• UK departure would create a third tier. – Institutional adjustment would be massive, but
ultimately make enlargement easier.
• Expanding Factory Europe to include Maghreb & Egypt, etc will create a ‘near membership’ for non-European nations.
Thanks for listening
• Research-based policy analysis and commentary: VoxEU.org
http://www.voxeu.org/
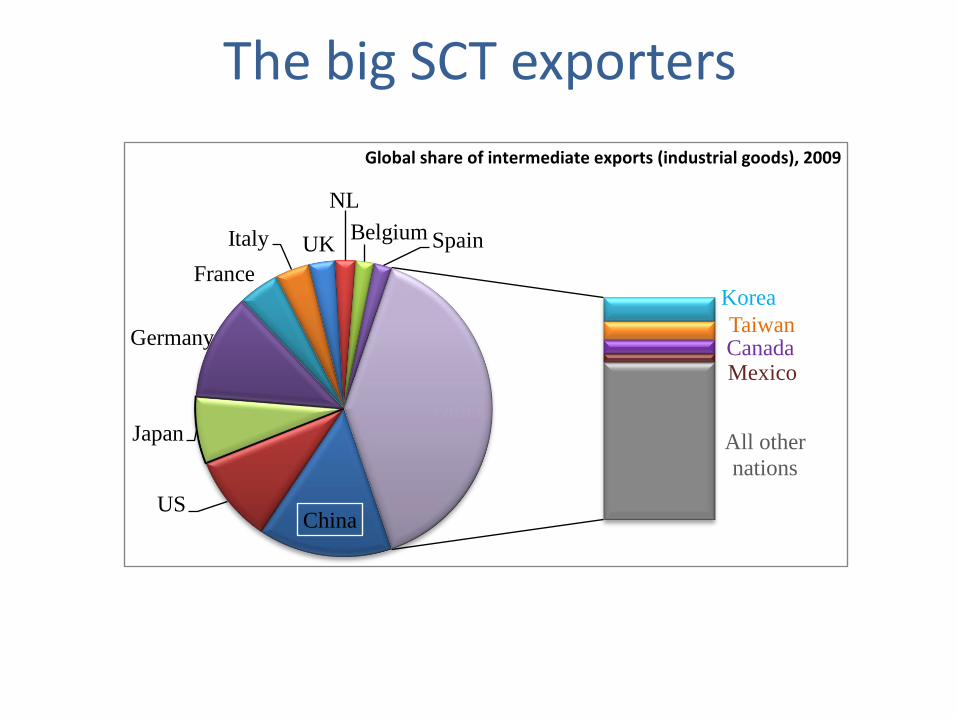
The big SCT exporters
ChinaUS
Japan
Germany
France
Italy UK
NL
Belgium Spain
Korea
TaiwanCanadaMexico
All other
nations
Other
Global share of intermediate exports (industrial goods), 2009
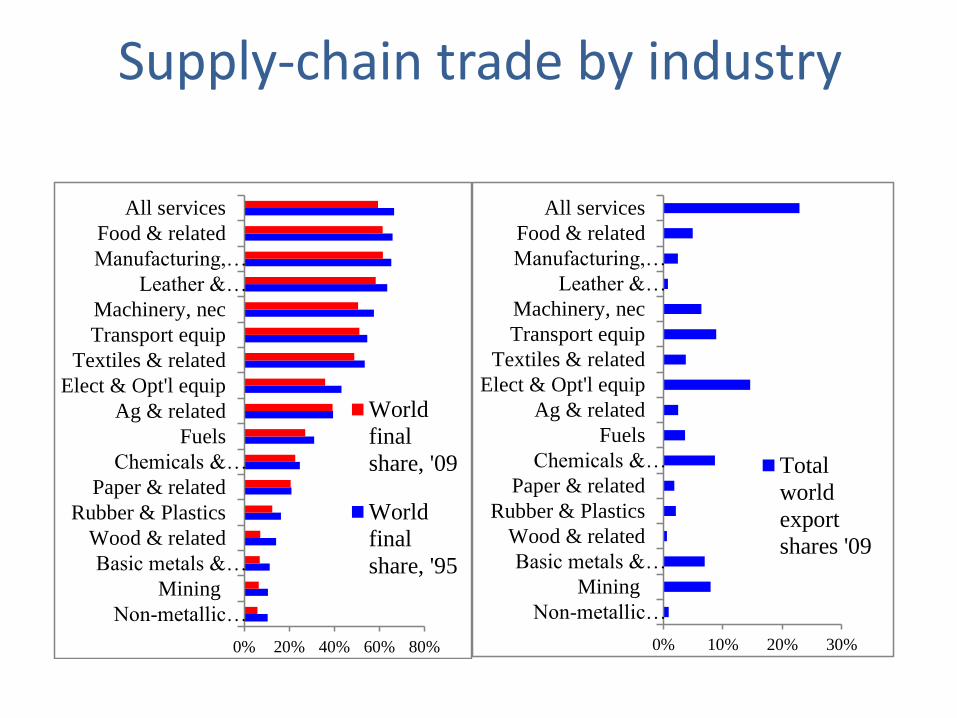
Supply-chain trade by industry
0% 10% 20% 30%
Non-metallic…
Mining
Basic metals &…
Wood & related
Rubber & Plastics
Paper & related
Chemicals &…
Fuels
Ag & related
Elect & Opt'l equip
Textiles & related
Transport equip
Machinery, nec
Leather &…
Manufacturing,…
Food & related
All services
Total
world
export
shares '09
0% 20% 40% 60% 80%
Non-metallic…
Mining
Basic metals &…
Wood & related
Rubber & Plastics
Paper & related
Chemicals &…
Fuels
Ag & related
Elect & Opt'l equip
Textiles & related
Transport equip
Machinery, nec
Leather &…
Manufacturing,…
Food & related
All services
World
final
share, '09
World
final
share, '95