Embed Size (px)
Citation preview

No. 34 March 2003Civic Report
Who Really Benefits fromNew York City’s Rent Regulation System?
Henry O. PollakowskiHousing Economist, MIT Center for Real Estate
Editor, Journal of Housing Economics
C E N T E R F O R C I V I C I N N O V A T I O NAAAAA T T H E M A N H AT T H E M A N H AT T H E M A N H AT T H E M A N H AT T H E M A N H A T TT TT TT TT T A N I N S T I T U T EA N I N S T I T U T EA N I N S T I T U T EA N I N S T I T U T EA N I N S T I T U T E
C C i

Civic Report 34
March 2003
Who Really Benefits from New York City’s Rent Regulation System?
March 2003
EXECUTIVE SUMMARY
This report examines New York City’s rent stabilization system and estimates the effects of total or partialderegulation. It finds that rent stabilization provides little benefit to residents of the outer boroughs andthe lower and middle-income neighborhoods of Manhattan, while providing a substantial subsidy only tothe residents of the relatively affluent areas of Lower and Mid-Manhattan.
The report also finds rent increases for stabilized housing following deregulation would be significantlyless than generally expected. Because residents of neighborhoods outside of the affluent part of Manhattanare not receiving significant subsidies, their rent increases would be minimal to non-existent. In the affluentareas of Lower and Mid-Manhattan, the substantial expansion of the unregulated housing market wouldcreate downward pressure on rent levels, making rent increases for stabilized housing less than might beexpected.
The report’s specific findings are as follows:
• The median monthly subsidy provided by rent stabilization for all of New York City is $42. How-ever, under total rent deregulation the median monthly rent of subsidized housing would increaseby only $8 due to the expansion of the unregulated market. Under vacancy deregulation, the me-dian monthly rent increase during the first two years would be $35.
• The vast majority of the benefits of rent stabilization go the higher-income areas of Lower- andMid-Manhattan, where the median monthly subsidy from rent stabilization is $397. By contrast,the median subsidy in the Bronx is $58, in Upper Manhattan (including Chinatown and the LowerEast Side) it is $9, and in Brooklyn it is $5, while in Queens and Staten Island the median subsidy iseffectively zero.
• This disparity would be even starker under deregulation. Under total deregulation, only the Bronx($37) and Lower- and Mid-Manhattan ($218) would see an increase in the median monthly rent ofstabilized housing. The same is true for the first two years of vacancy deregulation, though in thatcase the median rent increase would be $54 for the Bronx and $374 for Lower- and Mid-Manhattan.In both cases, the median rent would not increase for residents of stabilized housing in Brooklyn,Queens, Staten Island, and the Lower East Side and Chinatown.
• Even now rent regulation does not appear to protect most City residents from rising rents. Be-tween 1993 and 1999, the median monthly rent of stabilized housing citywide increased 24%, whilethe median rent of unregulated housing increased only 17%. Only in the affluent neighborhoods ofManhattan was there a larger median rent increase for unregulated housing.

Civic Report 34
March 2003

Who Really Benefits from New York City’s Rent Regulation System?
March 2003
ABOUT THE AUTHOR
Henry O. Pollakowski has been a housing economist at the MIT Center for Real Estate since 1996. He is thefounding and current Editor of the Journal of Housing Economics, which is now beginning its second decade.In addition to spending 12 years as a senior researcher at the Harvard Joint Center for Housing Studies, hehas taught at Boston College, Harvard University, the University of York (UK), and the University ofWashington.
Dr. Pollakowski has done extensive work in housing economics, including influential contributions to themeasurement of quality-adjusted housing price changes. He is widely recognized as a leading researcheron the economics of rent control, and during the past 15 years has conducted numerous studies of rentstabilization in New York City. He has specialized in the effects of land-use regulation on housing markets,and has done work on nonresidential property markets. He is the author of numerous scholarly andprofessional journal articles and Urban Housing Markets and Residential Location, a book focusing on theroles of location and house prices in housing decision-making.
While at Harvard, Dr. Pollakowski served as director of all phases of a national housing survey andcontributed to the annual State of the Nation’s Housing. He has studied house price appreciation forhomeowners with modest incomes for the Ford Foundation, and has examined the effects of developmentdelays on house prices for the Seattle Housing Partnership. He serves as a consultant to the low-incomeBermuda Housing Corporation and the New Jersey Pinelands Commission. He has also conducted researchfor the National Multi-Housing Council, the Department of Housing and Urban Development, the WorldBank, and numerous other private and public organizations.
As a faculty fellow of the Homer Hoyt Institute, Dr. Pollakowski has organized conferences on residentialand commercial real estate analysis. He has also served as a Director of the American Real Estate andUrban Economics Association and as guest editor of the Association’s journal. He received his BA inEconomics from the University of Michigan and his Ph.D. in Economics from the University of Californiaat Berkeley.
ACKNOWLEDGEMENTS
The author would like to thank Allison Neizmik and Tammie Simmons for assistance and helpful comments.

Civic Report 34
March 2003
Who Really Benefits from New York City’s Rent Regulation System?
March 2003
TABLE OF CONTENTS
Introduction and Overview ................................................................................................................................. 1
Calculating the True Effects of Rent Stabilization .............................................................................................. 2
Table 1: Median Rents By Sub-Borough and Control Status, New York City, 1999 ................................ 2,3
Methodology ....................................................................................................................................................... 4
Table 2: Locations Used In Subsidy Analysis, New York City, 1999 ............................................................ 5
Table 3: Median Subsidies Generated By Rent Stabilization,By Location, New York City, 1999 ................................................................................................................ 6
Table 4: Subsidies Generated By Rent Stabilization, By Borough, New York City, 1999 ........................... 7
Table 5: Median Rents and Income Levels, New York City, 1993–1999 ...................................................... 8
Table 6: Median Rents By Borough, New York City, 1993–1999 ................................................................. 8
Rent Changes Under Complete Deregulation of Stabilized Housing ............................................................... 9
Table 7: Deregulation of All Stabilized Units, Median Predicted Rent Changesand Number of Units Affected, By Borough, New York City .................................................................... 10
Rent Changes Under Vacancy Deregulation..................................................................................................... 10
Table 8: Stabilized Units Turning Over At Least Once During 1997–1998,By Borough, New York City ........................................................................................................................ 11
Table 9: Two-Year Vacancy Deregulation of Stabilized Units, Adjusted For Subsidy Levels, PredictedRent Changes and Number of Units Affected, By Borough, New York City ............................................ 12
Conclusion and Policy Implications ................................................................................................................... 13
Appendix ........................................................................................................................................................... 15
Estimation of Shadow Rent in a Partially-Controlled Market .................................................................... 15
Table A-1: Number of Units By Sub-Borough and Control Status, New York City, 1999 .................... 16,17
Table A-2: Explanatory Variables Used In Regression Analysis ................................................................. 18
Table A-3: Hedonic Rent Equation, Unregulated Sector, Bronx and Upper Manhattan .......................... 18
Table A-4: Hedonic Rent Equation, Unregulated Sector, Brooklyn and Staten Island ............................. 19
Table A-5: Hedonic Rent Equation, Unregulated Sector, Lower- and Mid-Manhattan ............................. 19
Table A-6: Hedonic Rent Equation, Unregulated Sector, Queens ............................................................ 20
Table A-7: Deregulation of All Stabilized Units, Median Predicted Rent Changesand Number of Units Affected, Bronx and Upper Manhattan .................................................................. 20
Table A-8: Deregulation of All Stabilized Units, Median Predicted Rent Changesand Number of Units Affected, Brooklyn .................................................................................................. 21
Table A-9: Deregulation of All Stabilized Units, Median Predicted Rent Changesand Number of Units Affected, Lower- and Mid-Manhattan .................................................................... 21
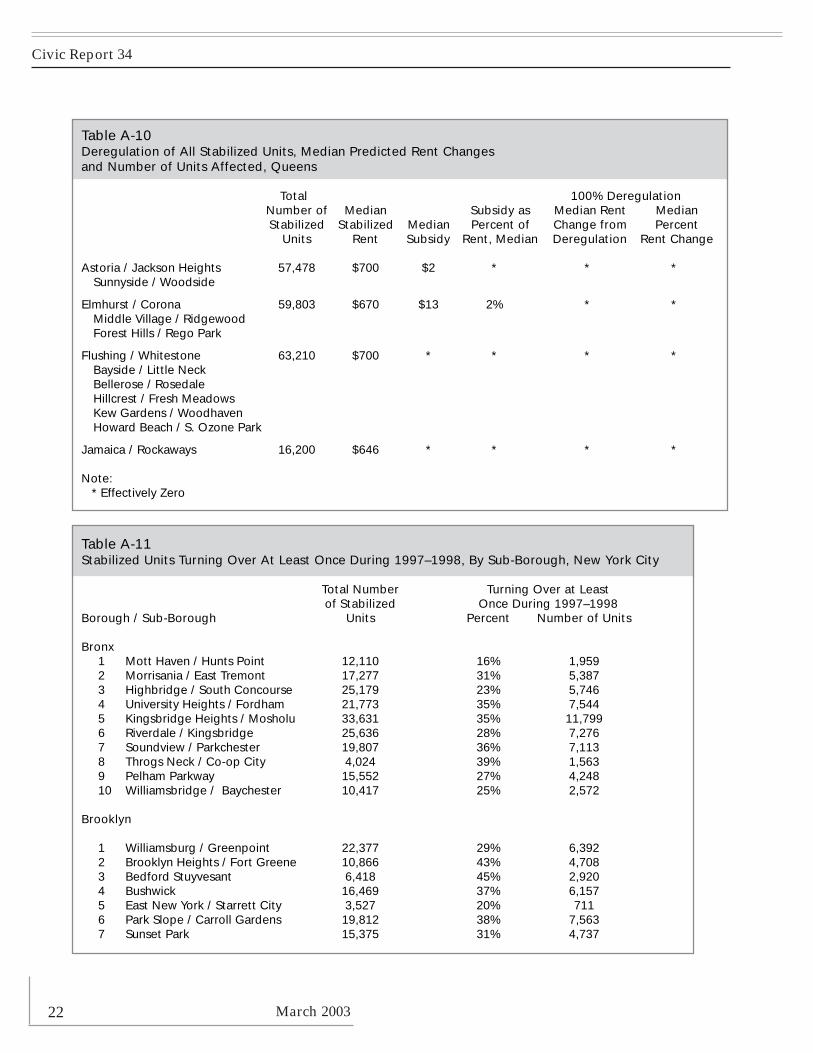
Table A-10: Deregulation of All Stabilized Units, Median Predicted Rent Changesand Number of Units Affected, Queens .................................................................................................... 22
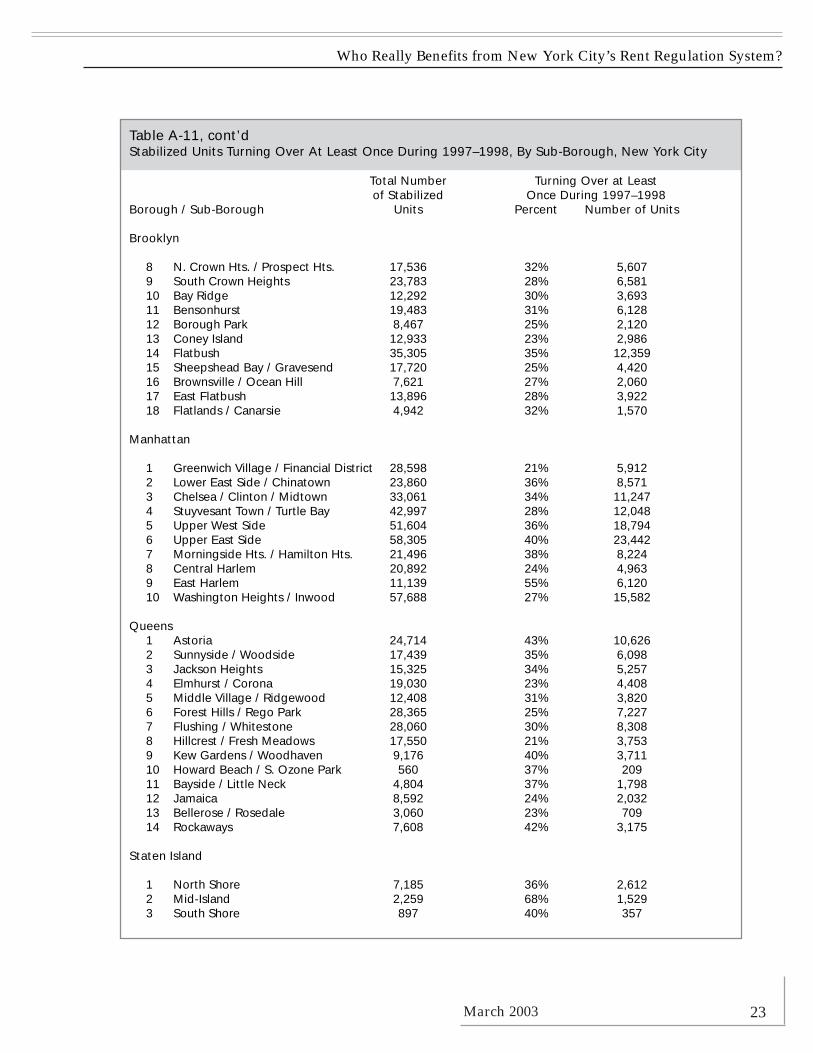
Table A-11: Stabilized Units Turning Over At Least Once During 1997–1998,By Sub-Borough, New York City ........................................................................................................... 22,23
References ......................................................................................................................................................... 25
Endnotes............................................................................................................................................................ 27

Civic Report 34
March 2003

March 2003 1
RENT DEREGULATION IN NEW YORK CITY
Introduction and Overview
Much of the public discussion of the future of NewYork City’s rent stabilization system implicitly orexplicitly presumes that most renters benefit fromit, and hence would pay higher rents without it. Thisis not true. As this study shows, the majority of NewYorkers living in stabilized rental housing are notpaying rents that are below market once dwellingsize, quality, and location are taken into account.Thus, repeal of rent stabilization would not lead torent increases for this majority. In addition, theneighborhoods that do not benefit from rentstabilization, and hence would not face rentincreases, are predominantly those housing lower-and moderate-income households. Thus theargument that rent stabilization should bemaintained for the benefit of those of moderatemeans stands without empirical support.
Why are the facts so distant from the generalwisdom? Most people look at the lower nominalrents stabilized apartments command, compare themto rents for existing unregulated housing, andassume the difference is the amount they “save” withrent stabilization. But this back-of-the-envelopecalculation skirts the real question: what would aregulated unit rent for if there were no regulation?Most regulated units could not command the higherrents found in much of the current unregulatedmarket because they are older, less-well maintained,have fewer amenities, or are located in less desirablelocations—all factors that lead to lower rentsregardless of legal rent restrictions. This reasoningimplies that rent deregulation will not lead to rentincreases in most of the City, with the exception ofaffluent Lower and Mid-Manhattan. This is the casebecause only those dwellings currently reaping rentbenefits would experience rent increases, and ourresearch finds that rent stabilization currentlyprovides virtually no benefit for residents ofBrooklyn, Queens, Staten Island, Upper Manhattanand the Lower East Side of Manhattan, and providesminimal benefits to residents of the Bronx.1
Furthermore, while rent increases would occur inLower and Mid-Manhattan, these would be much
less than might be expected. The more than threefoldexpansion of the affluent Lower and Mid-Manhattan unregulated market would takepressure off the current smaller unregulatedmarket, significantly lowering the very high rentsexisting there. Put simply, expanding supply wouldlower rents.
This study arrives at these findings using data fromthe 1999 New York City Housing and VacancySurvey.2 The Survey covers a large number ofdwelling characteristics, including size, location,regulation status, and structural and neighborhoodquality, allowing us to calculate the rent reductionbenefits actually received by tenants of stabilizeddwellings throughout the City. Then, based oneconomic analysis designed for a case such as NewYork’s, in which both regulated and unregulatedrental housing exist, post-deregulation rent changesare projected for all stabilized rental dwellings. Weexamine two possible scenarios for deregulation:complete deregulation of stabilized housing andvacancy deregulation of stabilized housing units asthey gradually turn over.
New York City has had rent regulation in one formor another since World War II. During that sameperiod of time, New York City has experienced someof the highest housing prices and rents in the nationand chronic supply shortfalls. Nonetheless, manyNew Yorkers believe that rent regulation is one ofthe only policies keeping housing affordable forlower- and middle-income people. However, in 1994and 1997 the extensions of rent regulation grantedby the State Legislature included modest butincreasing partial deregulation of the over onemillion rental dwellings in the rent stabilizationsystem.3 This partial deregulation coincided with thehousing price boom in the mid- and late-1990s,leading many New Yorkers to blame deregulationfor rising rents. Accordingly, as the authorizinglegislation comes up for renewal in 2003, it is crucialto closely examine this costly-to-administer systemto ascertain what its true effects are, allowingpolicymakers to make an informed choice as towhether to retain, modify, or eliminate it.

Civic Report 34
March 20032
Calculating the True Effects of Rent Stabilization
Finding out what rents currently are for stabilized and unregulated rental units is the first step in ascertainingwhat rent stabilization really does to prices. Table 1 shows the raw difference between the median stabilizedrent and the median rent on the unregulated market for each borough and sub-borough. (Table A-1, foundin the Appendix, presents an overview of city wide rental housing stocks). One can see here the numberswhich give rise to the belief that rent stabilization is beneficial. However, as noted before, direct comparisonbetween unregulated and regulated rents is inadequate because stabilized units and those on the unregulatedmarket differ in a number of important ways, even within a single location.
First, unregulated units are usually larger. People almost always pay more for a larger unit, making theunadjusted difference inapplicable at the outset. Furthermore, additional differences exist in quality of the
Table 1Median Rents By Sub-Borough and Control Status, New York City, 1999
Stabilized Unregulated Unregulated -Borough / Sub-Borough Pre-47 Post-47 All All Stabilized
New York City Median $619 $700 $650 $750 $100
Bronx Total $550 $600 $550 $700 $1501 Motts Haven / Hunts Point 445 * 445 700 2552 Morrisania / East Tremont 535 * 525 530 53 Highbridge / South Concourse 550 525 548 700 1524 University Heights / Fordham 533 580 540 650 1105 Kingsbridge Heights / Mosholu 560 560 560 600 406 Riverdale / Kingsbridge 572 680 600 900 3007 Soundview / Parkchester 546 650 556 725 1698 Throgs Neck / Co-op City 600 * 600 755 1559 Pelham Parkway 550 634 566 750 18410 Williamsbridge / Baychester 575 * 575 750 175
Brooklyn Total $600 $650 $607 $700 $931 Williamsburg / Greenpoint 550 358 548 675 1272 Brooklyn Heights / Fort Greene 680 850 700 855 1553 Bedford / Stuyvesant 595 * 595 500 -954 Bushwick 514 * 514 600 865 East New York / Starret City 600 * 600 700 1006 Park Slope / Carroll Gardens 759 * 759 790 317 Sunset Park 612 845 615 700 858 North Crown Hghts. / Prospect Hghts. 600 * 600 600 09 South Crown Heights 598 570 593 700 10710 Bay Ridge 700 750 708 691 -1711 Bensonhurst 640 697 650 700 5012 Borough Park 650 615 650 700 5013 Coney Island 600 688 620 625 514 Flatbush 650 631 650 685 3515 Sheepshead Bay / Gravesend 600 650 607 724 11716 Brownsville / Ocean Hill 500 313 521 650 12917 East Flatbush 600 664 621 650 2918 Flatlands / Canarsie 575 620 600 800 200

Who Really Benefits from New York City’s Rent Regulation System?
March 2003 3
structure, including age and maintenance deficiencies, and in quality of neighborhood. Stabilized unitstend to be older, less well maintained, contain fewer amenities, and be located in less desirable locations.Since people pay more for each one of these differences, rents must be further adjusted for these factors toaccurately measure the benefits reaped by households living in stabilized housing.
To calculate rent regulation’s effects on a stabilized unit, we must estimate the rent that would be paid for aunit of the same size and quality, within the same location, on the unregulated market. The difference betweenthe estimated unregulated market rent and the actual rent paid under stabilization is often referred to as therenter’s subsidy. The statistical method for calculating these subsidies is described in the next section.
Table 1, cont’dMedian Rents By Sub-Borough and Control Status, New York City, 1999
Stabilized Unregulated Unregulated -Borough / Sub-Borough Pre-47 Post-47 All All Stabilized
Manhattan Total $718 $1,052 $800 $1,995 $1,1951 Greenwich Village / Financial District 900 1080 956 1900 9442 Lower East Side / Chinatown 685 * 682 2000 13183 Chelsea / Clinton / Midtown 913 1500 1000 2040 10404 Stuyvesant Town / Turtle Bay 1003 1100 1050 1950 9005 Upper West Side 850 1058 875 2000 11256 Upper East Side 1040 1200 1076 2300 12247 Morningside Hts. / Hamilton Hts. 647 * 666 1166 5008 Central Harlem 489 440 500 625 1259 East Harlem 700 600 675 850 17510 Washington Heights / Inwood 600 683 610 710 100
Queens Total $675 $700 $690 $750 $601 Astoria 710 775 710 750 402 Sunnyside / Woodside 650 699 666 750 843 Jackson Heights 700 750 710 800 904 Elmhurst / Corona 600 650 650 760 1105 Middle Village / Ridgewood 580 700 600 675 756 Forest Hills / Rego Park 850 715 728 875 1477 Flushing / Whitestone 640 732 725 850 1258 Hillcrest / Fresh Meadows 700 682 690 850 1609 Kew Gardens / Woodhaven 700 850 700 750 5010 Howard Beach / S. Ozone Park * * * 750 *11 Bayside / Little Neck * 652 652 865 21312 Jamaica 508 700 619 655 3613 Bellerose / Rosedale * 597 600 800 20014 Rockaways 567 685 650 700 50
Staten Island Total $650 $650 $650 $650 $01 North Shore 650 683 650 626 -242 Mid-Island * 810 810 650 -1603 South Shore * * * 700 *
Note:* Effectively zero

Civic Report 34
March 20034
Methodology
The unregulated market is analyzed first, in orderto obtain the statistical relationship betweenunregulated rents and factors such as unit size,quality, and location.4 An unregulated rental valueis then estimated for each stabilized unit using thisrelationship. The subsidy is the difference betweenthe actual stabilized rent and the rent calculated foran identical dwelling unit in the unregulated sector.For example, if a stabilized unit rents for $500, butthe same unit would rent in the unregulated marketfor $600, the subsidy is calculated at $100.
Everyone knows that location is one of the mostimportant factors in determining housing cost. Whilethe New York City Housing and Vacancy Survey’sindividual unit data could be used for most of theprice-determinant factors, each unit’s locationneeded to be placed within a larger area to provideenough statistical grounding to accurately derive thelocation effect. The Survey identifies dwellingsaccording to their location in the 54 sub-boroughareas listed in Table 1. The eighteen zones for whichresults are presented are groupings of sub-boroughsaccording to similarities in economic status anddistribution of unregulated and stabilized housing.These groupings are defined in Table 2. In order toobtain a relationship between unregulated marketrents and their determinants, the eighteen zones werefurther grouped into the four major areas shown inTable 2. Staten Island is coupled with Brooklyn; andUpper Manhattan, along with Chinatown / LowerEast Side, is included with the Bronx.
For each of these four areas, a regression equation isestimated, relating rent to characteristics of the unit,the building, the surrounding neighborhood, and thelocation within the city. The parameters orcoefficients of this equation indicate the contributionof each characteristic to the total rent. The equationscan then be used to estimate unregulated marketrental value for any stabilized unit given itscharacteristics, and in turn to calculate the subsidy.
The variables used in the regression equation aredrawn from the 1999 New York City Housing andVacancy Survey and are listed in Table A-2 (seeAppendix). The number of bedrooms and number ofother rooms measure the size of the unit. Quality ofthe unit and building age represented by the year builtand by maintenance deficiencies. Neighborhood andlocation are represented by respondent’s evaluationof neighborhood structures, the presence of boarded-up units, and location by zone.
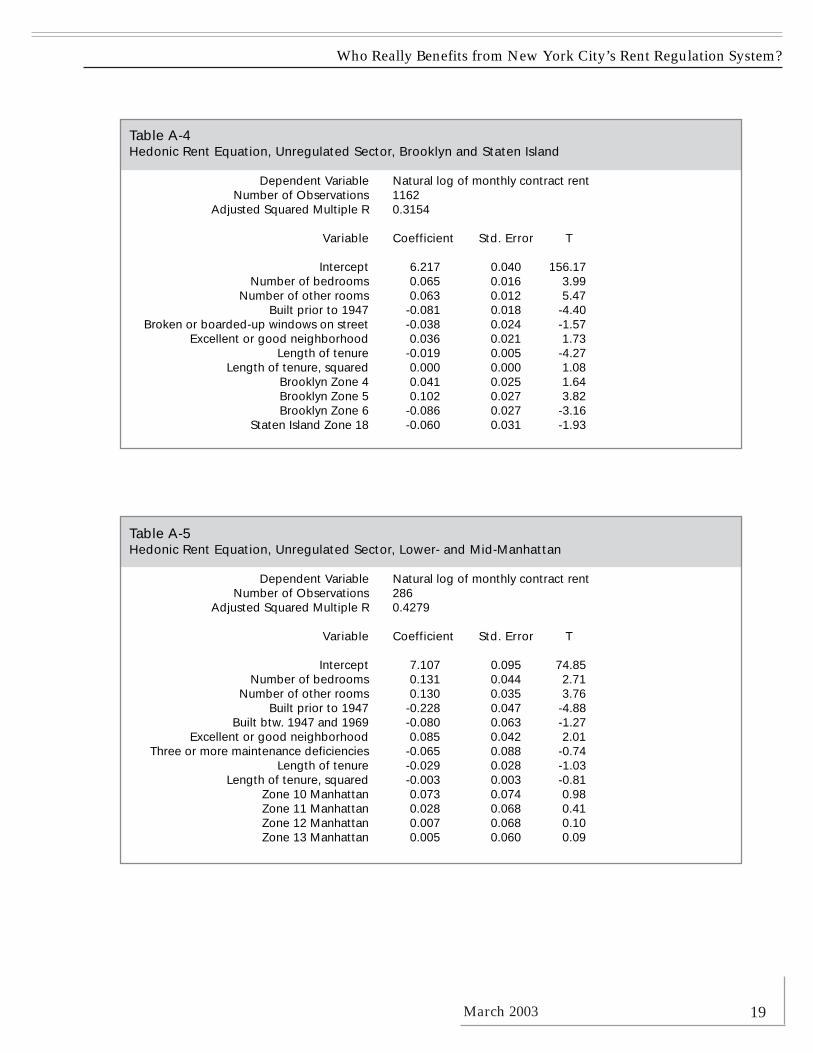
The regression equations for the unregulated marketfor each of the four areas described above arepresented in Appendix tables A-3 through A-6. Theseestimates are commonly referred to as hedonic priceequations. The majority of rent determinants areuseful and consistent across the four equations. Asexpected, length of tenure always lowers rent.Number of rooms and age of building, along withneighborhood rating and presence of boarded upunits, together reflect the importance of building andneighborhood qualities. Finally, the various zonevariables highlight important differences betweenlocations within each area.

Who Really Benefits from New York City’s Rent Regulation System?
March 2003 5
Table 2Locations Used In Subsidy Analysis, New York City, 1999
Location * Location *
Bronx / Upper Manhattan Lower and Mid-Manhattan
1 Mott Haven / Hunts Point 1 Greenwich Village / Financial District2 Morrisania / East Tremont3 Highbridge / South Concourse 3 Chelsea / Clinton / Midtown4 University Heights / Fordham7 Soundview / Parkchester 4 Stuyvesant Town / Turtle Bay
8,9 Central Harlem / East Harlem, Manhattan7 Morningside Hts. / Hamilton Hts., Manhattan 5 Upper West Side
10 Washington Heights / Inwood, Manhattan6 Upper East Side
5 Kingsbridge Heights / Mosholu6 Riverdale / Kingsbridge Brooklyn & Staten Island
10 Williamsbridge / Bychester1 Williamsburg / Greenpoint
8 Throgs Neck / Co-op City 7 Sunset Park9 Pelham Parkway 11 Bensonhurst
12 Borough Park2 Lower East Side / Chinatown, Manhattan 15 Sheepshead Bay / Gravesend
Queens 2 Brooklyn Heights / Fort Greene6 Park Slope / Carroll Gardens
1 Astoria 10 Bay Ridge2 Sunnyside / Woodside 14 Flatbush3 Jackson Heights 18 Flatlands / Canarsie
4 Elmhurst / Corona 3 Bedford Stuyvesant5 Middle Village / Ridgewood 4 Bushwick6 Forest Hills / Rego Park 5 East New York / Starrett City
13 Coney Island7 Flushing / Whitestone 16 Brownsville / Ocean Hill8 Hillcrest / Fresh Meadows9 Kew Gardens / Woodhaven 8 North Crown Heights / Prospect Heights
10 Howard Beach / S. Ozone Park 9 South Crown Heights11 Bayside / Little Neck 17 East Flatbush13 Bellerose / Rosedale
1 North Shore, Staten Island12 Jamaica 2 Mid-Island, Staten Island14 Rockaways 3 South Shore, Staten Island
Note:* Locations are grouped by sub-borough zones used in subsidy analysis

Civic Report 34
March 20036
The regression results, presented in Tables 3 and 4, show that rent stabilization has virtually no effect onrents throughout most of the City, especially those neighborhoods housing low- and moderate-incomehouseholds. Citywide, the median subsidy is $42 per month, or about 6 percent of the median rent for astabilized unit. Queens and Staten Island residents receive no benefit at all from rent regulation, whileBrooklyn and Upper Manhattan residents receive negligible benefits of less than $10 per month for themedian unit. Bronx residents receive a modest benefit, with a median subsidy of $58 per month, or about
Table 3Median Subsidies Generated By Rent Stabilization, By Location, New York City, 1999
Location Median Location MedianSubsidy Subsidy
Bronx / Upper Manhattan Lower and Mid-Manhattan
Lower Bronx and Upper Manhattan1 $41 Greenwich Village / Financial District $339
Kingsbridge Heights / Mosholu $42 Lower East Side / Chinatown *Riverdale / KingsbridgeWilliamsbridge / Baychester Chelsea / Clinton / Midtown $454
Throgs Neck / Co-op City $89 Stuyvesant Town / Turtle Bay $292Pelham Parkway
Upper West Side $485Brooklyn
Upper East Side $418Sunset Park $12
Williamsburg / Greenpoint QueensBensonhurstBorough Park Astoria $2Sheepshead Bay / Gravesend Sunnyside / Woodside
Jackson HeightsBrooklyn Heights / Fort Greene *
Park Slope / Carroll Gardens Elmhurst / Corona $13Bay Ridge Middle Village / RidgewoodFlatbush Forest Hills / Rego ParkFlatlands / Canarsie
Flushing / Whitestone *Bedford Stuyvesant * Hillcrest / Fresh Meadows
Bushwick Kew Gardens / WoodhavenEast New York / Starrett City Howard Beach / S. Ozone ParkConey Island Bayside / Little NeckBrownsville / Ocean Hill Bellerose / Rosedale
N. Crown Hts. / Prospect Hts. $15 Jamaica *South Crown Heights RockawaysEast Flatbush
Staten Island *
Notes:* Effectively Zero1. Mott Haven / Hunts Point Soundview / Parkchester
Morrisania / East Tremont Morningside Hts. / Hamilton Hts.Highbridge / South Concourse Central Harlem & East HarlemUniversity Heights / Fordham Washington Heights / Inwood
Who Really Benefits from New York City’s Rent Regulation System?
March 2003 7
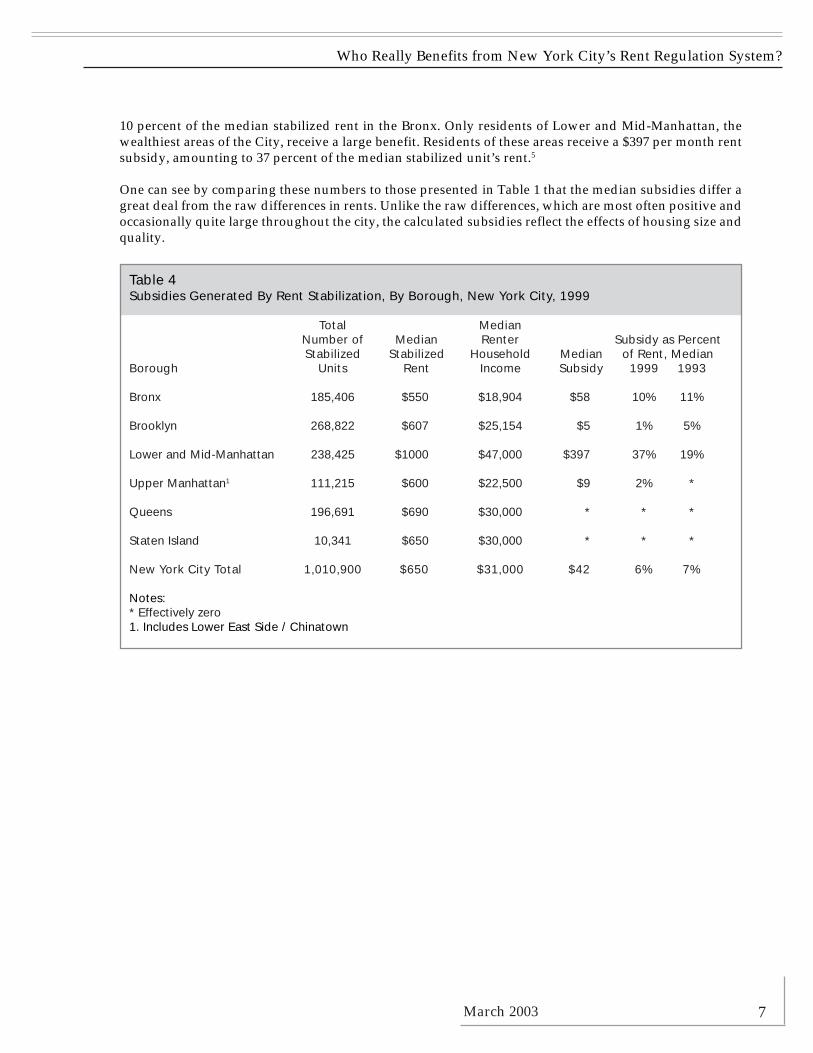
10 percent of the median stabilized rent in the Bronx. Only residents of Lower and Mid-Manhattan, thewealthiest areas of the City, receive a large benefit. Residents of these areas receive a $397 per month rentsubsidy, amounting to 37 percent of the median stabilized unit’s rent.5
One can see by comparing these numbers to those presented in Table 1 that the median subsidies differ agreat deal from the raw differences in rents. Unlike the raw differences, which are most often positive andoccasionally quite large throughout the city, the calculated subsidies reflect the effects of housing size andquality.
Table 4Subsidies Generated By Rent Stabilization, By Borough, New York City, 1999
Total MedianNumber of Median Renter Subsidy as PercentStabilized Stabilized Household Median of Rent, Median
Borough Units Rent Income Subsidy 1999 1993
Bronx 185,406 $550 $18,904 $58 10% 11%
Brooklyn 268,822 $607 $25,154 $5 1% 5%
Lower and Mid-Manhattan 238,425 $1000 $47,000 $397 37% 19%
Upper Manhattan1 111,215 $600 $22,500 $9 2% *
Queens 196,691 $690 $30,000 * * *
Staten Island 10,341 $650 $30,000 * * *
New York City Total 1,010,900 $650 $31,000 $42 6% 7%
Notes:* Effectively zero1. Includes Lower East Side / Chinatown

Civic Report 34
March 2003
It is also interesting to note that rentregulation did not seem to protect most Cityresidents from rising rents during the boomyears of the 1990s. In fact, rents grew morerapidly in stabilized housing than inunregulated housing outside Lower andMid-Manhattan. Table 5 displays 1993 and1999 median unadjusted rent levels for thecity. Monthly rent in the unregulatedmarket rose 17 percent, from $640 to $750,while stabilized renters experienced anincrease of $125 monthly, or 24 percent.These changes were not uniformthroughout the City. In the outer boroughs(and Upper Manhattan), median stabilizedrents increased from 2 to 18 percentagepoints more than did unregulated rents(Table 6). Only in the wealthy areas ofManhattan did unregulated rents increasemore than stabilized rents. Here medianunregulated rents increased by aremarkable 86 percent, from $1090 to over$2000. Conversely, stabilized rents rosefrom $750 per month to $1000, an increaseof 33 percent.
A comparison of subsidies between 1993 and1999 shows the same picture. While subsidiesfor most of the City remained essentiallyunchanged, decreasing significantly only inBrooklyn, subsidies to stabilized renters inLower and Mid-Manhattan rose sharplyfrom 1993 to the boom year of 1999 (final twocolumns of Table 4). High housing demandput disproportionate strain on theunregulated rental housing in Lower andMid-Manhattan, raising rents dramaticallyfor newcomers to the borough, thus creatinga competitive disadvantage for Manhattanfirms trying to hire professionals. In addition,as will be shown in Table 8, stabilized-renter mobility rates for Lower and Mid-Manhattan declined from1993 to 1999, with the greatest decline occurring in the top rent quartile. It would appear that stabilizedrenters here were more inclined than usual to hang on to good deals.
This measured benefit to affluent Manhattanites must be viewed in the appropriate context, however,because it reflects in large part the effect that other governmental policies have on housing supply. Manhattanis one of the most difficult places in the country in which to build new units, meaning that the expectedmarket response to sharply rising demand—sharply increasing supply—is unavailable. When supply isconstricted and demand rises, the market prices rise. That is the likely cause of much of the subsidy increaseseen in the 1990s, not rent regulation.
8
Table 5Median Rents and Income Levels, New York City, 1993–1999
Median Contract Rent1993 1999 % Increase
Unregulated 640 750 17%Stabilized 525 650 24%
Median Household Income1993 1999 % Increase
Unregulated 25000 37000 48%Stabilized 20160 28000 39%
Table 6Median Rents By Borough, New York City, 1993–1999
Borough 1993 1999 % Increase
BronxUnregulated 600 700 17%Stabilized 450 550 22%
BrooklynUnregulated 600 700 17%Stabilized 500 607 21%
Lower- and Mid-ManhattanUnregulated 1090 2029 86%Stabilized 750 1000 33%
Upper Manhattan1
Unregulated 716 750 5%Stabilized 486 600 23%
QueensUnregulated 675 750 11%Stabilized 564 690 22%
Staten IslandUnregulated 575 650 13%Stabilized 564 650 15%
Note:1. Includes Lower East Side / Chinatown

Who Really Benefits from New York City’s Rent Regulation System?
March 2003
These figures, moreover, overestimate the rentchanges that would occur with deregulation—thebest measure of the true effects of rent regulation onrents. This measure is the estimated rent increase onewould face if all stabilized units were deregulated,with all rents subsequently set in the market. In thiscase, rent increases would be smaller than thesubsidies just presented due to the addition offormerly stabilized units to the unregulated market.As shown above, rent regulation not only determinesstabilized rents, but can also channel unmet demandto the unregulated sector, making unregulated rentshigher that they would otherwise be. The expansionof the unregulated rental market in New York wouldpartially relieve this upward pressure, decreasing thegap between regulated and unregulated rents. Thefollowing two sections present estimated rentchanges for stabilized housing under differentderegulation scenarios.
Rent Changes Under CompleteDeregulation of Stabilized Housing
The scenario presented in this section simulates rentchanges for currently regulated units under completederegulation of stabilized housing. The starting pointfor this calculation is the estimated subsidy receivedby a dwelling unit. If, for example, a singlesubsidized unit is deregulated, then the rent wouldsimply rise to the comparable unregulated marketrent for a unit of its type. Thus, the rent increasewould be equal to the prior subsidy. However, asmentioned in the previous section, deregulation ofall stabilized units would result in considerabledownward pressure on unregulated rents, asderegulated units serve to expand the unregulatedmarket. A new equilibrium rent is thus established,higher than the previous stabilized rent, but lowerthan the previous unregulated rent. Thus, the greaterthe extent of deregulation, the lower the newlyestablished market rent level.6
A number of factors contribute to the size of the post-deregulation rent increase, primarily the size of thecalculated subsidy. The larger the subsidy, thegreater the potential rent increases fromderegulation. If there is no subsidy, that is, nodifference between quality-adjusted regulated and
actual regulated rents, then there will be no rentchange. Since we have shown above that subsidiesoutside of Lower and Mid-Manhattan are generallysmall or zero, residents in these areas would see norent increase if rent stabilization were repealed.
The willingness of households to pay a higher rent isanother determinant of change in rent. In the event ofa rent increase, a household may: (1) pay the higherrent; (2) consume less housing by moving to a smalleror lower quality unit within the same location; or (3)seek a lower rent by moving to another location. Weaccount for this behavior by including the priceelasticity of demand for rental housing in ourregressions in this section. Price elasticity measuresthe percent change in the consumption of housingrelative to a given percent change in price.
The third determinant of change in rent is the extentof regulation of the pre-existing market. Table A-1compares the number of stabilized units to thenumber of unregulated unregulated units at the sub-borough level. Calculating the percent of the overallmarket comprised by stabilized units yields ameasure of the extent of regulation. The higher thepercentage of regulated dwellings in one of the city’seighteen zones, the lower will be the rent change forthe regulated dwellings.
In this case, the price elasticity for rental housing isset at -0.5, which is the consensus of the literature.Thus, a one percent increase in rent will result in adecrease in quantity of housing consumed of one halfof one percent. Together with the other factorsmentioned above, we are able to calculate rentincreases for all stabilized units. Since completederegulation of stabilized housing fully relieves theupward pressure on unregulated market rents, thecalculated rent increases are the lowest possible.Predicted rent increases represent a new short-runequilibrium for the market under completederegulation.
Median rent changes resulting from completederegulation for each borough and for the City as awhole are found in Table 7. The rent changes for eachof the eighteen zones (sub-borough groupings) arepresented in Tables A-7 through A-10.
9

Civic Report 34
March 2003
Table 7 shows that rents would rise very little, if at all, outside of Lower and Mid-Manhattan. With theexception of a 10 percent increase in one location in the Bronx, rents would rise by no more than 6 percentin any sub-borough outside of the affluent portions of Manhattan. In fact, predicted rent changes areeffectively zero throughout Brooklyn, Queens, Upper Manhattan, and Staten Island. These negligible rentincreases result from the very small initial subsidies calculated in these zones. Thus, residents in theseareas should not be afraid of rent increases stemming from the complete elimination of rent regulation.7
10
Deregulation would have its greatest affect by far on stabilized tenants in affluent Lower and Mid-Manhattan.The overall median increase here is $218 per month, or 22 percent. With the exception of Chinatown /Lower East Side, which would see no rent increase, the Lower and Mid-Manhattan zones would realizemedian rent increases of anywhere from 16 to 28 percent.
It is important to note, however, that the predicted rent increases are much lower than the subsidies. Thisis due to the fact that stabilized units far outnumber those in the unregulated market. Table A-1 shows349,640 stabilized units in Manhattan, compared to only 76,897 unregulated units. For this reason, rents ina deregulated market would remain closer to the formerly stabilized rents than to former unregulatedmarket level. In addition, actual rent changes may in fact turn out to be somewhat lower, since the estimatespresented here are based on the hot market of 1999.
Rent Changes Under Vacancy Deregulation
In contrast to the scenario discussed in the previous section, vacancy deregulation is only partial deregulation,affecting only those stabilized units that turn over, or change tenants, within a given period of time. Thetime period discussed in this simulation is two years. Although a substantial portion of rental households,especially younger renters, will have a high mobility rate, there is also a significant segment of long-termrenters who are far less likely to move within any two-year period. The basis for projections of rent changesunder vacancy deregulation is the previous section’s analysis of complete deregulation. Projections must
Table 7Deregulation of All Stabilized Units, Median Predicted Rent Changesand Number of Units Affected, By Borough, New York City
Total 100% DeregulationNumber of Median Subsidy as Median Rent MedianStabilized Stabilized Median Percent of Change from Percent
Borough Units Rent Subsidy Rent, Median Deregulation Rent Change
Bronx 185,406 $550 $58 10% $37 7%
Brooklyn 268,822 $607 $5 1% * *
Lower and Mid-Manhattan 238,425 $1000 $397 37% $218 22%
Upper Manhattan1 111,215 $600 $9 2% * *
Queens 196,691 $690 * * * *
Staten Island 10,341 $650 * * * *
New York City Total 1,010,900 $650 $42 6% $8 1%
Notes:* Effectively Zero1. Includes Lower East Side / Chinatown

Who Really Benefits from New York City’s Rent Regulation System?
March 2003
take into account the lower number of units affected in a two-year period under vacancy deregulation. Thiswill allow the rent increases for complete deregulation to be adjusted upward proportionally to reflect thesmaller number of dwellings affected.
The number of units affected is derived from the number of units known to have turned over within thetwo years prior to the 1999 New York Housing and Vacancy Survey. The Survey, conducted in April 1999,asked respondents to report the year in which they had moved into their present dwelling. The numbers inTables 8 and A-11 represent the percentages of stabilized units first occupied by their present tenantsbetween January 1997 and March 1999.8 Table 8 presents these numbers according to borough and level ofrent; percentages by sub-borough can be found in Table A-11.
11
Table 8Stabilized Units Turning Over At Least Once During 1997–1998, By Borough, New York City
Total Units Turning Over at LeastMedian Number of Once During 1997–1998
Stabilized Stabilized NumberBorough Quartile Rent Units Percent of Units
Bronx all $550 185,406 30% 55,2031 361 15% 6,9992 513 31% 14,7873 598 36% 16,5004 743 37% 16,917
Brooklyn all $607 268,822 31% 84,4571 450 17% 11,9432 575 33% 22,1443 666 37% 24,5344 843 39% 25,836
Lower and Mid-Manhattan all $1,000 238,425 30% 70,7161 500 20% 10,8302 875 32% 17,0903 1165 39% 20,3484 1700 42% 22,448
Upper Manhattan1 all $600 111,215 39% 43,2321 350 16% 5,4102 535 25% 8,5423 668 37% 12,6734 922 49% 16,607
Queens all $690 196,691 31% 61,3481 498 19% 9,2602 626 32% 15,7773 728 34% 17,1774 900 38% 19,134
Staten Island all $650 10,341 43% 4,4971 400 28% 7522 642 38% 9603 735 54% 1,4404 900 55% 1,345
New York City Total all $650 1,010,900 32% 319,453
Notes:1. Includes Lower East Side / Chinatown

Civic Report 34
March 2003
In each of the six locations presented in Table 8, turnover of stabilized dwellings increases with rent. That is,higher rent and presumably higher-income households move more frequently. This finding serves to mitigatethe rent increases of lower rent, lower income households, since they will be slower to move. Overall,approximately 319,450 units, or 32% of the stabilized stock, turned over at least once during the 1997–98 period.
To derive the two-year turnover rate for vacancy deregulation, a number of factors must be incorporated.First, the numbers in Tables 8 and A-11 should not be considered a “turnover rate” because the nature ofthe survey question fails to capture units that have turned over more than once. An additional source ofbias may be changes in household composition. For example, a new husband moving into his wife’sapartment may state that the present tenants have occupied the apartment since 1997, when in fact the wifelived there prior. This leads to an overstatement of turnover. For this reason, we reduce the 1997–1998turnover values by 10 percent.
The next major factors to consider for this simulation are the various disincentives to move faced by stabilizedrenters. Households currently occupying stabilized units may know they are reaping substantial subsidies.Others may believe that they are receiving subsidies because they are failing to adjust for size, quality, orlocation. Finally, households may feel there is some arbitrary advantage to remaining in a stabilized unit(perhaps that they are under some long-term protection from large rent increases). For those that are actuallyreceiving subsidies, the reduction in the number of units affected by vacancy deregulation can be based onthe subsidies. This subsidy effect is measured by the median of the subsidy as a percent of rent, rangingfrom effectively zero in Queens and Staten Island to 37% in Lower and Mid-Manhattan. This is shown incolumn 4 of Table 9. In addition, an arbitrary deduction of 10 percent is taken for the perceived disincentivesdiscussed above. In summary, the projected number of stabilized units in each borough affected by vacancyderegulation in a two-year period is calculated as follows:
Number of units turning over during 1997–98Minus 10 percent deduction for overstatement (overcounting)
Minus X percent deduction for subsidy affectMinus 10 percent deduction for other perceived disincentives
12
Table 9Two-Year Vacancy Deregulation of Stabilized Units, Adjusted For Subsidy Levels,Predicted Rent Changes and Number of Units Affected, By Borough, New York City
Adjusted ** Rent ChangeTotal Subsidy Median Rent from Vacancy Deregulation
Number of Median as Percent ChangeStabilized Stabilized Median of Rent, from 100% Rent Percent Units
Borough Units Rent Subsidy Median Deregulation Change Affected Affected
Bronx 185,406 $550 $58 10% $37 $54 21% 38,642
Brooklyn 268,822 $607 $5 1% * * 25% 66,721
Lower and Mid-Manhattan 238,425 $1000 $397 37% $218 $374 13% 30,408
Upper Manhattan1 111,215 $600 $9 2% * * 30% 33,721
Queens 196,691 $690 * * * * 25% 49,078
Staten Island 10,341 $650 * * * * 35% 3,598
New York City Total 1,010,900 $650 $42 6% $8 $35 22% 222,168
Notes:* Effectively Zero** Adjusted to take into account subsidy levels and overcounting; see text1. Includes Lower Eastside/Chinatown

Who Really Benefits from New York City’s Rent Regulation System?
March 2003
Because fewer units are open to market competition,rent increases under vacancy deregulation will behigher than they would be under full deregulation.Thus, to ascertain the rent increases under vacancyderegulation, we adjust the rent change from the 100-percent deregulation scenario proportional to thenumber of units affected by vacancy deregulation,which ranges from 13 percent in Lower and Mid-Manhattan to 35 percent of all stabilized units in StatenIsland. Throughout the city 222,168 units, or 22 percentof the stabilized stock will be affected within two years.
Table 9 presents the projected rent changes undervacancy deregulation. The median monthly rentchange for the entire city is $35, compared to $8under complete deregulation and a median subsidyof $42. Throughout the boroughs, rent increasesrange from effectively zero to $374. Once again,residents of Brooklyn, Queens, Staten Island andUpper Manhattan will see no rent increase at all as aresult of vacancy deregulation. Thus, over half of theCity’s residents, and a larger percentage of its lower-and middle-income households, will not face rentincreases stemming from vacancy deregulation.
Even most households of those areas which wouldsee significant rent increases would be relativelyunaffected. That is because the projected rentincreases only apply to the units that become vacantwithin the two-year period, which is only a smallproportion of the entire housing stock. Only 21% ofthe stabilized units in the Bronx, and a modest 13%of those in Manhattan, are expected to become vacantin the two-year period. That means nearly 80% ofcurrent Bronx residents and over 85% of currentManhattan residents in stabilized units will see nochange in their rents beyond what would otherwisebe allowed under rent stabilization. Since higher rentunits, which are presumably rented by higherincome households, tend to turn over much morequickly, the burden of higher rents will likely fall onthose able to afford it.9
These rent increases would moderate after theinitial two-year period as more units become vacantand hence unregulated. In addition, the rate ofvacancy deregulation would decline over time, withmost of the stabilized stock deregulated within 20years. As is seen in Table 8, higher-rent dwellingswould likely turn over first, and thus enter intoderegulation more quickly.
Given the portion of the population who are long-term renters, as well as the real and perceiveddisincentives to move from stabilized housing, therate of vacancy deregulation would fall over time.Vacancy deregulation as a singular policy instrumentwould take about 20 years to reach the bulk of thestabilized housing stock. Furthermore, tenants inhigh-rent locations enjoying substantial subsidieswould be particularly reluctant to move. For thisreason especially, the addition of high-rent, high-income deregulation to vacancy deregulation hasbeen a policy recommendation from Roistacher(1992) and others.
Conclusion and Policy Implications
This study finds that tenants in low- and moderate-income areas receive little or no benefit from rentstabilization, while tenants in more affluent locationsare effectively subsidized for a substantial portionof their rent.
When the “hot” market of 1999 is compared to the“cool” one of 1993, we see that on average, stabilizedtenants outside of affluent areas did not receive extraprotection benefits. Most of the benefits went tostabilized tenants in Lower and Mid-Manhattan. Thisprovides a strong argument for moving ahead moreaggressively with deregulation. Two possibilities forderegulation have been examined: completederegulation and vacancy deregulation of stabilizedhousing. We have found that the rent increasesresulting from complete deregulation would bemoderate or negligible throughout the city, with theexception of the affluent sub-boroughs of Lower andMid-Manhattan. In contrast, under vacancyderegulation, the 22 percent of units to turn overwithin the first two years would realize higherincreases in rent. Even in this case, however, mostof the increase would occur in Lower and Mid-Manhattan. As the rate of vacancy deregulationslowed, almost all of the stabilized stock would bederegulated in 20 years. Although not whollydesirable as a sole policy instrument, vacancyderegulation could function well along with acomplementary approach, such as high- andmoderate-income deregulation.
Under either form of deregulation, some householdswould be see greater rent increases than others. Rentstabilization has been in effect for over 30 years, and
13

Civic Report 34
March 200314
in fact many of the presently stabilized units havebeen under some form of rent regulation since WorldWar II. Thus it is not surprising that households enjoysubsidies at various levels, or that rent changes willvary from the typical amounts.
For the aforementioned reasons, deregulation policymust be crafted with an eye on the low-incomeelderly. The current short-run solution in New York
City is to reimburse landlords in the case of low-income elderly tenants paying controlled rents. Forthe duration of rent stabilization, this may benecessary to protect the elderly. However, in the longrun, direct government assistance along withderegulation is the favored alternative. Given that rentregulation disproportionately benefits tenants inaffluent areas, direct financial assistance to poor andelderly renters is preferable to simply regulating rents.
Who Really Benefits from New York City’s Rent Regulation System?
March 2003 15
APPENDIX
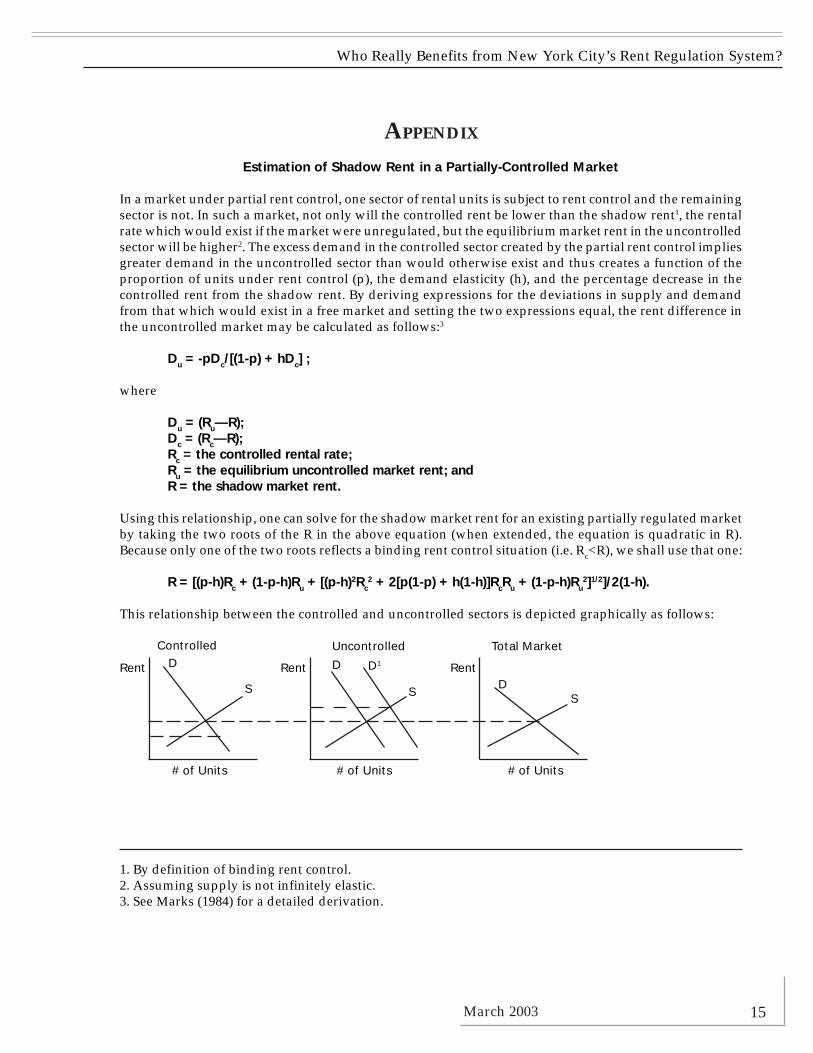
Estimation of Shadow Rent in a Partially-Controlled Market
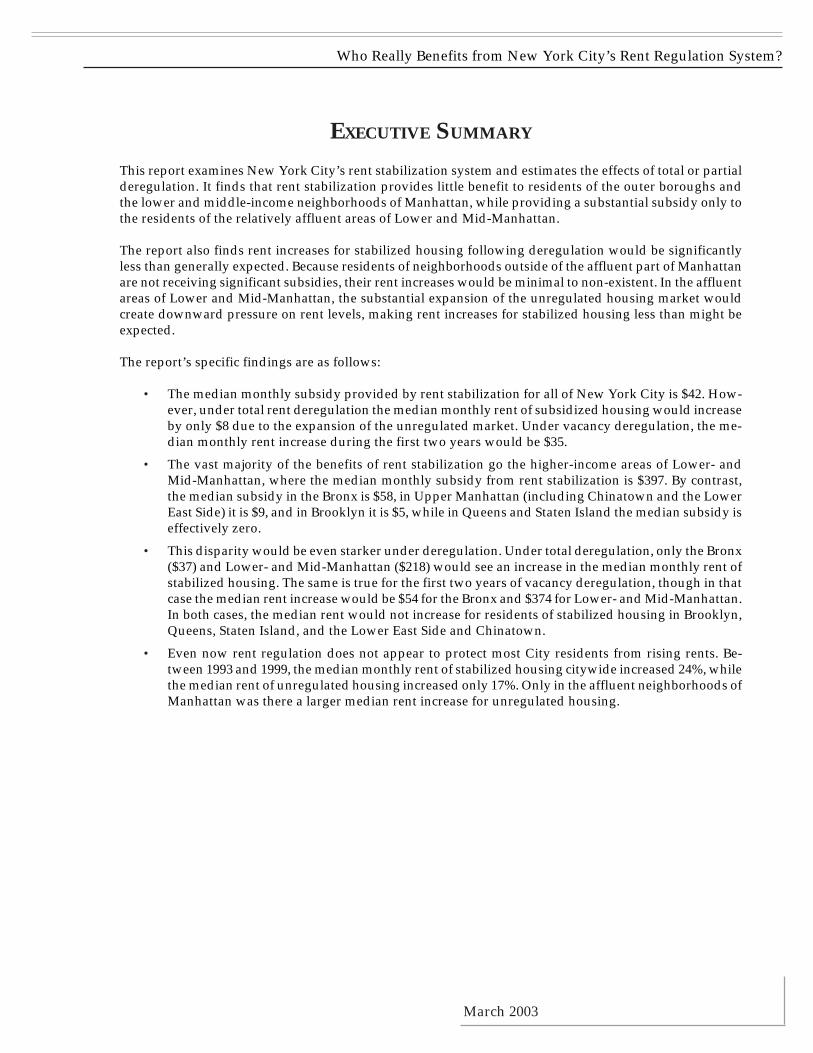
In a market under partial rent control, one sector of rental units is subject to rent control and the remainingsector is not. In such a market, not only will the controlled rent be lower than the shadow rent1, the rentalrate which would exist if the market were unregulated, but the equilibrium market rent in the uncontrolledsector will be higher2. The excess demand in the controlled sector created by the partial rent control impliesgreater demand in the uncontrolled sector than would otherwise exist and thus creates a function of theproportion of units under rent control (p), the demand elasticity (h), and the percentage decrease in thecontrolled rent from the shadow rent. By deriving expressions for the deviations in supply and demandfrom that which would exist in a free market and setting the two expressions equal, the rent difference inthe uncontrolled market may be calculated as follows:3
Du = -pDc/[(1-p) + hDc] ;
where
Du = (Ru—R);Dc = (Rc—R);Rc = the controlled rental rate;Ru = the equilibrium uncontrolled market rent; andR = the shadow market rent.
Using this relationship, one can solve for the shadow market rent for an existing partially regulated marketby taking the two roots of the R in the above equation (when extended, the equation is quadratic in R).Because only one of the two roots reflects a binding rent control situation (i.e. Rc<R), we shall use that one:
R = [(p-h)Rc + (1-p-h)Ru + [(p-h)2Rc2 + 2[p(1-p) + h(1-h)]RcRu + (1-p-h)Ru
2]1/2]/2(1-h).
This relationship between the controlled and uncontrolled sectors is depicted graphically as follows:
1. By definition of binding rent control.2. Assuming supply is not infinitely elastic.3. See Marks (1984) for a detailed derivation.
DUncontrolled Total Market
Rent
# of Units
Controlled
Rent
# of Units
Rent
# of Units
D
DS S S
D1

Civic Report 34
March 200316
Table A-1Number of Units By Sub-Borough and Control Status, New York City, 1999
Stabilized UnregulatedBorough / Sub-Borough Pre-47 Post-47 All All Total**
New York City Total 741,832 268,171 1,010,003 560,051 1,570,951
Bronx Total 155,250 30,156 185,406 62,515 247,9211 Motts Haven / Hunts Point 12,110 * 12,110 4,594 16,7042 Morrisania / East Tremont 16,436 * 17,277 3,465 20,7423 Highbridge / South Concourse 23,295 1,884 25,179 1,681 26,8604 University Heights / Fordham 18,755 3,018 21,773 4,642 26,4155 Kingsbridge Heights / Mosholu 30,533 3,098 33,631 3,798 37,4296 Riverdale / Kingsbridge 14,293 11,343 25,636 4,143 29,7797 Soundview / Parkchester 14,362 5,445 19,807 13,591 33,3988 Throgs Neck / Co-op City 4,024 * 4,024 7,456 11,4809 Pelham Parkway 11,436 4,116 15,552 7,653 23,20510 Williamsbridge / Baychester 10,006 * 10,417 11,492 21,909
Brooklyn Total 216,400 52,422 268,822 204,130 472,9521 Williamsburg / Greenpoint 21,112 1,265 22,377 11,664 34,0412 Brooklyn Heights / Fort Greene 8,686 2,180 10,866 8,986 19,8523 Bedford / Stuyvesant 6,418 * 6,418 11,033 17,4514 Bushwick 16,469 * 16,469 6,722 23,1915 East New York / Starret City 2,952 * 3,527 14,338 17,8656 Park Slope / Carroll Gardens 19,461 * 19,812 9,111 28,9237 Sunset Park 13,835 1,540 15,375 13,162 28,5378 North Crown Hghts. / Prospect Hghts. 17,122 * 17,536 6,943 24,4799 South Crown Heights 18,308 5,475 23,783 6,826 30,60910 Bay Ridge 9,583 2,709 12,292 12,521 24,81311 Bensonhurst 13,301 6,182 19,483 18,948 38,43112 Borough Park 6,191 2,276 8,467 18,033 26,50013 Coney Island 9,592 3,341 12,933 7,248 20,18114 Flatbush 26,966 8,339 35,305 7,137 42,44215 Sheepshead Bay / Gravesend 10,124 7,596 17,720 11,631 29,35116 Brownsville / Ocean Hill 6,162 1,459 7,621 9,885 17,50617 East Flatbush 8,995 4,901 13,896 11,918 25,81418 Flatlands / Canarsie 1,123 3,819 4,942 18,024 22,966

Who Really Benefits from New York City’s Rent Regulation System?
March 2003 17
Table A-1, cont’dNumber of Units By Sub-Borough and Control Status, New York City, 1999
Stabilized UnregulatedBorough / Sub-Borough Pre-47 Post-47 All All Total**
Manhattan Total 287,771 61,869 349,640 76,897 426,5371 Greenwich Village / Financial District 23,067 5,531 28,598 11,580 40,1782 Lower East Side / Chinatown 23,696 * 23,860 1,842 25,7023 Chelsea / Clinton / Midtown 25,703 7,358 33,061 9,146 42,2074 Stuyvesant Town / Turtle Bay 27,200 15,797 42,997 12,380 55,3775 Upper West Side 47,140 4,464 51,604 11,520 63,1246 Upper East Side 39,488 18,817 58,305 20,142 78,4477 Morningside Hts. / Hamilton Hts. 20,528 * 21,496 4,408 25,9048 Central Harlem 16,779 4,113 20,892 1,161 22,0539 East Harlem 10,069 1,070 11,139 990 12,12910 Washington Heights / Inwood 54,101 3,587 57,688 3,728 61,416
Queens Total 79,749 116,942 196,691 181,356 378,0471 Astoria 20,662 4,052 24,714 18,118 42,8322 Sunnyside / Woodside 12,122 5,317 17,439 8,995 26,4343 Jackson Heights 9,805 5,520 15,325 17,085 32,4104 Elmhurst / Corona 1,792 17,238 19,030 14,204 33,2345 Middle Village / Ridgewood 9,890 2,518 12,408 20,826 33,2346 Forest Hills / Rego Park 4,985 23,380 28,365 9,443 37,8087 Flushing / Whitestone 4,883 23,177 28,060 18,805 46,8658 Hillcrest / Fresh Meadows 2,460 15,090 17,550 12,315 29,8659 Kew Gardens / Woodhaven 7,612 1,564 9,176 12,828 22,00410 Howard Beach / S. Ozone Park * * * 10,796 11,35611 Bayside / Little Neck * 4,804 4,804 8,914 13,71812 Jamaica 3,183 5,409 8,592 12,291 20,88313 Bellerose / Rosedale * 2,263 3,060 12,244 15,30414 Rockaways 2,355 5,253 7,608 4,492 12,100
Staten Island Total 2,662 6,782 9,444 35,153 45,4941 North Shore 2,662 4,523 7,185 15,586 22,7712 Mid-Island * 2,259 2,259 9,919 12,1783 South Shore * * * 9,648 10,545
Notes:* Too few units to report** Numbers in this table do not include public housing, controlled, or other regulated / assisted units

Civic Report 34
March 200318
Table A-2Explanatory Variables Used In Regression Analysis
Variable Definition
Dependent Variable:LMCRENT Natural log of monthly contract rent
Independent Variables:AMTBED Number of bedroomsAMTROOM Number of total roomsBLTPRE47 Built prior to 1947BLT47T69 Built between 1947 and 1969BRBOWIN Broken or boarded up windows on streetGOODCOND Excellent or good neighborhoodMADEFGE3 Unit has has three or more maintenance deficienciesLENTEN99 Length of tenureLENTENSQ Length of tenure, squaredLOCATION Series of variables designating locations listed in Table A-1
Table A-3Hedonic Rent Equation, Unregulated Sector, Bronx and Upper Manhattan
Dependent Variable Natural log of monthly contract rentNumber of Observations 369
Adjusted Squared Multiple R 0.2551
Variable Coefficient Std. Error T
Intercept 6.306 0.066 96.14Number of bedrooms 0.158 0.035 4.55
Number of other rooms -0.001 0.026 -0.04Built prior to 1947 -0.081 0.034 -2.36
Broken or boarded-up windows on street -0.045 0.060 -0.76Excellent or good neighborhood 0.078 0.044 1.77
Length of tenure -0.005 0.010 -0.44Length of tenure, squared -0.001 0.001 -1.09
Bronx Zone 1 -0.144 0.040 -3.62Bronx Zone 5 -0.077 0.044 -1.74
Who Really Benefits from New York City’s Rent Regulation System?
March 2003 19
Table A-4Hedonic Rent Equation, Unregulated Sector, Brooklyn and Staten Island
Dependent Variable Natural log of monthly contract rentNumber of Observations 1162
Adjusted Squared Multiple R 0.3154
Variable Coefficient Std. Error T
Intercept 6.217 0.040 156.17Number of bedrooms 0.065 0.016 3.99
Number of other rooms 0.063 0.012 5.47Built prior to 1947 -0.081 0.018 -4.40
Broken or boarded-up windows on street -0.038 0.024 -1.57Excellent or good neighborhood 0.036 0.021 1.73
Length of tenure -0.019 0.005 -4.27Length of tenure, squared 0.000 0.000 1.08
Brooklyn Zone 4 0.041 0.025 1.64Brooklyn Zone 5 0.102 0.027 3.82Brooklyn Zone 6 -0.086 0.027 -3.16
Staten Island Zone 18 -0.060 0.031 -1.93
Table A-5Hedonic Rent Equation, Unregulated Sector, Lower- and Mid-Manhattan
Dependent Variable Natural log of monthly contract rentNumber of Observations 286
Adjusted Squared Multiple R 0.4279
Variable Coefficient Std. Error T
Intercept 7.107 0.095 74.85Number of bedrooms 0.131 0.044 2.71
Number of other rooms 0.130 0.035 3.76Built prior to 1947 -0.228 0.047 -4.88
Built btw. 1947 and 1969 -0.080 0.063 -1.27Excellent or good neighborhood 0.085 0.042 2.01
Three or more maintenance deficiencies -0.065 0.088 -0.74Length of tenure -0.029 0.028 -1.03
Length of tenure, squared -0.003 0.003 -0.81Zone 10 Manhattan 0.073 0.074 0.98Zone 11 Manhattan 0.028 0.068 0.41Zone 12 Manhattan 0.007 0.068 0.10Zone 13 Manhattan 0.005 0.060 0.09

Civic Report 34
March 200320
Table A-6Hedonic Rent Equation, Unregulated Sector, Queens
Dependent Variable Natural log of monthly contract rentNumber of Observations 901
Adjusted Squared Multiple R 0.411
Variable Coefficient Std. Error T
Intercept 6.150 0.044 141.31Number of bedrooms 0.096 0.016 6.02
Number of other rooms 0.062 0.011 5.65Built prior to 1947 -0.161 0.025 -6.40
Built btw. 1947 and 1969 -0.051 0.026 -1.98Broken or boarded-up windows on street 0.000 0.039 0.00
Excellent or good neighborhood 0.029 0.020 1.40Three or more maintenance deficiencies 0.032 0.031 1.03
Length of tenure -0.019 0.005 -3.96Length of tenure, squared 0.000 0.000 0.62
Queens Zone 14 0.182 0.029 6.20Queens Zone 15 0.134 0.029 4.56Queens Zone 16 0.156 0.028 5.64
Table A-7Deregulation of All Stabilized Units, Median Predicted Rent Changes andNumber of Units Affected, Bronx And Upper Manhattan
Total 100% DeregulationNumber of Median Subsidy as Median Rent MedianStabilized Stabilized Median Percent of Change from Percent
Units Rent Subsidy Rent, Median Deregulation Rent Change
Lower Bronx and 207,361 $560 $41 8% $28 5%Upper Manhattan1
Kingsbridge Heights / Mosholu 69,684 $580 $42 7% $34 6%Riverdale / KingsbridgeWilliamsbridge / Baychester
Throgs Neck / Co-op City 19,576 $570 $89 17% $57 10%Pelham Parkway
Notes:
1 Mott Haven / Hunts Point Soundview / ParkchesterMorrisania / East Tremont Central Harlem / East HarlemHighbridge / South Concourse Morningside Heights / Hamilton HeightsUniversity Heights / Fordham Washington Heights / Inwood

Who Really Benefits from New York City’s Rent Regulation System?
March 2003 21
Table A-8Deregulation of All Stabilized Units, Median Predicted Rent Changes andNumber of Units Affected, Brooklyn
Total 100% DeregulationNumber of Median Subsidy as Median Rent MedianStabilized Stabilized Median Percent of Change from Percent
Units Rent Subsidy Rent, Median Deregulation Rent Change
Sunset Park / Bensonhurst 83,422 $612 $12 2% * *Sheepshead Bay / GravesendBorough ParkWilliamsburg / Greenpoint
Brooklyn Heights / Fort Greene 83,217 $668 * * * *Park Slope / Carroll GardensFlatbush / Flatlands / CanarsieBay Ridge
Bedford Stuyvesant / Bushwick 46,968 $565 * * * *East New York / Starrett CityBrownsville / Ocean HillConey Island
N. Crown Hts. / Prospect Hts. 55,215 $600 $15 2% * *South Crown HeightsEast Flatbush
Note: * Effectively zero
Table A-9Deregulation of All Stabilized Units, Median Predicted Rent Changes andNumber of Units Affected, Lower- And Mid-Manhattan
Total 100% DeregulationNumber of Median Subsidy as Median Rent MedianStabilized Stabilized Median Percent of Change from Percent
Units Rent Subsidy Rent, Median Deregulation Rent Change
Greenwich Village / 28,598 $956 $339 34% $250 26%Financial District
Lower East Side / 23,860 $682 * * * *Chinatown
Chelsea / Clinton / 33,061 $1000 $454 35% $210 21%Midtown
Stuyvesant Town / 42,997 $1050 $292 27% $169 16%Turtle Bay
Upper West Side 51,604 $875 $485 46% $243 28%
Upper East Side 58,305 $1096 $418 38% $211 19%
Note:* Effectively zero
Civic Report 34
March 200322
Table A-10Deregulation of All Stabilized Units, Median Predicted Rent Changesand Number of Units Affected, Queens
Total 100% DeregulationNumber of Median Subsidy as Median Rent MedianStabilized Stabilized Median Percent of Change from Percent
Units Rent Subsidy Rent, Median Deregulation Rent Change
Astoria / Jackson Heights 57,478 $700 $2 * * *Sunnyside / Woodside
Elmhurst / Corona 59,803 $670 $13 2% * *Middle Village / RidgewoodForest Hills / Rego Park
Flushing / Whitestone 63,210 $700 * * * *Bayside / Little NeckBellerose / RosedaleHillcrest / Fresh MeadowsKew Gardens / WoodhavenHoward Beach / S. Ozone Park
Jamaica / Rockaways 16,200 $646 * * * *
Note: * Effectively Zero
Table A-11Stabilized Units Turning Over At Least Once During 1997–1998, By Sub-Borough, New York City
Total Number Turning Over at Leastof Stabilized Once During 1997–1998
Borough / Sub-Borough Units Percent Number of Units
Bronx1 Mott Haven / Hunts Point 12,110 16% 1,9592 Morrisania / East Tremont 17,277 31% 5,3873 Highbridge / South Concourse 25,179 23% 5,7464 University Heights / Fordham 21,773 35% 7,5445 Kingsbridge Heights / Mosholu 33,631 35% 11,7996 Riverdale / Kingsbridge 25,636 28% 7,2767 Soundview / Parkchester 19,807 36% 7,1138 Throgs Neck / Co-op City 4,024 39% 1,5639 Pelham Parkway 15,552 27% 4,24810 Williamsbridge / Baychester 10,417 25% 2,572
Brooklyn
1 Williamsburg / Greenpoint 22,377 29% 6,3922 Brooklyn Heights / Fort Greene 10,866 43% 4,7083 Bedford Stuyvesant 6,418 45% 2,9204 Bushwick 16,469 37% 6,1575 East New York / Starrett City 3,527 20% 7116 Park Slope / Carroll Gardens 19,812 38% 7,5637 Sunset Park 15,375 31% 4,737
Who Really Benefits from New York City’s Rent Regulation System?
March 2003 23
Table A-11, cont’dStabilized Units Turning Over At Least Once During 1997–1998, By Sub-Borough, New York City
Total Number Turning Over at Leastof Stabilized Once During 1997–1998
Borough / Sub-Borough Units Percent Number of Units
Brooklyn
8 N. Crown Hts. / Prospect Hts. 17,536 32% 5,6079 South Crown Heights 23,783 28% 6,58110 Bay Ridge 12,292 30% 3,69311 Bensonhurst 19,483 31% 6,12812 Borough Park 8,467 25% 2,12013 Coney Island 12,933 23% 2,98614 Flatbush 35,305 35% 12,35915 Sheepshead Bay / Gravesend 17,720 25% 4,42016 Brownsville / Ocean Hill 7,621 27% 2,06017 East Flatbush 13,896 28% 3,92218 Flatlands / Canarsie 4,942 32% 1,570
Manhattan
1 Greenwich Village / Financial District 28,598 21% 5,9122 Lower East Side / Chinatown 23,860 36% 8,5713 Chelsea / Clinton / Midtown 33,061 34% 11,2474 Stuyvesant Town / Turtle Bay 42,997 28% 12,0485 Upper West Side 51,604 36% 18,7946 Upper East Side 58,305 40% 23,4427 Morningside Hts. / Hamilton Hts. 21,496 38% 8,2248 Central Harlem 20,892 24% 4,9639 East Harlem 11,139 55% 6,12010 Washington Heights / Inwood 57,688 27% 15,582
Queens1 Astoria 24,714 43% 10,6262 Sunnyside / Woodside 17,439 35% 6,0983 Jackson Heights 15,325 34% 5,2574 Elmhurst / Corona 19,030 23% 4,4085 Middle Village / Ridgewood 12,408 31% 3,8206 Forest Hills / Rego Park 28,365 25% 7,2277 Flushing / Whitestone 28,060 30% 8,3088 Hillcrest / Fresh Meadows 17,550 21% 3,7539 Kew Gardens / Woodhaven 9,176 40% 3,71110 Howard Beach / S. Ozone Park 560 37% 20911 Bayside / Little Neck 4,804 37% 1,79812 Jamaica 8,592 24% 2,03213 Bellerose / Rosedale 3,060 23% 70914 Rockaways 7,608 42% 3,175
Staten Island
1 North Shore 7,185 36% 2,6122 Mid-Island 2,259 68% 1,5293 South Shore 897 40% 357
Civic Report 34
March 200324

Who Really Benefits from New York City’s Rent Regulation System?
March 2003 25
REFERENCES
Marks, D. (1984). “The Effects of Partial-Coverage Rent Control on the Price and Quantity of Rental Housing,”Journal of Urban Economics 16, 360–369.
Olsen, E. (1972). “An Econometric Analysis of Rent Control,” Journal of Political Economy 80, 1081–1100.Pollakowski, H. O. (1997) “The Effects of Rent Deregulation in New York City,” Working Paper, Center for
Real Estate, Massachusetts Institute of Technology.Pollakowski, H. O. (1992) “The Effects of Partial Rent Deregulation in New York City,” Working Paper,
Joint Center for Housing Studies, Harvard University.Roistacher, E. A. (1992) “Rent Regulation in New York City: Simulating Decontrol Options,” Journal of
Housing Economics 2, 107–138.
Civic Report 34
March 200326
Who Really Benefits from New York City’s Rent Regulation System?
March 2003 27
ENDNOTES
1. This finding is broadly consistent with previous research, including Roistacher (1992) andPollakowski (1992, 1997).
2. The New York City Housing and Vacancy Survey is conducted every three years. This study isbased on the most recent available Survey, taken in 1999. The current study repeats and refines much of theanalysis that was done using the 1993 Survey (Pollakowski, 1997). This strategy serves two purposes. First,it provides a detailed look at how the New York City rental housing market has changed since 1993. Second,it provides a comparison of two quite different states of the housing market. Coming out of the recession in1993, the market was “cooler” than it had been in the late 1980’s and would be later in the 1990’s. In 1999,the market was “hot.” However, the changes from 1993 to 1999 were far from uniform. The current studydocuments what can be learned concerning rent deregulation from the pattern of change.
3. A moderate form of partial deregulation began in New York City in 1994. With the renewal ofenabling legislation at the state level, a combination of high-income, high-rent deregulation and partialvacancy deregulation was put into place. A unit renting in excess of $2000 per month could be deregulatedwhen the income of the occupying household reached $250,000 two years in a row. In addition, a unitrenting above $2000, regardless of income, could be deregulated when the tenants of the unit moved. The1997 legislation strengthened this partial deregulation by lowering the income level to $175,000, whilemaintaining the rent level of $2000. In addition, larger increases in rents were allowed upon turnover ofstabilized units, including an allowance for the length of tenure of the outgoing tenant
4. The methodology builds upon that of earlier researchers, including Olsen (1972), Roistacher (1992),and Pollakowski (1992, 1997).
5. These findings are broadly consistent with conclusions drawn from previous work with the NewYork City Housing and Vacancy Survey, including Pollakowski (1992, 1997) and Roistacher (1992).
6. The market rent level that would exist in the event of complete deregulation is often referred to asthe “shadow” market rent. The shadow market rent for any type of housing at any point in time can beestimated through an adaptation of the model developed by Marks (1984). This model develops an equationfor the underlying or shadow market rent based on the three factors discussed herein: (1) the existingunregulated market and regulated rents; (2) the price elasticity of demand for rental housing; and (3) theextent to which rents are regulated. Marks’ model is summarized in the Appendix.
7. As with all our numbers, these represent average effects. Since many of the presently stabilizedunits have been under some form of rent regulation since World War II, rent changes for some householdswill vary from these typical amounts.
8. Note that this necessitates using a period of two years and three months. The “two-year” resultsthus actually pertain to a period of two years and three months.
9. Again, individual rent increases would vary from the medians, and within each location somehouseholds would see far greater rent increases than others. In addition, a misreading of the market situationcould lead to higher than anticipated rent increases for the first deregulated units.

EXECUTIVE DIRECTOR
Henry Olsen
ADVISORY BOARD
Stephen Goldsmith, ChairmanMayor Jerry BrownMayor John O. NorquistMayor Martin O’MalleyMayor Rick Baker
FELLOWS
William D. EggersJay P. Greene
Byron R. JohnsonGeorge L. Kelling
Edmund J. McMahonPeter D. Salins
The Center for Civic Innovation’s (CCI) purpose is to improve the quality of life in cities by shaping public policyand enriching public discourse on urban issues.
CCI sponsors the publication of books like The Entrepreneurial City: A How-To Handbook for Urban Innovators,which contains brief essays from America’s leading mayors explaining how they improved their cities’ quality oflife; Stephen Goldsmith’s The Twenty-First Century City, which provides a blueprint for getting America’s citiesback in shape; and George Kelling’s and Catherine Coles’ Fixing Broken Windows, which explores the theorywidely credited with reducing the rate of crime in New York and other cities. CCI also hosts conferences,publishes studies, and holds luncheon forums where prominent local and national leaders are given opportunitiesto present their views on critical urban issues. Cities on a Hill, CCI’s newsletter, highlights the ongoing work ofinnovative mayors across the country.
The Manhattan Institute is a 501(C)(3) nonprofit organization. Contributions are tax-deductible to the fullestextent of the law. EIN #13-2912529
M A N H A T T A N I N S T I T U T E F O R P O L I C Y R E S E A R C H
M
52 Vanderbilt Avenue • New York, NY 10017www.manhattan-institute.org
INon-Profit
OrganizationUS Postage
PAIDPermit 04001
New York, NY