Embed Size (px)
Citation preview

Designed and printed by the Central Statistics Office
Wholesale Price IndexIntroduction of Updated SeriesBase Year 2010 = 100
An Phríomh-Oifig Staidrimh
Central Statistics Office
www.cso.ie
Contents
Page
WPI Introduction of Updated Series to Base 2010 as 100 3
Appendices
Appendix 1 Calculation Process for Wholesale Price Index 13
Appendix 2 Weighting % within Total Manufacturing Industries 14
Appendix 3 Industrial Sectors
Table A Excluded from Producer Price Indices - Table 2 15
Table B Calculated but not published 15
Appendix 4 Recalculated Backdated Series (for information purposes)
Table 1 Manufacturing Industries Output Price Indices (excluding VAT) 18
Table 2 Industrial Producer Price Indices (excluding VAT) 19
Table 3 Detailed Wholesale Price Indices (excluding VAT) for Building and
Construction Materials 27
Table 4 Capital Goods Price Indices (excluding VAT) 35
Table 5 Wholesale Price Indices (excluding VAT) for Energy Products
(i.e. Fuels purchased by Manufacturing Industry) 37
1

© Government of Ireland 2013
Material compiled and presented by
Central Statistics Office
Reproduction is authorised, except for commercial
purposes, provided the source is acknowledged.
Published October 2013.

3
Wholesale Price Index
Introduction of Updated Series to Base 2010 as 100
Index Updating and
Rebasing
The EU regulation concerning short-term statistical indicators (STS) of economic activities1 re-
quires that sectoral weights for the Producer Price Index be updated from 2005 to 2010 by the end
of 2013 in order to reflect changes in the structure of the economy.
This article introduces the updated Wholesale Price Index (WPI) to base 2010 as 100. It replaces
the former Wholesale Price Index series which was introduced in 2010 to base 2005 as 100.
The same system of price indices are continued, namely:
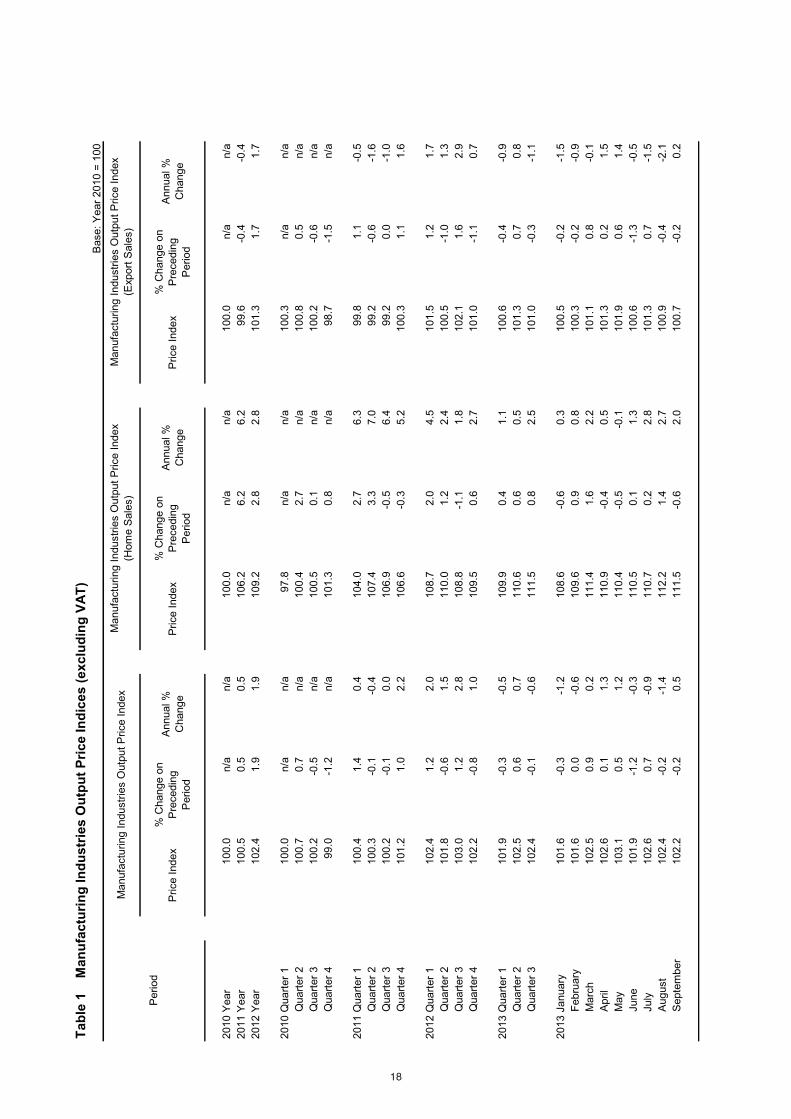
i. Manufacturing Industries Output Price Index (table 1) which contains the overall
Manufacturing Industries Output Price Index as well as breakdown by Home and
Export Sales.
together with separate series of:
ii . industrial producer price indices classified by NACE2 + sector (table 2);
iii. wholesale price indices for building and construction materials (table 3);
iv. wholesale price indices for capital goods (table 4);
v. wholesale price indices for energy products purchased by manufacturing industry
(table 5).
Tables 1 and 2 present the rebased Producer Price Indices as required by the STS regulation. Ta-
bles 3, 4 and 5 have also been rebased to 2010=100 for the purpose of consistency.
At each re-base of the WPI two sets of retrospective indices are estimated for the WPI series.
These indices are published in the following tables:
1. The backdated data for the official series:
The data published in the monthly WPI release up to August 2013 is calculated using this series. It
has been rescaled to the 2010 as 100 series thereby maintaining the annual and monthly percent-
age changes officially published for the period 2010 to August 2013. This series is available on
the CSO databank.
2. The recalculated series:
These series have been calculated from January 2010 to September 2013 using the new weights.
They are not used as the official backdated series as the percentage changes reported differ from
those already officially published for the period prior to September 2013. They are useful, how-
ever, as they highlight the effect of the new weights on the series when compared to the official
backdated series. This recalculated series is available in Appendix 4 of this publication and the
CSO databank.
The Wholesale Price Index is compiled by the Central Statistics Office (CSO). The index is nor-
mally issued through the CSO website within 4 weeks of the month to which it relates.
Definition of the WPI The industrial producer price index for a sector measures, in index form, changes in prices re-
ceived by Irish manufacturers for goods fully or partially produced in Ireland and sold to the
home and export markets by that sector. The other wholesale price index series incorporate im-
ported and home produced goods sold by manufacturers and wholesale outlets. All constituent se-
ries are compiled using a Laspeyres type index formula. Identical items are priced each month so
that changes in the cost of this constant basket reflect price changes only.
1 COUNCIL REGULATION (EC) No 1165/98 of 19 May 1998 concerning short-term statistics (Official Journal L 1 62 , 05/06/1998) amended in 2005 by Regulation
(EC) no 1158/2005 (Official Journal L 191/1 , 22/07/2005).2 NACE Rev.2 Statistical classification of economic activities in the European Community.
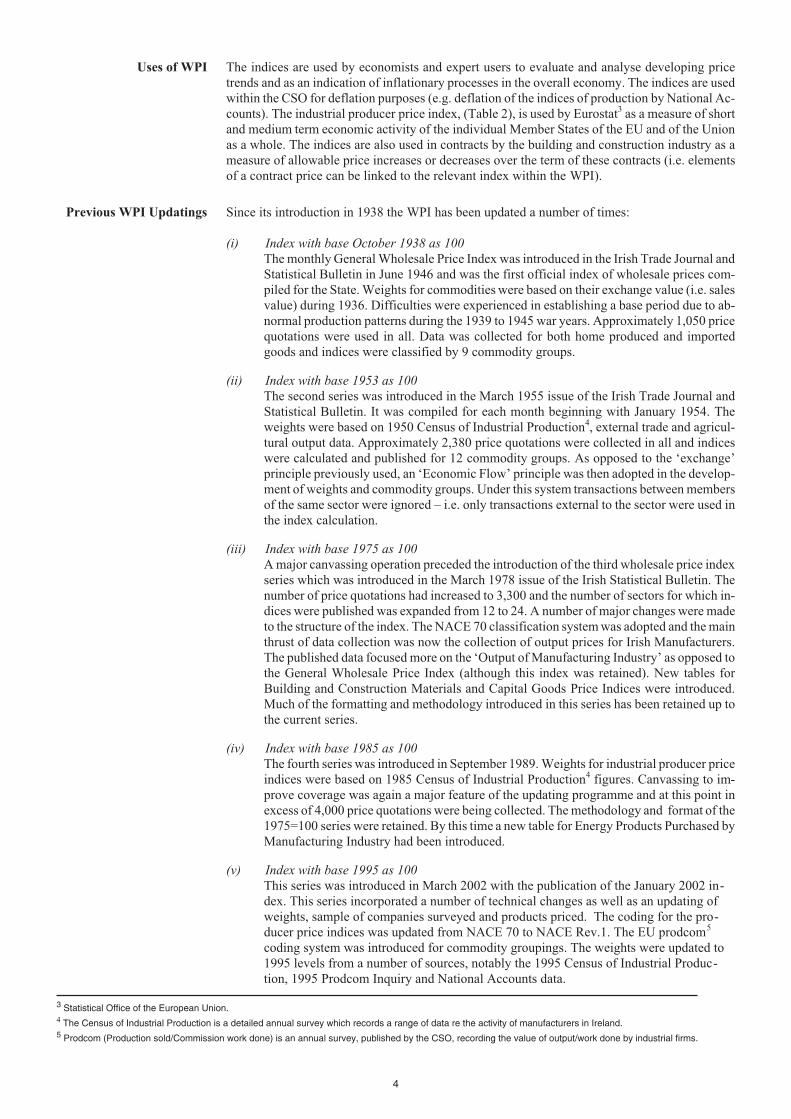
Uses of WPI The indices are used by economists and expert users to evaluate and analyse developing price
trends and as an indication of inflationary processes in the overall economy. The indices are used
within the CSO for deflation purposes (e.g. deflation of the indices of production by National Ac-
counts). The industrial producer price index, (Table 2), is used by Eurostat3 as a measure of short
and medium term economic activity of the individual Member States of the EU and of the Union
as a whole. The indices are also used in contracts by the building and construction industry as a
measure of allowable price increases or decreases over the term of these contracts (i.e. elements
of a contract price can be linked to the relevant index within the WPI).
Previous WPI Updatings Since its introduction in 1938 the WPI has been updated a number of times:
(i) Index with base October 1938 as 100
The monthly General Wholesale Price Index was introduced in the Irish Trade Journal and
Statistical Bulletin in June 1946 and was the first official index of wholesale prices com-
piled for the State. Weights for commodities were based on their exchange value (i.e. sales
value) during 1936. Difficulties were experienced in establishing a base period due to ab-
normal production patterns during the 1939 to 1945 war years. Approximately 1,050 price
quotations were used in all. Data was collected for both home produced and imported
goods and indices were classified by 9 commodity groups.
(ii) Index with base 1953 as 100
The second series was introduced in the March 1955 issue of the Irish Trade Journal and
Statistical Bulletin. It was compiled for each month beginning with January 1954. The
weights were based on 1950 Census of Industrial Production4, external trade and agricul-
tural output data. Approximately 2,380 price quotations were collected in all and indices
were calculated and published for 12 commodity groups. As opposed to the ‘exchange’
principle previously used, an ‘Economic Flow’ principle was then adopted in the develop-
ment of weights and commodity groups. Under this system transactions between members
of the same sector were ignored – i.e. only transactions external to the sector were used in
the index calculation.
(iii) Index with base 1975 as 100
A major canvassing operation preceded the introduction of the third wholesale price index
series which was introduced in the March 1978 issue of the Irish Statistical Bulletin. The
number of price quotations had increased to 3,300 and the number of sectors for which in-
dices were published was expanded from 12 to 24. A number of major changes were made
to the structure of the index. The NACE 70 classification system was adopted and the main
thrust of data collection was now the collection of output prices for Irish Manufacturers.
The published data focused more on the ‘Output of Manufacturing Industry’ as opposed to
the General Wholesale Price Index (although this index was retained). New tables for
Building and Construction Materials and Capital Goods Price Indices were introduced.
Much of the formatting and methodology introduced in this series has been retained up to
the current series.
(iv) Index with base 1985 as 100
The fourth series was introduced in September 1989. Weights for industrial producer price
indices were based on 1985 Census of Industrial Production4 figures. Canvassing to im-
prove coverage was again a major feature of the updating programme and at this point in
excess of 4,000 price quotations were being collected. The methodology and format of the
1975=100 series were retained. By this time a new table for Energy Products Purchased by
Manufacturing Industry had been introduced.
(v) Index with base 1995 as 100
This series was introduced in March 2002 with the publication of the January 2002 in-
dex. This series incorporated a number of technical changes as well as an updating of
weights, sample of companies surveyed and products priced. The coding for the pro-
ducer price indices was updated from NACE 70 to NACE Rev.1. The EU prodcom5
coding system was introduced for commodity groupings. The weights were updated to
1995 levels from a number of sources, notably the 1995 Census of Industrial Produc-
tion, 1995 Prodcom Inquiry and National Accounts data.
3 Statistical Office of the European Union.4 The Census of Industrial Production is a detailed annual survey which records a range of data re the activity of manufacturers in Ireland.5 Prodcom (Production sold/Commission work done) is an annual survey, published by the CSO, recording the value of output/work done by industrial firms.
4

(vi) Index with base 2000 as 100
This series was introduced in March 2003 with the publication of the January 2003 index.
This series incorporated a number of technical changes as well as an updating of weights,
sample of companies surveyed and products priced. The coding for the producer price in-
dices was updated from NACE Rev.1 to NACE Rev.1.1. The weights were updated to
2000 levels from a number of sources, notably the 2000 Census of Industrial Production,
2000 Prodcom Inquiry and National Accounts data.
(vii) Index with base 2005 as 100
This series was introduced in June 2010 with the publication of the April 2010 index. This
series incorporated a number of technical changes as well as an updating of weights, sam-
ple of companies surveyed and products priced. The coding for the producer price indices
was updated from NACE Rev.1.1 to NACE Rev.2. The weights were updated to 2005 lev-
els from a number of sources, notably the 2005 Census of Industrial Production, 2005
Prodcom Inquiry and National Accounts data.
Monthly Pricing
Procedures
Price quotations are collected in a monthly inquiry. The method of collection is normally by
means of a postal survey however if more suitable to a respondent by means of email, phone or the
CSO’s Secure Deposit Box response system. The updated system is currently based on approxi-
mately 7,000 monthly price quotations provided by a panel of some 1,300 respondent firms. The
CSO wishes to express appreciation to all respondents for their co-operation. The price quota-
tions relating to individual concerns are treated as strictly confidential and are not divulged in an
identifiable form by the CSO to any other Government Department or outside body.
Each month individualised survey forms are sent to the respondent firms. These incorporate the
detailed specifications of the representative selection of the particular products to be priced on a
monthly basis. Actual transaction prices are sought. The previous month’s price for the item is
presented and the respondent is asked to provide an updated price for the new month. Trade price
lists are only used where respondents are unable to complete the special form.
The price sought is the price invoiced to customers for an item on the 15th day of the month (i.e.
mid-month):
� excluding delivery charges itemised on the invoice separately;
� before discounts or surcharges are applied (standard discounts or surcharges are to be indicated);
� before the addition of direct subsidies;
� exclusive of VAT (except for private vehicles used in the Capital Goods indices);
� inclusive of excise duties.
Pricing procedures are strictly based on the principle that identical items must be priced by re-
spondents on each occasion (i.e. matched basket approach). If discontinuities occur, such as an
item becoming unavailable, respondents are asked to price a suitable replacement product. The
relevant price is excluded from the index calculations until two consecutive monthly quotations
are obtained for the substitute. Where replacement products are excluded from the month’s calcu-
lations the price trend for all other products in that product group is taken as the price trend for the
product excluded. Indirectly, by doing this, a valuation is put on any quality change. This is
known as an indirect or implicit method of quality adjustment.
Index Calculation In technical terms the WPI system is compiled using a variant of the fixed weighted Laspeyres in-
dex formula. When weights are updated at any level, chain-linking is applied. The formula used is
as follows:
=
5
10000
1
10
�
�����
�
�
�����
�
����
����
�
PQ
P
PPQ
m
mm
1000
1
1
�
�����
�
�
�����
�
����
����
�
V
P
PV
m
mm
where:
Q0 and P0: the quantity and price respectively of a commodity in the base period;
Pm: the price of the commodity in the current month;
�: represents summation over all commodities.
In practice the method of compilation of the indices means that base year commodity weights (i.e.
V0= Q0P0) are progressively updated each month and the price indices are derived by dividing the
aggregate current monthly value by the corresponding base year value. The calculations are done
in a number of stages reflecting the weighting structure of the WPI:
(i) Initially average monthly price relatives are determined in the case of each respondent
for individual commodity groupings. These are based on price changes recorded for
identical products from the previous month to the current month. If a respondent prices
more than one commodity within a commodity group, then a weighted (if the informa-
tion is available) or simple arithmetic average is taken of the monthly price relatives;
(ii) The average price relatives of different respondents within a particular commodity
group are averaged and then weighted according to the share of sales recorded by each
respondent, to give a price relative for the commodity group;
(iii) The price relatives for each commodity group within a sector are then used to update the
previous month’s value weights (i.e. Vm-1 = Q0Pm-1) for those commodity groups;
(iv) The monthly sectoral price index is compiled by summing these current monthly value
weights over all the commodity groups within that sector and dividing by the sum of the
previous monthly value weights for those commodity groupings;
(v) The previous months value weights for each sector are updated by the monthly sectoral
price indices to obtain the current month’s updated value for the sector. This value is di-
vided by the corresponding base year value (V0=Q0P0) to get the base year index for the
sector;
(vi) Indices are compiled at higher levels by aggregating the relevant sectoral value weights
and dividing by the sum of the corresponding base year value weights.
This process is illustrated by the chart in Appendix 1.
Industrial Producer
Prices
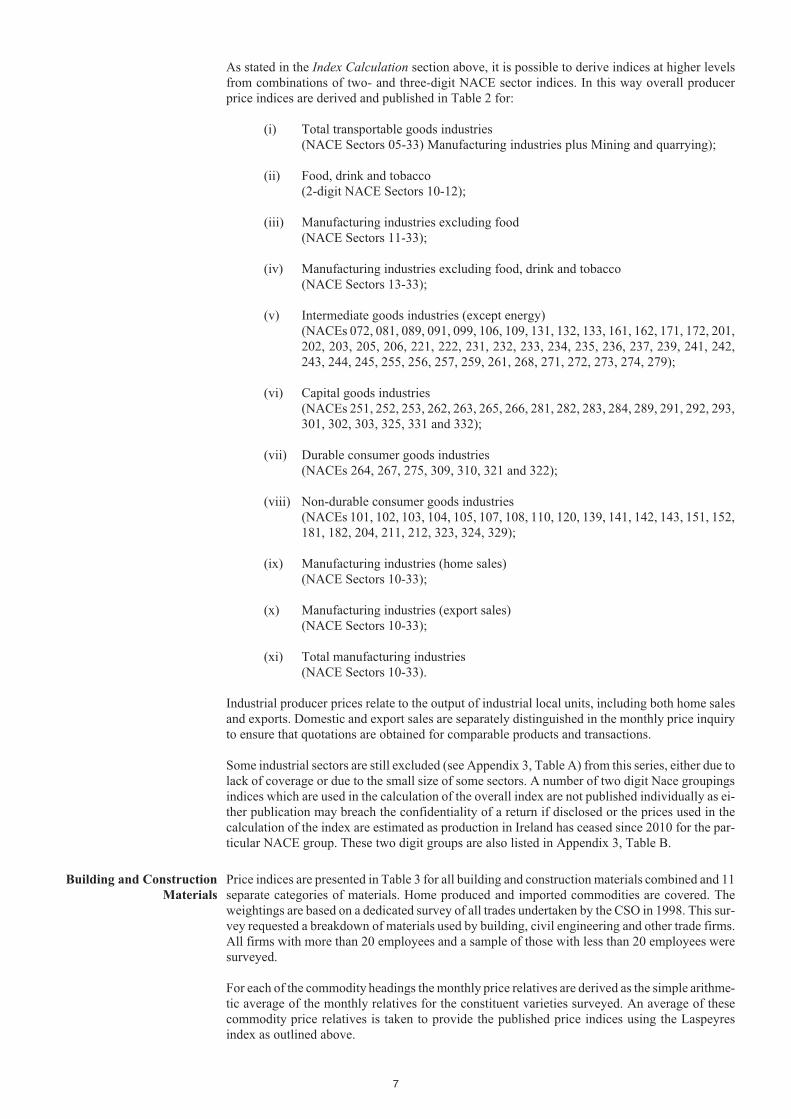
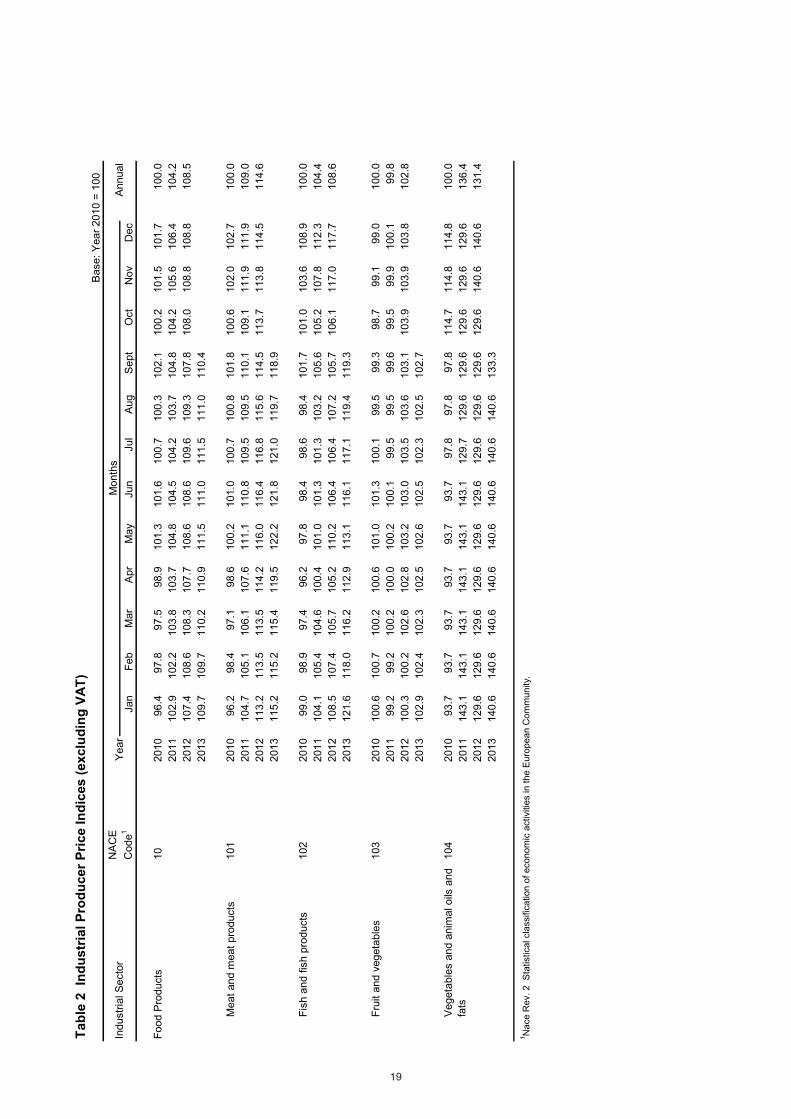
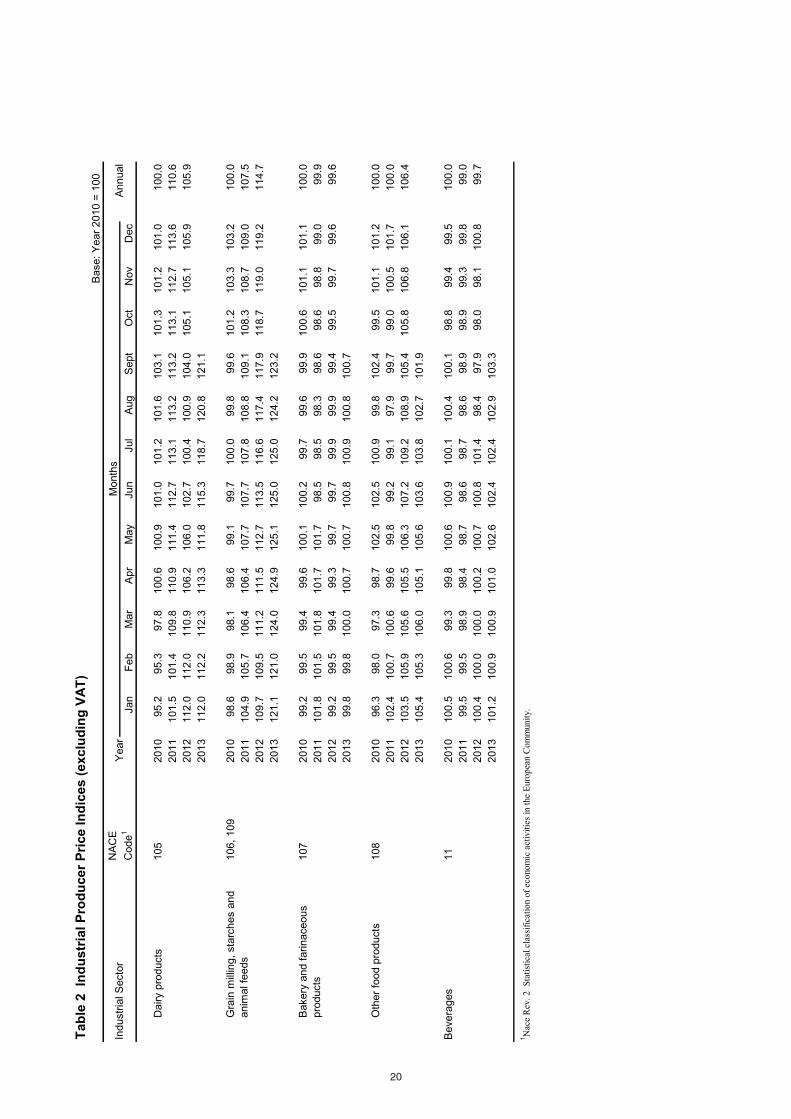
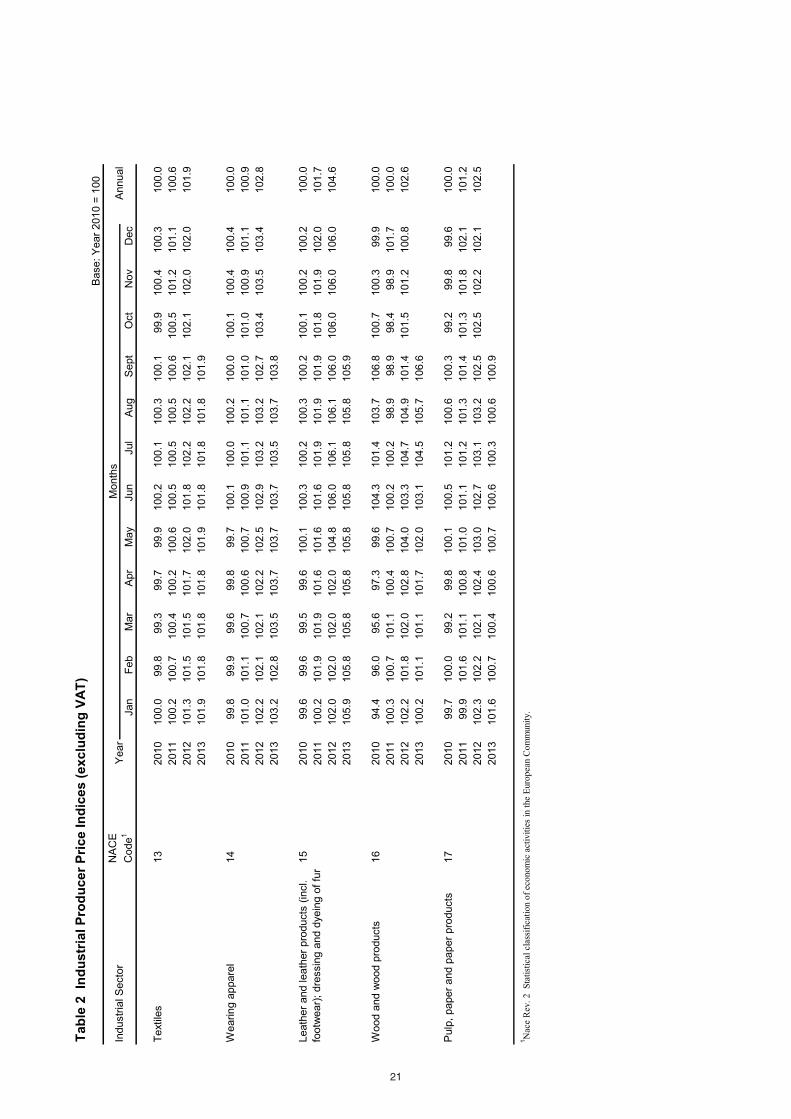
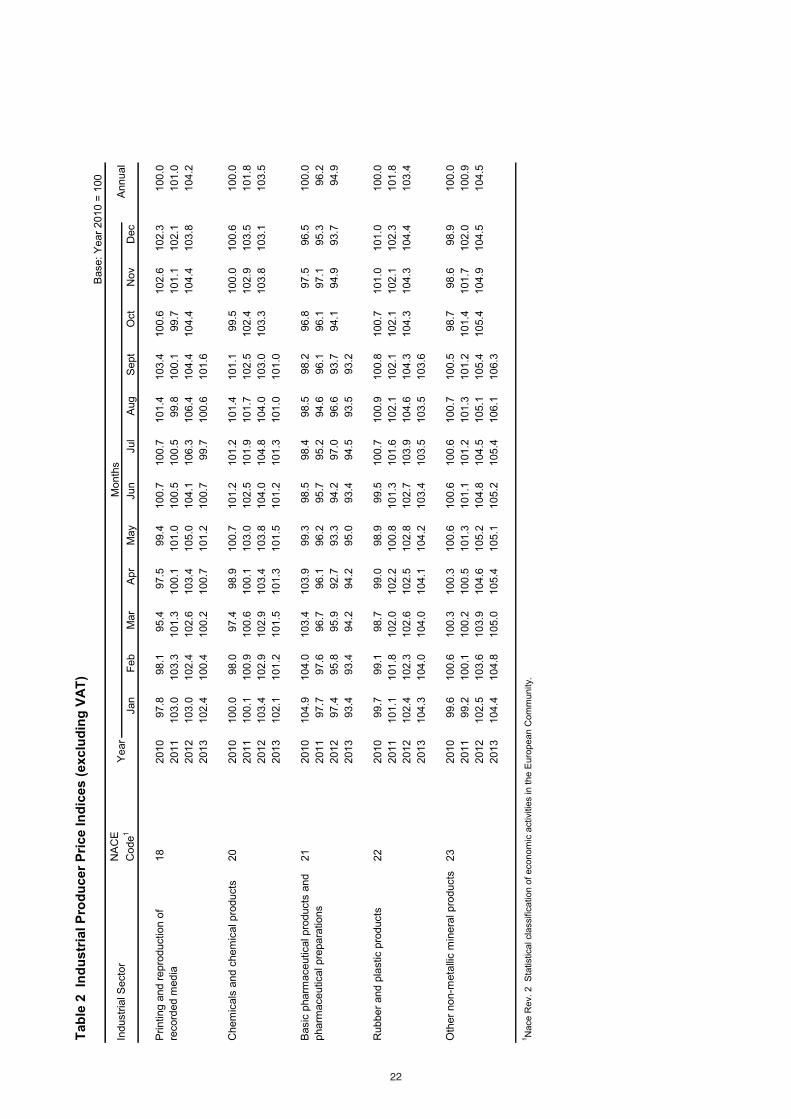
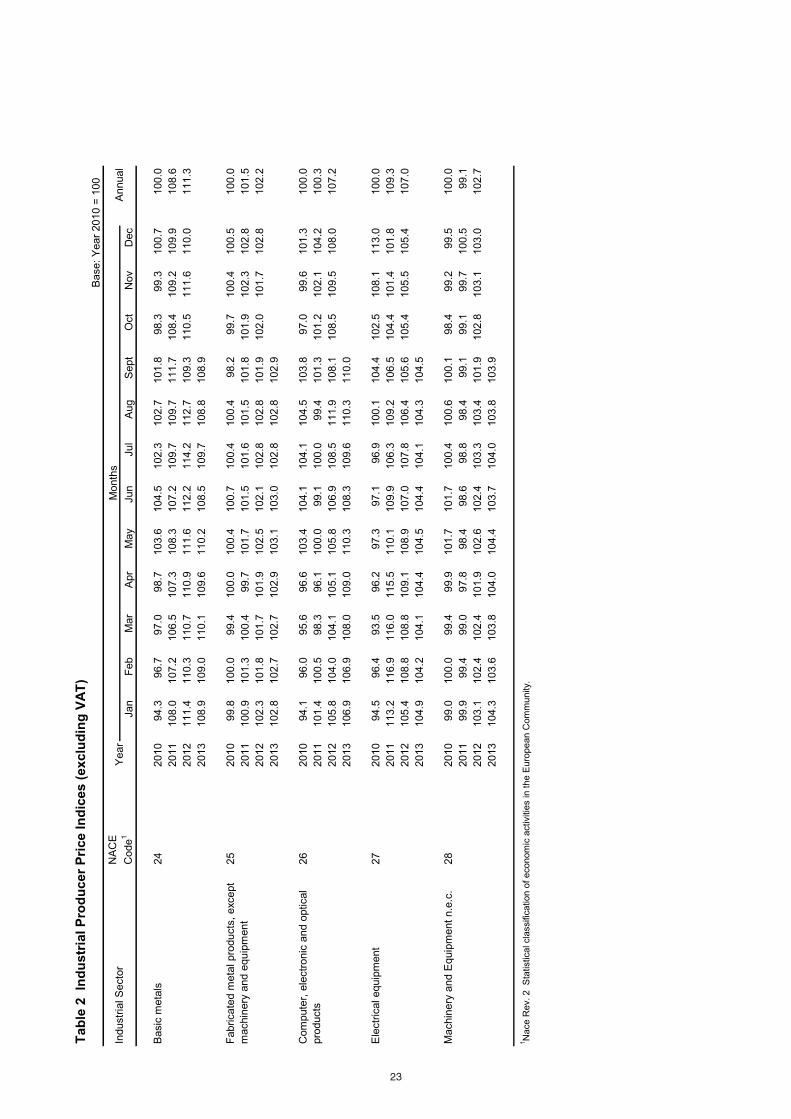
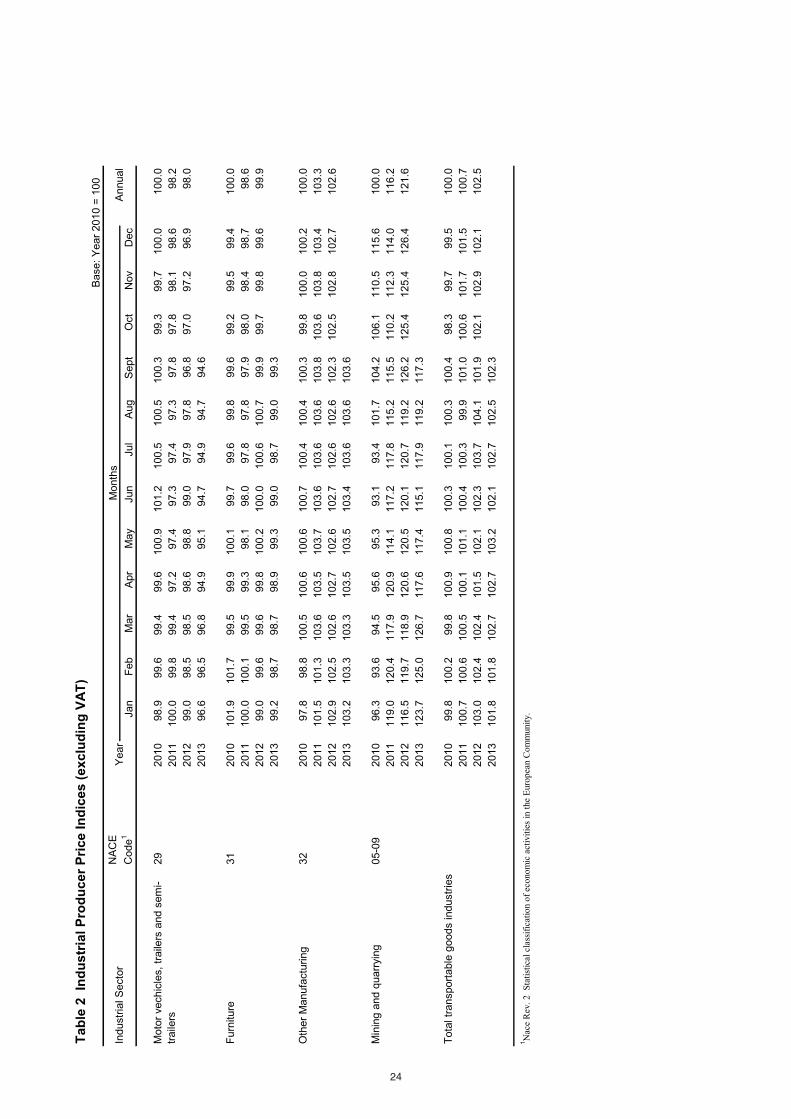
Producer price indices are presented in Table 2 for major industrial sectors defined in terms of lo-
cal units6 and classified on the basis of the Statistical classification of economic activities within
the European Community (NACE Rev.2).
The three-digit NACE sectoral weights used in Table 2 in the current series are based on gross
output figures as reported in the 2010 Census of Industrial Production.
Price indices are published for most two-digit NACE groupings with additional breakdown pro-
vided for various food products. The relevant weights are presented in Appendix 2 of this publi-
cation. At the three digit NACE level these sectoral indices approximate closely to price indices
for the commodities characteristic of these sectors since the compilations are based on local units
for price reporting and weighting purposes. If, for example, a company is classified to a NACE
group for the manufacturing of textiles and a substantial part of the company output is also card-
board boxes then prices for those items are also collected and used in the compilation of the index
for textiles.
6 A local unit is defined as an enterprise or part thereof situated in a geographically identified place. The different geographical locations in which an enterprise
conducts industrial activities are treated as separate local units.
6
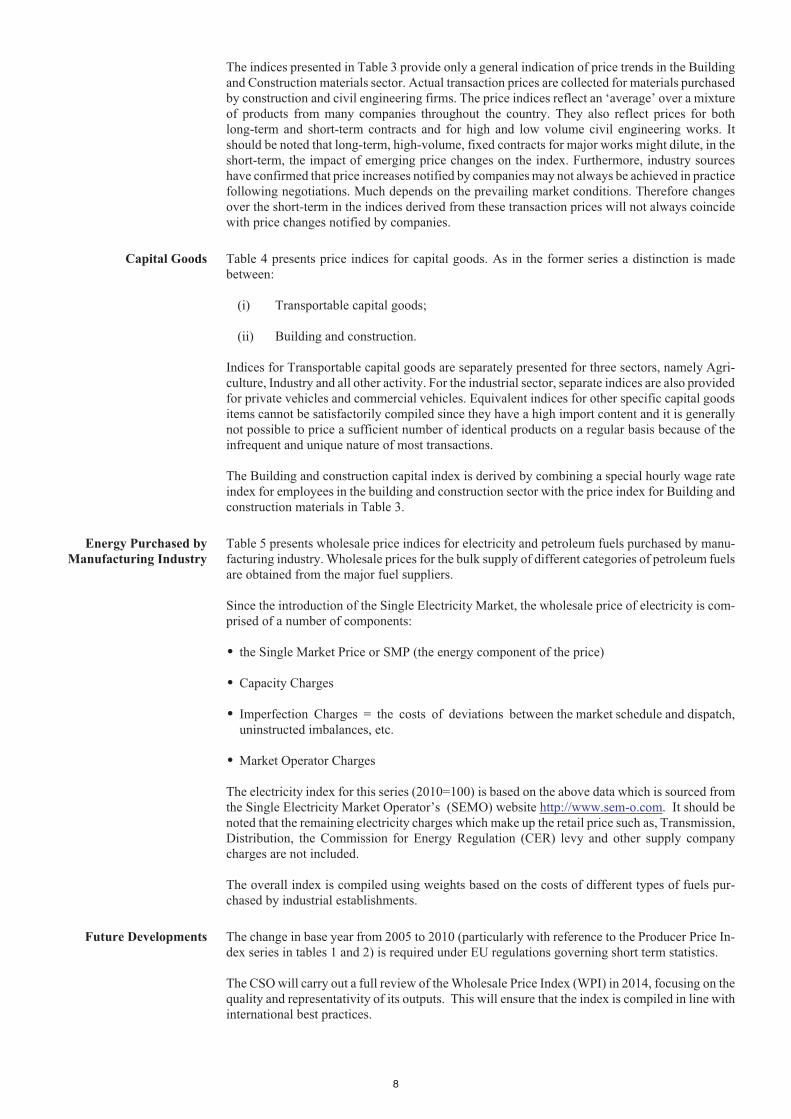
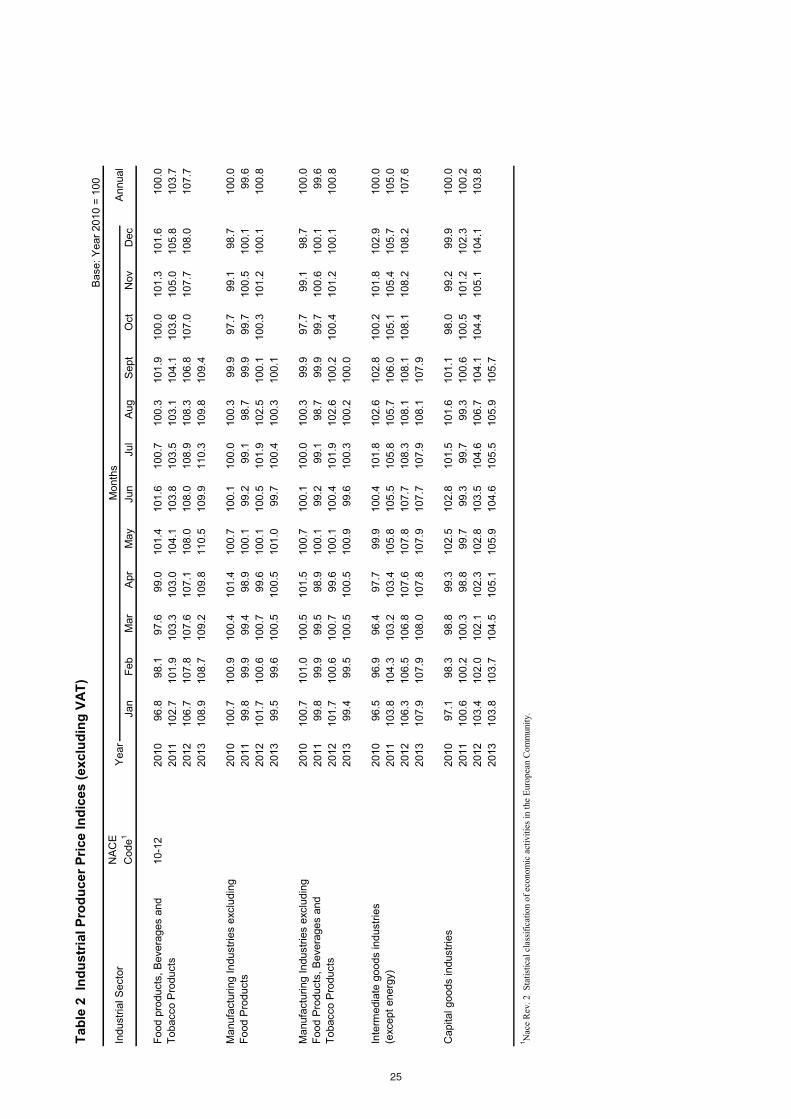
As stated in the Index Calculation section above, it is possible to derive indices at higher levels
from combinations of two- and three-digit NACE sector indices. In this way overall producer
price indices are derived and published in Table 2 for:
(i) Total transportable goods industries
(NACE Sectors 05-33) Manufacturing industries plus Mining and quarrying);
(ii) Food, drink and tobacco
(2-digit NACE Sectors 10-12);
(iii) Manufacturing industries excluding food
(NACE Sectors 11-33);
(iv) Manufacturing industries excluding food, drink and tobacco
(NACE Sectors 13-33);
(v) Intermediate goods industries (except energy)
(NACEs 072, 081, 089, 091, 099, 106, 109, 131, 132, 133, 161, 162, 171, 172, 201,
202, 203, 205, 206, 221, 222, 231, 232, 233, 234, 235, 236, 237, 239, 241, 242,
243, 244, 245, 255, 256, 257, 259, 261, 268, 271, 272, 273, 274, 279);
(vi) Capital goods industries
(NACEs 251, 252, 253, 262, 263, 265, 266, 281, 282, 283, 284, 289, 291, 292, 293,
301, 302, 303, 325, 331 and 332);
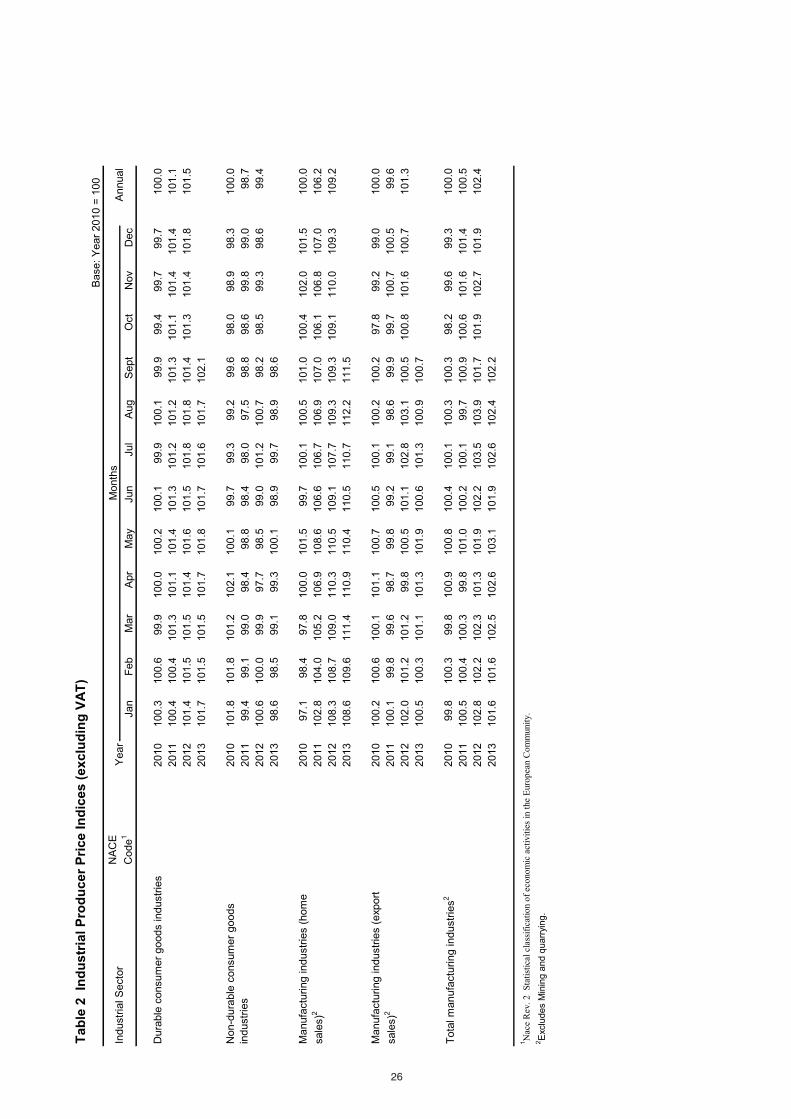
(vii) Durable consumer goods industries
(NACEs 264, 267, 275, 309, 310, 321 and 322);
(viii) Non-durable consumer goods industries
(NACEs 101, 102, 103, 104, 105, 107, 108, 110, 120, 139, 141, 142, 143, 151, 152,
181, 182, 204, 211, 212, 323, 324, 329);
(ix) Manufacturing industries (home sales)
(NACE Sectors 10-33);
(x) Manufacturing industries (export sales)
(NACE Sectors 10-33);
(xi) Total manufacturing industries
(NACE Sectors 10-33).
Industrial producer prices relate to the output of industrial local units, including both home sales
and exports. Domestic and export sales are separately distinguished in the monthly price inquiry
to ensure that quotations are obtained for comparable products and transactions.
Some industrial sectors are still excluded (see Appendix 3, Table A) from this series, either due to
lack of coverage or due to the small size of some sectors. A number of two digit Nace groupings
indices which are used in the calculation of the overall index are not published individually as ei-
ther publication may breach the confidentiality of a return if disclosed or the prices used in the
calculation of the index are estimated as production in Ireland has ceased since 2010 for the par-
ticular NACE group. These two digit groups are also listed in Appendix 3, Table B.
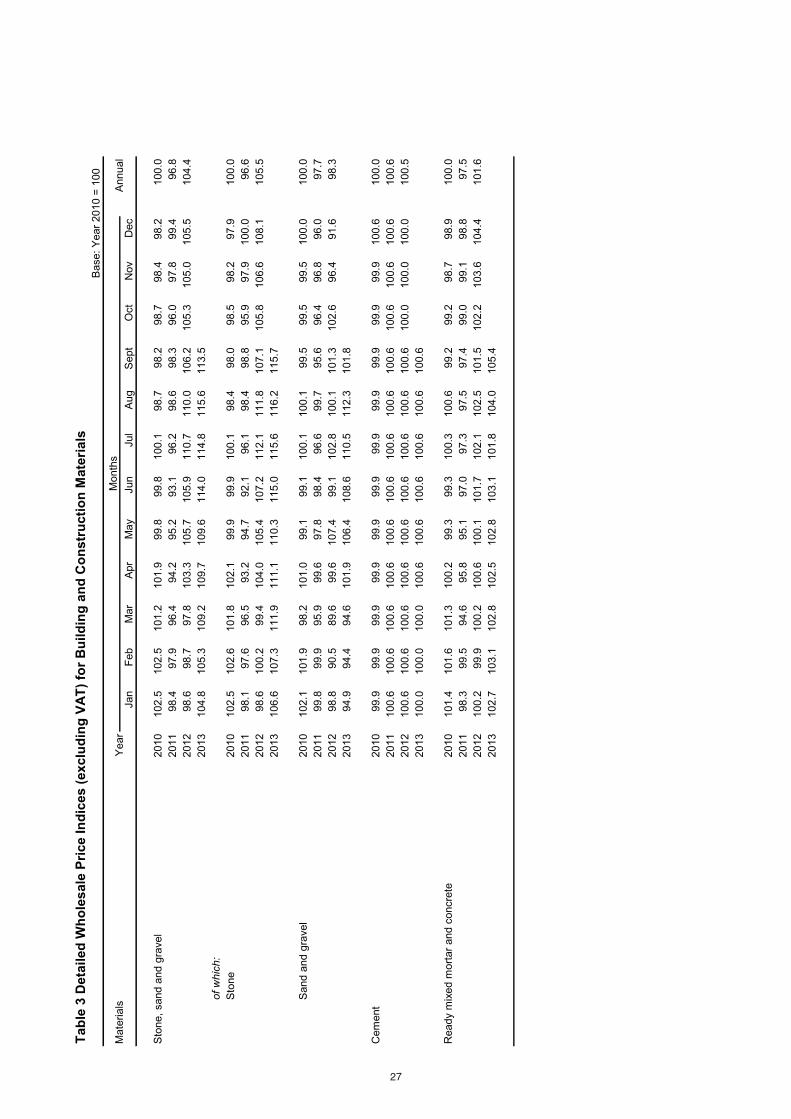
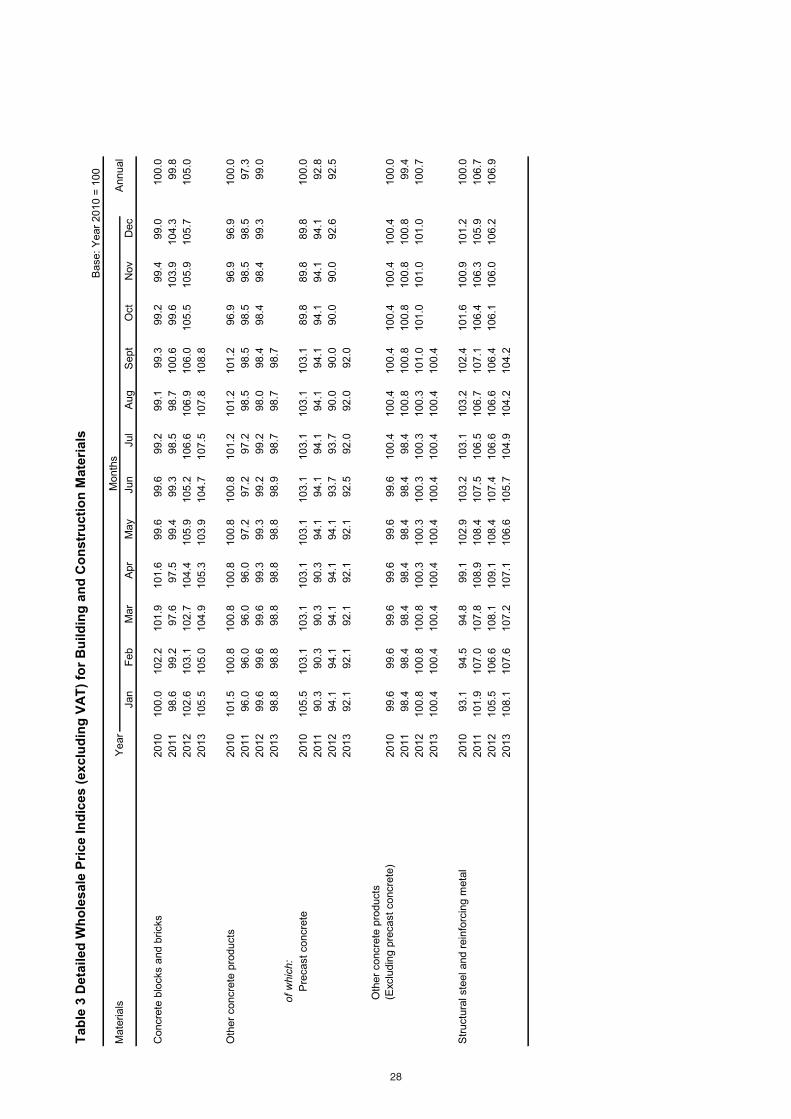
Building and Construction
Materials
Price indices are presented in Table 3 for all building and construction materials combined and 11
separate categories of materials. Home produced and imported commodities are covered. The
weightings are based on a dedicated survey of all trades undertaken by the CSO in 1998. This sur-
vey requested a breakdown of materials used by building, civil engineering and other trade firms.
All firms with more than 20 employees and a sample of those with less than 20 employees were
surveyed.
For each of the commodity headings the monthly price relatives are derived as the simple arithme-
tic average of the monthly relatives for the constituent varieties surveyed. An average of these
commodity price relatives is taken to provide the published price indices using the Laspeyres
index as outlined above.
7
The indices presented in Table 3 provide only a general indication of price trends in the Building
and Construction materials sector. Actual transaction prices are collected for materials purchased
by construction and civil engineering firms. The price indices reflect an ‘average’ over a mixture
of products from many companies throughout the country. They also reflect prices for both
long-term and short-term contracts and for high and low volume civil engineering works. It
should be noted that long-term, high-volume, fixed contracts for major works might dilute, in the
short-term, the impact of emerging price changes on the index. Furthermore, industry sources
have confirmed that price increases notified by companies may not always be achieved in practice
following negotiations. Much depends on the prevailing market conditions. Therefore changes
over the short-term in the indices derived from these transaction prices will not always coincide
with price changes notified by companies.
Capital Goods Table 4 presents price indices for capital goods. As in the former series a distinction is made
between:
(i) Transportable capital goods;
(ii) Building and construction.
Indices for Transportable capital goods are separately presented for three sectors, namely Agri-
culture, Industry and all other activity. For the industrial sector, separate indices are also provided
for private vehicles and commercial vehicles. Equivalent indices for other specific capital goods
items cannot be satisfactorily compiled since they have a high import content and it is generally
not possible to price a sufficient number of identical products on a regular basis because of the
infrequent and unique nature of most transactions.
The Building and construction capital index is derived by combining a special hourly wage rate
index for employees in the building and construction sector with the price index for Building and
construction materials in Table 3.
Energy Purchased by
Manufacturing Industry
Table 5 presents wholesale price indices for electricity and petroleum fuels purchased by manu-
facturing industry. Wholesale prices for the bulk supply of different categories of petroleum fuels
are obtained from the major fuel suppliers.
Since the introduction of the Single Electricity Market, the wholesale price of electricity is com-
prised of a number of components:
� the Single Market Price or SMP (the energy component of the price)
� Capacity Charges
� Imperfection Charges = the costs of deviations between the market schedule and dispatch,
uninstructed imbalances, etc.
� Market Operator Charges
The electricity index for this series (2010=100) is based on the above data which is sourced from
the Single Electricity Market Operator’s (SEMO) website http://www.sem-o.com. It should be
noted that the remaining electricity charges which make up the retail price such as, Transmission,
Distribution, the Commission for Energy Regulation (CER) levy and other supply company
charges are not included.
The overall index is compiled using weights based on the costs of different types of fuels pur-
chased by industrial establishments.
Future Developments The change in base year from 2005 to 2010 (particularly with reference to the Producer Price In-
dex series in tables 1 and 2) is required under EU regulations governing short term statistics.
The CSO will carry out a full review of the Wholesale Price Index (WPI) in 2014, focusing on the
quality and representativity of its outputs. This will ensure that the index is compiled in line with
international best practices.
8

9
Enquires to:
WPI Section,
Central Statistics Office,
Skehard Road,
Cork.
+353-21 453 5447 Fax +353-21 453 5555
+353-1 498 4000 E-mail [email protected]
LoCall 1890 313 414 Website http://www.cso.ie
Ext. 5447/5096
�


Appendices

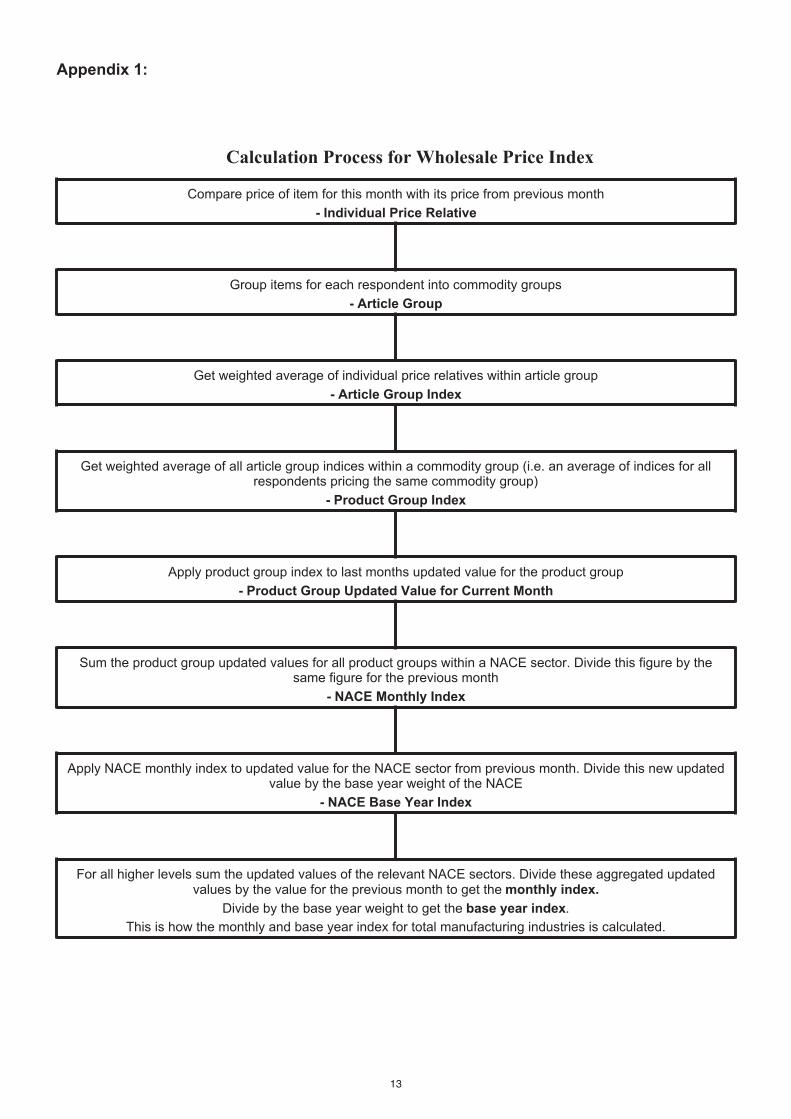
Appendix 1:
Calculation Process for Wholesale Price Index
Compare price of item for this month with its price from previous month
- Individual Price Relative
Group items for each respondent into commodity groups
- Article Group
Get weighted average of individual price relatives within article group
- Article Group Index
Get weighted average of all article group indices within a commodity group (i.e. an average of indices for allrespondents pricing the same commodity group)
- Product Group Index
Apply product group index to last months updated value for the product group
- Product Group Updated Value for Current Month
Sum the product group updated values for all product groups within a NACE sector. Divide this figure by thesame figure for the previous month
- NACE Monthly Index
Apply NACE monthly index to updated value for the NACE sector from previous month. Divide this new updatedvalue by the base year weight of the NACE
- NACE Base Year Index
For all higher levels sum the updated values of the relevant NACE sectors. Divide these aggregated updatedvalues by the value for the previous month to get the monthly index.
Divide by the base year weight to get the base year index.
This is how the monthly and base year index for total manufacturing industries is calculated.
13
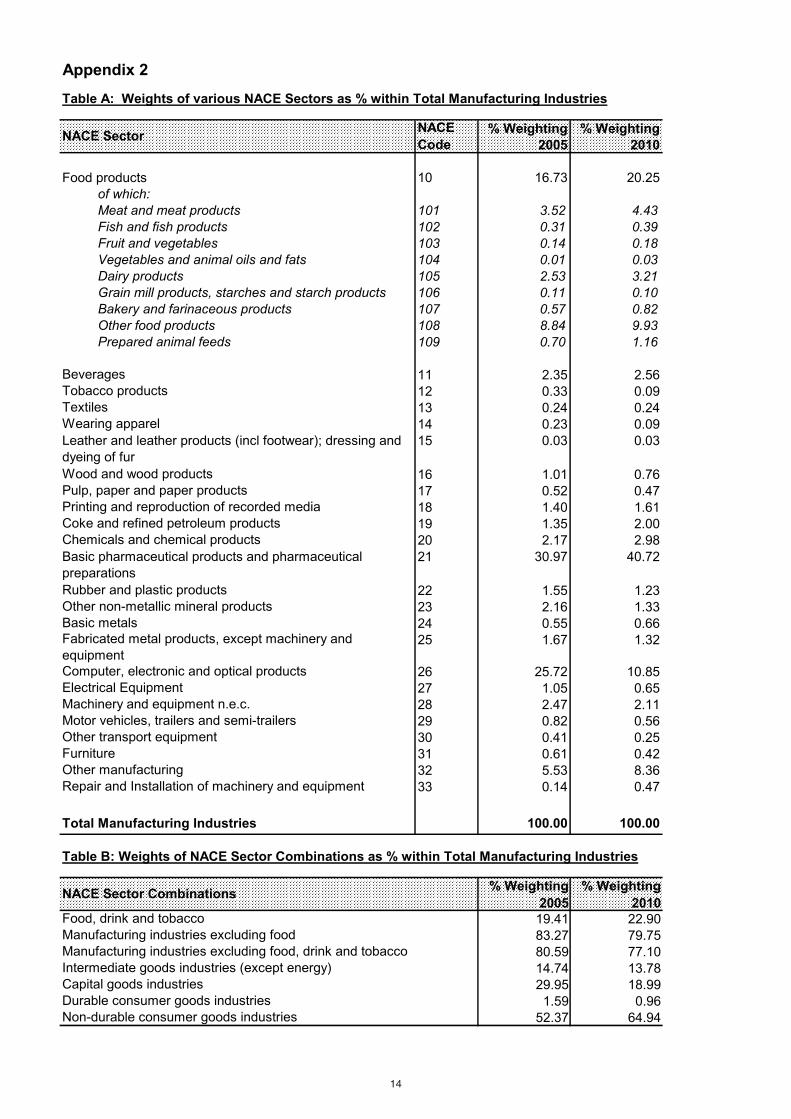
Appendix 2
Table A: Weights of various NACE Sectors as % within Total Manufacturing Industries
% Weighting % Weighting
2005 2010
Food products 10 16.73 20.25
of which:
Meat and meat products 101 3.52 4.43
Fish and fish products 102 0.31 0.39
Fruit and vegetables 103 0.14 0.18
Vegetables and animal oils and fats 104 0.01 0.03
Dairy products 105 2.53 3.21
Grain mill products, starches and starch products 106 0.11 0.10
Bakery and farinaceous products 107 0.57 0.82
Other food products 108 8.84 9.93
Prepared animal feeds 109 0.70 1.16
11 2.35 2.56
12 0.33 0.09
13 0.24 0.24
14 0.23 0.09
15 0.03 0.03
16 1.01 0.76
17 0.52 0.47
18 1.40 1.61
19 1.35 2.00
20 2.17 2.98
21 30.97 40.72
22 1.55 1.23
23 2.16 1.33
24 0.55 0.66
25 1.67 1.32
26 25.72 10.85
27 1.05 0.65
28 2.47 2.11
29 0.82 0.56
30 0.41 0.25
31 0.61 0.42
32 5.53 8.36
33 0.14 0.47
Total Manufacturing Industries 100.00 100.00
Table B: Weights of NACE Sector Combinations as % within Total Manufacturing Industries
% Weighting
2005
% Weighting
2010
19.41 22.90
83.27 79.75
80.59 77.10
14.74 13.78
29.95 18.99
1.59 0.96
52.37 64.94
Durable consumer goods industries
Non-durable consumer goods industries
NACE Sector Combinations
Food, drink and tobacco
Manufacturing industries excluding food
Manufacturing industries excluding food, drink and tobacco
Intermediate goods industries (except energy)
Capital goods industries
Motor vehicles, trailers and semi-trailers
Other transport equipment
Furniture
Basic metals
Fabricated metal products, except machinery and
equipment
Other manufacturing
Repair and Installation of machinery and equipment
Electrical Equipment
Machinery and equipment n.e.c.
Computer, electronic and optical products
Coke and refined petroleum products
NACE
Code
Beverages
Tobacco products
Textiles
Wearing apparel
NACE Sector
Leather and leather products (incl footwear); dressing and
dyeing of fur
Wood and wood products
Pulp, paper and paper products
Printing and reproduction of recorded media
Chemicals and chemical products
Basic pharmaceutical products and pharmaceutical
preparations
Rubber and plastic products
Other non-metallic mineral products
14
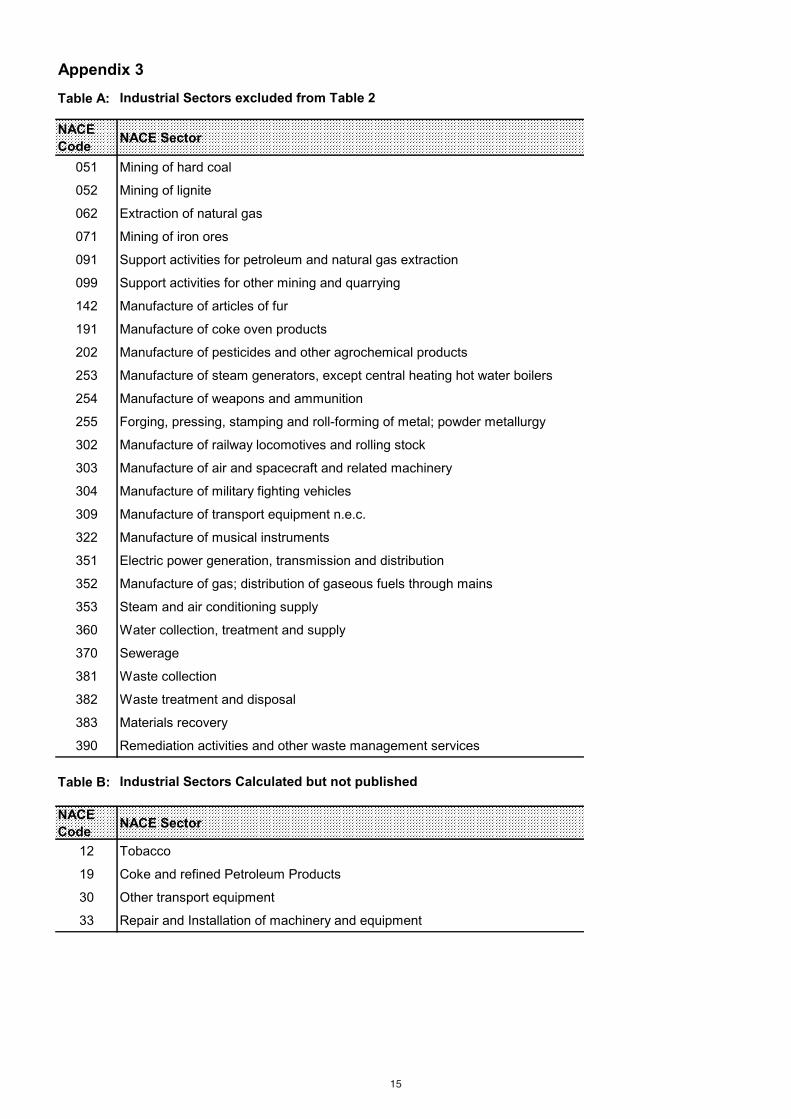
Appendix 3
Table A: Industrial Sectors excluded from Table 2
NACE
CodeNACE Sector
051 Mining of hard coal
052 Mining of lignite
062 Extraction of natural gas
071 Mining of iron ores
091 Support activities for petroleum and natural gas extraction
099 Support activities for other mining and quarrying
142 Manufacture of articles of fur
191 Manufacture of coke oven products
202 Manufacture of pesticides and other agrochemical products
253 Manufacture of steam generators, except central heating hot water boilers
254 Manufacture of weapons and ammunition
255 Forging, pressing, stamping and roll-forming of metal; powder metallurgy
302 Manufacture of railway locomotives and rolling stock
303 Manufacture of air and spacecraft and related machinery
304 Manufacture of military fighting vehicles
309 Manufacture of transport equipment n.e.c.
322 Manufacture of musical instruments
351 Electric power generation, transmission and distribution
352 Manufacture of gas; distribution of gaseous fuels through mains
353 Steam and air conditioning supply
360 Water collection, treatment and supply
370 Sewerage
381 Waste collection
382 Waste treatment and disposal
383 Materials recovery
390 Remediation activities and other waste management services
Table B: Industrial Sectors Calculated but not published
NACE
CodeNACE Sector
12 Tobacco
19 Coke and refined Petroleum Products
30 Other transport equipment
33 Repair and Installation of machinery and equipment
15


Appendix 4 Tables - Recalculated Backdated Series(for information purposes)
Price
Index
%C
hange
on
Pre
cedin
g
Period
Annual%
Change
Price
Index
%C
hange
on
Pre
cedin
g
Period
Annual%
Change
Price
Index
%C
hange
on
Pre
cedin
g
Period
Annual%
Change
2010
Year
100.0
n/a
n/a
100.0
n/a
n/a
100.0
n/a
n/a
2011
Year
100.5
0.5
0.5
106.2
6.2
6.2
99.6
-0.4
-0.4
2012
Year
102.4
1.9
1.9
109.2
2.8
2.8
101.3
1.7
1.7
2010
Quart
er
1100.0
n/a
n/a
97.8
n/a
n/a
100.3
n/a
n/a
Quart
er
2100.7
0.7
n/a
100.4
2.7
n/a
100.8
0.5
n/a
Quart
er
3100.2
-0.5
n/a
100.5
0.1
n/a
100.2
-0.6
n/a
Quart
er
499.0
-1.2
n/a
101.3
0.8
n/a
98.7
-1.5
n/a
2011
Quart
er
1100.4
1.4
0.4
104.0
2.7
6.3
99.8
1.1
-0.5
Quart
er
2100.3
-0.1
-0.4
107.4
3.3
7.0
99.2
-0.6
-1.6
Quart
er
3100.2
-0.1
0.0
106.9
-0.5
6.4
99.2
0.0
-1.0
Quart
er
4101.2
1.0
2.2
106.6
-0.3
5.2
100.3
1.1
1.6
2012
Quart
er
1102.4
1.2
2.0
108.7
2.0
4.5
101.5
1.2
1.7
Quart
er
2101.8
-0.6
1.5
110.0
1.2
2.4
100.5
-1.0
1.3
Quart
er
3103.0
1.2
2.8
108.8
-1.1
1.8
102.1
1.6
2.9
Quart
er
4102.2
-0.8
1.0
109.5
0.6
2.7
101.0
-1.1
0.7
2013
Quart
er
1101.9
-0.3
-0.5
109.9
0.4
1.1
100.6
-0.4
-0.9
Quart
er
2102.5
0.6
0.7
110.6
0.6
0.5
101.3
0.7
0.8
Quart
er
3102.4
-0.1
-0.6
111.5
0.8
2.5
101.0
-0.3
-1.1
2013
January
101.6
-0.3
-1.2
108.6
-0.6
0.3
100.5
-0.2
-1.5
Febru
ary
101.6
0.0
-0.6
109.6
0.9
0.8
100.3
-0.2
-0.9
Marc
h102.5
0.9
0.2
111.4
1.6
2.2
101.1
0.8
-0.1
April
102.6
0.1
1.3
110.9
-0.4
0.5
101.3
0.2
1.5
May
103.1
0.5
1.2
110.4
-0.5
-0.1
101.9
0.6
1.4
June
101.9
-1.2
-0.3
110.5
0.1
1.3
100.6
-1.3
-0.5
July
102.6
0.7
-0.9
110.7
0.2
2.8
101.3
0.7
-1.5
August
102.4
-0.2
-1.4
112.2
1.4
2.7
100.9
-0.4
-2.1
Septe
mber
102.2
-0.2
0.5
111.5
-0.6
2.0
100.7
-0.2
0.2
Tab
le1
Man
ufa
ctu
rin
gIn
du
str
ies
Ou
tpu
tP
ric
eIn
dic
es
(ex
clu
din
gV
AT
)B
ase:
Year
2010
=100
Period
Manufa
ctu
ring
Industr
ies
Outp
ut
Price
Index
Manufa
ctu
ring
Industr
ies
Outp
ut
Price
Index
(Hom
eS
ale
s)
Manufa
ctu
ring
Industr
ies
Outp
ut
Price
Index
(Export
Sale
s)
Tab
le2
Ind
ustr
ialP
rod
ucer
Pri
ce
Ind
ices
(exclu
din
gV
AT
)B
ase:
Year
2010
=100
Jan
Feb
Mar
Apr
May
Jun
Jul
Aug
Sept
Oct
Nov
Dec
Food
Pro
ducts
10
2010
96.4
97.8
97.5
98.9
101.3
101.6
100.7
100.3
102.1
100.2
101.5
101.7
100.0
2011
102.9
102.2
103.8
103.7
104.8
104.5
104.2
103.7
104.8
104.2
105.6
106.4
104.2
2012
107.4
108.6
108.3
107.7
108.6
108.6
109.6
109.3
107.8
108.0
108.8
108.8
108.5
2013
109.7
109.7
110.2
110.9
111.5
111.0
111.5
111.0
110.4
Meat
and
meat
pro
ducts
101
2010
96.2
98.4
97.1
98.6
100.2
101.0
100.7
100.8
101.8
100.6
102.0
102.7
100.0
2011
104.7
105.1
106.1
107.6
111.1
110.8
109.5
109.5
110.1
109.1
111.9
111.9
109.0
2012
113.2
113.5
113.5
114.2
116.0
116.4
116.8
115.6
114.5
113.7
113.8
114.5
114.6
2013
115.2
115.2
115.4
119.5
122.2
121.8
121.0
119.7
118.9
Fis
hand
fish
pro
ducts
102
2010
99.0
98.9
97.4
96.2
97.8
98.4
98.6
98.4
101.7
101.0
103.6
108.9
100.0
2011
104.1
105.4
104.6
100.4
101.0
101.3
101.3
103.2
105.6
105.2
107.8
112.3
104.4
2012
108.5
107.4
105.7
105.2
110.2
106.4
106.4
107.2
105.7
106.1
117.0
117.7
108.6
2013
121.6
118.0
116.2
112.9
113.1
116.1
117.1
119.4
119.3
Fru
itand
vegeta
ble
s103
2010
100.6
100.7
100.2
100.6
101.0
101.3
100.1
99.5
99.3
98.7
99.1
99.0
100.0
2011
99.2
99.2
100.2
100.0
100.2
100.1
99.5
99.5
99.6
99.5
99.9
100.1
99.8
2012
100.3
100.2
102.6
102.8
103.2
103.0
103.5
103.6
103.1
103.9
103.9
103.8
102.8
2013
102.9
102.4
102.3
102.5
102.6
102.5
102.3
102.5
102.7
104
2010
93.7
93.7
93.7
93.7
93.7
93.7
97.8
97.8
97.8
114.7
114.8
114.8
100.0
2011
143.1
143.1
143.1
143.1
143.1
143.1
129.7
129.6
129.6
129.6
129.6
129.6
136.4
2012
129.6
129.6
129.6
129.6
129.6
129.6
129.6
129.6
129.6
129.6
140.6
140.6
131.4
2013
140.6
140.6
140.6
140.6
140.6
140.6
140.6
140.6
133.3
1N
ace
Rev.2
Sta
tisticalcla
ssific
ation
ofeconom
icactivitie
sin
the
Euro
pean
Com
munity.
Annual
Vegeta
ble
sand
anim
aloils
and
fats
Industr
ialS
ecto
rN
AC
E
Code
1Y
ear
Month
s
Tab
le2
Ind
ustr
ialP
rod
ucer
Pri
ce
Ind
ices
(exclu
din
gV
AT
)B
ase:
Year
2010
=100
Jan
Feb
Mar
Apr
May
Jun
Jul
Aug
Sept
Oct
Nov
Dec
Dairy
pro
ducts
105
2010
95.2
95.3
97.8
100.6
100.9
101.0
101.2
101.6
103.1
101.3
101.2
101.0
100.0
2011
101.5
101.4
109.8
110.9
111.4
112.7
113.1
113.2
113.2
113.1
112.7
113.6
110.6
2012
112.0
112.0
110.9
106.2
106.0
102.7
100.4
100.9
104.0
105.1
105.1
105.9
105.9
2013
112.0
112.2
112.3
113.3
111.8
115.3
118.7
120.8
121.1
106,
109
2010
98.6
98.9
98.1
98.6
99.1
99.7
100.0
99.8
99.6
101.2
103.3
103.2
100.0
2011
104.9
105.7
106.4
106.4
107.7
107.7
107.8
108.8
109.1
108.3
108.7
109.0
107.5
2012
109.7
109.5
111.2
111.5
112.7
113.5
116.6
117.4
117.9
118.7
119.0
119.2
114.7
2013
121.1
121.0
124.0
124.9
125.1
125.0
125.0
124.2
123.2
107
2010
99.2
99.5
99.4
99.6
100.1
100.2
99.7
99.6
99.9
100.6
101.1
101.1
100.0
2011
101.8
101.5
101.8
101.7
101.7
98.5
98.5
98.3
98.6
98.6
98.8
99.0
99.9
2012
99.2
99.5
99.4
99.3
99.7
99.7
99.9
99.9
99.4
99.5
99.7
99.6
99.6
2013
99.8
99.8
100.0
100.7
100.7
100.8
100.9
100.8
100.7
108
2010
96.3
98.0
97.3
98.7
102.5
102.5
100.9
99.8
102.4
99.5
101.1
101.2
100.0
2011
102.4
100.7
100.6
99.6
99.8
99.2
99.1
97.9
99.7
99.0
100.5
101.7
100.0
2012
103.5
105.9
105.6
105.5
106.3
107.2
109.2
108.9
105.4
105.8
106.8
106.1
106.4
2013
105.4
105.3
106.0
105.1
105.6
103.6
103.8
102.7
101.9
Bevera
ges
11
2010
100.5
100.6
99.3
99.8
100.6
100.9
100.1
100.4
100.1
98.8
99.4
99.5
100.0
2011
99.5
99.5
98.9
98.4
98.7
98.6
98.7
98.6
98.9
98.9
99.3
99.8
99.0
2012
100.4
100.0
100.0
100.2
100.7
100.8
101.4
98.4
97.9
98.0
98.1
100.8
99.7
2013
101.2
100.9
100.9
101.0
102.6
102.4
102.4
102.9
103.3
1N
ace
Rev
.2
Sta
tist
ical
clas
sifi
cati
on
of
eco
nom
icac
tivit
ies
inth
eE
uro
pea
nC
om
munit
y.
Oth
er
food
pro
ducts
Annual
Gra
inm
illin
g,
sta
rches
and
anim
alfe
eds
Bakery
and
farinaceous
pro
ducts
Industr
ialS
ecto
rN
AC
E
Code
1Y
ear
Month
s
Tab
le2
Ind
us
tria
lP
rod
uc
er
Pri
ce
Ind
ice
s(e
xc
lud
ing
VA
T)
Base:
Year
2010
=100
Jan
Feb
Mar
Apr
May
Jun
Jul
Aug
Sept
Oct
Nov
Dec
13
2010
100.0
99.8
99.3
99.7
99.9
100.2
100.1
100.3
100.1
99.9
100.4
100.3
100.0
2011
100.2
100.7
100.4
100.2
100.6
100.5
100.5
100.5
100.6
100.5
101.2
101.1
100.6
2012
101.3
101.5
101.5
101.7
102.0
101.8
102.2
102.2
102.1
102.1
102.0
102.0
101.9
2013
101.9
101.8
101.8
101.8
101.9
101.8
101.8
101.8
101.9
14
2010
99.8
99.9
99.6
99.8
99.7
100.1
100.0
100.2
100.0
100.1
100.4
100.4
100.0
2011
101.0
101.1
100.7
100.6
100.7
100.9
101.1
101.1
101.0
101.0
100.9
101.1
100.9
2012
102.2
102.1
102.1
102.2
102.5
102.9
103.2
103.2
102.7
103.4
103.5
103.4
102.8
2013
103.2
102.8
103.5
103.7
103.7
103.7
103.5
103.7
103.8
15
2010
99.6
99.6
99.5
99.6
100.1
100.3
100.2
100.3
100.2
100.1
100.2
100.2
100.0
2011
100.2
101.9
101.9
101.6
101.6
101.6
101.9
101.9
101.9
101.8
101.9
102.0
101.7
2012
102.0
102.0
102.0
102.0
104.8
106.0
106.1
106.1
106.0
106.0
106.0
106.0
104.6
2013
105.9
105.8
105.8
105.8
105.8
105.8
105.8
105.8
105.9
Wood
and
wood
pro
ducts
16
2010
94.4
96.0
95.6
97.3
99.6
104.3
101.4
103.7
106.8
100.7
100.3
99.9
100.0
2011
100.3
100.7
101.1
100.4
100.7
100.2
100.2
98.9
98.9
98.4
98.9
101.7
100.0
2012
102.2
101.8
102.0
102.8
104.0
103.3
104.7
104.9
101.4
101.5
101.2
100.8
102.6
2013
100.2
101.1
101.1
101.7
102.0
103.1
104.5
105.7
106.6
17
2010
99.7
100.0
99.2
99.8
100.1
100.5
101.2
100.6
100.3
99.2
99.8
99.6
100.0
2011
99.9
101.6
101.1
100.8
101.0
101.1
101.2
101.3
101.4
101.3
101.8
102.1
101.2
2012
102.3
102.2
102.1
102.4
103.0
102.7
103.1
103.2
102.5
102.5
102.2
102.1
102.5
2013
101.6
100.7
100.4
100.6
100.7
100.6
100.3
100.6
100.9
1N
ace
Rev
.2
Sta
tist
ical
clas
sifi
cati
on
of
eco
nom
icac
tivit
ies
inth
eE
uro
pea
nC
om
munit
y.
Annual
Wearing
appare
l
Textile
s
Industr
ialS
ecto
rN
AC
E
Code
1
Leath
er
and
leath
er
pro
ducts
(incl.
footw
ear)
;dre
ssin
gand
dyein
gof
fur
Pulp
,paper
and
paper
pro
ducts
Year
Month
s
Tab
le2
Ind
ustr
ialP
rod
ucer
Pri
ce
Ind
ices
(exclu
din
gV
AT
)
Base:
Year
2010
=100
Jan
Feb
Mar
Apr
May
Jun
Jul
Aug
Sept
Oct
Nov
Dec
18
2010
97.8
98.1
95.4
97.5
99.4
100.7
100.7
101.4
103.4
100.6
102.6
102.3
100.0
2011
103.0
103.3
101.3
100.1
101.0
100.5
100.5
99.8
100.1
99.7
101.1
102.1
101.0
2012
103.0
102.4
102.6
103.4
105.0
104.1
106.3
106.4
104.4
104.4
104.4
103.8
104.2
2013
102.4
100.4
100.2
100.7
101.2
100.7
99.7
100.6
101.6
20
2010
100.0
98.0
97.4
98.9
100.7
101.2
101.2
101.4
101.1
99.5
100.0
100.6
100.0
2011
100.1
100.9
100.6
100.1
103.0
102.5
101.9
101.7
102.5
102.4
102.9
103.5
101.8
2012
103.4
102.9
102.9
103.4
103.8
104.0
104.8
104.0
103.0
103.3
103.8
103.1
103.5
2013
102.1
101.2
101.5
101.3
101.5
101.2
101.3
101.0
101.0
21
2010
104.9
104.0
103.4
103.9
99.3
98.5
98.4
98.5
98.2
96.8
97.5
96.5
100.0
2011
97.7
97.6
96.7
96.1
96.2
95.7
95.2
94.6
96.1
96.1
97.1
95.3
96.2
2012
97.4
95.8
95.9
92.7
93.3
94.2
97.0
96.6
93.7
94.1
94.9
93.7
94.9
2013
93.4
93.4
94.2
94.2
95.0
93.4
94.5
93.5
93.2
22
2010
99.7
99.1
98.7
99.0
98.9
99.5
100.7
100.9
100.8
100.7
101.0
101.0
100.0
2011
101.1
101.8
102.0
102.2
100.8
101.3
101.6
102.1
102.1
102.1
102.1
102.3
101.8
2012
102.4
102.3
102.6
102.5
102.8
102.7
103.9
104.6
104.3
104.3
104.3
104.4
103.4
2013
104.3
104.0
104.0
104.1
104.2
103.4
103.5
103.5
103.6
23
2010
99.6
100.6
100.3
100.3
100.6
100.6
100.6
100.7
100.5
98.7
98.6
98.9
100.0
2011
99.2
100.1
100.2
100.5
101.3
101.1
101.2
101.3
101.2
101.4
101.7
102.0
100.9
2012
102.5
103.6
103.9
104.6
105.2
104.8
104.5
105.1
105.4
105.4
104.9
104.5
104.5
2013
104.4
104.8
105.0
105.4
105.1
105.2
105.4
106.1
106.3
1N
ace
Rev.2
Sta
tisticalcla
ssific
ation
ofeconom
icactivitie
sin
the
Euro
pean
Com
munity.
Annual
Printing
and
repro
duction
of
record
ed
media
Industr
ialS
ecto
rN
AC
E
Code
1
Rubber
and
pla
stic
pro
ducts
Oth
er
non-m
eta
llic
min
era
lpro
ducts
Year
Month
s
Chem
icals
and
chem
icalpro
ducts
Basic
pharm
aceuticalpro
ducts
and
pharm
aceuticalpre
para
tions
Tab
le2
Ind
ustr
ialP
rod
ucer
Pri
ce
Ind
ices
(exclu
din
gV
AT
)B
ase:
Year
2010
=100
Jan
Feb
Mar
Apr
May
Jun
Jul
Aug
Sept
Oct
Nov
Dec
24
2010
94.3
96.7
97.0
98.7
103.6
104.5
102.3
102.7
101.8
98.3
99.3
100.7
100.0
2011
108.0
107.2
106.5
107.3
108.3
107.2
109.7
109.7
111.7
108.4
109.2
109.9
108.6
2012
111.4
110.3
110.7
110.9
111.6
112.2
114.2
112.7
109.3
110.5
111.6
110.0
111.3
2013
108.9
109.0
110.1
109.6
110.2
108.5
109.7
108.8
108.9
25
2010
99.8
100.0
99.4
100.0
100.4
100.7
100.4
100.4
98.2
99.7
100.4
100.5
100.0
2011
100.9
101.3
100.4
99.7
101.7
101.5
101.6
101.5
101.8
101.9
102.3
102.8
101.5
2012
102.3
101.8
101.7
101.9
102.5
102.1
102.8
102.8
101.9
102.0
101.7
102.8
102.2
2013
102.8
102.7
102.7
102.9
103.1
103.0
102.8
102.8
102.9
26
2010
94.1
96.0
95.6
96.6
103.4
104.1
104.1
104.5
103.8
97.0
99.6
101.3
100.0
2011
101.4
100.5
98.3
96.1
100.0
99.1
100.0
99.4
101.3
101.2
102.1
104.2
100.3
2012
105.8
104.0
104.1
105.1
105.8
106.9
108.5
111.9
108.1
108.5
109.5
108.0
107.2
2013
106.9
106.9
108.0
109.0
110.3
108.3
109.6
110.3
110.0
27
2010
94.5
96.4
93.5
96.2
97.3
97.1
96.9
100.1
104.4
102.5
108.1
113.0
100.0
2011
113.2
116.9
116.0
115.5
110.1
109.9
106.3
109.2
106.5
104.4
101.4
101.8
109.3
2012
105.4
108.8
108.8
109.1
108.9
107.0
107.8
106.4
105.6
105.4
105.5
105.4
107.0
2013
104.9
104.2
104.1
104.4
104.5
104.4
104.1
104.3
104.5
28
2010
99.0
100.0
99.4
99.9
101.7
101.7
100.4
100.6
100.1
98.4
99.2
99.5
100.0
2011
99.9
99.4
99.0
97.8
98.4
98.6
98.8
98.4
99.1
99.1
99.7
100.5
99.1
2012
103.1
102.4
102.4
101.9
102.6
102.4
103.3
103.4
101.9
102.8
103.1
103.0
102.7
2013
104.3
103.6
103.8
104.0
104.4
103.7
104.0
103.8
103.9
1N
ace
Rev.2
Sta
tisticalcla
ssific
ation
ofeconom
icactivitie
sin
the
Euro
pean
Com
munity.
Annual
Ele
ctr
icalequip
ment
Basic
meta
ls
Com
pute
r,ele
ctr
onic
and
optical
pro
ducts
Fabricate
dm
eta
lpro
ducts
,except
machin
ery
and
equip
ment
Industr
ialS
ecto
r
Machin
ery
and
Equip
ment
n.e
.c.
NA
CE
Code
1Y
ear
Month
s
Tab
le2
Ind
us
tria
lP
rod
uc
er
Pri
ce
Ind
ice
s(e
xc
lud
ing
VA
T)
Base:
Year
2010
=100
Jan
Feb
Mar
Apr
May
Jun
Jul
Aug
Sept
Oct
Nov
Dec
29
2010
98.9
99.6
99.4
99.6
100.9
101.2
100.5
100.5
100.3
99.3
99.7
100.0
100.0
2011
100.0
99.8
99.4
97.2
97.4
97.3
97.4
97.3
97.8
97.8
98.1
98.6
98.2
2012
99.0
98.5
98.5
98.6
98.8
99.0
97.9
97.8
96.8
97.0
97.2
96.9
98.0
2013
96.6
96.5
96.8
94.9
95.1
94.7
94.9
94.7
94.6
31
2010
101.9
101.7
99.5
99.9
100.1
99.7
99.6
99.8
99.6
99.2
99.5
99.4
100.0
2011
100.0
100.1
99.5
99.3
98.1
98.0
97.8
97.8
97.9
98.0
98.4
98.7
98.6
2012
99.0
99.6
99.6
99.8
100.2
100.0
100.6
100.7
99.9
99.7
99.8
99.6
99.9
2013
99.2
98.7
98.7
98.9
99.3
99.0
98.7
99.0
99.3
32
2010
97.8
98.8
100.5
100.6
100.6
100.7
100.4
100.4
100.3
99.8
100.0
100.2
100.0
2011
101.5
101.3
103.6
103.5
103.7
103.6
103.6
103.6
103.8
103.6
103.8
103.4
103.3
2012
102.9
102.5
102.6
102.7
102.6
102.7
102.6
102.6
102.3
102.5
102.8
102.7
102.6
2013
103.2
103.3
103.3
103.5
103.5
103.4
103.6
103.6
103.6
05-0
92010
96.3
93.6
94.5
95.6
95.3
93.1
93.4
101.7
104.2
106.1
110.5
115.6
100.0
2011
119.0
120.4
117.9
120.9
114.1
117.2
117.8
115.2
115.5
110.2
112.3
114.0
116.2
2012
116.5
119.7
118.9
120.6
120.5
120.1
120.7
119.2
126.2
125.4
125.4
126.4
121.6
2013
123.7
125.0
126.7
117.6
117.4
115.1
117.9
119.2
117.3
2010
99.8
100.2
99.8
100.9
100.8
100.3
100.1
100.3
100.4
98.3
99.7
99.5
100.0
2011
100.7
100.6
100.5
100.1
101.1
100.4
100.3
99.9
101.0
100.6
101.7
101.5
100.7
2012
103.0
102.4
102.4
101.5
102.1
102.3
103.7
104.1
101.9
102.1
102.9
102.1
102.5
2013
101.8
101.8
102.7
102.7
103.2
102.1
102.7
102.5
102.3
1N
ace
Rev
.2
Sta
tist
ical
clas
sifi
cati
on
of
eco
nom
icac
tivit
ies
inth
eE
uro
pea
nC
om
munit
y.
Month
sA
nnual
Oth
er
Manufa
ctu
ring
Moto
rvechic
les,
traile
rsand
sem
i-
traile
rs
Furn
iture
Industr
ialS
ecto
r
Min
ing
and
quarr
yin
g
Tota
ltr
ansport
able
goods
industr
ies
NA
CE
Code
1Y
ear
Tab
le2
Ind
ustr
ialP
rod
ucer
Pri
ce
Ind
ices
(exclu
din
gV
AT
)B
ase:
Year
2010
=100
Jan
Feb
Mar
Apr
May
Jun
Jul
Aug
Sept
Oct
Nov
Dec
10-1
22010
96.8
98.1
97.6
99.0
101.4
101.6
100.7
100.3
101.9
100.0
101.3
101.6
100.0
2011
102.7
101.9
103.3
103.0
104.1
103.8
103.5
103.1
104.1
103.6
105.0
105.8
103.7
2012
106.7
107.8
107.6
107.1
108.0
108.0
108.9
108.3
106.8
107.0
107.7
108.0
107.7
2013
108.9
108.7
109.2
109.8
110.5
109.9
110.3
109.8
109.4
2010
100.7
100.9
100.4
101.4
100.7
100.1
100.0
100.3
99.9
97.7
99.1
98.7
100.0
2011
99.8
99.9
99.4
98.9
100.1
99.2
99.1
98.7
99.9
99.7
100.5
100.1
99.6
2012
101.7
100.6
100.7
99.6
100.1
100.5
101.9
102.5
100.1
100.3
101.2
100.1
100.8
2013
99.5
99.6
100.5
100.5
101.0
99.7
100.4
100.3
100.1
2010
100.7
101.0
100.5
101.5
100.7
100.1
100.0
100.3
99.9
97.7
99.1
98.7
100.0
2011
99.8
99.9
99.5
98.9
100.1
99.2
99.1
98.7
99.9
99.7
100.6
100.1
99.6
2012
101.7
100.6
100.7
99.6
100.1
100.4
101.9
102.6
100.2
100.4
101.2
100.1
100.8
2013
99.4
99.5
100.5
100.5
100.9
99.6
100.3
100.2
100.0
2010
96.5
96.9
96.4
97.7
99.9
100.4
101.8
102.6
102.8
100.2
101.8
102.9
100.0
2011
103.8
104.3
103.2
103.4
105.8
105.5
105.8
105.7
106.0
105.1
105.4
105.7
105.0
2012
106.3
106.5
106.8
107.6
107.8
107.7
108.3
108.1
108.1
108.1
108.2
108.2
107.6
2013
107.9
107.9
108.0
107.8
107.9
107.7
107.9
108.1
107.9
2010
97.1
98.3
98.8
99.3
102.5
102.8
101.5
101.6
101.1
98.0
99.2
99.9
100.0
2011
100.6
100.2
100.3
98.8
99.7
99.3
99.7
99.3
100.6
100.5
101.2
102.3
100.2
2012
103.4
102.0
102.1
102.3
102.8
103.5
104.6
106.7
104.1
104.4
105.1
104.1
103.8
2013
103.8
103.7
104.5
105.1
105.9
104.6
105.5
105.9
105.7
1N
ace
Rev
.2
Sta
tist
ical
clas
sifi
cati
on
of
eco
nom
icac
tivit
ies
inth
eE
uro
pea
nC
om
munit
y.
Month
sA
nnual
Food
pro
ducts
,B
evera
ges
and
Tobacco
Pro
ducts
Manufa
ctu
ring
Industr
ies
exclu
din
g
Food
Pro
ducts
Industr
ialS
ecto
rN
AC
E
Code
1
Manufa
ctu
ring
Industr
ies
exclu
din
g
Food
Pro
ducts
,B
evera
ges
and
Tobacco
Pro
ducts
Inte
rmedia
tegoods
industr
ies
(except
energ
y)
Capitalgoods
industr
ies
Year
Tab
le2
Ind
us
tria
lP
rod
uc
er
Pri
ce
Ind
ice
s(e
xc
lud
ing
VA
T)
Base:
Year
2010
=100
Jan
Feb
Mar
Apr
May
Jun
Jul
Aug
Sept
Oct
Nov
Dec
2010
100.3
100.6
99.9
100.0
100.2
100.1
99.9
100.1
99.9
99.4
99.7
99.7
100.0
2011
100.4
100.4
101.3
101.1
101.4
101.3
101.2
101.2
101.3
101.1
101.4
101.4
101.1
2012
101.4
101.5
101.5
101.4
101.6
101.5
101.8
101.8
101.4
101.3
101.4
101.8
101.5
2013
101.7
101.5
101.5
101.7
101.8
101.7
101.6
101.7
102.1
2010
101.8
101.8
101.2
102.1
100.1
99.7
99.3
99.2
99.6
98.0
98.9
98.3
100.0
2011
99.4
99.1
99.0
98.4
98.8
98.4
98.0
97.5
98.8
98.6
99.8
99.0
98.7
2012
100.6
100.0
99.9
97.7
98.5
99.0
101.2
100.7
98.2
98.5
99.3
98.6
99.4
2013
98.6
98.5
99.1
99.3
100.1
98.9
99.7
98.9
98.6
2010
97.1
98.4
97.8
100.0
101.5
99.7
100.1
100.5
101.0
100.4
102.0
101.5
100.0
2011
102.8
104.0
105.2
106.9
108.6
106.6
106.7
106.9
107.0
106.1
106.8
107.0
106.2
2012
108.3
108.7
109.0
110.3
110.5
109.1
107.7
109.3
109.3
109.1
110.0
109.3
109.2
2013
108.6
109.6
111.4
110.9
110.4
110.5
110.7
112.2
111.5
2010
100.2
100.6
100.1
101.1
100.7
100.5
100.1
100.2
100.2
97.8
99.2
99.0
100.0
2011
100.1
99.8
99.6
98.7
99.8
99.2
99.1
98.6
99.9
99.7
100.7
100.5
99.6
2012
102.0
101.2
101.2
99.8
100.5
101.1
102.8
103.1
100.5
100.8
101.6
100.7
101.3
2013
100.5
100.3
101.1
101.3
101.9
100.6
101.3
100.9
100.7
2010
99.8
100.3
99.8
100.9
100.8
100.4
100.1
100.3
100.3
98.2
99.6
99.3
100.0
2011
100.5
100.4
100.3
99.8
101.0
100.2
100.1
99.7
100.9
100.6
101.6
101.4
100.5
2012
102.8
102.2
102.3
101.3
101.9
102.2
103.5
103.9
101.7
101.9
102.7
101.9
102.4
2013
101.6
101.6
102.5
102.6
103.1
101.9
102.6
102.4
102.2
1N
ace
Rev
.2
Sta
tist
ical
clas
sifi
cati
on
of
eco
nom
icac
tivit
ies
inth
eE
uro
pea
nC
om
munit
y.
2E
xclu
des
Min
ing
and
quarr
ying.
Annual
Dura
ble
consum
er
goods
industr
ies
Industr
ialS
ecto
rN
AC
E
Code
1Y
ear
Month
s
Non-d
ura
ble
consum
er
goods
industr
ies
Manufa
ctu
ring
industr
ies
(hom
e
sale
s)2
Manufa
ctu
ring
industr
ies
(export
sale
s)2
Tota
lm
anufa
ctu
ring
industr
ies
2
Tab
le3
Deta
iled
Wh
ole
sale
Pri
ce
Ind
ices
(exclu
din
gV
AT
)fo
rB
uild
ing
an
dC
on
str
ucti
on
Mate
rials
Base:
Year
2010
=100
Jan
Feb
Mar
Apr
May
Jun
Jul
Aug
Sept
Oct
Nov
Dec
Sto
ne,
sand
and
gra
vel
2010
102.5
102.5
101.2
101.9
99.8
99.8
100.1
98.7
98.2
98.7
98.4
98.2
100.0
2011
98.4
97.9
96.4
94.2
95.2
93.1
96.2
98.6
98.3
96.0
97.8
99.4
96.8
2012
98.6
98.7
97.8
103.3
105.7
105.9
110.7
110.0
106.2
105.3
105.0
105.5
104.4
2013
104.8
105.3
109.2
109.7
109.6
114.0
114.8
115.6
113.5
of
whic
h:
Sto
ne
2010
102.5
102.6
101.8
102.1
99.9
99.9
100.1
98.4
98.0
98.5
98.2
97.9
100.0
2011
98.1
97.6
96.5
93.2
94.7
92.1
96.1
98.4
98.8
95.9
97.9
100.0
96.6
2012
98.6
100.2
99.4
104.0
105.4
107.2
112.1
111.8
107.1
105.8
106.6
108.1
105.5
2013
106.6
107.3
111.9
111.1
110.3
115.0
115.6
116.2
115.7
Sand
and
gra
vel
2010
102.1
101.9
98.2
101.0
99.1
99.1
100.1
100.1
99.5
99.5
99.5
100.0
100.0
2011
99.8
99.9
95.9
99.6
97.8
98.4
96.6
99.7
95.6
96.4
96.8
96.0
97.7
2012
98.8
90.5
89.6
99.6
107.4
99.1
102.8
100.1
101.3
102.6
96.4
91.6
98.3
2013
94.9
94.4
94.6
101.9
106.4
108.6
110.5
112.3
101.8
Cem
ent
2010
99.9
99.9
99.9
99.9
99.9
99.9
99.9
99.9
99.9
99.9
99.9
100.6
100.0
2011
100.6
100.6
100.6
100.6
100.6
100.6
100.6
100.6
100.6
100.6
100.6
100.6
100.6
2012
100.6
100.6
100.6
100.6
100.6
100.6
100.6
100.6
100.6
100.0
100.0
100.0
100.5
2013
100.0
100.0
100.0
100.6
100.6
100.6
100.6
100.6
100.6
Ready
mix
ed
mort
ar
and
concre
te2010
101.4
101.6
101.3
100.2
99.3
99.3
100.3
100.6
99.2
99.2
98.7
98.9
100.0
2011
98.3
99.5
94.6
95.8
95.1
97.0
97.3
97.5
97.4
99.0
99.1
98.8
97.5
2012
100.2
99.9
100.2
100.6
100.1
101.7
102.1
102.5
101.5
102.2
103.6
104.4
101.6
2013
102.7
103.1
102.8
102.5
102.8
103.1
101.8
104.0
105.4
Mate
rials
Year
Month
sA
nnual
Tab
le3
Deta
iled
Wh
ole
sale
Pri
ce
Ind
ices
(exclu
din
gV
AT
)fo
rB
uild
ing
an
dC
on
str
ucti
on
Mate
rials
Base:
Year
2010
=100
Jan
Feb
Mar
Apr
May
Jun
Jul
Aug
Sept
Oct
Nov
Dec
Concre
teblo
cks
and
bricks
2010
100.0
102.2
101.9
101.6
99.6
99.6
99.2
99.1
99.3
99.2
99.4
99.0
100.0
2011
98.6
99.2
97.6
97.5
99.4
99.3
98.5
98.7
100.6
99.6
103.9
104.3
99.8
2012
102.6
103.1
102.7
104.4
105.9
105.2
106.6
106.9
106.0
105.5
105.9
105.7
105.0
2013
105.5
105.0
104.9
105.3
103.9
104.7
107.5
107.8
108.8
Oth
er
concre
tepro
ducts
2010
101.5
100.8
100.8
100.8
100.8
100.8
101.2
101.2
101.2
96.9
96.9
96.9
100.0
2011
96.0
96.0
96.0
96.0
97.2
97.2
97.2
98.5
98.5
98.5
98.5
98.5
97.3
2012
99.6
99.6
99.6
99.3
99.3
99.2
99.2
98.0
98.4
98.4
98.4
99.3
99.0
2013
98.8
98.8
98.8
98.8
98.8
98.9
98.7
98.7
98.7
of
whic
h:
Pre
cast
concre
te2010
105.5
103.1
103.1
103.1
103.1
103.1
103.1
103.1
103.1
89.8
89.8
89.8
100.0
2011
90.3
90.3
90.3
90.3
94.1
94.1
94.1
94.1
94.1
94.1
94.1
94.1
92.8
2012
94.1
94.1
94.1
94.1
94.1
93.7
93.7
90.0
90.0
90.0
90.0
92.6
92.5
2013
92.1
92.1
92.1
92.1
92.1
92.5
92.0
92.0
92.0
Oth
er
concre
tepro
ducts
(Exclu
din
gpre
cast
concre
te)
2010
99.6
99.6
99.6
99.6
99.6
99.6
100.4
100.4
100.4
100.4
100.4
100.4
100.0
2011
98.4
98.4
98.4
98.4
98.4
98.4
98.4
100.8
100.8
100.8
100.8
100.8
99.4
2012
100.8
100.8
100.8
100.3
100.3
100.3
100.3
100.3
101.0
101.0
101.0
101.0
100.7
2013
100.4
100.4
100.4
100.4
100.4
100.4
100.4
100.4
100.4
Str
uctu
ralste
eland
rein
forc
ing
meta
l2010
93.1
94.5
94.8
99.1
102.9
103.2
103.1
103.2
102.4
101.6
100.9
101.2
100.0
2011
101.9
107.0
107.8
108.9
108.4
107.5
106.5
106.7
107.1
106.4
106.3
105.9
106.7
2012
105.5
106.6
108.1
109.1
108.4
107.4
106.6
106.6
106.4
106.1
106.0
106.2
106.9
2013
108.1
107.6
107.2
107.1
106.6
105.7
104.9
104.2
104.2
Mate
rials
Year
Month
sA
nnual
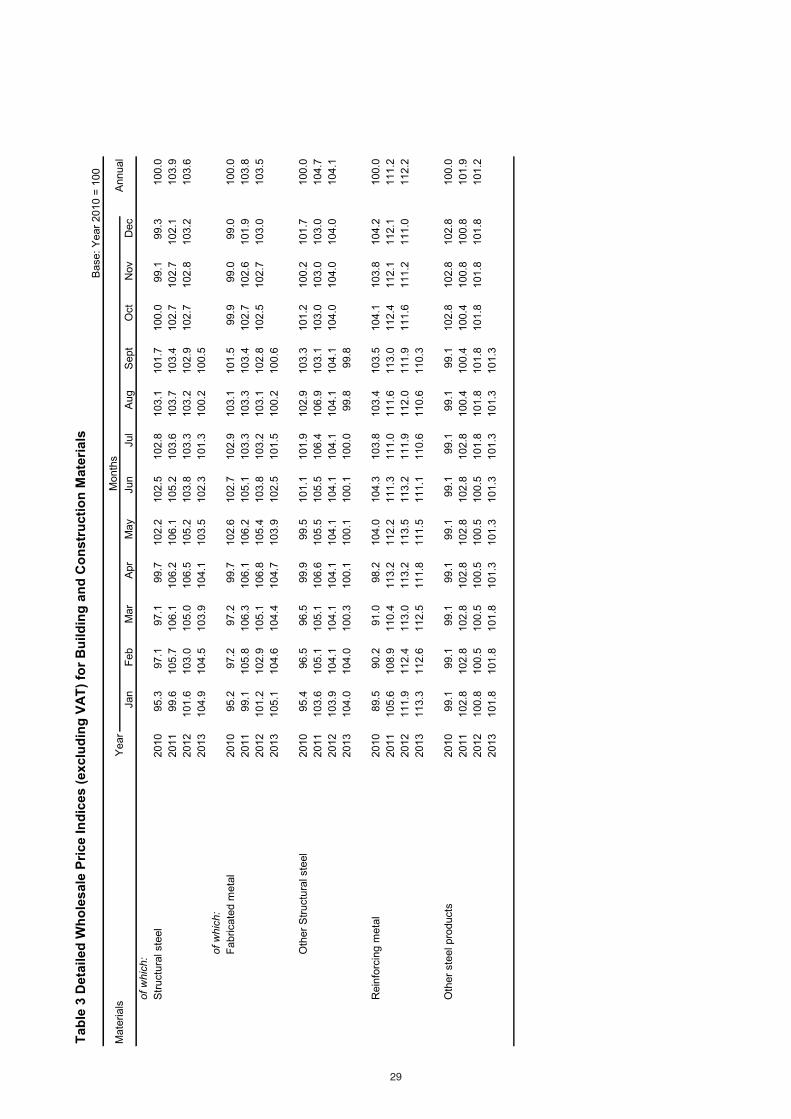
Tab
le3
Deta
iled
Wh
ole
sale
Pri
ce
Ind
ices
(exclu
din
gV
AT
)fo
rB
uild
ing
an
dC
on
str
ucti
on
Mate
rials
Base:
Year
2010
=100
Jan
Feb
Mar
Apr
May
Jun
Jul
Aug
Sept
Oct
Nov
Dec
of
whic
h:
Str
uctu
ralste
el
2010
95.3
97.1
97.1
99.7
102.2
102.5
102.8
103.1
101.7
100.0
99.1
99.3
100.0
2011
99.6
105.7
106.1
106.2
106.1
105.2
103.6
103.7
103.4
102.7
102.7
102.1
103.9
2012
101.6
103.0
105.0
106.5
105.2
103.8
103.3
103.2
102.9
102.7
102.8
103.2
103.6
2013
104.9
104.5
103.9
104.1
103.5
102.3
101.3
100.2
100.5
of
whic
h:
Fabricate
dm
eta
l2010
95.2
97.2
97.2
99.7
102.6
102.7
102.9
103.1
101.5
99.9
99.0
99.0
100.0
2011
99.1
105.8
106.3
106.1
106.2
105.1
103.3
103.3
103.4
102.7
102.6
101.9
103.8
2012
101.2
102.9
105.1
106.8
105.4
103.8
103.2
103.1
102.8
102.5
102.7
103.0
103.5
2013
105.1
104.6
104.4
104.7
103.9
102.5
101.5
100.2
100.6
Oth
er
Str
uctu
ralste
el
2010
95.4
96.5
96.5
99.9
99.5
101.1
101.9
102.9
103.3
101.2
100.2
101.7
100.0
2011
103.6
105.1
105.1
106.6
105.5
105.5
106.4
106.9
103.1
103.0
103.0
103.0
104.7
2012
103.9
104.1
104.1
104.1
104.1
104.1
104.1
104.1
104.1
104.0
104.0
104.0
104.1
2013
104.0
104.0
100.3
100.1
100.1
100.1
100.0
99.8
99.8
Rein
forc
ing
meta
l2010
89.5
90.2
91.0
98.2
104.0
104.3
103.8
103.4
103.5
104.1
103.8
104.2
100.0
2011
105.6
108.9
110.4
113.2
112.2
111.3
111.0
111.6
113.0
112.4
112.1
112.1
111.2
2012
111.9
112.4
113.0
113.2
113.5
113.2
111.9
112.0
111.9
111.6
111.2
111.0
112.2
2013
113.3
112.6
112.5
111.8
111.5
111.1
110.6
110.6
110.3
Oth
er
ste
elpro
ducts
2010
99.1
99.1
99.1
99.1
99.1
99.1
99.1
99.1
99.1
102.8
102.8
102.8
100.0
2011
102.8
102.8
102.8
102.8
102.8
102.8
102.8
100.4
100.4
100.4
100.8
100.8
101.9
2012
100.8
100.5
100.5
100.5
100.5
100.5
101.8
101.8
101.8
101.8
101.8
101.8
101.2
2013
101.8
101.8
101.8
101.3
101.3
101.3
101.3
101.3
101.3
Mate
rials
Year
Month
sA
nnual
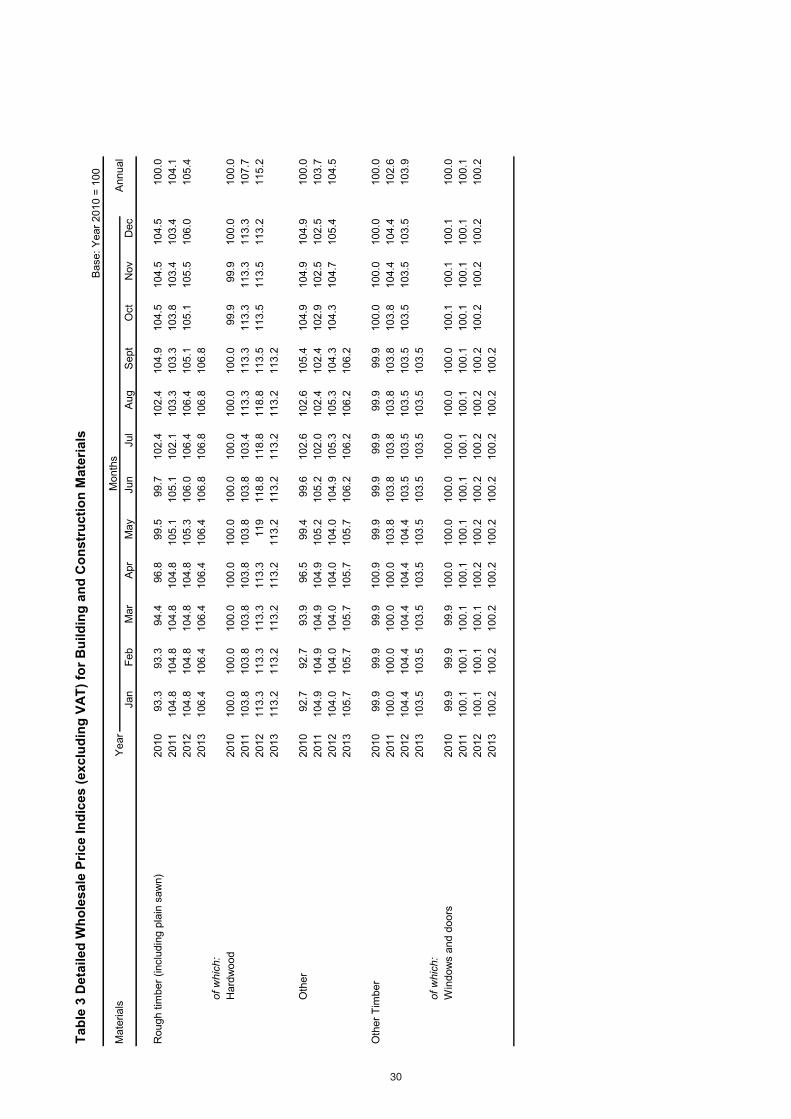
Tab
le3
Deta
iled
Wh
ole
sale
Pri
ce
Ind
ices
(exclu
din
gV
AT
)fo
rB
uild
ing
an
dC
on
str
ucti
on
Mate
rials
Base:
Year
2010
=100
Jan
Feb
Mar
Apr
May
Jun
Jul
Aug
Sept
Oct
Nov
Dec
Rough
tim
ber
(inclu
din
gpla
insaw
n)
2010
93.3
93.3
94.4
96.8
99.5
99.7
102.4
102.4
104.9
104.5
104.5
104.5
100.0
2011
104.8
104.8
104.8
104.8
105.1
105.1
102.1
103.3
103.3
103.8
103.4
103.4
104.1
2012
104.8
104.8
104.8
104.8
105.3
106.0
106.4
106.4
105.1
105.1
105.5
106.0
105.4
2013
106.4
106.4
106.4
106.4
106.4
106.8
106.8
106.8
106.8
of
whic
h:
Hard
wood
2010
100.0
100.0
100.0
100.0
100.0
100.0
100.0
100.0
100.0
99.9
99.9
100.0
100.0
2011
103.8
103.8
103.8
103.8
103.8
103.8
103.4
113.3
113.3
113.3
113.3
113.3
107.7
2012
113.3
113.3
113.3
113.3
119
118.8
118.8
118.8
113.5
113.5
113.5
113.2
115.2
2013
113.2
113.2
113.2
113.2
113.2
113.2
113.2
113.2
113.2
Oth
er
2010
92.7
92.7
93.9
96.5
99.4
99.6
102.6
102.6
105.4
104.9
104.9
104.9
100.0
2011
104.9
104.9
104.9
104.9
105.2
105.2
102.0
102.4
102.4
102.9
102.5
102.5
103.7
2012
104.0
104.0
104.0
104.0
104.0
104.9
105.3
105.3
104.3
104.3
104.7
105.4
104.5
2013
105.7
105.7
105.7
105.7
105.7
106.2
106.2
106.2
106.2
Oth
er
Tim
ber
2010
99.9
99.9
99.9
100.9
99.9
99.9
99.9
99.9
99.9
100.0
100.0
100.0
100.0
2011
100.0
100.0
100.0
100.0
103.8
103.8
103.8
103.8
103.8
103.8
104.4
104.4
102.6
2012
104.4
104.4
104.4
104.4
104.4
103.5
103.5
103.5
103.5
103.5
103.5
103.5
103.9
2013
103.5
103.5
103.5
103.5
103.5
103.5
103.5
103.5
103.5
of
whic
h:
Win
dow
sand
doors
2010
99.9
99.9
99.9
100.0
100.0
100.0
100.0
100.0
100.0
100.1
100.1
100.1
100.0
2011
100.1
100.1
100.1
100.1
100.1
100.1
100.1
100.1
100.1
100.1
100.1
100.1
100.1
2012
100.1
100.1
100.1
100.2
100.2
100.2
100.2
100.2
100.2
100.2
100.2
100.2
100.2
2013
100.2
100.2
100.2
100.2
100.2
100.2
100.2
100.2
100.2
Mate
rials
Year
Month
sA
nnual
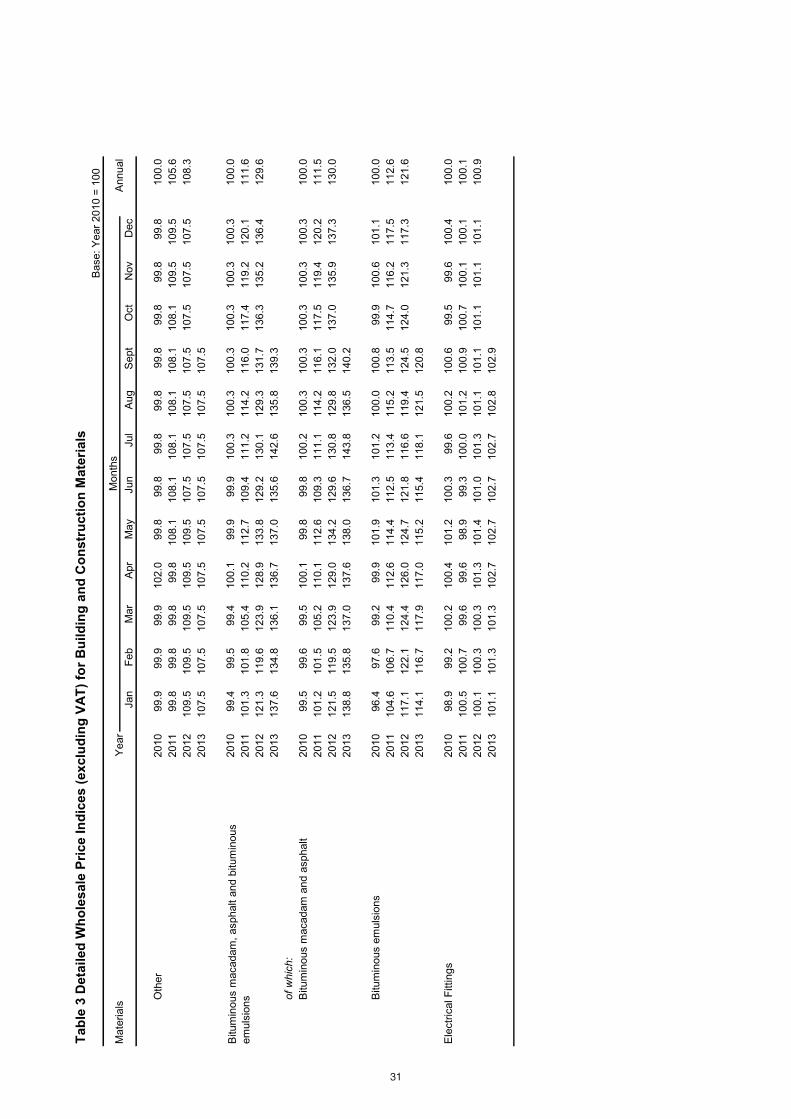
Tab
le3
Deta
iled
Wh
ole
sale
Pri
ce
Ind
ices
(exclu
din
gV
AT
)fo
rB
uild
ing
an
dC
on
str
ucti
on
Mate
rials
Base:
Year
2010
=100
Jan
Feb
Mar
Apr
May
Jun
Jul
Aug
Sept
Oct
Nov
Dec
Oth
er
2010
99.9
99.9
99.9
102.0
99.8
99.8
99.8
99.8
99.8
99.8
99.8
99.8
100.0
2011
99.8
99.8
99.8
99.8
108.1
108.1
108.1
108.1
108.1
108.1
109.5
109.5
105.6
2012
109.5
109.5
109.5
109.5
109.5
107.5
107.5
107.5
107.5
107.5
107.5
107.5
108.3
2013
107.5
107.5
107.5
107.5
107.5
107.5
107.5
107.5
107.5
2010
99.4
99.5
99.4
100.1
99.9
99.9
100.3
100.3
100.3
100.3
100.3
100.3
100.0
2011
101.3
101.8
105.4
110.2
112.7
109.4
111.2
114.2
116.0
117.4
119.2
120.1
111.6
2012
121.3
119.6
123.9
128.9
133.8
129.2
130.1
129.3
131.7
136.3
135.2
136.4
129.6
2013
137.6
134.8
136.1
136.7
137.0
135.6
142.6
135.8
139.3
of
whic
h:
Bitum
inous
macadam
and
asphalt
2010
99.5
99.6
99.5
100.1
99.8
99.8
100.2
100.3
100.3
100.3
100.3
100.3
100.0
2011
101.2
101.5
105.2
110.1
112.6
109.3
111.1
114.2
116.1
117.5
119.4
120.2
111.5
2012
121.5
119.5
123.9
129.0
134.2
129.6
130.8
129.8
132.0
137.0
135.9
137.3
130.0
2013
138.8
135.8
137.0
137.6
138.0
136.7
143.8
136.5
140.2
Bitum
inous
em
uls
ions
2010
96.4
97.6
99.2
99.9
101.9
101.3
101.2
100.0
100.8
99.9
100.6
101.1
100.0
2011
104.6
106.7
110.4
112.6
114.4
112.5
113.4
115.2
113.5
114.7
116.2
117.5
112.6
2012
117.1
122.1
124.4
126.0
124.7
121.8
116.6
119.4
124.5
124.0
121.3
117.3
121.6
2013
114.1
116.7
117.9
117.0
115.2
115.4
118.1
121.5
120.8
Ele
ctr
icalF
ittings
2010
98.9
99.2
100.2
100.4
101.2
100.3
99.6
100.2
100.6
99.5
99.6
100.4
100.0
2011
100.5
100.7
99.6
99.6
98.9
99.3
100.0
101.2
100.9
100.7
100.1
100.1
100.1
2012
100.1
100.3
100.3
101.3
101.4
101.0
101.3
101.1
101.1
101.1
101.1
101.1
100.9
2013
101.1
101.3
101.3
102.7
102.7
102.7
102.7
102.8
102.9
Bitum
inous
macadam
,asphalt
and
bitum
inous
em
uls
ions
Mate
rials
Year
Month
sA
nnual
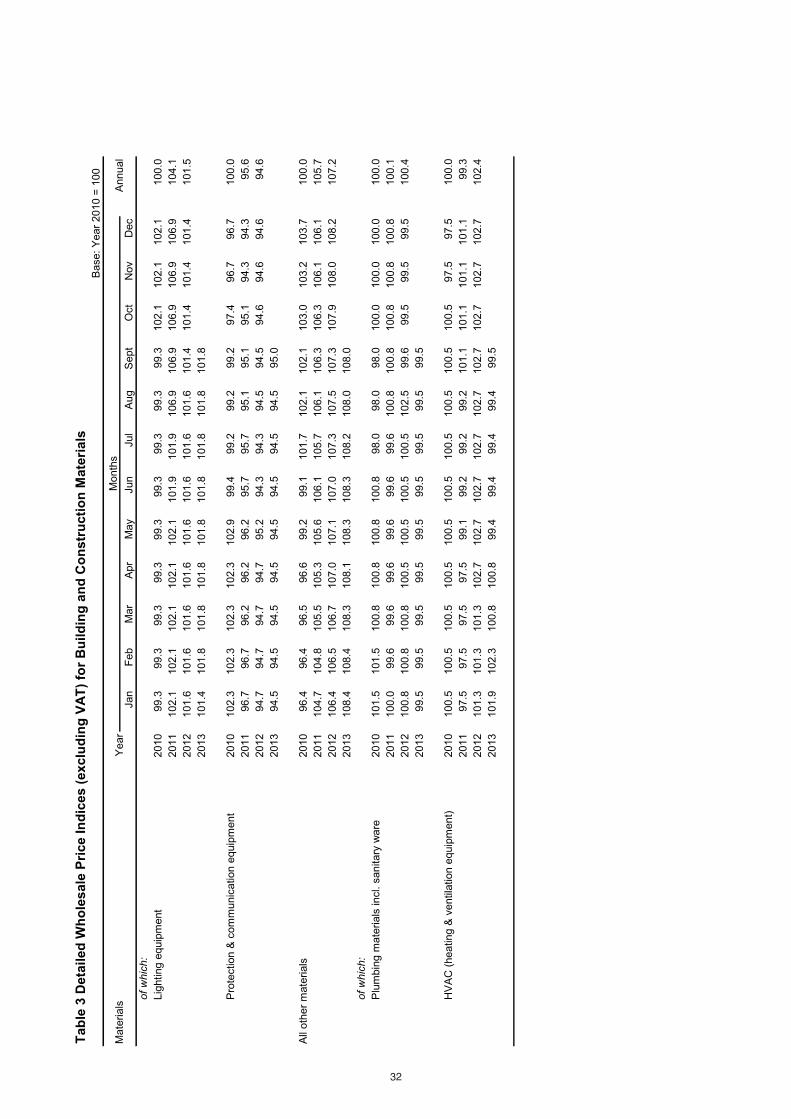
Tab
le3
Deta
iled
Wh
ole
sale
Pri
ce
Ind
ices
(exclu
din
gV
AT
)fo
rB
uild
ing
an
dC
on
str
ucti
on
Mate
rials
Base:
Year
2010
=100
Jan
Feb
Mar
Apr
May
Jun
Jul
Aug
Sept
Oct
Nov
Dec
of
whic
h:
Lig
hting
equip
ment
2010
99.3
99.3
99.3
99.3
99.3
99.3
99.3
99.3
99.3
102.1
102.1
102.1
100.0
2011
102.1
102.1
102.1
102.1
102.1
101.9
101.9
106.9
106.9
106.9
106.9
106.9
104.1
2012
101.6
101.6
101.6
101.6
101.6
101.6
101.6
101.6
101.4
101.4
101.4
101.4
101.5
2013
101.4
101.8
101.8
101.8
101.8
101.8
101.8
101.8
101.8
Pro
tection
&com
munic
ation
equip
ment
2010
102.3
102.3
102.3
102.3
102.9
99.4
99.2
99.2
99.2
97.4
96.7
96.7
100.0
2011
96.7
96.7
96.2
96.2
96.2
95.7
95.7
95.1
95.1
95.1
94.3
94.3
95.6
2012
94.7
94.7
94.7
94.7
95.2
94.3
94.3
94.5
94.5
94.6
94.6
94.6
94.6
2013
94.5
94.5
94.5
94.5
94.5
94.5
94.5
94.5
95.0
All
oth
er
mate
rials
2010
96.4
96.4
96.5
96.6
99.2
99.1
101.7
102.1
102.1
103.0
103.2
103.7
100.0
2011
104.7
104.8
105.5
105.3
105.6
106.1
105.7
106.1
106.3
106.3
106.1
106.1
105.7
2012
106.4
106.5
106.7
107.0
107.1
107.0
107.3
107.5
107.3
107.9
108.0
108.2
107.2
2013
108.4
108.4
108.3
108.1
108.3
108.3
108.2
108.0
108.0
of
whic
h:
Plu
mbin
gm
ate
rials
incl.
sanitary
ware
2010
101.5
101.5
100.8
100.8
100.8
100.8
98.0
98.0
98.0
100.0
100.0
100.0
100.0
2011
100.0
99.6
99.6
99.6
99.6
99.6
99.6
100.8
100.8
100.8
100.8
100.8
100.1
2012
100.8
100.8
100.8
100.5
100.5
100.5
100.5
102.5
99.6
99.5
99.5
99.5
100.4
2013
99.5
99.5
99.5
99.5
99.5
99.5
99.5
99.5
99.5
HV
AC
(heating
&ventila
tion
equip
ment)
2010
100.5
100.5
100.5
100.5
100.5
100.5
100.5
100.5
100.5
100.5
97.5
97.5
100.0
2011
97.5
97.5
97.5
97.5
99.1
99.2
99.2
99.2
101.1
101.1
101.1
101.1
99.3
2012
101.3
101.3
101.3
102.7
102.7
102.7
102.7
102.7
102.7
102.7
102.7
102.7
102.4
2013
101.9
102.3
100.8
100.8
99.4
99.4
99.4
99.4
99.5
Mate
rials
Year
Month
sA
nnual
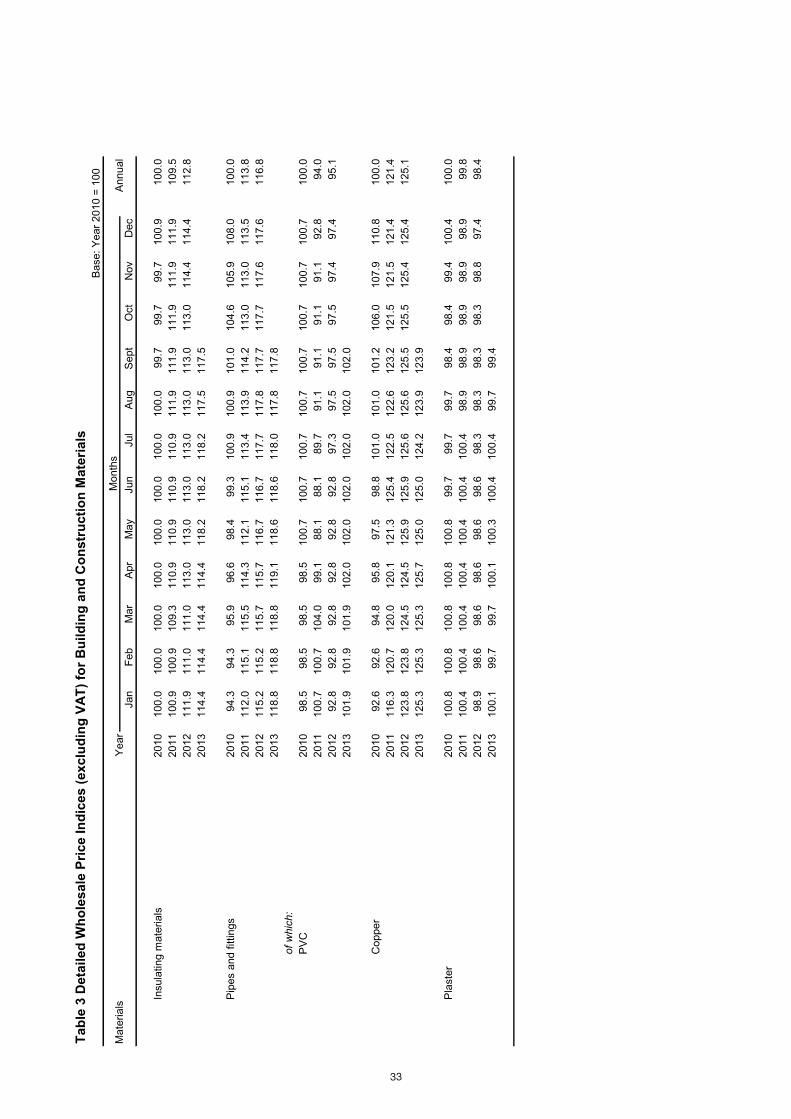
Tab
le3
Deta
iled
Wh
ole
sale
Pri
ce
Ind
ices
(exclu
din
gV
AT
)fo
rB
uild
ing
an
dC
on
str
ucti
on
Mate
rials
Base:
Year
2010
=100
Jan
Feb
Mar
Apr
May
Jun
Jul
Aug
Sept
Oct
Nov
Dec
Insula
ting
mate
rials
2010
100.0
100.0
100.0
100.0
100.0
100.0
100.0
100.0
99.7
99.7
99.7
100.9
100.0
2011
100.9
100.9
109.3
110.9
110.9
110.9
110.9
111.9
111.9
111.9
111.9
111.9
109.5
2012
111.9
111.0
111.0
113.0
113.0
113.0
113.0
113.0
113.0
113.0
114.4
114.4
112.8
2013
114.4
114.4
114.4
114.4
118.2
118.2
118.2
117.5
117.5
Pip
es
and
fitt
ings
2010
94.3
94.3
95.9
96.6
98.4
99.3
100.9
100.9
101.0
104.6
105.9
108.0
100.0
2011
112.0
115.1
115.5
114.3
112.1
115.1
113.4
113.9
114.2
113.0
113.0
113.5
113.8
2012
115.2
115.2
115.7
115.7
116.7
116.7
117.7
117.8
117.7
117.7
117.6
117.6
116.8
2013
118.8
118.8
118.8
119.1
118.6
118.6
118.0
117.8
117.8
of
whic
h:
PV
C2010
98.5
98.5
98.5
98.5
100.7
100.7
100.7
100.7
100.7
100.7
100.7
100.7
100.0
2011
100.7
100.7
104.0
99.1
88.1
88.1
89.7
91.1
91.1
91.1
91.1
92.8
94.0
2012
92.8
92.8
92.8
92.8
92.8
92.8
97.3
97.5
97.5
97.5
97.4
97.4
95.1
2013
101.9
101.9
101.9
102.0
102.0
102.0
102.0
102.0
102.0
Copper
2010
92.6
92.6
94.8
95.8
97.5
98.8
101.0
101.0
101.2
106.0
107.9
110.8
100.0
2011
116.3
120.7
120.0
120.1
121.3
125.4
122.5
122.6
123.2
121.5
121.5
121.4
121.4
2012
123.8
123.8
124.5
124.5
125.9
125.9
125.6
125.6
125.5
125.5
125.4
125.4
125.1
2013
125.3
125.3
125.3
125.7
125.0
125.0
124.2
123.9
123.9
Pla
ste
r2010
100.8
100.8
100.8
100.8
100.8
99.7
99.7
99.7
98.4
98.4
99.4
100.4
100.0
2011
100.4
100.4
100.4
100.4
100.4
100.4
100.4
98.9
98.9
98.9
98.9
98.9
99.8
2012
98.9
98.6
98.6
98.6
98.6
98.6
98.3
98.3
98.3
98.3
98.8
97.4
98.4
2013
100.1
99.7
99.7
100.1
100.3
100.4
100.4
99.7
99.4
Mate
rials
Year
Month
sA
nnual
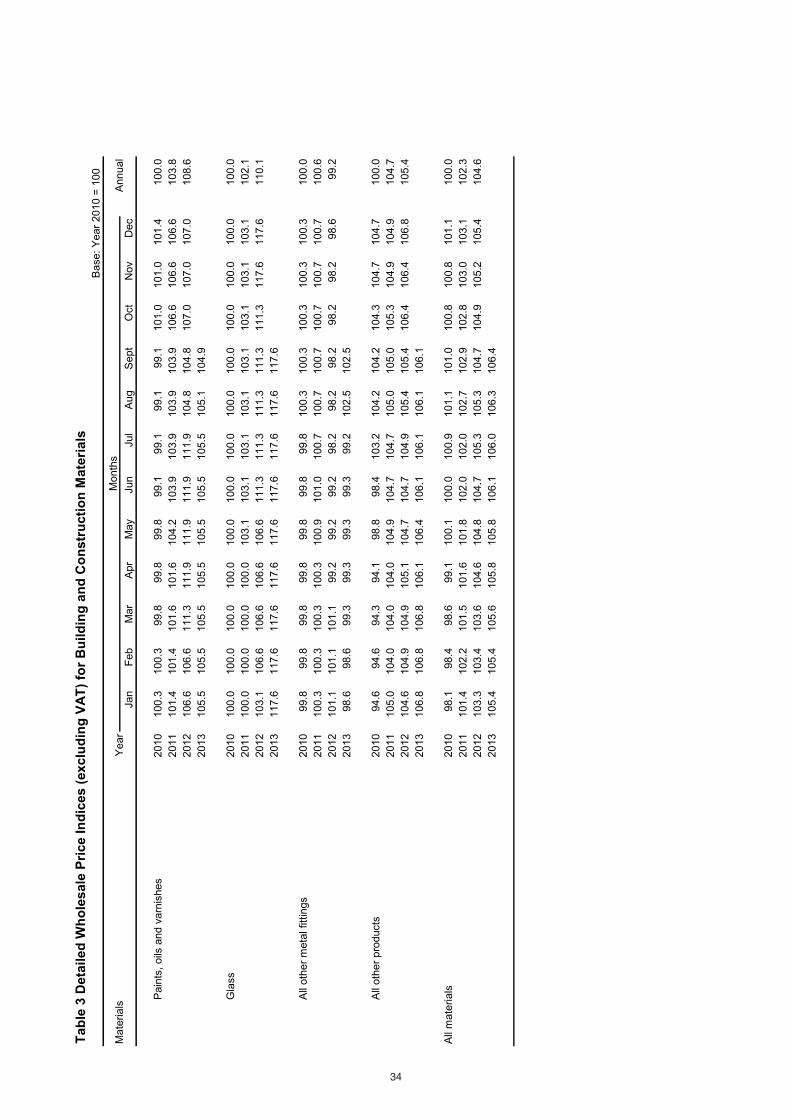
Tab
le3
Deta
iled
Wh
ole
sale
Pri
ce
Ind
ices
(exclu
din
gV
AT
)fo
rB
uild
ing
an
dC
on
str
ucti
on
Mate
rials
Base:
Year
2010
=100
Jan
Feb
Mar
Apr
May
Jun
Jul
Aug
Sept
Oct
Nov
Dec
Pain
ts,
oils
and
varn
ishes
2010
100.3
100.3
99.8
99.8
99.8
99.1
99.1
99.1
99.1
101.0
101.0
101.4
100.0
2011
101.4
101.4
101.6
101.6
104.2
103.9
103.9
103.9
103.9
106.6
106.6
106.6
103.8
2012
106.6
106.6
111.3
111.9
111.9
111.9
111.9
104.8
104.8
107.0
107.0
107.0
108.6
2013
105.5
105.5
105.5
105.5
105.5
105.5
105.5
105.1
104.9
Gla
ss
2010
100.0
100.0
100.0
100.0
100.0
100.0
100.0
100.0
100.0
100.0
100.0
100.0
100.0
2011
100.0
100.0
100.0
100.0
103.1
103.1
103.1
103.1
103.1
103.1
103.1
103.1
102.1
2012
103.1
106.6
106.6
106.6
106.6
111.3
111.3
111.3
111.3
111.3
117.6
117.6
110.1
2013
117.6
117.6
117.6
117.6
117.6
117.6
117.6
117.6
117.6
All
oth
er
meta
lfitt
ings
2010
99.8
99.8
99.8
99.8
99.8
99.8
99.8
100.3
100.3
100.3
100.3
100.3
100.0
2011
100.3
100.3
100.3
100.3
100.9
101.0
100.7
100.7
100.7
100.7
100.7
100.7
100.6
2012
101.1
101.1
101.1
99.2
99.2
99.2
98.2
98.2
98.2
98.2
98.2
98.6
99.2
2013
98.6
98.6
99.3
99.3
99.3
99.3
99.2
102.5
102.5
All
oth
er
pro
ducts
2010
94.6
94.6
94.3
94.1
98.8
98.4
103.2
104.2
104.2
104.3
104.7
104.7
100.0
2011
105.0
104.0
104.0
104.0
104.9
104.7
104.7
105.0
105.0
105.3
104.9
104.9
104.7
2012
104.6
104.9
104.9
105.1
104.7
104.7
104.9
105.4
105.4
106.4
106.4
106.8
105.4
2013
106.8
106.8
106.8
106.1
106.4
106.1
106.1
106.1
106.1
All
mate
rials
2010
98.1
98.4
98.6
99.1
100.1
100.0
100.9
101.1
101.0
100.8
100.8
101.1
100.0
2011
101.4
102.2
101.5
101.6
101.8
102.0
102.0
102.7
102.9
102.8
103.0
103.1
102.3
2012
103.3
103.4
103.6
104.6
104.8
104.7
105.3
105.3
104.7
104.9
105.2
105.4
104.6
2013
105.4
105.4
105.6
105.8
105.8
106.1
106.0
106.3
106.4
Mate
rials
Year
Month
sA
nnual
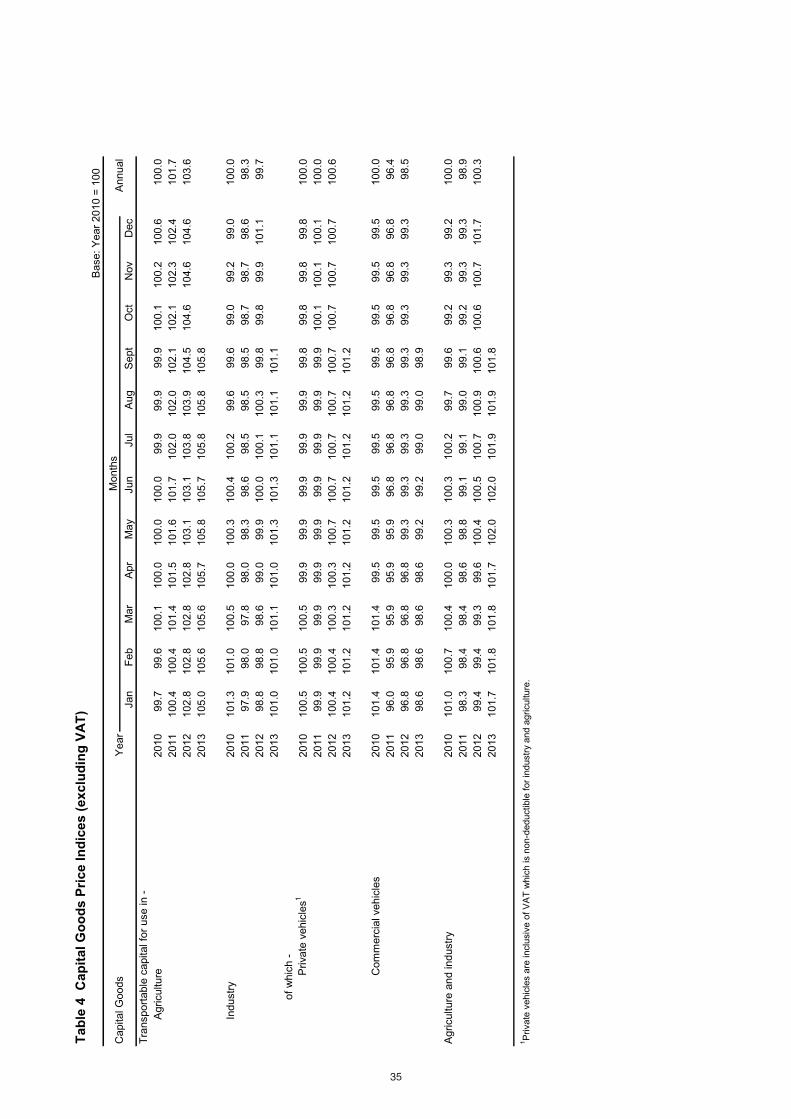
Tab
le4
Ca
pit
alG
oo
ds
Pri
ce
Ind
ice
s(e
xc
lud
ing
VA
T)
Base:
Year
2010
=100
Jan
Feb
Mar
Apr
May
Jun
Jul
Aug
Sept
Oct
Nov
Dec
Tra
nsport
able
capitalfo
ruse
in-
Agriculture
2010
99.7
99.6
100.1
100.0
100.0
100.0
99.9
99.9
99.9
100.1
100.2
100.6
100.0
2011
100.4
100.4
101.4
101.5
101.6
101.7
102.0
102.0
102.1
102.1
102.3
102.4
101.7
2012
102.8
102.8
102.8
102.8
103.1
103.1
103.8
103.9
104.5
104.6
104.6
104.6
103.6
2013
105.0
105.6
105.6
105.7
105.8
105.7
105.8
105.8
105.8
Industr
y2010
101.3
101.0
100.5
100.0
100.3
100.4
100.2
99.6
99.6
99.0
99.2
99.0
100.0
2011
97.9
98.0
97.8
98.0
98.3
98.6
98.5
98.5
98.5
98.7
98.7
98.6
98.3
2012
98.8
98.8
98.6
99.0
99.9
100.0
100.1
100.3
99.8
99.8
99.9
101.1
99.7
2013
101.0
101.0
101.1
101.0
101.3
101.3
101.1
101.1
101.1
of
whic
h-
Private
vehic
les
12010
100.5
100.5
100.5
99.9
99.9
99.9
99.9
99.9
99.8
99.8
99.8
99.8
100.0
2011
99.9
99.9
99.9
99.9
99.9
99.9
99.9
99.9
99.9
100.1
100.1
100.1
100.0
2012
100.4
100.4
100.3
100.3
100.7
100.7
100.7
100.7
100.7
100.7
100.7
100.7
100.6
2013
101.2
101.2
101.2
101.2
101.2
101.2
101.2
101.2
101.2
Com
merc
ialvehic
les
2010
101.4
101.4
101.4
99.5
99.5
99.5
99.5
99.5
99.5
99.5
99.5
99.5
100.0
2011
96.0
95.9
95.9
95.9
95.9
96.8
96.8
96.8
96.8
96.8
96.8
96.8
96.4
2012
96.8
96.8
96.8
96.8
99.3
99.3
99.3
99.3
99.3
99.3
99.3
99.3
98.5
2013
98.6
98.6
98.6
98.6
99.2
99.2
99.0
99.0
98.9
Agriculture
and
industr
y2010
101.0
100.7
100.4
100.0
100.3
100.3
100.2
99.7
99.6
99.2
99.3
99.2
100.0
2011
98.3
98.4
98.4
98.6
98.8
99.1
99.1
99.0
99.1
99.2
99.3
99.3
98.9
2012
99.4
99.4
99.3
99.6
100.4
100.5
100.7
100.9
100.6
100.6
100.7
101.7
100.3
2013
101.7
101.8
101.8
101.7
102.0
102.0
101.9
101.9
101.8
1P
rivate
vehic
les
are
inclu
siv
eofV
AT
whic
his
non-d
eductible
for
industr
yand
agriculture
.
CapitalG
oods
Year
Month
sA
nnual
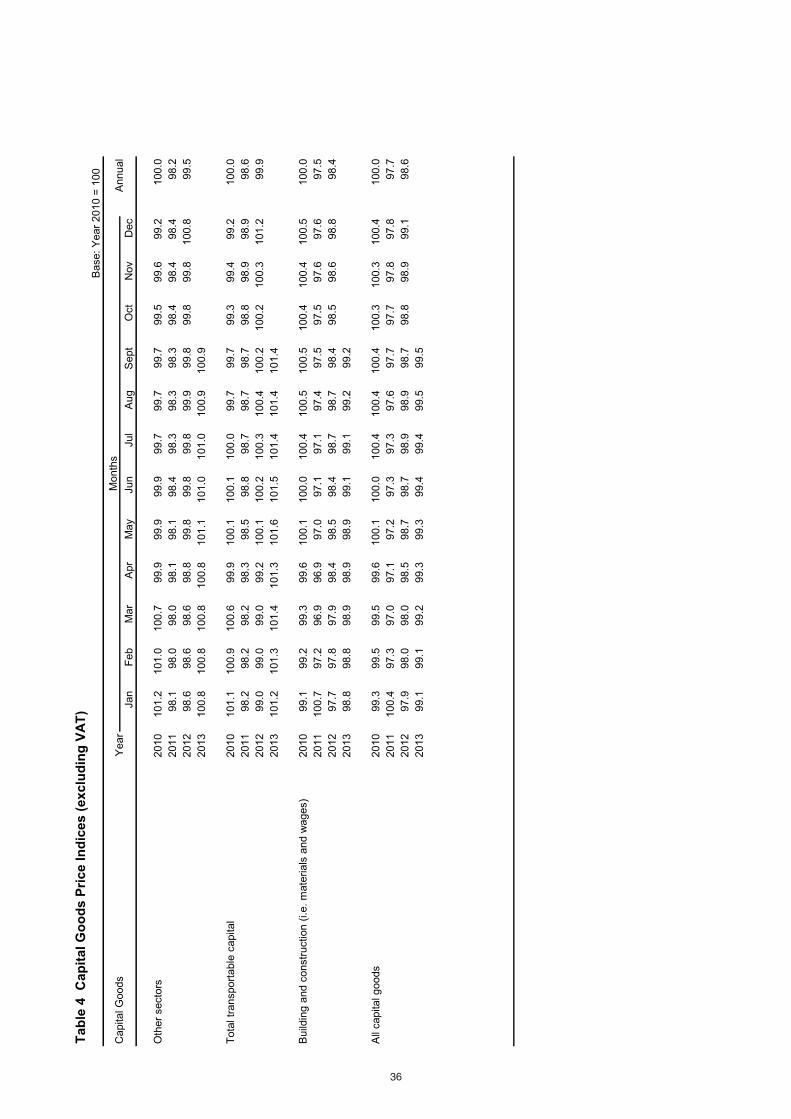
Tab
le4
Ca
pit
alG
oo
ds
Pri
ce
Ind
ice
s(e
xc
lud
ing
VA
T)
Base:
Year
2010
=100
Jan
Feb
Mar
Apr
May
Jun
Jul
Aug
Sept
Oct
Nov
Dec
Oth
er
secto
rs2010
101.2
101.0
100.7
99.9
99.9
99.9
99.7
99.7
99.7
99.5
99.6
99.2
100.0
2011
98.1
98.0
98.0
98.1
98.1
98.4
98.3
98.3
98.3
98.4
98.4
98.4
98.2
2012
98.6
98.6
98.6
98.8
99.8
99.8
99.8
99.9
99.8
99.8
99.8
100.8
99.5
2013
100.8
100.8
100.8
100.8
101.1
101.0
101.0
100.9
100.9
Tota
ltr
ansport
able
capital
2010
101.1
100.9
100.6
99.9
100.1
100.1
100.0
99.7
99.7
99.3
99.4
99.2
100.0
2011
98.2
98.2
98.2
98.3
98.5
98.8
98.7
98.7
98.7
98.8
98.9
98.9
98.6
2012
99.0
99.0
99.0
99.2
100.1
100.2
100.3
100.4
100.2
100.2
100.3
101.2
99.9
2013
101.2
101.3
101.4
101.3
101.6
101.5
101.4
101.4
101.4
2010
99.1
99.2
99.3
99.6
100.1
100.0
100.4
100.5
100.5
100.4
100.4
100.5
100.0
2011
100.7
97.2
96.9
96.9
97.0
97.1
97.1
97.4
97.5
97.5
97.6
97.6
97.5
2012
97.7
97.8
97.9
98.4
98.5
98.4
98.7
98.7
98.4
98.5
98.6
98.8
98.4
2013
98.8
98.8
98.9
98.9
98.9
99.1
99.1
99.2
99.2
All
capitalgoods
2010
99.3
99.5
99.5
99.6
100.1
100.0
100.4
100.4
100.4
100.3
100.3
100.4
100.0
2011
100.4
97.3
97.0
97.1
97.2
97.3
97.3
97.6
97.7
97.7
97.8
97.8
97.7
2012
97.9
98.0
98.0
98.5
98.7
98.7
98.9
98.9
98.7
98.8
98.9
99.1
98.6
2013
99.1
99.1
99.2
99.3
99.3
99.4
99.4
99.5
99.5
Build
ing
and
constr
uction
(i.e
.m
ate
rials
and
wages)
CapitalG
oods
Year
Month
sA
nnual
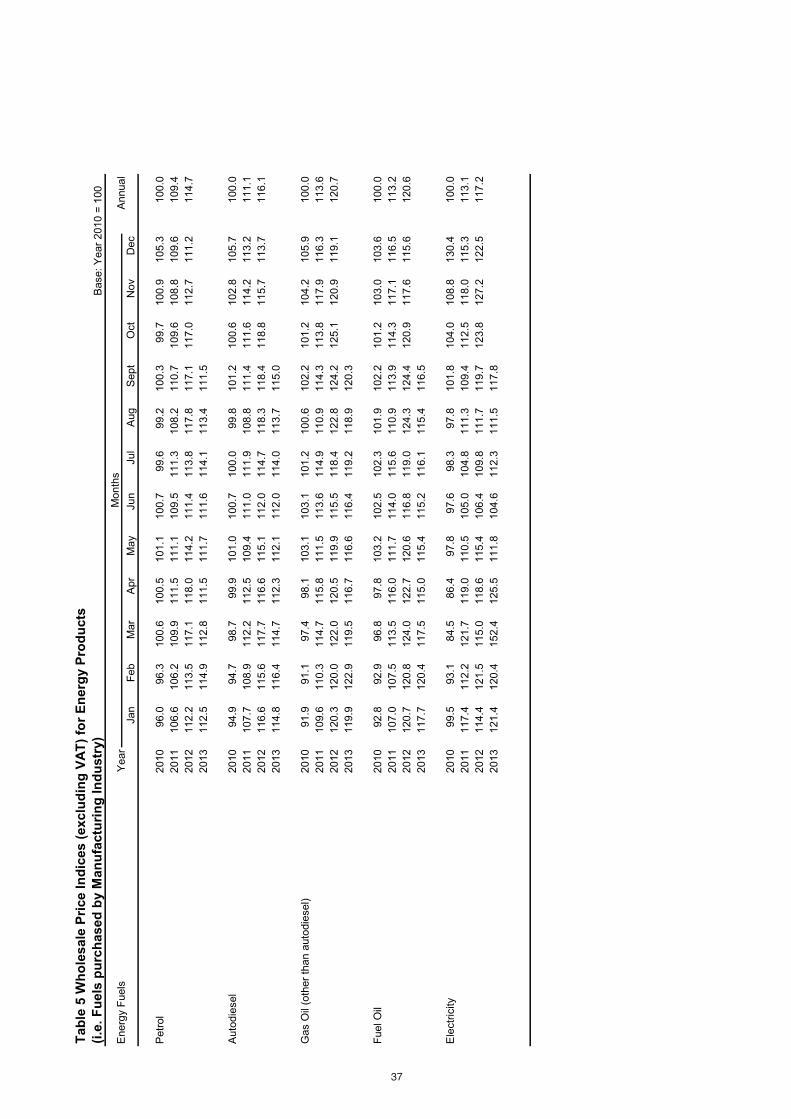
Tab
le5
Wh
ole
sale
Pri
ce
Ind
ices
(exclu
din
gV
AT
)fo
rE
nerg
yP
rod
ucts
(i.e
.F
uels
pu
rch
ased
by
Man
ufa
ctu
rin
gIn
du
str
y)
Base:
Year
2010
=100
Jan
Feb
Mar
Apr
May
Jun
Jul
Aug
Sept
Oct
Nov
Dec
Petr
ol
2010
96.0
96.3
100.6
100.5
101.1
100.7
99.6
99.2
100.3
99.7
100.9
105.3
100.0
2011
106.6
106.2
109.9
111.5
111.1
109.5
111.3
108.2
110.7
109.6
108.8
109.6
109.4
2012
112.2
113.5
117.1
118.0
114.2
111.4
113.8
117.8
117.1
117.0
112.7
111.2
114.7
2013
112.5
114.9
112.8
111.5
111.7
111.6
114.1
113.4
111.5
Auto
die
sel
2010
94.9
94.7
98.7
99.9
101.0
100.7
100.0
99.8
101.2
100.6
102.8
105.7
100.0
2011
107.7
108.9
112.2
112.5
109.4
111.0
111.9
108.8
111.4
111.6
114.2
113.2
111.1
2012
116.6
115.6
117.7
116.6
115.1
112.0
114.7
118.3
118.4
118.8
115.7
113.7
116.1
2013
114.8
116.4
114.7
112.3
112.1
112.0
114.0
113.7
115.0
Gas
Oil
(oth
er
than
auto
die
sel)
2010
91.9
91.1
97.4
98.1
103.1
103.1
101.2
100.6
102.2
101.2
104.2
105.9
100.0
2011
109.6
110.3
114.7
115.8
111.5
113.6
114.9
110.9
114.3
113.8
117.9
116.3
113.6
2012
120.3
120.0
122.0
120.5
119.9
115.5
118.4
122.8
124.2
125.1
120.9
119.1
120.7
2013
119.9
122.9
119.5
116.7
116.6
116.4
119.2
118.9
120.3
FuelO
il2010
92.8
92.9
96.8
97.8
103.2
102.5
102.3
101.9
102.2
101.2
103.0
103.6
100.0
2011
107.0
107.5
113.5
116.0
111.7
114.0
115.6
110.9
113.9
114.3
117.1
116.5
113.2
2012
120.7
120.8
124.0
122.7
120.6
116.8
119.0
124.3
124.4
120.9
117.6
115.6
120.6
2013
117.7
120.4
117.5
115.0
115.4
115.2
116.1
115.4
116.5
Ele
ctr
icity
2010
99.5
93.1
84.5
86.4
97.8
97.6
98.3
97.8
101.8
104.0
108.8
130.4
100.0
2011
117.4
112.2
121.7
119.0
110.5
105.0
104.8
111.3
109.4
112.5
118.0
115.3
113.1
2012
114.4
121.5
115.0
118.6
115.4
106.4
109.8
111.7
119.7
123.8
127.2
122.5
117.2
2013
121.4
120.4
152.4
125.5
111.8
104.6
112.3
111.5
117.8
Energ
yF
uels
Year
Month
sA
nnual

Tab
le5
Wh
ole
sale
Pri
ce
Ind
ices
(exclu
din
gV
AT
)fo
rE
ne
rgy
Pro
du
cts
(i.e
.F
ue
lsp
urc
ha
se
db
yM
an
ufa
ctu
rin
gIn
du
str
y)
Base:
Year
2010
=100
Jan
Feb
Mar
Apr
May
Jun
Jul
Aug
Sept
Oct
Nov
Dec
Petr
ole
um
fuels
12010
93.2
93.1
97.5
98.4
102.6
102.2
101.5
101.2
101.9
101.0
103.0
104.5
100.0
2011
107.5
108.1
113.3
115.1
111.2
113.1
114.5
110.4
113.3
113.5
116.3
115.5
112.7
2012
119.4
119.3
122.1
120.9
119.1
115.4
117.8
122.6
122.8
120.9
117.5
115.5
119.4
2013
117.2
119.7
117.0
114.6
114.7
114.5
116.0
115.5
116.6
Energ
yP
roducts
2010
97.4
93.1
88.8
90.4
99.4
99.1
99.4
98.9
101.8
103.0
106.8
121.7
100.0
2011
114.1
110.9
118.9
117.7
110.7
107.7
108.1
111.0
110.7
112.8
117.4
115.4
113.0
2012
116.1
120.8
117.4
119.4
116.7
109.4
112.5
115.3
120.7
122.9
124.0
120.2
118.0
2013
120.0
120.2
140.5
121.8
112.8
107.9
113.5
112.9
117.4
1E
nerg
ypro
ducts
exclu
din
gele
ctr
icity
Energ
yF
uels
Year
Month
sA
nnual