Embed Size (px)
Citation preview
Content
Why Taxonomy?
How to determine & classify a species
Domains versus Kingdoms
Phylogeny and evolution
Taxonomy
Why Taxonomy?
• Classification – Arrangement in groups or taxa
(taxon = group)
• Nomenclature – Assigning names to taxa
• Identification – Determination of taxon to which an
isolate belongs
(Most practical part of taxonomy)
Making sense of Nature
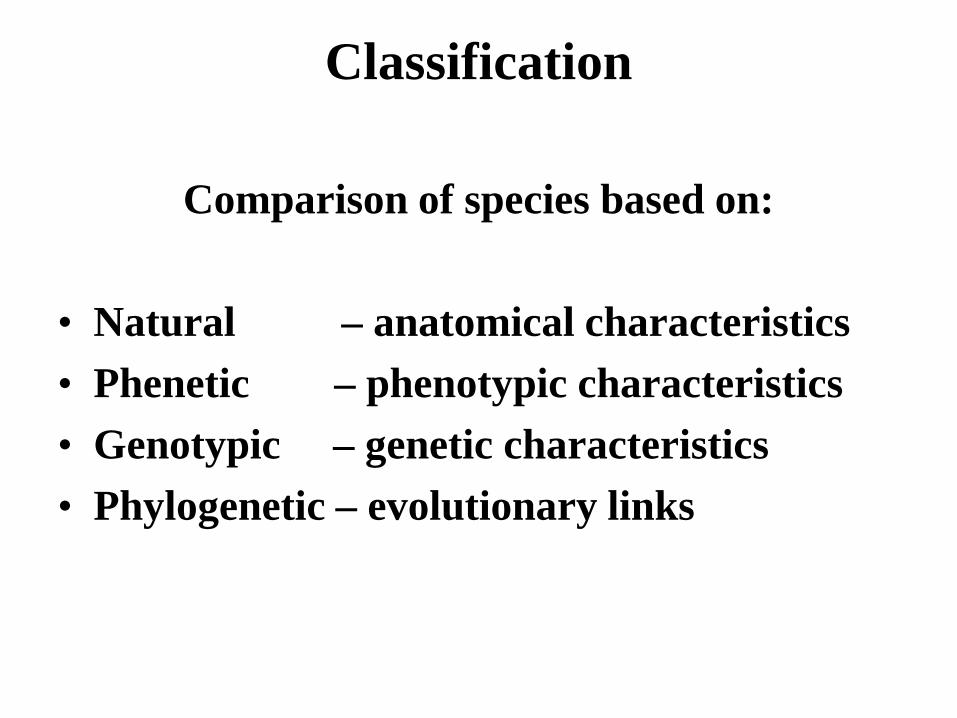
Classification
Comparison of species based on:
• Natural – anatomical characteristics• Phenetic – phenotypic characteristics• Genotypic – genetic characteristics• Phylogenetic – evolutionary links
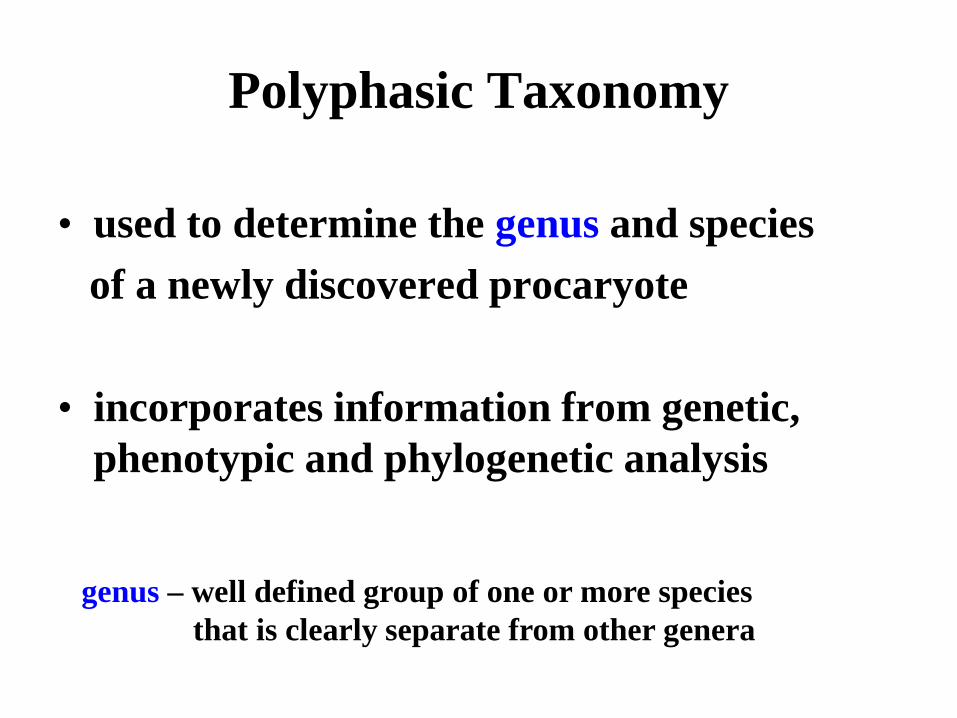
Polyphasic Taxonomy
• used to determine the genus and species of a newly discovered procaryote
• incorporates information from genetic, phenotypic and phylogenetic analysis
genus – well defined group of one or more species that is clearly separate from other genera
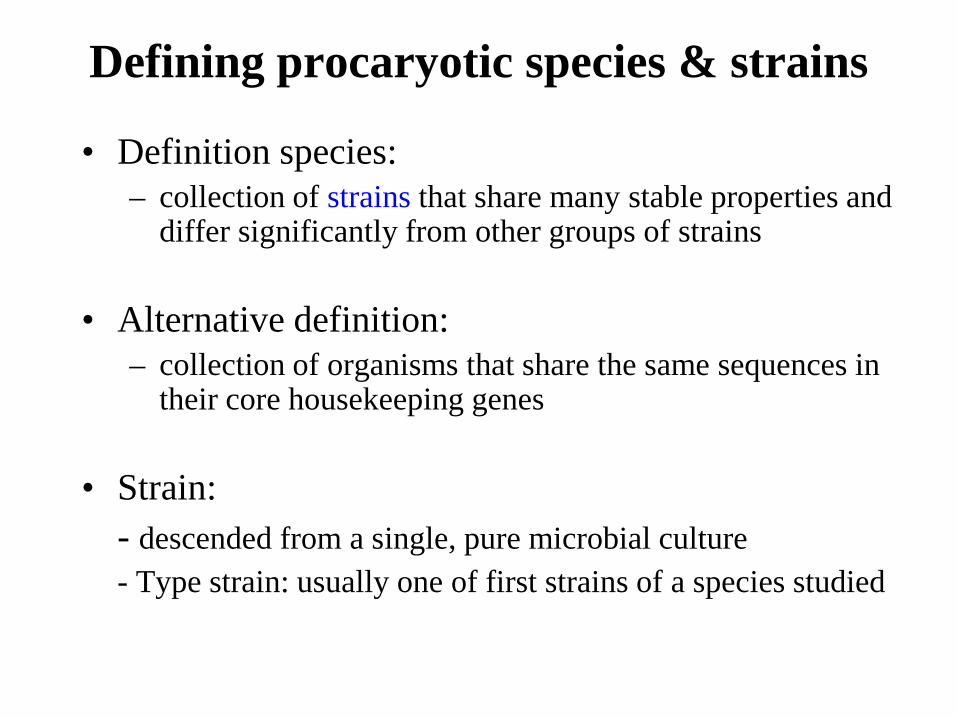
Defining procaryotic species & strains
• Definition species:– collection of strains that share many stable properties and
differ significantly from other groups of strains
• Alternative definition:– collection of organisms that share the same sequences in
their core housekeeping genes
• Strain:- descended from a single, pure microbial culture- Type strain: usually one of first strains of a species studied
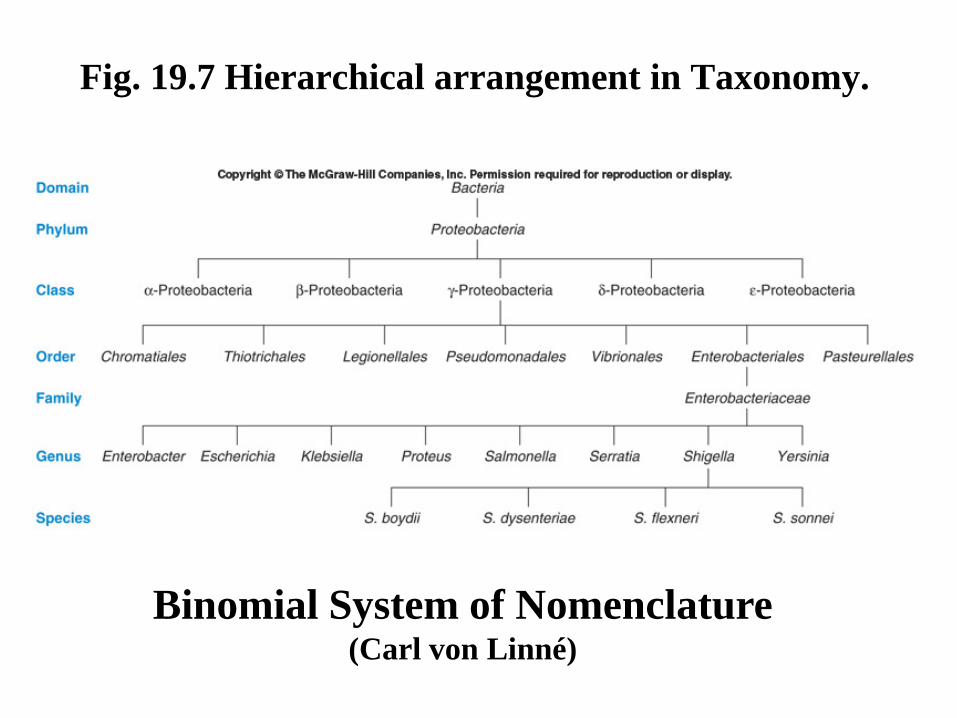
Fig. 19.7 Hierarchical arrangement in Taxonomy.
Binomial System of Nomenclature(Carl von Linné)
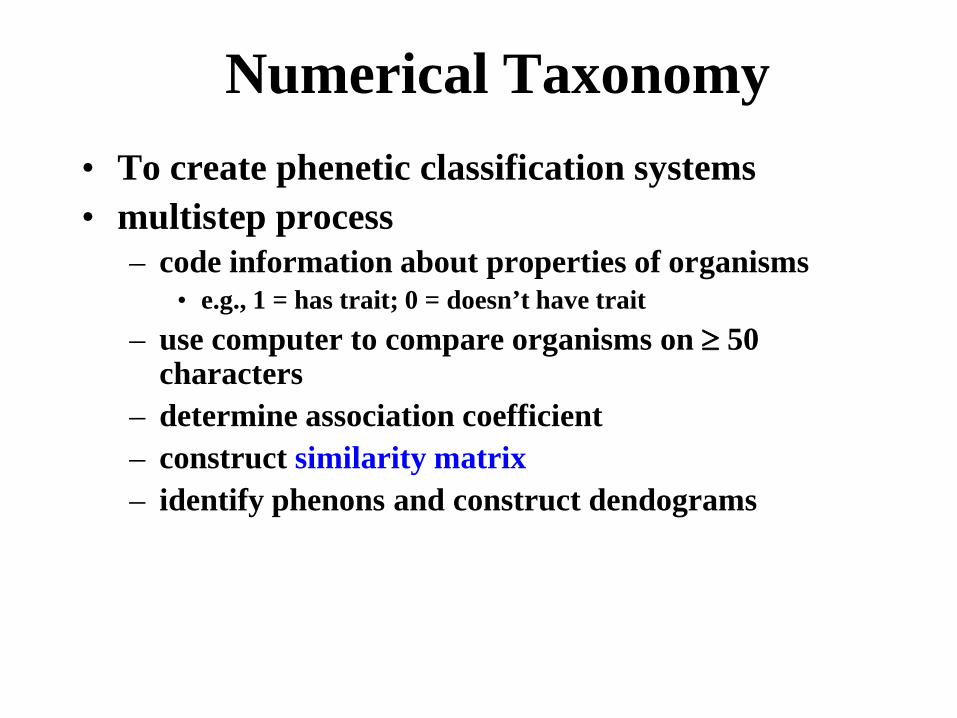
Numerical Taxonomy• To create phenetic classification systems• multistep process
– code information about properties of organisms• e.g., 1 = has trait; 0 = doesn’t have trait
– use computer to compare organisms on ≥ 50 characters
– determine association coefficient– construct similarity matrix– identify phenons and construct dendograms
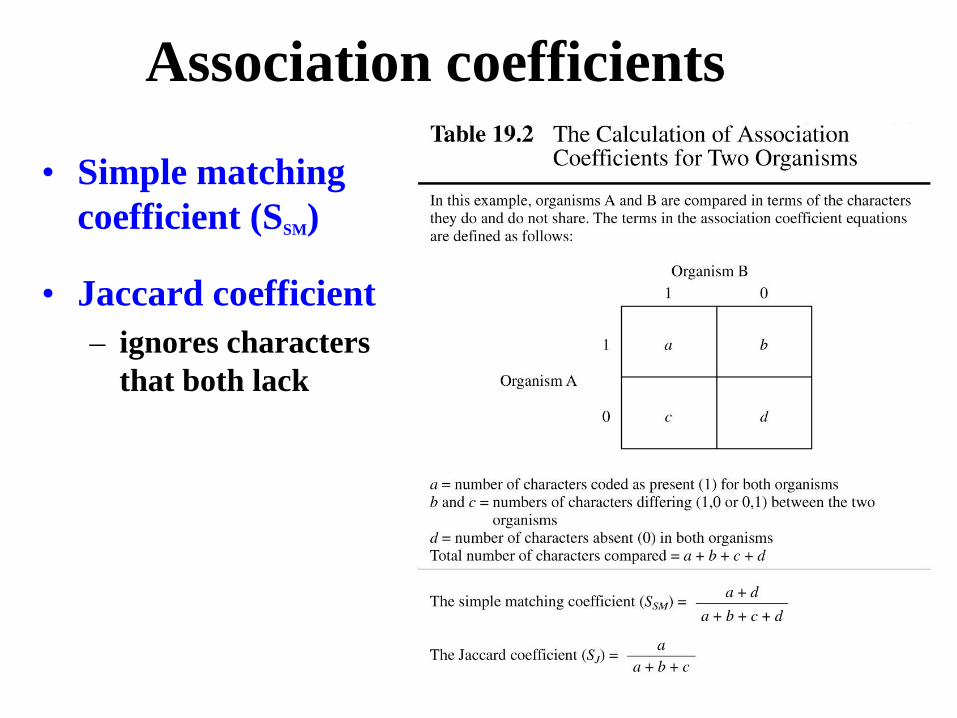
Association coefficients
• Simple matching coefficient (SSM)
• Jaccard coefficient– ignores characters
that both lack
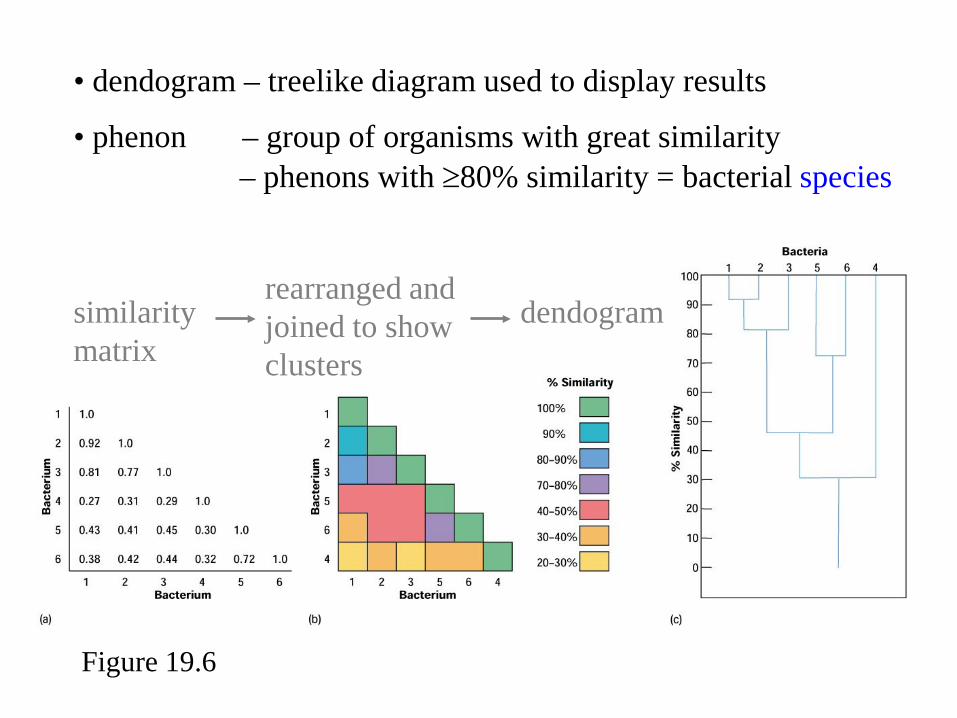
Figure 19.6
similaritymatrix
rearranged andjoined to show clusters
• dendogram – treelike diagram used to display results
dendogram
• phenon – group of organisms with great similarity– phenons with ≥80% similarity = bacterial species
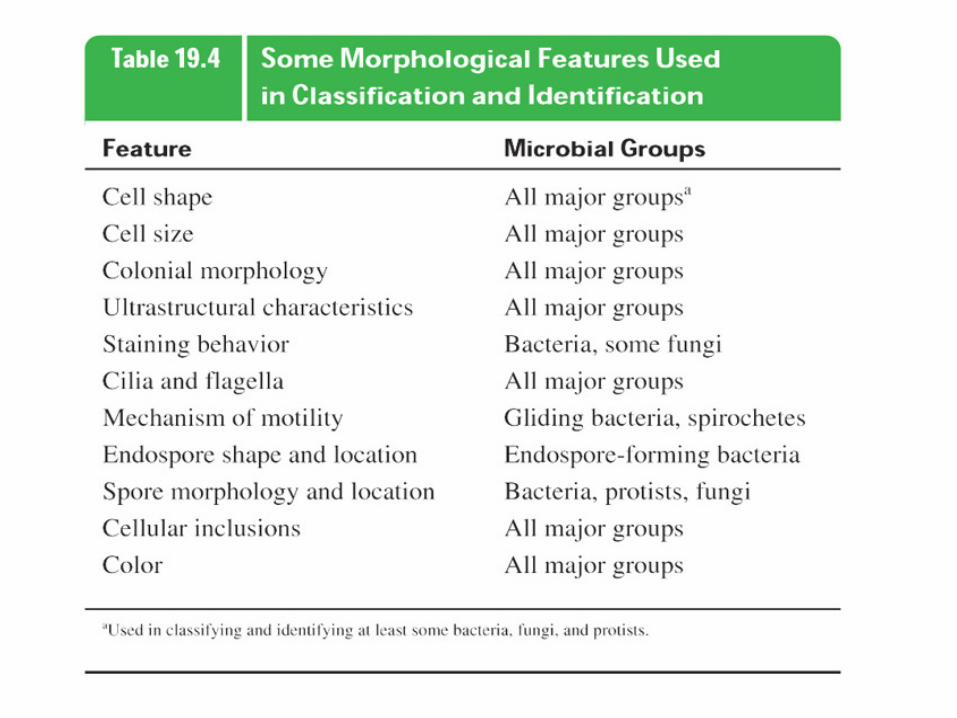
Techniques for Determining Microbial Taxonomy and Phylogeny
• Classical CharacteristicsMorphological
EcologicalPhysiologicalBiochemical
Genetic
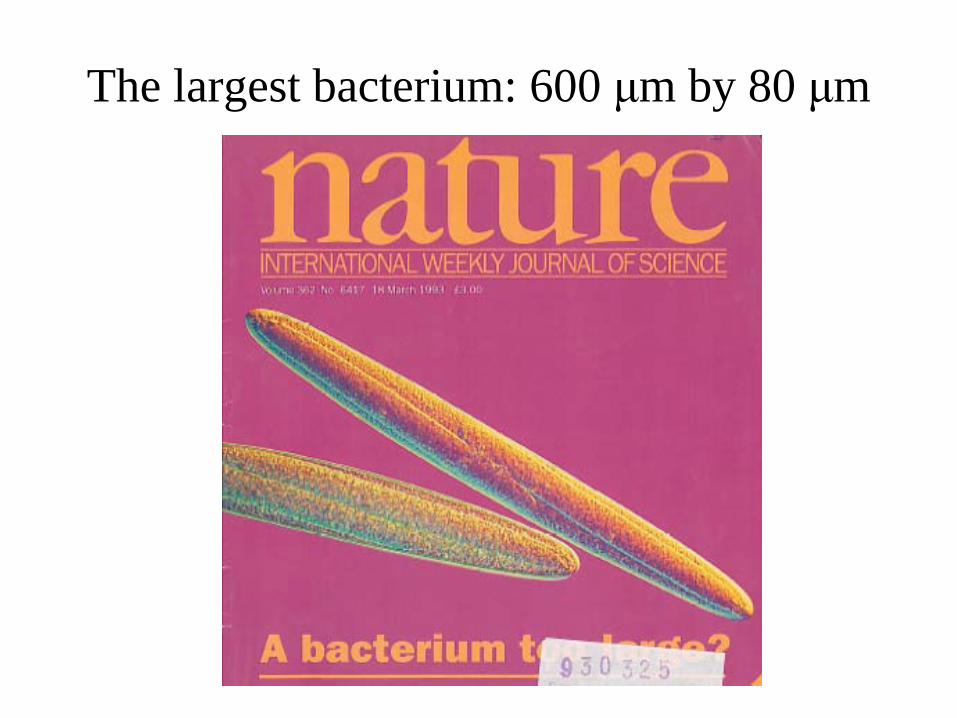
The largest bacterium: 600 μm by 80 μm
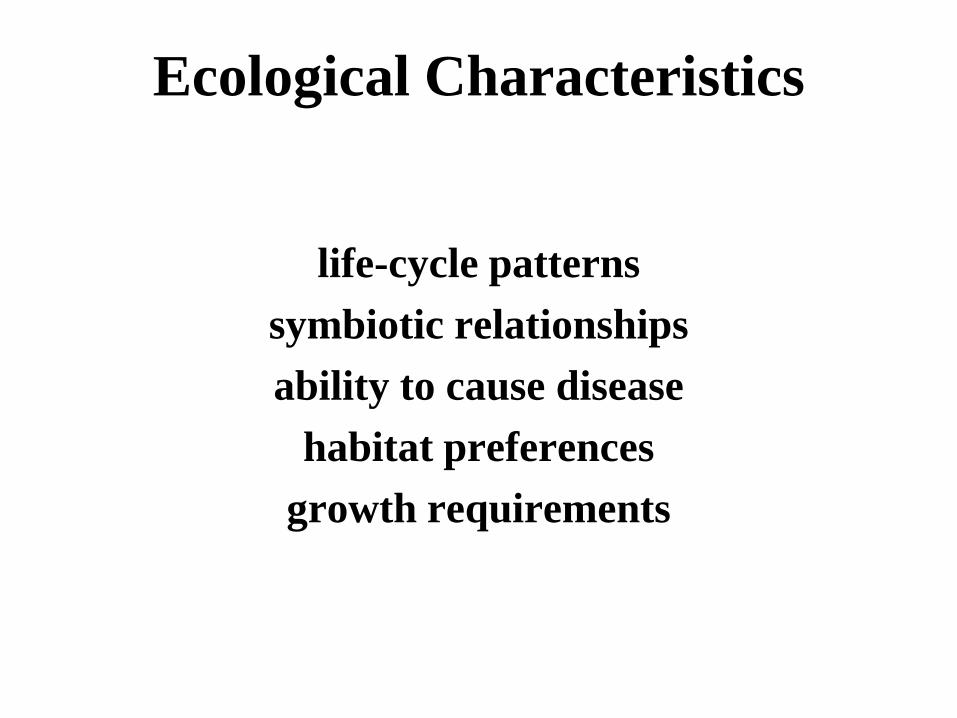
Ecological Characteristics
life-cycle patternssymbiotic relationshipsability to cause disease
habitat preferencesgrowth requirements
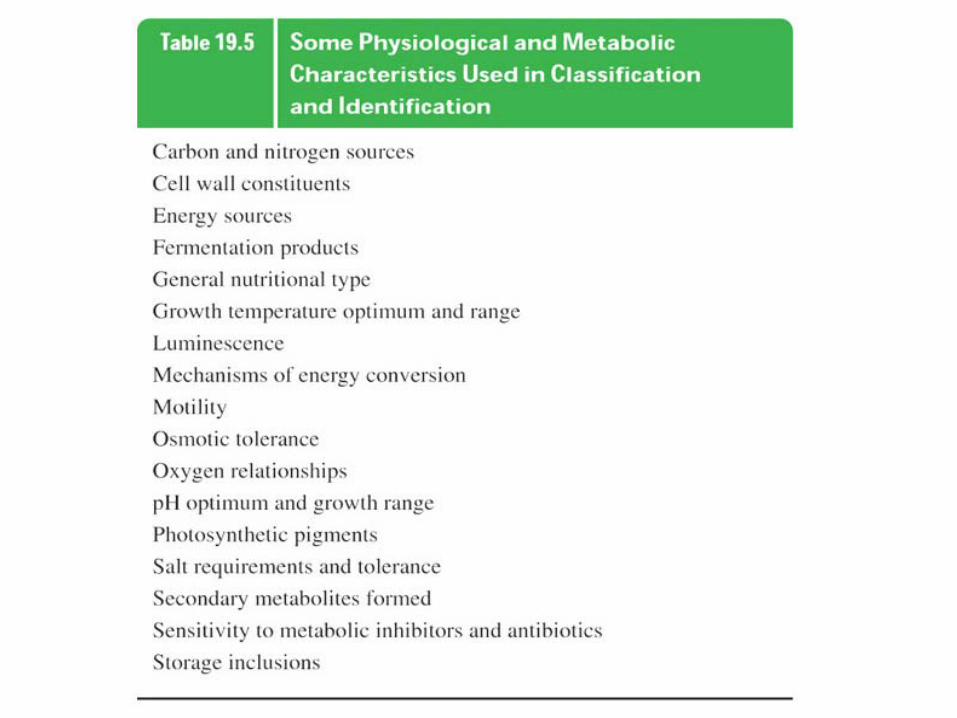
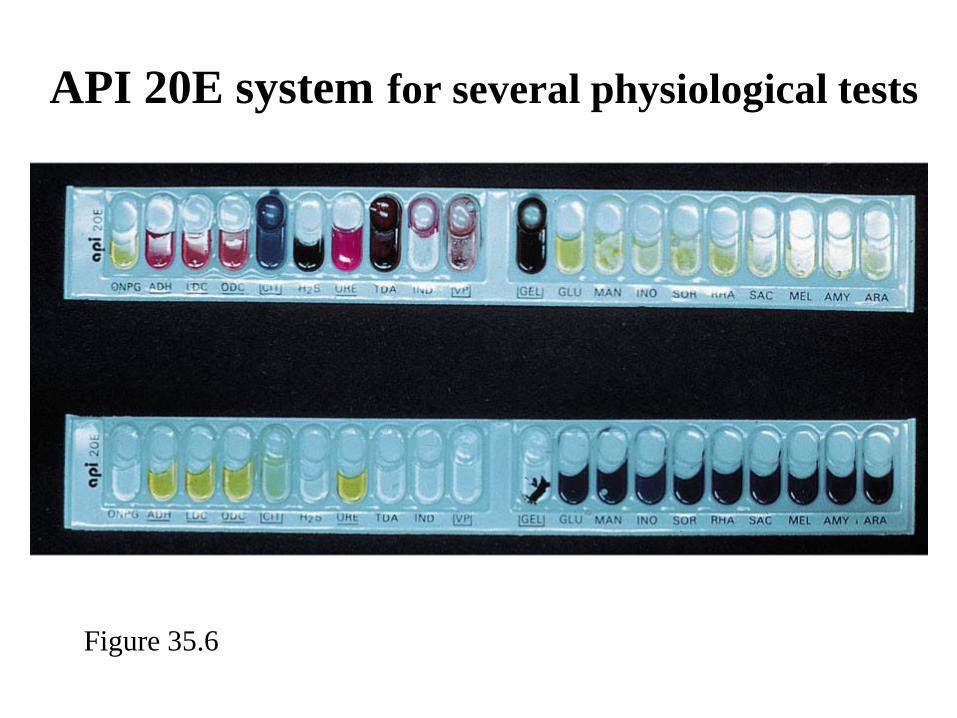
Figure 35.6
API 20E system for several physiological tests
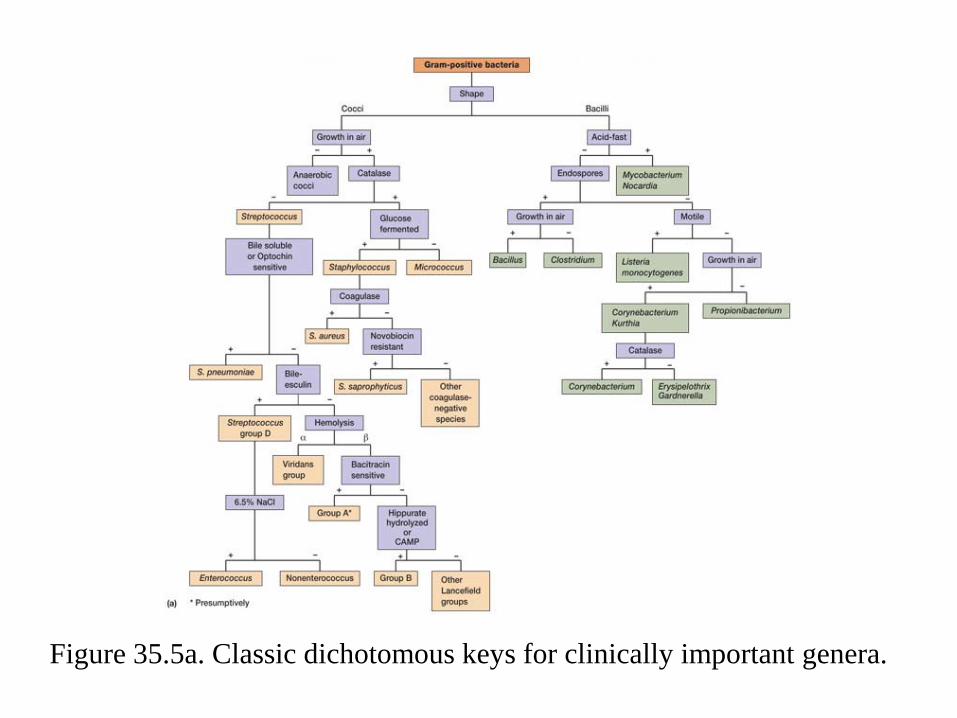
Figure 35.5a. Classic dichotomous keys for clinically important genera.
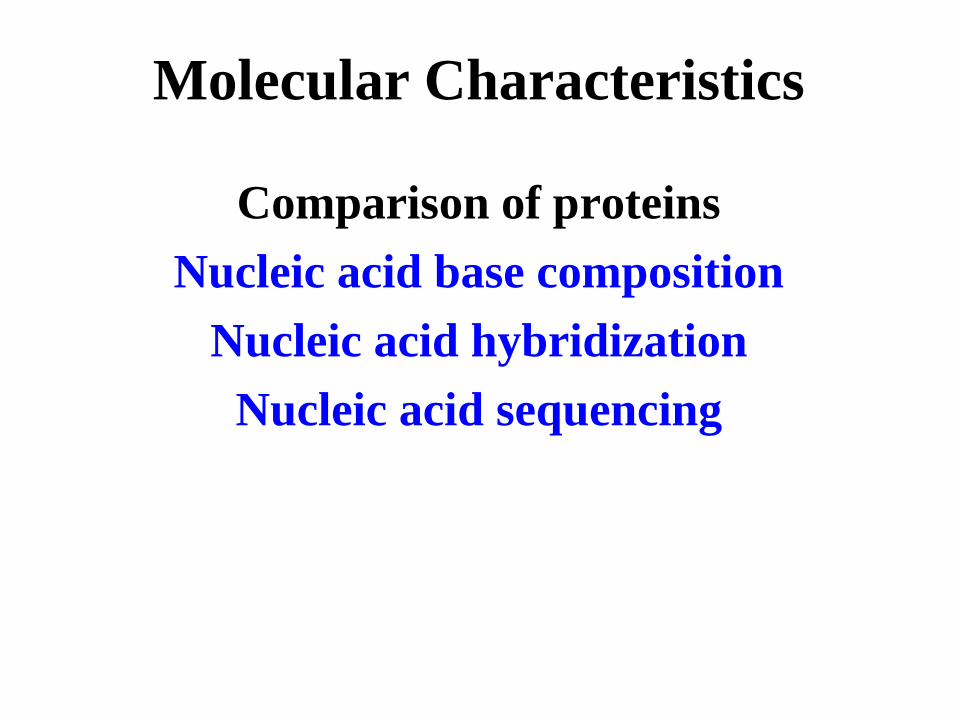
Molecular Characteristics
Comparison of proteinsNucleic acid base composition
Nucleic acid hybridizationNucleic acid sequencing
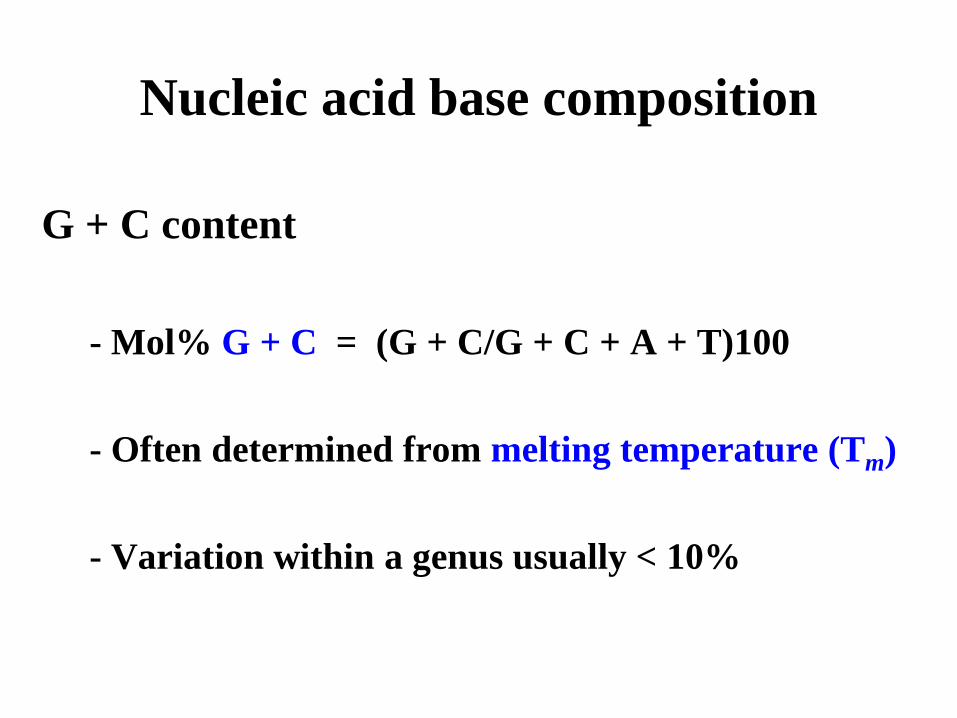
Nucleic acid base composition
G + C content
- Mol% G + C = (G + C/G + C + A + T)100
- Often determined from melting temperature (Tm)
- Variation within a genus usually < 10%
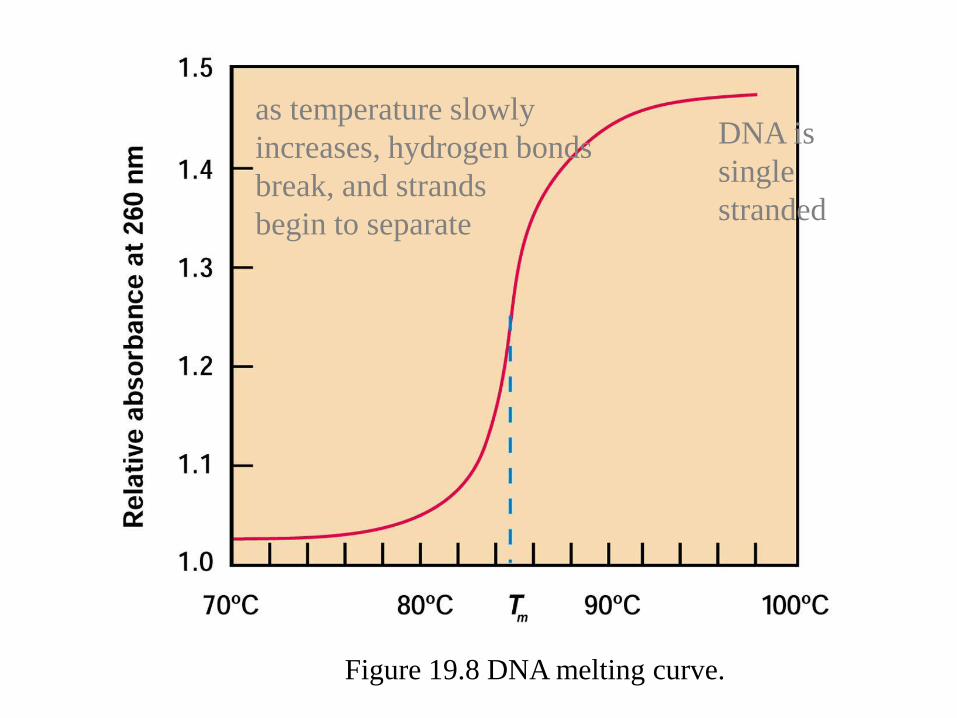
Figure 19.8 DNA melting curve.
as temperature slowlyincreases, hydrogen bondsbreak, and strandsbegin to separate
DNA issinglestranded
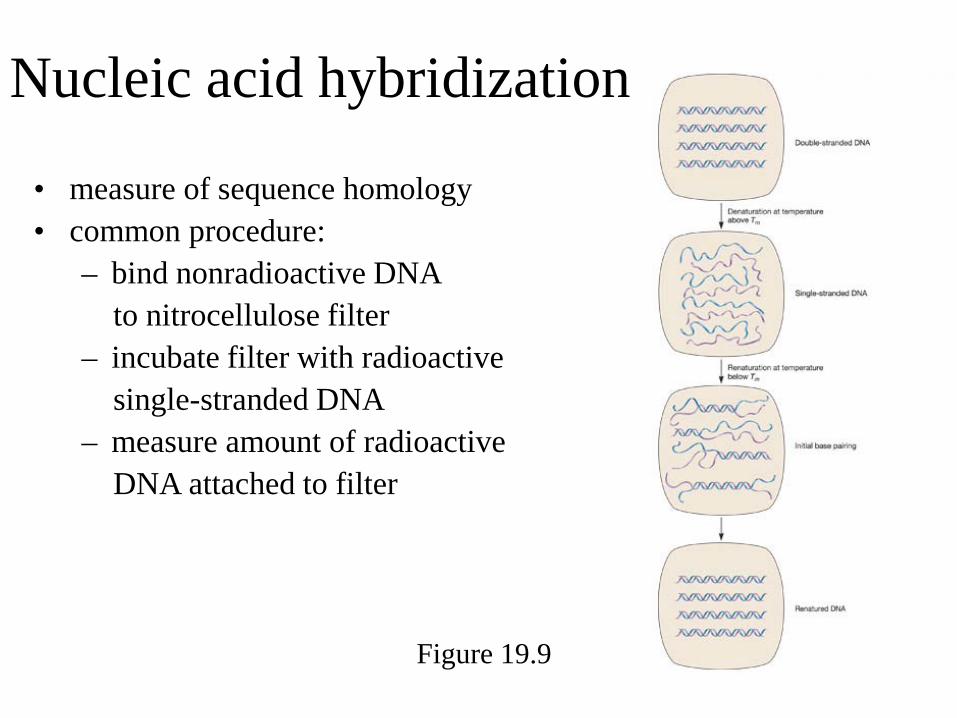
Figure 19.9
Nucleic acid hybridization
• measure of sequence homology• common procedure:
– bind nonradioactive DNAto nitrocellulose filter
– incubate filter with radioactivesingle-stranded DNA
– measure amount of radioactiveDNA attached to filter
Nucleic acid sequencing
• most powerful and direct method for comparing genomes
• sequences of 16S & 18S rRNA (SSU rRNAs) are used most often in phylogenetic studies
• complete chromosomes can now be sequenced and compared(BIOINFORMATICS !)
Genetic Analysis
• study of chromosomal gene exchange by transformation and conjugation– these processes rarely cross genera
• plasmids can help to solve confusion in the analysis of phenotypic traits
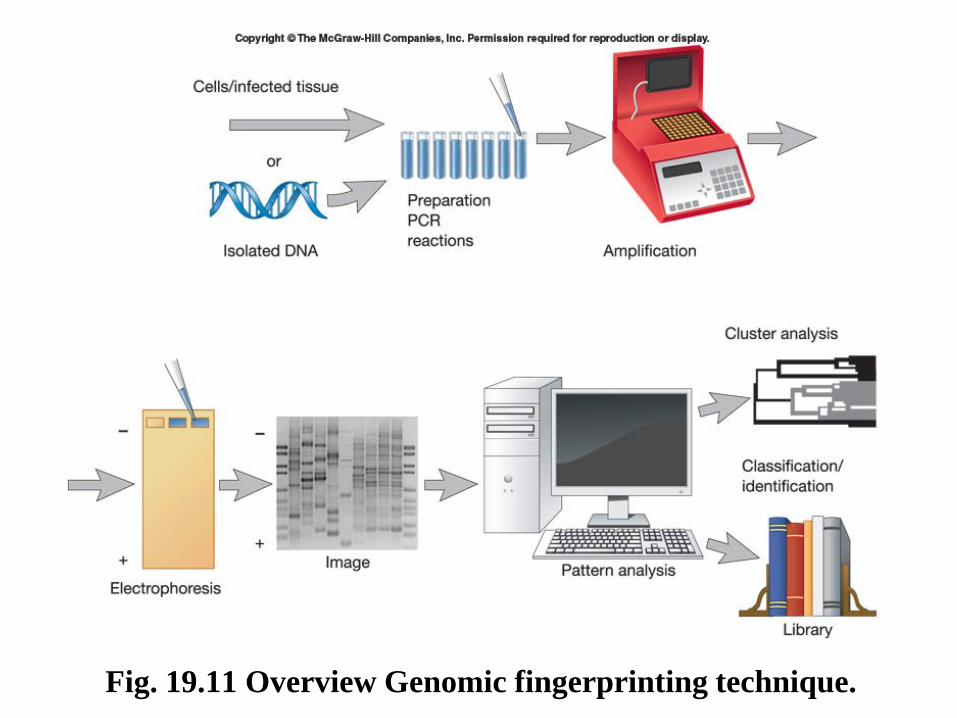
Fig. 19.11 Overview Genomic fingerprinting technique.
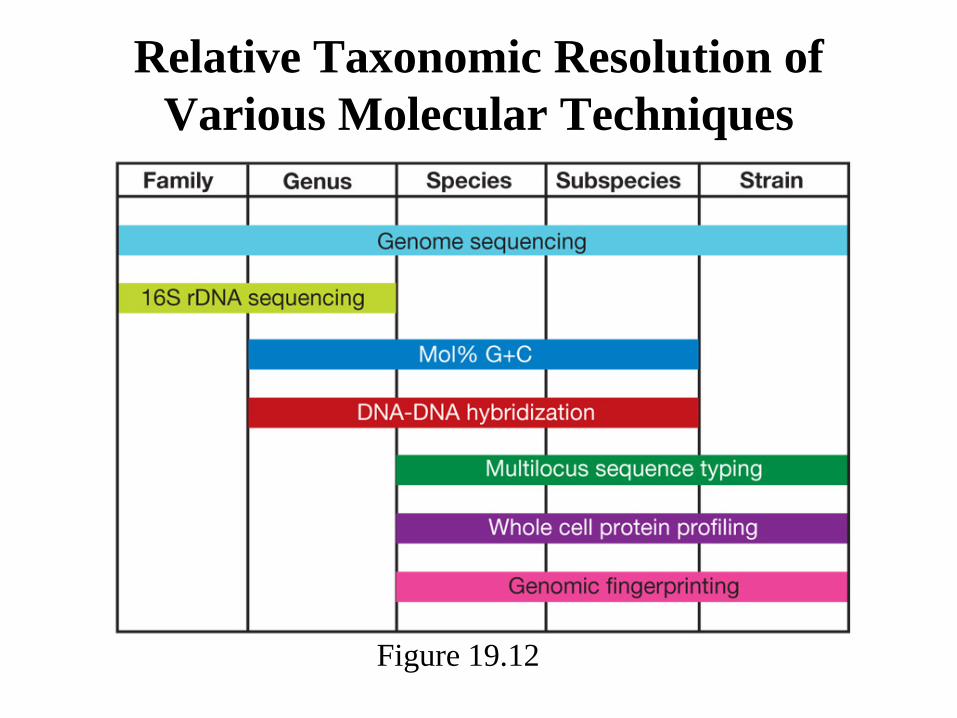
Relative Taxonomic Resolution of Various Molecular Techniques
Figure 19.12
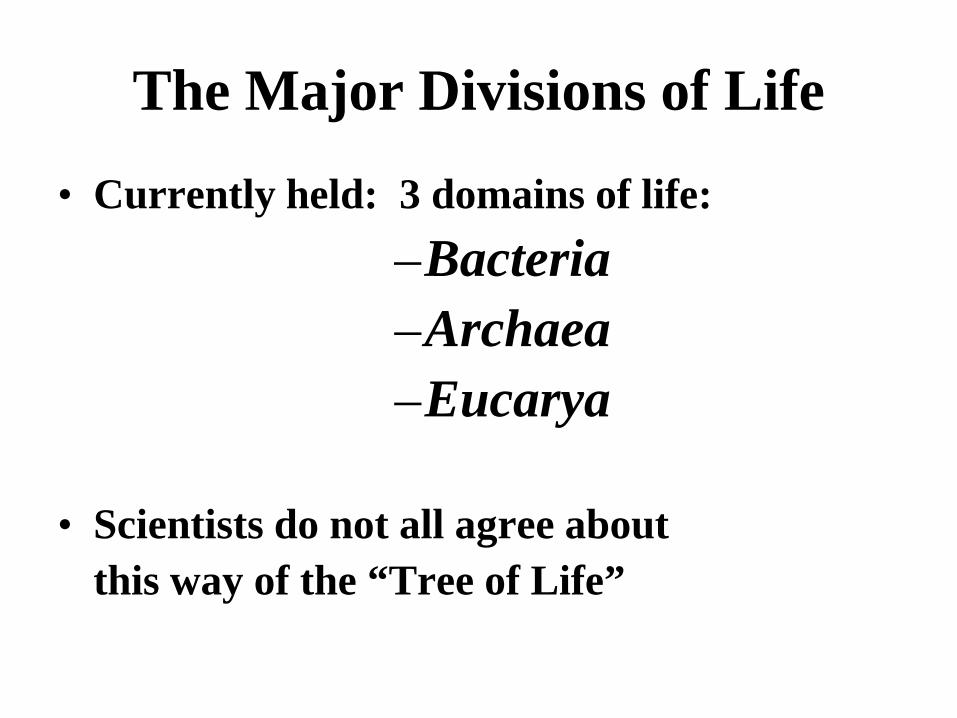
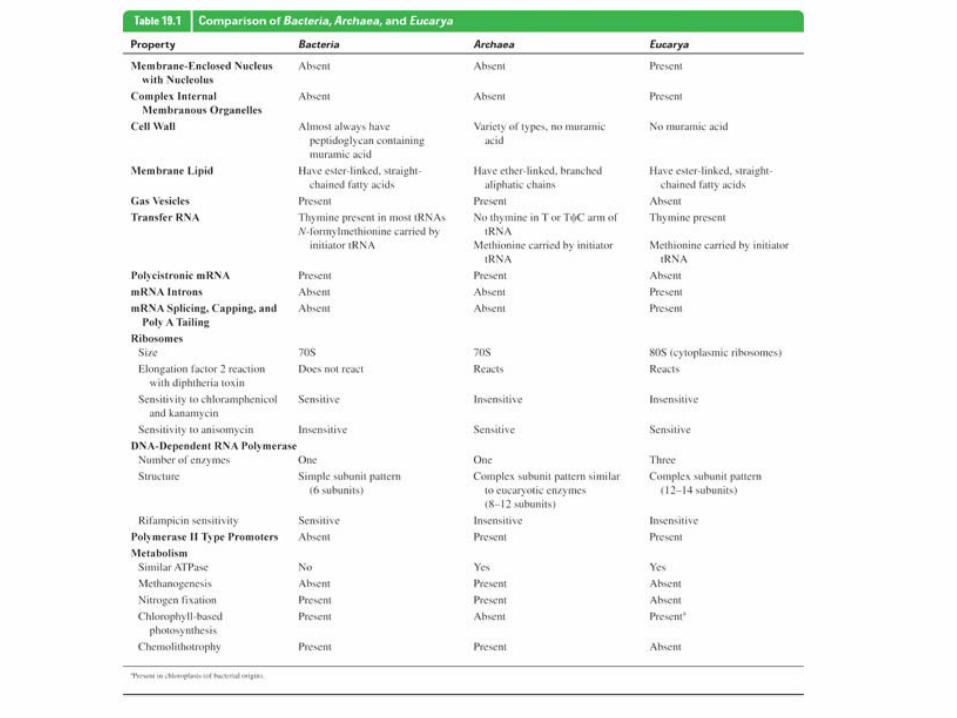
The Major Divisions of Life
• Currently held: 3 domains of life:–Bacteria–Archaea–Eucarya
• Scientists do not all agree aboutthis way of the “Tree of Life”
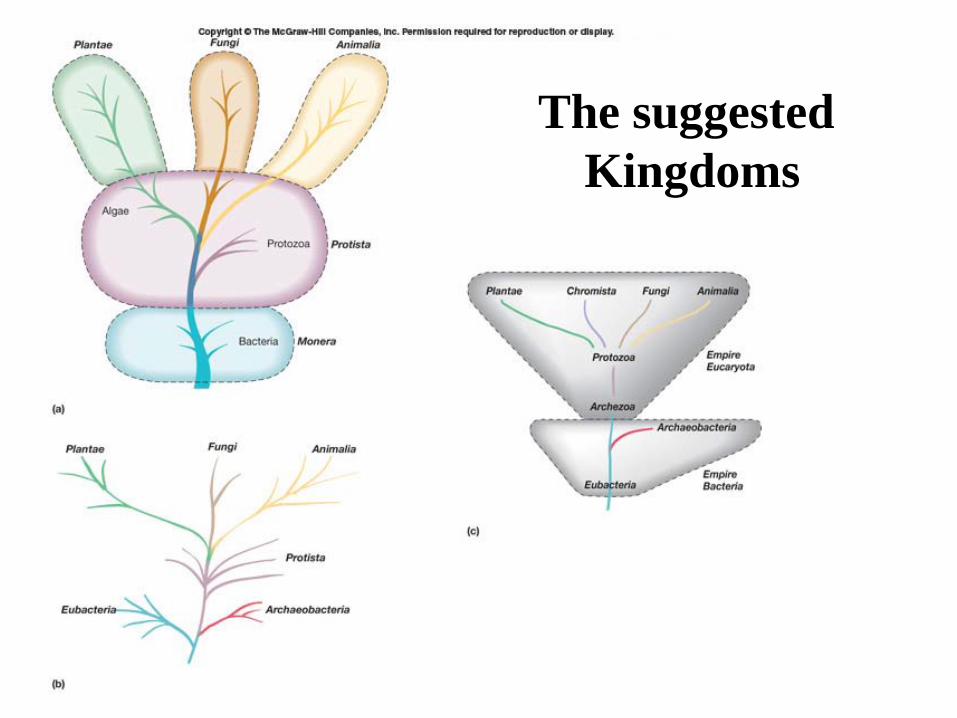
The suggestedKingdoms
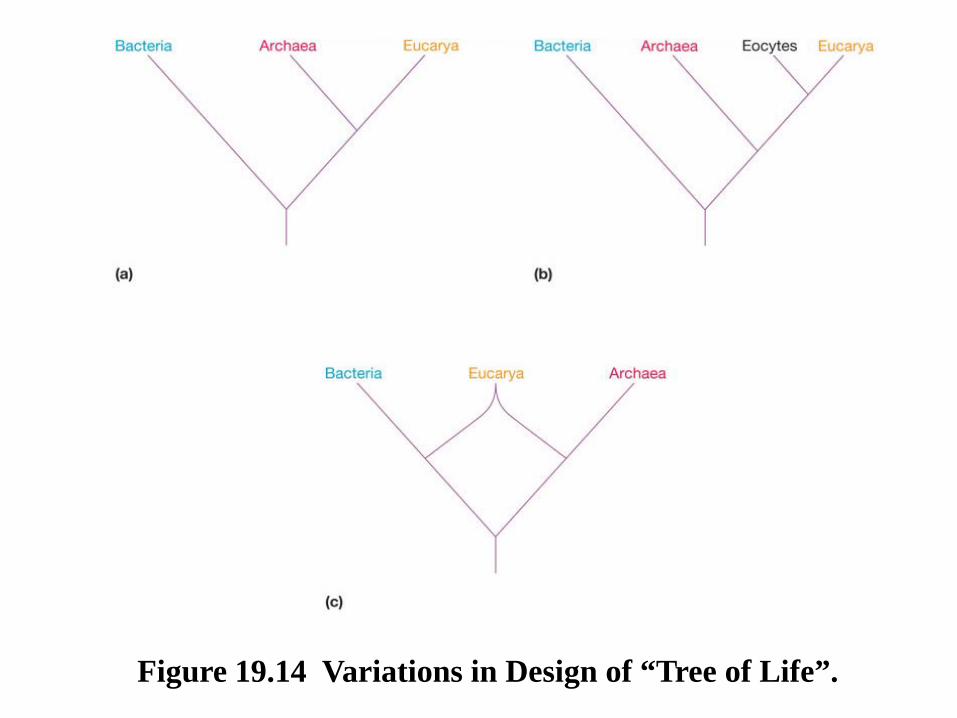
Figure 19.14 Variations in Design of “Tree of Life”.
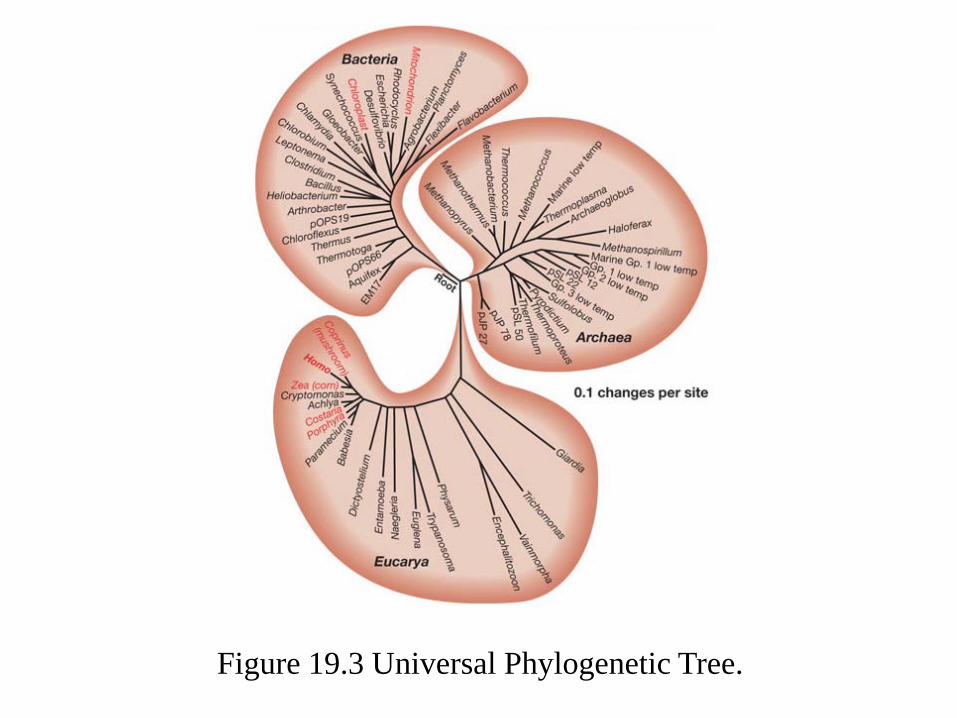
Figure 19.3 Universal Phylogenetic Tree.
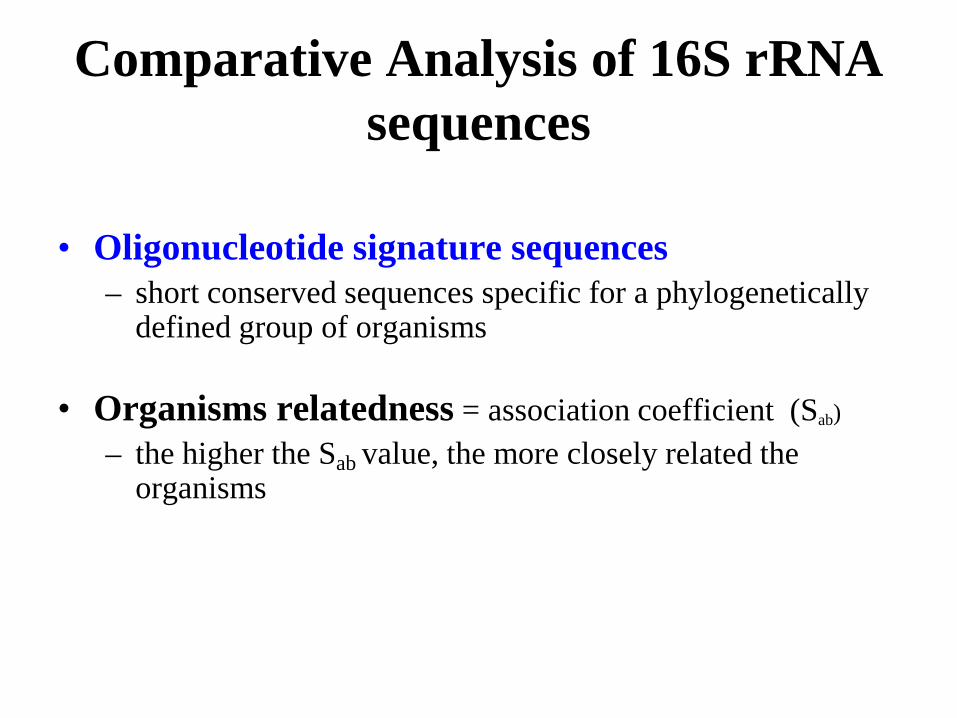
Comparative Analysis of 16S rRNA sequences
• Oligonucleotide signature sequences– short conserved sequences specific for a phylogenetically
defined group of organisms
• Organisms relatedness = association coefficient (Sab)
– the higher the Sab value, the more closely related the organisms
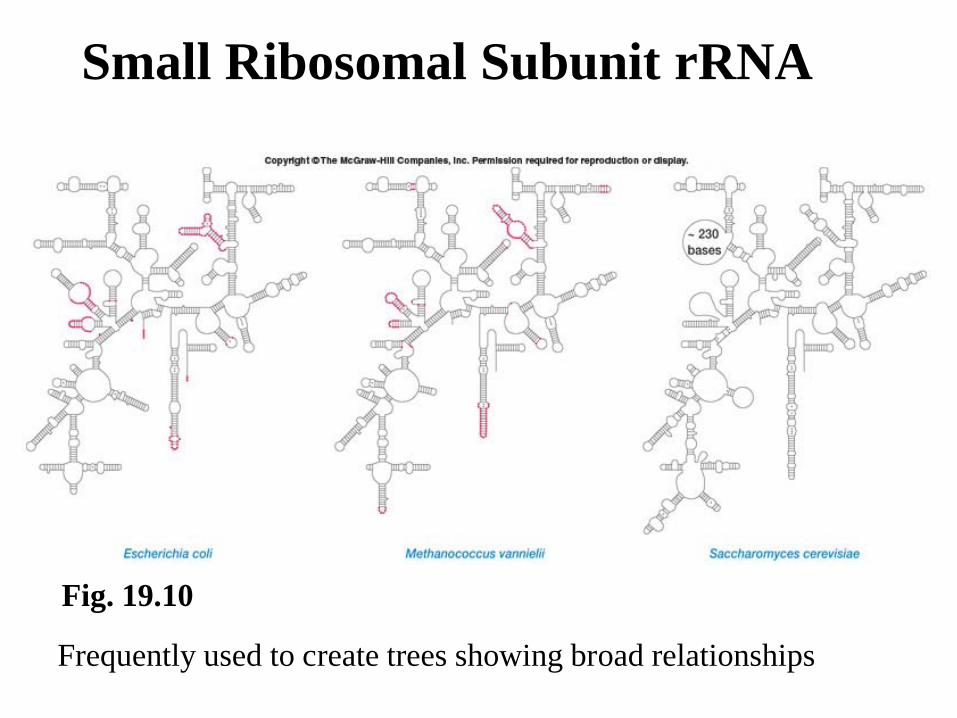
Fig. 19.10
Small Ribosomal Subunit rRNA
Frequently used to create trees showing broad relationships
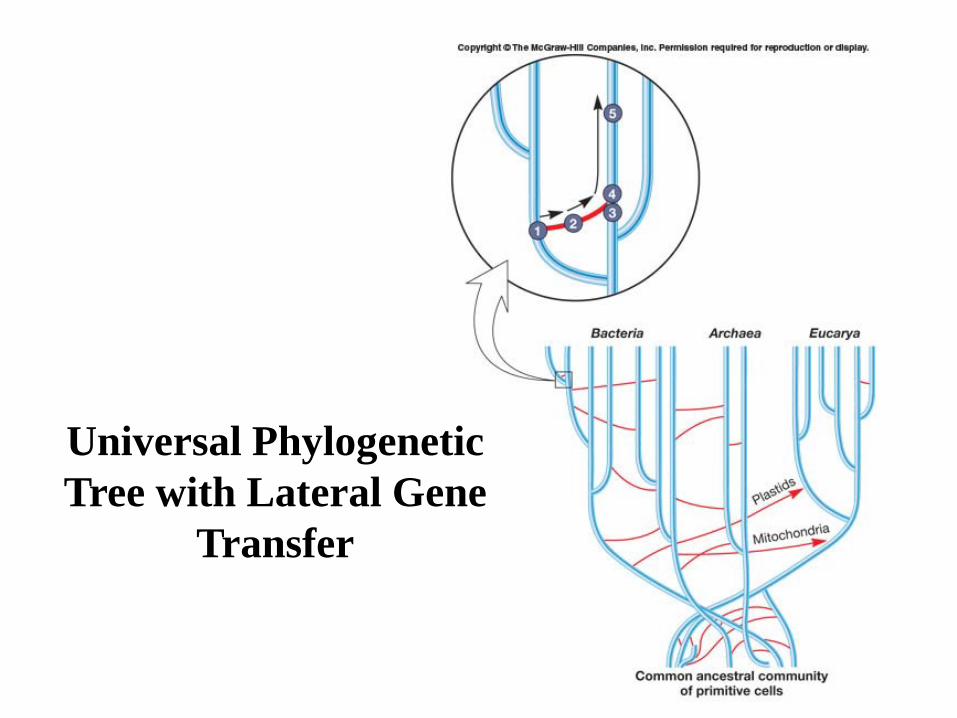
Universal Phylogenetic Tree with Lateral Gene
Transfer