Embed Size (px)
Citation preview
8/7/2019 wind velocity bangladesh coastal area
http://slidepdf.com/reader/full/wind-velocity-bangladesh-coastal-area 1/5
Analysis of Wind Characteristics in Coastal Areas of Bangladesh
Journal of Mechanic al Engineering , vo l. ME39, No. 1, June 2008
Transac tion of the Mec h. Eng. Div., The Institution of Eng ineers, Bang lad esh
45
ANALYSIS OF WIND CHARACTERISTICS IN COASTAL AREAS OF
BANGLADESH
A.N. M. Mominul Islam Mukut1, Md. Quamrul Islam
2and Muhammad Mahbubul Alam
2
Department of Mechanical Engineering,1Dhaka University of Engineering and Technology, Gazipur-1700, Bangladesh. 2Bangladesh University of Engineering and Technology, Dhaka-1000, Bangladesh.
Abstract: The present demand of energy is increasing day by day due to various reasons such as increasing population, the
aspiration for improved living standards and general economic and industrial growth. In the wake of the increasing world
energy crisis, which mostly affected the least developed countries, the interest in alternative energy resources has been
increased considerably. In this regard, wind as a source of energy can hold good prospect for a underdeveloped country like
Bangladesh. Besides, utilization of wind energy has been growing rapidly in the whole world due to environmental pollution,
consumption of the limited fossil fuels and global warming. Bangladesh has fairly wind energy potential, exploitation of the
wind energy is still in the crawling level. In the current study, wind characteristics and wind energy potential of Teknaf,
Kutubdia, Sandwip, Kuakata, and Mongla in the Coastal Areas are investigated. The measured wind data were processed as
hourly and monthly basis. Weibull probability density functions of the locations are calculated in the light of observed data
and Weibull shape parameter and scale parameter are also calculated. The main objective is to find out wind energy
potential for the utilization.
Keywords: Wind energy, Weibull distribution, Wind power, Coastal area.
INTRODUCTIONUtilization of energy indicates the social development
and economic growth for a country. A major portion of
world’s electricity energy requirement has been supplied
by thermal and hydro power plants. The present non-renewable energy sources have been causing negative
effects (global warming, ozone layer depletion, acid rain
etc.) on the atmosphere. Renewable energy sources are
inexhaustible, clean and free. These sources offer manyenvironmental and economical benefits in contrast to
conventional energy sources. Thus, recently the sources of
renewable energy such as wind, solar, geothermal etc. has
been growing leaps and bound within other resources astheir generating cost decreases. Although mankind has
been using the wind energy since ancient time, its use to
produce electricity effectively by means of modern wind
turbines is over two decades old (Rosa1).Wind energy continued its dynamic growth
worldwide in the year 2006. According to figures released
recently by the World Wind Energy Association about 14
900 MW were added in the past year making a globalinstalled capacity of 73 904 MW by the end of December
2006. The added capacity equals a growth rate of 25
percent, after 24 percent in 2005. The currently installed
wind power capacity generates more than one percent of
the global electricity consumption. Based on theaccelerated development, WWEA expects 160 000 MW to
be installed by the end of 2010. Wind power installed
capacity is 59322MW for the whole world at the end of 20052.Five countries added more than 1000 MW; the United
States of America (2454 MW), Germany (2194 MW),India (1840 MW) and Spain (1587 MW) were able to
secure their leading market positions and China (1.45 MW)
joined the group of the top five and is now number five in
terms of added capacity, showing a market growth of 91 percent. Five countries added more than 500 MW and
showed excellent growth rates; France (810 MW, 107
percent growth), Canada (768 MW, 112 percent), Portugal
(628 MW, 61 percent) and the UK (610 MW, 45 percent).
The most dynamic market in 2006, Brazil, faced its longexpected take off and added 208 MW, which equals a
sevenfold increase of installed capacity within one year.
At present the USA is the 1st, Germany is the 2nd and
India is the 3rd in the world in case of the installedcapacity of Wind parks (Mukut3).
WIND PROSPECT IN BANGLADESHBangladesh is situated in the latitude between 20°34' -
26°38'N and longitude between 88°01-92°4E. The country
has a 724 km long coastal line along the Bay of Bengal.
There are many islands in the Bay, which belongs to
Bangladesh. The strong south /south-westerly monsoonwind coming from the Indian Ocean, after traveling a long
distance over the water surface, enter into Asia over the
coastal area of Bangladesh. This wind blows over
Bangladesh from March to September with a monthlyaverage speed 3 m/s to 6 m/s (Ahmed4). The wind speed is
enhanced when it enters the V- shaped coastal region of the
country. According to preliminary studies, (from
meteorological department, BCAS, LGED, and BUET)winds are available in Bangladesh mainly during the
monsoon and around one to two months before and after
the monsoon (7 months, March to September). During the
months starring from late October to February wind speed
remains either calm or too low. The peak wind speedoccurs during the months of June and July (Ahmed 4). Park
of wind turbines in coastal areas, can be incorporated in
electricity grid on a substantial basis and could addreliability and consistency to the electricity generated bythe Kaptai Hydro-electric power Station from March to
September, during which load shedding becomes criticalthan winter season. So the deficit power could be
compensated with the help of wind power plants along the
coastal zone. They're many islands along the Bay of
Bengal where the wind speed is quite high. For example,Kuakata, Sandwip and St. Martin islands are very
prospective areas for this type of wind turbines. Most of
the people of these islands are fishermen and there are
many shrimp-farms in these areas. They can never avail the
8/7/2019 wind velocity bangladesh coastal area
http://slidepdf.com/reader/full/wind-velocity-bangladesh-coastal-area 2/5
Analysis of Wind Characteristics in Coastal Areas of Bangladesh
Journal of Mechanic al Engineering , vo l. ME39, No. 1, June 2008
Transac tion of the Mec h. Eng. Div., The Institution of Eng ineers, Bang lad esh
46
opportunities to have the electricity from the National Grid
line. Therefore, these areas have a great prospect to utilize
the wind. Besides these, there are a lot of hilly and remoteareas with a great open space island where the wind speed
remains 2 m/s to 5 m/s in Bangladesh. The recent
development of wind rotor aerodynamics makes it feasible
to extract energy from wind speed as low as 2.5 m/s.Bangladesh is an agricultural land. The agriculture needs
supply of water at right time for better yielding.Bangladesh Government has already undertaken many
irrigation and canal digging projects to supply water. Many power pumps and hand pumps have been distributed to the
farmers. A study of Bangladesh Agriculture DevelopmentCorporation (BADC) shows that low lift pumps (LLP) of
about 40 feet head and two-cusec discharge were inoperation. It is claimed that there is surface water potential
for 54,700 LLP of two-cusec capacity. Recently man
powered (TARA PUMP) water pumps have become very popular for irrigation, and every year its supply is
increasing. Considering the terrain of the country about
50% of the pumps require to be operated at a total head of
20 feet or less (Ahmed4). Most of these power pumps alongwith a number of deep and .shallow tube wells are being
run in most cases by diesel engines and in other cases by
electric motors. The non- availability of electricity andirregular supply of diesel fuel in rural areas the existing
schemes of irrigation have been adversely affected. Theinstallation of windmills will be very much convenient for
operating the pumps. The application of wind power for
operating man powered water pumps will also be very
convenient, and it will save energy.
WIND DATAIn the present study, wind data of some coastal areas in
Bangladesh such as Kutubdia, Kuakata, Mongla, Sandwipand Teknaf from March to September, 2003 have been
considered5. The wind data measured in ten minutes
interval and then further processed to hourly time series.
CALCULATION METHODOLOGYKnowledge of the wind speed distribution is a very
important factor to evaluate the wind potential in the windyareas. In addition to speed distribution, meteorological data
and topographical information for considered site have
same importance. If ever the wind speed distribution in any
windy site is known, the power potential and the economic
feasibility belonging to the site can be easily obtained.Wind data obtained with various observation methods has
the wide ranges. Therefore, in the wind energy analysis, it
is necessary to have only a few key parameters that can
explain the behavior of a wide range of wind speed data.The simplest and most practical method for the procedure
is to use a distribution function. There are several density functions, which can be used to describe the wind speed
frequency curve. The most common is the Weibull
functions. The studies using this function can be found inthe following section.
The Weibull distribution is characterized by two
parameters: the shape parameter k (dimensionless) and the
scale parameter c (m/s.) The cumulative distributionfunction (Weibull function, Lysen6) is given by
( ) 1
k v
cF v e
⎛ ⎞−⎜ ⎟
⎝ ⎠= − (1)
and the Weibull density (probability density) function byLysen6,
1( )( )
( )k
k v
cdF v k v
f v edv c c
−−⎛ ⎞ ⎛ ⎞
= = ×⎜ ⎟ ⎜ ⎟⎝ ⎠ ⎝ ⎠
(2)
There are several methods to calculate the Weibull parameter k and c such as, Weibull paper method, Standard
deviation method, Energy pattern factor method etc.
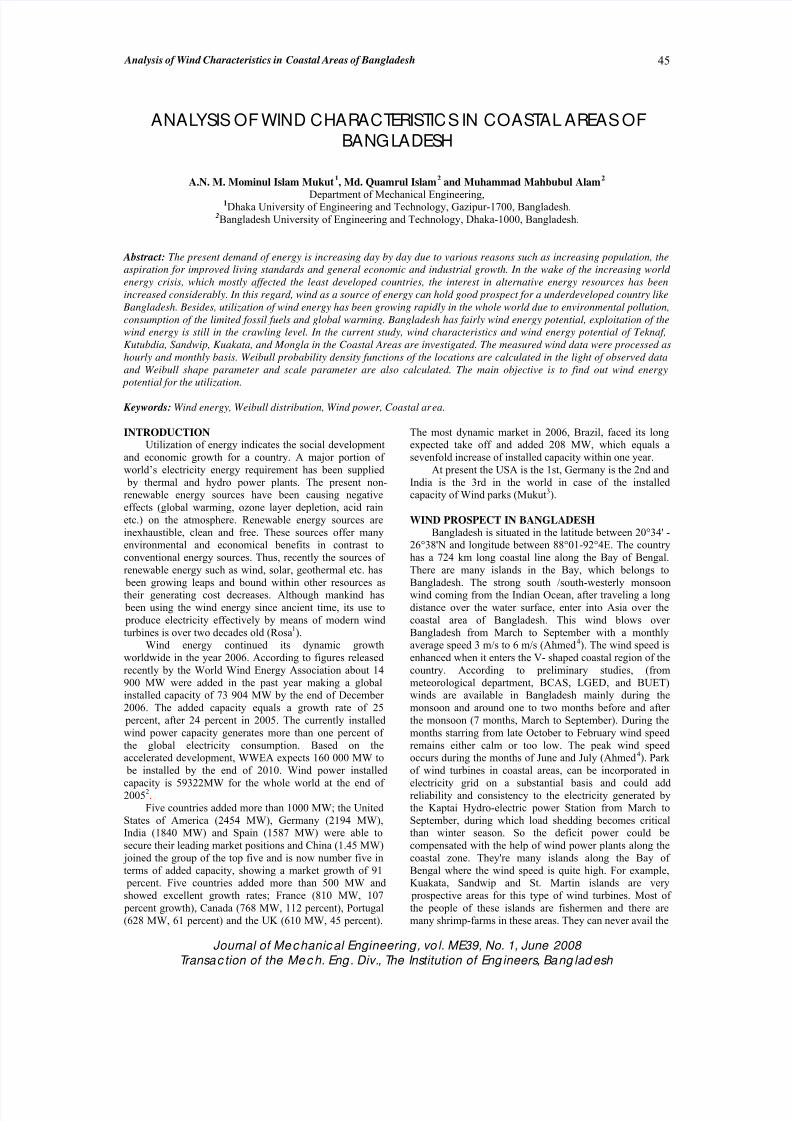
WEIBULL PAPER METHOD
At first percentage of cumulative distribution iscalculated and plotted for corresponding wind speed as
shown in Figure 1. Then a straight line is drawn so that itcovers most points and from this line an intersection with c
estimation line (dotted) gives the corresponding value of c
for the location. A normal from “+” of the graph is drawn
upon the previous straight line, the point of intersectionwith the “k” axis line (top) gives the value of k.
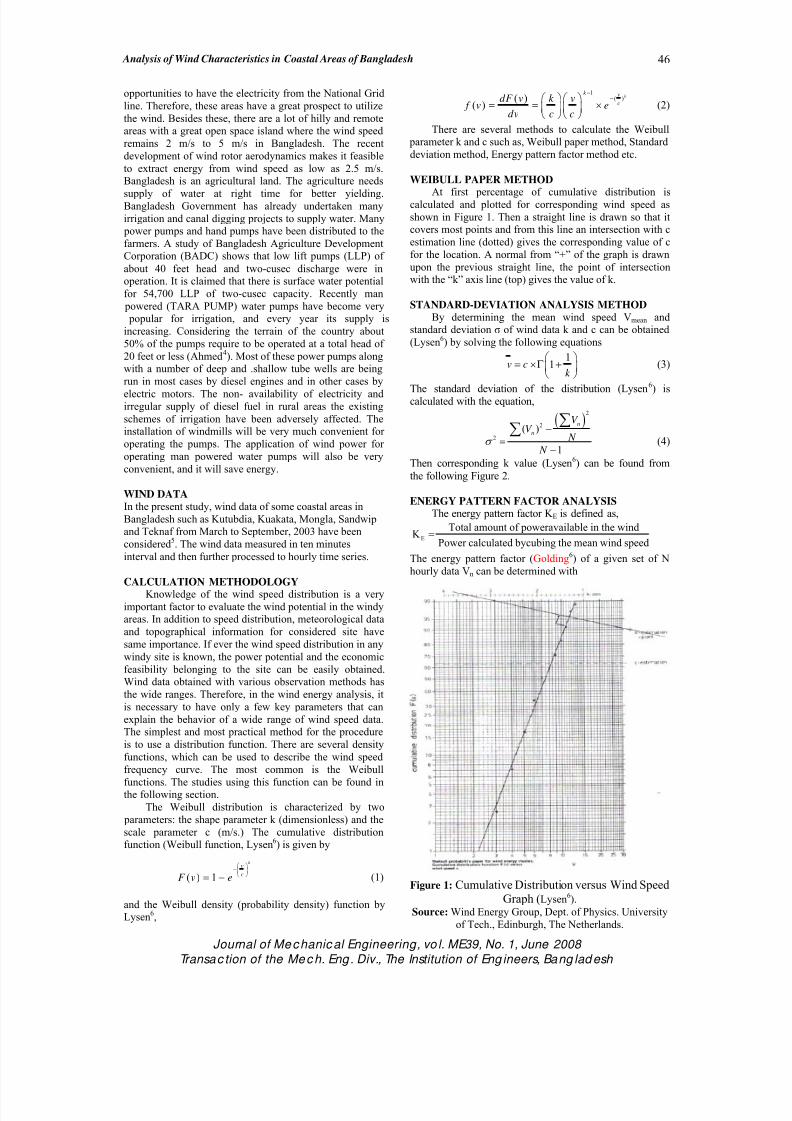
STANDARD-DEVIATION ANALYSIS METHODBy determining the mean wind speed Vmean and
standard deviation σ of wind data k and c can be obtained
(Lysen6) by solving the following equations
11v c
k
⎛ ⎞= ×Γ +⎜ ⎟
⎝ ⎠(3)
The standard deviation of the distribution (Lysen
6
) iscalculated with the equation,
( )2
2
2
( )
1
n
n
V V
N
N σ
−=
−
∑∑
(4)
Then corresponding k value (Lysen6) can be found from
the following Figure 2.
ENERGY PATTERN FACTOR ANALYSISThe energy pattern factor K E is defined as,
E
Total amount of poweravailable in the windK
Power calculated bycubing the mean wind speed=
The energy pattern factor (Golding6) of a given set of N
hourly data Vn can be determined with
Figure 1: Cumulative Distribution versus Wind Speed
Graph (Lysen6).
Source: Wind Energy Group, Dept. of Physics. University
of Tech., Edinburgh, The Netherlands.
8/7/2019 wind velocity bangladesh coastal area
http://slidepdf.com/reader/full/wind-velocity-bangladesh-coastal-area 3/5
Analysis of Wind Characteristics in Coastal Areas of Bangladesh
Journal of Mechanic al Engineering , vo l. ME39, No. 1, June 2008
Transac tion of the Mec h. Eng. Div., The Institution of Eng ineers, Bang lad esh
47
Kutubdia
0
3
6
9
12
M a r A p
r M a y J u
n J u l A u g
S e p
A v g w i n d s p e e d
Teknaf
0123
45
M a r A p
r M a y J u
n J u l
A u g
S e p
A v g w i n d
s p e e d
Sandwip
0
3
6
9
12
M a r A p
r M a y J u
n J u l
A u g
S e p
A v g w i n d s p e e d
Mongla
0
3
6
9
12
M a r A p
r M a y J u
n J u l
A u g
S e p
A v g w i n d s p
e e d
Kuakata
0
3
6
9
12
M a r A p
r M a y J u
n J u l
A u g
S e p
A v g w i n d s p e e d
.
Figure 2: The Relative Standard Deviation of a
Weibull Distribution as a Function of Weibull ShapeFactor, k.
Figure 3: The Energy Pattern Factor of a Weibull Wind
Speed Distribution as a Function of the Weibull Shape
Factor, k (Lysen6).
3
1
3
1
1( )
1
N
n
n E
N
n
n
V N
K
V N
=
=
=
⎛ ⎞⎜ ⎟⎝ ⎠
∑
∑
(5)
Using the above expression the Weibull shape parameter k
is easily found by the following figure. The wind power per unit area of approach is
proportional to the cube of wind speed (Beurskens7) and it
can be expressed as P/A = 0.6 V3 where P/A is in W/m2
and V is in m/s. This wind power represents the strength of
wind, and theoretically maximum 59% of this power can be extracted.
RESULTS AND DISCUSSION
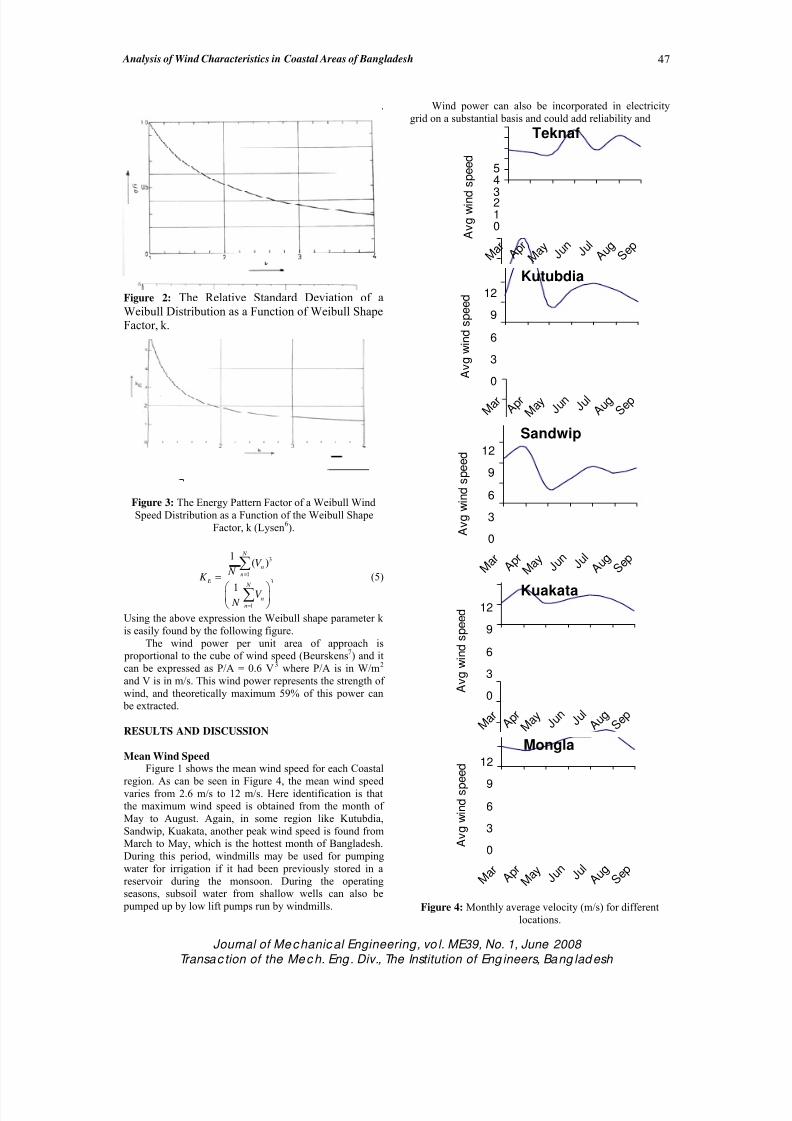
Mean Wind SpeedFigure 1 shows the mean wind speed for each Coastal
region. As can be seen in Figure 4, the mean wind speedvaries from 2.6 m/s to 12 m/s. Here identification is thatthe maximum wind speed is obtained from the month of
May to August. Again, in some region like Kutubdia,
Sandwip, Kuakata, another peak wind speed is found fromMarch to May, which is the hottest month of Bangladesh.
During this period, windmills may be used for pumping
water for irrigation if it had been previously stored in a
reservoir during the monsoon. During the operatingseasons, subsoil water from shallow wells can also be
pumped up by low lift pumps run by windmills.
Wind power can also be incorporated in electricity
grid on a substantial basis and could add reliability and
Figure 4: Monthly average velocity (m/s) for different
locations.
8/7/2019 wind velocity bangladesh coastal area
http://slidepdf.com/reader/full/wind-velocity-bangladesh-coastal-area 4/5
8/7/2019 wind velocity bangladesh coastal area
http://slidepdf.com/reader/full/wind-velocity-bangladesh-coastal-area 5/5
Analysis of Wind Characteristics in Coastal Areas of Bangladesh
Journal of Mechanic al Engineering , vo l. ME39, No. 1, June 2008
Transac tion of the Mec h. Eng. Div., The Institution of Eng ineers, Bang lad esh
49
Table 1: Mean speed for each location.
Location Mean Speed (m/s)
Teknaf 3.22
Kutubdia 5.17
Sandwip 5.12
Kuakata 3.58
Mongla 3.44
Table 2: Value of Weibull shape parameter (c) and scale parameter (k).
Location March April May June July August September Mean
k Teknaf
c
1.45
3.14
1.65
2.86
1.45
2.63
1.98
5.3
1.5
3.13
1.88
4.68
1.87
3.48
1.68
3.60
k Kutubdia
c
2.184.19
1.1412.06
1.42.6
1.975.31
3.26.4
1.985.4
1.483.2
1.915.59
k Sandwip
c
1.2
3.5
1.15
8.76
1.38
2.50
2.1
4.15
2.1
6.14
1.39
4.87
2.17
5.85
1.64
5.11
k Kuakata
c
1.8
3.4
1.1
5.45
2.2
3.49
2.17
4.17
2.7
4.81
1.8
3.78
1.3
2.19
1.87
3.90
k Mongla
c
2.4
3.3
1.7
2.7
2.4
3.3
1.7
4.74
2.7
4.88
1.5
5.25
1.75
2.78
2.02
3.85
Although the wind speed is maximum in Kutubdia but
that of Sandwip is more stable, because the wind speedvaries roughly in Kuakata. So, Sandwip is more effective
for wind power extraction in point view of wind turbineoverall performance.
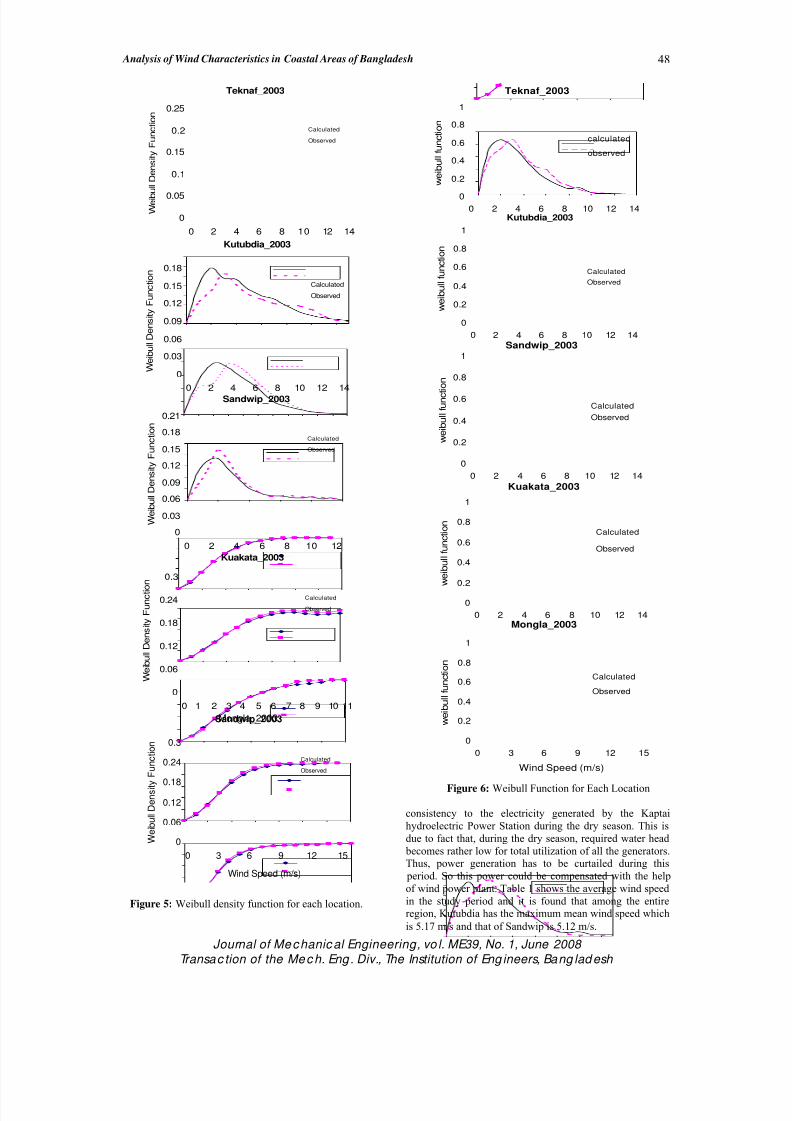
WEIBULL DENSITY FUNCTIONSWeibull/Probability density functions are usually used
to determine the wind speed distribution of a windy site in
a period of time. It means the relative frequency of wind
speeds for the site. Therefore, the shape of wind speedsdistribution can be guessed when it is plotted. The
comparison between calculated and observed Weibull
density function for each location is presented in Figure 5.
WEIBULL FUNCTIONSWeibull Function is the integration of Weibull
Density Function. It is the cumulative of relative frequency
of each velocity interval. The comparison between
calculated and observed Weibull function for each locationis presented in Figure 6. The Weibull Shape parameter (c)
and Scale parameter (k) were calculated using the method
mentioned in earlier section. Table 2 shows the
corresponding value of k and c for each location for eachmonth.
From Table 2, it is found that in Teknaf k varies from1.45 to 1.98 and that of c ranges from 2.63 to 4.68, for
Kutubdia k varies from 1.14 to 3.2 and that of c ranges
from 2.6 to 12.06, for Sandwip k varies from 1.15 to 2.17
and that of c ranges from 2.5 to 8.76, for Kuakata k varies
from 1.1 to 2.7 and that of c ranges from 2.19 to 5.45, andfor Mongla k varies from 1.5 to 2.4 and that of c ranges
from 2.7 to 4.88.
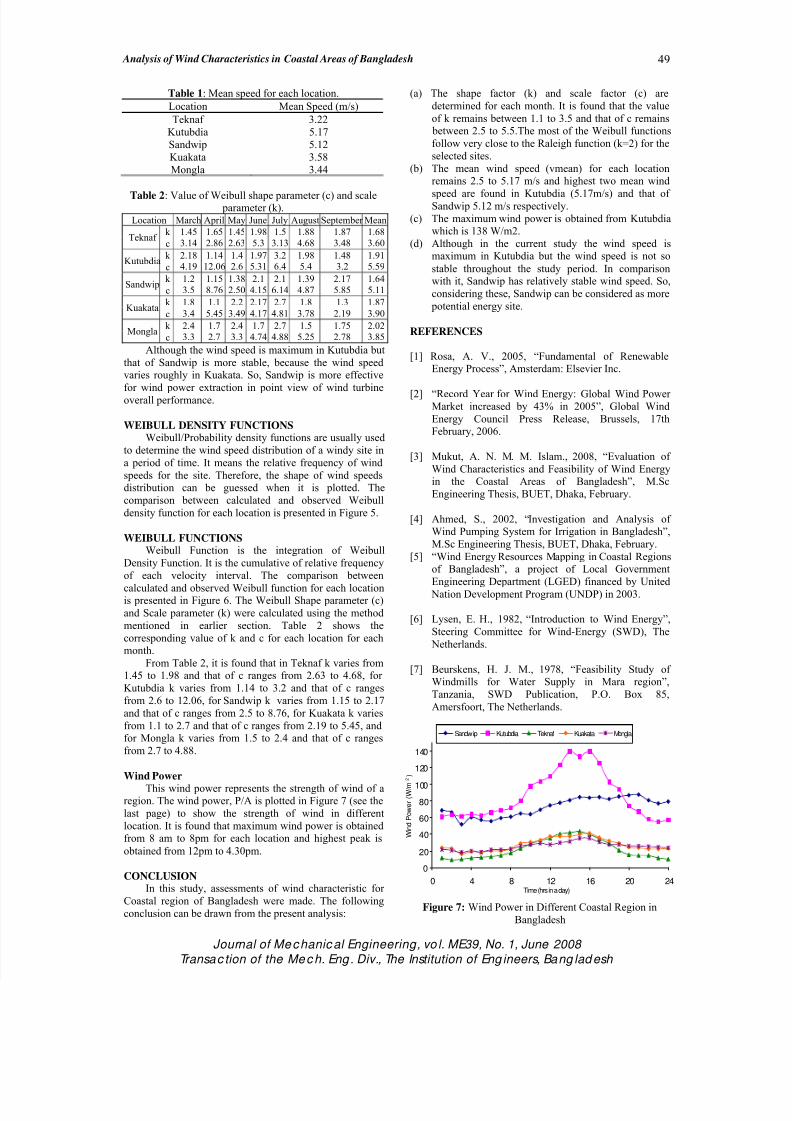
Wind Power
This wind power represents the strength of wind of aregion. The wind power, P/A is plotted in Figure 7 (see the
last page) to show the strength of wind in different
location. It is found that maximum wind power is obtainedfrom 8 am to 8pm for each location and highest peak is
obtained from 12pm to 4.30pm.
CONCLUSIONIn this study, assessments of wind characteristic for
Coastal region of Bangladesh were made. The following
conclusion can be drawn from the present analysis:
(a) The shape factor (k) and scale factor (c) are
determined for each month. It is found that the value
of k remains between 1.1 to 3.5 and that of c remains between 2.5 to 5.5.The most of the Weibull functions
follow very close to the Raleigh function (k=2) for the
selected sites.
(b) The mean wind speed (vmean) for each locationremains 2.5 to 5.17 m/s and highest two mean wind
speed are found in Kutubdia (5.17m/s) and that of Sandwip 5.12 m/s respectively.
(c) The maximum wind power is obtained from Kutubdiawhich is 138 W/m2.
(d) Although in the current study the wind speed ismaximum in Kutubdia but the wind speed is not so
stable throughout the study period. In comparisonwith it, Sandwip has relatively stable wind speed. So,
considering these, Sandwip can be considered as more
potential energy site.
REFERENCES
[1] Rosa, A. V., 2005, “Fundamental of RenewableEnergy Process”, Amsterdam: Elsevier Inc.
[2] “Record Year for Wind Energy: Global Wind Power Market increased by 43% in 2005”, Global Wind
Energy Council Press Release, Brussels, 17thFebruary, 2006.
[3] Mukut, A. N. M. M. Islam., 2008, “Evaluation of
Wind Characteristics and Feasibility of Wind Energyin the Coastal Areas of Bangladesh”, M.Sc
Engineering Thesis, BUET, Dhaka, February.
[4] Ahmed, S., 2002, “Investigation and Analysis of Wind Pumping System for Irrigation in Bangladesh”,
M.Sc Engineering Thesis, BUET, Dhaka, February.
[5] “Wind Energy Resources Mapping in Coastal Regionsof Bangladesh”, a project of Local Government
Engineering Department (LGED) financed by United
Nation Development Program (UNDP) in 2003.
[6] Lysen, E. H., 1982, “Introduction to Wind Energy”,
Steering Committee for Wind-Energy (SWD), The
Netherlands.
[7] Beurskens, H. J. M., 1978, “Feasibility Study of Windmills for Water Supply in Mara region”,
Tanzania, SWD Publication, P.O. Box 85,
Amersfoort, The Netherlands.
Figure 7: Wind Power in Different Coastal Region in
Bangladesh
0
20
40
60
80
100
120
140
0 4 8 12 16 20 24Time (hrs in a day)
W i n d P o w e r ( W / m
2 )
Sandwip Kutubdia Teknaf Kuakata Mongla